
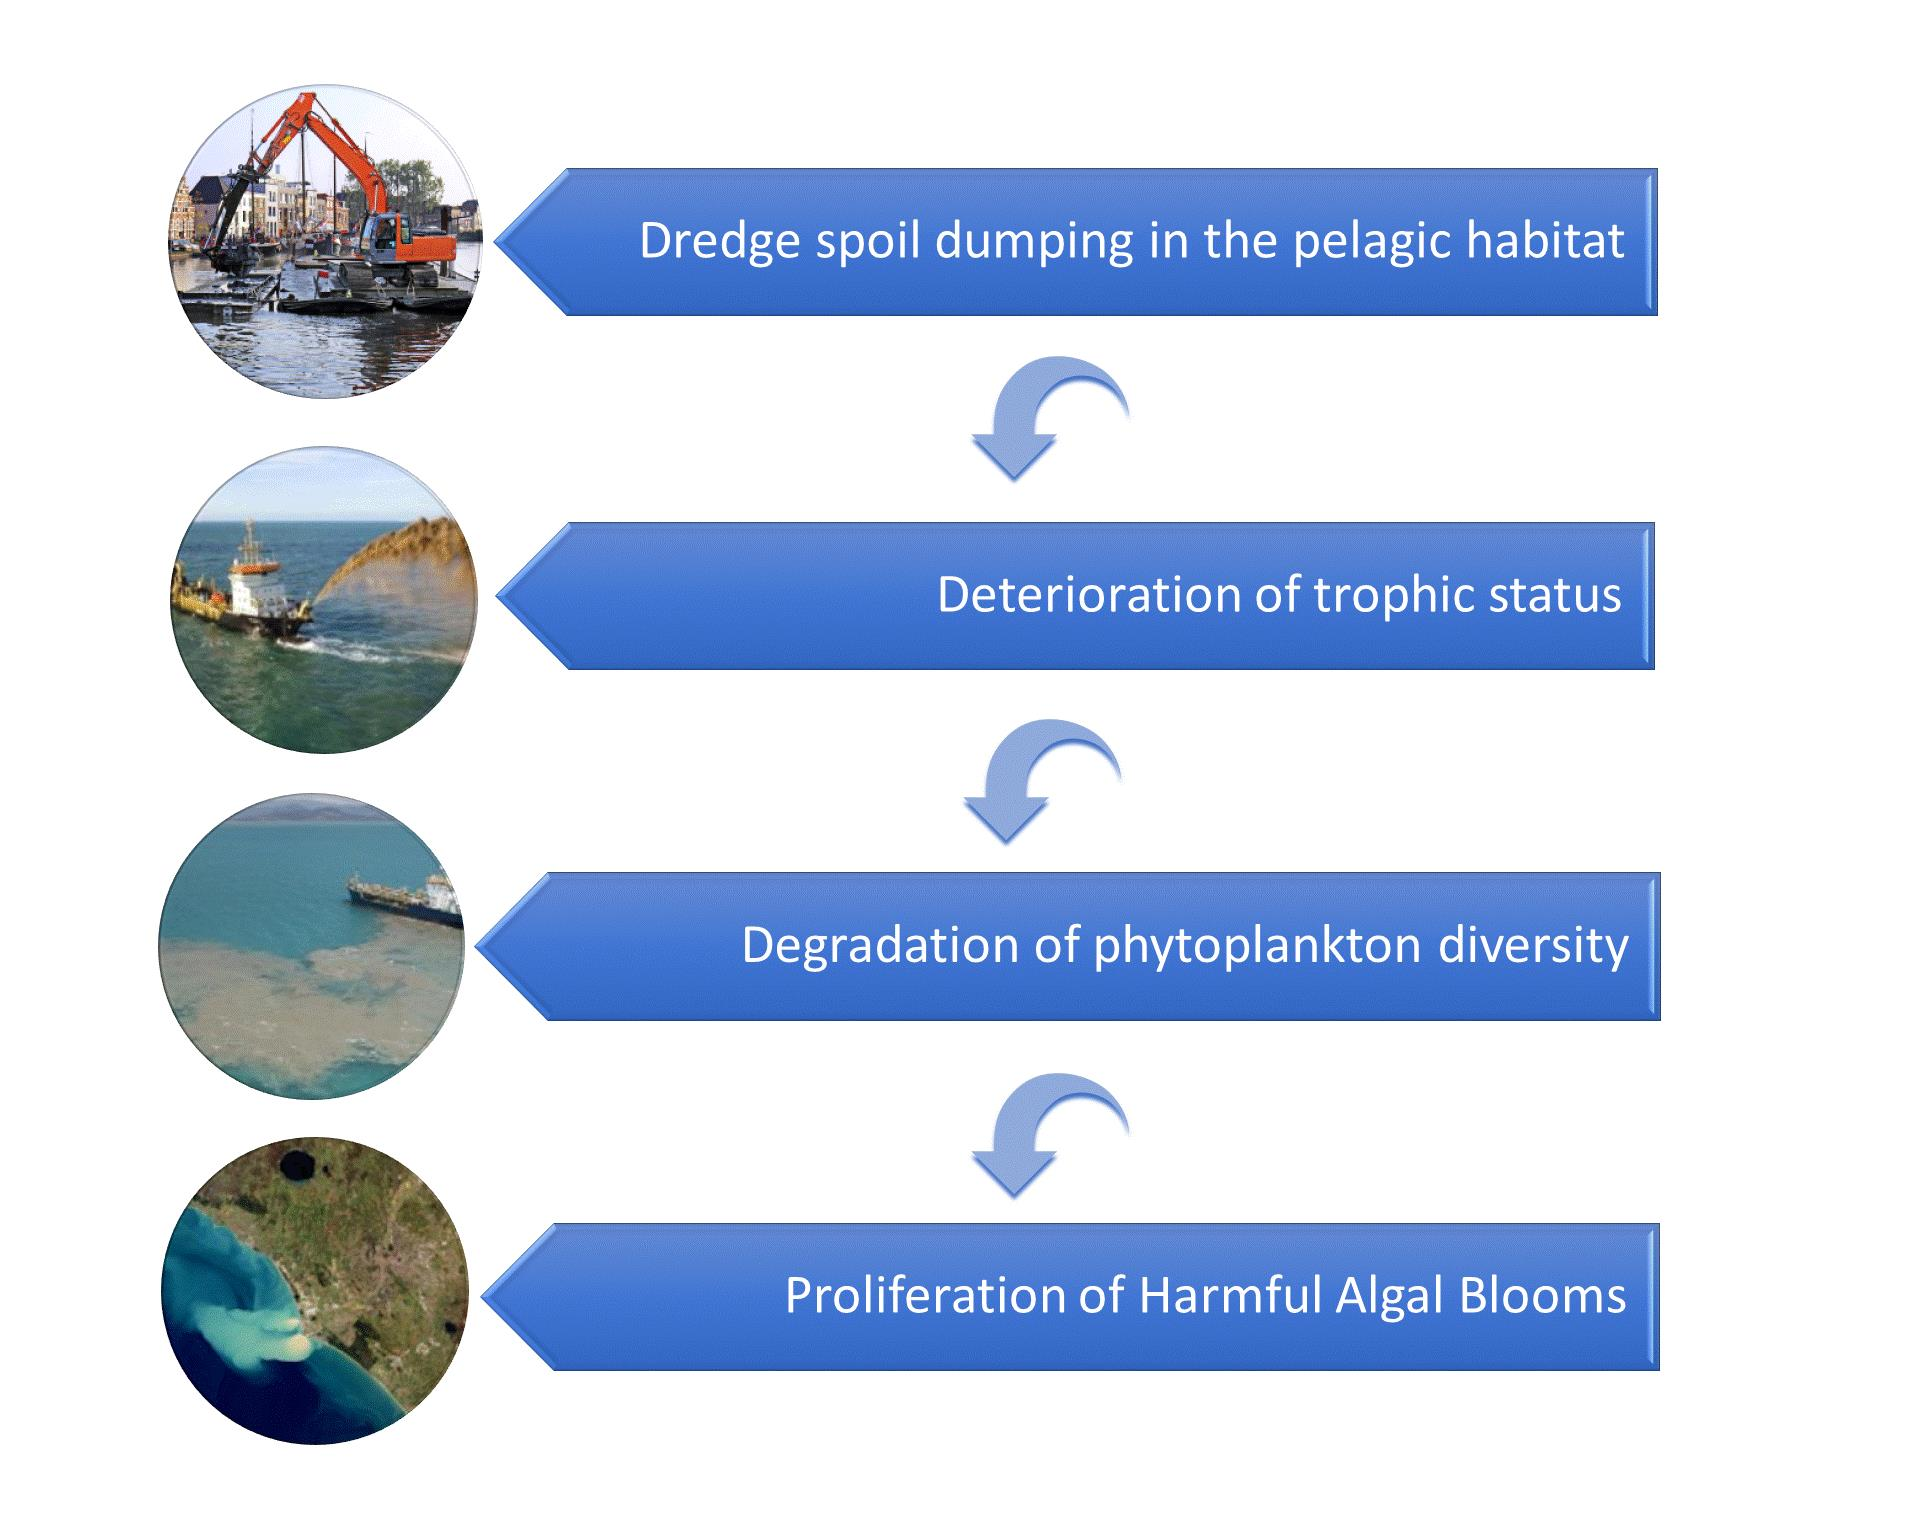
Dumping of Dredge Spoil in the Pelagic Habitat: Focus on Trophic Status, Phytoplankton Diversity Responses and Generation of Blooms

 ,
,  , , , and
Abstract
:
1. Introduction
2. Materials and Methods
2.1. Study Area and Sampling
2.2. Analyses of Environmental and Phytoplankton Parameters
2.3. Statistical Analysis
3. Results
4. Discussion
5. Conclusions
Supplementary Materials
Author Contributions
Funding
Data Availability Statement
Acknowledgments
Conflicts of Interest
References
- UNEP. Guidelines for the Management of Dredged Material. 2000. Available online: https://www.unep.org/unepmap/node/13796 (accessed on 20 November 2017).
- Van Maren, D.; van Kessel, T.; Cronin, K.; Sittoni, L. The impact of channel deepening and dredging on estuarine sediment concentration. Cont. Shelf Res. 2015, 95, 1–14. [Google Scholar] [CrossRef]
- Elliott, M.; Mander, L.; Mazik, K.; Simenstad, C.; Valesini, F.; Whitfield, A.; Wolanski, E. Ecoengineering with Ecohydrology: Successes and failures in estuarine restoration. Estuar. Coast. Shelf Sci. 2016, 176, 12–35. [Google Scholar] [CrossRef]
- OSPAR Agreement 2014-06. Available online: https://www.ospar.org/work-areas/eiha/dredging-dumping (accessed on 20 November 2017).
- HELCOM Recommendation 36/2. Available online: https://helcom.fi/wp-content/uploads/2015/03/Rec-36-2_revised-2020-1.pdf (accessed on 20 November 2017).
- Adekunbi, F.O.; Elegbede, I.O.; Akhiromen, D.I.; Oluwagunke, T.O.; Oyatola, O.O. Impact of Sand Dredging Activities on Ecosystem and Community Survival in Ibeshe Area of Lagos Lagoon, Nigeria. J. Geosci. Environ. Prot. 2018, 6, 112–125. [Google Scholar] [CrossRef]
- Zhao, G.; Sheng, Y.; Jiang, M.; Zhou, H.; Zhang, H. The biogeochemical characteristics of phosphorus in coastal sediments under high salinity and dredging conditions. Chemosphere 2019, 215, 681–692. [Google Scholar] [CrossRef]
- Yoshino, K.; Yamada, K.; Tanaka, M.; Tada, Y.; Kanaya, G.; Henmi, Y.; Yamamoto, M. Subtidal benthic communities in Minamata Bay, Japan, approximately 30 years after mercury pollution remediation involving dredging disturbance. Ecol. Res. 2022, 37, 137–150. [Google Scholar] [CrossRef]
- Gillmore, M.L.; Golding, L.A.; Angel, B.M.; Adams, M.S.; Jolley, D.F. Toxicity of dissolved and precipitated aluminium to marine diatoms. Aquat. Toxicol. 2016, 174, 82–91. [Google Scholar] [CrossRef]
- HELCOM. TBT and Imposex. HELCOM Core Indicator Report. Online. 2018. Available online: https://helcom.fi/wp-content/uploads/2019/08/Tributyltin-TBT-and-imposex-HELCOM-core-indicator-2018.pdf (accessed on 20 November 2021).
- Zhang, Y.; Peng, C.; Huang, S.; Wang, J.; Xiong, X.; Li, D. The relative role of spatial and environmental processes on seasonal variations of phytoplankton beta diversity along different anthropogenic disturbances of subtropical rivers in China. Environ. Sci. Pollut. Res. 2019, 26, 1422–1434. [Google Scholar] [CrossRef]
- Abbate, M.C.L.; Molinero, J.C.; Guinder, V.A.; Perillo, G.M.; Freije, R.H.; Sommer, U.; Spetter, C.V.; Marcovecchio, J.E. Time-varying environmental control of phytoplankton in a changing estuarine system. Sci. Total Environ. 2017, 609, 1390–1400. [Google Scholar] [CrossRef]
- De Jonge, V.N.; Schückel, U. Exploring effects of dredging and organic waste on the functioning and the quantitative biomass structure of the Ems estuary food web by applying Input Method balancing in Ecological Network Analysis. Ocean Coast. Manag. 2019, 174, 38–55. [Google Scholar] [CrossRef]
- Cabrita, M.T. Phytoplankton community indicators of changes associated with dredging in the Tagus estuary (Portugal). Environ. Pollut. 2014, 191, 17–24. [Google Scholar] [CrossRef]
- Layglon, N.; Misson, B.; Durieu, G.; Coclet, C.; D’Onofrio, S.; Dang, D.H.; François, D.; Mullot, J.-U.; Mounier, S.; Lenoble, V.; et al. Long-term monitoring emphasizes impacts of the dredging on dissolved Cu and Pb contamination along with ultraplankton distribution and structure in Toulon Bay (NW Mediterranean Sea, France). Mar. Pollut. Bull. 2020, 156, 111196. [Google Scholar] [CrossRef]
- Lemley, D.A.; Adams, J.B.; Rishworth, G.M.; Bouland, C. Phytoplankton responses to adaptive management interventions in eutrophic urban estuaries. Sci. Total Environ. 2019, 693, 133601. [Google Scholar] [CrossRef]
- Cordeiro, I.A.; Feitosa, F.A.D.N.; Montes, M.D.J.F.; Otsuka, A.Y.; Silva, A.C. Environmental conditions of the Suape estuarine-port complex area (Pernambuco, Brazil): Phytoplankton biomass and hydrological parameters. J. Mar. Biol. Assoc. U.K. 2019, 99, 291–301. [Google Scholar] [CrossRef]
- Neto, J.B.F.; Beretta, M.; Ferreira, A.N.; De De Souza, C.S.; Júnior, P.D.O.M. A variabilidade da biomassa planctônica sob influência da sazonalidade e da dragagem do porto de Aratú, Baía de Todos os Santos, Brasil. Trop. Oceanogr. 2014, 42, 230–242. [Google Scholar]
- Kapsimalis, V.; Panagiotopoulos, I.; Kanellopoulos, T.; Hatzianestis, I.; Antoniou, P.; Anagnostou, C. A multi-criteria approach for the dumping of dredged material in the Thermaikos Gulf, Northern Greece. J. Environ. Manag. 2010, 91, 2455–2465. [Google Scholar] [CrossRef]
- Katsiaras, N.; Simboura, N.; Tsangaris, C.; Hatzianestis, I.; Pavlidou, A.; Kapsimalis, V. Impacts of dredged-material disposal on the coastal soft-bottom macrofauna, Saronikos Gulf, Greece. Sci. Total Environ. 2015, 508, 320–330. [Google Scholar] [CrossRef]
- Panagiotopoulos, I.; Kapsimalis, V.; Hatzianestis, I.; Kanellopoulos, T.D.; Kyriakidou, C. Environmental status of the metropolitan river (Kifissos) of Athens, Greece. Environ. Earth Sci. 2010, 61, 983–993. [Google Scholar] [CrossRef]
- Pavlidou, A.; Simboura, N.; Rousselaki, E.; Tsapakis, M.; Pagou, K.; Drakopoulou, P.; Assimakopoulou, G.; Kontoyiannis, H.; Panayotidis, P. Methods of eutrophication assessment in the context of the water framework directive: Examples from the Eastern Mediterranean coastal areas. Cont. Shelf Res. 2015, 108, 156–168. [Google Scholar] [CrossRef]
- Pavlidou, A.; Simboura, N.; Pagou, K.; Assimakopoulou, G.; Gerakaris, V.; Hatzianestis, I.; Panayotidis, P.; Pantazi, M.; Papadopoulou, N.; Reizopoulou, S.; et al. Using a holistic ecosystem-integrated approach to assess the environmental status of Saronikos Gulf, Eastern Mediterranean. Ecol. Indic. 2019, 96, 336–350. [Google Scholar] [CrossRef]
- Simboura, A.; Pavlidou, J.; Bald, M.; Tsapakis, K.; Pagou Ch Zeri, A.; Androni; Panayotidis, P. Response of ecological indices to nutrient and chemical contaminant stress factors in eastern Mediterranean coastal waters. Ecol. Ind. 2016, 70, 89–105. [Google Scholar] [CrossRef]
- Mullin, J.; Riley, J. The colorimetric determination of silicate with special reference to sea and natural waters. Anal. Chim. Acta 1955, 12, 162–176. [Google Scholar] [CrossRef]
- Murphy, J.; Riley, J.P. A modified single solution method for phosphate in natural waters. Anal. Chim. Acta 1962, 12, 162–176. [Google Scholar] [CrossRef]
- Strickland, J.D.H.; Parsons, T.R. A practical handbook of sea water analysis. Bull. Fish. Res. Bd. Canada 1968, 167, 310. [Google Scholar]
- Koroleff, F. Revised version of “Direct determination of ammonia in natural waters as indophenol blue”. Int. Con. Explor. Sea; C. M. 1969/C:9 ICES information on techniques and methods for sea water analysis. Interlab. Rep. 1970, 3, 19–22. [Google Scholar]
- Carpenter, J.H. The Chesapeake Bay Institute technique for dissolved oxygen method. Limnol. Oceanogr. 1965, 10, 141–143. [Google Scholar] [CrossRef]
- Primpas, I.; Tsirtsis, G.; Karydis, M.; Kokkoris, G. Principal component analysis: Development of a multivariate index for assessing eutrophication according to the European water framework directive. Ecol. Indic. 2010, 10, 178–183. [Google Scholar] [CrossRef]
- Holm-Hansen, O.; Lorenzen, C.J.; Holmes, R.W.; Strickland, J.D.H. Fluorometric Determination of Chlorophyll. ICES J. Mar. Sci. 1965, 30, 3–15. [Google Scholar] [CrossRef]
- Utermöhl, H. Zur Vervollkommnung der quantitativen Phytoplankton Methodik. Mitt. Int. Ver. Theor. Angew. Limnol. 1958, 9, 1–38. [Google Scholar] [CrossRef]
- Clarke, K.R.; Warwick, R.M. Similarity-based testing for community pattern: The two-way layout with no replication. Mar. Biol. 1994, 118, 167–176. [Google Scholar] [CrossRef]
- Clarke, K.R.; Gorley, R.N. Getting Started with PRIMER v7; PRIMER-E Plymouth, Plymouth Marine Laboratory: Plymouth, UK, 2015; p. 20. [Google Scholar]
- Ter Braak, C.J. Canonical correspondence analysis: A new eigenvector technique for multivariate direct gradient analysis. Ecology 1986, 67, 1167–1179. [Google Scholar] [CrossRef]
- Borcard, D.; Gillet, F.; Legendre, P. Numerical Ecology with R; Springer: New York, NY, USA, 2011; Volume 2, p. 688. [Google Scholar]
- Dormann, C.F.; Elith, J.; Bacher, S.; Buchmann, C.; Carl, G.; Carré, G.; Marquéz, J.R.G.; Gruber, B.; Lafourcade, B.; Leitão, P.J.; et al. Collinearity: A review of methods to deal with it and a simulation study evaluating their performance. Ecography 2013, 36, 27–46. [Google Scholar] [CrossRef]
- Zuur, A.F.; Ieno, E.N.; Elphick, C.S. A protocol for data exploration to avoid common statistical problems. Methods Ecol. Evol. 2010, 1, 3–14. [Google Scholar] [CrossRef]
- Legendre, P.; Legendre, L. Canonical analysis. In Developments in Environmental Modelling; Elsevier: Amsterdam, The Netherlands, 2012; Volume 24, pp. 625–710. [Google Scholar]
- Burford, M.A.; O’Donohue, M.J. A comparison of phytoplankton community assemblages in artificially and naturally mixed subtropical water reservoirs. Freshw. Biol. 2006, 51, 973–982. [Google Scholar] [CrossRef]
- ICES. Interim Report of the Working Group on the Effects of Extraction of Marine Sediments on the Marine Ecosystem. In Proceedings of the WGEXT, Norwich, UK, 24–27 April 2017; p. 147. [Google Scholar]
- Roberts, D.A. Causes and ecological effects of resuspended contaminated sediments (RCS) in marine environments. Environ. Int. 2012, 40, 230–243. [Google Scholar] [CrossRef] [PubMed]
- Perillo, G.M.E.; Pierini, J.O.; Perez, D.E.; Gomez, E.A. Suspended sediment circulation in semienclosed docks, Puerto Galván, Argentina. Terra et Aqua 2001, 83, 1–8. [Google Scholar]
- Coelho, J.; Flindt, M.R.; Jensen, H.; Lillebø, A.; Pardal, M. Phosphorus speciation and availability in intertidal sediments of a temperate estuary: Relation to eutrophication and annual P-fluxes. Estuar. Coast. Shelf Sci. 2004, 61, 583–590. [Google Scholar] [CrossRef]
- Guinder, V.A.; Popovich, C.A.; Molinero, J.C.; Perillo, G.M.E. Long-term changes in phytoplankton phenology and community structure in the Bahía Blanca Estuary, Argentina. Mar. Biol. 2010, 157, 2703–2716. [Google Scholar] [CrossRef]
- Ferreira, J.G.; Simas, T.; Nobre, A.; Silva, M.C.; Schifferegger, K.; Lencart-Silva, J. Identification of Sensitive Areas and Vulnerable Zones in Transitional and Coastal Portuguese Systems. Application of the United States National Estuarine Eutrophication Assessment to the Minho, Lima, Douro, Ria de Aveiro, Mondego, Tagus, Sado, Mira, Ria Formosa and Guadiana Systems. INAG/IMAR; Instituto da Água and Institute of Marine Research: Lisboa, Portugal, 2003. [Google Scholar]
- Cabrita, M.T.; Brito, P.; Caçador, I.; Duarte, B. Impacts of phytoplankton blooms on trace metal recycling and bioavailability during dredging events in the Sado estuary (Portugal). Mar. Environ. Res. 2020, 153, 104837. [Google Scholar] [CrossRef]
- Kromkamp, J.C.; Peene, J. Changes in phytoplankton biomass and primary production between 1991 and 2001 in the Westerschelde estuary (Belgium/The Netherlands). Hydrobiologia 2005, 540, 117–126. [Google Scholar] [CrossRef]
- Pennekamp, J.G.; Epskamp, R.J.C.; Rosenbrand, W.F.; Mullie, A.; Wessel, G.L.; Arts, T.; Deibel, I.K. Turbidity caused by dredging: Viewed in perspective. Terra et Aqua 1996, 1, 10–17. [Google Scholar]
- Bates, S.S.; Trainer, V.L. The ecology of harmful diatoms. In Ecology of Harmful Algae; Springer: Berlin/Heidelberg, Germany, 2006; pp. 81–93. [Google Scholar]
- Bargu, S.; Baustian, M.M.; Rabalais, N.N.; Del Rio, R.; Von Korff, B.; Turner, R.E. Influence of the Mississippi River on Pseudo-nitzschia spp. Abundance and Toxicity in Louisiana Coastal Waters. Estuaries Coasts 2016, 39, 1345–1356. [Google Scholar] [CrossRef]
- Malviya, S.; Scalco, E.; Audic, S.; Vincent, F.; Veluchamy, A.; Poulain, J.; Wincker, P.; Iudicone, D.; de Vargas, C.; Bittner, L.; et al. Insights into global diatom distribution and diversity in the world’s ocean. Proc. Natl. Acad. Sci. USA 2016, 113, E1516–E1525. [Google Scholar] [CrossRef]
- Raven, J.A. The transport and function of silicon in plants. Biol. Rev. 1983, 58, 179–207. [Google Scholar] [CrossRef]
- Allen, A.E.; Dupont, C.L.; Oborník, M.; Horak, A.; Nunes-Nesi, A.; McCrow, J.; Zheng, H.; Johnson, D.A.; Hu, H.; Fernie, A.R.; et al. Evolution and metabolic significance of the urea cycle in photosynthetic diatoms. Nature 2011, 473, 203–207. [Google Scholar] [CrossRef]
- Raven, J.A. The vacuole: A cost-benefit analysis. Adv. Bot. Res. 1997, 25, 59–86. [Google Scholar] [CrossRef]
- Varkitzi, I.; Psarra, S.; Assimakopoulou, G.; Pavlidou, A.; Krasakopoulou, E.; Velaoras, D.; Papathanassiou, E.; Pagou, K. Phytoplankton dynamics and bloom formation in the oligotrophic Eastern Mediterranean: Field studies in the Aegean, Levantine and Ionian seas. Deep Sea Res. Part II Top. Stud. Oceanogr. 2020, 171, 104662. [Google Scholar] [CrossRef]
- Guinder, V.A.; Popovich, C.A.; Molinero, J.C.; Marcovecchio, J. Phytoplankton summer bloom dynamics in the Bahía Blanca Estuary in relation to changing environmental conditions. Cont. Shelf Res. 2013, 52, 150–158. [Google Scholar] [CrossRef]
- Kasperovièienë, J.; Vaikutiene, G. Long-term changes in diatom communities of phytoplankton and the surface sediments in the Curonian Lagoon (Lithuanian part). Transit. Waters Bull. 2007, 1, 27–37. [Google Scholar]
- Shikata, T.; Nagasoe, S.; Matsubara, T.; Yoshikawa, S.; Yamasaki, Y.; Shimasaki, Y.; Oshima, Y.; Jenkinson, I.R.; Honjo, T. Factors influencing the initiation of blooms of the raphidophyte Heterosigma akashiwo and the diatom Skeletonema costatum in a port in Japan. Limnol. Oceanogr. 2008, 53, 2503–2518. [Google Scholar] [CrossRef]
- Garibotti, I.A.; Ferrario, M.E.; Almandoz, G.O.; Castaños, C. Seasonal diatom cycle in Anegada Bay, El Rincon estuarine system, Argentina. Diatom. Res. 2011, 26, 227–241. [Google Scholar] [CrossRef]
- Gayoso, A.M. Seasonal succession patterns of phytoplankton in the Bahía Blanca Estuary (Argentina). Bot. Mar. 1999, 42, 367–375. [Google Scholar] [CrossRef]
- Rörig, L.R.; da Silva Tamanaha, M.; da Rosa Persich, G.; Schettini, C.A.F.; Schettini, E.C.T. Phytoplankton Patterns and Processes in a Tropical-Subtropical Transition Region: Santa Catarina Coast, Southern Brazil. In Plankton Ecology of the Southwestern Atlantic; Springer: Cham, Switzerland, 2018; pp. 269–288. [Google Scholar]
- Lucas, C.; Widdows, J.; Brinsley, M.D.; Salkeld, P.N.; Herman, P.M. Benthic-pelagic exchange of microalgae at a tidal flat. 1. Pigment analysis. Mar. Ecol. Prog. Ser. 2000, 196, 59–73. [Google Scholar] [CrossRef]
- Ignatiades, L.; Gotsis-Skretas, O. A Review on Toxic and Harmful Algae in Greek Coastal Waters (E. Mediterranean Sea). Toxins 2010, 2, 1019–1037. [Google Scholar] [CrossRef] [PubMed]
- Varkitzi, I.; Markogianni, V.; Pantazi, M.; Pagou, K.; Pavlidou, A.; Dimitriou, E. Effect of river inputs on environmental status and potentially harmful phytoplankton in a coastal area of eastern Mediterranean (Maliakos Gulf, Greece). Mediterr. Mar. Sci. 2018, 19, 326–343. [Google Scholar] [CrossRef]
- Tsikoti, C.; Genitsaris, S. Review of Harmful Algal Blooms in the Coastal Mediterranean Sea, with a Focus on Greek Waters. Diversity 2021, 13, 396. [Google Scholar] [CrossRef]
- Marchetti, A.; Varela, D.E.; Lance, V.P.; Palmucci, M.; Giordano, M.; Armbrust, E.V. Iron and silicic acid effects on phytoplankton productivity, diversity, and chemical composition in the central equatorial Pacific Ocean. Limnol. Oceanogr. 2010, 55, 11–29. [Google Scholar] [CrossRef]
- Marchetti, A.; Schruth, D.M.; Durkin, C.A.; Parker, M.S.; Kodner, R.B.; Berthiaume, C.T.; Morales, R.; Allen, A.E.; Armbrust, E.V. Comparative metatranscriptomics identifies molecular bases for the physiological responses of phytoplankton to varying iron availability. Proc. Natl. Acad. Sci. USA 2012, 109, E317–E325. [Google Scholar] [CrossRef]
- Bizsel, N.; Bizsel, K.C. New records of toxic algae Heterosigma cf. akashiwo and Gymnodinium cf. mikimotoi in the hypereutrophic Izmir Bay (Aegean Sea): Coupling between organisms and water quality parameters. Israel J. Plant Sci. 2002, 50, 33–44. [Google Scholar] [CrossRef]
- Guigue, C.; Tedetti, M.; Dang, D.H.; Mullot, J.-U.; Garnier, C.; Goutx, M. Remobilization of polycyclic aromatic hydrocarbons and organic matter in seawater during sediment resuspension experiments from a polluted coastal environment: Insights from Toulon Bay (France). Environ. Pollut. 2017, 229, 627–638. [Google Scholar] [CrossRef]
- Burkholder, J.M.; Glibert, P.M.; Skelton, H.M. Mixotrophy, a major mode of nutrition for harmful algal species in eutrophic waters. Harmful Algae 2008, 8, 77–93. [Google Scholar] [CrossRef]
- Lindehoff, E.; Granéli, E.; Glibert, P.M. Nitrogen uptake kinetics of Prymnesium parvum (Haptophyte). Harmful Algae 2011, 12, 70–76. [Google Scholar] [CrossRef]
- Hartmann, M.; Zubkov, M.V.; Scanlan, D.J.; Lepère, C. In situ interactions between photosynthetic picoeukaryotes and bacterioplankton in the Atlantic Ocean: Evidence for mixotrophy. Environ. Microbiol. Rep. 2013, 5, 835–840. [Google Scholar] [CrossRef]
- Preece, E.P.; Hardy, F.J.; Moore, B.C.; Bryan, M. A review of microcystin detections in Estuarine and Marine waters: Environmental implications and human health risk. Harmful Algae 2017, 61, 31–45. [Google Scholar] [CrossRef]
- Chen, L.; Giesy, J.P.; Adamovsky, O.; Svirčev, Z.; Meriluoto, J.; Codd, G.A.; Mijovic, B.; Shi, T.; Tuo, X.; Li, S.; et al. Challenges of using blooms of Microcystis spp. in animal feeds: A comprehensive review of nutritional, toxicological and microbial health evaluation. Sci. Total Environ. 2021, 764, 142319. [Google Scholar] [CrossRef]
- Cozzoli, F.; Stanca, E.; Selmeczy, G.; Francé, J.; Varkitzi, I.; Basset, A. Sensitivity of phytoplankton metrics to sample-size: A case study on a large transitional water dataset (WISER). Ecol. Indic. 2017, 82, 558–573. [Google Scholar] [CrossRef]
- Varkitzi, I.; Francé, J.; Basset, A.; Cozzoli, F.; Stanca, E.; Zervoudaki, S.; Giannakourou, A.; Assimakopoulou, G.; Venetsanopoulou, A.; Mozetič, P.; et al. Pelagic habitats in the Mediterranean Sea: A review of Good Environmental Status (GES) determination for plankton components and identification of gaps and priority needs to improve coherence for the MSFD implementation. Ecol. Indic. 2018, 95, 203–218. [Google Scholar] [CrossRef]
- Magliozzi, C.; Druon, J.N.; Palialexis, A.; Aguzzi, L.; Alexande, B.; Antoniadis, K.; Artigas, L.F.; Azzellino, A.; Bisinicu, E.; Boicenco, L.; et al. Pelagic Habitats under the MSFD D1: Scientific Advice of Policy Relevance. EUR 30671 EN; Publications Office of the European Union: Luxembourg, 2021; Available online: https://publications.jrc.ec.europa.eu/repository/handle/JRC124882 (accessed on 10 May 2022). [CrossRef]
- Magliozzi, C.; Druon, J.-N.; Palialexis, A.; Artigas, L.F.; Boicenco, L.; González-Quirós, R.; Gorokhova, E.; Heyden, B.; McQuatters-Gollop, A.; Varkitzi, I. Pelagic Habitats under MSFD D1: Current Approaches and Priorities. EUR 30619 EN; Publications Office of the European Union: Luxembourg, 2021; Available online: https://publications.jrc.ec.europa.eu/repository/bitstream/JRC123960/msfd_pelagic_habitats.pdf (accessed on 10 May 2022). [CrossRef]
- Francé, J.; Varkitzi, I.; Stanca, E.; Cozzoli, F.; Skejić, S.; Ungaro, N.; Vascotto, I.; Mozetič, P.; Gladan, N.; Assimakopoulou, G.; et al. Large-scale testing of phytoplankton diversity indices for environmental assessment in Mediterranean sub-regions (Adriatic, Ionian and Aegean Seas). Ecol. Indic. 2021, 126, 107630. [Google Scholar] [CrossRef]
- Halpern, B.S.; Walbridge, S.; Selkoe, K.A.; Kappel, C.V.; Micheli, F.; D’Agrosa, C.; Bruno, J.F.; Casey, K.S.; Ebert, C.; Fox, H.E.; et al. A global map of human impact on marine ecosystems. Science 2008, 319, 948–952. [Google Scholar] [CrossRef]
- Tweddle, J.F.; Gubbins, M.; Scott, B.E. Should phytoplankton be a key consideration for marine management? Mar. Policy 2018, 97, 1–9. [Google Scholar] [CrossRef]


| Sampling Stations | Latitude (N) | Longitude (E) | Depth (m) | Site |
|---|---|---|---|---|
| DSS1 | 37°53′40″ | 23°39′40″ | 66 | Dumping site |
| DSS2 | 37°53′10″ | 23°39′10″ | 69 | Dumping site |
| DSS3 | 37°53′20″ | 23°40′50″ | 50 | Nearby site |
| DSS4 | 37°52′20″ | 23°38′20″ | 77 | Nearby site |
| DSS5 | 37°54′00″ | 23°38′20″ | 71 | Nearby site |
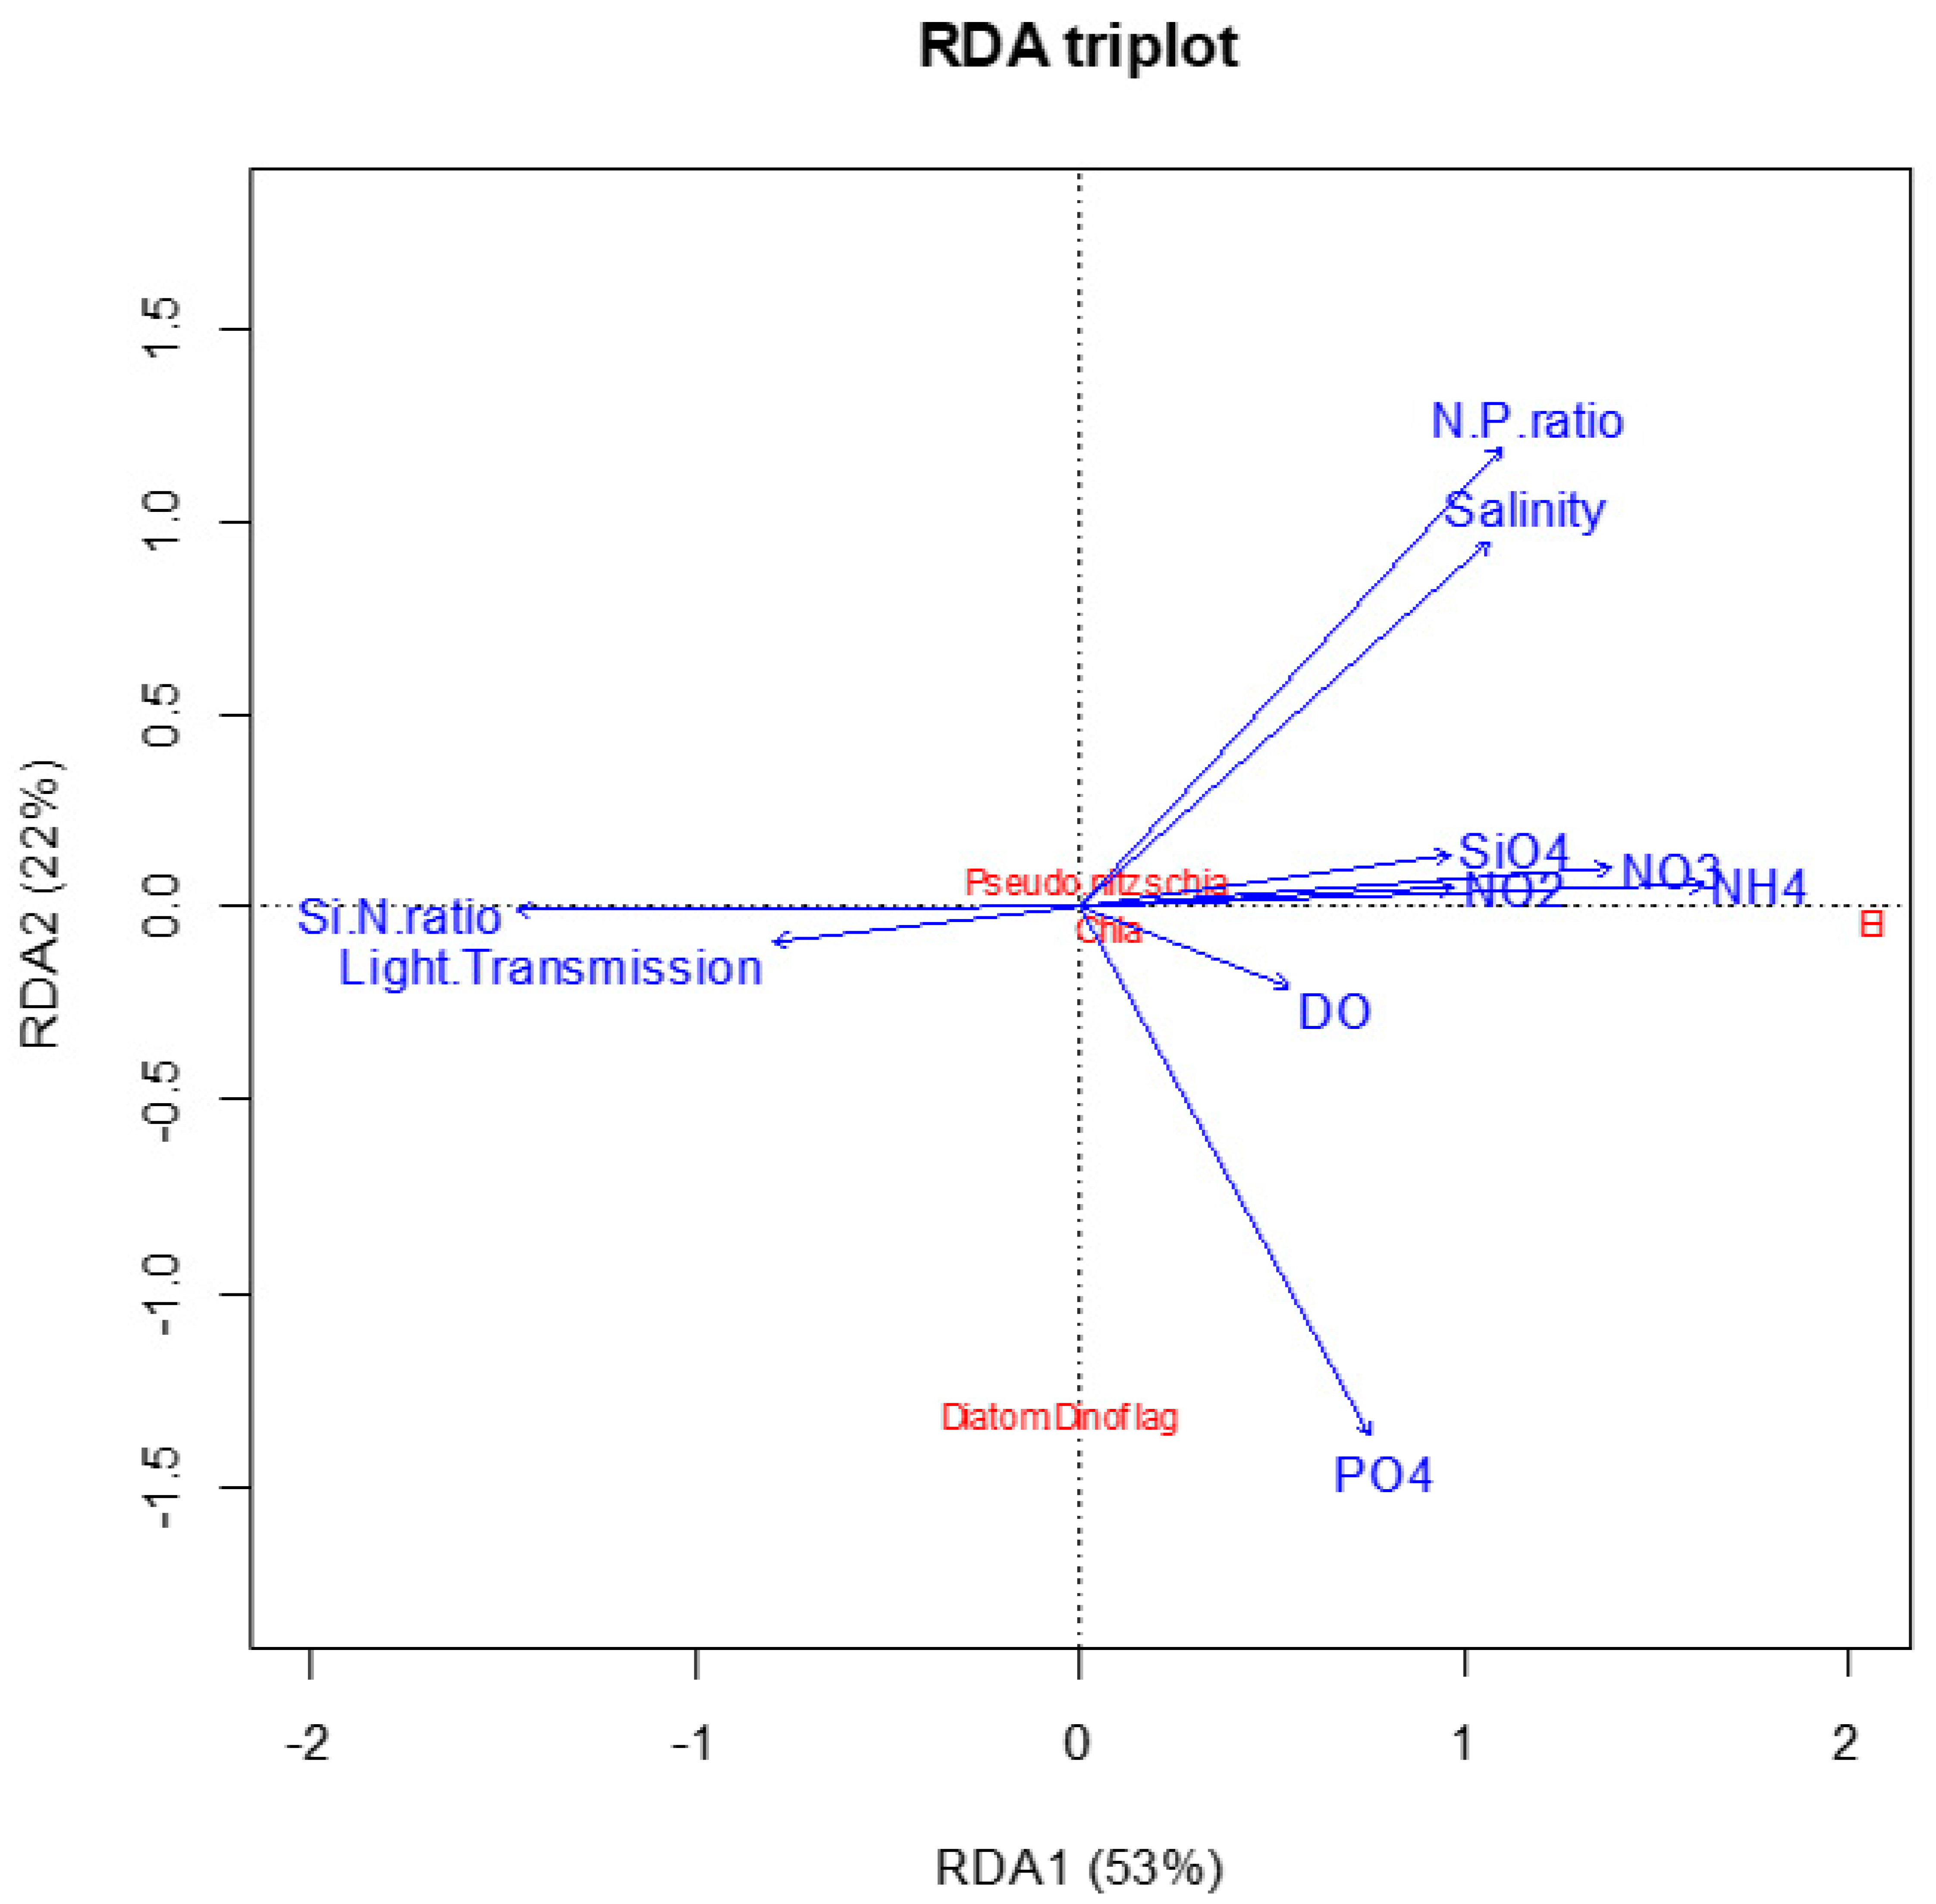
| Response Variables | RDA1 | RDA2 | Explanatory Variables | RDA1 | RDA2 |
|---|---|---|---|---|---|
| EI | 2.055 | −0.03134 | Ammonium NH4 (μM) | 0.8155 | 0.030799 |
| Nitrates NO3 (μM) | 0.6931 | 0.050349 | |||
| Chorophyll-a (Ln) | 0.07744 | −0.04749 | Salinity | 0.5360 | 0.478432 |
| Light Transmission | −0.4017 | −0.045965 | |||
| Diatoms: Dinoflagellates ratio (Ln) | −0.04951 | −1.321 | Phosphates PO4 (μM) | 0.3772 | −0.690978 |
| Dissolved Oxygen (mL/L) | 0.2722 | −0.102520 | |||
| N:P ratio | 0.5506 | 0.601707 | |||
| Abundance of Pseudo-nitzschia multiseries (Ln) | 0.03745 | 0.07160 | Si:N ratio | −0.7384 | −0.003835 |
| Nitrites NO2 (μM) | 0.4863 | 0.025692 | |||
| Silicates SiO4 (μM) | 0.4836 | 0.068162 |
Publisher’s Note: MDPI stays neutral with regard to jurisdictional claims in published maps and institutional affiliations. |
© 2022 by the authors. Licensee MDPI, Basel, Switzerland. This article is an open access article distributed under the terms and conditions of the Creative Commons Attribution (CC BY) license (https://creativecommons.org/licenses/by/4.0/).
Share and Cite
Varkitzi, I.; Pavlidou, A.; Pantazi, M.; Rousselaki, E.; Hatiris, G.-A.; Gratsia, E.; Kapsimalis, V.; Pagou, K. Dumping of Dredge Spoil in the Pelagic Habitat: Focus on Trophic Status, Phytoplankton Diversity Responses and Generation of Blooms. Water 2022, 14, 2343. https://doi.org/10.3390/w14152343
Varkitzi I, Pavlidou A, Pantazi M, Rousselaki E, Hatiris G-A, Gratsia E, Kapsimalis V, Pagou K. Dumping of Dredge Spoil in the Pelagic Habitat: Focus on Trophic Status, Phytoplankton Diversity Responses and Generation of Blooms. Water. 2022; 14(15):2343. https://doi.org/10.3390/w14152343
Chicago/Turabian StyleVarkitzi, Ioanna, Alexandra Pavlidou, Maria Pantazi, Eleni Rousselaki, Georgios-Angelos Hatiris, Eirini Gratsia, Vasilios Kapsimalis, and Kalliopi Pagou. 2022. "Dumping of Dredge Spoil in the Pelagic Habitat: Focus on Trophic Status, Phytoplankton Diversity Responses and Generation of Blooms" Water 14, no. 15: 2343. https://doi.org/10.3390/w14152343