Article

Modelling Water Flow and Soil Erosion in Mediterranean Headwaters (with or without Check Dams) under Land-Use and Climate Change Scenarios Using SWAT

by
Demetrio Antonio Zema
1,*,
Bruno Gianmarco Carrà
1,
Manuel Esteban Lucas-Borja
2,
Pasquale Giuseppe Fabio Filianoti
3,
Pedro Pérez-Cutillas
4 and
Carmelo Conesa-García
4
1
Department Agraria, “Mediterranea” University of Reggio Calabria, Località Feo di Vito, I-89122 Reggio Calabria, Italy
2
Department of Agroforestry Technology, Science and Genetics, School of Advanced Agricultural and Forestry Engineering, Campus Universitario s/n, Castilla La Mancha University, E-02071 Albacete, Spain
3
Department of Civil, Energy, Environmental and Material Engineering (DICEAM), “Mediterranea” University of Reggio Calabria, Via Graziella, I-89122 Reggio Calabria, Italy
4
Department of Geography, University of Murcia, 30001 Murcia, Spain
*
Author to whom correspondence should be addressed.
Water 2022, 14(15), 2338; https://doi.org/10.3390/w14152338
Submission received: 28 June 2022 / Revised: 21 July 2022 / Accepted: 26 July 2022 / Published: 28 July 2022
(This article belongs to the Special Issue Hydrological Response to Climate Change)

Abstract

:
The use of check dams is a common strategy to reduce soil erosion in the Mediterranean headwaters. However, the effects of these control works on water flow rates and sediment yields have been scarcely investigated under possible scenarios of climate and land-use changes. On this regard, the use of hydrological models, such as SWAT, provide reliable hydrological predictions under variable environmental conditions. To fill this gap, this study has evaluated the effectiveness of check dams on the hydrological response of a forest headwater in Calabria (Southern Italy) in comparison with an unregulated subcatchment with very similar environmental conditions. In this regard, the effects of different combined scenarios of climate change (through three GCMs and two RCPs applied to a time period of the next 80 years) and land use (forest, pasture, and cropland) on water flow rates and sediment yields in the two headwaters were analysed using the SWAT model. The SWAT model was first calibrated in a third headwater with very similar climatic, soil, and land-use conditions, and this verification showed a satisfactory prediction capacity of water flow rate. The water flow rate prediction capacity of the model was satisfactory (coefficients of determination and efficiency of Nash and Sutcliffe equal to 0.71 and 0.67, respectively, and percent bias of 14.9%). No significant differences were detected for the water flow rates and sediment yields between the two subcatchments (with or without check dams) among the different land-use and climate change scenarios. This was linked to the low hydrological response of both headwaters to the forcing actions, which influenced the low effectiveness of the control works. SWAT estimated higher values of both mean and maximum values of water flow rates and sediment yields under RCP2.6 compared with RCP8.5. Both water flow rates and sediment yields were predicted to be very low under all climate and land-use scenarios. The regulated headwater with check dams was predicted to always produce more runoff and erosion compared with the subcatchment without check dams. The increases were predicted to be up to 60% for the maximum flow rate and 30–35% for the sediment yield in forest land use under RCP2.6. Although there was a limitation in this study due to the lack of validation of the erosion data (due to unavailable records of sediment yield), this study demonstrated how the use of check dams in headwater catchments may be not effective for soil conservation purposes several decades after their installation in Mediterranean semiarid areas, where the water flow and erosion rate are limited.

1. Introduction

Mediterranean ephemeral torrents are exposed to intense floods and erosion, which may generate hazards for infrastructures and human lives [1]. Flash floods are typical for the Mediterranean region, and they have been recurring at increasing frequency over the past few decades, especially over the Italian Peninsula [2]. Erosion is one of the major threats to soils in the European Union, with a negative impact on ecosystem services, crop production, drinking water, and carbon stocks [3]. The most noticeable consequences of soil erosion include water quality deterioration and soil degradation, and increased sediment detachment, transportation, and deposition in natural lakes and water reservoirs [4]. Moreover, unsustainable management practices and climate change affect many ecosystems, especially in the Mediterranean region. Here, many socioeconomic activities and rapid land-use and climate changes are increasing the pressure on soil, which is increasingly exposed to floods and erosion [5].
These hydrogeological risks are associated with two main factors: (i) the local hydrological input, consisting of frequent and intense rainfalls with high erosivity power [6] that are typical of convective systems [7]; and (ii) the specific geomorphic characteristics, such as the short concentration time, complex orography, small drainage areas, short length, steep slopes, and erodible soils, of many Mediterranean catchments [8,9]. Moreover, sediment detachment, transport, and deposition processes in those catchments can be noticeably altered by anthropogenic activities, such as deforestation, intensive agriculture, overgrazing, insect outbreaks, and forest fires [4,5,10]. To avoid or, at least, limit the hydrogeological risks within tolerable thresholds in the Mediterranean torrents, proper control of their hydrological response is essential, which is often a challenging task for land managers and authorities charged with catchment protection [11,12]. Several soil conservation strategies can be adopted to control water and sediment flows in catchments, at both hillslope (e.g., mulching, terracing, fascines) and channel (e.g., check dam) scales [13,14]. The installation of check dams is presumably the most common strategy to protect catchments in semiarid environments in combination with reforestation works [15,16,17]. Check dams are transverse structures that are built in channels to reduce erosion and regulate floods [14]. Check dams produce hydrological, morphological, and ecological effects far away from the structures themselves [17,18]. On the geomorphological point of view, check dams retain sediments, stabilize the channel bed, protect the banks, and reduce the longitudinal gradient of the torrent [19,20,21]. The hydrological actions consist of stream flow modulation, debris flow regulation, and runoff control [14,22,23]. Moreover, several ecological effects are recognised for check dams, from riparian vegetation restoration to land reclamation [18,24,25].
The presence of check dams is essential to regulate water and sediment flows in the headwaters of catchments, where the hydrological and erosion processes are activated. These flows extend beyond the local scale downstream to valley areas, which are mostly exposed to floods and debris flows [25,26,27]. The torrents of Southern Italy, where thousands of check dams have been installed over the last century, are emblematic examples of this catchment-protection strategy, which has avoided disrupting floods with possible huge damage to infrastructures and loss of human lives in valley areas [6,28].
A large body of literature has paid significant attention to the effects of check dams in Mediterranean torrents, at both the reach and the catchment scales (e.g., [11,17,20,25]). Many of these studies have evaluated the ex-post effectiveness of check dams in controlling the water and sediment flows [19,29,30]. However, the hydrological, morphological, and ecological effects of these structures are not completely clear, due to the large variability of the environmental conditions and driving factors [11,15,16]. Moreover, undesired and secondary effects on channel morphology are possible with negative impacts on catchment hydrology and geomorphic processes [14,31]. All these effects are dynamically variable over time; therefore, both the short-term impacts (when the regulated channels are not stable) and the steady-state functioning (some decades after check dam construction) of these structures need to be further explored.
Furthermore, the hydrological and morphological effects of check dams have been mainly analysed by comparisons before and after their installation (e.g., [15,16]). However, this comparison, although providing interesting indications, may not be always representative of the catchment’s functioning at a given time [32]. A synchronic comparison of headwaters regulated with check dams or not regulated should be more suitable to disentangle the geomorphological and hydrological effects of the structures, provided that the hydrological input and environmental conditions are the same. Therefore, this approach allows us to better understand whether a structure or a series of staggered check dams are effective or not for catchment systems in both short- and long-term views [33,34]. Therefore, this synchronic assessment may be more helpful in giving catchment managers indications of how to optimise the functioning or maintenance of check dams. This approach is uncommon in the scientific literature, mainly because it is difficult to collect records of water and sediment flows in unregulated and regulated catchments with the same climatic and geomorphological characteristics [26].
Another important issue of torrent protection is the role of check dams on catchment hydrology and morphology under the future climate and land-use changes. The relevant scenarios have forecasted increases in rainfall erosivity and mean temperature [35,36]. Consequently, an aggravation of flooding and hydrogeological instability in Mediterranean headwaters is expected [37,38,39]. The Mediterranean torrents experience a high seasonal variability with alternating dry and wet periods, and thus these hydro-systems will be severely affected by the negative impacts of future climate changes [40]. Moreover, large areas of Mediterranean headwaters are subjected to land-use changes (for instance, deforestation, agricultural abandonment, and overgrazing or, in contrast, reforestation, agricultural intensification, and pasture rehabilitation). These changes have heavy impacts on a given catchment’s hydrological response [41,42,43]. Therefore, it is essential to evaluate the hydrological and morphological effectiveness of check dams under both climate and land-use changes. To the authors’ best knowledge, no relevant studies have explored the hydrological functioning and geomorphological balance of headwaters regulated by check dams under climate and land-use change scenarios.
According to [44], studies about the potential effects of climate and land-use changes on surface water and erosion are scarce in the Mediterranean region. The use of hydrological models, which are effective tools for simulating the hydrological functioning of torrents at the catchment scale, can provide useful indications about the effectiveness of actions for catchment restoration for landscape planners [8,45].
To fill the research gaps mentioned above, this study has analysed the hydrological response of two forest headwaters in Calabria (Southern Italy), one of which is regulated by check dams built in the 1950s, and the other is undisturbed. The catchments have the same climate, and very similar land-use and soil characteristics. In a previous study conducted in the same catchments, a modelling approach using the HEC-HMS and MUSLE models showed that check dams did not significantly reduce the surface runoff compared to the unregulated torrent. Moreover, the structures retained sediments for about 8–10 years after their installation, reducing erosion by about 35%; after the soil-retention capacity of the dam sediment wedge was depleted, the sediment yield in the regulated torrent was high (by about 20%) compared with the headwater without check dams [26]. A similar behaviour was found in other semiarid Mediterranean catchments regulated with check dams in their filling phase, which experienced different geomorphological effectiveness [46]. The present study extends this historical analysis to future scenarios of climate and land-use changes. More specifically, the effects of combinations of climate change scenarios (two representative concentration pathways (RCP)—RCP2.6 and RCP8.5—which were produced by three Global Circulation Models: MIROC5, GISS-E2-H, and MRI-CGCM3) and three alternative land-use distributions (forest, pasture, and cropland) on flow rates and sediment yields have been simulated using the well-known SWAT model. We adopted this model due to its large use in hydrological modelling and its potential for simulating climate change and land-use scenarios. This modelling approach can indicate the effectiveness of check dams under these forcing factors (climate and land-use changes), and the feasibility of this catchment-protection strategy in the long term for torrents of Southern Italy. We hypothesise that (i) both the climate and land-use changes will significantly impact the water flow and erosion rates in the studied catchments; and (ii) the unregulated catchment will show a lower hydrological response in terms of water flow rates and sediment yields compared with the headwater without check dams.

2. Materials and Methods
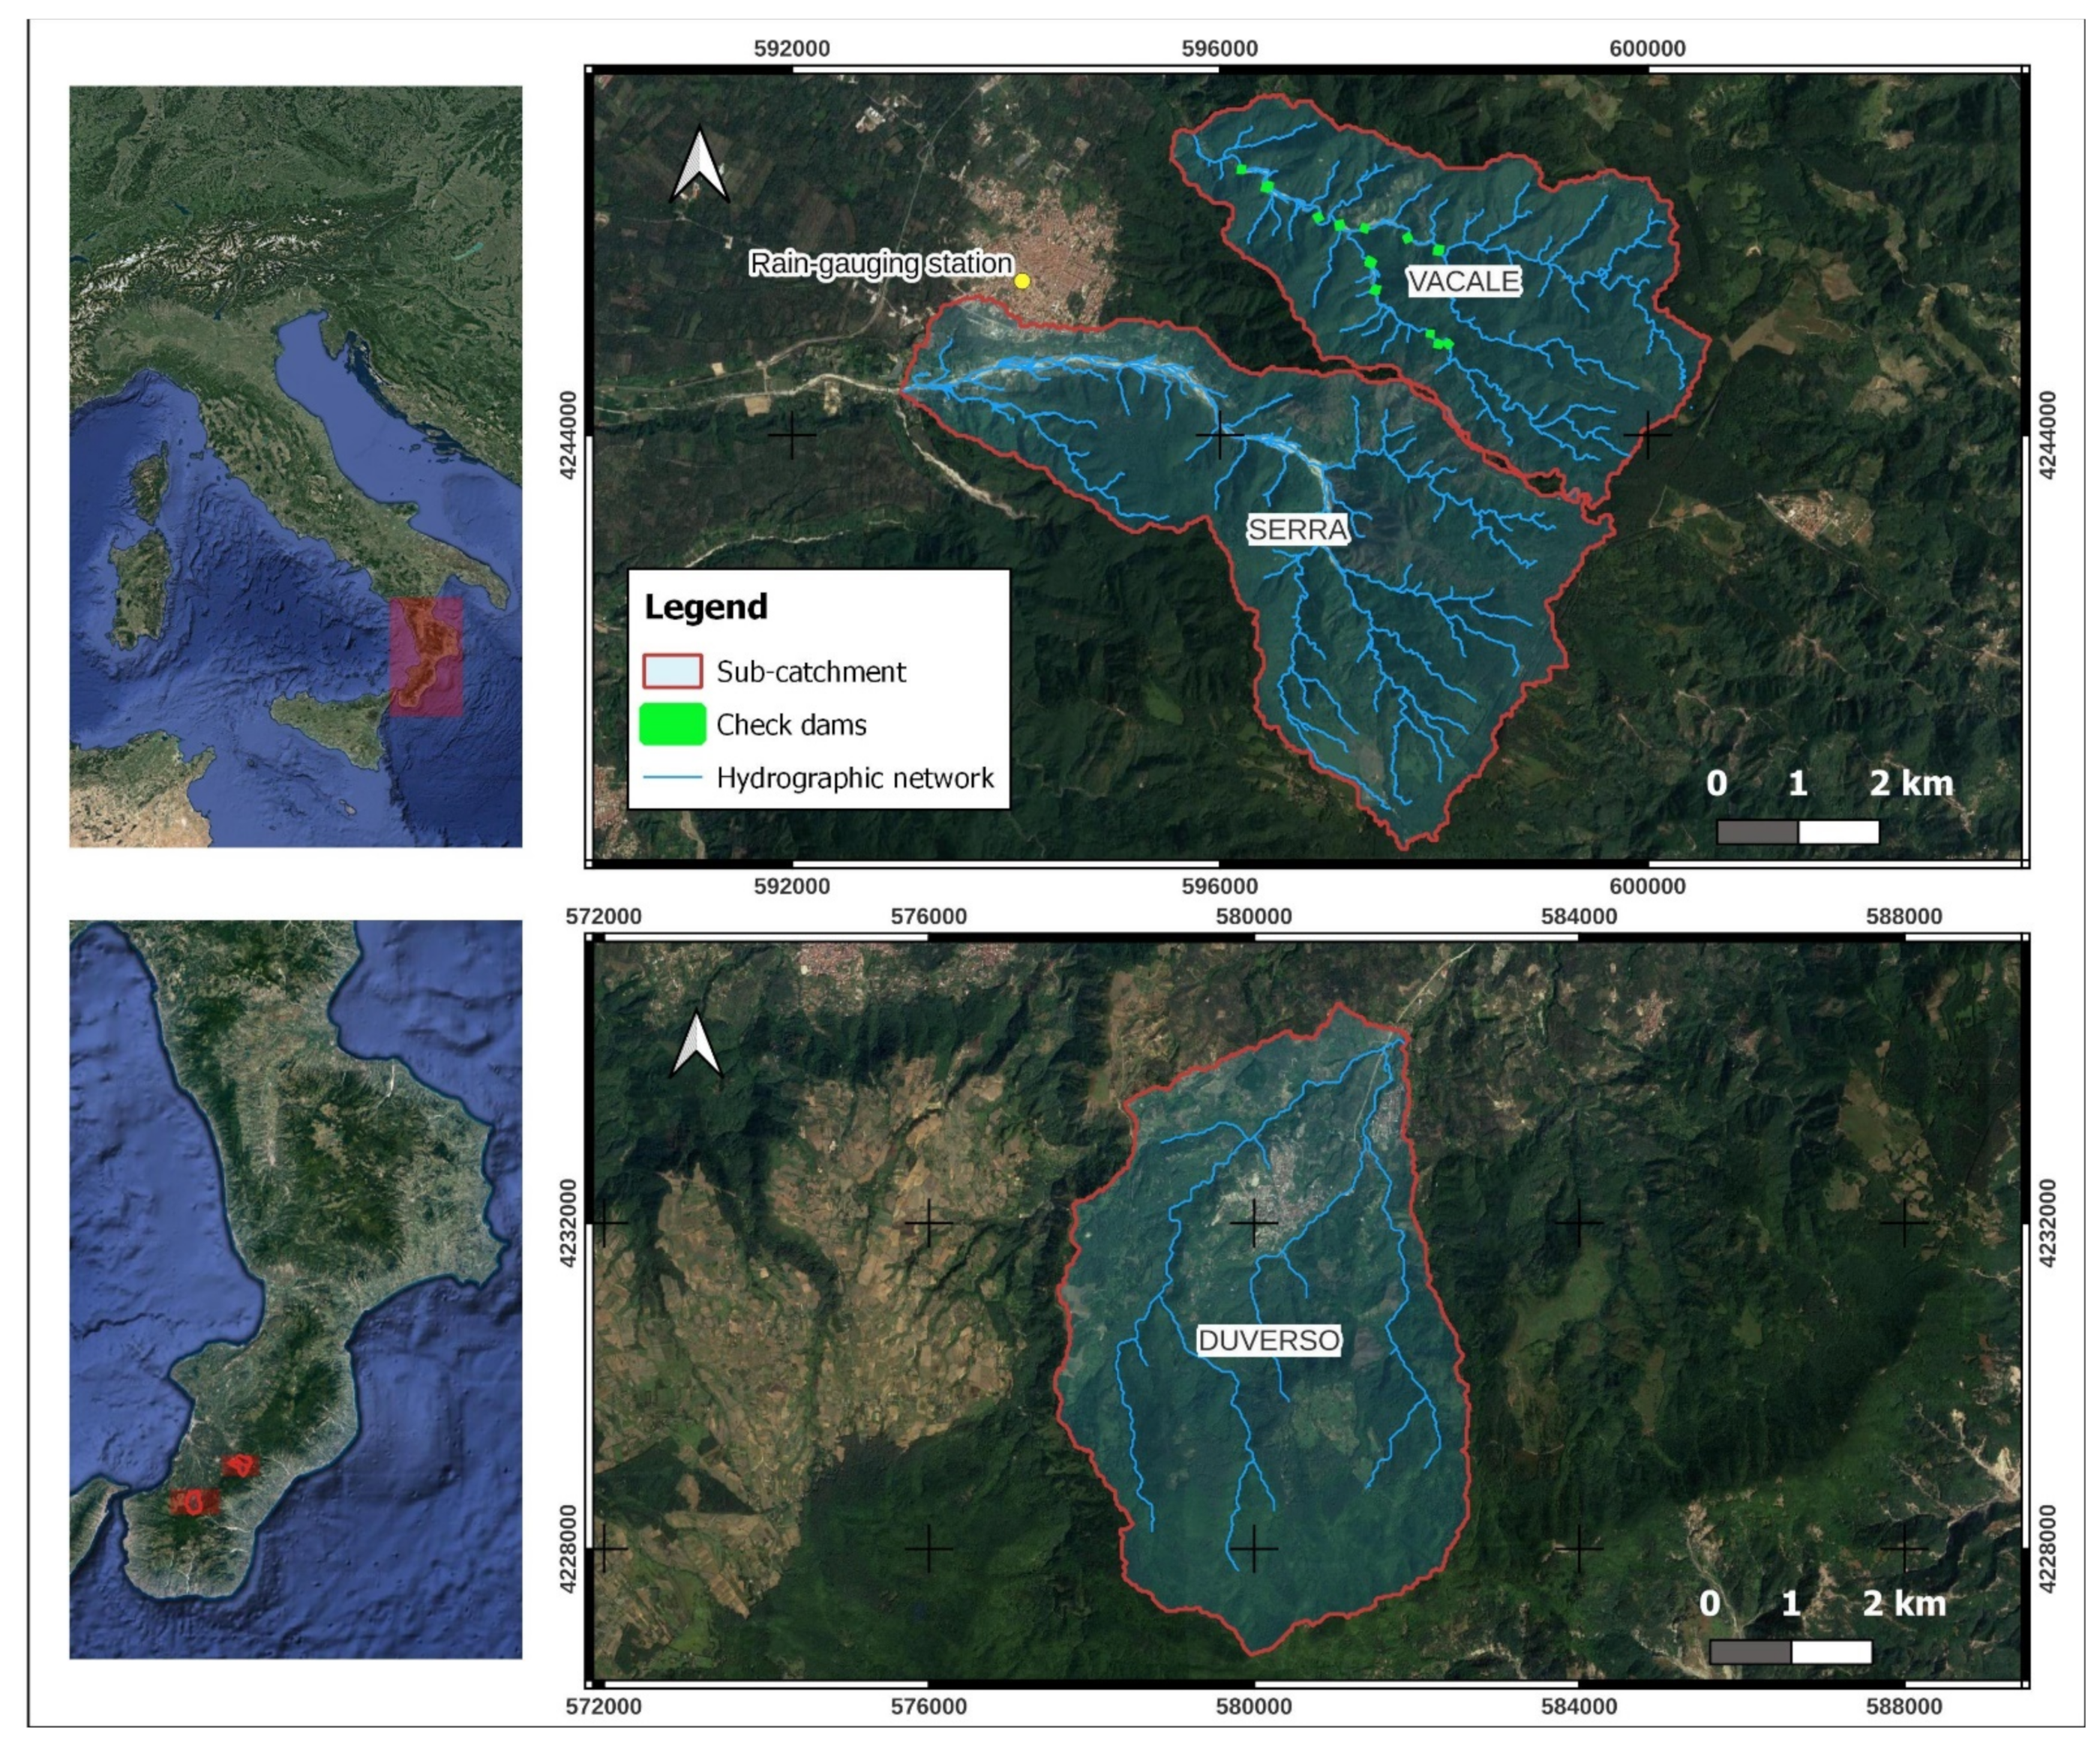
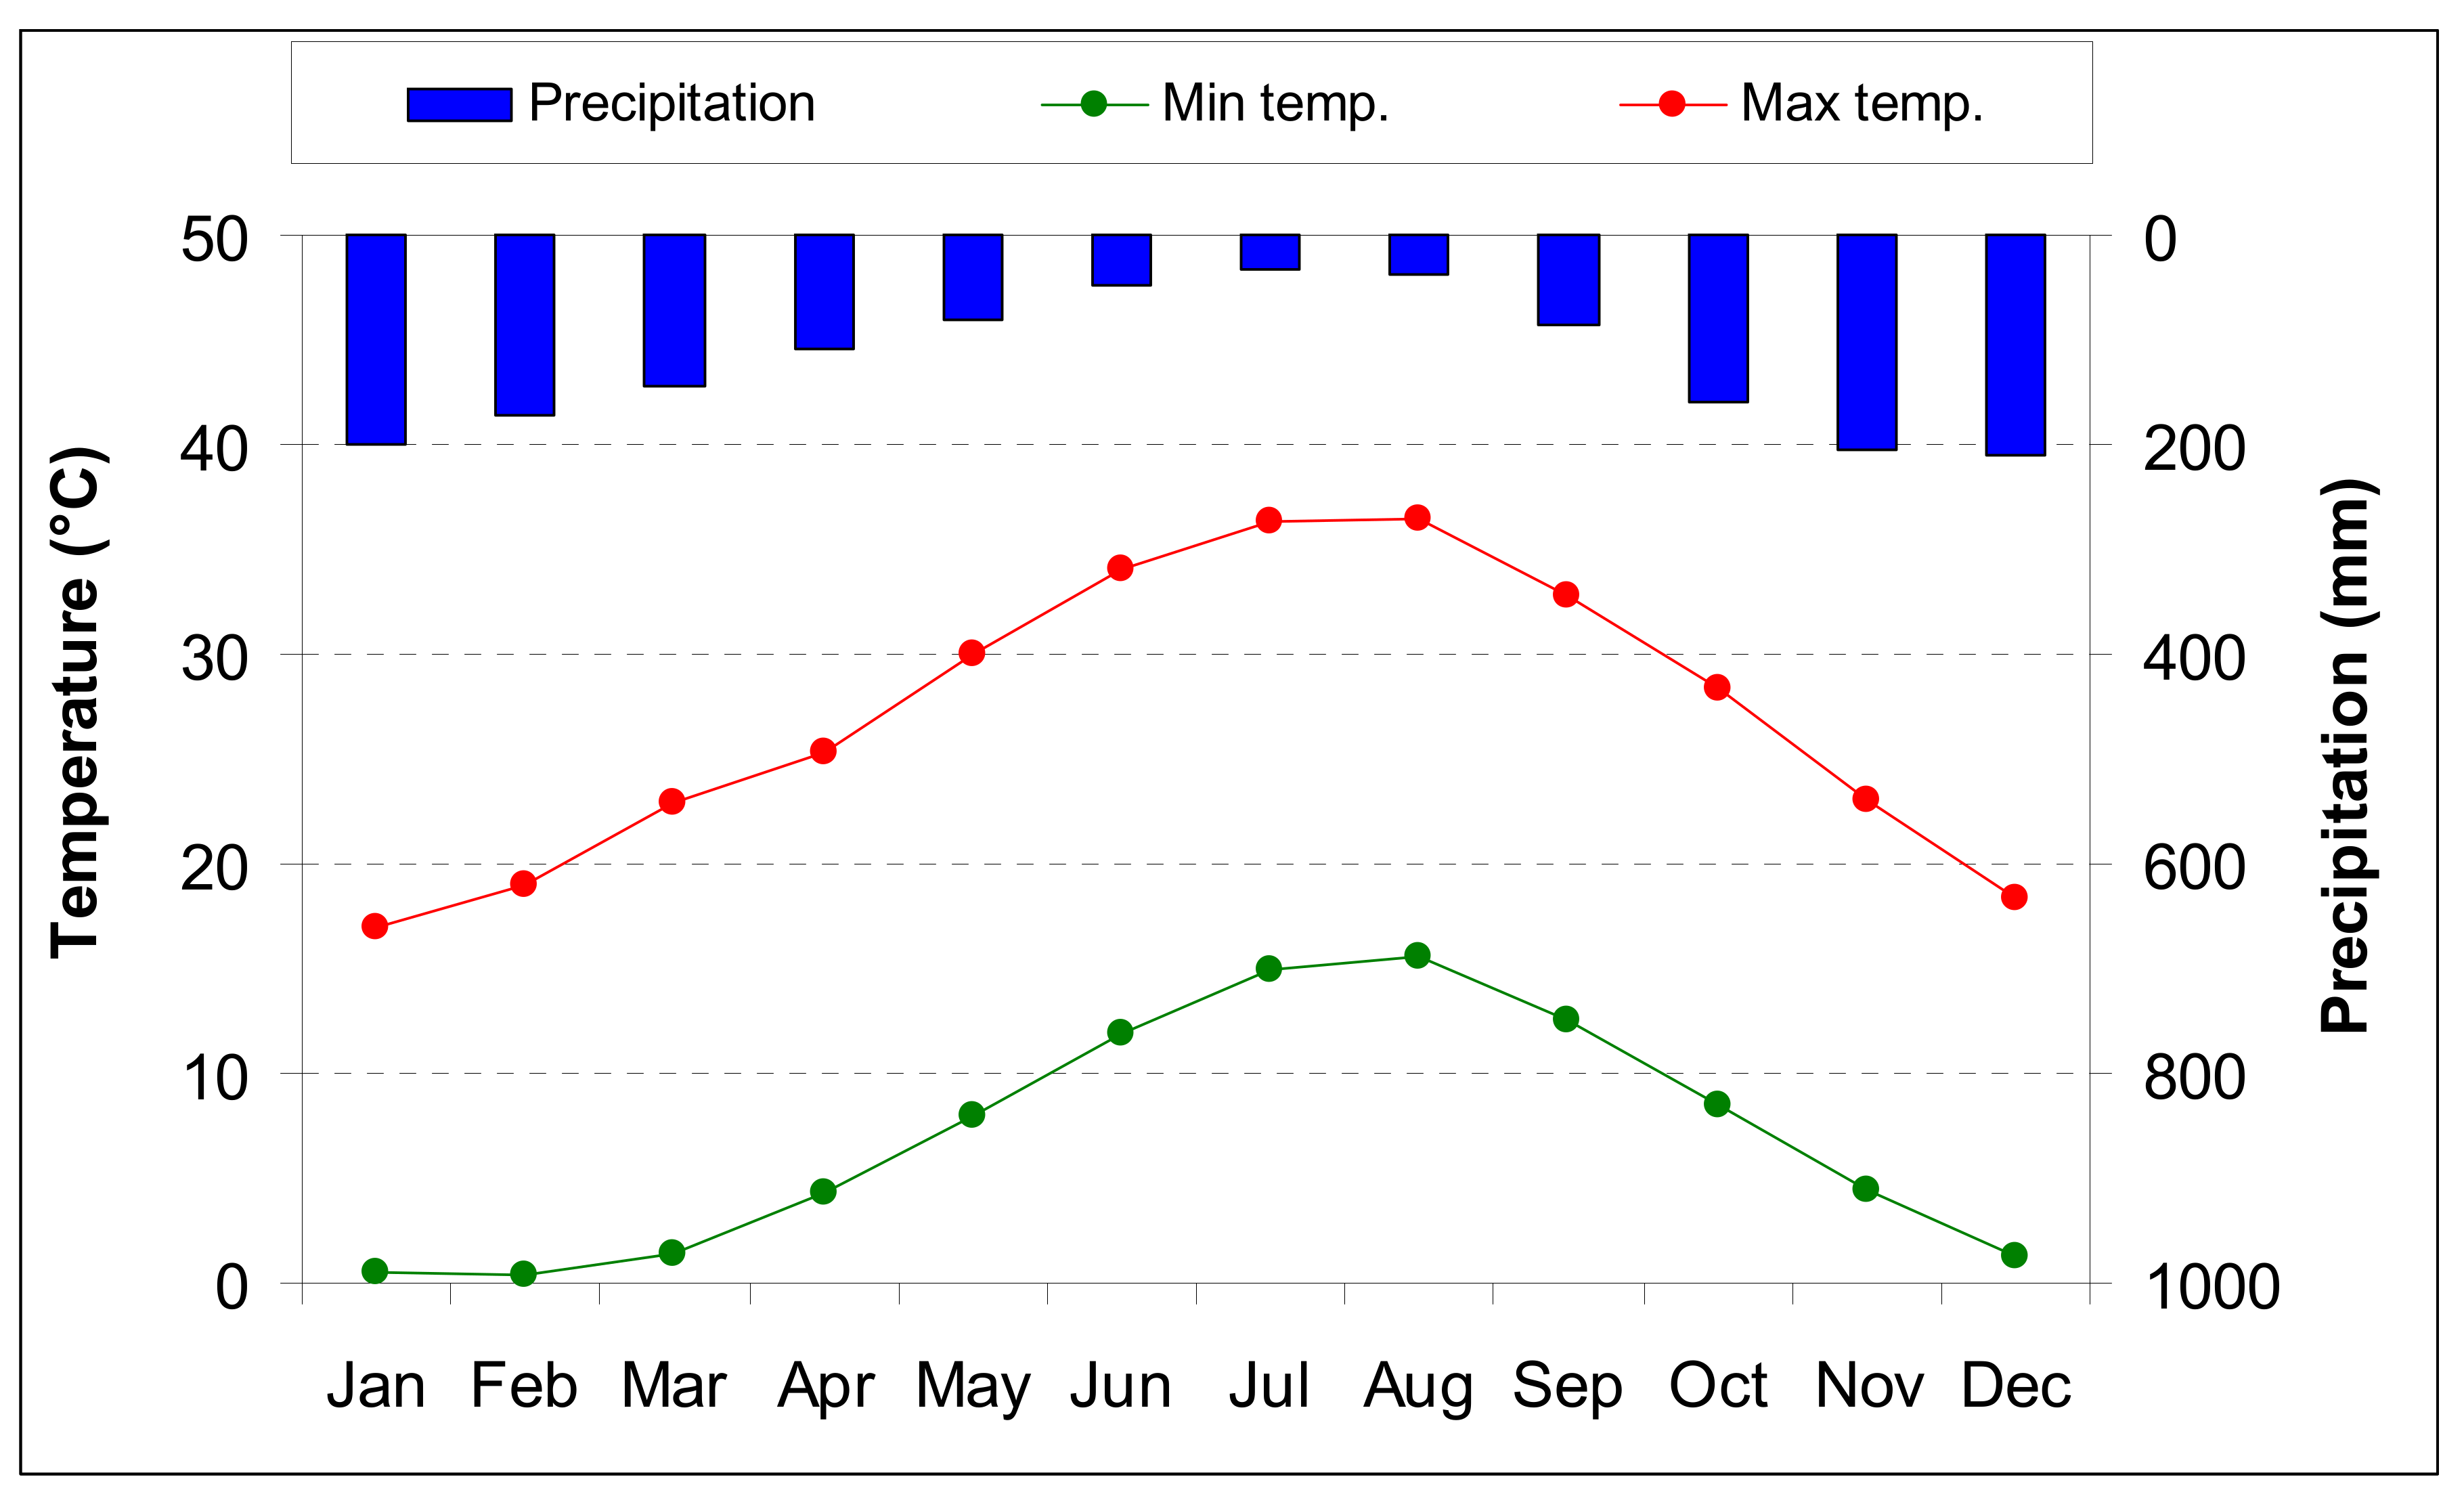
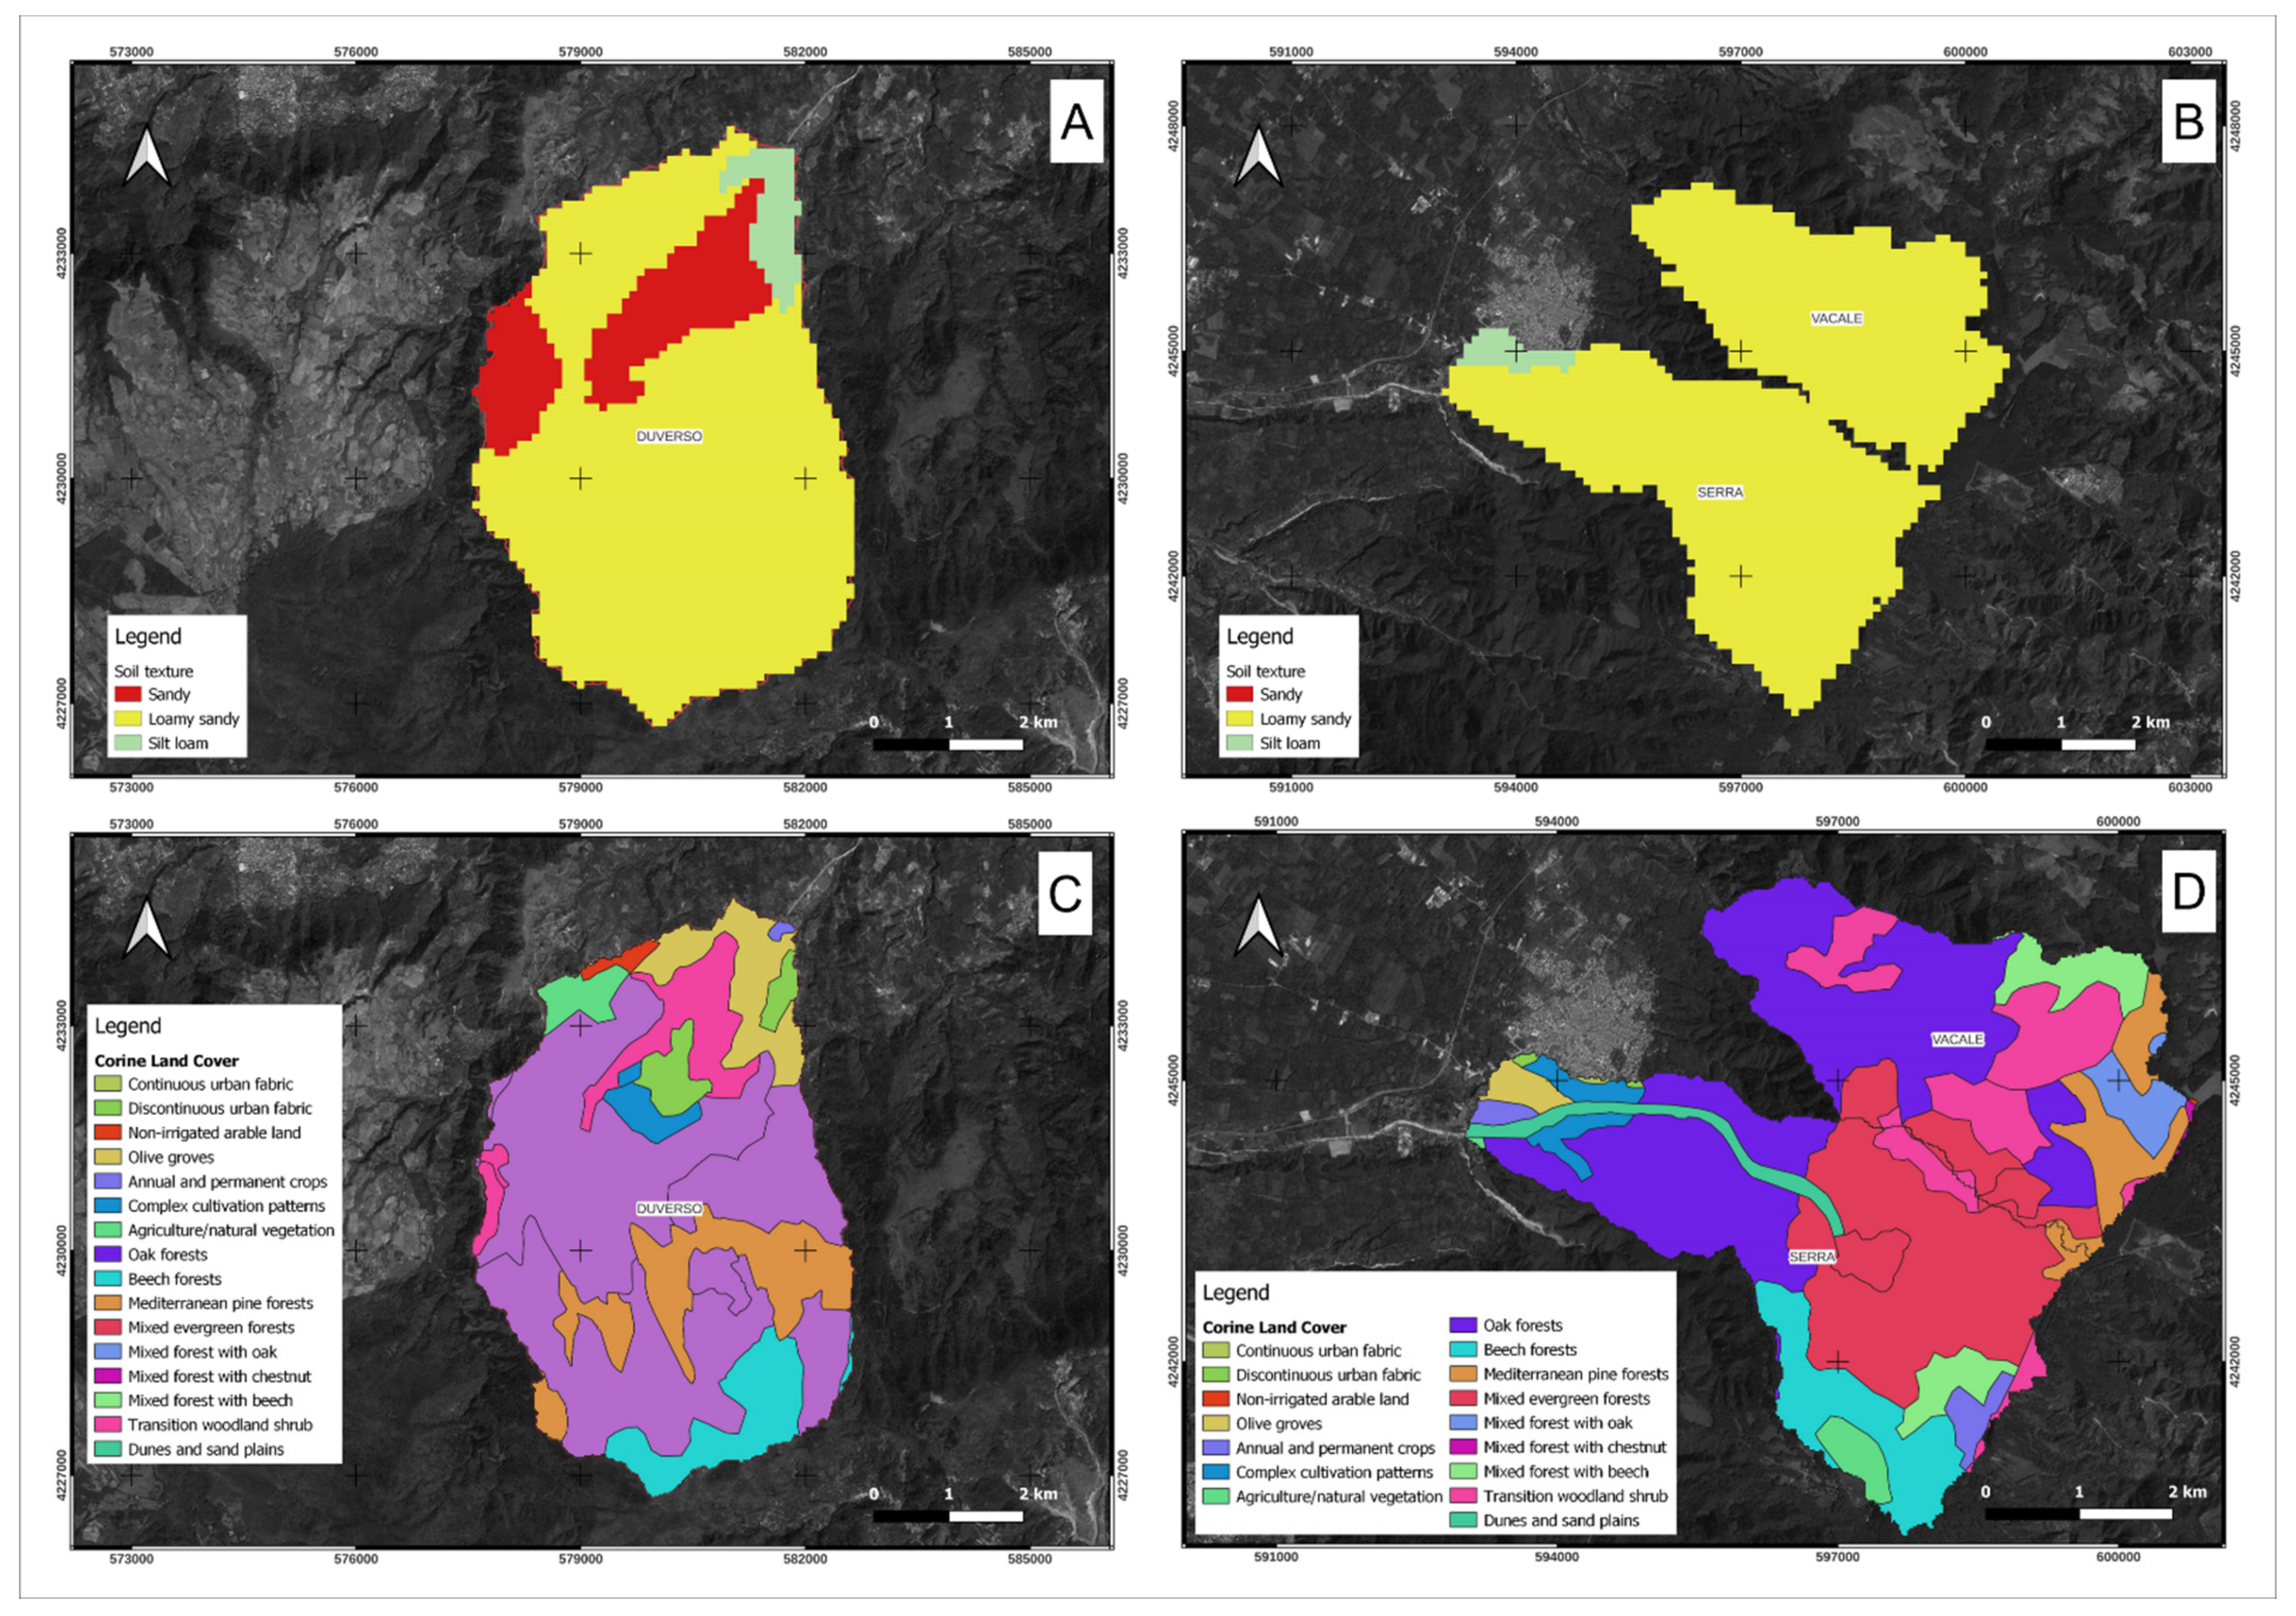
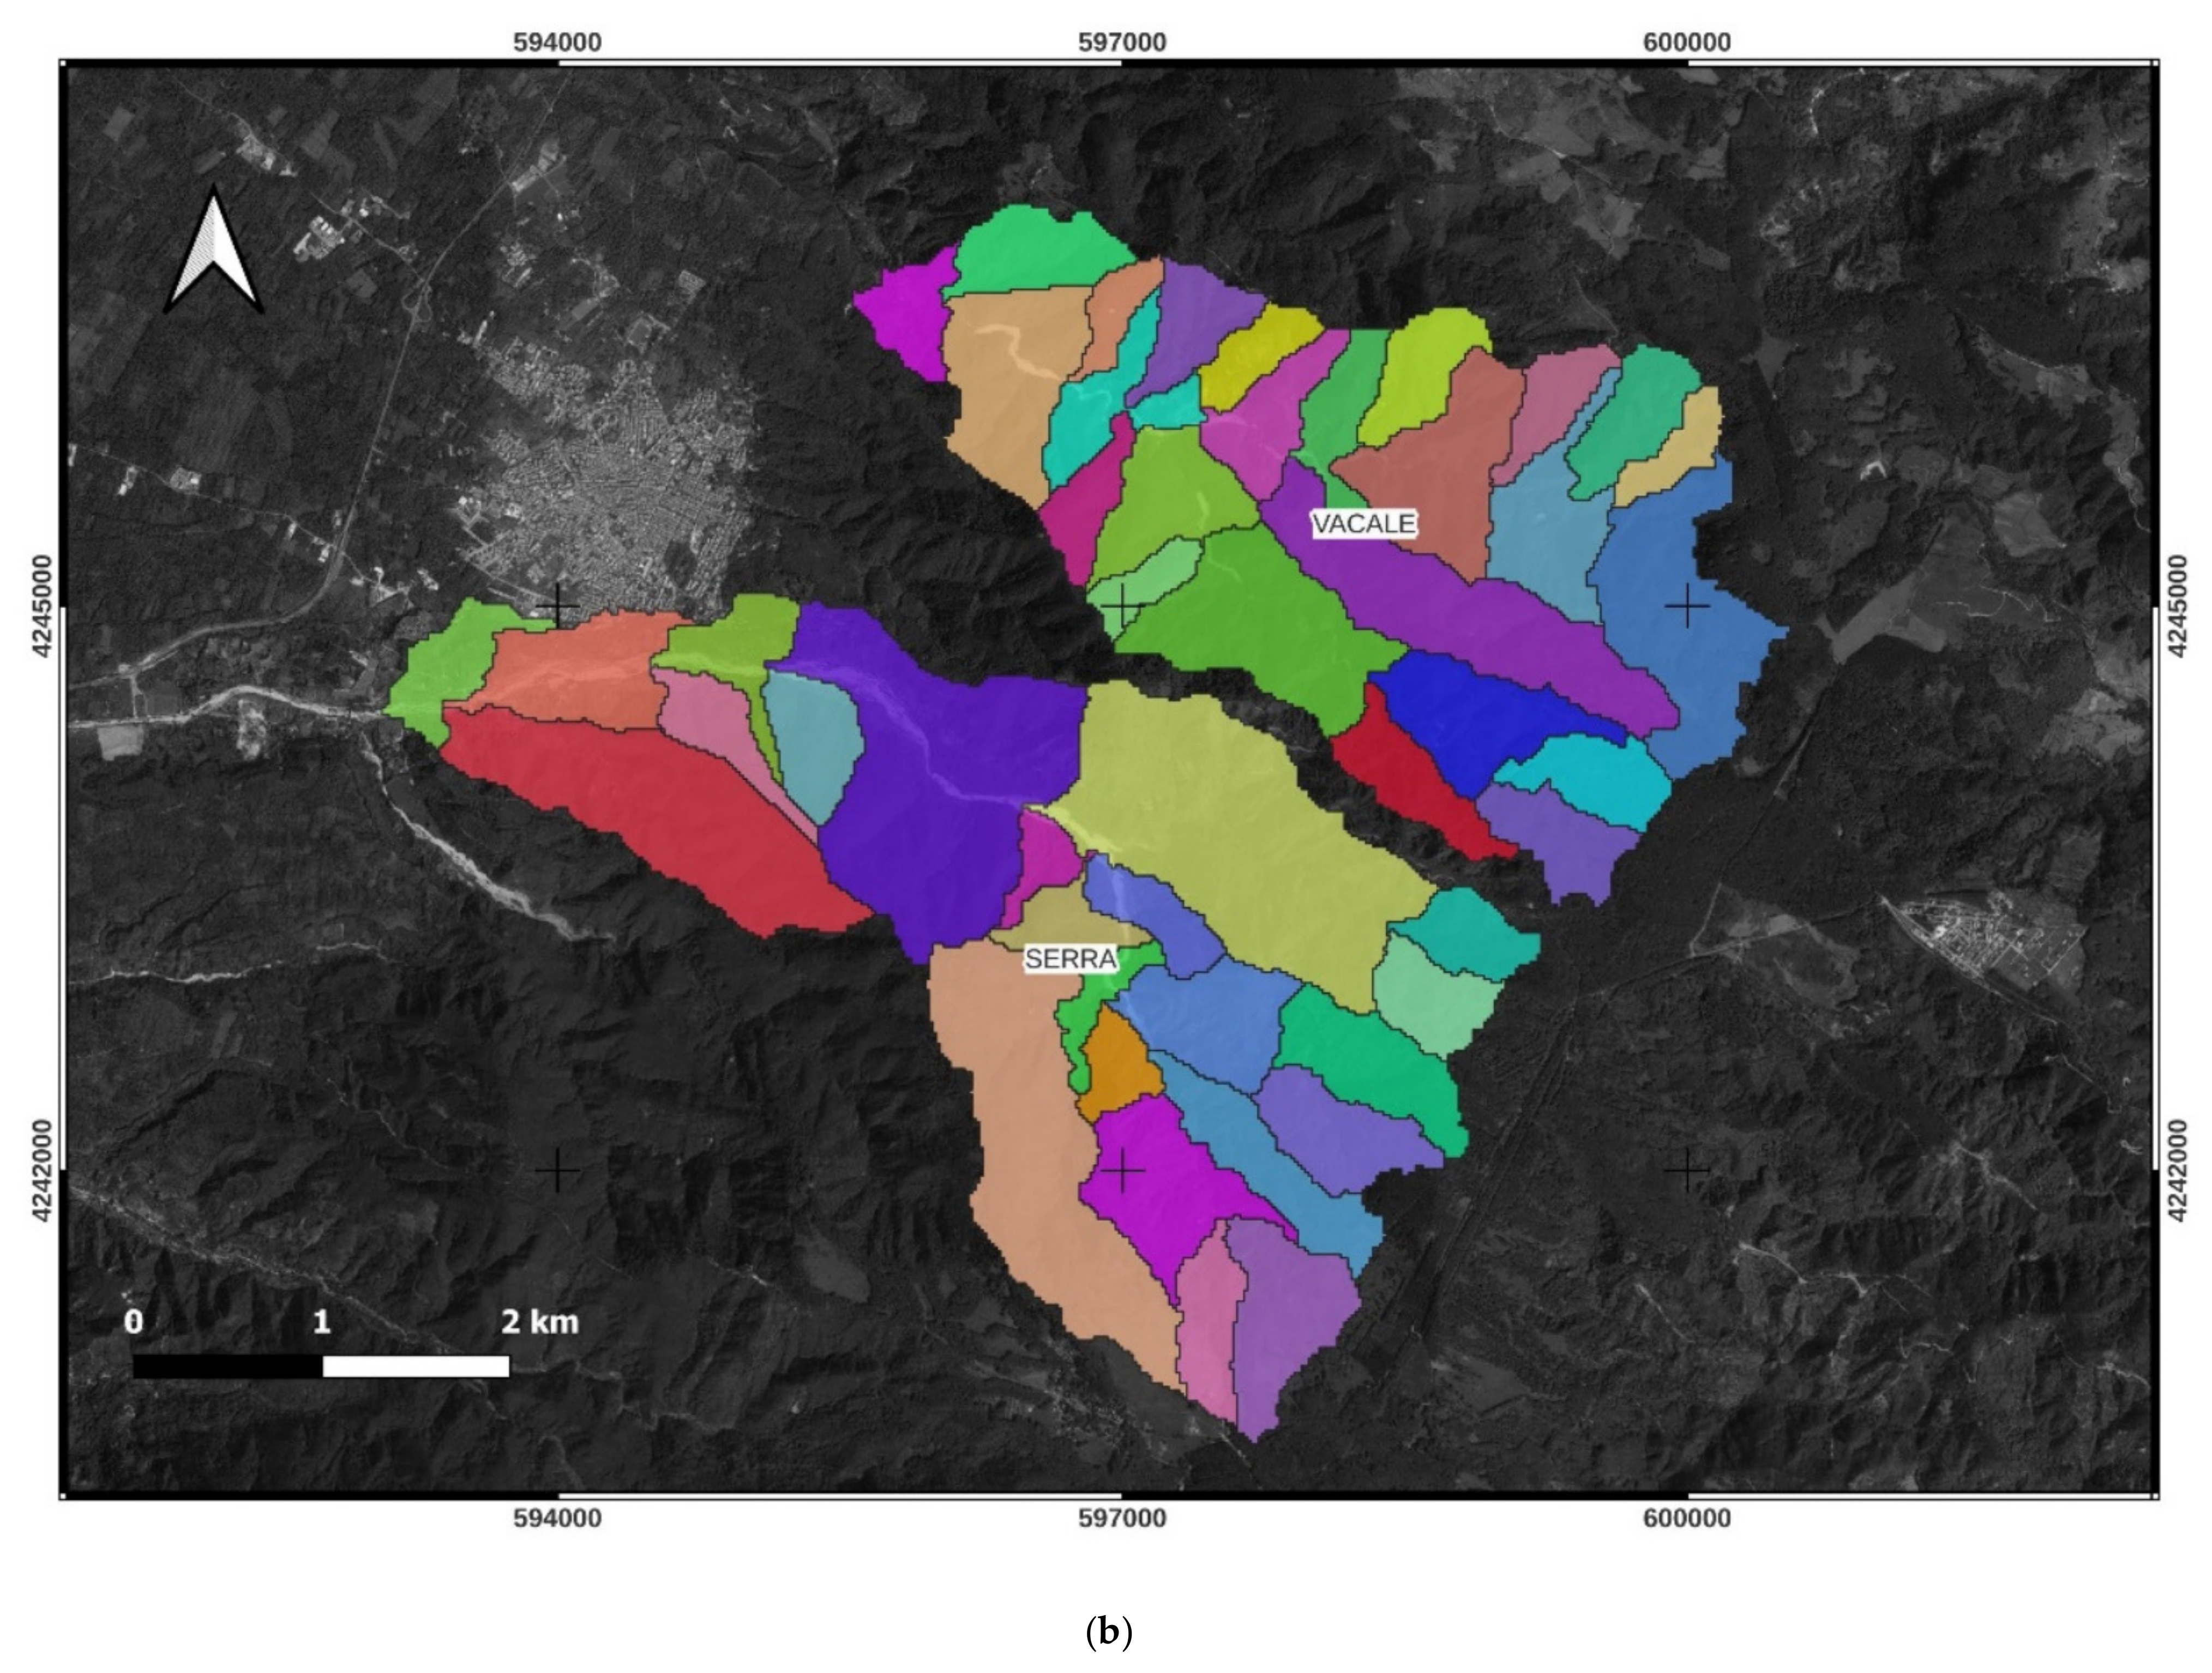
2.1. Study Area

The typical water courses of Calabria (Southern Italy, Figure 1) are ephemeral torrents with small drainage areas, steep channels and hillslopes, and short length. Channels are dry in summer, while in winter they are subject to flash floods and high sediment transport after heavy and frequent rainstorms.
The climate of Southern Italy is typically semiarid Mediterranean, and is classified as Csb climate (mild temperate, dry, and warm summer, in internal areas), according to Köppen–Geiger [47]. The mean maximum and minimum temperatures are 24.2 (August) and 8.3 °C (January), respectively, while the monthly precipitation is in the range of 34 (July)–155 mm (December), with an annual mean of 1484 mm. These values come from the weather records of Cittanova station (geographical coordinates—38°21′14.3″ N; 16°04′48.9″ E. Altitude 140 m above the medium sea level (a.s.l.)), with a reference period of 1924–2018. The data were supplied by the Regional Agency of Environmental Protection of Calabria Region (ARPACAL) (Figure 2).

2.2. Main Characteristics of the Studied Subcatchments

In the studied area, three headwaters were selected, of which two (Duverso, outlet coordinates 38°15′08.1″ N; 15°56′09.5″ E, and Serra, 38°20′35.2″ N; 16°03′47.3″ E) are contributors to the Petrace catchment, and the third headwater (Vacale, 38°28′23.1″ N; 16°01′51.5″ E) is a contributor to the Mesima catchment. The main catchments source from the Aspromonte Mountain Chain (Italian Apennine) and flow to the Tyrrhenian coast of Calabria.
The Duverso headwater was used for SWAT model calibration, while the Vacale (regulated with check dams) and Serra (not regulated) headwaters were used to predict water flow rates and sediment yields under climate and land-use change scenarios using the model.
The Duverso headwater covers an area of 12.5 km2 between 450 and 630 m above the mean sea level. The main channel is 5.2 km long and its channel slope is on average 7% (Table 1). Forests—beech (Fagus sylvatica L.), elm (Quercus ilex L.), and artificial woods of pine (Pinus nigra ssp. laricio Poir.)—cover 77% of the subcatchment area, while natural grasslands mixed with shrubland of brooms (8% of the subcatchment area) lie in middle and lower parts of the subcatchment. The land use of the residual 15% of the headwater is cropland (mainly olive groves and arable cropland for vegetable production) [48]. Soils are mainly Humic Lithic Dystrudept (39.6% of the total area), Humic Pachic Dystrudets (19.3% of the total area), and Typic Eutrudepts (15.9% of the total area) [49]. The texture is loamy sandy in more than 80% of the area, while other soils have sandy (15%), and silty loamy (5%)-textured soils (Table 1 and Figure 3). Granites and granodiorites are the main lithological formations.

2.3. Brief Description of the SWAT Model

The perimeters of the Vacale and Serra headwaters are neighbouring, and their main streams flow very close each other. Both headwaters are about 18 km far from the Duverso subcatchment. The Vacale headwater covers an area of 11.3 km2 between 400 and 960 m a.s.l., and its main channel is 4.7 km long with a slope of 7%. The Serra headwater covers an area of 14.6 km2 between 360 and 620 m a.s.l., and its main channel is 6.6 km long with a slope of 6% (Table 1 and Figure 3). Both headwaters are mainly covered by woodlands in the upper area (78% and 85% of the total subcatchment for Serra and Vacale, respectively). According to the Corine land cover of 2004 [50], natural forests of beech (Fagus sylvatica L.) and elm (Quercus ilex L.) lie over 1000 m, while artificial woods (about 30%), consisting of pine (Pinus nigra ssp. laricio Poir.), were planted in 1960s on degraded or deforested lands. About 20% (Vacale) and 4% (Serra) in the middle and lower parts of the headwaters are covered by shrubs (Cytisus scoparius L., Cytisus villosus Pourret, and Spartium junceum L.), while croplands are only in the latter headwater (12% of the total area—olive and citrus orchards as well as vegetables). Abandoned areas at the highest altitudes are covered by natural grasslands (Festuca, Lolium, Hypochaeris, Trifolium, and Vicia). The main soil texture and type are very similar to the Duverso headwater. In more detail, in the Serra headwaters, soils are mainly Humic Lithic Dystroxerepts (38.4% of the total area), Humic Dystrudepts (21% of the total area), Humic Pachic Dystrudepts (20.7% of the total area), and Humic Dystroxerepts (12.4% of the total area); meanwhile, in the Vacale headwater, soils are mainly Humic Lithic Dystroxerepts (64.4% of the total area) and Humic Dystrudepts (25.9% of the total area). The texture is almost totally loamy sandy in the Vacale headwater. The same texture is found for the Serra headwater (88% of the total area), together with a small area with silty loamy soils (12% of the total area) (Table 1 and Figure 3).
Two reaches were selected in the Vacale and Serra headwaters. In the first headwater, the reach is the main channel; meanwhile, in the Serra headwater, one subreach is in the main channel, and the second and third subreaches are two tributaries immediately upstream (Figure 1). The thalweg is single in each reach, while the water course is branched immediately upstream of the check dams.
In the main channel of the Vacale headwater, public authorities built 15 check dams between 1950 and 1960 with a purpose of soil conservation in mountainous areas and defence against disruptive floods in valley areas. These check dams are 11–55 m wide and 0.5–3 m high (Table 2). After construction, the profile in the channels regulated with the check dams was not stable for several years. The sediment wedge aggradated during normal events and was eroded during extreme floods, while the channel bed was progressively scoured downstream of the structures. Several check dams out of the studied reaches were instead destroyed by extreme floods (in 1971, 1996, and 2003) [28]. In both headwaters, no noticeable changes were detected in land use, except some wildfires in small areas (that were soon reforested), and conversion of cultivated areas to pastures in other limited areas. Moreover, no further check dams have been built since the 1960s.
The large similarity of the morphological, soil, and land-use characteristics make the verification of the hydrological prediction capacity of the SWAT model realistic in the first headwater (Duverso), in addition to the comparison of the hydrological response in the regulated (Vacale) and unregulated (Serra) headwaters to the same precipitation.
The Soil and Water Assessment Tool (SWAT [51]) is a continuous, distributed-parameter, process-based model that was developed by the United States Department of Agriculture—Agricultural Research Service—at the end of the 20th century. The model predicts catchment-scale surface and subsurface flow, soil erosion, and sediment and nutrient transport. SWAT has been mainly used to simulate the hydrological processes in medium–large catchments [52], but the model has also been applied in small catchments (e.g., [53,54]).
SWAT delineates a catchment into multiple subcatchments that are further divided into lumped hydrologic response units (HRUs), and topologically connected by the hydrological network [55]. Each HRU results from a unique combination of land use, soil type, and topography that are derived by overlaying the relevant maps [56,57].
To simulate the hydrological processes in catchments, the model separates the “land phase” and the “channel” processes [58]. The land phase is simulated in each HRU, and consists of water flow, nutrient transport, and vegetation growth simulation [55]. Water, sediment, and nutrient flows are cumulated for all HRUs in a subcatchment, and then routed in the channel phase through channels, ponds, and reservoirs to the catchment outlet [59]. In each HRU, SWAT estimates the hydrological variables (surface runoff, baseflow, evapotranspiration, infiltration, and soil water content) [60], using the following water-balance equation [61]:
SWt = SW0 + STt=1(R − Sn − ET − Wa − Rf)
where SWt—final soil water content on day t (mm); SW0—initial soil water content on day i (mm); T—time (d); R—precipitation depth on day i (mm); Sn—surface runoff volume on day i (mm); ET—evapotranspiration depth on day i (mm); Wa—water flow entering the vadose zone from the soil profile on day i; Rf—return flow on day i.
The input parameters of SWAT are the daily precipitation, maximum and minimum temperatures, solar radiation, relative humidity, and wind speed [61]. Each hydrological variable is estimated by the different subcomponents of SWAT (climate, hydrology, erosion, land cover, plant growth, nutrients, pesticides, and land management) [57]. Surface runoff and infiltration are predicted at the daily scale from the input precipitation using the soil conservation service (SCS)–curve number (CN) method [62].

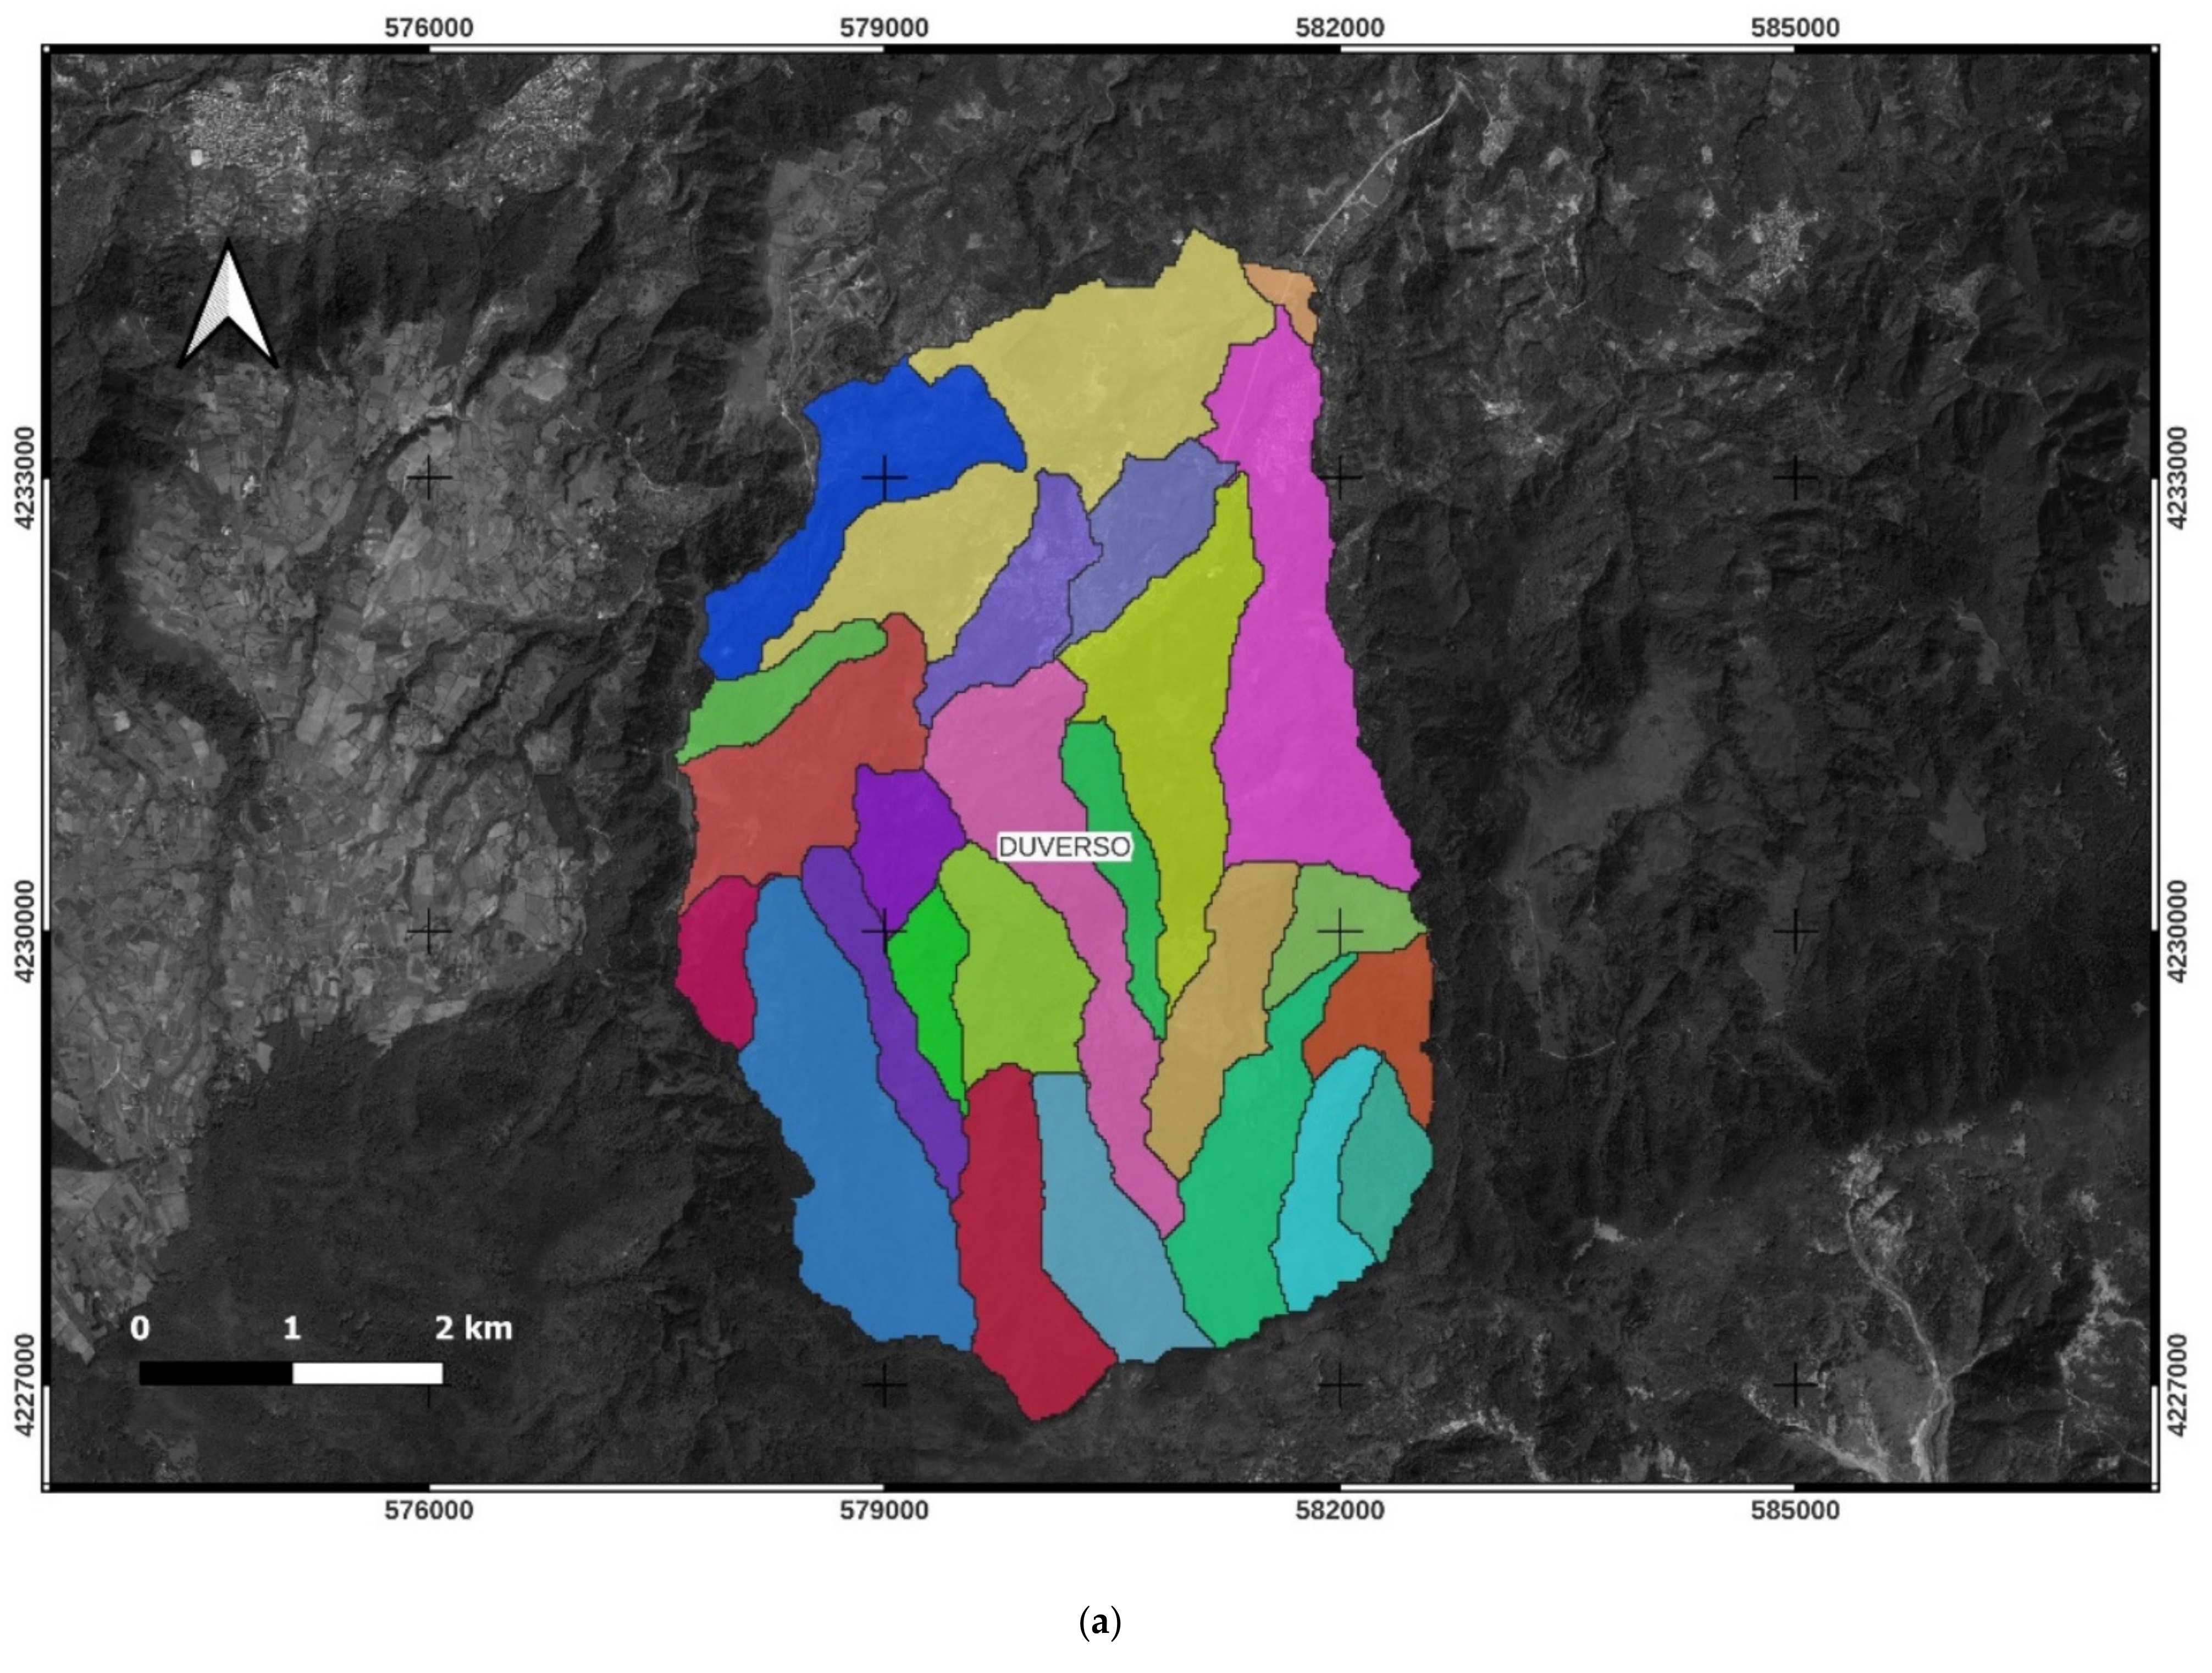
2.4. Model Implementation

To implement the SWAT model in the three headwaters, a 10 m-resolution digital terrain model (DTM) was used to reproduce the catchment altimetry and delineate the stream network. The soil texture/type and land-use characteristics needed by SWAT were derived from the soil map of the Calabria Region (CASMEZ (Cassa del Mezzogiorno); Technical Map of Calabria; Rome, Italy, 1954) and the most recent orthophotographs, respectively (Figure 4). Thanks to these data, each headwater was discretised into HRUs by SWAT. The hydrological network was divided into channels. Therefore, each HRU was characterised by a specific land use and soil type on which its hydrological response depends.
The climatic data were collected from the database of the Regional Agency of Environmental Protection of the Calabria Region (ARPACAL) for the period of 1959–1960 for the Duverso torrent. Hourly rainfall depths and daily temperatures were recorded at the gauging station of Cittanova, close to the studied headwater (Figure 1), and input into the climate subroutines of SWAT.
For model calibration at the Duverso torrent, the mean daily flow rates (m3/s), available for two years (1959–1960), were used. This short period was due to the lack of other data of water flow rate matching the available precipitations. These flow rates were measured by an ultrasonic flow meter at the subcatchment outlet, close to the municipality of Cittanova. Following [63], the surface runoff was separated from baseflow by the linear method applied to the observed streamflow records. Unfortunately, no observations of sediment yields are available in the three catchments, since all catchments of Calabria are not instrumented for this purpose.

2.5. Model Calibration

The hydrological SWAT submodel was run, and its hydrological predictions were evaluated at the daily scale. The modelled variables were the mean daily values of water flow rate (in m3/s) and sediment yield (in tons). To consider the different area of the modelled headwaters, these variables were expressed as unit flow rate (in m3/s km2) and sediment yield (in kg/ha). The default soil parameters were derived from the SWAT manual and initially input to the model (Table 3). A default CN for the forest was first derived from the standard procedure set by USDA (1972). The precipitation of the same years (1959 and 1960) was appended before the simulation dates, to set up the soil water content and thus to warm up the model [64,65,66].
Before the calibration process, a sensitivity analysis was carried out, using SWAT-CUP (Calibration and Uncertainty Programs [67]). This analysis helped the selection of the most sensitive parameters according to the p-value of a Student’s t distribution. The null hypothesis that each of the input parameters does not affect the model output was tested. This null hypothesis is rejected with a low p-value (p = 0.05). In other words, when p < 0.05, the change in a parameter significantly varies the flow rate; therefore, SWAT is very sensitive to that parameter.
The SWAT-CUP subroutine was also applied to automatically setup the most sensitive input parameters for predicting the flow rate. In more detail, this automatic calibration was carried out [67,68] as follows: (1) a value of the objective function (the Nash–Sutcliffe coefficient, NSE, see below) equal to 0.4 was adopted; (2) a physically realistic range of the absolute minimum and maximum parameters being optimised were hypothesised, according to the values suggested in SWAT and SWAT-CUP guidelines; (3) each parameter was individually setup in this range until the highest value of the objective function was achieved.

2.6. Model Evaluation

The water flow rate prediction capacity of SWAT model was evaluated by adopting a set of quantitative criteria, commonly used in hydrological modelling: (i) the mean of the observed and simulated values); (ii) the coefficient of determination (r2); (iii) the coefficient of efficiency of [69] (NSE); and (iv) the coefficient of residual mass (PBIAS). The acceptable values of these criteria are: (i) a difference in the observed and predicted mean values below 20%; (ii) 0.5 for r2 [70,71]; (iii) 0.36 for NSE [72]; and (iv) 25% for PBIAS [73]. The latter index indicates model underestimation, if positive, or overestimation, if negative [74].
The calibrated input parameters provided by the SWAT-CUP subroutine in the Duverso headwater were used for SWAT applications in the Vacale and Serra subcatchments.

2.7. Analysis of the Headwater Hydrological Response to Land-Use and Climate Changes

Combinations of three scenarios of land use and six scenarios of climate change were evaluated to assess their effects on the hydrological response of the headwaters. The three land-use scenarios were (a) forestland (under the current species), (b) pasture (alfalfa herb), and (c) cropland (wheat). The latter two scenarios were adopted alternatively, converting the forest to pasture or cropland. These scenarios are able to simulate deforestation and subsequent natural pasture cover or conversion to seeded crops. The hydrological effects of these land-use changes were input to SWAT by modifying the initial CNs. The values related to the land uses alternative to forest were derived from the USDA-SCS guidelines for the soil hydrological group in the headwaters.
The climate changes forecasted for the next 80 years (2020–2099) were simulated using three Global Circulation Models (GCMs), which mathematically represent the general circulation of a planetary atmosphere or ocean [75]: (a) MIROC5 (Atmosphere and Ocean Research Institute, University of Tokyo, National Institute for Environmental Studies and Japan Agency for Marine–Earth Science and Technology, Japan); (b) GISS-E2-H (NASA Goddard Institute for Space Sciences, New York, NY, USA); and (c) MRI-CGCM3 (Meteorological Research Institute, Tsukuba, Japan).
GCMs usually estimate weather data at a coarse resolution (grid size between 100 and 200 km). Therefore, the resolution of the GCM simulations was downscaled to achieve suitable values for local hydrological modelling (25–50 km). According to [76], the statistical downscaling method (SDSM), developed by [77], was applied to achieve a finer resolution of the weather forecasts for each GCM, and preparing the data for SWAT input over the headwaters. The SDSM was applied as follows. First, predictant (observed data) and predictor (large-scale atmospheric variable) were selected, then the model was calibrated and the weather was generated, and finally, after model validation, the future climate data were estimated [37]. The future monthly values were simulated by SWAT subroutine and then split into daily values using the internal weather generator of the model.
GCMs are driven by greenhouse gas (GHG) concentrations in the atmosphere. As GHG emissions scenarios, two (RCP2.6 and RCP8.5) of the four so-called representative concentration pathways (RCP2.6, RCP4.5, RCP6.0, and RCP8.5) were adopted [36,78]. The radiative forcing levels in 2100 of RCP2.6 and RCP8.5 are the lowest and the highest, respectively.
From each GCM and RCP, the monthly precipitation, and maximum and minimum temperatures for four 20-year periods (2020–2039, 2040–2059, 2060–2079, and 2080–2099) were simulated by SWAT. The model also predicted the water flow rates and sediment yields at the outlet of each headwater under each combination of land-use and climate change scenarios.

2.8. Statistical Analysis

The statistical significance of differences in water flow rates and sediment yields between the Vacale and Serra headwaters was evaluated using a three-way analysis of variance (ANOVA) along with a Tukey test (designed for the pairwise comparisons). The three independent ANOVA factors were the land-use scenarios (forest, pasture, and cropland), the RCPs (RCP2.6 and RCP8.5, under the three GCMs—MIROC5, GISS-E2-H, and MRI-CGCM3), and the presence or absence of check dams (regulated and unregulated headwater). The response variables of the ANOVA were the water flow rate and the sediment yield, separately. The significance level was set at p < 0.05. The ANOVA analysis of variance assumes that the residuals are normally distributed. Thus, data were tested for the assumption of normality by using the Anderson–Darling methodology, which is based on the function of empirical distribution. The statistical analysis was performed using XLSTAT release 2019.1 (Addinsoft, Paris, France).

3. Results and Discussion

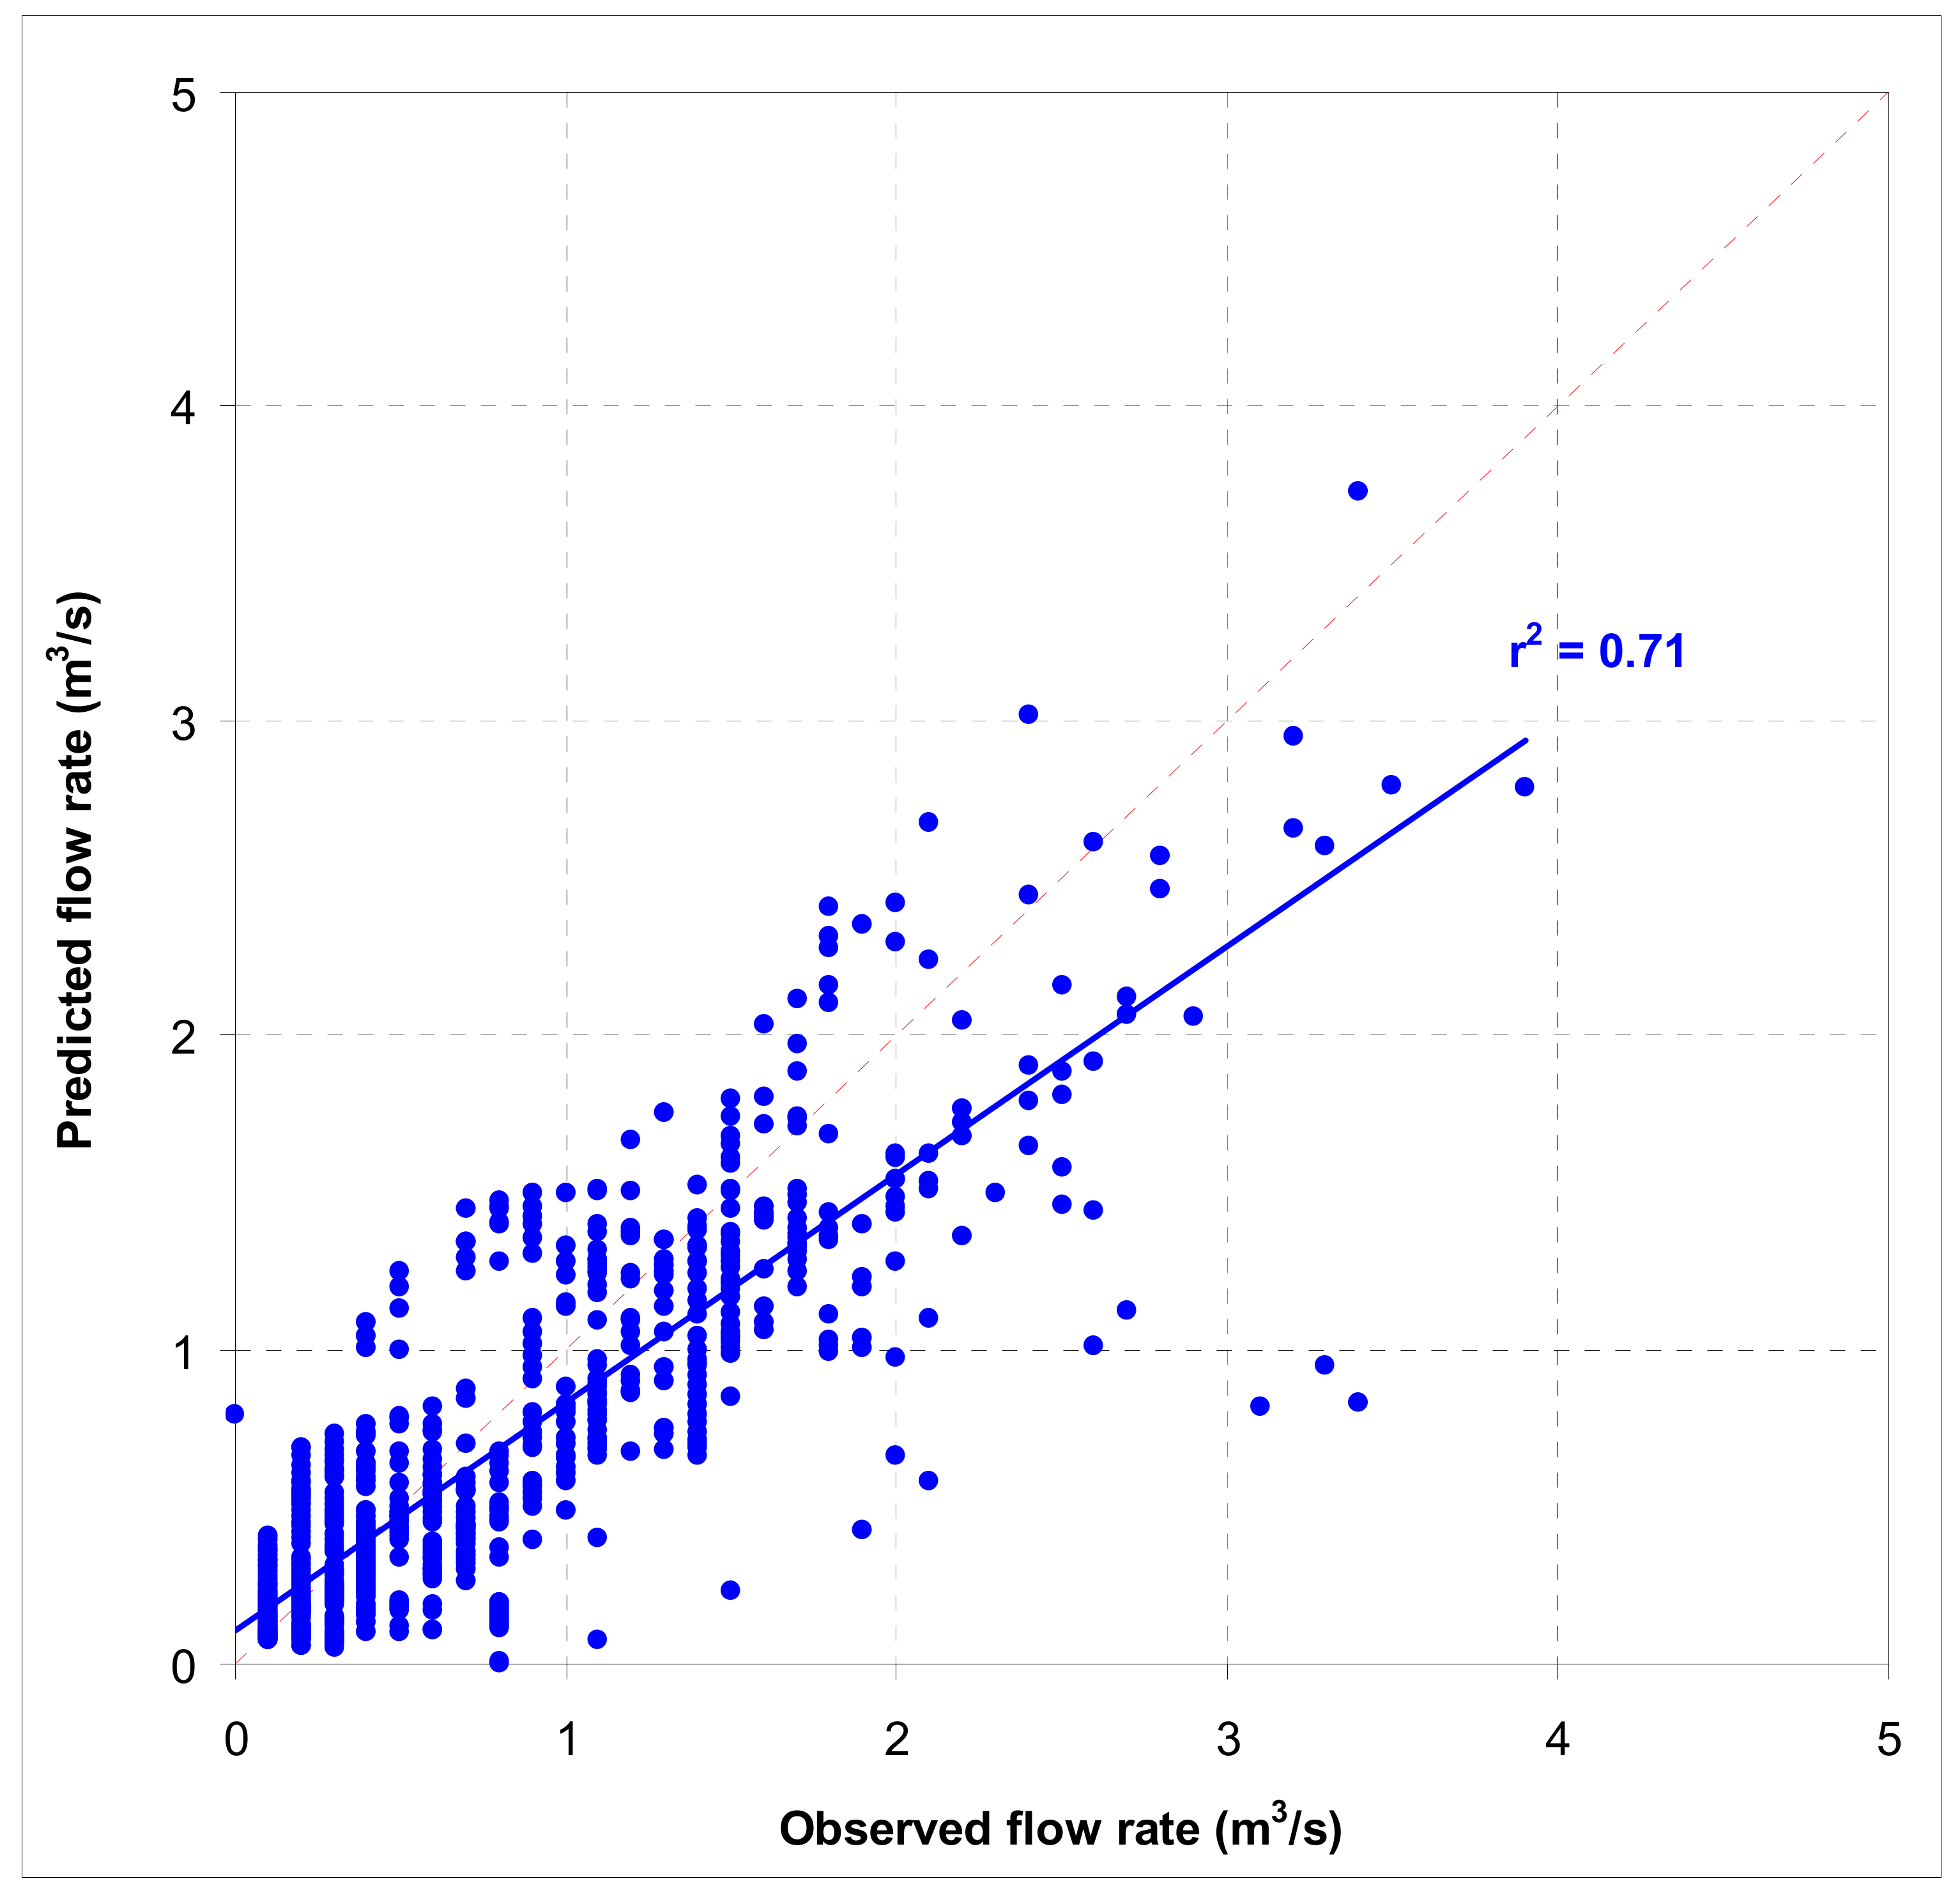
3.1. SWAT Calibration (Duverso Torrent)

To obtain the most accurate predictions of water flow rates in the Duverso headwater, several input parameters must be tuned from the default values in the SWAT model. The application of the SWAT-CUP subroutine showed that five input variables—GW_REVAP.gw, CANMX.hru, CH_N2.rte, GWQMN.gw, and FFCB.bsn (Table 3)—significantly influenced the predictions of water flow rate. Among these sensitive parameters, GW_REVAP.gw and CH_N2.rte were decreased by 622% and 1413%, respectively, and GWQMN.gw was increased by 23.8%, while CANMX.hru and FFCB.bsn were increased from 0 mm to 13.44 mm and 1 mm, respectively (Table 3).
After calibration, the water flow rates predicted by SWAT were closer to the corresponding observations at the subcatchment outlet compared with those provided by the model running with default parameters (Figure 5). In more detail, the difference between the mean value of the predicted and observed flow rate was 16.9%. The values of r2 and NSE were 0.71 and 0.67, respectively, while the PBIAS was 14.9%. These coefficients indicate for SWAT an acceptable (although not optimal) prediction capacity of the water flow rates at the subcatchment outlet together a slight model tendency to underestimate this variable (see the positive value of PBIAS) (Figure 5). Other modelling studies that used SWAT to predict water flow under Mediterranean conditions and climate/land-use change scenarios showed a variable prediction accuracy. For instance, [40], in a catchment of Southern Australia dominated by pasture and under Mediterranean climatic conditions, found r2 of 0.88–0.89 (for calibration and validation, respectively), NSE of 0.82, and PBIAS between −17.5% and −24.6%. NSE and PBIAS in two agroforest catchments of Portugal were in the range of 0.31–0.56, and from −3.34% to 6.96%, respectively [43], while [39] reported an NSE between 0.50 and 0.76, and an r2 of 0.81–0.82 in two catchments of Southern France and Northeastern Tunisia. In Central and Southern Portugal (in a catchment covered by shrublands and under semiarid conditions, and another catchment dominated by croplands and under humid conditions), [44] showed model performance with an r2 in the range 0.83–0.91, an NSE between 0.82 and 0.85, and a PBIAS from −17% to 15%, while [79] achieved an r2 of 0.85 and an NSE of 0.79 in a mountainous and forest catchment in the Cyclades Islands (Greece). More recently, [35] obtained an r2 between 0.68 and 0.73, an NSE in the range 0.55–0.68, and a PBIAS from 12% to 22% in an agricultural catchment of Northwestern Morocco mainly covered by wither wheat and sunflower; meanwhile, [80] reported an r2 in the range 0.70–0.85, an NSE between 0.62 and 0.89, and a PBIAS from −13.6% to 20.6% in a catchment of Southern Spain, mainly forested. Finally, in an agricultural catchment of Apulia (Southern Italy), [81] pointed out an r2 between 0.65 and 0.76, an NSE of 0.65, and a PBIAS from −1.8% to 6.1%.

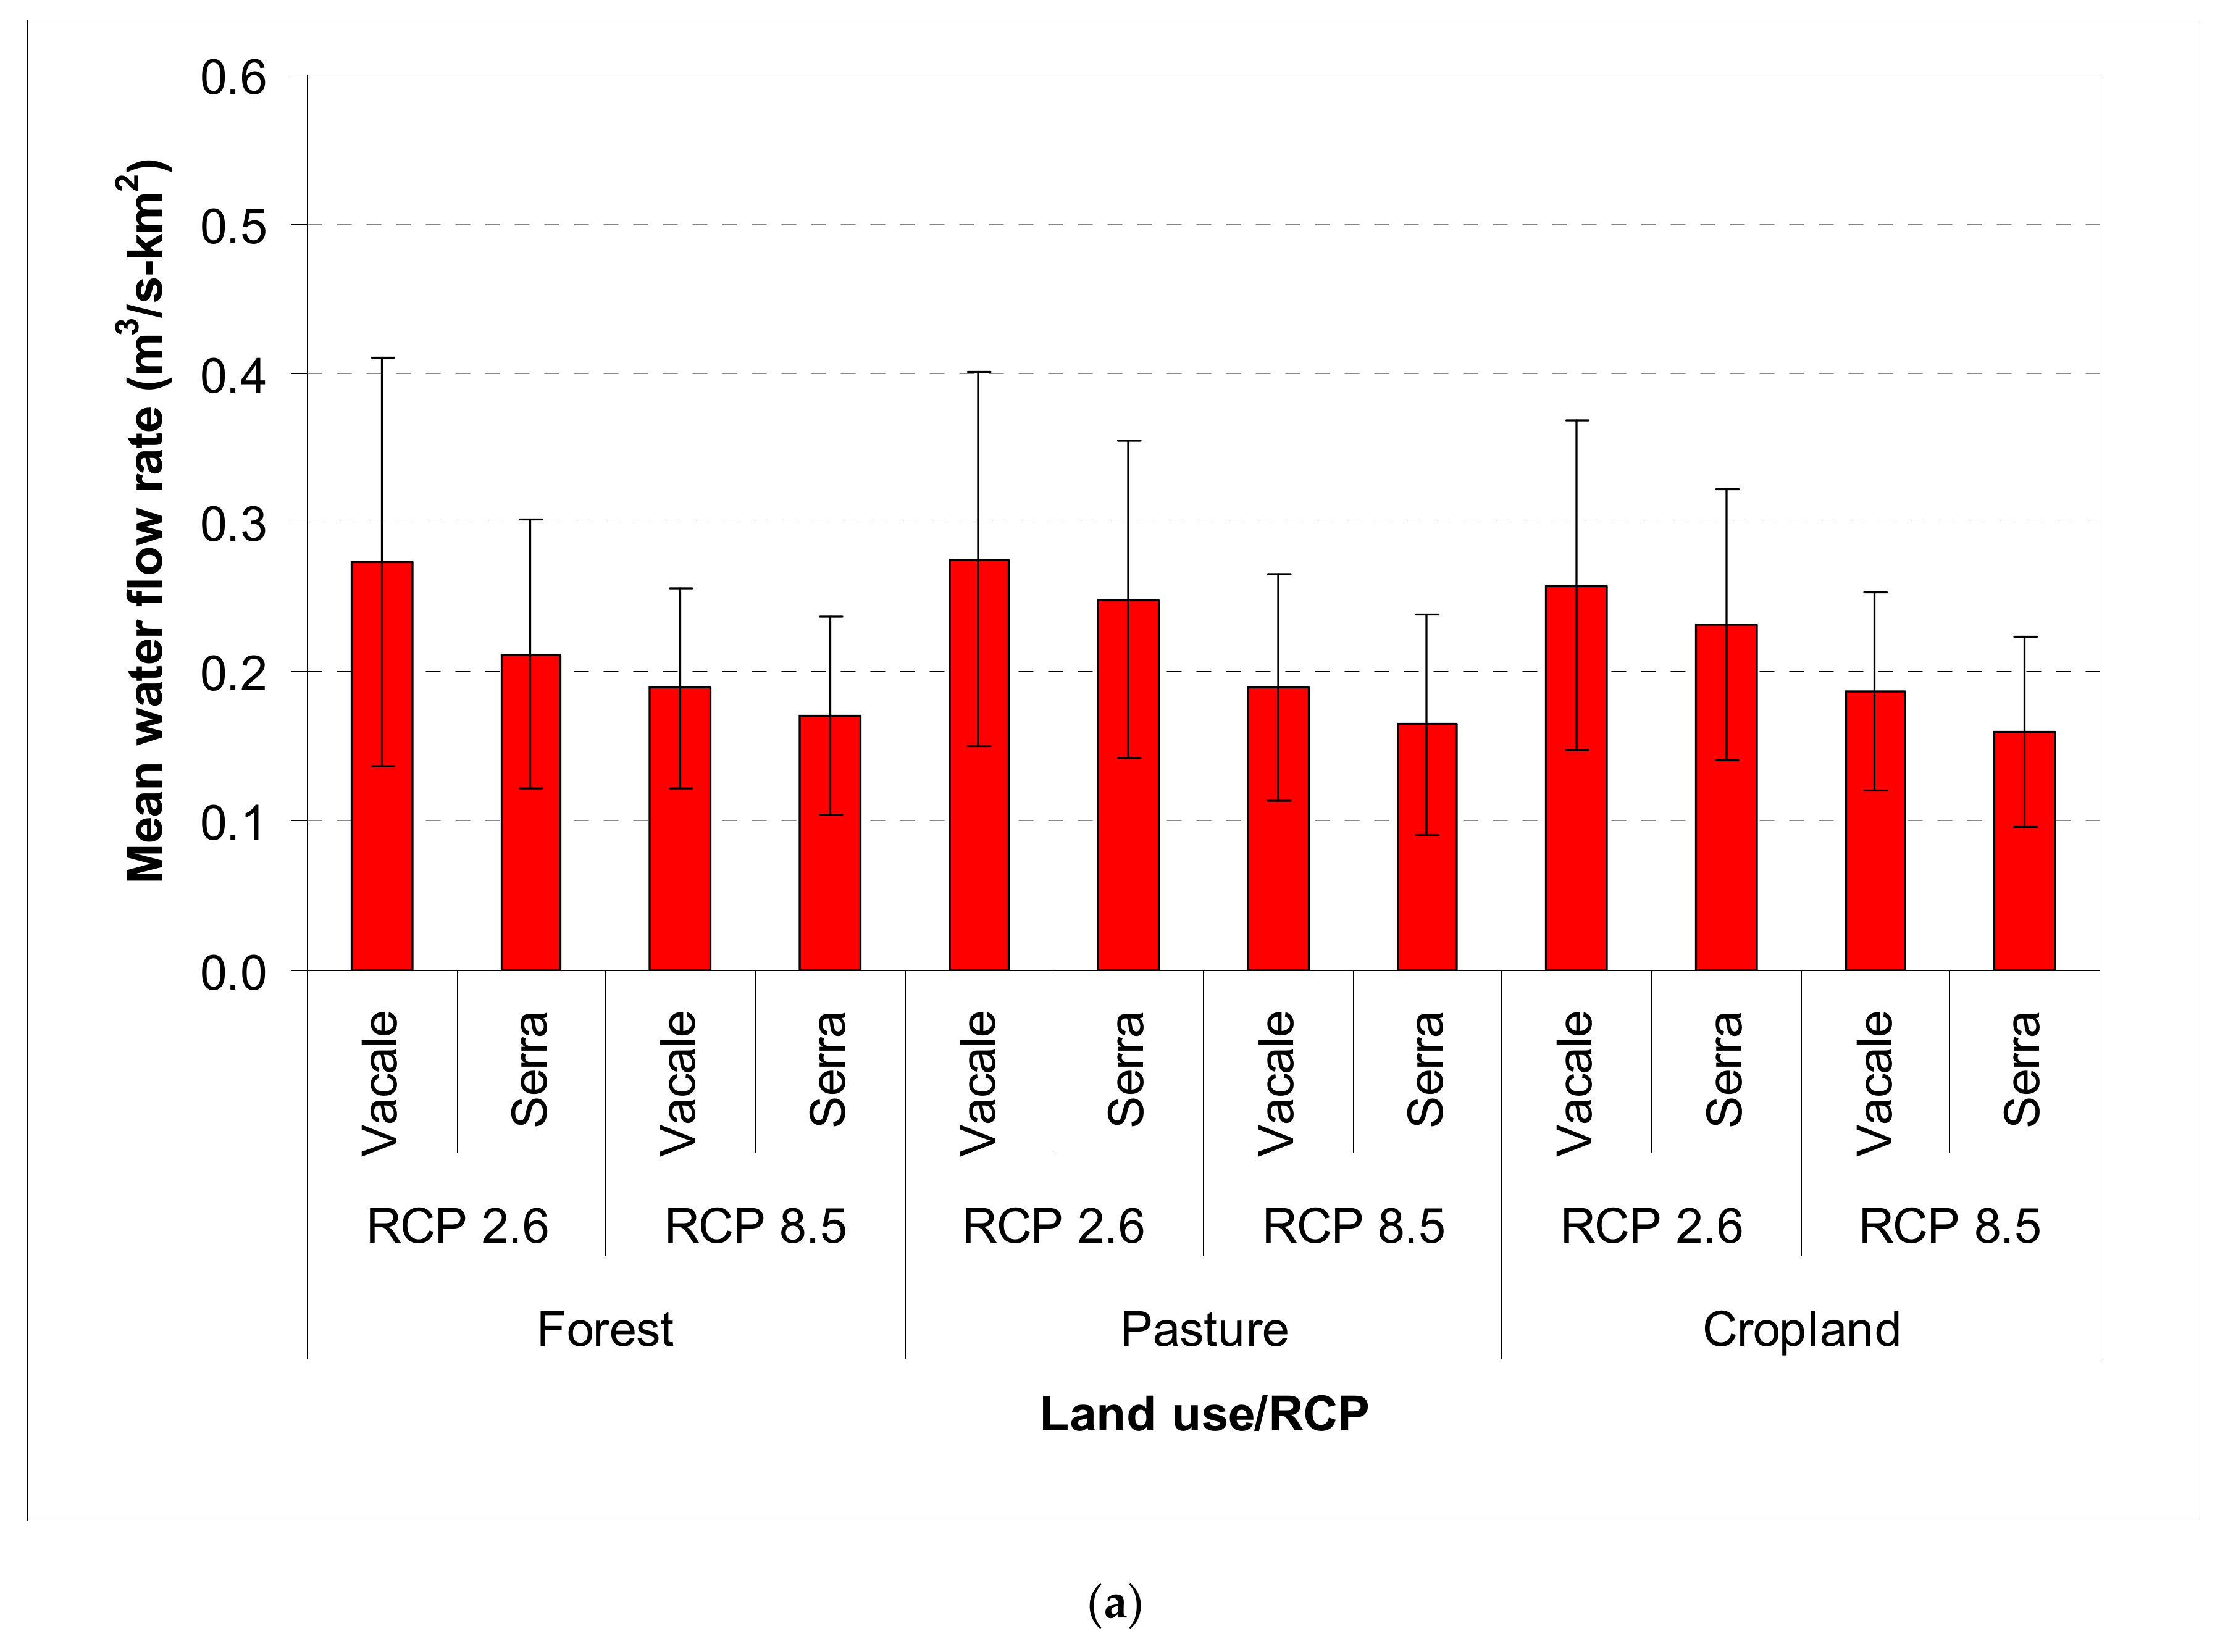
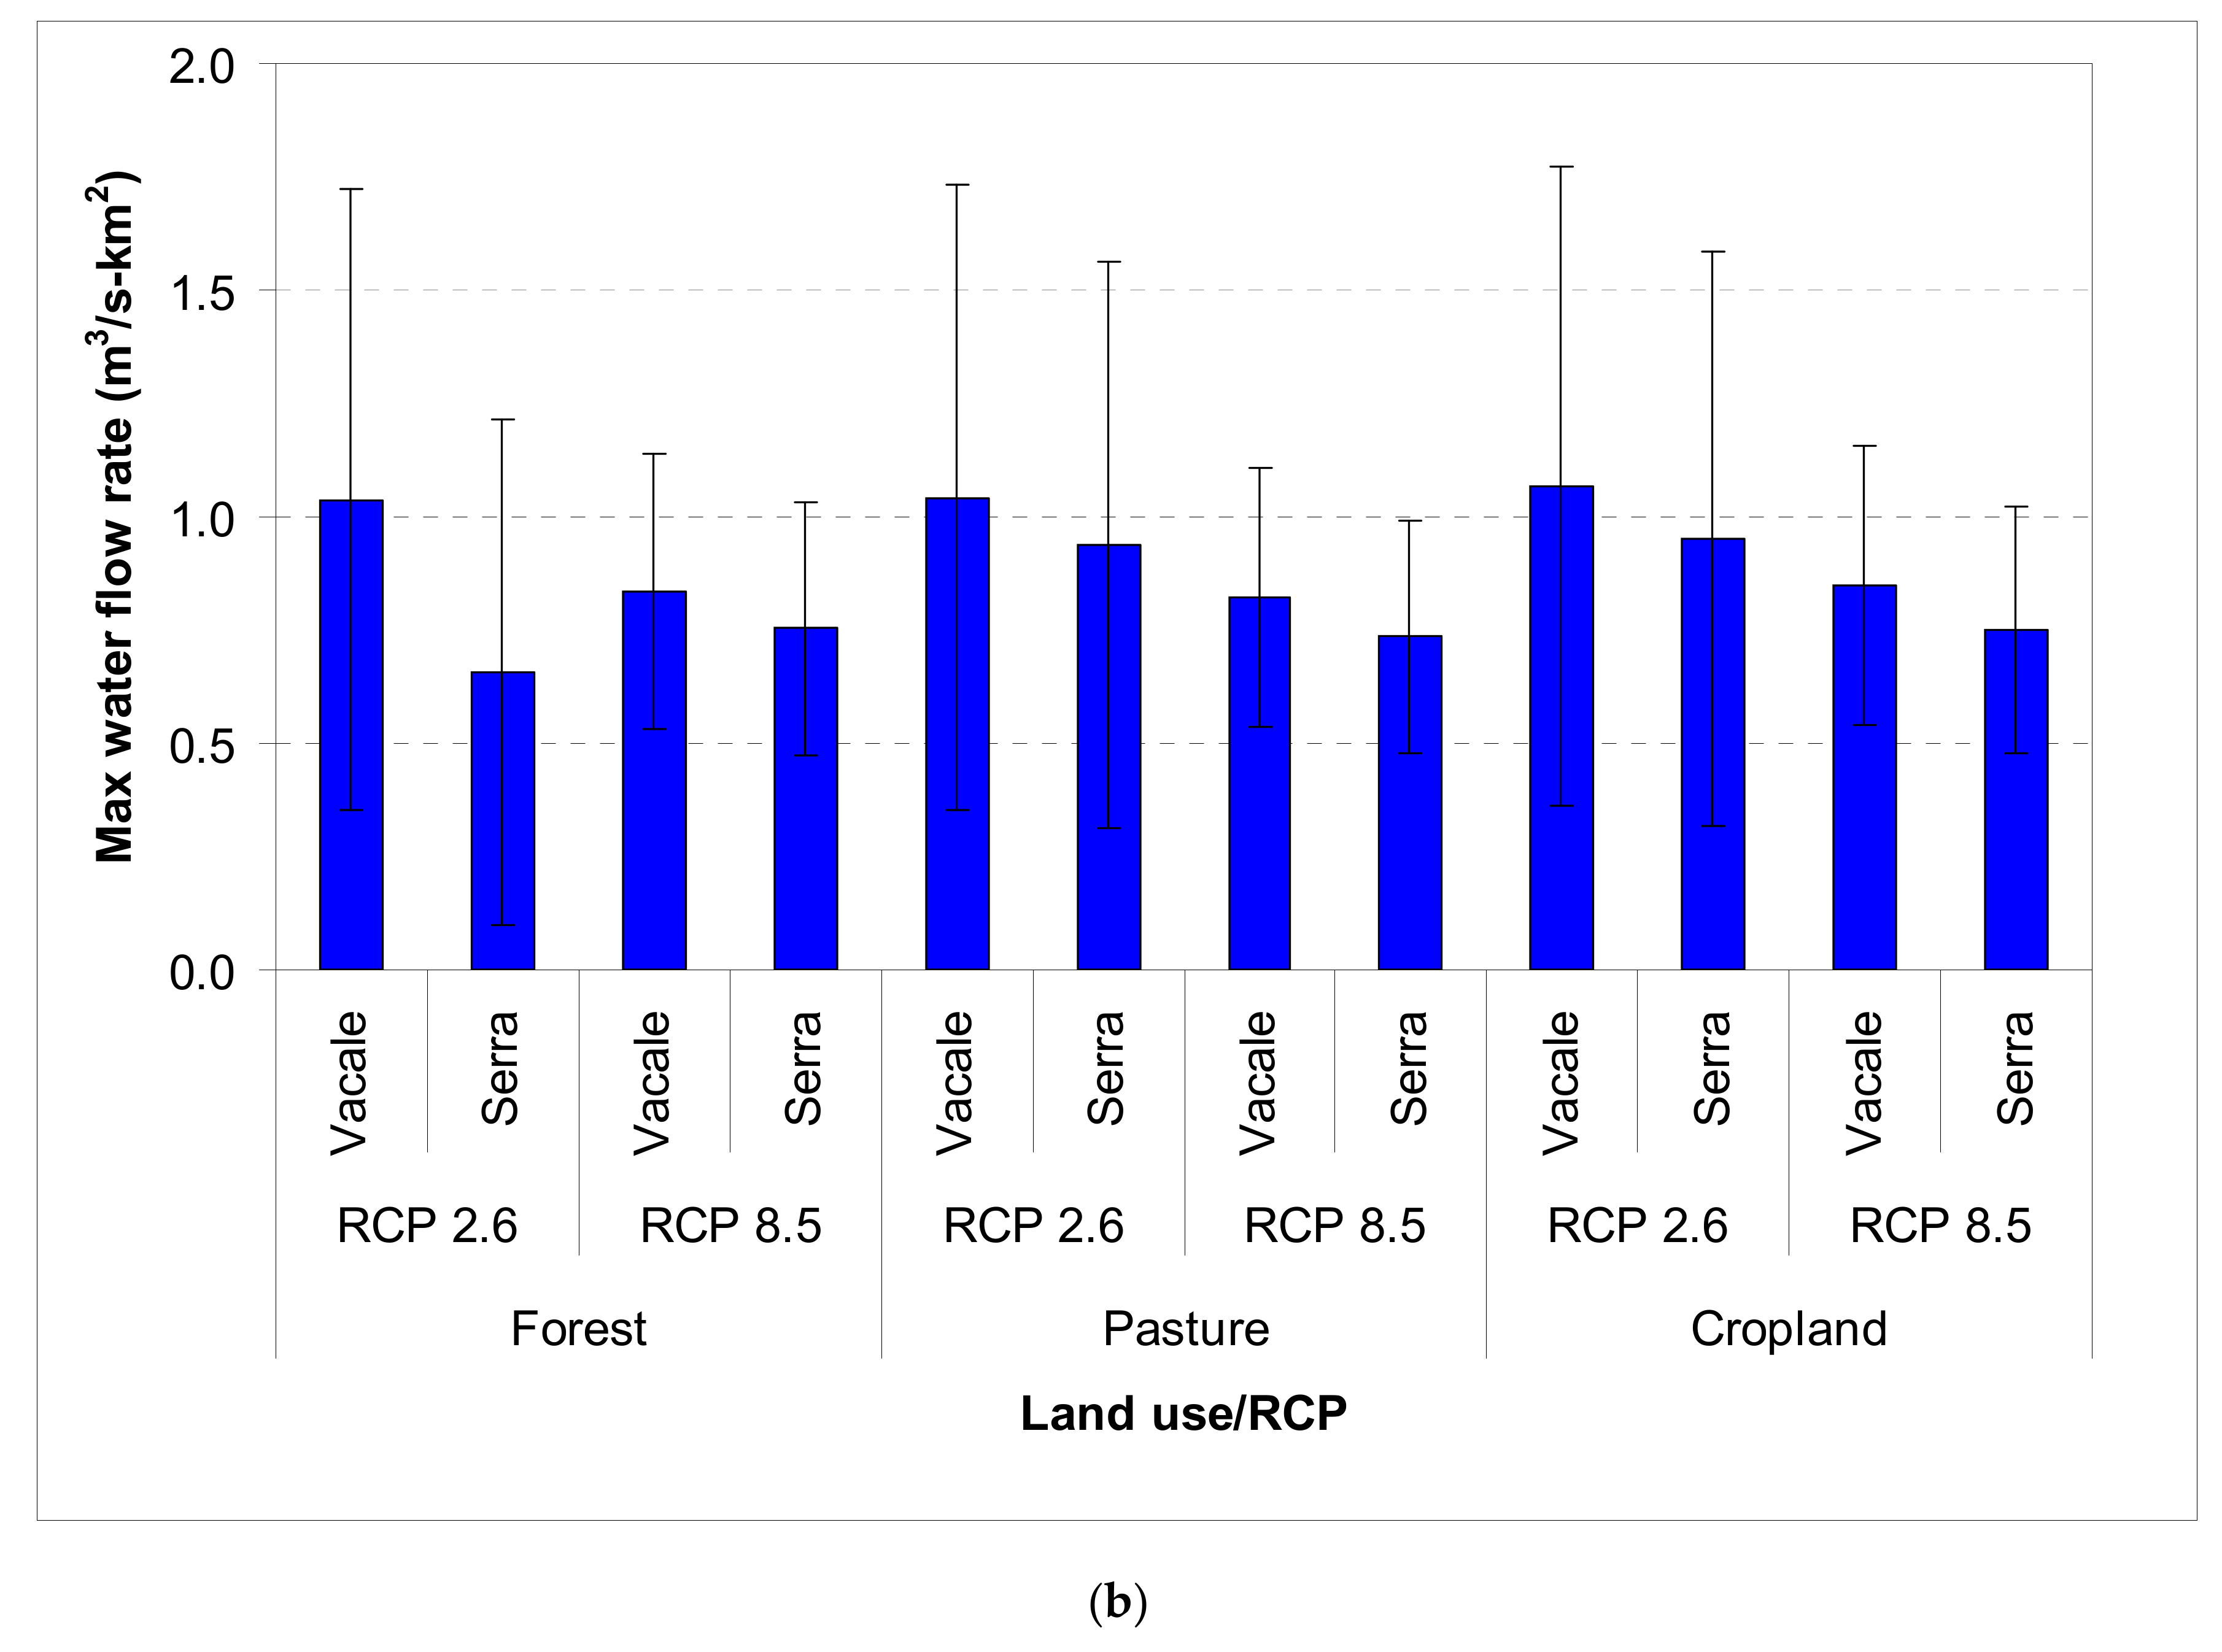
3.2. Analysis of Water Flow Rates in the Two Headwaters

No significant differences were detected for the mean values of water flow rates among the different land uses (0.21–0.22 m3/s km2); these differences were more noticeable, but not significant (from 0.82 m3/s km2, for forest, to 0.90 m3/s km2, for cropland) (Figure 6). These values are very low compared with those reported in previous studies (e.g., [82]). The latter authors, who have compiled a dataset on European flash floods, report unit peak discharges between 0.5 and 80 m3/s km2. These very low flow rates explain the low sediment yield detected in the two studied headwaters (see Section 3.3). Values of flood discharge between 9 and 11 m3/s km2 are effective at generating high sedimentation after soil detachment. The estimation of the runoff coefficients shows mean values of 0.18 ± 0.10 for the headwater without check dams and 0.20 ± 0.10 for the regulated headwater, and these values are equal for all the modelled land uses. These runoff coefficients are low, and this highlights a limited runoff-generation capacity of the studied subcatchments under the same climate and land-use characteristics. Additionally, [26] found very low values in the same headwaters under historical records of precipitation (1956–1971). The authors ascribed this low hydrological response to the large forest cover that was evidently effective in limiting the runoff-generation capacity [83,84,85,86]. The forests have a finite capability in decreasing the maximum discharges, especially during extreme rainfall events [2,87], which trigger the transport of runoff and sediment. The current study has instead demonstrated how this runoff-generation capacity may not be affected by the changes in land use (from forest to pasture or cropland), and this shows that it may be due to the intrinsic hydrological properties of the studied soil rather than being due to the land use. Overall, the impacts of land-use changes on the runoff-generation capacity will be minimal, since a conversion of forest to pasture or cropland will increase the mean or maximum flow rate by less than 8 and 10%, respectively (Figure 6). Regarding the effects of climate change on water flow rates given a certain land use in the headwaters, RCP2.6 always gave higher values of both mean and maximum flow rates compared with RCP8.5, except for Serra headwater with forest land cover. The more impactful RCP (RCP8.5) provides a reduction in the mean or maximum flow rate between 20% and 34%, except under forest land use, where an increase in the maximum hydrological response by 15% may be possible (Figure 6).
When the impacts of climate change and land use are jointly analysed, the predictions by SWAT show that the scenario under the lower RCP (RCP2.6) in the unregulated headwater forecasts increases in the mean flow rates by 9% and 17% (for conversion to cropland and pasture, respectively) and in the maximum flow by 43% (pasture)–45% (cropland) compared with the natural forest cover. In contrast, in the regulated headwater, these increases will be always lower than 6% (Figure 6). This means that the check dams will be potentially able to limit the increases in surface runoff due to the climate change effects.
Other studies have pointed out contrasting results in modelling the effects of land-use changes on soil’s hydrological response using the SWAT model. For instance, [7] showed how a large urban growth has increased the flash flood risks in five Mediterranean catchments of SE Spain; meanwhile, [40] reported that the annual and seasonal water yield may be slightly affected by land-use changes (+40% or +70% of forest areas, and +50% and 85% of urban areas) in a Mediterranean catchment of South Australia, but are significantly altered by intermediate and high emission scenarios, predominantly during the spring season. In two Mediterranean catchments of Portugal (humid and dry, respectively), climate change predictions may lead to decreased in streamflow [43]. Concerning the effects of climate change on water flow regime, [35] reported a decrease in water yield by about 26%, which would lead to a reduction in the water productivity of cropland by 45% between 2031 and 2050 under RCP4.5 and RCP8.5 in a Mediterranean agro-silvo-pastoral watershed in Northwestern Morocco. According to [79], an increase in temperature between 1 and 3 °C will cause a decrease in mean annual runoff between 0.31% and 1.29%, respectively, in a typical catchment in Andros Island, Greece. In two catchments of Southern France and Northeastern Tunisia, the authors of [39] predicted decreases in runoff and soil water content and increases in potential evapotranspiration between 2041 and 2071. The latter authors showed that the forecasted magnitudes of the changes in stream flows due to climate changes are higher in the wet period than in the dry period. In 18 large catchments in two contrasting regions of Portugal (one humid and one semiarid), [44] pointed out that water runoff, particularly subsurface runoff, is highly sensitive to climate change trends. According to this study, a shift of the humid catchments to acquire semiarid characteristics, such as more irregular river flows and increasingly marginal conditions for agricultural production, is likely to occur under the forecasted climate change scenarios.
In our study, the regulated subcatchment always produces more water flow compared with the subcatchment without check dams. This difference is between 10% and 15% for all the modelled scenarios, while the maximum increases—30% (mean flow rate)–60% (maximum flow rate)—were detected under forest land use and RCP2.6 (Figure 6). The higher hydrological response to precipitation that was detected in the headwater with check dams compared with the unregulated subcatchment may be surprising, since the majority of studies have demonstrated that these structures are generally effective in reducing the peak flow rates [23,88,89]. The literature reports that check dams reduce water flow rates and delay discharge [22,89,90,91]. For instance, check dams were effective in the valley reaches of the torrents of Southern Italy after the disrupting floods of the mid-1950s [92], as well as in steep channels of the North Italian Alps [93]. In our study, the hydraulic control works evidently will not modify the soil infiltration in the channels, whose change would reduce the water volume generated as runoff.
On the other hand, check dams increase the sedimentation processes of finer sediments forming a torrent bed with lower soil hydraulic conductivity compared with the coarser material of the channels without check dams (sand or gravel). Therefore, the higher water flow rate that was simulated by the model in the regulated headwater compared with the subcatchment without check dams should be mostly due to the natural variability of soil properties. Moreover, the lack of effectiveness of check dams shown in our study may be also due to the morphologic adjustments of channels following the check dam construction. Close to check dams, the bed profile aggrades upstream of the structures and the transverse sections widen. These adjustments reduce the water velocity and increase the time to the peak of a flood [25]. As mentioned above, the studied catchments show a limited runoff-generation capacity, which produces very low water discharges that are not affected by the presence of a check dam. In other words, the flow rate is lower compared with the maximum discharge that the check dam weir can convey, and the water stream overpasses the check dam without any hydraulic disturbances. Therefore, the hydraulic parameters of the water stream (velocity, depth, and width) are basically the same as in the unregulated channel under undisturbed conditions. Moreover, the low influence of the check dam on surface runoff in comparison with the unregulated headwater can be understood, since the hydraulic control works do not impact the overland and concentrated water flow generated on the hillslopes—the hydrological actions played by these structures only influence the regulated channels with increases in water travel time, without any effects on the runoff volume [25].
The limited effects of check dams on water flow rates predicted in the studied subcatchments agree with some studies, which have demonstrated that check dams do not always impact the runoff control function. For instance, in semiarid channels of Arizona (USA), rock check dams did not reduce the runoff volumes, and the response to peak flow was not persistent [89,94]. In ephemeral torrent of SE Spain and in the tributaries of the Yellow River (China), check dams were not effective in reducing the effects of disrupting floods, especially in the case of poorly designed or improperly maintained structures [95,96].

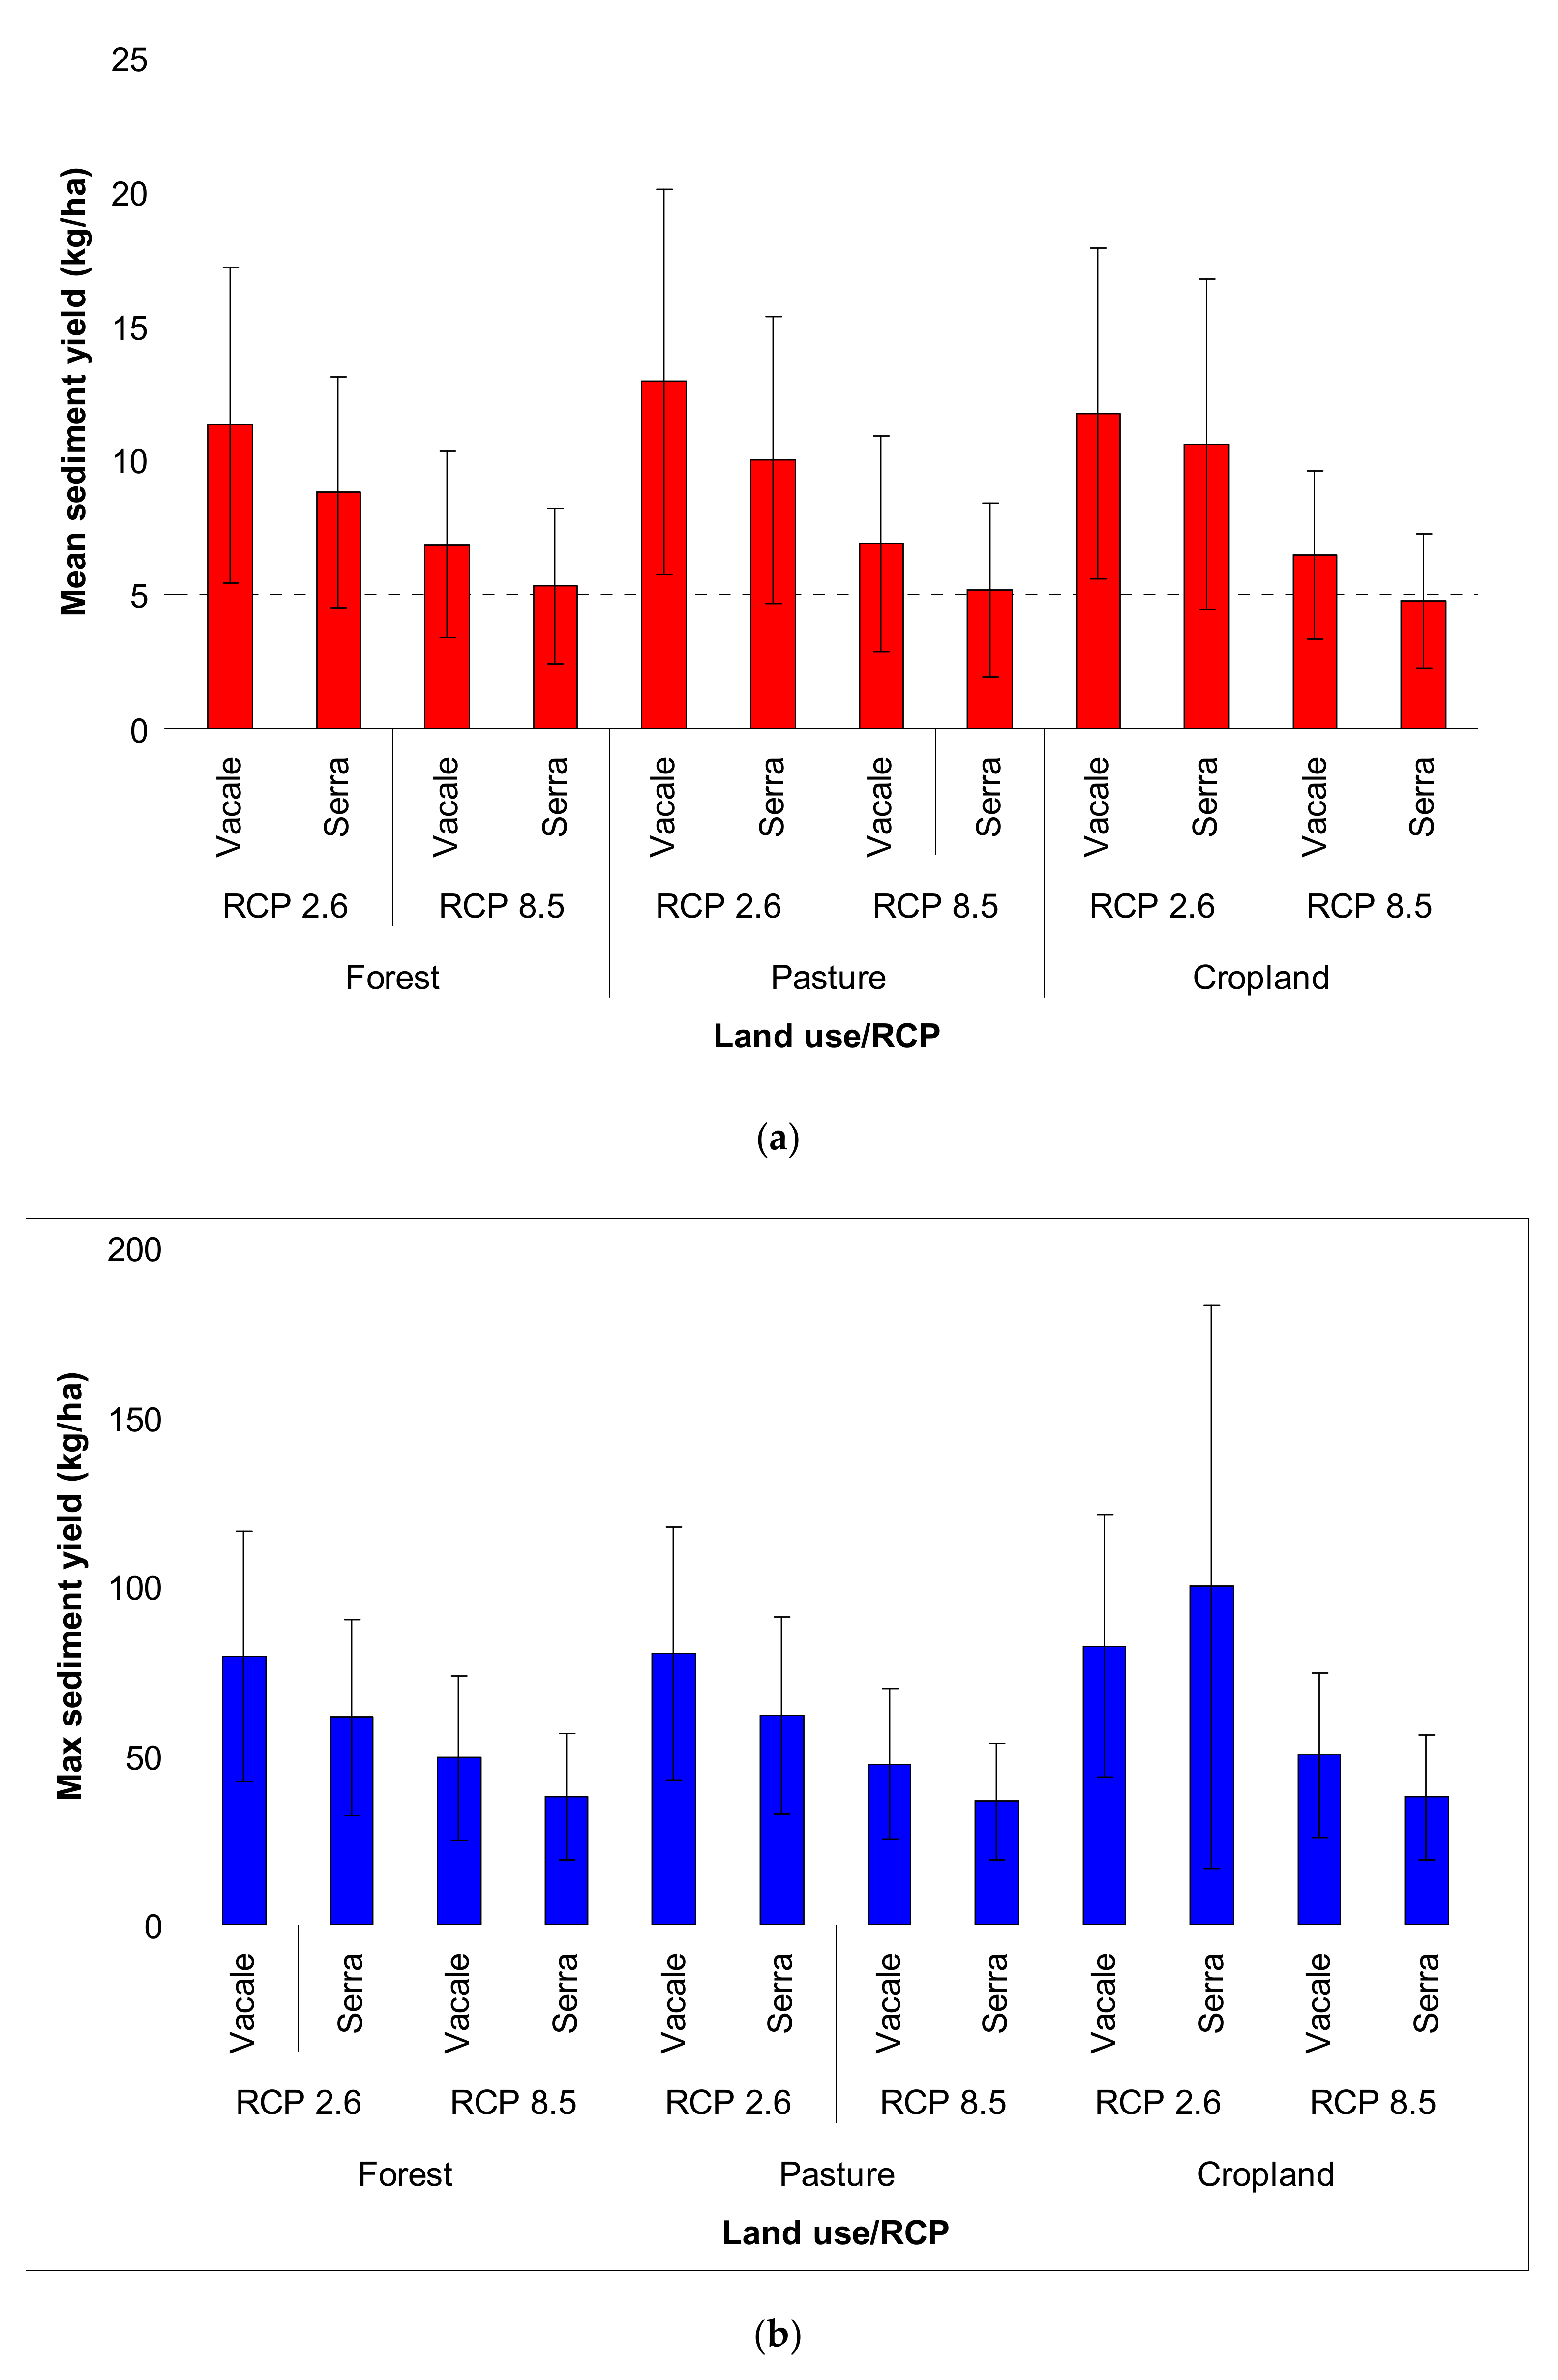
3.3. Analysis of Sediment Yield in the Two Headwaters

Erosion in the modelled headwater followed basically the same trends as the water flow rates. The differences predicted by SWAT for the mean sediment yield among the modelled land uses were very low and not significant (from 8.39 kg/ha in cropland to 8.74 kg/ha in forest). These differences increased for the maximum sediment yields (from 52–53 kg/ha in forest and pasture to 63.4 kg/ha in cropland) and were not significant (Figure 7). The erosion modelling by SWAT indicates that the conversion of forest to pasture or cropland will provide small variations in the mean sediment yields erosion rates (slight decrease, <4%); meanwhile, the maximum erosion will be stable if pasture replaces the forestland, and will increase in the case of replacement with crops (+20%)—although this increase will not be significant. Regarding the effects of climate changes on sediment yields, RCP8.5 results in low erosion compared with RCP2.6, and this decrease is generally noticeable (−30–60%) (Figure 7).
The combined analysis of the effects of land-use changes and climate changes shows positive or negative variations of mean and maximum sediment yield, and these differences will be always lower than 10%. Only the conversion of forest to cropland in the subcatchment without check dams under RCP2.6 will increase the sediment yield by about 70% (Figure 7).
Overall, the sediment yields predicted at the daily scale were very low (maximum value of 92.8 kg/ha in Serra headwater, under RCP2.6 and cropland). The total sediment yield predicted in the 80 years of simulations did not exceed 30.8 (unregulated headwater) and 23.8 (regulated catchment) tons/ha (on average 0.39 and 0.30 tons/ha-year, respectively) under the cropland land use. These very low erosion rates are in accordance with previous studies [3,4]. These annual values are much lower compared with the tolerance limits of erosion. According to [97], a “tolerable soil erosion” is “any actual soil erosion rate at which a deterioration or loss of one or more soil functions does not occur”, while “actual soil erosion” is “the total amount of soil lost by all recognised erosion types”. These authors state that, in Europe, the upper limit of tolerable soil erosion, as equal to soil formation, is about 1.4 tons/ha-year, while the lower limit is about 0.3 tons/ha-year. In this regard, [98,99] suggest limits between 3 and 11 tons/ha-year for agricultural lands. The authors of [3] report that four million ha of croplands currently have unsustainable soil loss rates of more than 5 tons/ha-year, and this requires targeted policy measures. Thus, the check dam actions are less important than in highly dynamic and unstable catchments, where erosion is some order of magnitude higher compared with the values predicted by SWAT in this study. However, it should be highlighted that these erosion estimations could be affected by errors due to the lack of model verification against observed data.
Other experiences about the effects of climate and land-use changes on soil erosion predicted using the SWAT model show that the sediment yield is noticeably sensitive to the climate change scenarios, mainly due to the effects of alterations in saturation deficit and vegetation cover on sediment connectivity [100]. Again, [44] demonstrated that soil erosion may undergo a significant increasing trend in wheat fields of their experimental humid or semiarid catchments of Portugal (one humid and one semiarid), which is well above the recovery capacity of the soil. Finally, the decreased streamflow predicted in [43] under land-use changes is likely to produce a different erosive response between the humid and dry catchments in Portugal.
In our study, the regulated headwater always produced more erosion compared with the subcatchment without check dams (+30–35%). The scenario with cropland replacing forest under RCP2.6 in the unregulated headwater is an exception, since the maximum sediment yield is higher by 21.4% compared with the subcatchment with check dams, while the mean value is lower by 10% (Figure 7).
The higher sediment yields predicted by the SWAT model in the regulated headwater under the modelled scenarios of climate and land-use changes may be surprising considering the published studies. The literature has widely shown that check dams largely influence the soil hydrology and channel morphology. The control structures reduce the channel profile slope and widen their cross-sections (e.g., [6,25]). In the sediment wedge, the riparian vegetation grows more rapidly and extensively compared with the undisturbed reaches (e.g., [18,101]); these effects result in reduced water velocity and sediment transport capacity of the stream flow [27,102], as well as higher sedimentation of the solid material. To explain the unexpected low effects of the control works in the regulated headwater, one should bear in mind that the check dams were built several decades before the flood occurrence, and the short-term effects of the structures after their construction were already exhausted [89]. For instance, their retention capacity was depleted, and—many decades after installation—the check dams work as bed stabilisers rather than sediment collectors [103]. In other words, the sediment wedge created immediately after installation behind each check dam was rapidly filled with sediments; therefore, the control works cannot retain the solid material transported by floods. When the retention capacity of the check dam is depleted, the structures are still effective in reducing the sediment yield, since the channel bed has a milder longitudinal slope behind a check dam; therefore, the sediment transport capacity is reduced [103,104]. Despite these more stable conditions, the most intense floods (i) mobilize the sediments previously deposited on bars or accumulated above the spillway level by ordinary stream flows; and (ii) scour the bed material downstream of the check dams due to the unsaturated conditions of the water stream [105,106,107]. Both the erosive processes, increasing the net erosion between two consecutive check dams, may increase the sediment yield at the outlet of the regulated channels. Therefore, it is possible that, despite the long period of time elapsed from check dam installation, the channel profiles (regulated or not) are not at the equilibrium slope. The profile slope of the studied headwaters has been estimated between 4% and 5% [26], against a value over 6% (Table 1). This means that the evolutionary dynamics of the channel profile and sections are still active, and the headwaters are evolving towards steady conditions, but this evolution occurs at a very slow rate. Due to these ongoing evolutionary trends, both headwaters are active on the geomorphologic aspects. Therefore, the erosion rates in both the regulated and unregulated subcatchments are very close, and even the torrent with check dams may produce higher sediment yields compared with the unregulated channel. This result agrees with findings of other authors, who reported lower effectiveness of check dams at reducing sediment yield compared with catchments without check dams [108,109]. The latter authors, in regulated catchments in the Czech Republic, demonstrated that the torrent control works increased the longitudinal connectivity of sediments compared with unregulated channels with the same catchment-scale characteristics. Our study and these experiences, which highlight how graded check dams can increase sediment flows downstream of regulated channels, are in contrast with the generally held view that check dams reduce erosion.
Another reason of the higher erosion rates estimated in the regulated headwater may be the local scouring of sediments downstream of check dams. Here, the water flow overpassing the check dam weir is undersaturated and concentrated. This results in an intense erosive power, which can mobilise the finer fraction of sediments in the channel bed. This effect may increase the sediment load in the regulated headwater, increasing the solid discharge. Many authors have reported that check dams slow the water stream down, which induces sedimentation of the finer material upstream of the check dam. Consequently, the undersaturated water flow increases the local erosion with additional sediment mobilisation downstream (also enhanced by the absence of in-channel vegetation) [25,105,106,107,110].

3.4. Limitations of the Study and Further Research Needs

Although the estimated water flow and erosion rates result in indications about the effectiveness of check dams at controlling the hydrological response of Mediterranean catchments, this study has two limitations.
Firstly, two years of daily flow rates were used for model calibration at the Duverso torrent. Although no extreme floods were measured in this period (which may have altered the accuracy of the calibration process) in the southern part of Calabria Region [28], it is possible that a larger availability of water flow observations could have improved the model’s prediction capacity; therefore, the reliability of future water flow estimations would have also improved.
Secondly, the accuracy of the erosion predictions of this study may be limited by the lack of observations of sediment yields in all the modelled subcatchments. This prevented the calibration of the erosive submodel of SWAT. However, attention was paid to the differences in erosion produced in the two studied catchments rather than to the absolute sediment yields. Therefore, we think that this lack did not noticeably affect the reliability of the estimations—the modelled headwaters being equally biased by this study limitation. Equipping at least one catchment with devices measuring the hydrological variables will not only help direct observations of the actual water flow and sediment yield rates, but will also allow the implementation of erosive models to support the analysis of future hydrological trends.
Finally, our study is a modelling experiment that has provided an estimation of the water flow and erosion rates under future scenarios of climate and land-use changes in forest headwaters either regulated or not regulated by control works. As such, the hydrological, morphological, and ecological reasons that produce those effects were not investigated. Therefore, there is a need for further investigations. These should focus on some important factors, such as the local soil characteristics (which noticeably influence the erodibility of the channel bed); the local presence of shrub and tree vegetation in the torrents (which modifies the water stream velocity and protects the channel from soil detachment); the landforms of the channel bed (which can alter sediment connectivity into the channel); and, above all, the availability of hydrological observations, as discussed above).

4. Conclusions

This study evaluated the effectiveness of check dams on the hydrological response of a forest headwater in Calabria (Southern Italy) in comparison with an unregulated subcatchment with very similar environmental conditions. In this regard, the effects of different combined scenarios of climate change (through three GCMs and two RCPs applied to a time period of the next 80 years) and land use (forest, pasture, and cropland) on water flow rates and sediment yields in the two headwaters were analysed using the SWAT model. The model calibration in a third headwater using 2-year observations showed a satisfactory prediction capacity of water flow rate.
No significant differences were detected for the water flow rates between the two subcatchments (with or without check dams) among the different land uses and climate change scenarios. SWAT estimated higher values of both mean and maximum flow rates under RCP2.6 compared with RCP8.5. As for the water flow rates, neither of the sediment yields predicted by SWAT were significantly different under the modelled climate and land-use change scenarios. Additionally, for this variable, the mean and maximum erosion values were higher under RCP2.6 compared with RCP8.5. Both water flow rates and sediment yields were very low under all climate and land-use scenarios. These results help us to reject the first working hypothesis, that both climate and land-use changes will significantly impact water flow and erosion rates in the studied subcatchments; this is because the runoff- and erosion-generation capacities will not be simply affected by the forecasted increases in air temperature and rainfall intensity. A regulated headwater with check dams will always produce more runoff and erosion compared with subcatchments without check dams. The increases will be up to 60% for the maximum flow rate and 30–35% for the sediment yield in forest land use and under RCP2.6. Therefore, the second working hypothesis—that the unregulated catchment would show a lower hydrological response compared with the headwater without check dams—should be also rejected. This rejection depends on several factors, such as the low runoff-generation capacity of the catchments, that is not affected by the changes in climate trends and land use; (b) the low efficiency of check dams in regulating the small water flows in the two subcatchments; (c) the lack of check dam effectiveness in contrasting the overland and concentrated water flows generated in the hillslopes; (d) the long time elapsed from check dam installation with consequent depletion of the sediment-retention capacity due to the wedge filling upstream of the structures; (e) the unsteady conditions of the channel profile in both headwaters that, after many decades, are not at their equilibrium slope; (f) the scouring of sediments downstream of check dams—where the undersaturated and concentrated water flow has an intense erosive power—which can mobilise the finer fraction of sediments in the channel bed. Although this study was limited by the lack of a validation of the erosion data (due to unavailable records of sediment yield), this study has demonstrated how the use of check dams in headwater catchments may be ineffective for soil conservation purposes several decades after their installation in Mediterranean semiarid areas, where the water flow and erosion rate are limited.

Author Contributions

Conceptualization, D.A.Z., M.E.L.-B., P.G.F.F., P.P.-C. and C.C.-G.; methodology, B.G.C., D.A.Z., M.E.L.-B., P.G.F.F., P.P.-C. and C.C.-G.; software, B.G.C. and D.A.Z.; validation, D.A.Z., M.E.L.-B., P.G.F.F., P.P.-C. and C.C.-G.; formal analysis, D.A.Z., M.E.L.-B., P.G.F.F., P.P.-C. and C.C.-G.; investigation, B.G.C., D.A.Z., M.E.L.-B., P.G.F.F., P.P.-C. and C.C.-G.; data curation, B.G.C. and D.A.Z.; writing—original draft preparation, B.G.C.; writing—review and editing, B.G.C., D.A.Z., M.E.L.-B., P.G.F.F., P.P.-C. and C.C.-G.; supervision, D.A.Z., M.E.L.-B. and C.C.-G.; project administration, D.A.Z. and C.C.-G.; funding acquisition, C.C.-G. All authors have read and agreed to the published version of the manuscript.

Funding

This research was funded by the ERDF/Spanish Ministry of Science, Innovation and Universities—State Research Agency (AEI)/Project CGL2017-84625-C2-1-R; State Program for Research, Development, and Innovation Focused on the Challenges of Society.

Institutional Review Board Statement

Not applicable.

Informed Consent Statement

Not applicable.

Data Availability Statement

The data presented in this study are available on request from the corresponding author.

Conflicts of Interest

The authors declare no conflict of interest.

References

  1. Gentile, F.; Bisantino, T.; Corbino, R.; Milillo, F.; Romano, G.; Liuzzi, G.T. Monitoring and Analysis of Suspended Sediment Transport Dynamics in the Carapelle Torrent (Southern Italy). Catena 2010, 80, 1–8. [Google Scholar] [CrossRef]
  2. Faccini, F.; Luino, F.; Paliaga, G.; Sacchini, A.; Turconi, L.; de Jong, C. Role of Rainfall Intensity and Urban Sprawl in the 2014 Flash Flood in Genoa City, Bisagno Catchment (Liguria, Italy). Appl. Geogr. 2018, 98, 224–241. [Google Scholar] [CrossRef]
  3. Panagos, P.; Borrelli, P.; Poesen, J.; Ballabio, C.; Lugato, E.; Meusburger, K.; Montanarella, L.; Alewell, C. The New Assessment of Soil Loss by Water Erosion in Europe. Environ. Sci. Policy 2015, 54, 438–447. [Google Scholar] [CrossRef]
  4. Kastridis, A.; Stathis, D.; Sapountzis, M.; Theodosiou, G. Insect Outbreak and Long-Term Post-Fire Effects on Soil Erosion in Mediterranean Suburban Forest. Land 2022, 11, 911. [Google Scholar] [CrossRef]
  5. Ferreira, C.S.; Seifollahi-Aghmiuni, S.; Destouni, G.; Ghajarnia, N.; Kalantari, Z. Soil Degradation in the European Mediterranean Region: Processes, Status and Consequences. Sci. Total Environ. 2022, 805, 150106. [Google Scholar] [CrossRef]
  6. Fortugno, D.; Boix-Fayos, C.; Bombino, G.; Denisi, P.; Quinonero Rubio, J.M.; Tamburino, V.; Zema, D.A. Adjustments in Channel Morphology Due to Land-use Changes and Check Dam Installation in Mountain Torrents of Calabria (Southern Italy). Earth Surf. Process. Landf. 2017, 42, 2469–2483. [Google Scholar] [CrossRef]
  7. Jodar-Abellan, A.; Valdes-Abellan, J.; Pla, C.; Gomariz-Castillo, F. Impact of Land Use Changes on Flash Flood Prediction Using a Sub-Daily SWAT Model in Five Mediterranean Ungauged Watersheds (SE Spain). Sci. Total Environ. 2019, 657, 1578–1591. [Google Scholar] [CrossRef]
  8. Filianoti, P.; Gurnari, L.; Zema, D.A.; Bombino, G.; Sinagra, M.; Tucciarelli, T. An Evaluation Matrix to Compare Computer Hydrological Models for Flood Predictions. Hydrology 2020, 7, 42. [Google Scholar] [CrossRef]
  9. Martın-Vide, J.P.; Ninerola, D.; Bateman, A.; Navarro, A.; Velasco, E. Runoff and Sediment Transport in a Torrential Ephemeral Stream of the Mediterranean Coast. J. Hydrol. 1999, 225, 118–129. [Google Scholar] [CrossRef]
  10. Rodrigo-Comino, J.; López-Vicente, M.; Kumar, V.; Rodríguez-Seijo, A.; Valkó, O.; Rojas, C.; Pourghasemi, H.R.; Salvati, L.; Bakr, N.; Vaudour, E. Soil Science Challenges in a New Era: A Transdisciplinary Overview of Relevant Topics. Air Soil Water Res. 2020, 13, 1–17. [Google Scholar] [CrossRef]
  11. Conesa-García, C.; Garcia-Lorenzo, R. Bed Texture Changes Caused by Check Dams on Ephemeral Channels in Mediterranean Semiarid Environments. Z. Geomorphol. 2008, 52, 437. [Google Scholar] [CrossRef]
  12. Mekonnen, M.; Keesstra, S.D.; Baartman, J.E.; Ritsema, C.J.; Melesse, A.M. Evaluating Sediment Storage Dams: Structural off-Site Sediment Trapping Measures in Northwest Ethiopia. Cuad. Investig. Geográfica 2015, 41, 7–22. [Google Scholar] [CrossRef] [Green Version]
  13. Bombino, G.; Gurnell, A.M.; Tamburino, V.; Zema, D.A.; Zimbone, S.M. A Method for Assessing Channelization Effects on Riparian Vegetation in a Mediterranean Environment. River Res. Appl. 2007, 23, 613–630. [Google Scholar] [CrossRef]
  14. Lucas-Borja, M.E.; Piton, G.; Yu, Y.; Castillo, C.; Zema, D.A. Check Dams Worldwide: Objectives, Functions, Effectiveness and Undesired Effects. Catena 2021, 204, 105390. [Google Scholar] [CrossRef]
  15. Boix-Fayos, C.; Barberá, G.G.; López-Bermúdez, F.; Castillo, V.M. Effects of Check Dams, Reforestation and Land-Use Changes on River Channel Morphology: Case Study of the Rogativa Catchment (Murcia, Spain). Geomorphology 2007, 91, 103–123. [Google Scholar] [CrossRef]
  16. Boix-Fayos, C.; de Vente, J.; Martínez-Mena, M.; Barberá, G.G.; Castillo, V. The Impact of Land Use Change and Check-dams on Catchment Sediment Yield. Hydrol. Process. Int. J. 2008, 22, 4922–4935. [Google Scholar] [CrossRef]
  17. Castillo, V.M.; Mosch, W.M.; García, C.C.; Barberá, G.G.; Cano, J.N.; López-Bermúdez, F. Effectiveness and Geomorphological Impacts of Check Dams for Soil Erosion Control in a Semiarid Mediterranean Catchment: El Cárcavo (Murcia, Spain). Catena 2007, 70, 416–427. [Google Scholar] [CrossRef]
  18. Bombino, G.; Zema, D.A.; Denisi, P.; Lucas-Borja, M.E.; Labate, A.; Zimbone, S.M. Assessment of Riparian Vegetation Characteristics in Mediterranean Headwaters Regulated by Check Dams Using Multivariate Statistical Techniques. Sci. Total Environ. 2019, 657, 597–607. [Google Scholar] [CrossRef]
  19. Díaz-Gutiérrez, V.; Mongil-Manso, J.; Navarro-Hevia, J.; Ramos-Díez, I. Check Dams and Sediment Control: Final Results of a Case Study in the Upper Corneja River (Central Spain). J. Soils Sediments 2019, 19, 451–466. [Google Scholar] [CrossRef]
  20. Ramos-Diez, I.; Navarro-Hevia, J.; San Martín Fernández, R.; Díaz-Gutiérrez, V.; Mongil-Manso, J. Analysis of Methods to Determine the Sediment Retained by Check Dams and to Estimate Erosion Rates in Badlands. Environ. Monit. Assess. 2016, 188, 405. [Google Scholar] [CrossRef]
  21. Ramos-Diez, I.; Navarro-Hevia, J.; San Martín Fernández, R.; Mongil-Manso, J. Final Analysis of the Accuracy and Precision of Methods to Calculate the Sediment Retained by Check Dams. Land Degrad. Dev. 2017, 28, 2446–2456. [Google Scholar] [CrossRef]
  22. Guyassa, E.; Frankl, A.; Zenebe, A.; Poesen, J.; Nyssen, J. Effects of Check Dams on Runoff Characteristics along Gully Reaches, the Case of Northern Ethiopia. J. Hydrol. 2017, 545, 299–309. [Google Scholar] [CrossRef] [Green Version]
  23. Nichols, M.H.; Polyakov, V.O.; Nearing, M.A.; Hernandez, M. Semiarid Watershed Response to Low-Tech Porous Rock Check Dams. Soil Sci. 2016, 181, 275–282. [Google Scholar] [CrossRef] [Green Version]
  24. Ricci, G.F.; Romano, G.; Leronni, V.; Gentile, F. Effect of Check Dams on Riparian Vegetation Cover: A Multiscale Approach Based on Field Measurements and Satellite Images for Leaf Area Index Assessment. Sci. Total Environ. 2019, 657, 827–838. [Google Scholar] [CrossRef]
  25. Zema, D.A.; Bombino, G.; Denisi, P.; Lucas-Borja, M.E.; Zimbone, S.M. Evaluating the Effects of Check Dams on Channel Geometry, Bed Sediment Size and Riparian Vegetation in Mediterranean Mountain Torrents. Sci. Total Environ. 2018, 642, 327–340. [Google Scholar] [CrossRef]
  26. Bombino, G.; Pérez-Cutillas, P.; D’Agostino, D.; Denisi, P.; Labate, A.; Martínez-Salvador, A.; Zema, D.A.; Zimbone, S.M.; Conesa-García, C. Comparing the Hydrological Response of Forested Headwaters (Unregulated and Regulated with Check Dams) under Mediterranean Semi-Arid Conditions. Water 2021, 13, 1275. [Google Scholar] [CrossRef]
  27. Saint-Laurent, D.; Arsenault-Boucher, L.; Berthelot, J.-S. Contrasting Effects of Flood Disturbance on Alluvial Soils and Riparian Tree Structure and Species Composition in Mixed Temperate Forests. Air Soil Water Res. 2019, 12, 1–15. [Google Scholar] [CrossRef] [Green Version]
  28. Ballesteros-Canovas, J.A.; Bombino, G.; D’Agostino, D.; Denisi, P.; Labate, A.; Stoffel, M.; Zema, D.A.; Zimbone, S.M. Tree-Ring Based, Regional-Scale Reconstruction of Flash Floods in Mediterranean Mountain Torrents. Catena 2020, 189, 104481. [Google Scholar] [CrossRef]
  29. Castillo, C.; Pérez, R.; Gómez, J.A. A Conceptual Model of Check Dam Hydraulics for Gully Control: Efficiency, Optimal Spacing and Relation with Step-Pools. Hydrol. Earth Syst. Sci. 2014, 18, 1705–1721. [Google Scholar] [CrossRef] [Green Version]
  30. Quiñonero-Rubio, J.M.; Nadeu, E.; Boix-Fayos, C.; de Vente, J. Evaluation of the Effectiveness of Forest Restoration and Check-dams to Reduce Catchment Sediment Yield. Land Degrad. Dev. 2016, 27, 1018–1031. [Google Scholar] [CrossRef]
  31. Abbasi, N.A.; Xu, X.; Lucas-Borja, M.E.; Dang, W.; Liu, B. The Use of Check Dams in Watershed Management Projects: Examples from around the World. Sci. Total Environ. 2019, 676, 683–691. [Google Scholar] [CrossRef] [PubMed]
  32. Grayson, R.; Blöschl, G. Spatial Patterns in Catchment Hydrology: Observations and Modelling; Cambridge University Press: Cambridge, UK, 2001; ISBN 0-521-63316-8. [Google Scholar]
  33. Locatelli, B.; Vignola, R. Managing Watershed Services of Tropical Forests and Plantations: Can Meta-Analyses Help? For. Ecol. Manag. 2009, 258, 1864–1870. [Google Scholar] [CrossRef] [Green Version]
  34. Navratil, O.; Albert, M.B.; Breil, P. Test of Three Methods to Detect the Overbank Flow from Water Level Time-series Analysis. Hydrol. Process. 2010, 24, 2452–2464. [Google Scholar] [CrossRef]
  35. Brouziyne, Y.; Abouabdillah, A.; Hirich, A.; Bouabid, R.; Zaaboul, R.; Benaabidate, L. Modeling Sustainable Adaptation Strategies toward a Climate-Smart Agriculture in a Mediterranean Watershed under Projected Climate Change Scenarios. Agric. Syst. 2018, 162, 154–163. [Google Scholar] [CrossRef]
  36. Cubasch, U.; Meehl, G.A.; Boer, G.J.; Stouffer, R.J.; Dix, M.; Noda, A.; Senior, C.A.; Raper, S.; Yap, K.S. Projections of Future Climate Change. In Climate Change 2001: The scientific basis. Contribution of WG1 to the Third Assessment Report of the IPCC (TAR); Cambridge University Press: Cambridge, UK, 2001; pp. 525–582. [Google Scholar]
  37. Lucas-Borja, M.E.; Carrà, B.G.; Nunes, J.P.; Bernard-Jannin, L.; Zema, D.A.; Zimbone, S.M. Impacts of Land-Use and Climate Changes on Surface Runoff in a Tropical Forest Watershed (Brazil). Hydrol. Sci. J. 2020, 65, 1956–1973. [Google Scholar] [CrossRef]
  38. Macklin, M.G.; Fuller, I.C.; Lewin, J.; Maas, G.S.; Passmore, D.G.; Rose, J.; Woodward, J.C.; Black, S.; Hamlin, R.H.B.; Rowan, J.S. Correlation of Fluvial Sequences in the Mediterranean Basin over the Last 200 Ka and Their Relationship to Climate Change. Quat. Sci. Rev. 2002, 21, 1633–1641. [Google Scholar] [CrossRef] [Green Version]
  39. Sellami, H.; Benabdallah, S.; La Jeunesse, I.; Vanclooster, M. Quantifying Hydrological Responses of Small Mediterranean Catchments under Climate Change Projections. Sci. Total Environ. 2016, 543, 924–936. [Google Scholar] [CrossRef]
  40. Shrestha, M.K.; Recknagel, F.; Frizenschaf, J.; Meyer, W. Future Climate and Land Uses Effects on Flow and Nutrient Loads of a Mediterranean Catchment in South Australia. Sci. Total Environ. 2017, 590–591, 186–193. [Google Scholar] [CrossRef]
  41. Cooper, S.D.; Lake, P.S.; Sabater, S.; Melack, J.M.; Sabo, J.L. The Effects of Land Use Changes on Streams and Rivers in Mediterranean Climates. Hydrobiologia 2013, 719, 383–425. [Google Scholar] [CrossRef]
  42. Lizaga, I.; Quijano, L.; Palazón, L.; Gaspar, L.; Navas, A. Enhancing Connectivity Index to Assess the Effects of Land Use Changes in a Mediterranean Catchment. Land Degrad. Dev. 2018, 29, 663–675. [Google Scholar] [CrossRef] [Green Version]
  43. Serpa, D.; Nunes, J.P.; Santos, J.; Sampaio, E.; Jacinto, R.; Veiga, S.; Lima, J.C.; Moreira, M.; Corte-Real, J.; Keizer, J.J. Impacts of Climate and Land Use Changes on the Hydrological and Erosion Processes of Two Contrasting Mediterranean Catchments. Sci. Total Environ. 2015, 538, 64–77. [Google Scholar] [CrossRef] [Green Version]
  44. Nunes, J.P.; Seixas, J.; Pacheco, N.R. Vulnerability of Water Resources, Vegetation Productivity and Soil Erosion to Climate Change in Mediterranean Watersheds. Hydrol. Process. 2008, 22, 3115–3134. [Google Scholar] [CrossRef]
  45. Kavian, A.; Javidan, N.; Bahrehmand, A.; Gyasi-Agyei, Y.; Hazbavi, Z.; Rodrigo-Comino, J. Assessing the Hydrological Effects of Land-Use Changes on a Catchment Using the Markov Chain and WetSpa Models. Hydrol. Sci. J. 2020, 65, 2604–2615. [Google Scholar] [CrossRef]
  46. Conesa-García, C.; López-Bermúdez, F.; García-Lorenzo, R. Bed Stability Variations after Check Dam Construction in Torrential Channels (South-East Spain). Earth Surf. Process. Landf. J. Br. Geomorphol. Res. Group 2007, 32, 2165–2184. [Google Scholar] [CrossRef]
  47. Kottek, M.; Grieser, J.; Beck, C.; Rudolf, B.; Rubel, F. World Map of the Köppen-Geiger Climate Classification Updated. Meteorol. Z. 2006, 15, 259–263. [Google Scholar] [CrossRef]
  48. Büttner, G.; Feranec, J.; Jaffrain, G.; Steenmans, C.; Gheorghe, A.; Lima, V. Corine Land cover Update 2000. Technical Guidelines; European Environment Agency: Copenhagen, Denmark, 2002. [Google Scholar]
  49. FAO—ISRIC. World Reference Base for Soil Resources; World Soil Resources Report 84; FAO: Rome, Italy, 1998. [Google Scholar]
  50. Büttner, G.; Feranec, J.; Jaffrain, G.; Mari, L.; Maucha, G.; Soukup, T. The CORINE Land Cover 2000 Project. EARSeL eProceedings 2004, 3, 331–346. [Google Scholar]
  51. Arnold, J.G.; Srinivasan, R.; Muttiah, R.S.; Williams, J.R. Large Area Hydrologic Modeling and Assessment Part I: Model Development 1. JAWRA J. Am. Water Resour. Assoc. 1998, 34, 73–89. [Google Scholar] [CrossRef]
  52. Piniewski, M.; Voss, F.; Bärlund, I.; Okruszko, T.; Kundzewicz, Z.W. Effect of Modelling Scale on the Assessment of Climate Change Impact on River Runoff. Hydrol. Sci. J. 2013, 58, 737–754. [Google Scholar] [CrossRef] [Green Version]
  53. Licciardello, F.; Rossi, C.G.; Srinivasan, R.; Zimbone, S.M.; Barbagallo, S. Hydrologic Evaluation of a Mediterranean Watershed Using the SWAT Model with Multiple PET Estimation Methods. Trans. ASABE 2011, 54, 1615–1625. [Google Scholar] [CrossRef]
  54. Meaurio, M.; Zabaleta, A.; Uriarte, J.A.; Srinivasan, R.; Antigüedad, I. Evaluation of SWAT Models Performance to Simulate Streamflow Spatial Origin. The Case of a Small Forested Watershed. J. Hydrol. 2015, 525, 326–334. [Google Scholar] [CrossRef]
  55. Strauch, M.; Volk, M. SWAT Plant Growth Modification for Improved Modeling of Perennial Vegetation in the Tropics. Ecol. Model. 2013, 269, 98–112. [Google Scholar] [CrossRef]
  56. Mello, C.R.; Norton, L.D.; Pinto, L.C.; Beskow, S.; Curi, N. Agricultural Watershed Modeling: A Review for Hydrology and Soil Erosion Processes. Ciência Agrotecnologia 2016, 40, 7–25. [Google Scholar] [CrossRef] [Green Version]
  57. Neitsch, S.L.; Arnold, J.G.; Kiniry, J.R.; Srinivasan, R.; Williams, J.R. Soil and Water Assessment Tool Input/Output File Documentation Version 2009: Texas Water Resources Institute Technical Report 365; Texas Water Resources Institute: College Station, TX, USA, 2010. [Google Scholar]
  58. Strauch, M.; Lima, J.E.; Volk, M.; Lorz, C.; Makeschin, F. The Impact of Best Management Practices on Simulated Streamflow and Sediment Load in a Central Brazilian Catchment. J. Environ. Manag. 2013, 127, S24–S36. [Google Scholar] [CrossRef]
  59. Ficklin, D.L.; Luo, Y.; Luedeling, E.; Zhang, M. Climate Change Sensitivity Assessment of a Highly Agricultural Watershed Using SWAT. J. Hydrol. 2009, 374, 16–29. [Google Scholar] [CrossRef]
  60. Lirong, S.; Jianyun, Z. Hydrological Response to Climate Change in Beijiang River Basin Based on the SWAT Model. Procedia Eng. 2012, 28, 241–245. [Google Scholar] [CrossRef] [Green Version]
  61. da Silva, V.P.R.; Silva, M.T.; Singh, V.P.; de Souza, E.P.; Braga, C.C.; de Holanda, R.M.; Almeida, R.S.R.; de Sousa, F.A.S.; Braga, A.C.R. Simulation of Stream Flow and Hydrological Response to Land-Cover Changes in a Tropical River Basin. Catena 2018, 162, 166–176. [Google Scholar] [CrossRef]
  62. USDA. National Engineering Handbook, Part 630 Hydrology, Section 4, Chapter 10; Natural Resources Conservation Service; US Department of Agriculture: Washington, DC, USA, 1972. [Google Scholar]
  63. Chow, V.T. (Ed.) Runoff. In Handbook of Applied Hydrology; Sect. 14; McGraw-Hill: New York, NY, USA, 1964. [Google Scholar]
  64. Licciardello, F.; Zema, D.A.; Zimbone, S.M.; Bingner, R.L. Runoff and Soil Erosion Evaluation by the AnnAGNPS Model in a Small Mediterranean Watershed. Trans. ASABE 2007, 50, 1585–1593. [Google Scholar] [CrossRef]
  65. Pereira, D.R.; Martinez, M.A.; da Silva, D.D.; Pruski, F.F. Hydrological Simulation in a Basin of Typical Tropical Climate and Soil Using the SWAT Model Part II: Simulation of Hydrological Variables and Soil Use Scenarios. J. Hydrol. Reg. Stud. 2016, 5, 149–163. [Google Scholar] [CrossRef] [Green Version]
  66. Pereira, D.R.; Martinez, M.A.; Pruski, F.F.; da Silva, D.D. Hydrological Simulation in a Basin of Typical Tropical Climate and Soil Using the SWAT Model Part I: Calibration and Validation Tests. J. Hydrol. Reg. Stud. 2016, 7, 14–37. [Google Scholar] [CrossRef] [Green Version]
  67. Abbaspour, K.C.; Vejdani, M.; Haghighat, S.; Yang, J. SWAT-CUP Calibration and Uncertainty Programs for SWAT. In Proceedings of the MODSIM 2007 International Congress on Modelling and Simulation, Modelling and Simulation Society of Australia and New Zealand, Christchurch, New Zealand, 10–13 December 2007; Swiss Federal Institute of Aquatic Science and Technology: Dübendorf, Switzerland; pp. 1596–1602. [Google Scholar]
  68. Fukunaga, D.C.; Cecílio, R.A.; Zanetti, S.S.; Oliveira, L.T.; Caiado, M.A.C. Application of the SWAT Hydrologic Model to a Tropical Watershed at Brazil. Catena 2015, 125, 206–213. [Google Scholar] [CrossRef]
  69. Nash, J.E.; Sutcliffe, J.V. River Flow Forecasting through Conceptual Models Part I—A Discussion of Principles. J. Hydrol. 1970, 10, 282–290. [Google Scholar] [CrossRef]
  70. Santhi, C.; Arnold, J.G.; Williams, J.R.; Dugas, W.A.; Srinivasan, R.; Hauck, L.M. Validation of the Swat Model on a Large Rwer Basin with Point and Nonpoint Sources 1. JAWRA J. Am. Water Resour. Assoc. 2001, 37, 1169–1188. [Google Scholar] [CrossRef]
  71. Van Liew, M.W.; Arnold, J.G.; Garbrecht, J.D. Hydrologic Simulation on Agricultural Watersheds: Choosing between Two Models. Trans. ASAE 2003, 46, 1539. [Google Scholar] [CrossRef]
  72. Van Liew, M.W.; Garbrecht, J. Hydrologic Simulation of the Little Washita River Experimental Watershed Using SWAT 1. JAWRA J. Am. Water Resour. Assoc. 2003, 39, 413–426. [Google Scholar] [CrossRef]
  73. Moriasi, D.N.; Arnold, J.G.; Van Liew, M.W.; Bingner, R.L.; Harmel, R.D.; Veith, T.L. Model Evaluation Guidelines for Systematic Quantification of Accuracy in Watershed Simulations. Trans. ASABE 2007, 50, 885–900. [Google Scholar] [CrossRef]
  74. Gupta, H.V.; Sorooshian, S.; Yapo, P.O. Status of Automatic Calibration for Hydrologic Models: Comparison with Multilevel Expert Calibration. J. Hydrol. Eng. 1999, 4, 135–143. [Google Scholar] [CrossRef]
  75. Zhang, M.; Liu, N.; Harper, R.; Li, Q.; Liu, K.; Wei, X.; Ning, D.; Hou, Y.; Liu, S. A Global Review on Hydrological Responses to Forest Change across Multiple Spatial Scales: Importance of Scale, Climate, Forest Type and Hydrological Regime. J. Hydrol. 2017, 546, 44–59. [Google Scholar] [CrossRef] [Green Version]
  76. Zhang, Y.; You, Q.; Chen, C.; Ge, J. Impacts of Climate Change on Streamflows under RCP Scenarios: A Case Study in Xin River Basin, China. Atmos. Res. 2016, 178, 521–534. [Google Scholar] [CrossRef]
  77. Wilby, R.L.; Dawson, C.W.; Barrow, E.M. SDSM—a Decision Support Tool for the Assessment of Regional Climate Change Impacts. Environ. Model. Softw. 2002, 17, 145–157. [Google Scholar] [CrossRef]
  78. Krysanova, V.; Kundzewicz, Z.W.; Piniewski, M.; Singh, V.P. Assessment of Climate Change Impacts on Water Resources. In Handbook of Applied Hydrology; McGraw-Hill Education: New York, MY, USA, 2016; pp. 148-1–148-12. [Google Scholar]
  79. Kalogeropoulos, K.; Chalkias, C. Modelling the Impacts of Climate Change on Surface Runoff in Small Mediterranean Catchments: Empirical Evidence from Greece: Modelling the Impacts of Climate Change on Surface Runoff. Water Environ. J. 2013, 27, 505–513. [Google Scholar] [CrossRef]
  80. Martínez-Salvador, A.; Conesa-García, C. Suitability of the SWAT Model for Simulating Water Discharge and Sediment Load in a Karst Watershed of the Semiarid Mediterranean Basin. Water Resour. Manag. 2020, 34, 785–802. [Google Scholar] [CrossRef]
  81. Abdelwahab, O.M.M.; Ricci, G.F.; De Girolamo, A.M.; Gentile, F. Modelling Soil Erosion in a Mediterranean Watershed: Comparison between SWAT and AnnAGNPS Models. Environ. Res. 2018, 166, 363–376. [Google Scholar] [CrossRef]
  82. Gaume, E.; Bain, V.; Bernardara, P.; Newinger, O.; Barbuc, M.; Bateman, A.; Blaškovičová, L.; Blöschl, G.; Borga, M.; Dumitrescu, A.; et al. A Compilation of Data on European Flash Floods. J. Hydrol. 2009, 367, 70–78. [Google Scholar] [CrossRef] [Green Version]
  83. Carvalho-Santos, C.; Honrado, J.P.; Hein, L. Hydrological Services and the Role of Forests: Conceptualization and Indicator-Based Analysis with an Illustration at a Regional Scale. Ecol. Complex. 2014, 20, 69–80. [Google Scholar] [CrossRef]
  84. Hewlett, J.D. Principles of Forest Hydrology; University of Georgia Press: Athens, GA, USA, 1982; ISBN 0-8203-2380-2. [Google Scholar]
  85. Lucas-Borja, M.E.; Piton, G.; Nichols, M.; Castillo, C.; Yang, Y.; Zema, D.A. The Use of Check Dams for Soil Restoration at Watershed Level: A Century of History and Perspectives. Sci. Total Environ. 2019, 692, 37–38. [Google Scholar] [CrossRef] [Green Version]
  86. Robinson, M.; Cognard-Plancq, A.-L.; Cosandey, C.; David, J.; Durand, P.; Führer, H.-W.; Hall, R.; Hendriques, M.O.; Marc, V.; McCarthy, R. Studies of the Impact of Forests on Peak Flows and Baseflows: A European Perspective. For. Ecol. Manag. 2003, 186, 85–97. [Google Scholar] [CrossRef]
  87. De Jong, C. European Perspectives on Forest Hydrology. In Forest Hydrology: Processes, Management and Assessment; Amatya, D., Williams, T., Bren, L., De Jong, C., Eds.; CABI: Wallingford, UK, 2016; pp. 69–87. [Google Scholar]
  88. Nichols, M.H.; Polyakov, V.O. The Impacts of Porous Rock Check Dams on a Semiarid Alluvial Fan. Sci. Total Environ. 2019, 664, 576–582. [Google Scholar] [CrossRef]
  89. Polyakov, V.O.; Nichols, M.H.; McClaran, M.P.; Nearing, M.A. Effect of Check Dams on Runoff, Sediment Yield, and Retention on Small Semiarid Watersheds. J. Soil Water Conserv. 2014, 69, 414–421. [Google Scholar] [CrossRef] [Green Version]
  90. Roshani, R. Evaluating the Effect of Check Dams on Flood Peaks to Optimize the Flood Control Measures (Kan Case Study in Iran). Master’s Thesis, Interntional Institute for Geo Information Science and Earth Observation, Enschede, The Netherland, 2003; 43p. [Google Scholar]
  91. Shi, P.; Zhang, Y.; Ren, Z.; Yu, Y.; Li, P.; Gong, J. Land-Use Changes and Check Dams Reducing Runoff and Sediment Yield on the Loess Plateau of China. Sci. Total Environ. 2019, 664, 984–994. [Google Scholar] [CrossRef]
  92. Lucas-Borja, M.E.; Zema, D.A.; Carrà, B.G.; Cerdà, A.; Plaza-Alvarez, P.A.; Cózar, J.S.; Gonzalez-Romero, J.; Moya, D.; de las Heras, J. Short-Term Changes in Infiltration between Straw Mulched and Non-Mulched Soils after Wildfire in Mediterranean Forest Ecosystems. Ecol. Eng. 2018, 122, 27–31. [Google Scholar] [CrossRef] [Green Version]
  93. Lenzi, M.A. Stream Bed Stabilization Using Boulder Check Dams That Mimic Step-Pool Morphology Features in Northern Italy. Geomorphology 2002, 45, 243–260. [Google Scholar] [CrossRef]
  94. Norman, L.M.; Brinkerhoff, F.; Gwilliam, E.; Guertin, D.P.; Callegary, J.; Goodrich, D.C.; Nagler, P.L.; Gray, F. Hydrologic Response of Streams Restored with Check Dams in the Chiricahua Mountains, Arizona. River Res. Appl. 2016, 32, 519–527. [Google Scholar] [CrossRef] [Green Version]
  95. Bai, P.; Liu, X.; Liang, K.; Liu, C. Investigation of Changes in the Annual Maximum Flood in the Yellow River Basin, China. Quat. Int. 2016, 392, 168–177. [Google Scholar] [CrossRef]
  96. Bull, L.J.; Kirkby, M.J.; Shannon, J.; Hooke, J.M. The Impact of Rainstorms on Floods in Ephemeral Channels in Southeast Spain. Catena 2000, 38, 191–209. [Google Scholar] [CrossRef]
  97. Verheijen, F.G.A.; Jones, R.J.A.; Rickson, R.J.; Smith, C.J. Tolerable versus Actual Soil Erosion Rates in Europe. Earth-Sci. Rev. 2009, 94, 23–38. [Google Scholar] [CrossRef] [Green Version]
  98. Bazzoffi, P. Soil Erosion Tolerance and Water Runoff Control: Minimum Environmental Standards. Reg. Environ. Chang. 2009, 9, 169–179. [Google Scholar] [CrossRef]
  99. Wischmeier, W.H.; Smith, D.D. Predicting Rainfall Erosion Losses: A Guide to Conservation Planning; Department of Agriculture, Science and Education Administration: Washington DC, USA, 1978. [Google Scholar]
  100. Nunes, J.P.; Seixas, J.; Keizer, J.J. Modeling the Response of Within-Storm Runoff and Erosion Dynamics to Climate Change in Two Mediterranean Watersheds: A Multi-Model, Multi-Scale Approach to Scenario Design and Analysis. Catena 2013, 102, 27–39. [Google Scholar] [CrossRef]
  101. Zaimes, G.N.; Tufekcioglu, M.; Schultz, R.C. Riparian Land-Use Impacts on Stream Bank and Gully Erosion in Agricultural Watersheds: What We Have Learned. Water 2019, 11, 1343. [Google Scholar] [CrossRef] [Green Version]
  102. D’Ippolito, A.; Calomino, F.; Alfonsi, G.; Lauria, A. Flow Resistance in Open Channel Due to Vegetation at Reach Scale: A Review. Water 2021, 13, 116. [Google Scholar] [CrossRef]
  103. Zema, D.A.; Bombino, G.; Boix-Fayos, C.; Tamburino, V.; Zimbone, S.M.; Fortugno, D. Evaluation and Modeling of Scouring and Sedimentation around Check Dams in a Mediterranean Torrent in Calabria, Italy. J. Soil Water Conserv. 2014, 69, 316–329. [Google Scholar] [CrossRef]
  104. Bombino, G.; Gurnell, A.M.; Tamburino, V.; Zema, D.A.; Zimbone, S.M. Adjustments in Channel Form, Sediment Calibre and Vegetation around Check-dams in the Headwater Reaches of Mountain Torrents, Calabria, Italy. Earth Surf. Process. Landf. 2009, 34, 1011–1021. [Google Scholar] [CrossRef]
  105. Bombino, G.; Gurnell, A.M.; Tamburino, V.; Zema, D.A.; Zimbone, S.M. Sediment Size Variation in Torrents with Check Dams: Effects on Riparian Vegetation. Ecol. Eng. 2008, 32, 166–177. [Google Scholar] [CrossRef]
  106. Conesa-García, C.; García-Lorenzo, R. Bed Scour-Sedimentation Balance Induced by Check Dams in Semiarid Catchments with Different Lithology. Check Dams, Morphological Adjustments and Erosion Control in Torrential Streams; Nova Science Publishers: New York, NY, USA, 2010; pp. 283–306. [Google Scholar]
  107. Shieh, C.-L.; Guh, Y.-R.; Wang, S.-Q. The Application of Range of Variability Approach to the Assessment of a Check Dam on Riverine Habitat Alteration. Environ. Geol. 2007, 52, 427–435. [Google Scholar] [CrossRef]
  108. Luo, P.; Zhou, M.; Deng, H.; Lyu, J.; Cao, W.; Takara, K.; Nover, D.; Geoffrey Schladow, S. Impact of Forest Maintenance on Water Shortages: Hydrologic Modeling and Effects of Climate Change. Sci. Total Environ. 2018, 615, 1355–1363. [Google Scholar] [CrossRef]
  109. Galia, T.; Škarpich, V.; Ruman, S. Impact of Check Dam Series on Coarse Sediment Connectivity. Geomorphology 2021, 377, 107595. [Google Scholar] [CrossRef]
  110. Conesa-García, C.; García-Lorenzo, R. Effectiveness of Check Dams in the Control of General Transitory Bed Scouring in Semiarid Catchment Areas (South-East Spain). Water Environ. J. 2009, 23, 1–14. [Google Scholar] [CrossRef]
Figure 1. Geographical location (left) and aerial map with the hydrographic network and check dam position (right) of the studied headwaters (Vacale, Serra, and Duverso torrents, Calabria, Southern Italy).
Water 14 02338 g001
Figure 2. Monthly patterns of precipitation and temperature for the meteorological station of Cittanova (Calabria, Southern Italy, data of the period 1924–2018, data source: ARPACAL).
Water 14 02338 g002
Figure 3. Land use ((A), Duverso, (B), Serra, and Vacale torrents, by photo-interpretation) and soil texture distribution ((C), Duverso, (D), Serra, and Vacale torrents, from the map by ARSSA, 2003) of the investigated subcatchments (Calabria, Southern Italy).
Water 14 02338 g003
Figure 4. Discretisation of the studied headwaters ((a) Duverso; (b), Vacale and Serra, Calabria, Southern Italy) in hydrological response units using the SWAT model.
Water 14 02338 g004aWater 14 02338 g004b
Figure 5. Scatterplot of the observed vs. simulated flow events in the Duverso torrent (Calabria, Southern Italy).
Water 14 02338 g005
Figure 6. Mean (a) and maximum (b) values of water flow rate simulated by the SWAT model in unregulated (Serra) and regulated (Vacale) subcatchments (Calabria, Southern Italy). All differences among land use, RCPs, and subcatchments are not significant after Tukey’s test at p < 0.05.
Water 14 02338 g006aWater 14 02338 g006b
Figure 7. Mean (a) and maximum (b) values of sediment yield simulated by the SWAT model in unregulated (Serra) and regulated (Vacale) subcatchments (Calabria, Southern Italy). All differences among land use, RCPs, and subcatchments are not significant after Tukey’s test at p < 0.05.
Water 14 02338 g007
Table 1. Main characteristics of the selected headwaters (Duverso, Serra, and Vacale torrents, Calabria, Southern Italy).
HeadwaterCharacteristics
Average Annual Air Temperature (°C)Average Annual Rainfall Depth (mm)Area (km2)Maximum Altitude
(m a.s.l.)
Minimum Altitude
(m a.s.l.)
Length of Main Stream (km)Longitudinal Slope (%)Number of Check DamsAverage Annual Discharge (m3 s−1)
Duverso16.7150312.56304505.2700.8
Serra
(without check dams)
16.3146714.66504006.660
Vacale
(with check dams)
16.3146711.36004004.7715
Table 2. Main dimensional characteristics of the 14 check dams in the Vacale headwater under investigation. (Calabria, Southern Italy).
Check Dam No.Distance from the Outlet (m)MaterialCurrent
Operational Condition
Altitude
(m a.s.l.)
Width (m)Height (m)
1 (m)688ConcreteFunctional364251.5
2 (m)1161MasonrySlightly damaged387252
3 (m)1734MasonrySlightly damaged410202
4 (m)2128MasonrySlightly damaged426202.5
5 (r)2397MasonrySlightly damaged437163
6 (r)2932MasonrySlightly damaged478200.5
7 (r)3323MasonrySlightly damaged501253
8 (r)3361ConcreteCovered by vegetation522301.5
9 (l)2661MasonryCovered by vegetation461552
10 (l)2672MasonryFunctional456202
11 (l)2689MasonryFunctional461202.5
12 (l)2979MasonrySlightly damaged463203
13 (l)3769ConcreteFunctional561102.5
14 (l)3894MasonryFunctional578302.5
15 (l)4060MasonryFunctional595153
Notes: (m)—main channel from the outlet upstream; (r)—right channel; (l)—left channel.
Table 3. Input (default and calibrated) parameters using SWAT-CUP procedure in SWAT model applied to Serra, Vacale, and Duverso torrents (Calabria, Southern Italy).
ParametersDefaultCalibratedNotes
v__CN2.mgt7753.3Initial SCS CN II value
v__ALPHA_BF.gw0.050.90Baseflow alpha factor [days]
v__GW_DELAY.gw31.019.8Groundwater delay [days]
v__GWQMN.gw1000763Threshold depth of water in the shallow aquifer required for return flow to occur [mm]
v__GW_REVAP.gw0.020.14Groundwater “revap” coefficient
v__ESCO.hru0.950.73Soil evaporation compensation factor
v__ESCO.bsn0.950.22Soil evaporation compensation factor
v__EPCO.bsn1.000.75Plant uptake compensation factor
v__EPCO.hru1.000.49Plant uptake compensation factor
v__CH_N2.rte0.010.21Manning’s n value for main channel
v__CH_K2.rte0.0023.7Effective hydraulic conductivity [mm/h]
v__SOL_AWC().sol0.080.40Ave. AW Incl. Rock Frag
v__SOL_BD().sol1.732.40Bulk Density Moist [g/cc]
v__SOL_K().sol84.41715Ksat. (est.) [mm/h]
v__REVAPMN.gw750323Threshold depth of water in the shallow aquifer for “revap” to occur [mm]
v__OV_N.hru0.148.87Manning’s “n” value for overland flow
v__RCHRG_DP.gw0.050.05Deep aquifer percolation fraction
v__CANMX.hru0.0013.44Maximum canopy storage [mm]
v__SURLAG.bsn4.0015.49Surface runoff lag time [days]
v__SLSUBBSN.hru15.238.4Average slope length [m]
v__LAT_TTIME.hru0.0028.8Lateral flow travel time [days]
v__GWHT.gw1.004.22Initial groundwater height [m]
v__CH_K1.sub0.000.29Effective hydraulic conductivity in tributary channel [mm/h]
v__CH_N1.sub0.0113.7Manning’s “n” value for the tributary channels
v__FFCB.bsn0.001.00Initial soil water storage expressed as a fraction of field capacity water content
v__MSK_CO1.bsn0.756.72Calibration coefficient used to control impact of the storage time constant (Km) for normal flow
Note: bold characters highlight the most sensitive input parameters at p < 0.05.
Publisher’s Note: MDPI stays neutral with regard to jurisdictional claims in published maps and institutional affiliations.

