Article

Molecular Insights into Factors Affecting the Generation Behaviors, Dynamic Properties, and Interfacial Structures of Methane Gas Bubbles

1
Beijing International Center for Gas Hydrate, School of Earth and Space Sciences, Peking University, Beijing 100871, China
2
Julong College, Shenzhen Technology University, Shenzhen 518118, China
3
College of Engineering, Peking University, Beijing 100871, China
4
MLR Key Laboratory of Marine Mineral Resources, Guangzhou Marine Geological Survey, Ministry of Land and Resources, Guangzhou 510075, China
*
Authors to whom correspondence should be addressed.
Water 2022, 14(15), 2327; https://doi.org/10.3390/w14152327
Submission received: 3 July 2022 / Revised: 24 July 2022 / Accepted: 25 July 2022 / Published: 27 July 2022
(This article belongs to the Special Issue Gas Hydrates in Marine Environments)

Abstract

:
Molecular dynamics simulations were performed to study the effects of temperatures, pressures, and methane mole fractions on the generation behaviors, dynamic properties, and interfacial structures of methane gas bubbles. Methane gas bubbling can be promoted by high temperatures and high mole fractions of methane, which come from the generation of larger methane clusters in solution. Bubbles were found to be highly dynamic, with more methane molecules exchanging between bubbles and the surrounding solution at high pressures and in systems with high mole fractions of methane. The interfacial structures between bubbles and the surrounding solution were rough at a molecular level, and the roughness of the outermost methane and water molecules was high at high temperatures, low pressures, and in systems with high methane mole fractions. The dissolution of methane molecules depended on the interactions between the outermost methane and water molecules, which would become stronger with decreasing temperatures, increasing pressures, and decreasing methane mole fractions. The results obtained can help in understanding both the generation behaviors of bubbles when gas hydrates decompose and the re-nucleation behaviors of gas hydrates in the presence of bubbles.

1. Introduction

Gas hydrates are ice-like crystalline solids formed by water molecules and wrapped guest molecules under high pressures and low temperatures [1]. They can also be called methane hydrates when the guest molecules are methane. With vast reserves, high energy density, and relatively low carbon dioxide production, gas hydrates have been regarded as important energy resources [1,2], and they have been a hot topic in the last several decades.
Efforts have been put into studying the processes related to hydrates by using experimental [3,4,5,6,7,8,9,10] and theoretical methods [11,12,13,14,15,16,17], and the results demonstrated the great impacts of gas bubbles on the nucleation, growth, and decomposition of the hydrates. The presence of micro- and nano-bubbles can shorten the induction time for hydrate nucleation and accelerate the growth rate of gas hydrates, which can be attributed to the provision of gas sources and high Laplace pressures [7,9,10,13,17]. The mole fraction of methane in hydrates is about 0.148, which is much higher than that in saturated methane solution [1,18,19]. With the high mole fraction of methane, the decomposition of methane hydrates leads to the formation of a supersaturated methane solution, in which bubbles can be generated [8,20]. The bubbles that are formed can, in turn, affect the decomposition process of hydrates. On one hand, bubbles can promote the decomposition of hydrates by enhancing the mass transfer of methane molecules and decreasing the methane concentrations in the solution [17,21]. On the other hand, bubbles at the decomposition interface of hydrates will inhibit the process of heat transfer, which is not conducive to the decomposition of hydrates [22]. In addition, large numbers of micro- and nano-bubbles will exist in the solution after the hydrates decompose, and they play an important role in accelerating the re-nucleation of hydrates [7,23].
Given the importance of bubbles in hydrate systems, efforts have been made to study the properties of gas bubbles, such as their generation behaviors [20,21,24,25,26,27] and dynamic properties [27]. Molecular dynamics (MD) simulations have been frequently used to investigate the mechanism at the molecular scale [11,12,13,14,15,16,17,20,21,24,28,29]. Methane concentrations in solution will continuously increase with the decomposition of methane hydrates. Therefore, methane bubbles can be formed as the hydrates decompose [20,21,24]. The addition of ethanol and sodium chloride can promote the formation of bubbles in the process of hydrate decomposition [24]. The nucleation mechanism and evolution characteristics of methane bubbles are also found depending on the temperatures for hydrate decomposition [20]. Methane bubbles in systems with small mole fractions of methane are unstable and will decompose in a short time. However, the addition of carbon dioxide [25], a mixed gas of carbon dioxide and nitrogen [26], sodium chloride [27], and methanol [27] can benefit the stabilization of methane bubbles. In addition, the dynamic properties of bubbles have been evaluated by calculating the number of methane molecules exchanged between bubbles and the surrounding solution [27]. Bubbles are less dynamic with higher concentrations of thermodynamic hydrate inhibitors and larger bubble sizes, which are correlated with the solubility of methane in solution and the Laplace pressures of the bubbles [27]. The generation behaviors and dynamic properties of bubbles are important for the decomposition and re-nucleation of gas hydrates. However, there is still a lack of research on the effects of temperatures, pressures, and mole fractions of methane on them.
The interfacial structures between the gas and the solution can be a key issue for the dissolution of gas molecules [30,31,32], which is significant for the formation of gas hydrates. Gas molecules can be adsorbed, and they form a thin film on the surface of the solution; some of them can enter into the bulk of the solution [30,31,32]. In many studies, the interface refers to the narrow region in which the density changes from the value in one phase to that in the other [25,26,33,34], and it can be affected by the composition of the gas [25,26,33] and the solute [34] in the solution. However, the interface is rough at the molecular level, and it cannot be described well by only the density profiles [35,36,37,38,39,40]. Therefore, some efforts have been put into studying the outermost molecular layers on the surfaces of solutions [35,36,37,38,39,40]. In such studies, methane molecules are generally treated as isolated molecules, adsorbing onto the surface of the solution [35,36,37,38,39,40]. In bubbles with small radii, methane molecules can be in the supercritical state because of the high Laplace pressures. Therefore, methane in bubbles with small radii can be treated as a kind of liquid, and the outermost methane and water molecules in the interface can both affect the dissolution of methane molecules. However, studies on the interfacial molecular structures between methane gas bubbles and the surrounding solution are currently lacking.
The decomposition and re-nucleation of gas hydrates can be affected by the generation behaviors, dynamic properties, and interfacial structures of methane gas bubbles. However, the effects of the surrounding conditions on them are still unclear on the molecular scale, including the temperature, pressure, and mole fraction of methane (Xmethane). In this work, MD simulations were performed to study the process of methane gas bubbling in systems with different Xmethane values of 0.037 to 0.065 mole fractions at temperatures of 293.15 to 313.15 K and pressures of 5 to 18 MPa. The generation behaviors, dynamic properties, and interfacial structures of methane gas bubbles were studied to investigate the effects of temperatures, pressures, and Xmethane.

2. Models and Methods

In the simulations, a mixture of methane and water molecules were randomly placed in a 6.1 nm × 6.1 nm × 6.1 nm cubic box. Six systems with different Xmethane values ranging from 0.037 to 0.065 were investigated; the numbers of methane and water molecules (Nmethane, Nwater) are given in Table 1. Saturated methane concentrations in aqueous solution had a mole fraction of about 0.003 under similar thermodynamic conditions [18,19]. Therefore, the six systems were all methane-supersaturated aqueous solutions. Five independent simulations were carried out for each system, with pressures of 5, 8, 12, 15, and 18 MPa. After energy minimization was performed, each system was relaxed via a 20 ns isobaric–isothermal (NPT) simulation at 288.15 K and the setting pressure to ensure that no bubbles appeared. The structures obtained were used as the initial configurations for the next steps. After an additional 1 ns equilibrium simulation, the temperature was raised to 293.15 K at a rate of 5 K/ns in 1 ns, and then it was kept stable for 50 ns. After that, the temperature was raised step by step at a rate of 5 K/ns and kept for 50 ns at 298.15, 303.15, 308.15, and 313.15 K.
The TIP4P-ice model [41] and TraPPE model [42] were used for the water and methane molecules, respectively. The SETTLE algorithm [43] was used to constrain the rigid geometry of the water molecules. The Lennard–Jones potentials between different atoms were calculated with the standard Lorentz–Berthelot rules. Equations of motion were integrated with a time step of 2 fs. Periodic boundary conditions were applied in all three Cartesian directions [44]. A V-rescale thermostat [45] and Berendsen barostat [46] were used to adjust the temperature and pressure with time constants of 0.2 and 2.0 ps, respectively. The van der Waals interactions were calculated with a cutoff of 1.2 nm, and the electrostatic interactions were calculated with the Fast Smooth Particle–Mesh–Ewald method [47]. All of the simulations were performed in GROMACS 2019.3 [48].

3. Results and Discussion

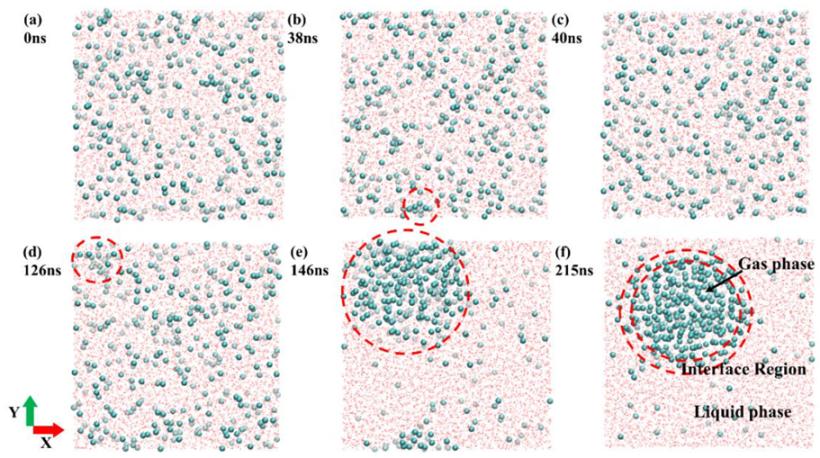
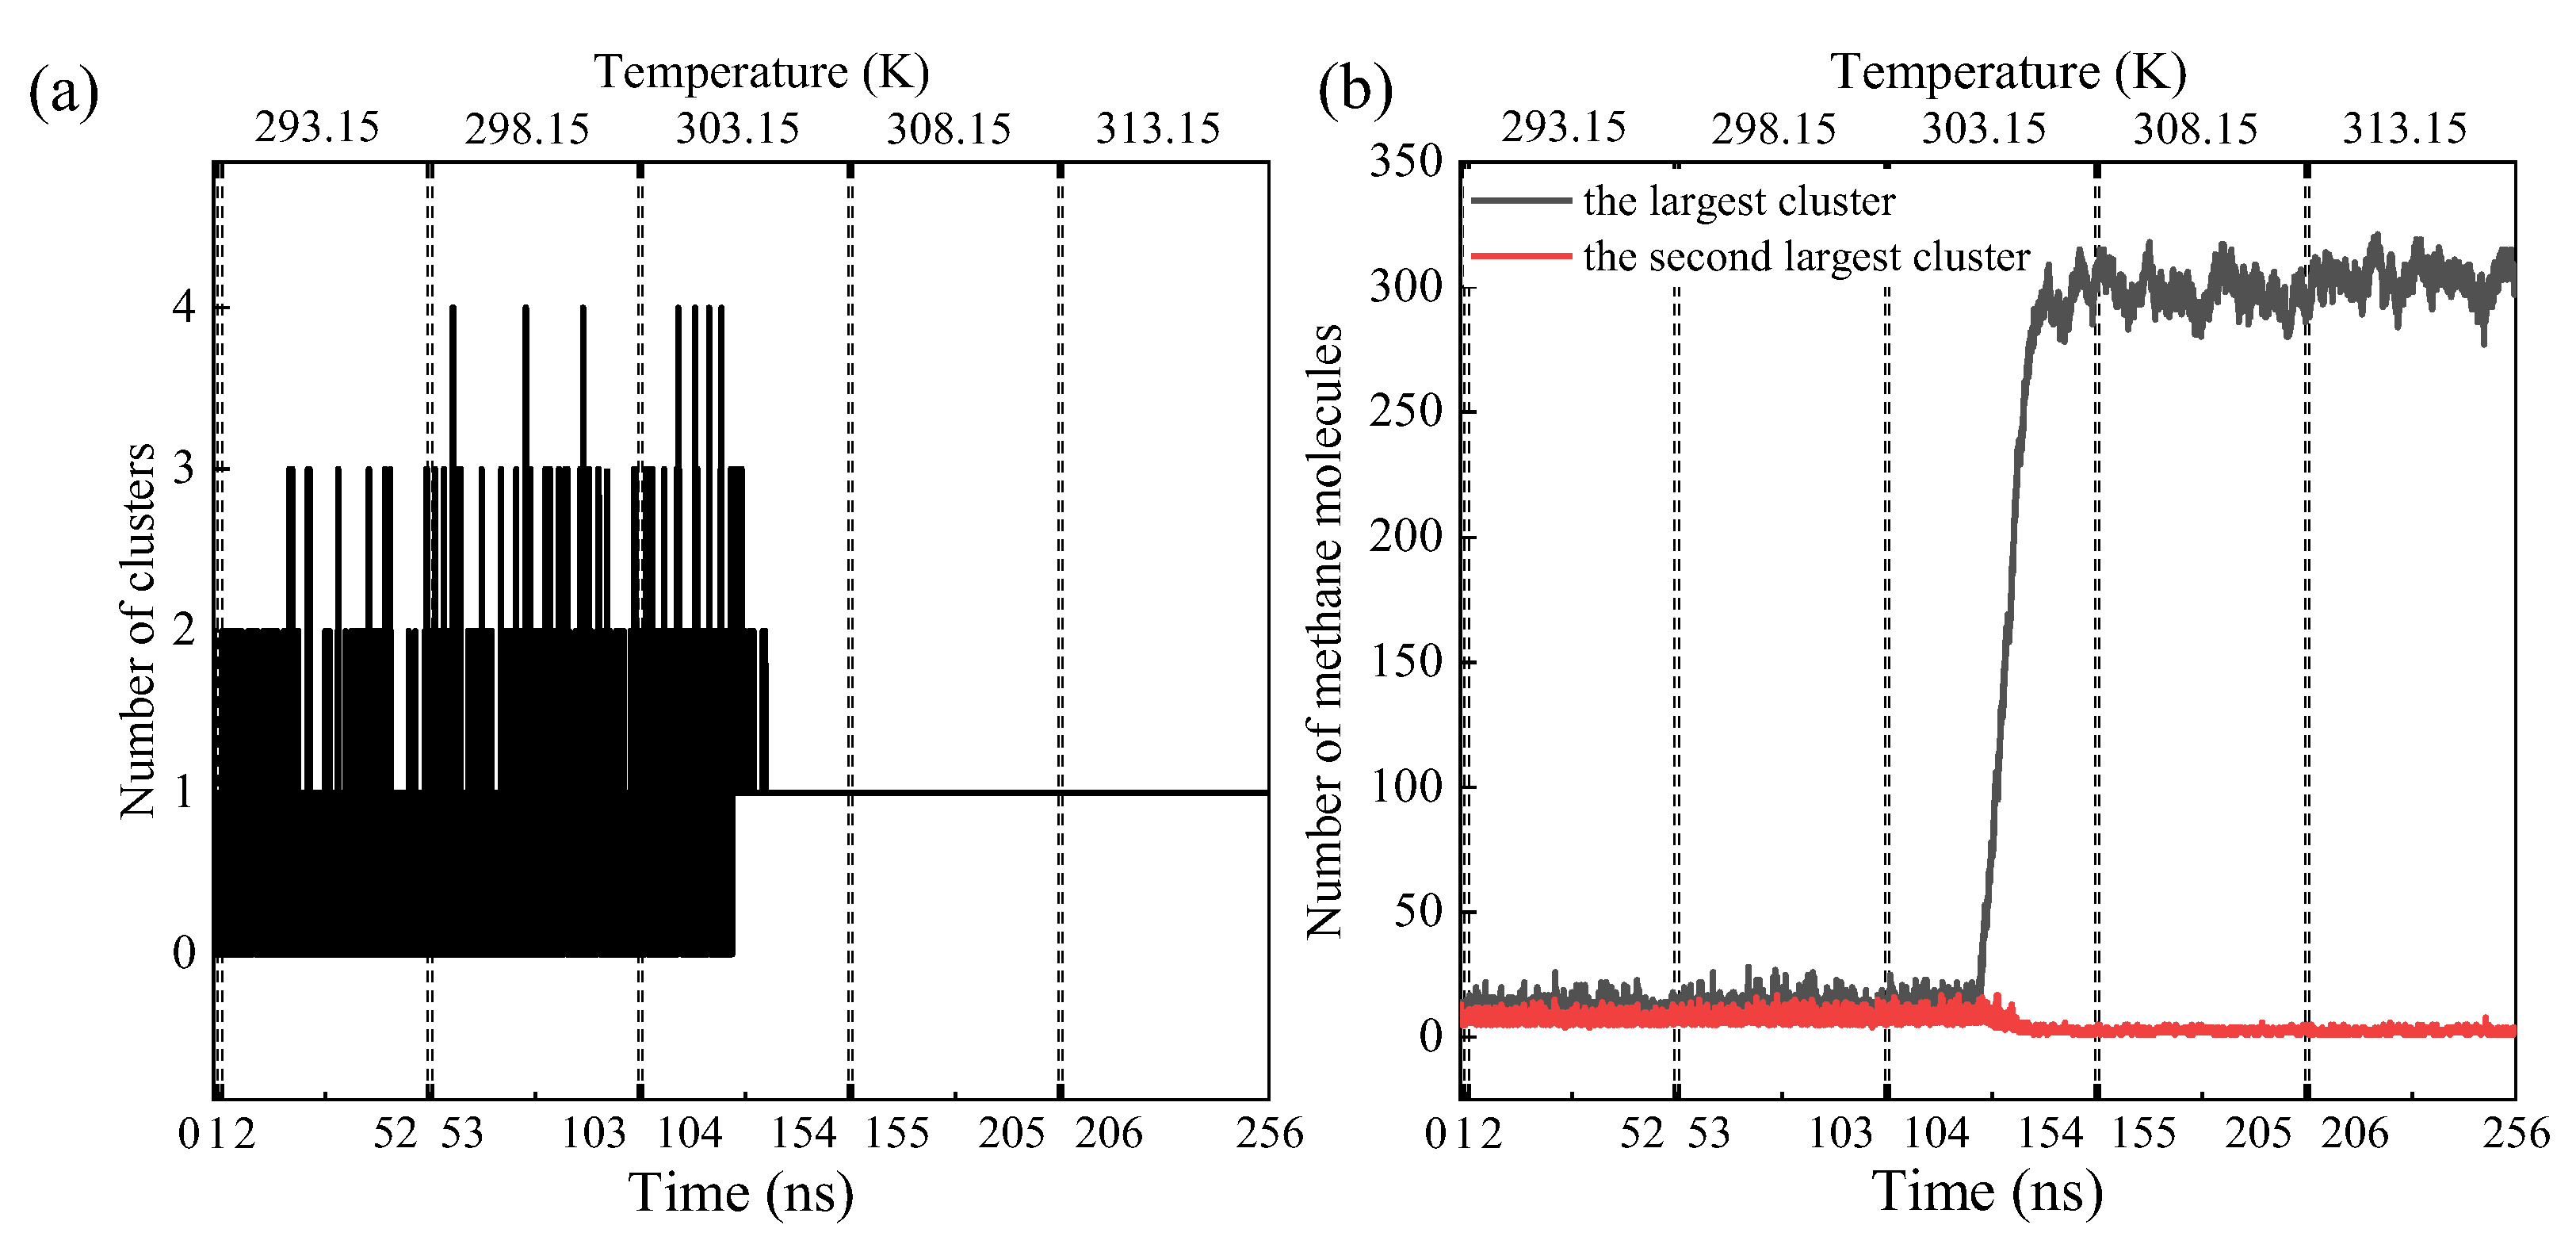
3.1. Methane Gas Bubbling in a Supersaturated Aqueous Solution

As shown in Figure 1, Sys3_5MPa was taken as an example to characterize the process of methane gas bubbling. After 20 ns of relaxation simulation at 288.15 K and 5 MPa, the initial configuration of Sys3_5MPa was still in a state of methane supersaturation (Figure 1a). As the simulation proceeded, the methane molecules collided with each other. Methane clusters containing small numbers of methane molecules were frequently formed (Figure 1b), but quickly decomposed (Figure 1c). When the temperature was raised to 303.15 K, the system remained supersaturated in the first 22 ns (from 104 to 126 ns). A methane cluster was then generated, formed by a large number of methane molecules (Figure 1d). This methane cluster grew further into a gas bubble with the addition of dissolved methane molecules (Figure 1e). The shape of the bubble was subject to change, with the system being in two phases consisting of bubbles and the solution (Figure 1f). As a result, a methane bubble was found to be formed at 303.15 K in the time interval of 104 to 154 ns in the simulation.
The number of methane molecules (Nmethane) in the gas bubble is one of the key parameters for describing the bubble formation process, as reported in many previous studies, with the definition of gas molecules varying among researchers [20,21,23,25,49]. In the cluster analysis method, two methane molecules with a distance less than the cutoff length are classified as being in the same cluster [49]. In the following, a cutoff length of 0.53 nm was chosen to monitor the evolution of methane clusters in the simulation (Figure 2). Although several methane clusters with Nmethane values larger than 10 were recognized in the methane-supersaturated aqueous solution at the same time, only one was found to grow into a methane gas bubble (Figure 2a). Methane clusters with small Nmethane values were alternatively formed and decomposed until 126 ns. The Nmethane value in the largest methane cluster continuously increased in the time interval of 126 to 140 ns, suggesting that a methane gas bubble formed and grew with the addition of dissolved methane molecules. However, the Nmethane value in the second largest methane cluster decreased. After the bubble was formed at around 140 ns, the Nmethane value in the largest methane cluster fluctuated, while that in the second largest methane cluster remained at a level of less than 10 (Figure 2b). The results obtained indicated that only one methane gas bubble was formed in Sys3_5MPa at 303.15 K, and the Nmethane value in the largest methane cluster could be used to describe the process of bubble formation. The cutoff length (0.53 nm) was selected as the first minimum of the radial distribution function (RDF) between the methane molecules in the solution. Time evolutions of the Nmethane value with different cutoff lengths in the largest methane cluster were also obtained (Figure S1). When the cutoff length was in the range of 0.45 to 0.6 nm, the bubble formation process could be readily captured. Otherwise, dissolved methane molecules were identified as being in a cluster with a large cutoff length by mistake, while methane molecules in the same cluster could be wrongly recognized as belonging to different clusters with a small cutoff length.

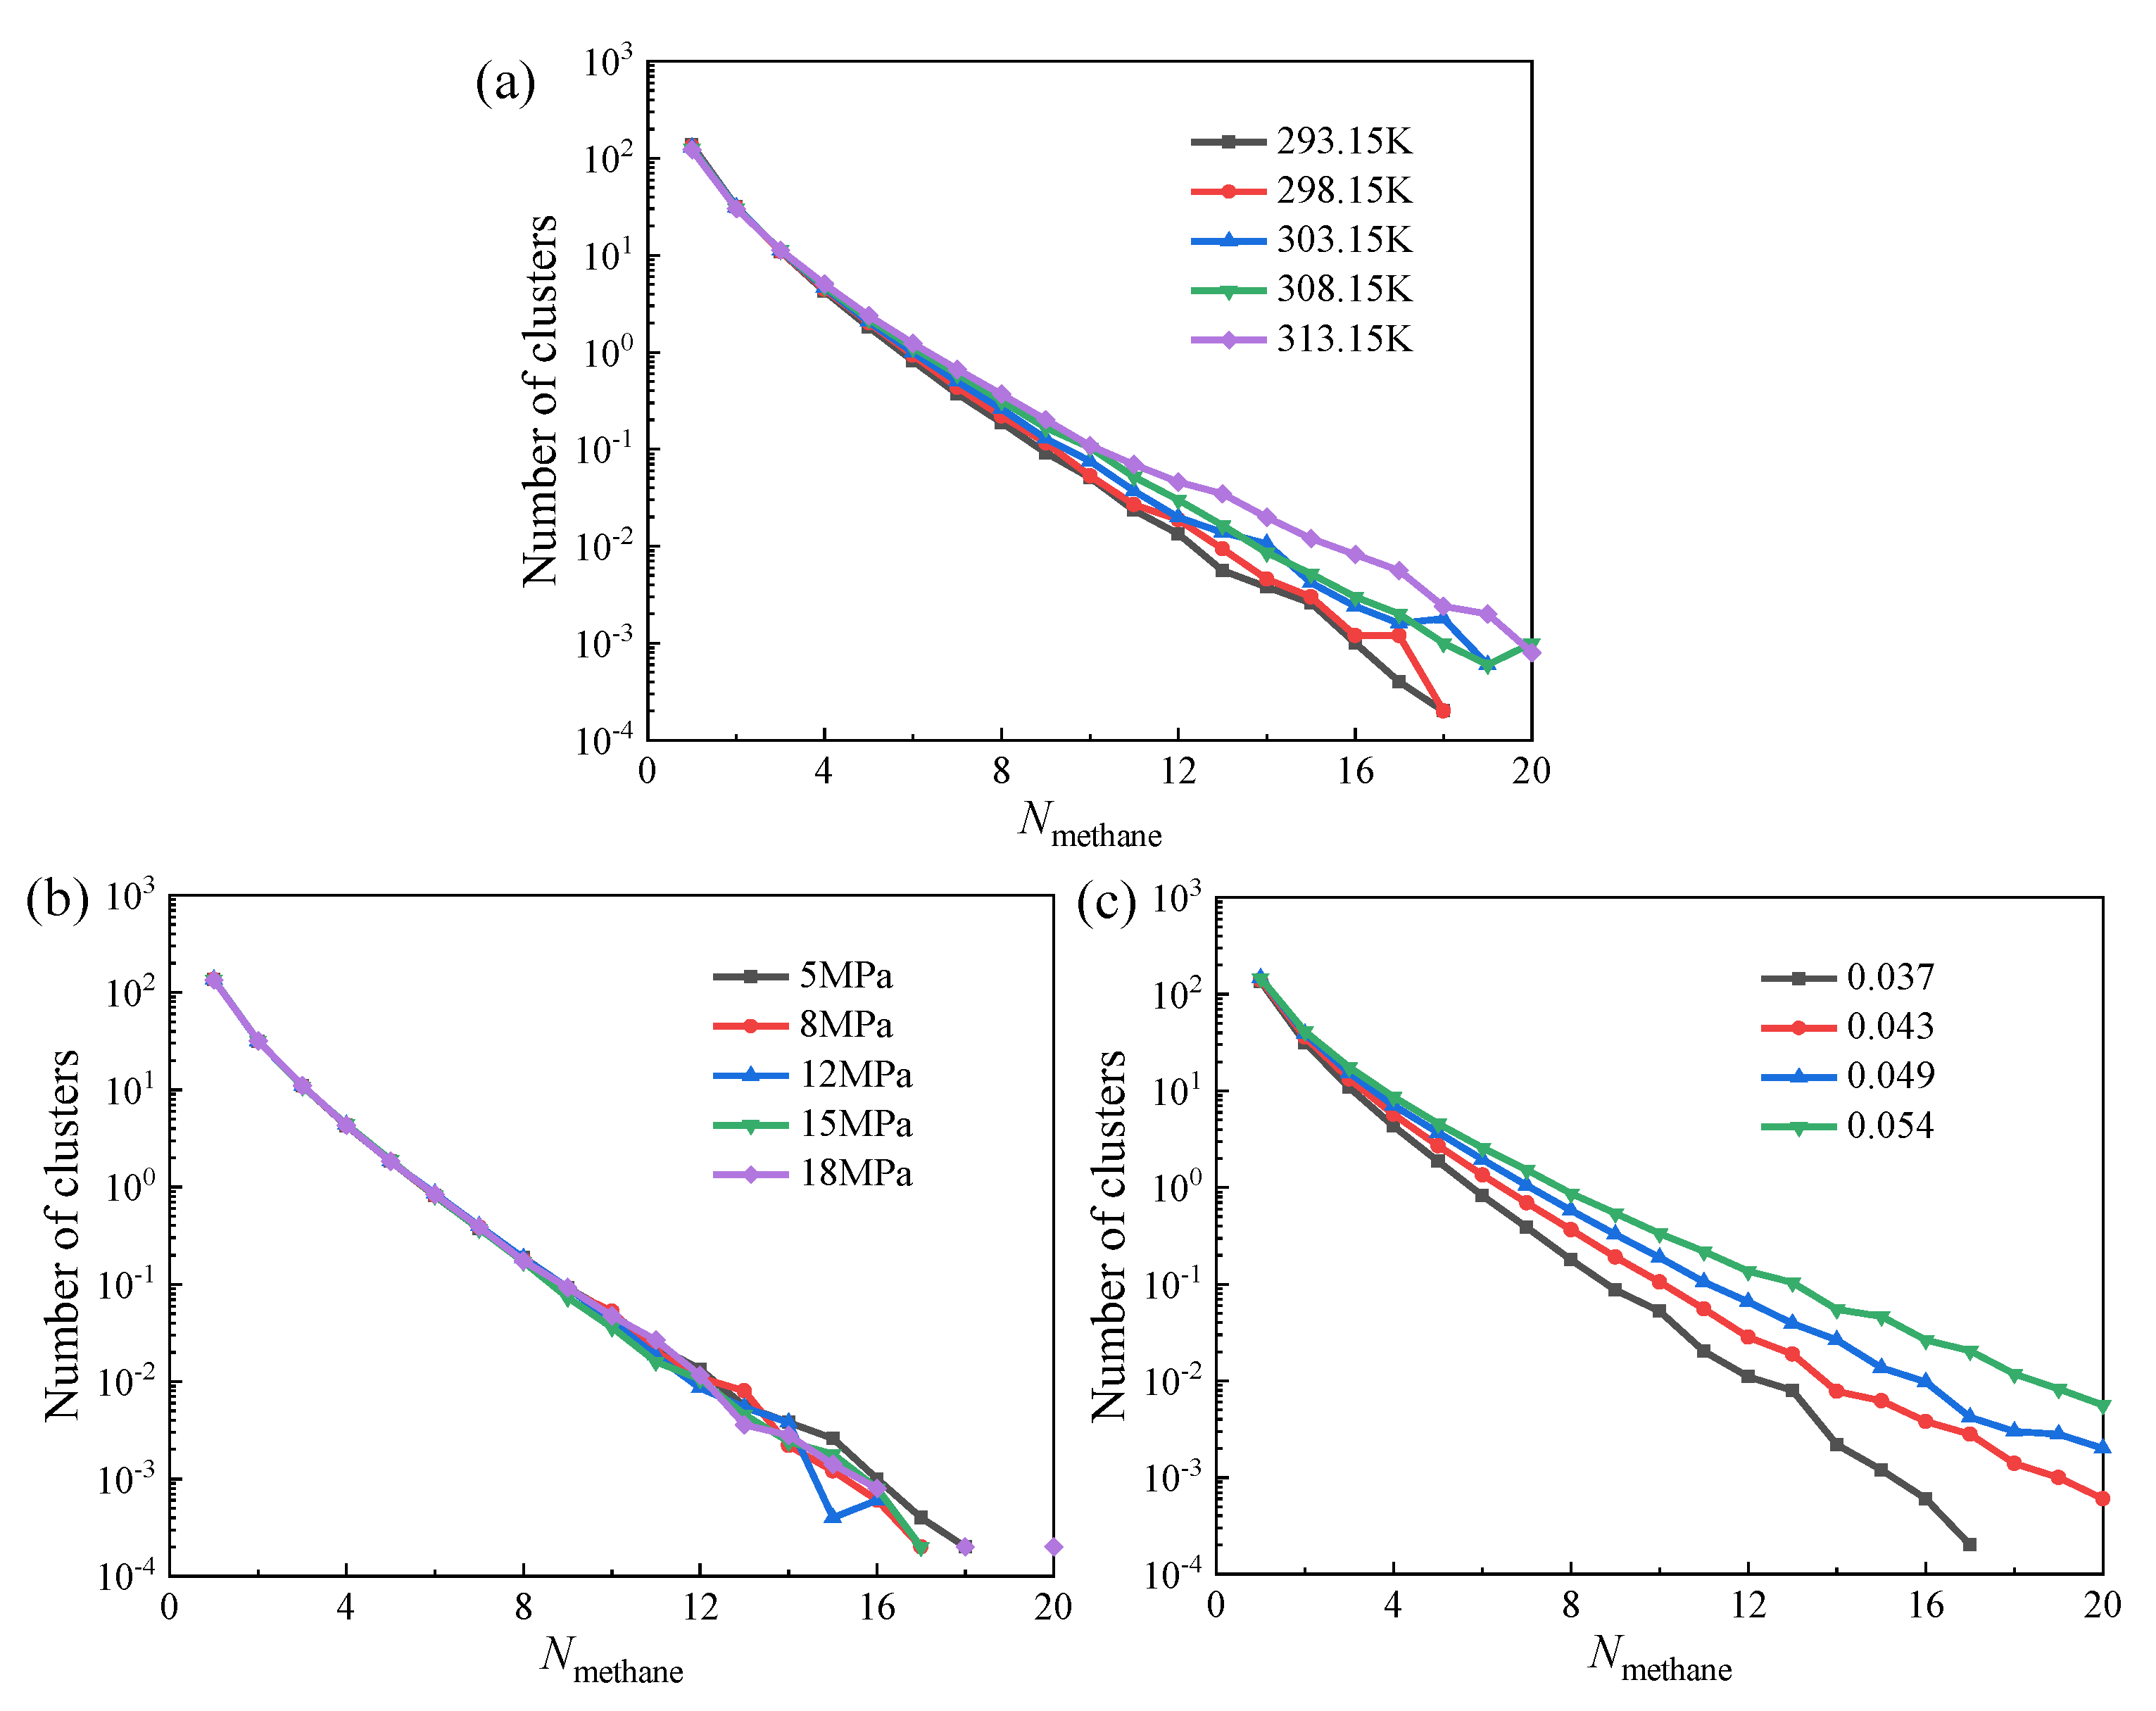
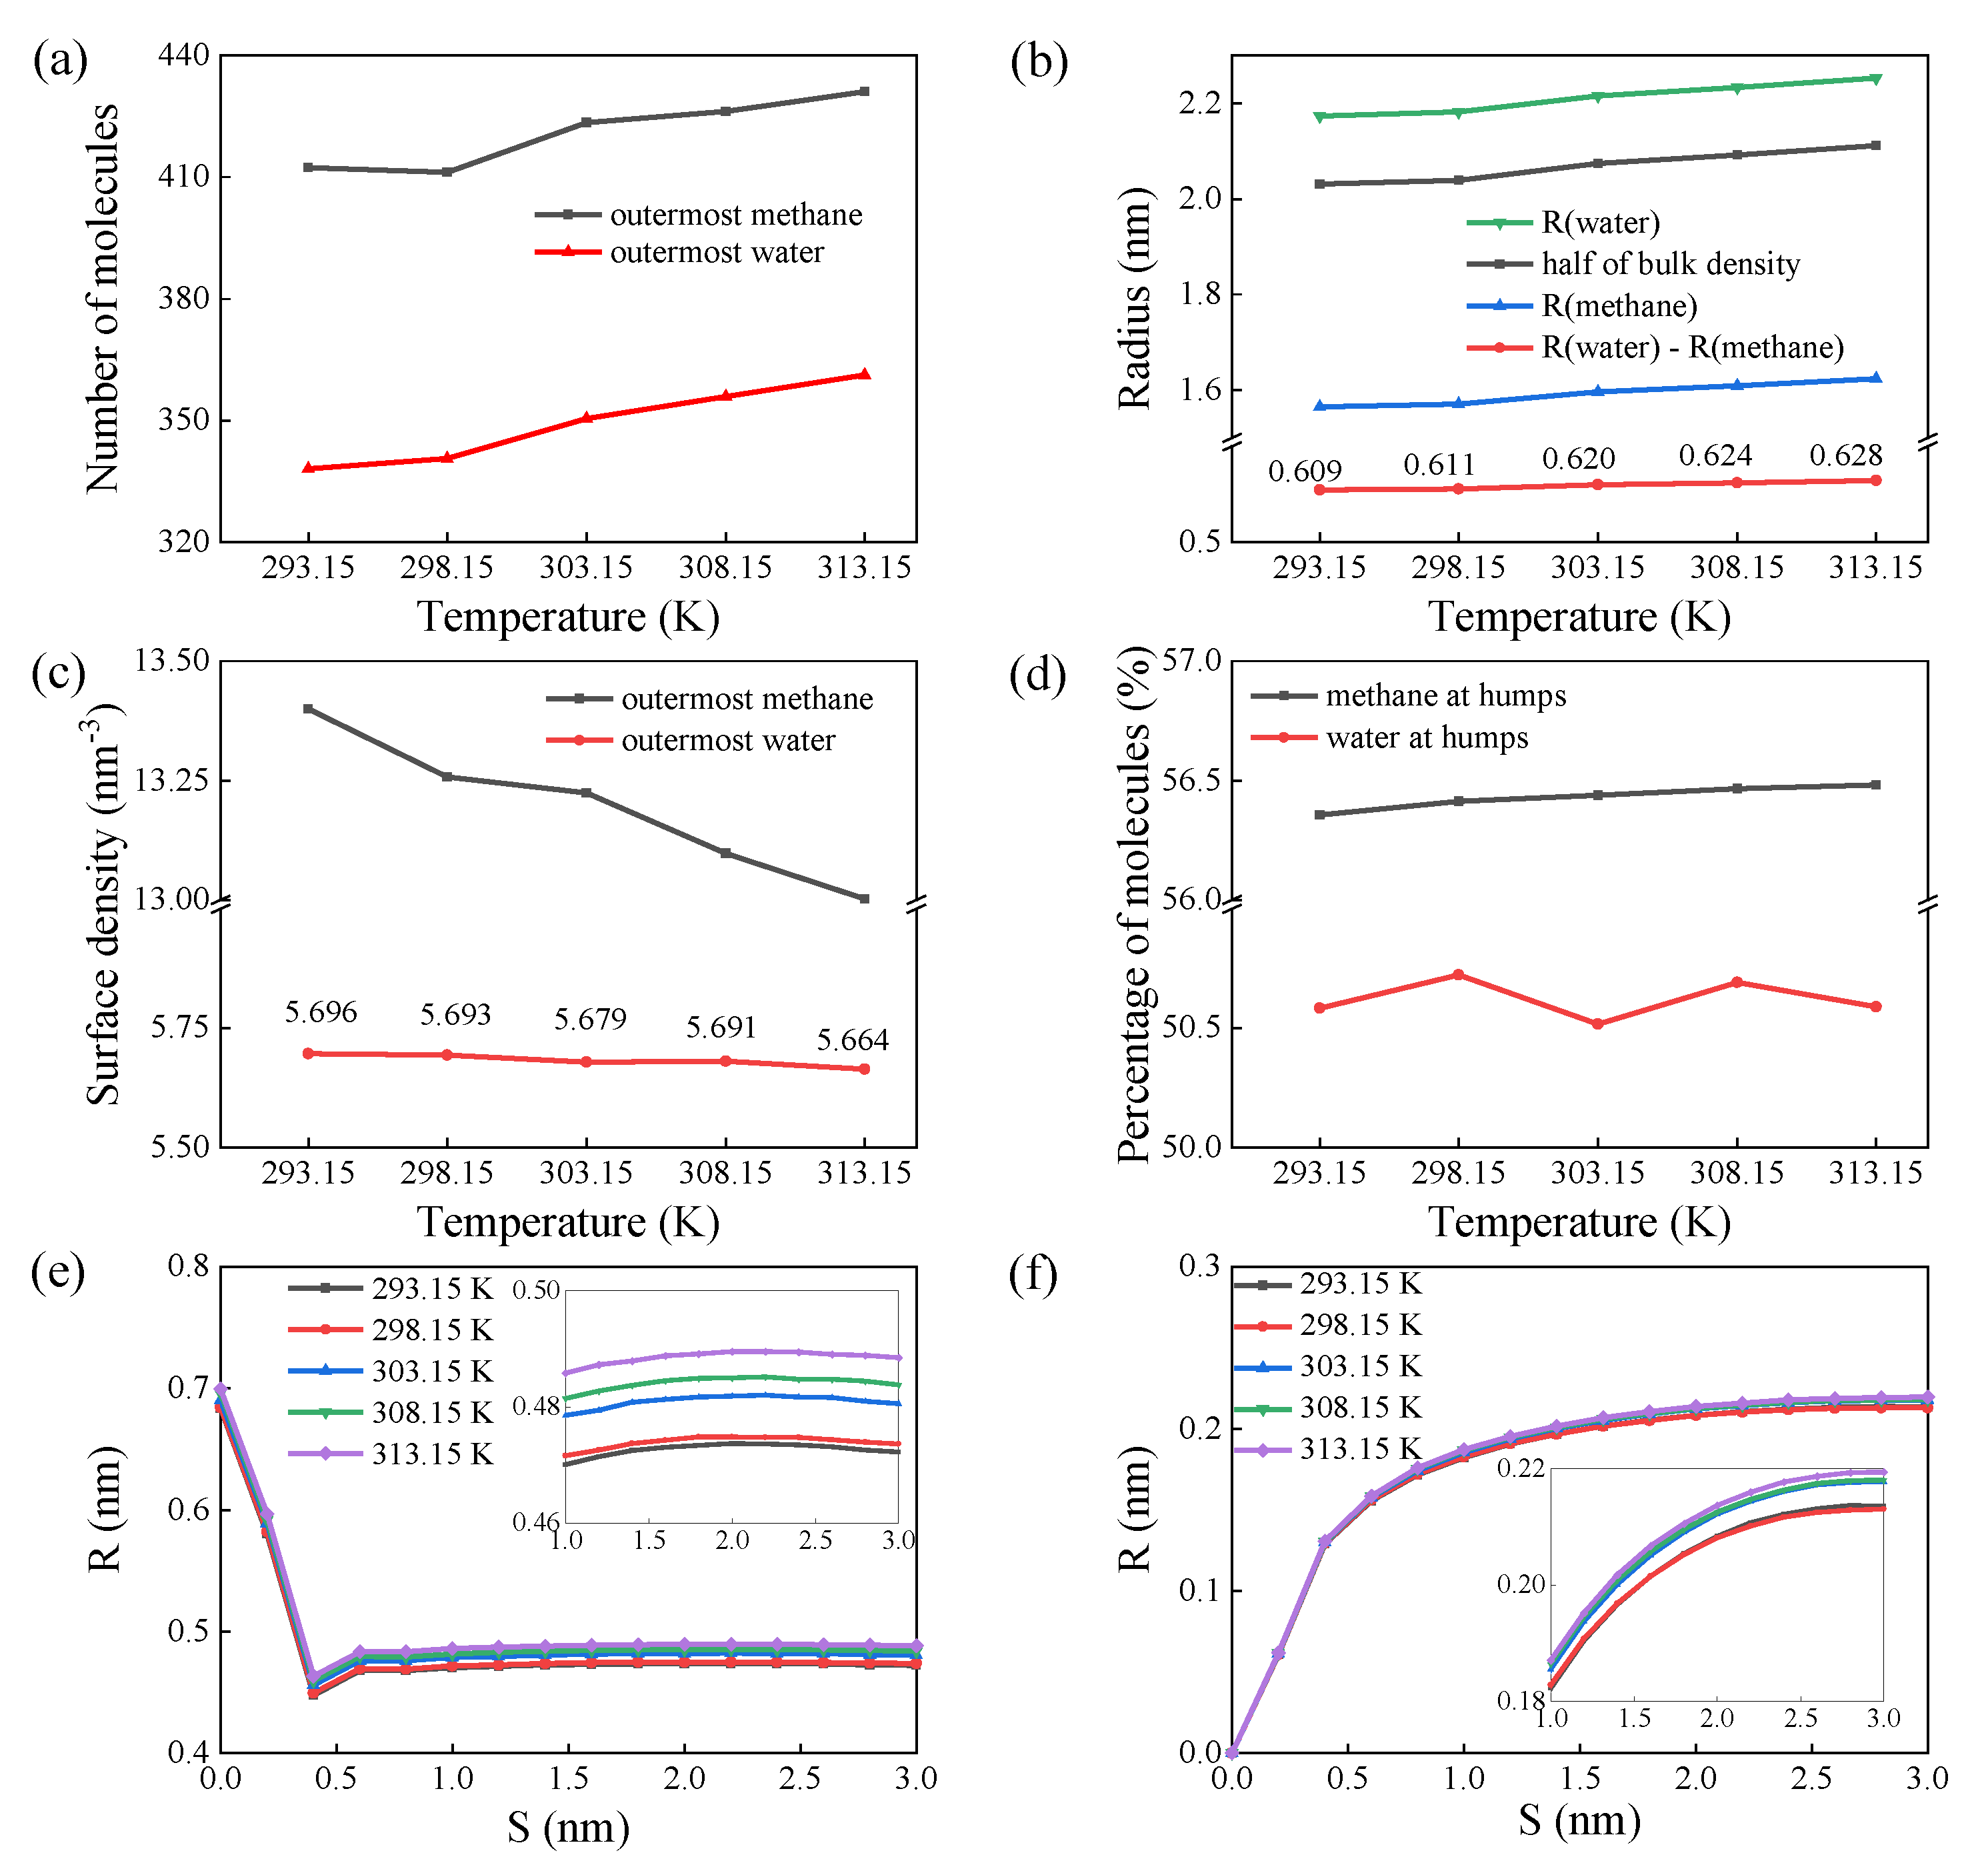
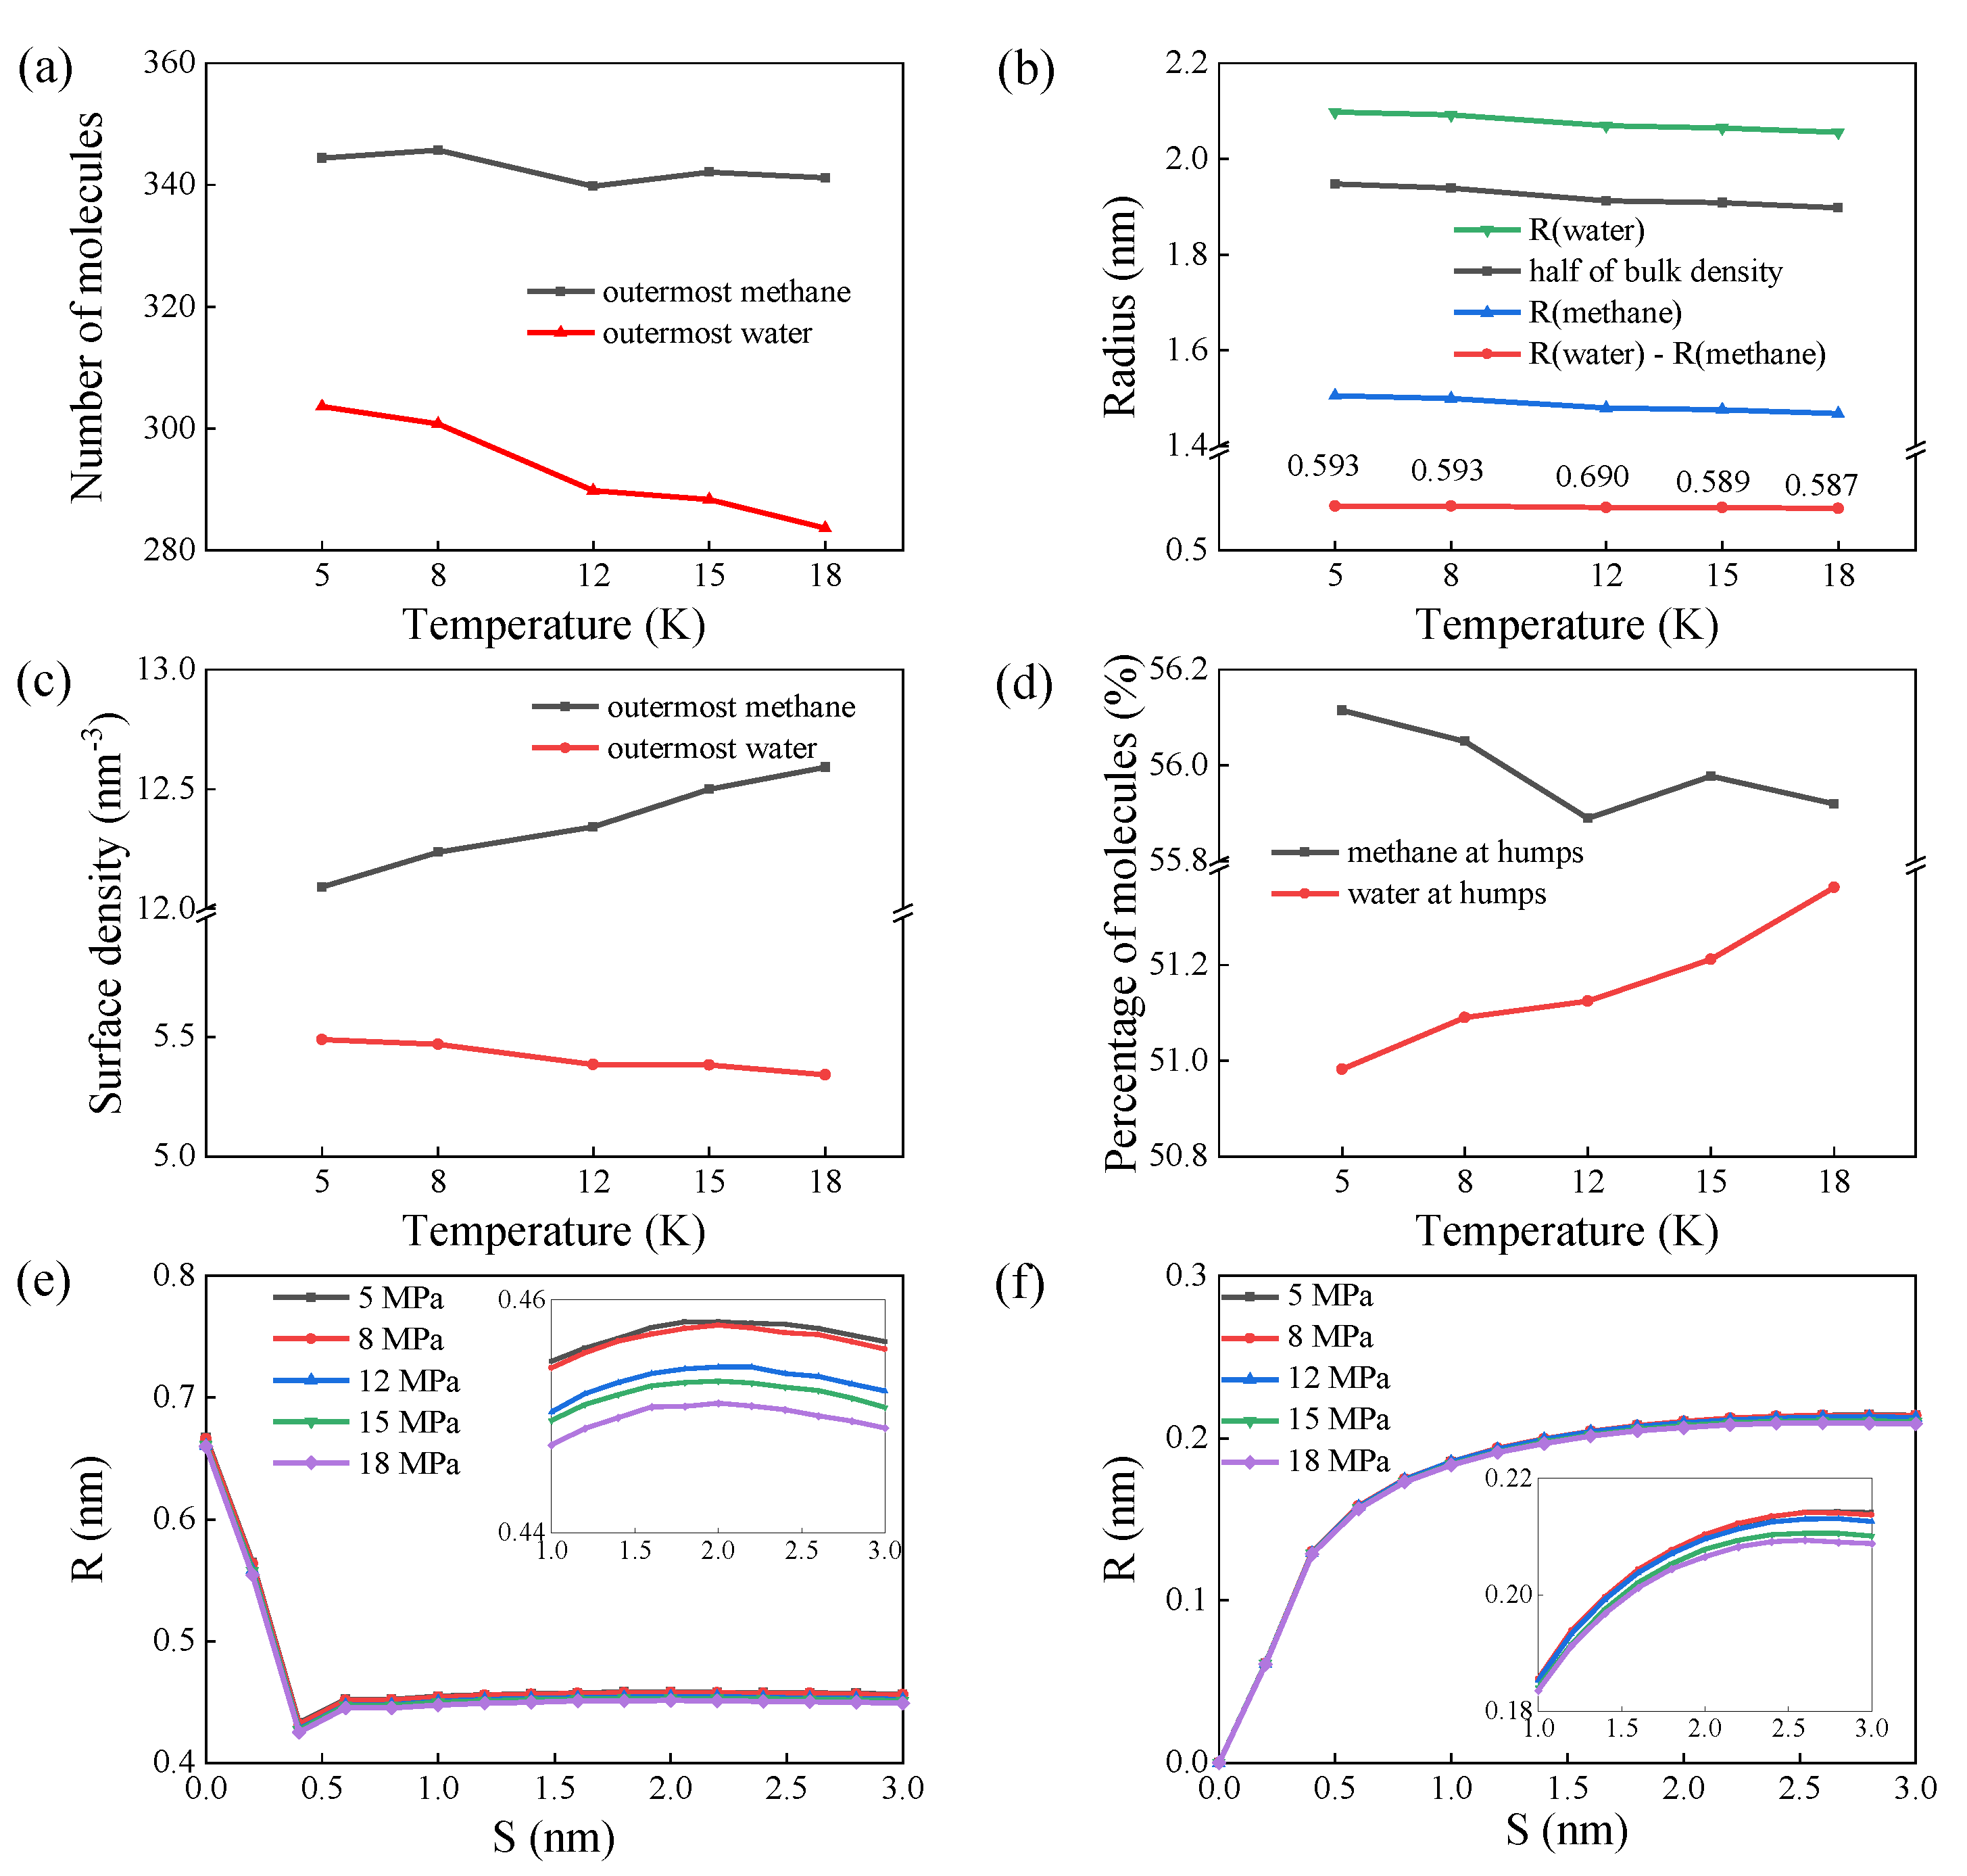
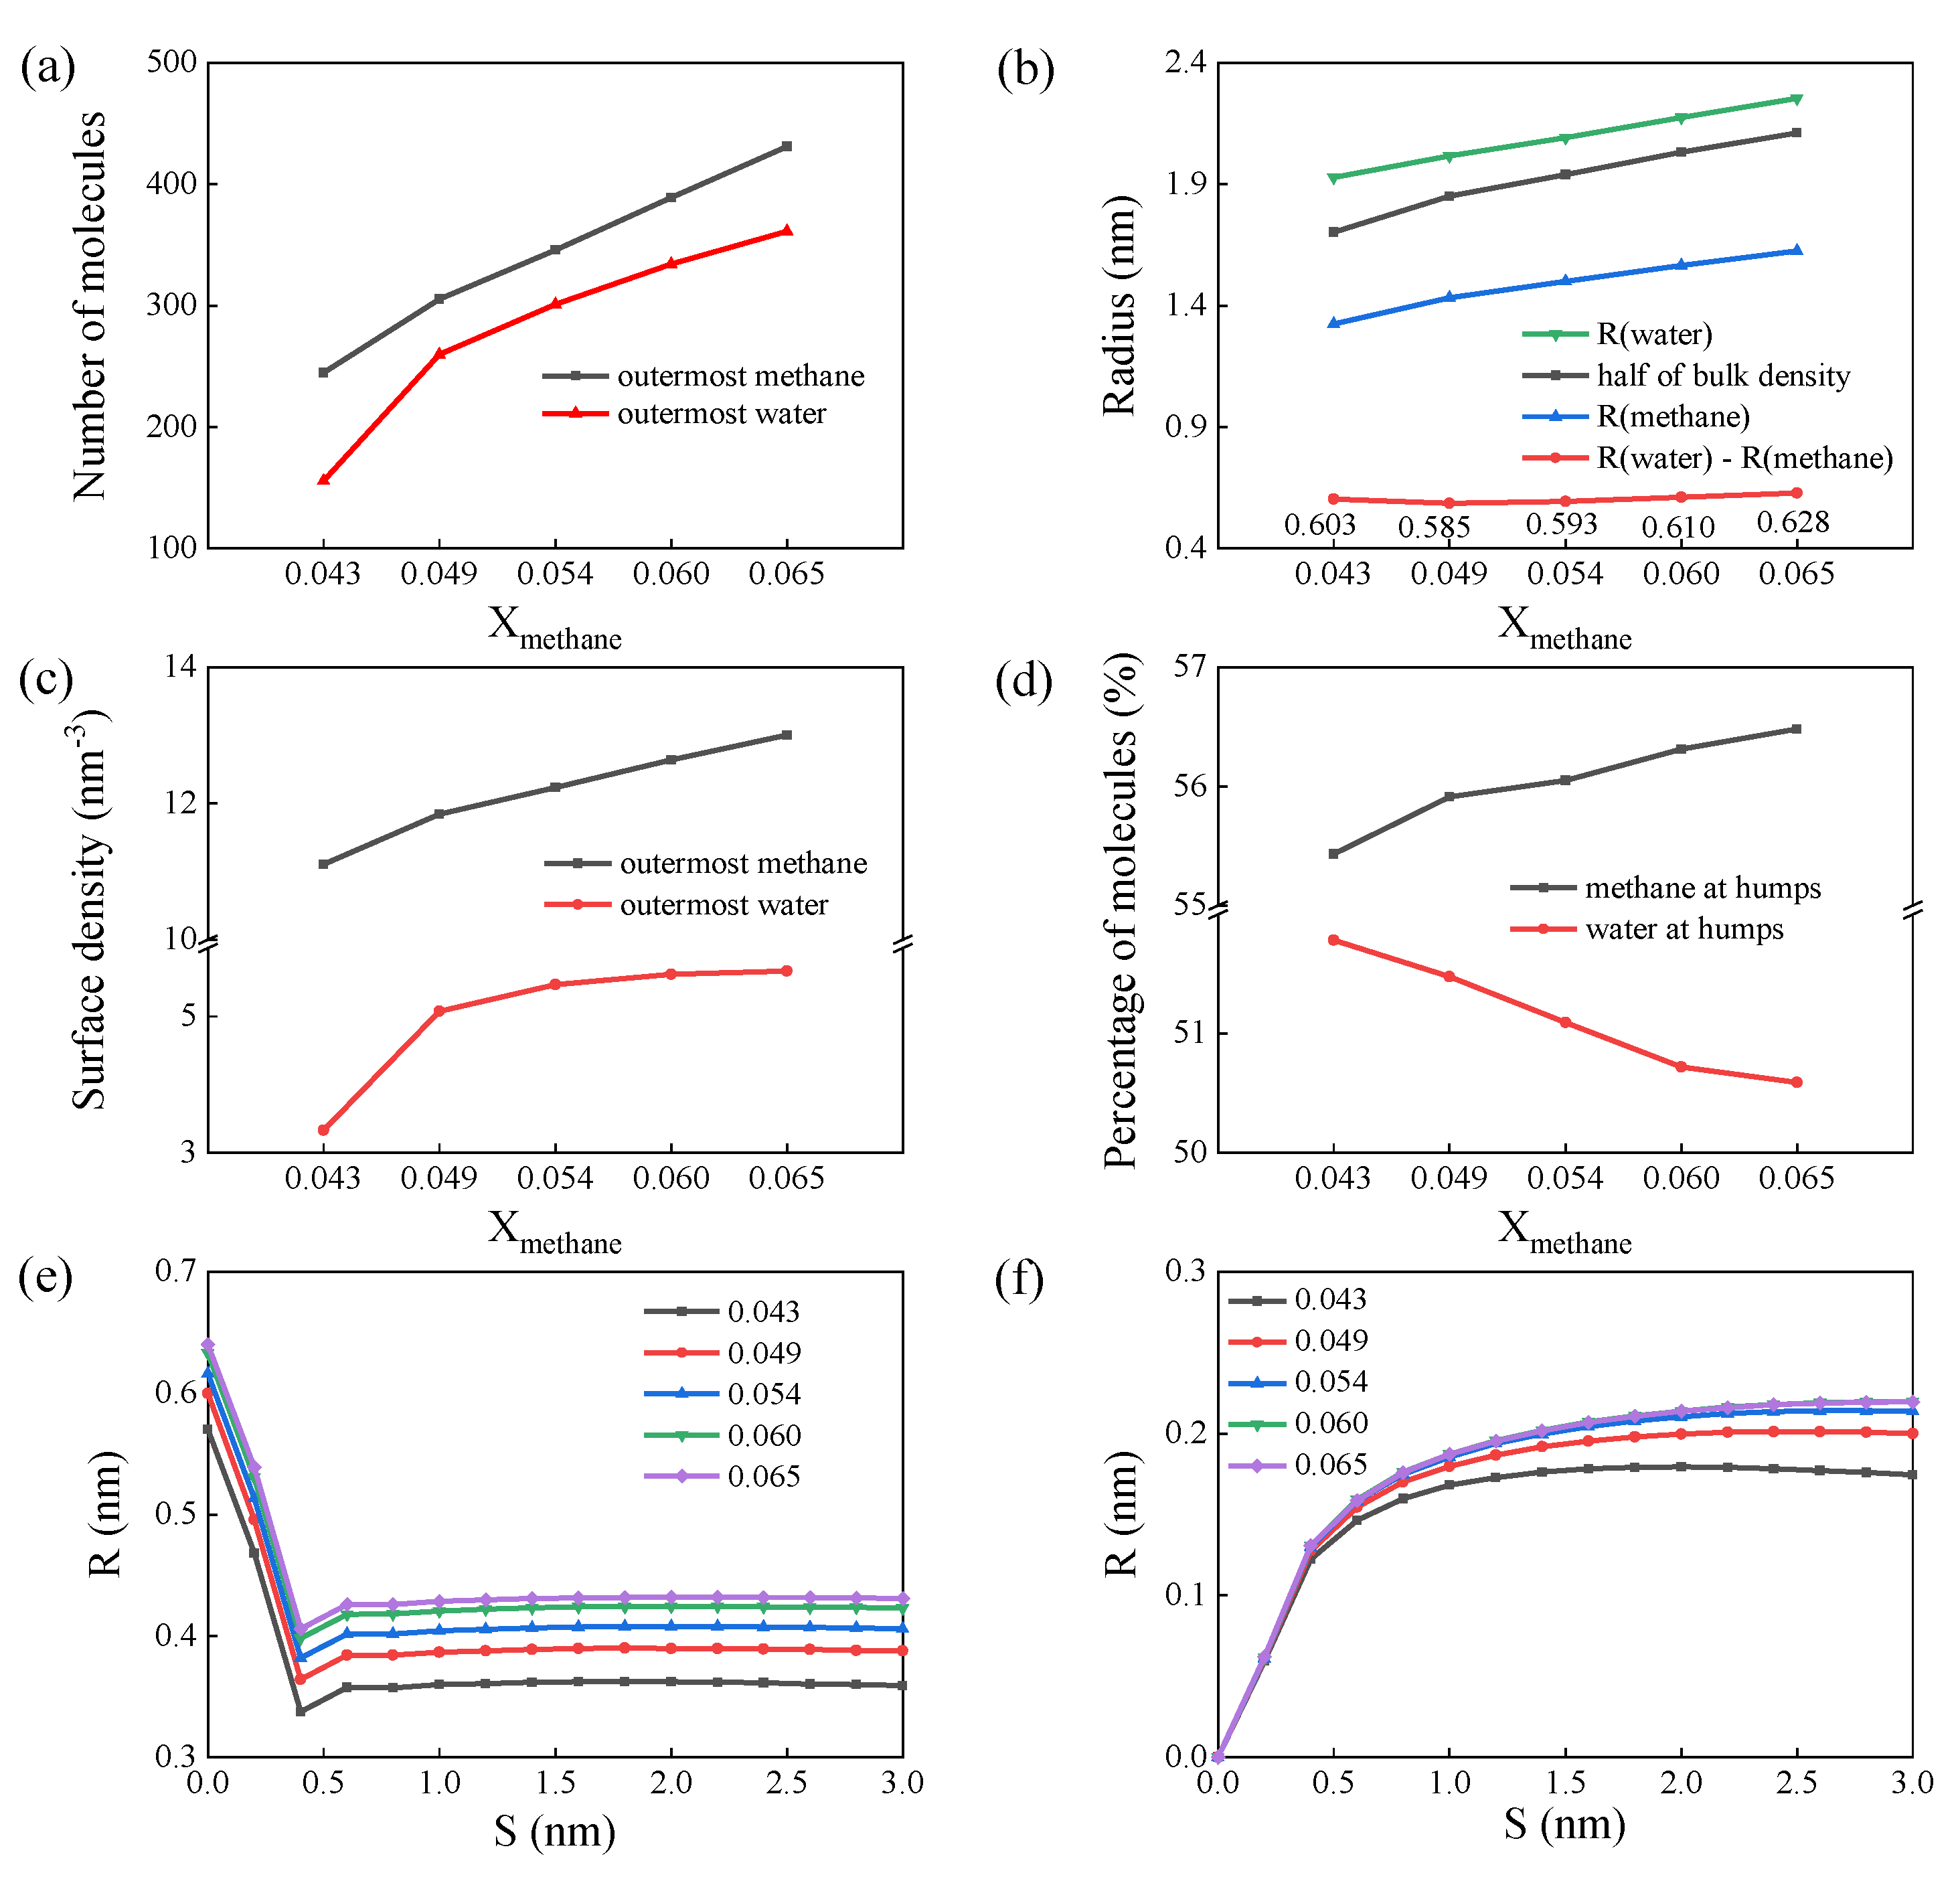
3.2. Effects of Temperatures, Pressures, and Xmethane on the Generation Behaviors of Bubbles

The generation of gas bubbles can accelerate the decomposition processes of gas hydrates by decreasing the gas concentrations in the solution [17,20,21]. Therefore, the effects of temperatures, pressures, and Xmethane on the generation behaviors of bubbles are studied in this part.
According to the time evolution of Nmethane in the largest methane cluster in Sys3_5MPa (Figure 2), the time and corresponding temperature for methane gas bubbling could be recognized to be 126 ns and 303.15 K. The results also suggest that methane gas bubbles are more likely to be generated at higher temperatures. Table 2 lists the times and corresponding temperatures for the generation of methane gas bubbles in other systems. With a higher value of Xmethane, methane gas bubbles could be formed at lower temperatures, indicating that higher values of Xmethane benefited the generation of methane gas bubbles. With the same Xmethane values of 0.049 or 0.054, bubbles were more easily formed at 5 and 8 MPa than at 12, 15, or 18 MPa. However, the effect of pressure seemed to be different in systems with other values of Xmethane.
Classical homogeneous nucleation theory (CNT) [50] can be used to explain the effects of temperatures, pressures, and Xmethane on the generation of methane gas bubbles. In CNT, the free energy barrier for methane gas bubbling can be described as ΔG* = (16πγ3)/(3ΔGv2), and the rate of bubble nucleation, J, can be calculated as J = Aexp(−ΔG*/kT). In these equations, γ, ΔGv, k, and T refer to the interfacial tension, the free energy change in the transformation per unit volume, the Boltzmann constant, and the temperature, respectively. In addition, A is positive and increases with Xmethane in the solution. Therefore, methane gas bubbles are likely to be formed in systems with large values of Xmethane at high temperatures. However, the effects of pressures can be complex. On one hand, high pressures can increase the solubility of methane molecules in water [18,19], leading to fewer methane molecules entering the bubble nuclei, which is not conductive to bubble nucleation. On the other hand, the surface tensions will decrease with increasing pressures [51], which benefits the nucleation of methane gas bubbles.
On a molecular scale, the observed dependence of the generation of methane gas bubbles on temperatures, pressures, and Xmethane could be correlated with the Nmethane distributions of the methane clusters in the solution. Methane clusters with large Nmethane values were more likely to reach the critical sizes of the bubble nuclei, and then grew into methane gas bubbles. Time-averaged Nmethane distributions on the methane clusters were calculated for each condition over a simulation time of 20 ns at a frequency of 10 ps (Figure 3). The results obtained indicated that the increase in both the temperature and the Xmethane value were conducive to forming methane clusters with large Nmethane values (Figure 3a,c). Therefore, the generation of methane gas bubbles could be promoted in systems with large Xmethane values at high temperatures. However, the Nmethane distributions on the methane clusters were similar at different pressures in the range of 5 to 18 MPa (Figure 3b), suggesting the weak effects of pressures on the generation of methane gas bubbles (Table 2).

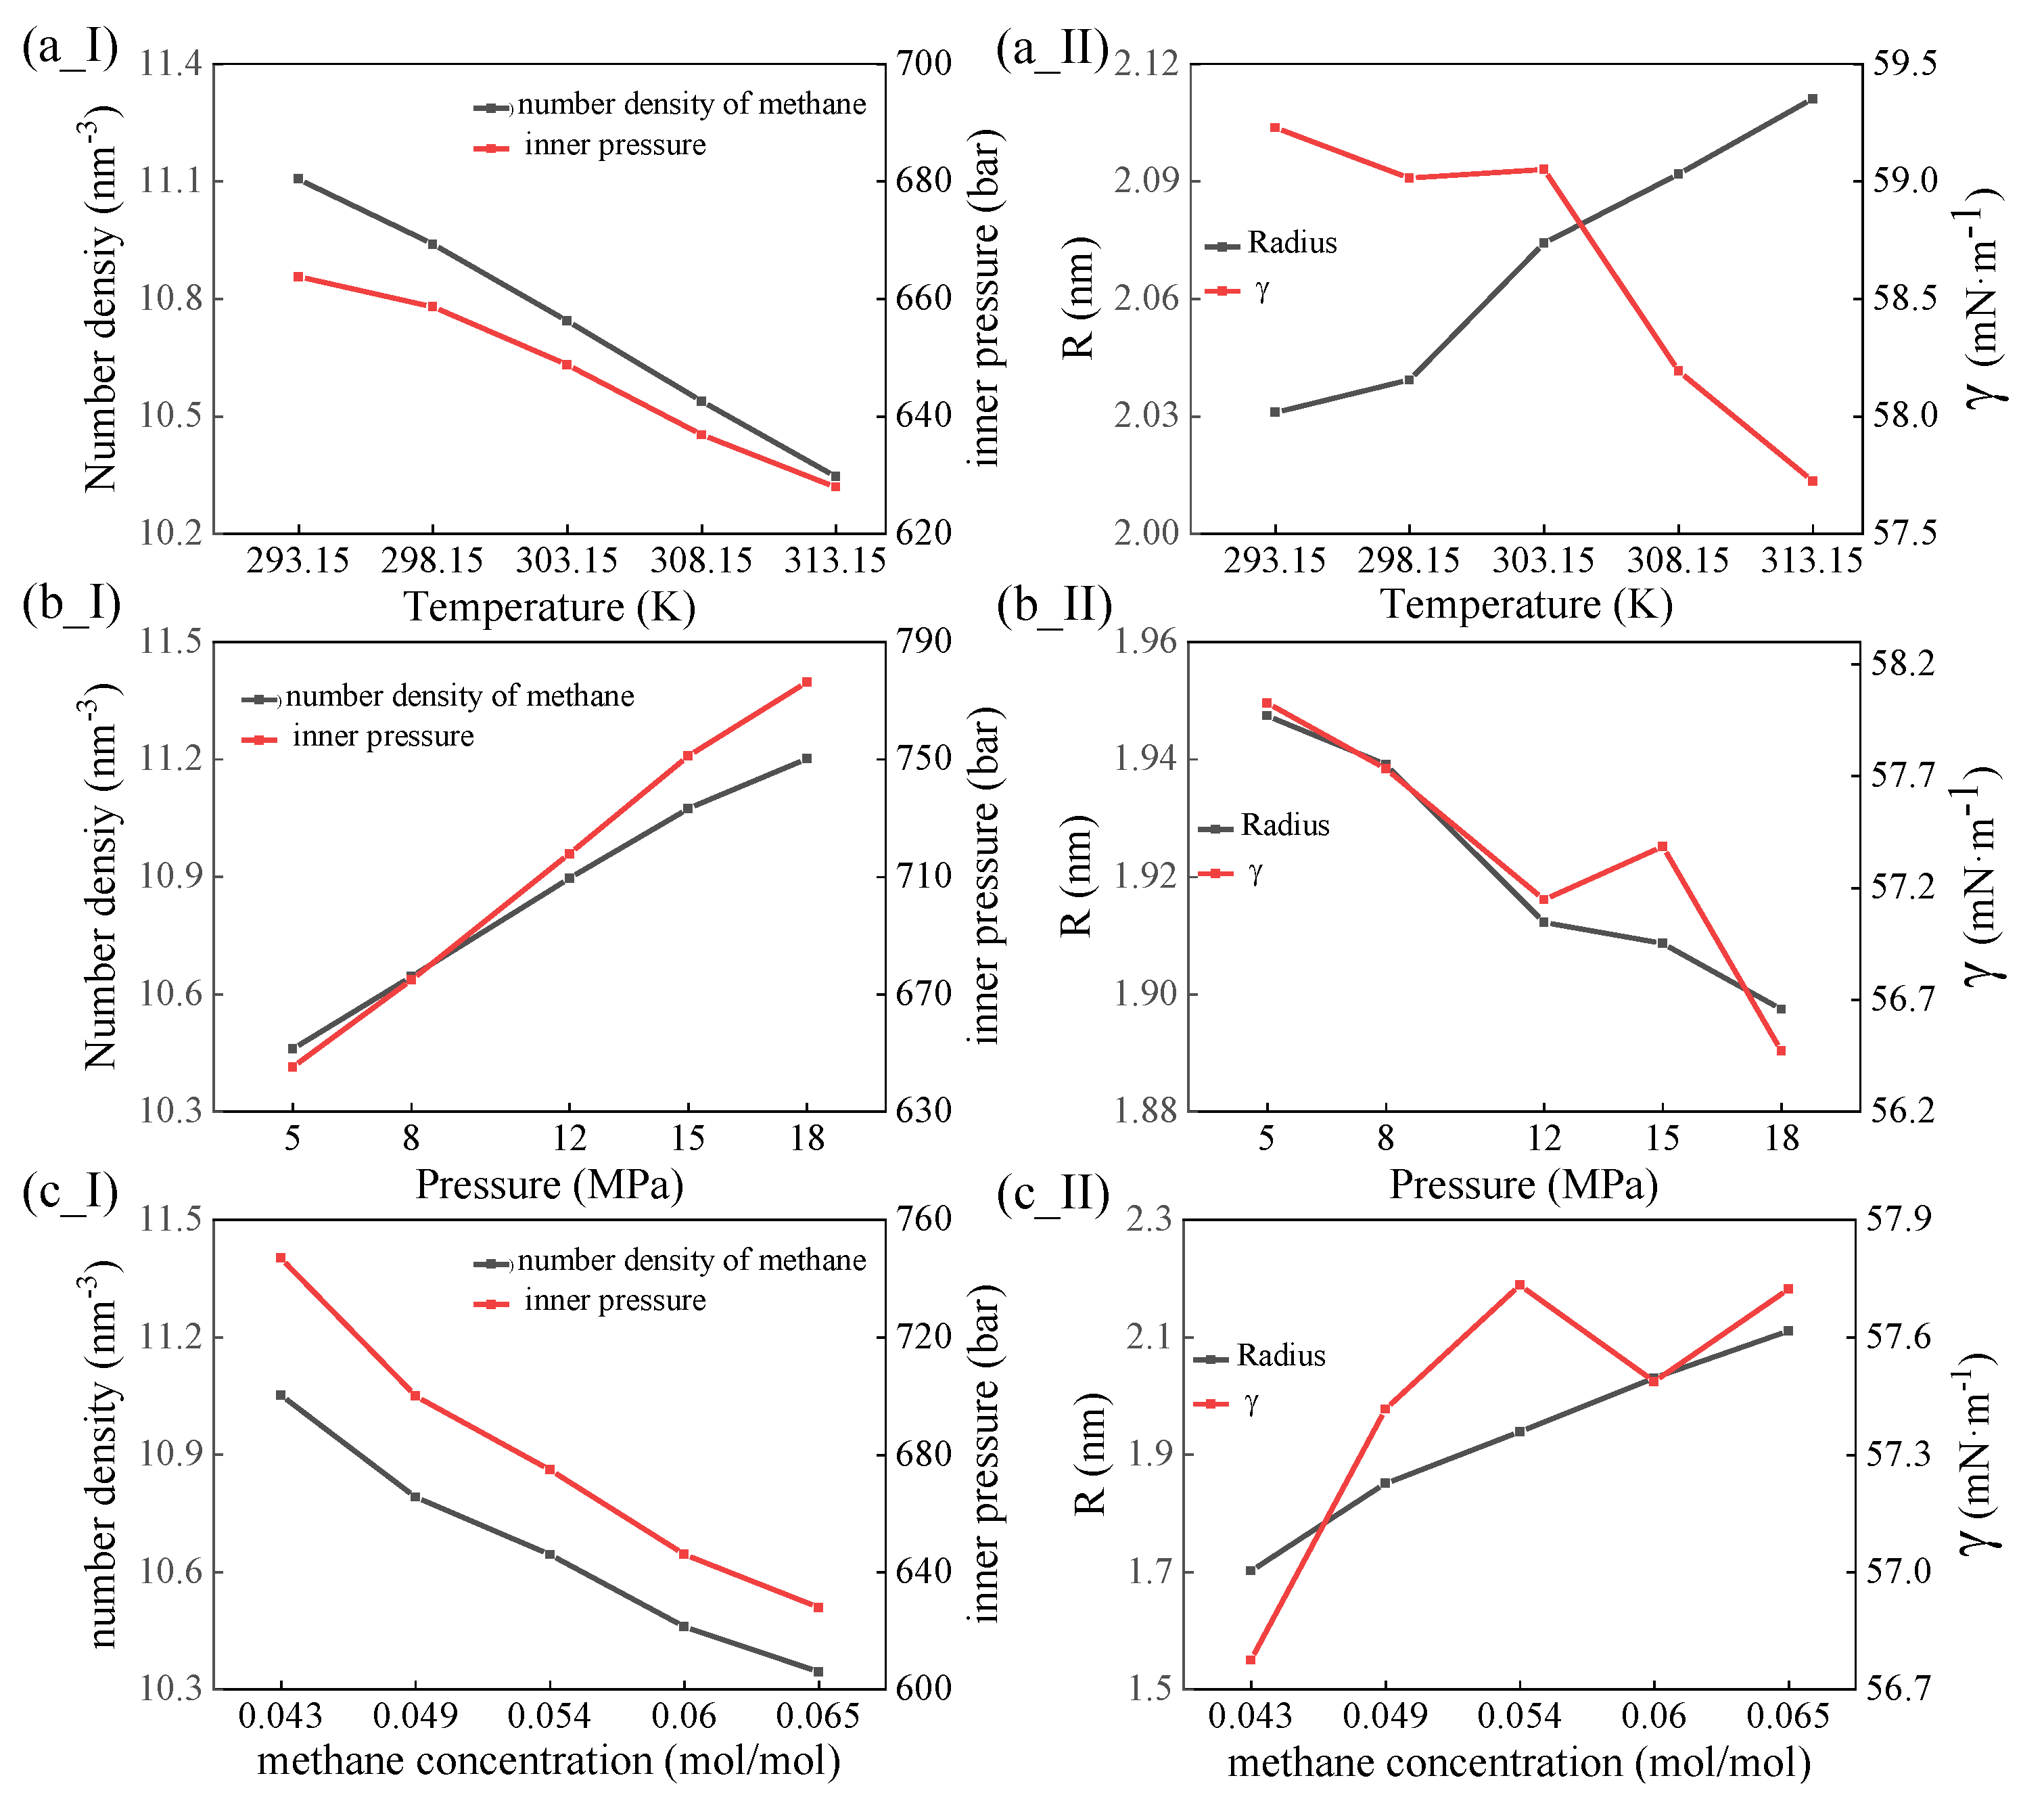
3.3. Effects of Temperatures, Pressures, and Xmethane on the Dynamic Properties of Bubbles

The gas bubbles that are formed can be nucleation sites for the re-nucleation of gas hydrates [7,9,10], which can be affected by the dynamic properties of the bubbles. The exchanges of methane molecules between bubbles and the surrounding solution can affect the increase in methane concentration in the surrounding solution. Therefore, the effects of temperatures, pressures, and Xmethane on the dynamic properties of the methane bubbles formed are studied in this section, focusing on the bubbles in Sys6_8MPa at different temperatures, those in Sys4 at 313.15 K and at different pressures, and those in systems with different Xmethane values at 313.15 K and 8 MPa.
For the studied systems, the effects of temperatures, pressures, and Xmethane on the inner pressures, radii, and surface tensions of bubbles were initially investigated. The number density profiles of methane and water molecules as a function of distance from the center of the gas bubbles were obtained. The regions in which the number density of water was less than 0.002 nm−3 were regarded as the bulk of the bubbles, and the number density of methane in the bulk of the bubbles was found to be about 10 to 11.5 nm−3. Several independent NVT simulations were carried out for systems with the same methane number density at the same temperature to obtain the inner pressures of those gas bubbles, and the computational details are presented in the Supplementary Materials. For the methane described by the TraPPE model, the critical temperature and pressure are 191.0 K and 45.0 bar, respectively [52]. Therefore, the methane molecules in the bubbles were all in a supercritical state in all of the systems (Figure 4a_I–c_I). In addition, both the methane number density in the bulk of the bubbles and the inner pressures increased with decreasing temperatures, increasing pressures, and decreasing Xmethane values (Figure 4a_I–c_I). Bubble radii are generally defined as the distance at which the methane density reaches half of that in the bulk of the bubbles [25,26]. The radii of the methane bubbles were found to increase with increasing temperatures, decreasing pressures, and increasing Xmethane values. Thus, the surface tensions (γ) could be obtained with Pin = Pout + 2γ/R, and they were around 56 to 60 mN/m, increasing with decreasing temperature, decreasing pressure, and increasing Xmethane values (Figure 4a_II–c_II).
Methane molecules with more than 12 water molecules in the first solvent shell were classified as dissolved molecules, and the other ones were in the gas phase [21]. When the state of methane gas molecules changed after a time-step simulation, these methane molecules were regarded as being exchanged between the bubble and the surrounding solution [27]. Therefore, time-averaged Nmethane exchanges between the bubbles and the solution could be determined over 20 ns with a time step of 10 ps (Table 3). The bubbles were found to be highly dynamic at high pressures and in systems with high Xmethane values, while the effects of temperature seemed to be complex. The dynamic properties of the bubbles could be affected by the dynamics of the methane molecules in the bubbles, the solubility of methane in the surrounding solution, and the size of the interfacial area. Higher dynamics of methane molecules in bubbles could drive more methane molecules to be dissolved in the solution, which would benefit the exchange of methane molecules. The low solubility of methane in the solution limited the dissolution of methane molecules, thereby reducing the exchange of methane molecules. More methane molecules could exchange between two phases with a larger interfacial area. It is known that the dynamics of methane molecules in bubbles will increase with higher temperatures and pressures, and the solubility of methane in aqueous solutions increases with lower temperatures and higher pressures. Although the dynamics of methane molecules in bubbles decreased with decreasing inner pressures in systems with higher Xmethane values (Figure 4c_I), the interfacial area for the exchange of methane molecules increased with the increase in the radii of the bubbles at the same time. As a result, the bubbles were highly dynamic at high pressures and in systems with high Xmethane values. The effects of temperature on the dynamic properties of bubbles can be complex because of the promoting impacts of the high dynamics of methane molecules in bubbles together with the inhibiting effects of the low solubility of methane molecules in solutions at high temperatures.

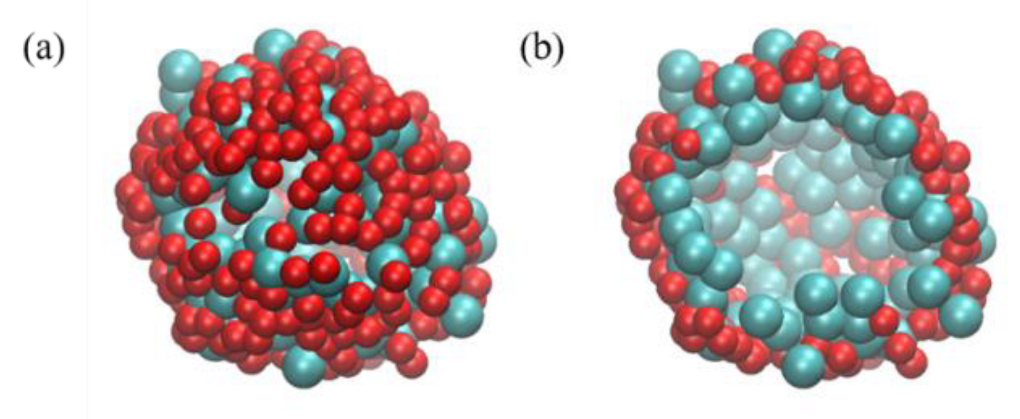
3.4. Effects of Temperatures, Pressures, and Xmethane on the Interfacial Structures between Bubbles and the Surrounding Solution

In addition to the dynamic properties of bubbles, the interfacial molecular structures between the gas phase and liquid phase also play important roles in the dissolution of gas molecules [38,39,40], which affects the re-nucleation of gas hydrates. In this section, the interfacial structures between bubbles and the surrounding solution are studied, with a focus on the systems in the preceding section.
The interfacial molecular structures were composed of the outermost methane and water molecules, as shown in Figure 5. These outermost molecules were identified with a procedure adapted from previous works [35,36,37,38,39,40], which is shown in detail in the Supplementary Materials. Thereafter, the average radius of the outermost methane, R(methane), and the average radius of the outermost water, R(water), were obtained with respect to the center of the bubbles. Surface densities were defined as the density of the outermost methane or water on the spherical shell with radii of R(methane) or R(water), respectively. When the distance to the center of the bubble was larger or smaller than R(methane), this outermost methane was classified as being in humps or wells of the bubble’s surface, respectively. When the distance to the center of the bubble was larger or smaller than R(water), this outermost water was classified as being in wells or humps on the liquid’s surface, respectively [38]. The separation between two of the outermost molecules in the radial direction (R) and the minimum distance between two of the outermost molecules projected on the spherical shell (S) were also calculated. The steady value of R at large values of S can be used to represent the surface roughness at the molecular level [35,36,37,38,39,40].
At higher temperatures, the radii of the gas bubbles became larger (Figure 6b), leading to more of the outermost molecules (Figure 6a). However, the surface density of the outermost molecules became smaller (Figure 6c). The radius of the outermost water was larger than the radius defined by half of the bulk density of the bubbles, while the radius of the outermost methane was smaller (Figure 6b). The mean difference in radii between the outermost methane and water molecules increased with increasing temperature (Figure 6b). The results suggest that the gas bubbles and methane solution were much more separate and that the interactions became weaker. Therefore, the methane molecules had less of an opportunity to dissolve in the solution. Temperature also had an effect on the roughness of the interfacial molecules. The percentage of methane molecules at the humps (Figure 6d) and the value of R at large values of S for the outermost methane (Figure 6e) increased with increasing temperature, indicating that the methane bubbles had a higher surface roughness at higher temperatures. The surrounding liquids had a higher surface roughness at higher temperatures (Figure 6f), and the effect of temperature on the roughness of the outermost methane molecules was stronger than that of the outermost water molecules (Figure 6e,f).
With the increase in pressure, the radii of the gas bubbles decreased, and the mean differences in radii of the outermost methane and water molecules also decreased (Figure 7b). Therefore, the bubbles and solution became closer, suggesting a stronger interaction between them. As the pressure increased, there were fewer of the outermost methane and water molecules, and the number of the outermost methane molecules decreased less than that of the outermost water molecules (Figure 7a), resulting in an increase in the surface density of the methane molecules and a decrease in the surface density of the water molecules (Figure 7c). The increasing surface density of the methane molecules could result in an increasing numerical density of methane in the bubbles (Figure 4b_I). However, some water molecules at wells under low pressure were covered by those at humps and, therefore, did not belong to the outermost water molecules under a high pressure. This phenomenon could be proved by the higher percentage of water at humps under higher pressures (Figure 7d). In addition, at higher pressures, with the increasing percentage of water at humps, the methane molecules were more likely to dissolve into the water because of the lower density of the water at the humps [38]. The outermost methane and water molecules both had a lower roughness at higher pressures (Figure 7e,f), which was opposite of the effects of external pressure on the surface roughness of water clusters [38].
At the same external temperature and pressure, the gas bubbles were bigger in systems with larger values of Xmethane, leading to more of the outermost methane and water molecules (Figure 8a) and larger bubble radii (Figure 8b). With the decrease in the inner pressures of the bubbles in systems with larger values of Xmethane (Figure 4a_I), the mean differences in the radii of the outermost methane and water molecules increase (Figure 8b), suggesting weaker interactions between the bubbles and the surrounding solution. In addition, the percentage of methane molecules at humps increased, while that of water molecules at humps decreases (Figure 8d), which was consistent with the effect of external pressure (Figure 7d). The surface density of the outermost molecules was higher (Figure 8c) for bigger bubbles, which could be explained by the greater roughness of the outermost molecules (Figure 8e,f). The outermost molecular layers with a greater roughness were thicker in the radial direction, resulting in a larger density projected onto the surfaces.

4. Conclusions

In the present work, classical MD simulations were conducted to study the process of methane gas bubbling in systems with different values of Xmethane (mole fractions of 0.037 to 0.065) at temperatures of 293.15 to 313.15 K and pressures of 5 to 18 MPa. The effects of temperature, pressure, and Xmethane on the generation behaviors, dynamic properties, and interfacial structures of methane gas bubbles were investigated. The major findings are listed in the following.
More methane clusters with large values of Nmethane can be generated at high temperatures and in a supersaturated solution with a high value of Xmethane. The generation of these large methane clusters can promote the formation of gas bubbles. However, the effects of pressure are not obvious in the range of 5 to 18 MPa.
More methane molecules were found to be exchanged between bubbles and the solution at high pressures and in systems with high values of Xmethane. However, the effects of temperature are complex. On one hand, a high temperature leads to high dynamics of the methane molecules in the bubbles, thus promoting the exchange of methane molecules. On the other hand, the low solubility of methane in the solution could inhibit the exchange of methane molecules at high temperatures.
The interfacial structures between bubbles and the surrounding solution were rough on the molecular level. The roughness of the outermost methane and water molecules became large at high temperatures, low pressures, and in systems with high values of Xmethane. The interactions between the outermost methane and water molecules could also become stronger with decreasing temperature, increasing pressure, and decreasing values of Xmethane in the systems. The strong interactions between the outermost methane and water molecules can benefit the dissolution of methane molecules in the solution.
The results obtained in this study can be used to understand the generation behaviors of gas bubbles during the decomposition of gas hydrates, together with the re-nucleation behaviors of gas hydrates in the presence of bubbles at different temperatures and pressures.

Supplementary Materials

The following supporting information can be downloaded at: https://www.mdpi.com/article/10.3390/w14152327/s1, Figure S1: Time evolutions of Nmethane in the largest methane cluster in Sys3_5MPa calculated with the cluster analysis method with cutoff lengths of (a) 0.4, (b) 0.45, (c) 0.5, (d) 0.55, (e) 0.6, (f) 0.65, (g) 0.7, (h) 0.75, and (i) 0.8 nm; Computation details of independent simulations for obtaining the inner pressures of methane gas bubbles, including Table S1: Details of number density of methane molecules, number of methane molecules and the temperature set in the simulation; Steps for identifying the outermost methane and water molecules in bubble–solution systems.

Author Contributions

Methodology, Z.L.; writing—original draft preparation, Z.L. and S.R.; writing—review and editing, Z.L., Y.D. and H.L.; supervision, H.L. and Y.D.; funding acquisition, H.L., J.Y., W.X. and Y.D. All authors have read and agreed to the published version of the manuscript.

Funding

This research was funded by the Guangdong Major Project of Basic and Applied Basic Research (No. 2020B0301030003), Shenzhen Key Laboratory of Marine Energies and Environmental Safety (ZDSYS20201215154000001).

Institutional Review Board Statement

Not applicable.

Informed Consent Statement

Not applicable.

Data Availability Statement

The data used to support the findings of this study are available from the corresponding author upon request.

Acknowledgments

The work was carried out at Peking University High Performance Computing Platform, and the calculations were performed on CLS-HPC. We also thank Yanlu Ding and Jiecheng Zhang for their help in preparing this manuscript.

Conflicts of Interest

The authors declare no conflict of interest.

References

  1. Sloan, E.D. Fundamental principles and applications of natural gas hydrates. Nature 2003, 426, 353–359. [Google Scholar] [CrossRef]
  2. Boswell, R.; Collett, T.S. Current perspectives on gas hydrate resources. Energy Environ. Sci. 2011, 4, 1206–1215. [Google Scholar] [CrossRef]
  3. Huang, X.; Deng, Y.J.; Li, Z.C.; Cai, W.J.; Gu, L.J.; Lu, H.L. Study of THF Hydrate Crystallization Based on In Situ Observation with Atomic Force Microscopy. Cryst. Growth Des. 2020, 20, 2921–2929. [Google Scholar] [CrossRef]
  4. Huang, X.; Li, Z.C.; Deng, Y.J.; Cai, W.J.; Gu, L.J.; Lu, H.L. Effect of Micro- and Nanobubbles on the Crystallization of THF Hydrate Based on the Observation by Atomic Force Microscopy. J. Phys. Chem. C 2020, 124, 13966–13975. [Google Scholar] [CrossRef]
  5. Huang, X.; Cai, W.J.; Zhan, L.S.; Lu, H.L. Study on the reaction of methane hydrate with gaseous CO2 by Raman imaging microscopy. Chem. Eng. Sci. 2020, 222, 115720. [Google Scholar] [CrossRef]
  6. Cai, W.J.; Zhan, L.S.; Huang, X.; Lu, H.L. Raman Micro-Imaging of the Coexistence of sI and sII Hydrates Formed from a Mixed Methane-Propane Gas in a Confined Space. Acta Geol. Sin.-Engl. Ed. 2022, 96, 674–679. [Google Scholar] [CrossRef]
  7. Uchida, T.; Yamazaki, K.; Gohara, K. Gas Nanobubbles as Nucleation Acceleration in the Gas-Hydrate Memory Effect. J. Phys. Chem. C 2016, 120, 26620–26629. [Google Scholar] [CrossRef]
  8. Uchida, T.; Yamazaki, K.; Gohara, K. Generation of micro- and nano-bubbles in water by dissociation of gas hydrates. Korean J. Chem. Eng. 2016, 33, 1749–1755. [Google Scholar] [CrossRef] [Green Version]
  9. Uchida, T.; Miyoshi, H.; Sugibuchi, R.; Suzuta, A.; Yamazaki, K.; Gohara, K. Contribution of Ultra-Fine Bubbles to Promoting Effect on Propane Hydrate Formation. Front. Chem. 2020, 8, 480. [Google Scholar] [CrossRef]
  10. Uchida, T.; Miyoshi, H.; Yamazaki, K.; Gohara, K. Promoting Effect of Ultra-Fine Bubbles on CO2 Hydrate Formation. Energies 2021, 14, 3386. [Google Scholar] [CrossRef]
  11. Li, Z.C.; Lu, H.L.; Deng, Y.J.; Rao, S.H.; Huang, X.; Zhang, Q. Advances in molecular dynamics simulation on heterogeneous nucleation of gas hydrate. Funct. Mater. Lett. 2021, 14, 2130010. [Google Scholar] [CrossRef]
  12. Walsh, M.R.; Koh, C.A.; Sloan, E.D.; Sum, A.K.; Wu, D.T. Microsecond simulations of spontaneous methane hydrate nucleation and growth. Science 2009, 326, 1095–1098. [Google Scholar] [CrossRef]
  13. Walsh, M.R.; Beckham, G.T.; Koh, C.A.; Sloan, E.D.; Wu, D.T.; Sum, A.K. Methane Hydrate Nucleation Rates from Molecular Dynamics Simulations: Effects of Aqueous Methane Concentration, Interfacial Curvature, and System Size. J. Phys. Chem. C 2011, 115, 21241–21248. [Google Scholar] [CrossRef]
  14. Bai, D.S.; Chen, G.J.; Zhang, X.R.; Wang, W.C. Nucleation of the CO2 Hydrate from Three-Phase Contact Lines. Langmuir 2012, 28, 7730–7736. [Google Scholar] [CrossRef]
  15. He, Z.J.; Linga, P.; Jiang, J.W. CH4 Hydrate Formation between Silica and Graphite Surfaces: Insights from Microsecond Molecular Dynamics Simulations. Langmuir 2017, 33, 11956–11967. [Google Scholar] [CrossRef] [PubMed]
  16. He, Z.J.; Mi, F.Y.; Ning, F.L. Molecular insights into CO2 hydrate formation in the presence of hydrophilic and hydrophobic solid surfaces. Energy 2021, 234, 121260. [Google Scholar] [CrossRef]
  17. Bagherzadeh, S.A.; Alavi, S.; Ripmeester, J.; Englezos, P. Formation of methane nano-bubbles during hydrate decomposition and their effect on hydrate growth. J. Chem. Phys. 2015, 142, 214701. [Google Scholar] [CrossRef]
  18. Duan, Z.; Weare, J.H. The prediction of methane solubility in natural waters to high ionic strength from 0 to 250 °C and from 0 to 1600 bar. Geochim. Cosmochim. Acta 1992, 56, 4303. [Google Scholar] [CrossRef]
  19. Duan, Z.H.; Mao, S.D. A thermodynamic model for calculating methane solubility, density and gas phase composition of methane-bearing aqueous fluids from 273 to 523 K and from 1 to 2000 bar. Geochim. Cosmochim. Acta 2006, 70, 3369–3386. [Google Scholar] [CrossRef]
  20. Chen, C.; Hu, W.F.; Yang, L.; Zhao, J.F.; Song, Y.C. Gas supersaturation and diffusion joint controlled CH4 nanobubble evolution during hydrate dissociation. J. Mol. Liq. 2021, 323, 114614. [Google Scholar] [CrossRef]
  21. Yagasaki, T.; Matsumoto, M.; Andoh, Y.; Okazaki, S.; Tanaka, H. Effect of Bubble Formation on the Dissociation of Methane Hydrate in Water: A Molecular Dynamics Study. J. Phys. Chem. B 2014, 118, 1900–1906. [Google Scholar] [CrossRef]
  22. Uddin, M.; Coombe, D. Kinetics of CH4 and CO2 Hydrate Dissociation and Gas Bubble Evolution via MD Simulation. J. Phys. Chem. A 2014, 118, 1971–1988. [Google Scholar] [CrossRef]
  23. Zhang, Y.; Zhao, L.; Deng, S.; Zhao, R.K.; Nie, X.H.; Liu, Y.N. Effect of Nanobubble Evolution on Hydrate Process: A Review. J Therm. Sci. 2019, 28, 948–961. [Google Scholar] [CrossRef]
  24. Yagasaki, T.; Matsumoto, M.; Tanaka, H. Effects of thermodynamic inhibitors on the dissociation of methane hydrate: A molecular dynamics study. Phys. Chem. Chem. Phys. 2015, 17, 32347–32357. [Google Scholar] [CrossRef]
  25. Sujith, K.S.; Ramachandran, C.N. Carbon dioxide induced bubble formation in a CH4-CO2-H2O ternary system: A molecular dynamics simulation study. Phys. Chem. Chem. Phys. 2016, 18, 3746–3754. [Google Scholar] [CrossRef] [PubMed]
  26. Kaur, S.P.; Sujith, K.S.; Ramachandran, C.N. Formation of a nanobubble and its effect on the structural ordering of water in a CH4-N2-CO2-H2O mixture. Phys. Chem. Chem. Phys. 2018, 20, 9157–9166. [Google Scholar] [CrossRef] [PubMed]
  27. Sujith, K.S.; Ramachandran, C.N. Natural Gas Evolution in a Gas Hydrate Melt: Effect of Thermodynamic Hydrate Inhibitors. J. Phys. Chem. B 2017, 121, 153–163. [Google Scholar] [CrossRef] [PubMed]
  28. Sodeifian, G.; Razmimanesh, F. Diffusional interaction behavior of NSAIDs in lipid bilayer membrane using molecular dynamics (MD) simulation: Aspirin and Ibuprofen. J. Biomol. Struct. Dyn. 2019, 37, 1666–1684. [Google Scholar] [CrossRef] [PubMed]
  29. Sodeifian, G.; Nikooamal, H.R.; Yousefi, A.A. Molecular dynamics study of epoxy/clay nanocomposites: Rheology and molecular confinement. J. Polym. Res. 2012, 19, 1–12. [Google Scholar] [CrossRef]
  30. Ghoufi, A.; Malfreyt, P. Numerical evidence of the formation of a thin microscopic film of methane at the water surface: A free energy calculation. Phys. Chem. Chem. Phys. 2010, 12, 5203–5205. [Google Scholar] [CrossRef]
  31. Murina, E.L.; Pastorino, C.; Fernandez-Prini, R. Entrance dynamics of CH4 molecules through a methane-water interface. Chem. Phys. Lett. 2015, 637, 13–17. [Google Scholar] [CrossRef]
  32. Fang, G.; Chen, J.G. Hindered Gas Transport through an Aqueous Salt Solution Interface. J. Phys. Chem. C 2018, 122, 20774–20780. [Google Scholar] [CrossRef]
  33. Li, W.H.; Jin, Z.H. Molecular dynamics simulations of natural gas-water interfacial tensions over wide range of pressures. Fuel 2019, 236, 480–492. [Google Scholar] [CrossRef]
  34. Chang, T.M.; Dang, L.X. Liquid-vapor interface of methanol-water mixtures: A molecular dynamics study. J. Phys. Chem. B 2005, 109, 5759–5765. [Google Scholar] [CrossRef] [PubMed]
  35. Partay, L.B.; Hantal, G.; Jedlovszky, B.; Vincze, A.; Horvai, G. A new method for determining the interfacial molecules and characterizing the surface roughness in computer simulations. Application to the liquid-vapor interface of water. J. Comput. Chem. 2008, 29, 945–956. [Google Scholar] [CrossRef]
  36. Partay, L.B.; Jedlovszky, B.; Vincze, A.; Horvai, G. Properties of free surface of water-methanol mixtures. Analysis of the truly interfacial molecular layer in computer simulation. J. Phys. Chem. B 2008, 112, 5428–5438. [Google Scholar] [CrossRef]
  37. Darvas, M.; Partay, L.B.; Jedlovszky, B.; Horvai, G. Computer simulation and ITIM analysis of the surface of water-methanol mixtures containing traces of water. J. Mol. Liq. 2010, 153, 88–93. [Google Scholar] [CrossRef]
  38. Sujith, K.S.; Ramachandran, C.N. Effect of surface roughness on adsorption and distribution of methane at the water-methane interface. J. Mol. Liq. 2018, 266, 856–863. [Google Scholar] [CrossRef]
  39. Sujith, K.S.; Lata, K.S.; Ramachandran, C.N. Adsorption and dissolution of methane at the surface of the methanol-water mixture. Fluid Phase Equilibria 2018, 473, 310–317. [Google Scholar] [CrossRef]
  40. Sujith, K.S. Adsorption and distribution of gas molecules at the (CH4 + CO2)-water interface: Insights from analysis of intrinsic interfacial structure. J. Mol. Liq. 2020, 301, 112480. [Google Scholar] [CrossRef]
  41. Abascal, J.L.F.; Sanz, E.; Fernandez, R.G.; Vega, C. A potential model for the study of ices and amorphous water: TIP4P/Ice. J. Chem. Phys. 2005, 122, 234511. [Google Scholar] [CrossRef] [PubMed] [Green Version]
  42. Martin, M.G.; Siepmann, J.I. Transferable potentials for phase equilibria. 1. United-atom description of n-alkanes. J. Phys. Chem. B 1998, 102, 2569–2577. [Google Scholar] [CrossRef]
  43. Miyamoto, S.; Kollman, P.A. Settle—An Analytical Version of the Shake and Rattle Algorithm for Rigid Water Models. J. Comput. Chem. 1992, 13, 952–962. [Google Scholar] [CrossRef]
  44. Makov, G.; Payne, M.C. Periodic boundary conditions in ab initio calculations. Phys. Rev. B 1995, 51, 4014–4022. [Google Scholar] [CrossRef] [Green Version]
  45. Bussi, G.; Donadio, D.; Parrinello, M. Canonical sampling through velocity rescaling. J. Chem. Phys. 2007, 126, 014101. [Google Scholar] [CrossRef] [Green Version]
  46. Berendsen, H.; van Gunsteren, W. Molecular dynamics simulations: Techniques and approaches. In Molecular Liquids; Springer: Dodrecht, The Netherlands, 1984; pp. 475–500. [Google Scholar]
  47. Darden, T.; York, D.; Pedersen, L. Particle Mesh Ewald—An N.Log(N) Method for Ewald Sums in Large Systems. J. Chem. Phys. 1993, 98, 10089–10092. [Google Scholar] [CrossRef] [Green Version]
  48. Abraham, M.J.; Murtola, T.; Schulz, R.; Pall, S.; Smith, J.C.; Hess, B.; Lindahl, E. GROMACS: High performance molecular simulations through multi-level parallelism from laptops to supercomputers. SoftwareX 2015, 1, 19–25. [Google Scholar] [CrossRef] [Green Version]
  49. Liu, Y.N.; Zhao, L.; Deng, S.; Bai, D.S. Evolution of bubbles in decomposition and replacement process of methane hydrate. Mol. Simulat. 2017, 43, 1061–1073. [Google Scholar] [CrossRef]
  50. Mullin, J.W. Crystallization, 4th ed.; Elsevier: Amsterdam, The Netherlands, 2001; pp. 536–575. [Google Scholar]
  51. Naeiji, P.; Varaminian, F.; Rahmati, M. Comparison of the thermodynamic, structural and dynamical properties of methane/water and methane/water/hydrate systems using molecular dynamic simulations. J. Nat. Gas Sci. Eng. 2017, 44, 122–130. [Google Scholar] [CrossRef]
  52. Skarmoutsos, I.; Kampanakis, L.I.; Samios, J. Investigation of the vapor-liquid equilibrium and supercritical phase of pure methane via computer simulations. J. Mol. Liq. 2005, 117, 33–41. [Google Scholar] [CrossRef]
Figure 1. Snapshots of Sys3_5MPa at (a) 0, (b) 38, (c) 40, (d) 126, (e) 146, and (f) 215 ns. Methane molecules and water molecules are represented by cyan balls and red lines, respectively.
Water 14 02327 g001
Figure 2. Time evolutions of (a) the number of methane clusters with Nmethane values larger than 10 and (b) Nmethane values in the largest and the second largest methane clusters in Sys3_5MPa.
Water 14 02327 g002
Figure 3. Time-averaged Nmethane distributions on methane clusters in (a) Sys1_5MPa at different temperatures, (b) Sys1 at 293.15 K and at different pressures, and (c) systems with different Xmethane values at 8 MPa and 293.15 K.
Water 14 02327 g003
Figure 4. (I) Methane number densities and the inner pressures in the bulk of bubbles and (II) radii and surface tensions of the bubbles in (a) Sys6_8MPa at different temperatures, (b) Sys4 at 313.15 K and at different pressures, and (c) systems with different Xmethane values at 313.15 K and 8 MPa.
Water 14 02327 g004
Figure 5. (a) All and (b) parts of the outermost methane and water molecules at the interface between the methane gas bubble and the surrounding solution. Methane molecules are represented by cyan balls, oxygen atoms are shown in red balls, and hydrogen atoms are hidden.
Water 14 02327 g005
Figure 6. Time averages of (a) the total numbers of outermost methane and water molecules, (b) bubble radii, (c) the surface densities of the outermost methane and water molecules, (d) percentages of methane and water molecules at humps, and R as a function of S for (e) the outermost methane molecules and (f) the outermost water molecules in Sys6_8MPa at different temperatures.
Water 14 02327 g006
Figure 7. Time averages of (a) the total numbers of the outermost methane and water molecules, (b) bubble radii, (c) the surface densities of the outermost methane and water molecules, (d) the percentages of methane and water molecules at humps, and R as a function of S for (e) the outermost methane molecules and (f) the outermost water molecules in Sys4 at 313.15 K and different pressures.
Water 14 02327 g007
Figure 8. Time averages of (a) the total numbers of the outermost methane and water molecules, (b) bubble radii, (c) the surface densities of the outermost methane and water molecules, (d) the percentages of methane and water molecules at humps, and R as a function of S for (e) the outermost methane molecules and (f) the outermost water molecules in systems with different values of Xmethane at 313.15 K and 8 MPa.
Water 14 02327 g008
Table 1. The numbers of methane and water molecules and the mole fractions of methane in each system.
SystemSys1Sys2Sys3Sys4Sys5Sys6
N (methane)270310350390430470
N (water)694069006860682067806740
X (methane, mol/mol)0.0370.0430.0490.0540.0600.065
Table 2. The times and corresponding temperatures for the generation of methane gas bubbles in each system.
Xmethane (mol/mol)5 MPa8 MPa12 MPa15 MPa18 MPa
0.037nb 1nbnbnbnb
0.043229 (313.15)167 (308.15)nbnbnb
0.049126 (303.15)120 (303.15)185 (308.15)170 (308.15)158 (308.15)
0.05462 (298.15)86 (298.15)133 (303.15)121 (303.15)122 (303.15)
0.060100 (298.15)48 (293.15)55 (298.15)109 (303.15)67 (298.15)
0.065ns 210 (293.15)33 (293.15)38 (293.15)17 (293.15)
Note: 1 No bubble formation. 2 No simulation performed because bubbles were generated in the relaxation simulation.
Table 3. Time-averaged Nmethane exchanges between the bubbles and the solution per 10 ps in (a) Sys6_8MPa at different temperatures, (b) Sys4 at 313.15 K and at different pressures, and (c) systems with different Xmethane values at 313.15 K and 8 MPa.
Part aPart bPart c
Temperature
(K)
Nmethane
(10 ps)−1
Pressure
(MPa)
Nmethane
(10 ps)−1
Xmethane
(mol/mol)
Nmethane
(10 ps)−1
293.1521.93519.460.037nb 1
298.1521.50819.890.04317.29
303.1521.771219.900.04918.82
308.1521.631520.310.05419.89
313.1521.401820.400.06020.57
0.06521.40
Note: 1 No bubble formation.
Publisher’s Note: MDPI stays neutral with regard to jurisdictional claims in published maps and institutional affiliations.

