
The Impacts of Precipitation on Fluorescent Dissolved Organic Matter (FDOM) in an Urban River System


1
College of Urban and Environmental Sciences, Peking University, No.5 Yiheyuan Road, Haidian District, Beijing 100871, China
2
Chemical Science College, University Bordeaux, UMR EPOC CNRS 5805, F-33400 Talence, France
3
China Academy of Building Research, No. 30 Beisanhuan East Road, Chaoyang District, Beijing 100029, China
*
Author to whom correspondence should be addressed.
Water 2022, 14(15), 2323; https://doi.org/10.3390/w14152323
Submission received: 24 May 2022
/
Revised: 22 July 2022
/
Accepted: 25 July 2022
/
Published: 27 July 2022
(This article belongs to the Special Issue Water Quality and Contaminant Transport in Aquatic Environments)
Abstract
:Precipitation is considered a key factor influencing the fluorescent dissolved organic matter (FDOM) of urban rivers. However, the multiple effects of precipitation on FDOM in urban rivers and the long-term impacts of precipitation on the spatial patterns of FDOM are seldom known. Spatiotemporal variations of FDOM at 36 sites from the urban rivers of Jinan City during dry and wet seasons were investigated in this study. Four components were identified using an excitation–emission matrix and parallel factor analysis. Overall, the total fluorescence intensities in dry and wet seasons ranged from 6.59 to 35.7 quinine sulfate units (QSU) and 3.42 to 69.3 QSU, respectively. Significant variations were found for different components that C2 and C3 declined but C4 increased in the wet season (p < 0.05). The temporal variations for different components could be explained by the different combined effects of precipitation dilution and flushing. Three different reference FDOM sources, including background water, spring water, and wastewater treatment plant (WWTP) outlets, were illustrated using principal coordinate analysis (PCoA). The places of FDOM in most sites were more closed to the PCoA location of WWTP outlets in the dry season while central shifted in the wet season. The changes of FDOM sources in the wet season could be explained by the mixed effect of precipitation. In conclusion, this study provided new insights into the multiple impacts of precipitation on FDOM in urban river systems, and also data support for precise pollution discharge and water resource management.
1. Introduction
Urban rivers are important for city development and are a momentous contributor to the urban ecosystem [1]. With the rapid development of urbanization, their ecosystem service functions have been gradually diversified [2,3]. Currently, the aggregated functions of urban rivers include the supply of water [4], shipping [5], landscape [6], the receipt of wastewater [3], irrigation [7], and micro-climate regulation [8]. Urban rivers also serve as spillways for flood discharge in cities with frequent rainstorms [9,10,11,12]. Due to the aggregated functions of urban rivers, their water quality is of significant importance [13,14,15,16].
The water quality of urban rivers could be affected by various factors, such as anthropogenic activities, precipitation, temperature, and water source background [17,18], and precipitation is considered to be an important factor therein [19], especially in karst areas [20]. Current studies illustrated that precipitation had multiple effects on the aquatic environment of urban rivers [21,22]. For example, precipitation can accelerate atmospheric nitrogen deposition in an urban river [23]. In addition, rainfall can dilute the contaminants in urban rivers [24]. However, it can also overflow the treatment capacity of sewage treatment plants and flush leachates into urban rivers via surface runoff, resulting in higher riverine contamination [25]. Therefore, it is of great significance to understand the multiple impacts of precipitation on urban rivers for the sustainable management of urban rivers and human–environment interaction and balance [26].
Dissolved organic matter (DOM) is ubiquitous in urban rivers [27,28]. It can greatly affect the environmental processes of pollutants [29] and plays a correlative role in multiple biogeochemical processes [30,31]. Therefore, DOM has profound impacts on the river ecosystem [32]. Among the multiple measurement approaches of DOM, the fluorescent measurement can provide useful information regarding the water quality [33,34]. Therefore, it was applied to investigate the variations of DOM in urban rivers during short-term precipitation processes. For example, Carstea et al. [35] and Croghan et al. [29] monitored the continuous fluorescent DOM (FDOM) variations in the Bournbrook River, Birmingham, UK, with an hour scale and 5 min resolutions, respectively. In addition, Lee et al. [36] evaluated the contributions of different FDOM sources in the Geumho River, South Korea, during a storm event. Moreover, Zhu et al. [37] reported the variations of FDOM in several polluted urban rivers in Shanghai in different weather conditions. However, to our best knowledge, the multiple effects (such as dilution, flushing, and mixture) of precipitation on FDOM in urban rivers and the long-term impacts of precipitation on the spatial patterns of FDOM are hardly known.
Spatiotemporal variations of FDOM in the urban rivers of Jinan City were measured in this study. The main objects of this study are (1) to analyze the components of FDOM in the urban rivers of Jinan, (2) to compare the variations of individual fluorescence components in dry and wet seasons, (3) to identify the fluorescence features of different water sources, and (4) to explore the multiple impacts of precipitation on FDOM in the urban rivers of Jinan. Here, we tested a hypothesis that precipitation had multiple impacts on FDOM in the urban river system of Jinan and was a key driving factor of FDOM patterns in different seasons. It is expected that this study could support the fundamental knowledge of the impacts of precipitation on FDOM in urban rivers for sustainable urban ecosystem management.
2. Materials and Methods
2.1. Study Area and Sample Collection
Jinan is the capital city of Shandong Province, China. Its main urban area is located in the corridor land between the southern hills and the hanging Yellow River [38]. Xiaoqing River flows through the main city with multiple human-made tributaries. Jinan has a subtropical monsoon climate with frequent rainstorms in the wet season and infrequent precipitation in dry season [39]. Due to the low terrain, Xiaoqing River, together with its tributaries, is the only spillway system of Jinan City. Notably, the severe Typhoon In-fa (No. 2106) passed through Jinan during our sampling period and resulted in a rainstorm event [40]. Therefore, Jinan provides us an opportunity to study the hypothesis.
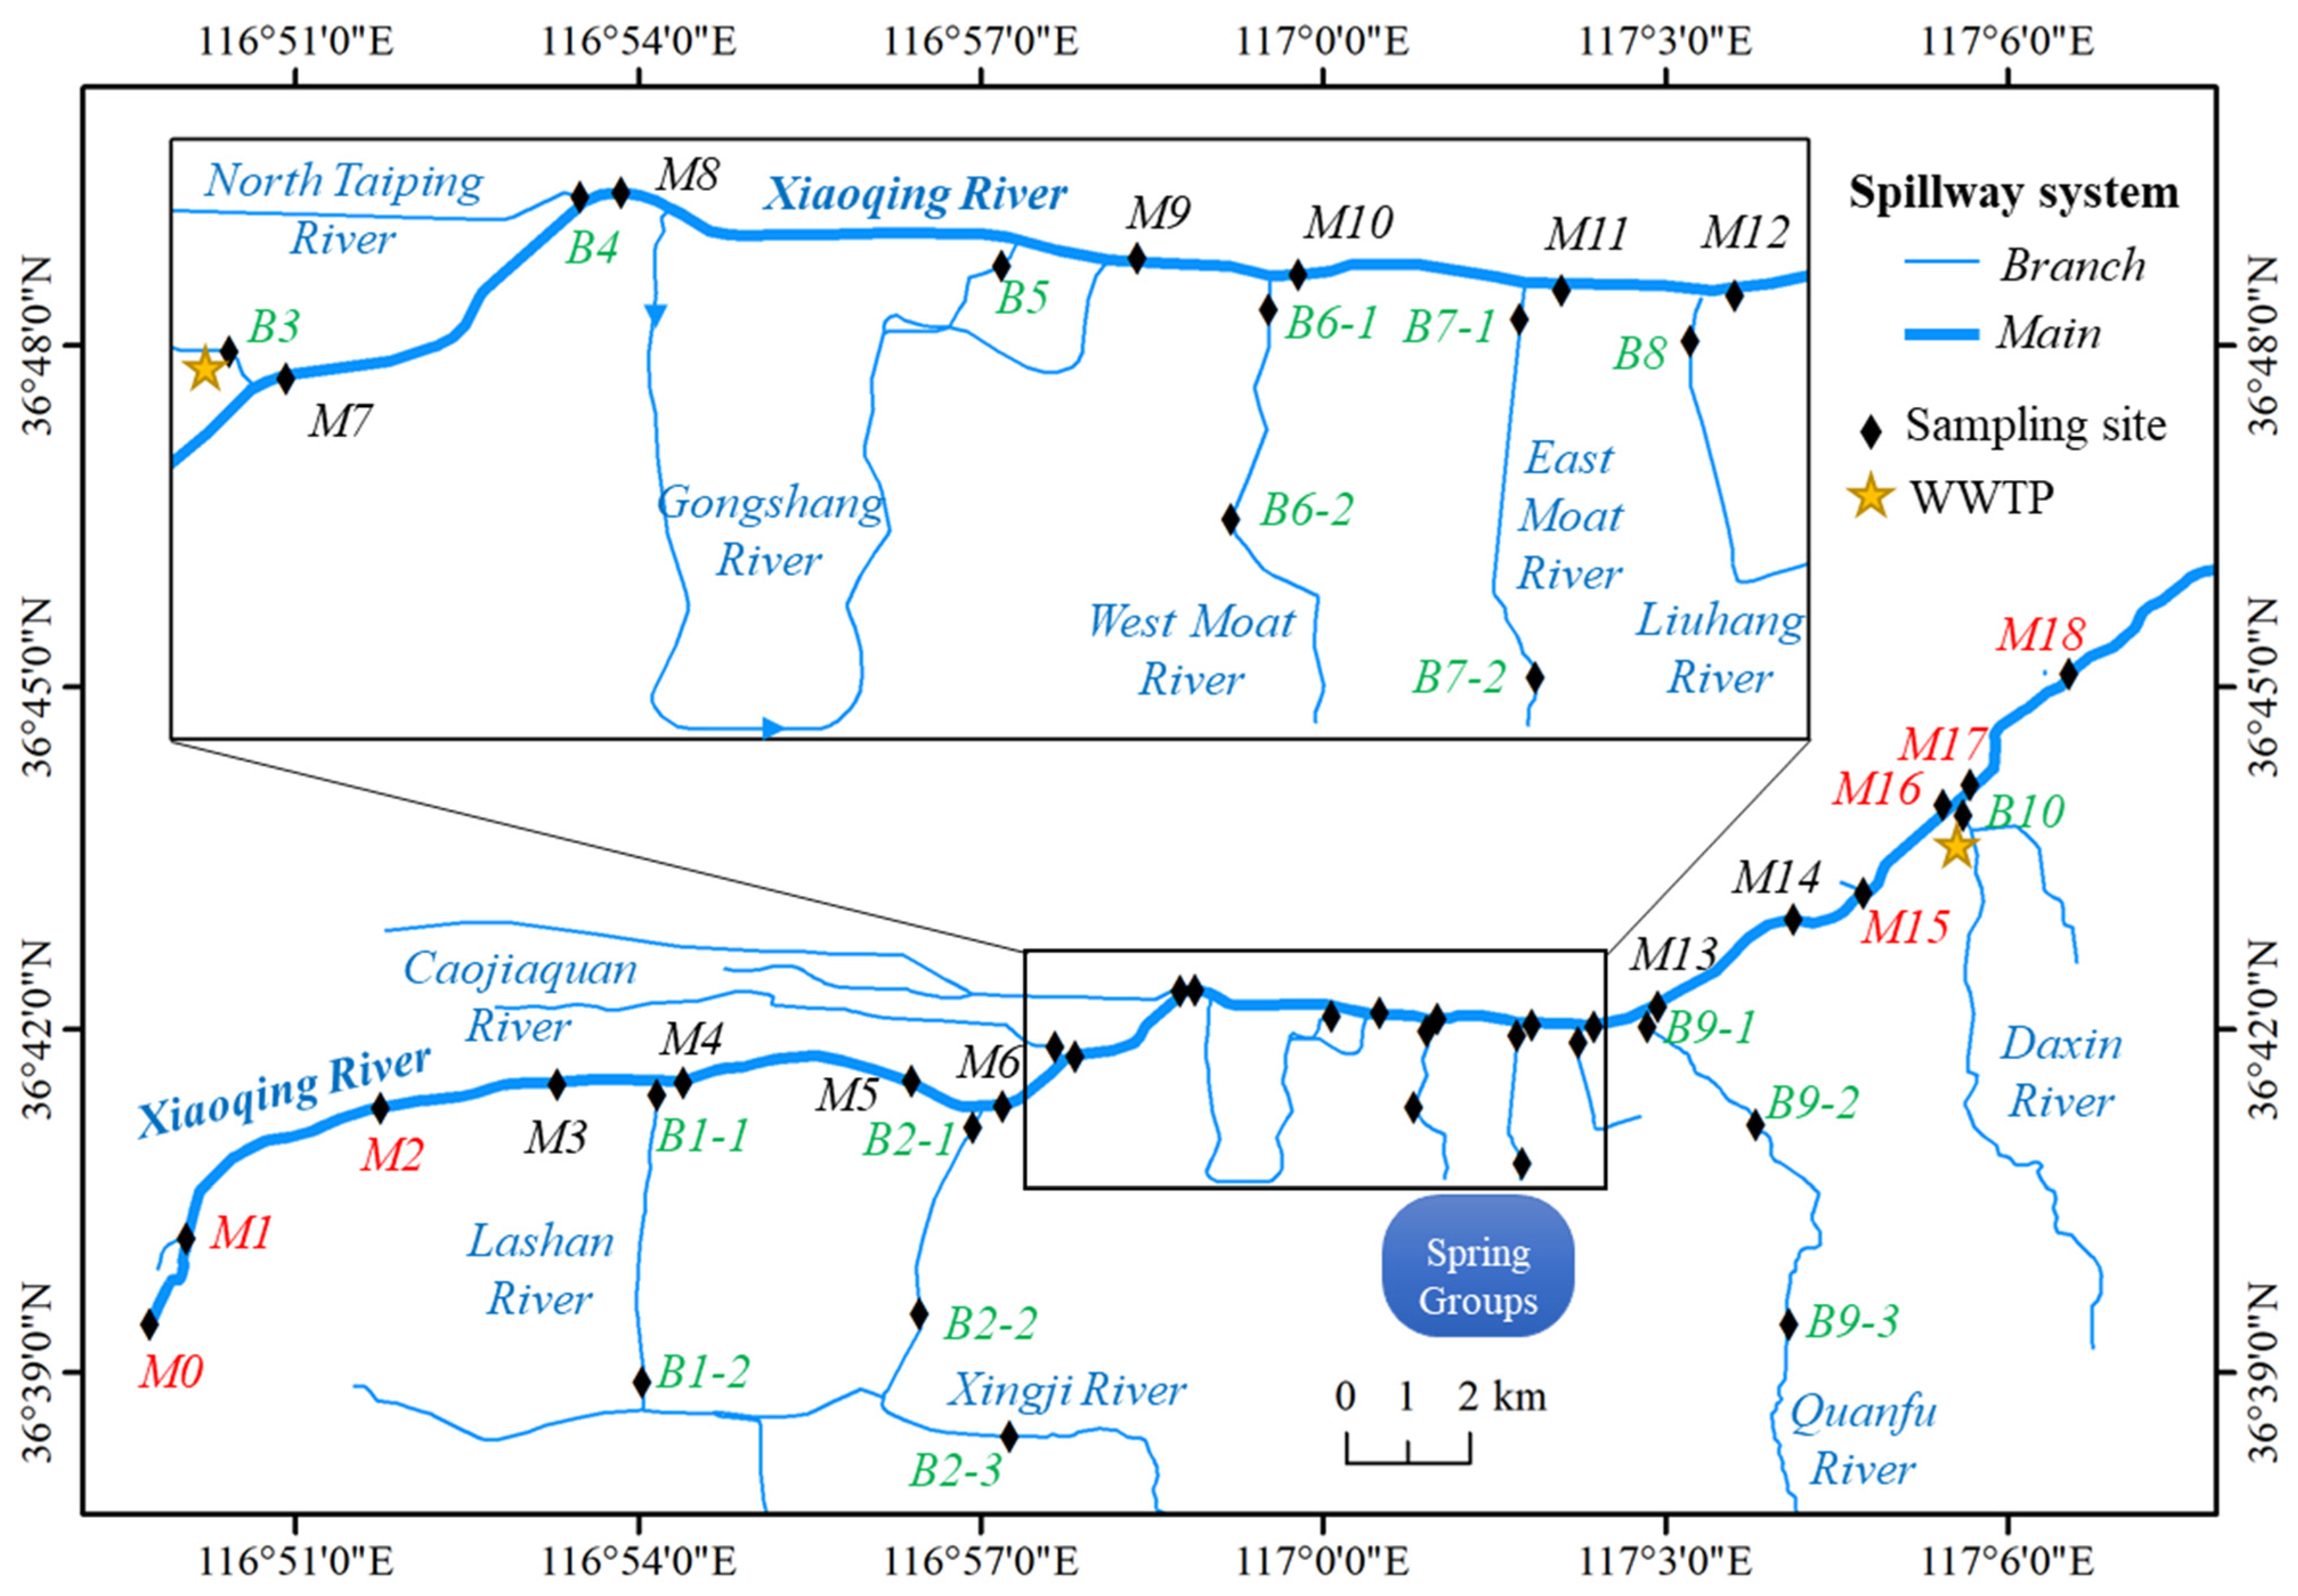
In this study, water samples were collected from 36 sites distributed in the urban river system of Jinan, Shandong Province, China (Figure 1) (see Table S1 for more detailed information in Supplementary Materials). Among them, M0 to M18 were located in the main stream of Xiaoqing River, while the other 17 sites were distributed in 10 different branch spillways flowing into Xiaoqing River. Specifically, M0 to M3 were designed as background sites, M18 was regarded as a declined site, and the others were considered as control sites. The segment of Xiaoqing River from M3 to M14 and the branch spillways included in this section were located in the urban area of Jinan, and the residual segments were located in the suburban area. The 36 studied sites were sampled in both dry season (18–20 May 2021) and wet season (27–29 July 2021). After sampling, the water samples were frozen at −20 °C and sent back to the laboratory for analysis.
2.2. Sample Pretreatment and Instrument Analysis
In the laboratory, the water sample was warmed to room temperature and filtered through a 0.45 μm nylon filter (ANPEL Laboratory Technologies (Shanghai) Inc., Shanghai, China). Then, the filtered sample was re-filtered through a 0.22 μm hydrophobic polytetrafluorethylene (PTFE) filter (ANPEL Laboratory Technologies (Shanghai) Inc., Shanghai, China) to eliminate the disturbance of small particles [41] and was decanted in a quartz cuvette with light path of 1 cm.
Excitation–emission matrix (EEM) of water sample was measured on a Shimadzu RF-6000 fluorescence spectrometer (Shimadzu Corporation, Kyoto, Japan) in 3D spectrum mode. The excitation wavelengths ranged from 200 to 450 nm with 5.0 nm data interval, while the emission wavelengths ranged from 250 to 600 nm with 5.0 nm data interval. The scan speed was set at 6000 nm·min−1. The spectral bandwidth was set at 5.0 nm for both excitation and emission spectra.
2.3. Quality Control and Quality Assurance (QC/QA)
The fluorescence intensity was corrected by the instrument automatically. Ultrapure water (18.2 MΩ·cm−1) was used as negative control for each batch. Sample was diluted with ultrapure water to guarantee that the fluorescence intensity of FDOM signal was within 10,000. The EEM data were calibrated by 10 μg·L−1 quinine sulfate in 1 M sulfuric acid solution, and the fluorescence intensity at Ex. 350 nm/Em. 450 nm was defined as one unit of quinine sulfate (QSU).
2.4. Statistical Analysis
2.4.1. Parallel Factor Analysis (PARAFAC)
The analyses of EEM data were conducted using R 4.1.3 with the package “staRdom” [42]. EEMs were subtracted by blanks (ultrapure water). For each EEM, the scatter areas of Rayleigh scattering and Raman scattering were removed, and these removed areas were interpolated using a multilevel B-splines approach [43]. PARAFAC was employed to decompose EEMs into discrete fluorescent components. The PARAFAC model was run for two to six components, and the appropriate number of components was determined by R-square, split-half analysis [44], and core consistency diagnostic [45]. With the increase in component numbers, R-square gradually elevated, but the core consistency dramatically decreased (Table S2). At equilibrium, the four-component model was selected as the optimal model [44,45], and the split-half analysis also illustrated an acceptable result (Figure S1). The fluorescence intensity was rescaled so the loading matrix shows the maximum fluorescence (Fmax).
2.4.2. Principal Coordinates Analysis (PCoA)
PCoA was applied to explore the spatiotemporal variations of FDOM. The analysis was implemented in R package “vegan” [46]. Bray–Curtis distance was employed to generate the dissimilarity matrix.
3. Results and Discussion
3.1. Optical Properties of FDOM Components
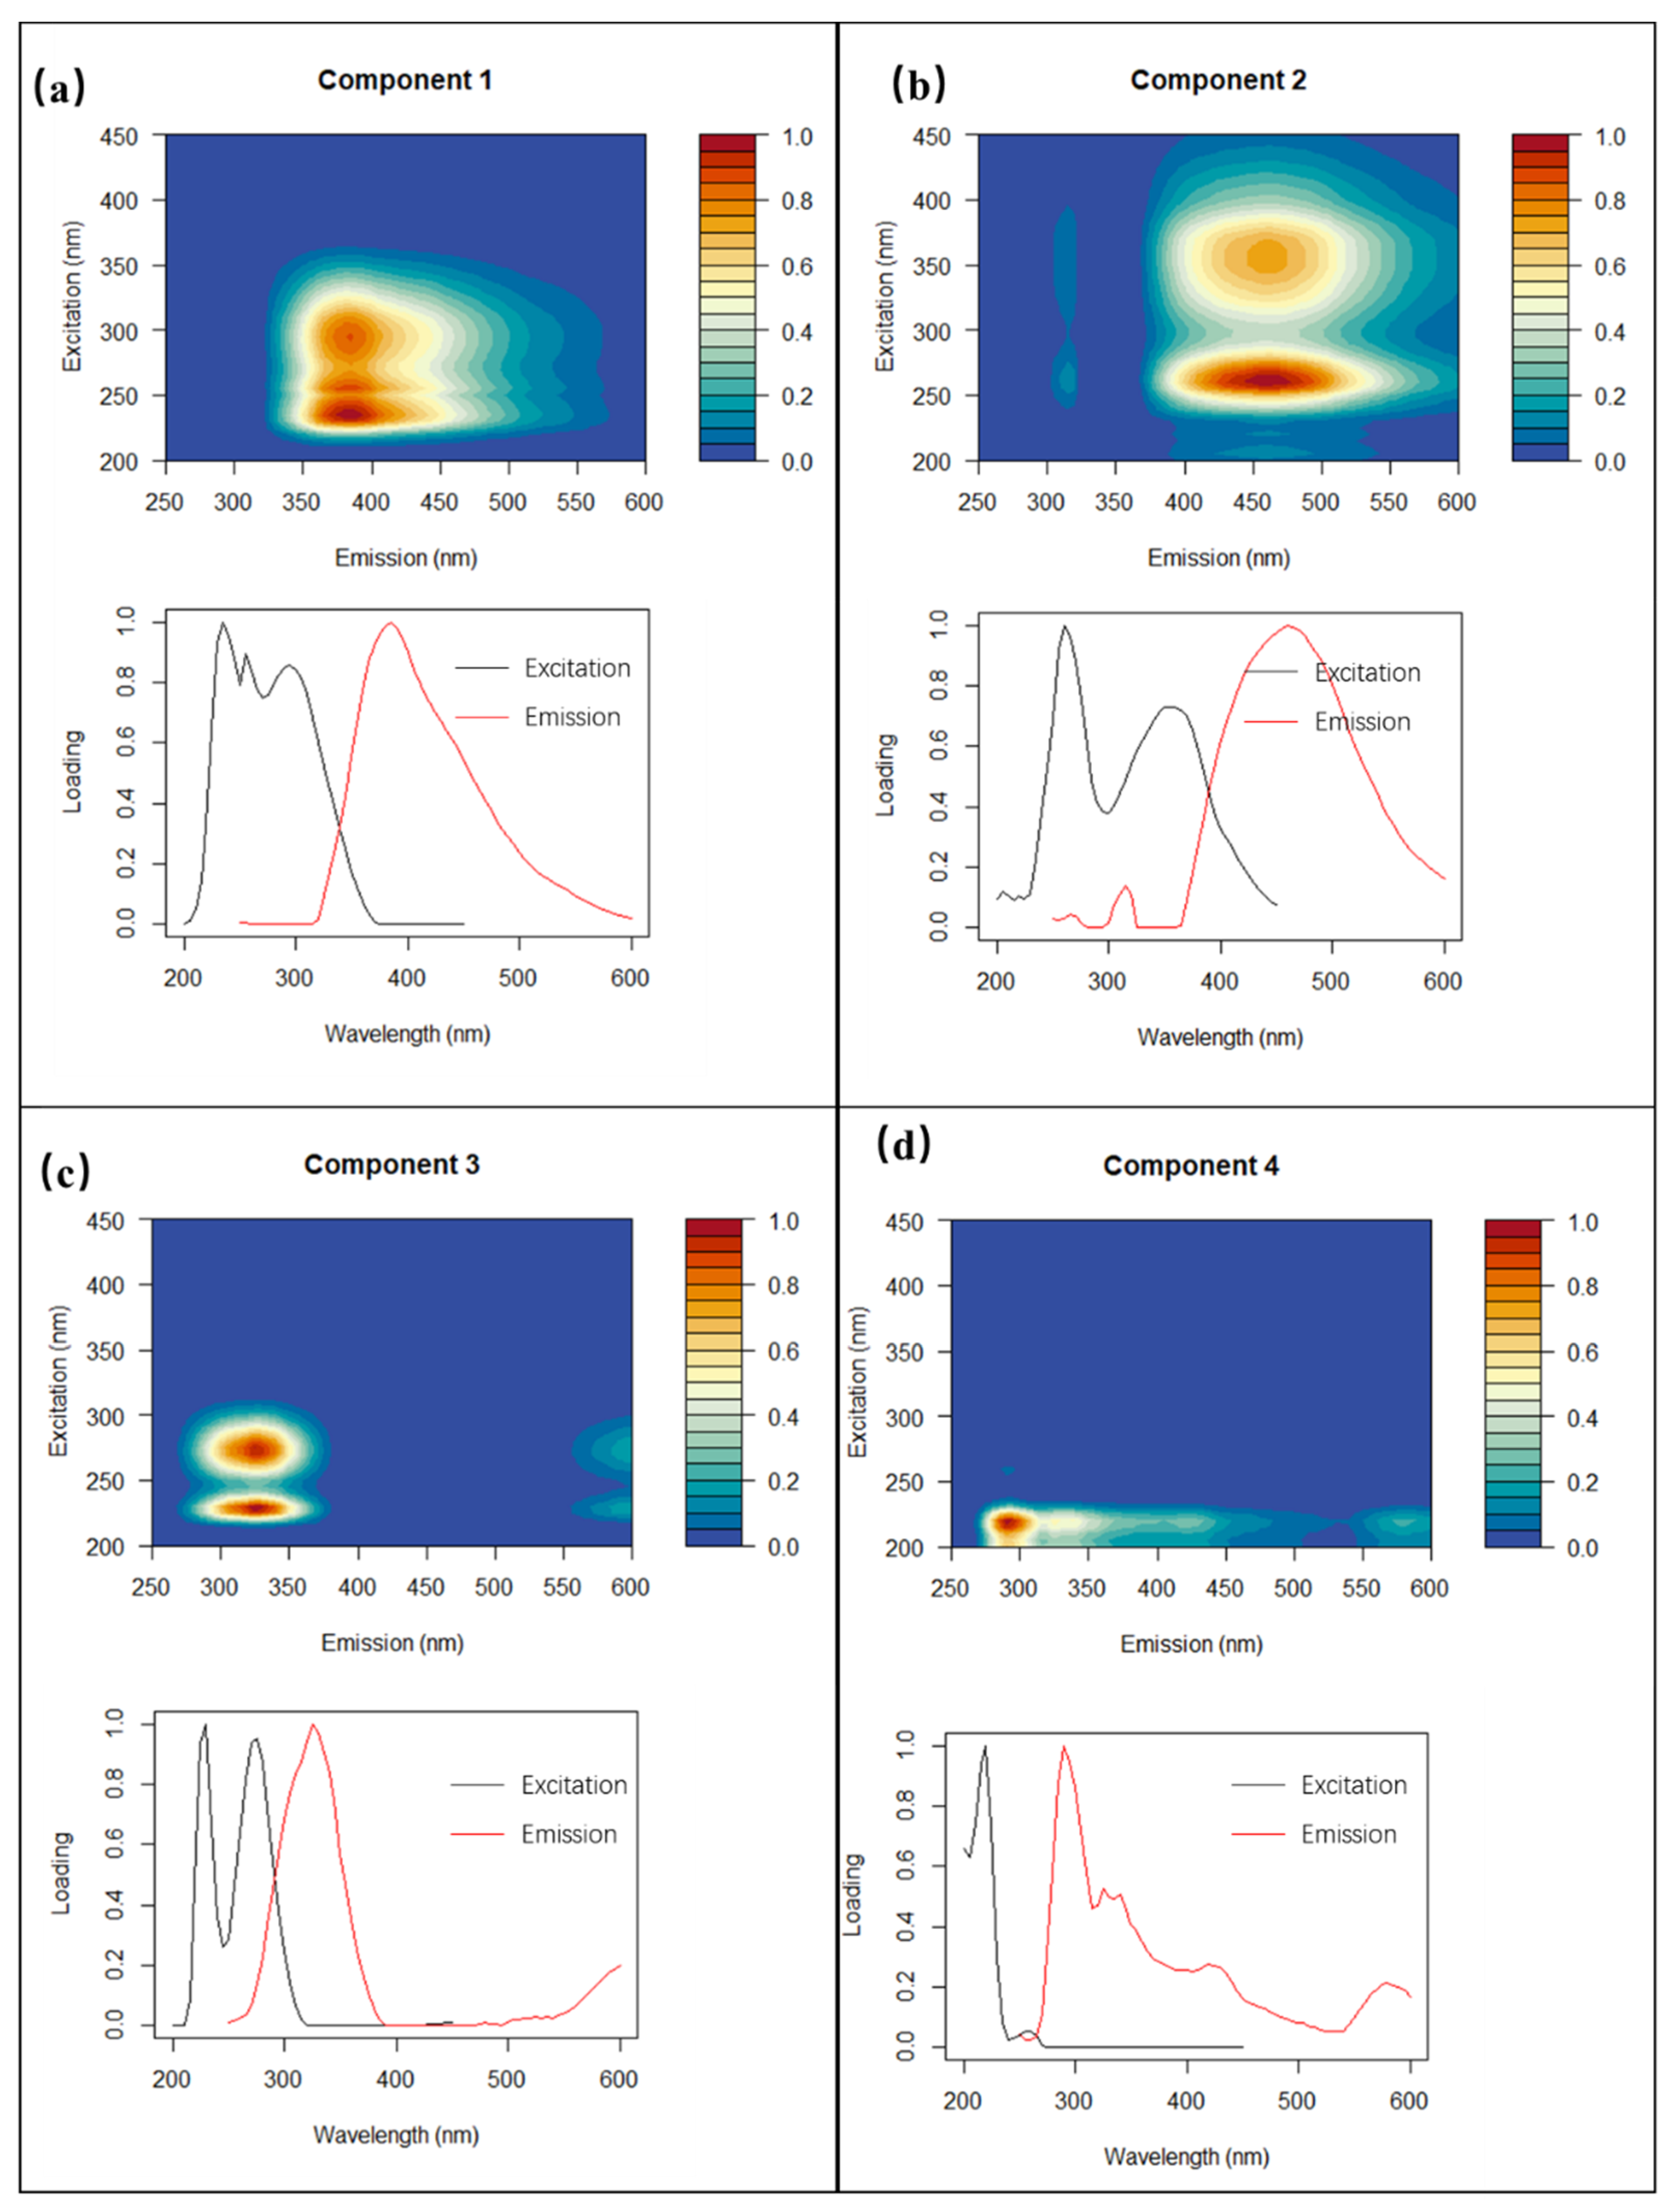
Four fluorescent components from the EEM dataset of FDOM in the river system of Jinan were identified using the PARAFAC model. The spectral characters of each component are presented in Figure 2. Based on the excitation–emission peak location, both autochthonous and allochthonous components were recognized. Component 1 (C1, Ex/Em = 235, 255, 295/385 nm) was categorized as terrestrial fulvic-like substances [47]. Component 2 (C2) was defined as terrestrial humic-like fluorophores (two peaks: Ex/Em = 260/460 nm and Ex/Em = 360/460 nm) [48,49]. Component 3 (C3) was noted as tryptophan-like substances with Ex/Em = 230, 275/325 nm from autochthonous biogenic metabolism [31,50,51]. Component 4 (C4) was reported as tyrosine-like substances with Ex/Em = 220/290 nm [31].
3.2. Temporal Variations of FDOM during Dry and Wet Seasons
Table 1 compares the fluorescence intensity of different components during dry and wet seasons in the urban river system of Jinan. In the dry season, the fluorescence intensities ranged from 1.47 to 10.6 QSU (7.01 ± 2.74 QSU on average), 1.12 to 4.80 QSU (3.25 ± 1.08 QSU), 3.31 to 9.57 QSU (6.90 ± 1.78 QSU), and 0 to 15.5 QSU (3.31 ± 4.32 QSU) for C1, C2, C3, and C4, respectively. In the wet season, the fluorescence intensities ranged from 0.75 to 15.4 QSU (6.64 ± 3.07 QSU), 0.41 to 6.00 QSU (2.27 ± 1.14 QSU), 1.10 to 15.5 QSU (4.54 ± 2.46 QSU), and 0 to 32.3 QSU (5.66 ± 5.81 QSU on average) for C1, C2, C3, and C4, respectively. Overall, the total fluorescence intensities did not show significant variations during the two seasons (6.59 to 35.7 QSU in the dry season, 3.42 to 69.3 QSU in the wet season, p = 0.533); however, significant variations were found for different components. Specifically, all fluorescent components except C1 showed significant temporal variations (p < 0.05) that demonstrated that C2 and C3 declined but C4 increased in the wet season. Our results were different from the patterns of the polluted rivers of Shanghai [37].
The temporal variations of different components could be explained by the precipitation in the wet season. On the one hand, precipitation could dilute the concentration of internal fluorescent substances and result in a decreased fluorescence intensity [35,52]; on the other hand, precipitation could also flush external fluorescent substances into the spillway and cause an increased fluorescence intensity [26,52,53]. For terrestrial fulvic-like fluorophores (C1), the insignificant temporal trend might be interpreted by the approximately balanced effect of direct dilution and external flushing. However, for terrestrial humic-like substances (C2), the temporal trend seemed to be dominated by the dilution effect of precipitation. As for the temporal trend of autochthonous protein-like fluorophores (C3), our interpretation is that the offsetting effect of stronger biogenic metabolism in the wet season with high temperatures might remove the dilution impact of heavy rainfall. In contrast, C4 showed an increasing trend in the wet season. Correlation analysis illustrated that C4 showed no correlations to any of the other components (Figure S2). This implied that the probable sources of C4 might be diversified. The possible sources could be external flushing and further internal degradation. The influence of dilution via precipitation on C4 should be limited.
3.3. Spatial Distribution of FDOM
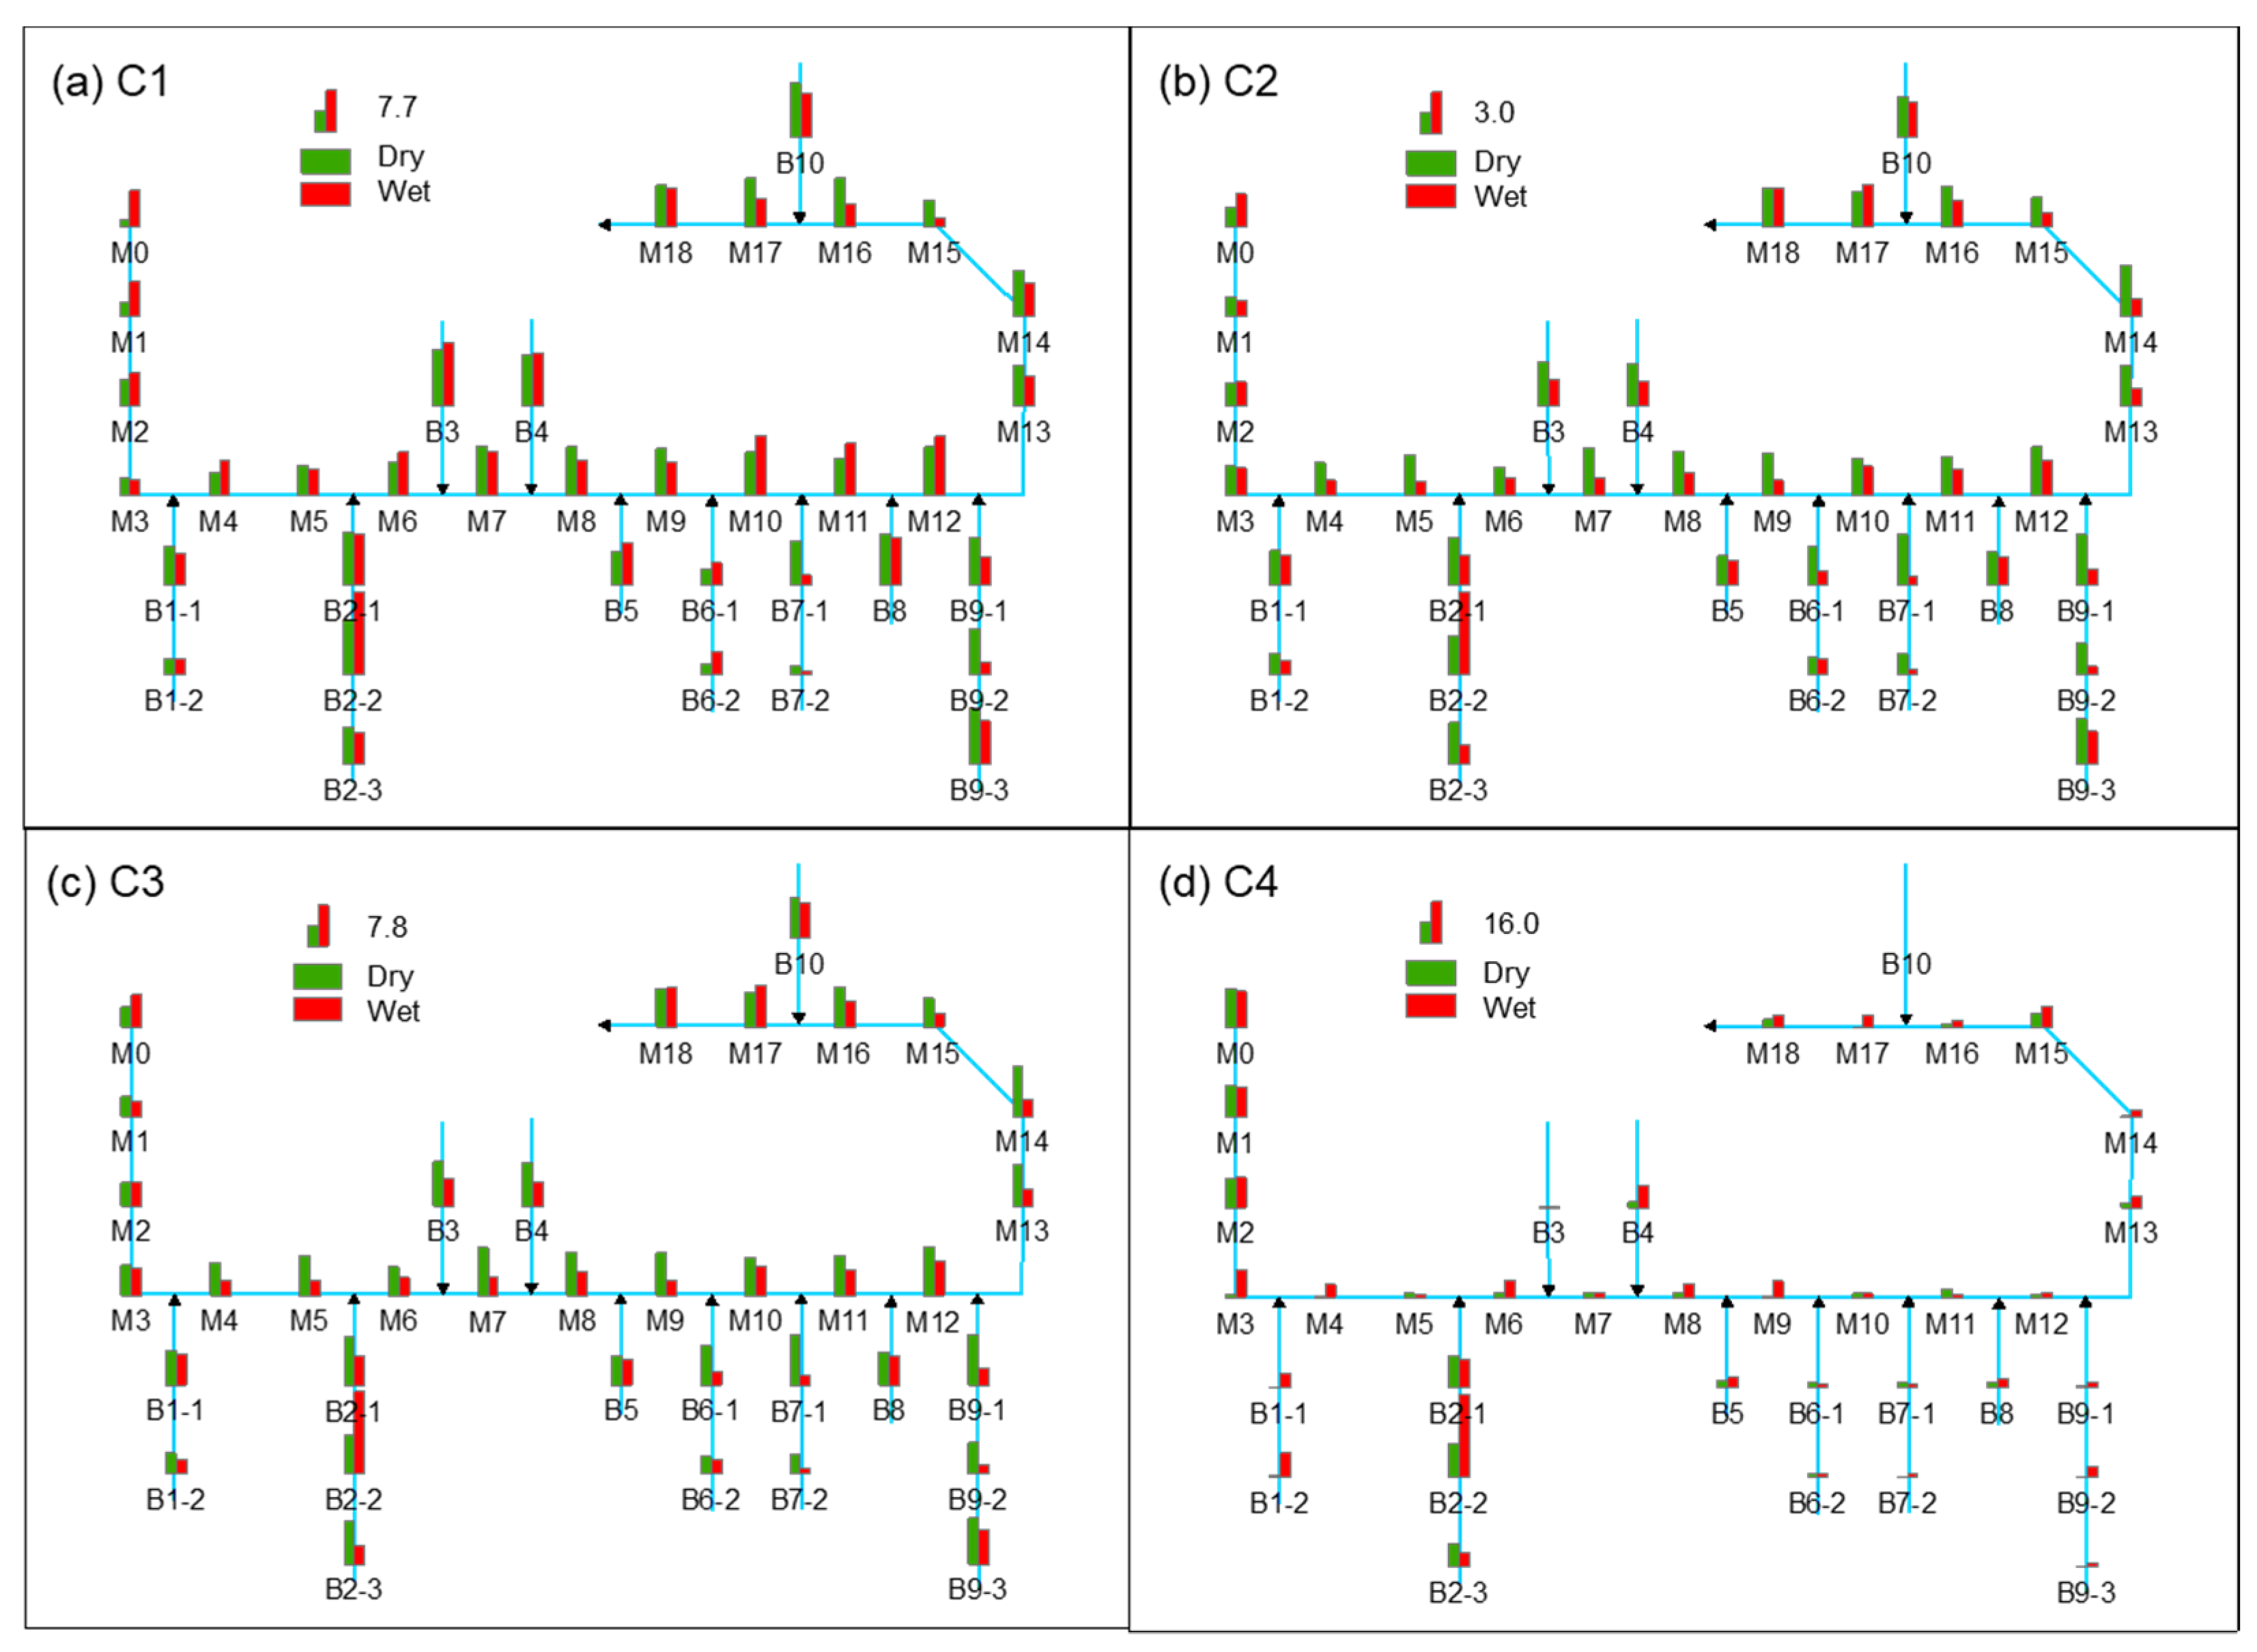
The spatial distribution of each FDOM component is displayed in Figure 3. Here, the coefficient of variation (CV) was applied to evaluate the spatial heterogeneity. C1, C2, and C3 all showed a smaller spatial heterogeneity in both seasons (CV < 0.6), but the spatial heterogeneity was relatively larger in the wet season. The CV values of C1, C2, and C3 were 0.39, 0.33, and 0.26 in the dry season and 0.46, 0.41, and 0.54 in the wet season, respectively. However, C4 showed obvious spatial heterogeneity in both seasons, with CV values of 1.31 and 1.03 in dry and wet seasons, respectively. C4 was found to have higher fluorescence intensities in the background sites (M0 to M2) and the Xingji River sites (B2-1 to B2-3) (Figure 3d). On the one hand, the water source of the Xiaoqing River comes from the Yufu River via the Muli Sluice, and the Yufu River originates from the Wohushan Reservoir and flows through a suburban area [54]. Hence, the higher fluorescence intensities of C4 in M0 to M2 reflected the background input. On the other hand, the Xingji River also originates from water sources located in the valleys of the southern mountains in Jinan [54]. However, the highest fluorescence intensities were not found at the upstream site of the Xingji River (B2-3). Instead, the highest fluorescence intensities of C4 were investigated at the B2-2 site adjacent to the residential area, especially in the wet season. Thereby, the higher fluorescence intensities of C4 in the Xingji River not only reflected the background input but anthropogenic emissions as well.
3.4. Source of Apportionment of FDOM
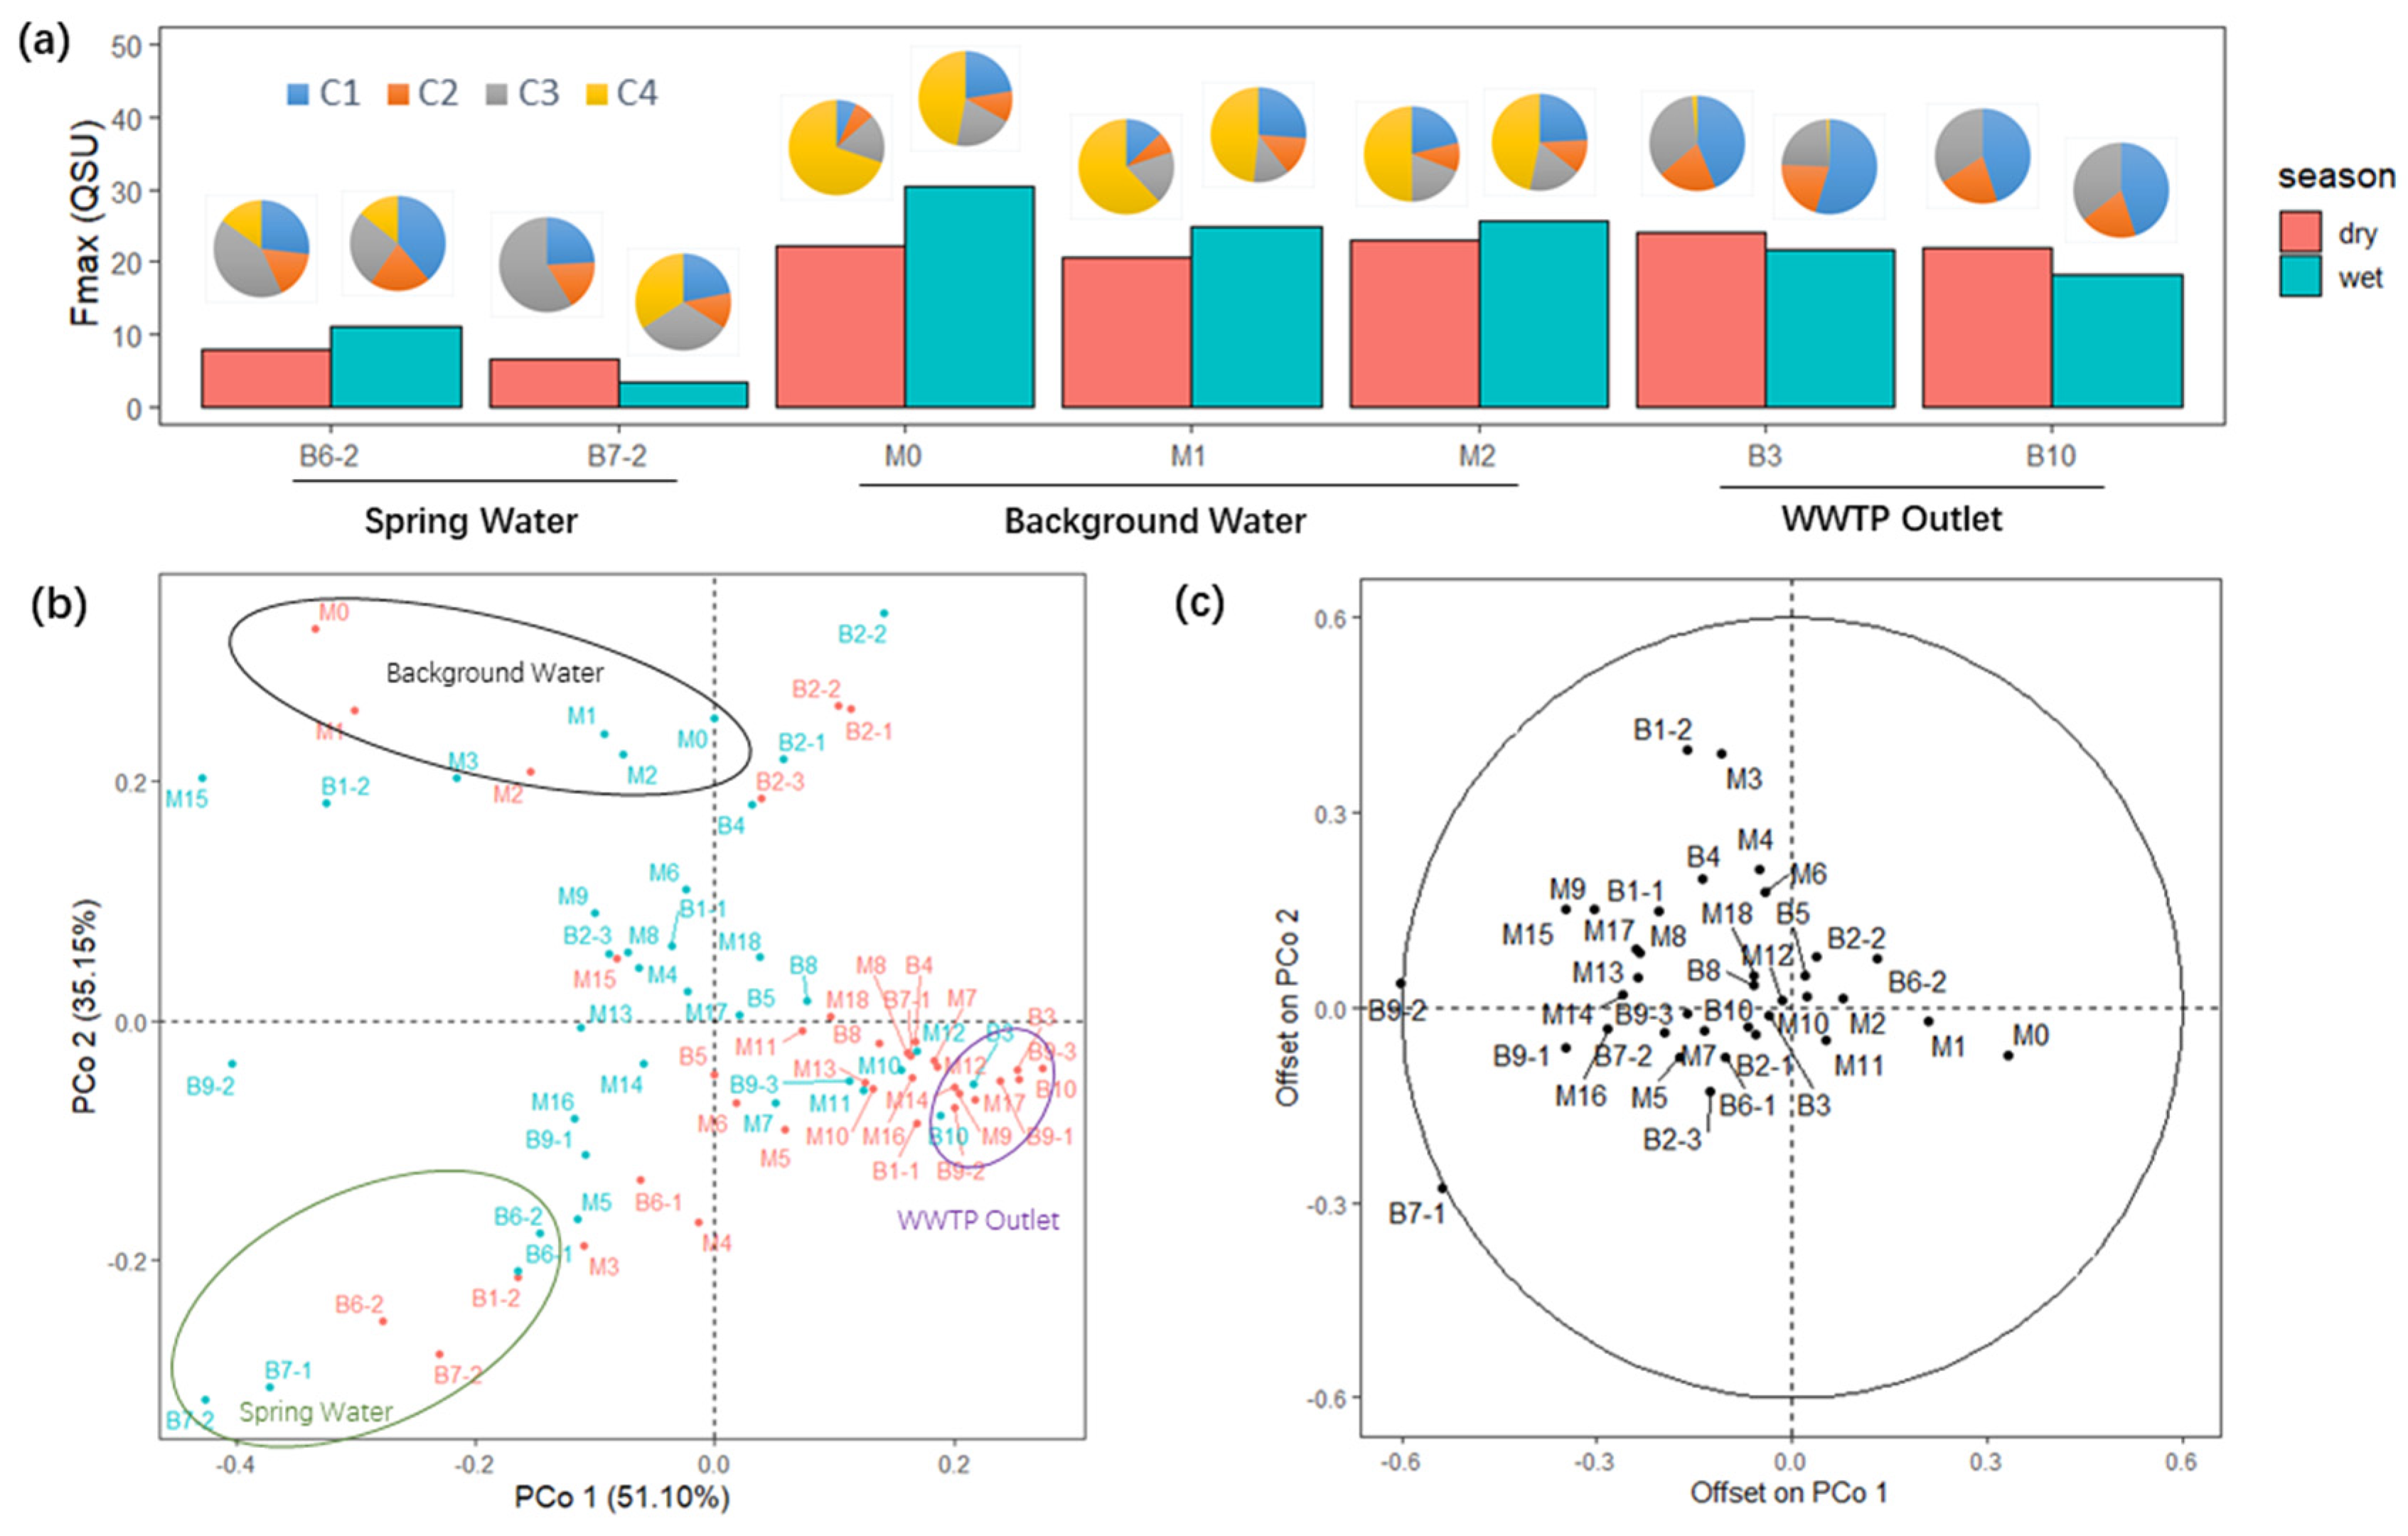
The 36 sites in the current study include 3 kinds of reference sites with definite sources. B6-2 and B7-2 are located downstream of the moat in Jinan directly receiving the water of many famous springs, such as the Wulongtan Springs, Baotu Spring, Heihu Spring, and Zhenzhu Spring (Figure 1). Therefore, these two sites were regarded as the reference sites of spring water sources. M0 to M2 are distributed upstream of the Xiaoqing River, where M0 is at its origin located behind the Mulizha Sluice, and M1 and M2 are distributed in the suburban area. Hence, M0 to M2 were considered as the reference sites of background water. B3 and B10 are arranged at the outlets of two known wastewater treatment plants (WWTPs) (Figure 1) and were thereby identified as the reference sites of a municipal wastewater source. Here, the Fmax and FDOM profiles of the reference sites in different seasons are displayed in Figure 4a. It is obvious that spring water showed the lowest Fmax values, compared to the other reference sites. Background water and WWTP outlet water showed similar Fmax values of approximately 20 QSU but presented quite different FDOM profiles. C4 constituted approximately over 50% of the fluorescent substances for background water, whereas it was barely observed in the WWTP outlet water. The profile of WWTP outlet water was dominated by C1, followed by C3 and C2.
To further clarify the sources of FDOM and the impacts of precipitation on FDOM, PCoA analysis was employed using the Bray–Curtis distance. This analysis considered both the occurrence and profile of FDOM. In total, 86.25% of the variances were explained by the first two principal coordinates (Figure 4b), and the loadings of each fluorescence component are listed in Table S3. The three kinds of reference sites are separated well in the two-dimension PCoA plot. The reference sites of background water, spring water, and WWTP outlets in both seasons are distributed in the top-left, bottom-left, and middle-right areas of the PCoA plot, respectively. Our results illustrated that different sources of FDOM were identified by PCoA, and the FDOM sources of other sites could, therefore, be revealed.
According to Figure 4b, in the dry season, the locations of FDOM in most sites were closer to the location of WWTP outlets, implying that FDOM in the river system of Jinan was mostly influenced by anthropogenic emissions. In the wet season, the positions of almost all sites were left-shifted (Figure 4c), showing a mixed source feature. Here, we considered that the scenario in the wet season probably ascribed to the “mixed effect” of precipitation. On the one hand, rainfall elevated the runoff fluxes of the main and branch spillways [55] and accelerated the mixture of the water body [56]. On the other hand, rainfall also provided sufficient supply to the underground and surface water, resulting in elevations of spring water and surface runoff [57,58]. The higher water fluxes of spring water with a lower prevalence of FDOM together with higher surface runoff input “diluted” the impact of municipal wastewater in a limited outlet flux [59]. For example, M7 and M17 were designated as the mixed cross-sections of WWTP outlets (B3 and B10, respectively) to the Xiaoqing River. Evidently, FDOM features in M7 and M17 were more like WWTP outlets in the dry season, and their similarities were greatly decreased in the wet season (Figure 4b,c). Similar cases could also be found for sites in the Quanfu River (B9-1 to B9-3). Moreover, B7-1 is located in the estuary of the East Moat River, and its FDOM feature was identified as a WWTP outlet in the dry season and spring water in the wet season, which supports our point to some extent.
4. Conclusions
The multiple impacts of precipitation on FDOM in the urban rivers of Jinan City were studied. Four fluorescent components were identified, and the spatiotemporal features for each component were different. It was explained by the different combined effects of dilution and the flushing of precipitation. Three different reference FDOM sources were well illustrated, and the FDOM sources during different seasons were recognized. The changes of FDOM sources in wet season were ascribed to the mixed effect of precipitation. In conclusion, this study provided new insights into the multiple impacts of precipitation on FDOM in an urban river system.
Supplementary Materials
The following supporting information can be downloaded at: https://www.mdpi.com/article/10.3390/w14152323/s1. Table S1. Coordinates of sampling sites; Table S2. The R-square and core consistency of PARAFAC model in different components; Table S3. Loadings of different fluorescence components for principal coordinates analysis; Figure S1. Split-half analysis of optimal four-component PARAFAC model; Figure S2. Correlations of different fluorescent components.
Author Contributions
Conceptualization, J.Y. and C.G.; methodology, J.Y.; software, J.Y.; validation, J.Y. and C.G.; formal analysis, J.Y.; investigation, J.Y., C.G. and X.Z.; resources, J.Y.; data curation, J.Y.; writing—original draft preparation, J.Y.; writing—review and editing, C.G.; visualization, J.Y.; supervision, J.Y.; project administration, J.Y. All authors have read and agreed to the published version of the manuscript.
Funding
This paper was funded by the Major Science and Technology Program for Water Pollution Control and treatment, China (grant no. 2014ZX07203-008).
Data Availability Statement
Not applicable.
Acknowledgments
We acknowledge the continued support and generosity of Xiaoliu Yang from the College of Urban and Environmental Sciences, Peking University. This work was financially supported by the Major Science and Technology Program for Water Pollution Control and treatment, China (grant no. 2014ZX07203-008).
Conflicts of Interest
The authors declare no conflict of interest. The funders had no role in the design of the study; in the collection, analyses, or interpretation of data; in the writing of the manuscript; or in the decision to publish the results.
References
- Sisman, E.E.; Bolu, E. An ecological approach for the planning of urban river green ways. A meric (maritza/evros) river case study, Turkey. J. Environ. Prot. Ecol. 2015, 16, 372–384. [Google Scholar]
- Everard, M.; Moggridge, H.L. Rediscovering the value of urban rivers. Urban Ecosyst. 2012, 15, 293–314. [Google Scholar] [CrossRef]
- Huang, J.; Xie, R.; Yin, H.; Zhou, Q. Assessment of water quality and source apportionment in a typical urban river in China using multivariate statistical methods. Water Supply 2018, 18, 1841–1851. [Google Scholar] [CrossRef]
- Akoteyon, I.S.; Omotayo, A.O.; Soladoye, O.; Olaoye, H.O. Determination of water quality index and suitability of urban river for municipal water supply in Lagos-Nigeria. Eur. J. Sci. Res. 2011, 54, 263–271. [Google Scholar]
- Hasan, M.F.; Nur-E-Alam, M.; Salam, M.A.; Rahman, H.; Paul, S.C.; Rak, A.E.; Ambade, B.; Towfiqul Islam, A.R.M. Health Risk and Water Quality Assessment of Surface Water in an Urban River of Bangladesh. Sustainability 2021, 13, 6832. [Google Scholar] [CrossRef]
- Yue, J. Urban Rivers: A Landscape Ecological Perspective. Hydrol. Curr. Res. 2012, 3, 1000125. [Google Scholar] [CrossRef]
- Ceballos, B.; Soares, N.; Moraes, M.; Catão, R.; Konig, A. Microbiological aspects of an urban river used for unrestricted irrigation in the semi-arid region of north-east Brazil. Water Sci. Technol. 2003, 47, 51–57. [Google Scholar] [CrossRef]
- Park, C.Y.; Lee, D.K.; Asawa, T.; Murakami, A.; Kim, H.G.; Lee, M.K.; Lee, H.S. Influence of urban form on the cooling effect of a small urban river. Landsc. Urban Plan. 2019, 183, 26–35. [Google Scholar] [CrossRef]
- Wang, Y.; Shen, J.; Yan, W.; Chen, C. Effects of Landscape Development Intensity on River Water Quality in Urbanized Areas. Sustainability 2019, 11, 7120. [Google Scholar] [CrossRef] [Green Version]
- Wilkinson, C.L.; Kwik, J.T.; Ow, A.M.; Lim, R.B.; Liu, S.; Tan, C.L.; Saw, A.C.; Liew, J.H.; Yeo, D.C. Rehabilitation of a tropical storm-water drain creates a novel fish assemblage. Ecol. Eng. 2021, 161, 106150. [Google Scholar] [CrossRef]
- Mihu-Pintilie, A.; Cîmpianu, C.I.; Stoleriu, C.C.; Pérez, M.N.; Paveluc, L.E. Using High-Density LiDAR Data and 2D Streamflow Hydraulic Modeling to Improve Urban Flood Hazard Maps: A HEC-RAS Multi-Scenario Approach. Water 2019, 11, 1832. [Google Scholar] [CrossRef] [Green Version]
- Romanescu, G.; Stoleriu, C. An inter-basin backwater overflow (the Buhai Brook and the Ezer reservoir on the Jijia River, Romania). Hydrol. Process. 2014, 28, 3118–3131. [Google Scholar] [CrossRef]
- Zerega, A.; Simões, N.; Feio, M. How to Improve the Biological Quality of Urban Streams? Reviewing the Effect of Hydromorphological Alterations and Rehabilitation Measures on Benthic Invertebrates. Water 2021, 13, 2087. [Google Scholar] [CrossRef]
- Wohl, E.; Lane, S.N.; Wilcox, A.C. The science and practice of river restoration. Water Resour. Res. 2015, 51, 5974–5997. [Google Scholar] [CrossRef] [Green Version]
- McFarland, A.R.; Larsen, L.; Yeshitela, K.; Engida, A.N.; Love, N.G. Guide for using green infrastructure in urban environments for stormwater management. Environ. Sci. Water Res. Technol. 2019, 5, 643–659. [Google Scholar] [CrossRef]
- Jefferson, A.J.; Bhaskar, A.S.; Hopkins, K.G.; Fanelli, R.; Avellaneda, P.M.; McMillan, S.K. Stormwater management network effectiveness and implications for urban watershed function: A critical review. Hydrol. Process. 2017, 31, 4056–4080. [Google Scholar] [CrossRef]
- Ivanovsky, A.; Criquet, J.; Dumoulin, D.; Alary, C.; Prygiel, J.; Duponchel, L.; Billon, G. Water quality assessment of a small peri-urban river using low and high frequency monitoring. Environ. Sci. Process. Impacts 2016, 18, 624–637. [Google Scholar] [CrossRef]
- Carstea, E.; Baker, A.; Savastru, R. Comparison of river and canal water dissolved organic matter fluorescence within an urbanised catchment. Water Environ. J. 2014, 28, 11–22. [Google Scholar] [CrossRef]
- Zhong, J.; Li, S.L.; Cai, H.M.; Yue, F.J.; Tao, F.X. The Response of Carbon Geochemistry to Hydrological Events within an Urban River, Southwestern China. Geochem. Int. 2018, 56, 462–473. [Google Scholar] [CrossRef]
- Zhang, P.; Yue, F.-J.; Wang, X.-D.; Chen, S.-N.; Li, X.-Z.; Liu, T.-Z.; Yang, C. Antecedent rainfall and land use controlling the fate of nitrogen in karst urban rivers, elucidated by an isotopic approach. J. Hydrol. 2021, 592, 125803. [Google Scholar] [CrossRef]
- Dwight, R.H.; Semenza, J.C.; Baker, D.B.; Olson, B.H. Association of Urban Runoff with Coastal Water Quality in Orange County, California. Water Environ. Res. 2002, 74, 82–90. [Google Scholar] [CrossRef]
- Fan, Y.; Zheng, J.; Deng, L.; Rao, W.; Zhang, Q.; Liu, T.; Qian, X. Spatiotemporal dynamics of microplastics in an urban river network area. Water Res. 2022, 212, 118116. [Google Scholar] [CrossRef]
- Zhang, Q.; Wang, X.; Sun, F.; Sun, J.; Liu, J.; Ouyang, Z. Assessment of temporal and spatial differences of source apportionment of nitrate in an urban river in China, using delta N-15 and delta O-18 values and an isotope mixing model. Environ. Sci. Pollut. Res. 2015, 22, 20226–20233. [Google Scholar] [CrossRef]
- Peng, X.; Zhang, K.; Tang, C.; Huang, Q.; Yu, Y.; Cui, J. Distribution pattern, behavior, and fate of antibacterials in urban aquatic environments in South China. J. Environ. Monit. 2011, 13, 446–454. [Google Scholar] [CrossRef]
- Mei, X.; Sui, Q.; Lyu, S.; Wang, D.; Zhao, W. Pharmaceuticals and personal care products in the urban river across the megacity Shanghai: Occurrence, source apportionment and a snapshot of influence of rainfall. J. Hazard. Mater. 2018, 359, 429–436. [Google Scholar] [CrossRef]
- Liu, Y.; Wang, C.; Yu, Y.; Chen, Y.; Du, L.; Qu, X.; Peng, W.; Zhang, M.; Gui, C. Effect of Urban Stormwater Road Runoff of Different Land Use Types on an Urban River in Shenzhen, China. Water 2019, 11, 2545. [Google Scholar] [CrossRef] [Green Version]
- Parr, T.B.; Cronan, C.S.; Ohno, T.; Findlay, S.E.G.; Smith, S.M.C.; Simon, K.S. Urbanization changes the composition and bioavailability of dissolved organic matter in headwater streams. Limnol. Oceanogr. 2015, 60, 885–900. [Google Scholar] [CrossRef] [Green Version]
- Gücker, B.; Silva, R.C.; Graeber, D.; Monteiro, J.; Boëchat, I. Urbanization and agriculture increase exports and differentially alter elemental stoichiometry of dissolved organic matter (DOM) from tropical catchments. Sci. Total Environ. 2016, 550, 785–792. [Google Scholar] [CrossRef]
- Croghan, D.; Khamis, K.; Bradley, C.; Van Loon, A.F.; Sadler, J.; Hannah, D.M. Combining in-situ fluorometry and distributed rainfall data provides new insights into natural organic matter transport dynamics in an urban river. Sci. Total Environ. 2020, 755, 142731. [Google Scholar] [CrossRef] [PubMed]
- Tang, J.; Li, X.; Cao, C.; Lin, M.; Qiu, Q.; Xu, Y.; Ren, Y. Compositional variety of dissolved organic matter and its correlation with water quality in peri-urban and urban river watersheds. Ecol. Indic. 2021, 104, 459–469. [Google Scholar] [CrossRef]
- Duan, P.; Wei, M.; Yao, L.; Li, M. Relationship between non-point source pollution and fluorescence fingerprint of riverine dissolved organic matter is season dependent. Sci. Total Environ. 2022, 823, 153617. [Google Scholar] [CrossRef]
- Lin, C.Y.; Manley, S.L. Bromoform production from seawater treated with bromoperoxidase. Limnol. Oceanogr. 2012, 57, 1857–1866. [Google Scholar] [CrossRef]
- Hur, J.; Hwang, S.-J.; Shin, J.-K. Using Synchronous Fluorescence Technique as a Water Quality Monitoring Tool for an Urban River. Water Air Soil Pollut. 2008, 191, 231–243. [Google Scholar] [CrossRef]
- Wang, X.; Zhang, F.; Kung, H.-T.; Ghulam, A.; Trumbo, A.L.; Yang, J.; Ren, Y.; Jing, Y. Evaluation and estimation of surface water quality in an arid region based on EEM-PARAFAC and 3D fluorescence spectral index: A case study of the Ebinur Lake Watershed, China. CATENA 2017, 155, 62–74. [Google Scholar] [CrossRef]
- Carstea, E.M.; Baker, A.; Pavelescu, G.; Boomer, I. Continuous fluorescence assessment of organic matter variability on the Bournbrook River, Birmingham, UK. Hydrol. Process. 2009, 23, 1937–1946. [Google Scholar] [CrossRef]
- Lee, M.-H.; Lee, Y.K.; Derrien, M.; Choi, K.; Shin, K.H.; Jang, K.-S.; Hur, J. Evaluating the contributions of different organic matter sources to urban river water during a storm event via optical indices and molecular composition. Water Res. 2019, 165, 115006. [Google Scholar] [CrossRef]
- Zhu, Y.; Chen, H.; Ding, G.P.; Sun, X.N.; Liu, H.; Ye, J.F. Distribution and influencing factors of DOM components in urban and suburban polluted rivers. Environ. Sci. 2021, 42, 5264–5274. (In Chinese) [Google Scholar] [CrossRef]
- Zhao, Y.; Xia, J.; Xu, Z.; Zou, L.; Qiao, Y.; Li, P. Impact of Urban Expansion on Rain Island Effect in Jinan City, North China. Remote Sens. 2021, 13, 2989. [Google Scholar] [CrossRef]
- Chen, S.; Liu, L.; Xu, S.; Ma, M.; Wang, D.; Wang, F.; Liu, J. Multi-scale update on precipitation characteristics at Jinan, East China. J. Water Clim. Chang. 2021, 12, 1268–1281. [Google Scholar] [CrossRef]
- Tang, F.; Chen, F.J.; Zhuge, X.Y.; Wu, F.L.; Yu, L.; Yao, B. Analysis of influence process of Typhoon In-fa (202106) based on satellite remote sensing data. Trans. Atmos. Sci. 2021, 44, 701–716. (In Chinese) [Google Scholar] [CrossRef]
- Zhang, Y.; Zhou, L.; Zhou, Y.; Zhang, L.; Yao, X.; Shi, K.; Jeppesen, E.; Yu, Q.; Zhu, W. Chromophoric dissolved organic matter in inland waters: Present knowledge and future challenges. Sci. Total Environ. 2021, 759, 143550. [Google Scholar] [CrossRef] [PubMed]
- Pucher, M.; Wünsch, U.; Weigelhofer, G.; Murphy, K.; Hein, T.; Graeber, D. staRdom: Versatile Software for Analyzing Spectroscopic Data of Dissolved Organic Matter in R. Water 2019, 11, 2366. [Google Scholar] [CrossRef] [Green Version]
- Lee, S.; Wolberg, G.; Shin, S.Y. Scattered data interpolation with multilevel B-splines. IEEE Trans. Vis. Comput. Graph. 1997, 3, 228–244. [Google Scholar] [CrossRef] [Green Version]
- Murphy, K.R.; Stedmon, C.A.; Graeber, D.; Bro, R. Fluorescence spectroscopy and multi-way techniques. PARAFAC. Anal. Methods 2013, 5, 6557–6566. [Google Scholar] [CrossRef] [Green Version]
- Bro, R.; Kiers, H.A.L. A new efficient method for determining the number of components in PARAFAC models. J. Chemom. 2003, 17, 274–286. [Google Scholar] [CrossRef]
- Oksanen, J.; Blanchet, F.G.; Kindt, R.; Legendre, P.; O’hara, R.B.; Simpson, G.L.; Solymos, P.; Stevens, M.H.H.; Wagner, H. Vegan: Community Ecology Package. R Package Version 2.5-7. Available online: https://CRAN.R-project.org/package=vegan (accessed on 25 June 2022).
- Han, Z.; Xiao, M.; Yue, F.; Yi, Y.; Mostofa, K. Seasonal Variations of Dissolved Organic Matter by Fluorescent Analysis in a Typical River Catchment in Northern China. Water 2021, 13, 494. [Google Scholar] [CrossRef]
- Coble, P.G. Characterization of marine and terrestrial DOM in seawater using excitation-emission matrix spectroscopy. Mar. Chem. 1996, 51, 325–346. [Google Scholar] [CrossRef]
- Ferretto, N.; Tedetti, M.; Guigue, C.; Mounier, S.; Raimbault, P.; Goutx, M. Spatio-temporal variability of fluorescent dissolved organic matter in the Rhône River delta and the Fos-Marseille marine area (NW Mediterranean Sea, France). Environ. Sci. Pollut. Res. 2016, 24, 4973–4989. [Google Scholar] [CrossRef] [Green Version]
- Lee, S.-A.; Kim, G. Sources, fluxes, and behaviors of fluorescent dissolved organic matter (FDOM) in the Nakdong River Estuary, Korea. Biogeosciences 2018, 15, 1115–1122. [Google Scholar] [CrossRef] [Green Version]
- Mostofa, K.M.G.; Li, W.; Wu, F.; Liu, C.-Q.; Liao, H.; Zeng, L.; Xiao, M. Environmental characteristics and changes of sediment pore water dissolved organic matter in four Chinese lakes. Environ. Sci. Pollut. Res. 2018, 25, 2783–2804. [Google Scholar] [CrossRef]
- Zhao, Y.; Song, K.; Wen, Z.; Li, L.; Zang, S.; Shao, T.; Li, S.; Du, J. Seasonal characterization of CDOM for lakes in semiarid regions of Northeast China using excitation–emission matrix fluorescence and parallel factor analysis (EEM–PARAFAC). Biogeosciences 2016, 13, 1635–1645. [Google Scholar] [CrossRef] [Green Version]
- Rio, M.; Salles, C.; Cernesson, F.; Marchand, P.; Tournoud, M.-G. An original urban land cover representation and its effects on rain event-based runoff and TSS modelling. J. Hydrol. 2020, 586, 124865. [Google Scholar] [CrossRef]
- Ci, M.; Zhang, G.; Yan, X.; Dong, W.; Xu, W.; Wang, W.; Fan, Y. Occurrence of antibiotics in the Xiaoqing River basin and antibiotic source contribution-a case study of Jinan city, China. Environ. Sci. Pollut. Res. 2021, 28, 25241–25254. [Google Scholar] [CrossRef] [PubMed]
- Old, G.H.; Leeks, G.J.; Packman, J.C.; Smith, B.P.; Lewis, S.; Hewitt, E.J.; Holmes, M.; Young, A. The impact of a convectional summer rainfall event on river flow and fine sediment transport in a highly urbanised catchment: Bradford, West Yorkshire. Sci. Total Environ. 2003, 314, 495–512. [Google Scholar] [CrossRef]
- Connor, N.P.; Sarraino, S.; Frantz, D.E.; Bushaw-Newton, K.; MacAvoy, S.E. Geochemical characteristics of an urban river: Influences of an anthropogenic landscape. Appl. Geochem. 2014, 47, 209–216. [Google Scholar] [CrossRef]
- Qi, H.; Qin, P.R.; Ding, G.T. Impact of Artificial recharge in Jinan City based on GMS. J. Irrig. Drain. 2018, 37, 98–105. (In Chinese) [Google Scholar] [CrossRef]
- Yu, H.J.; Huang, G.R.; Wu, C.H. Study on Urban Storm Water Modeling at Jinan City Using SWMM Model. J. Water Resour. Res. 2012, 1, 433–439. [Google Scholar] [CrossRef]
- Peters, M.; Guo, Q.; Strauss, H.; Wei, R.; Li, S.-L.; Yue, F.-J. Contamination patterns in river water from rural Beijing: A hydrochemical and multiple stable isotope study. Sci. Total Environ. 2019, 654, 226–236. [Google Scholar] [CrossRef]
Figure 1.
Location of the sampling sites in the urban river system of Jinan, China. Sampling sites with red and black labels are located in the suburban and urban segments of Xiaoqing River, respectively. Sampling sites with green label are located in the branch rivers. WWTP: wastewater treatment plant.

Figure 2.
Fluorescent components identified by PARAFAC model. (a) Component 1, (b) Component 2, (c) Component 3, and (d) Component 4. The contour plots indicate the fluorescence signatures, and the line plots illustrate the spectral curves of excitation and emission of each component.
Figure 2.
Fluorescent components identified by PARAFAC model. (a) Component 1, (b) Component 2, (c) Component 3, and (d) Component 4. The contour plots indicate the fluorescence signatures, and the line plots illustrate the spectral curves of excitation and emission of each component.

Figure 3.
Spatial distributions of FDOM components of (a) C1, (b) C2, (c) C3, and (d) C4.

Figure 4.
Spatiotemporal variations of fluorescent dissolved organic matter (FDOM) in the urban river system of Jinan, China. (a) Fmax and FDOM profiles of reference sites with different sources. (b) Principal coordinates analysis (PCoA) of Bray–Curtis distances of FDOM components. Labels in red and green indicate dry and wet seasons, respectively. (c) Offsets of studied sites in PCoA plot. Offset was calculated by locations in dry season minus those in wet season.


Table 1.
Temporal variations of FDOM components in urban river of Jinan, China.
| FDOM Components | Statistics | Season | p-Values 1 | |
|---|---|---|---|---|
| Dry | Wet | |||
| C1 | Range | 1.47–10.6 | 0.75–15.4 | 0.440 |
| Median | 7.92 | 6.39 | ||
| Mean ± SD 2 | 7.01 ± 2.74 | 6.64 ± 3.07 | ||
| C2 | Range | 1.12–4.80 | 0.41–6.00 | 0.024 |
| Median | 3.74 | 2.82 | ||
| Mean ± SD | 3.25 ± 1.08 | 2.77 ± 1.14 | ||
| C3 | Range | 3.31–9.57 | 1.10–15.5 | 1.88 × 10⁻⁵ |
| Median | 7.39 | 4.44 | ||
| Mean ± SD | 6.90 ± 1.78 | 4.54 ± 2.46 | ||
| C4 | Range | 0–15.5 | 0–32.3 | 1.46 × 10⁻³ |
| Median | 1.68 | 4.31 | ||
| Mean ± SD | 3.31 ± 4.32 | 5.66 ± 5.81 | ||
| All | Range | 6.59–35.7 | 3.42–69.3 | 0.533 |
| Median | 21.6 | 19.0 | ||
| Mean ± SD | 20.5 ± 5.98 | 19.6 ± 10.3 | ||
Notes: 1 Paired t-test with null hypothesis of true difference in means is equal to zero. 2 SD: standard deviation.
Publisher’s Note: MDPI stays neutral with regard to jurisdictional claims in published maps and institutional affiliations. |
© 2022 by the authors. Licensee MDPI, Basel, Switzerland. This article is an open access article distributed under the terms and conditions of the Creative Commons Attribution (CC BY) license (https://creativecommons.org/licenses/by/4.0/).
Share and Cite
MDPI and ACS Style
Yang, J.; Gao, C.; Zhang, X. The Impacts of Precipitation on Fluorescent Dissolved Organic Matter (FDOM) in an Urban River System. Water 2022, 14, 2323. https://doi.org/10.3390/w14152323
AMA Style
Yang J, Gao C, Zhang X. The Impacts of Precipitation on Fluorescent Dissolved Organic Matter (FDOM) in an Urban River System. Water. 2022; 14(15):2323. https://doi.org/10.3390/w14152323
Chicago/Turabian StyleYang, Jiashuai, Chan Gao, and Xuantong Zhang. 2022. "The Impacts of Precipitation on Fluorescent Dissolved Organic Matter (FDOM) in an Urban River System" Water 14, no. 15: 2323. https://doi.org/10.3390/w14152323
Note that from the first issue of 2016, this journal uses article numbers instead of page numbers. See further details here.