Article

Permafrost Degradation Impact on Water Bodies in the Siberian Tundra (Samoylov and Kurungnakh Islands, Lena Delta) Using GIS Analysis of Remote Sensing Data and a Geochemical Approach

by
Nataliya Yurkevich
1,*,
Andrei Kartoziia
1,2,3 and
Ekaterina Tsibizova
1
1
Trofimuk Institute of Petroleum Geology and Geophysics, Siberian Branch of the Russian Academy of Sciences, 3 Koptyug Avenue, 630090 Novosibirsk, Russia
2
Sobolev Institute of Geology and Mineralogy, Siberian Branch of the Russian Academy of Sciences, 3 Koptyug Avenue, 630090 Novosibirsk, Russia
3
Department of Geology and Geophysics, Novosibirsk State University, 1 Pirogov Street, 630090 Novosibirsk, Russia
*
Author to whom correspondence should be addressed.
Water 2022, 14(15), 2322; https://doi.org/10.3390/w14152322
Submission received: 15 June 2022 / Revised: 16 July 2022 / Accepted: 17 July 2022 / Published: 26 July 2022
(This article belongs to the Section Hydrology)

Abstract

:
The article presents the geomorphological and geochemical investigation of the water bodies on the Samoylov and Kurunghnakh Islands, the Lena River delta. We used GIS-analyze analysis for identifying water body groups, depending on their geomorphological features. The studied water bodies are located on two principally different surfaces: the first and the third terraces of the Lena Delta. The water bodies occupy thermokarst hollow bottoms, which have various elevations above sea level. We identified the altitudes of the water bodies’ water surfaces by analysing with ArcticDEM. Additionally, we estimated the area of the water bodies by hand after mapping the borders of the water bodies in UAV imageries. We sampled the bottom sediments and water’s chemical composition. All water bodies were divided into groups: (1) small water bodies on the Yedoma upland surface; (2) water bodies in six thermokarst hollows; (3) water bodies on the first terrace. The water bodies bottom sediments on the Yedoma are depleted by the As and enriched by the Zn and Mo in comparison with sediments of other groups. The Rare Earth Elements concentrations in the bottom sediments of Yedoma water bodies and several water bodies on poorly degraded surfaces of the third terrace are lower than in other water bodies, except La.

1. Introduction

Thermokarst water bodies receive trace elements mainly from the atmosphere and, being in the untouched conditions of the Arctic and subarctic regions, can serve as effective indicators of metal deposition over the past millennia [1,2]. Among the high latitude regions, the West Siberian Lowland (WSL), the largest permafrost peatland in the world, contains by far the largest number of thermokarst water bodies and has the largest water area [3]. Due to climate warming-induced changes in the geochemical and biogeochemical cycle of the chemical elements in aquatic systems of permafrost landscapes [2,4,5,6], the assessment of the relationship between the stage of the permafrost degradation andthe chemical composition of the water and bottom sediments in permafrost landscapes becomes a high priority topic. In addition to large-scale surface warming, local conditions in the landscape, which are not resolved very well by climate models, also influence permafrost thaw [7,8,9], associated wetland-water body evolution, and societal and health risks.
There are a lot of recent investigations which aim to detect landscape changes and erosion processes in permafrost regions by using remote sensing [8,10,11,12,13,14,15,16]. Already today, there are methods for processing images that make it possible to judge the degree of permafrost degradation. [17]. Our hypothesis is based on the consideration that different mobility of chemical elements leads to their redistribution in the course of permafrost degradation. Therefore, the bottom sediments of the water bodies water body, based on landscape areas with different degrees of degradation, will be characterized by the accumulation of marker elements.
The study is devoted to the chemical composition of waters and bottom sediments of small thermokarst water bodies located on the islands of the Lena River delta in the Arctic part of the Russian Federation. The paper considers the microelement composition of the waters and bottom sediments of the water bodies, its comparison with the average clarke values and makes conclusions about the ecological state of objects and the mobility of chemical elements in the “water-bottom sediments” system. In addition, a relationship is established between the chemical composition of water bodies and the degree of permafrost degradation; for this, the compositions of water bodies located on the Edom (ice complex) on the first river terrace, that is, on that part of the landscape that has not yet undergone thawing, are considered.
The main purpose of this work was to establish the regularities of the removal of chemical elements in the course of permafrost degradation.

2. Materials and Methods
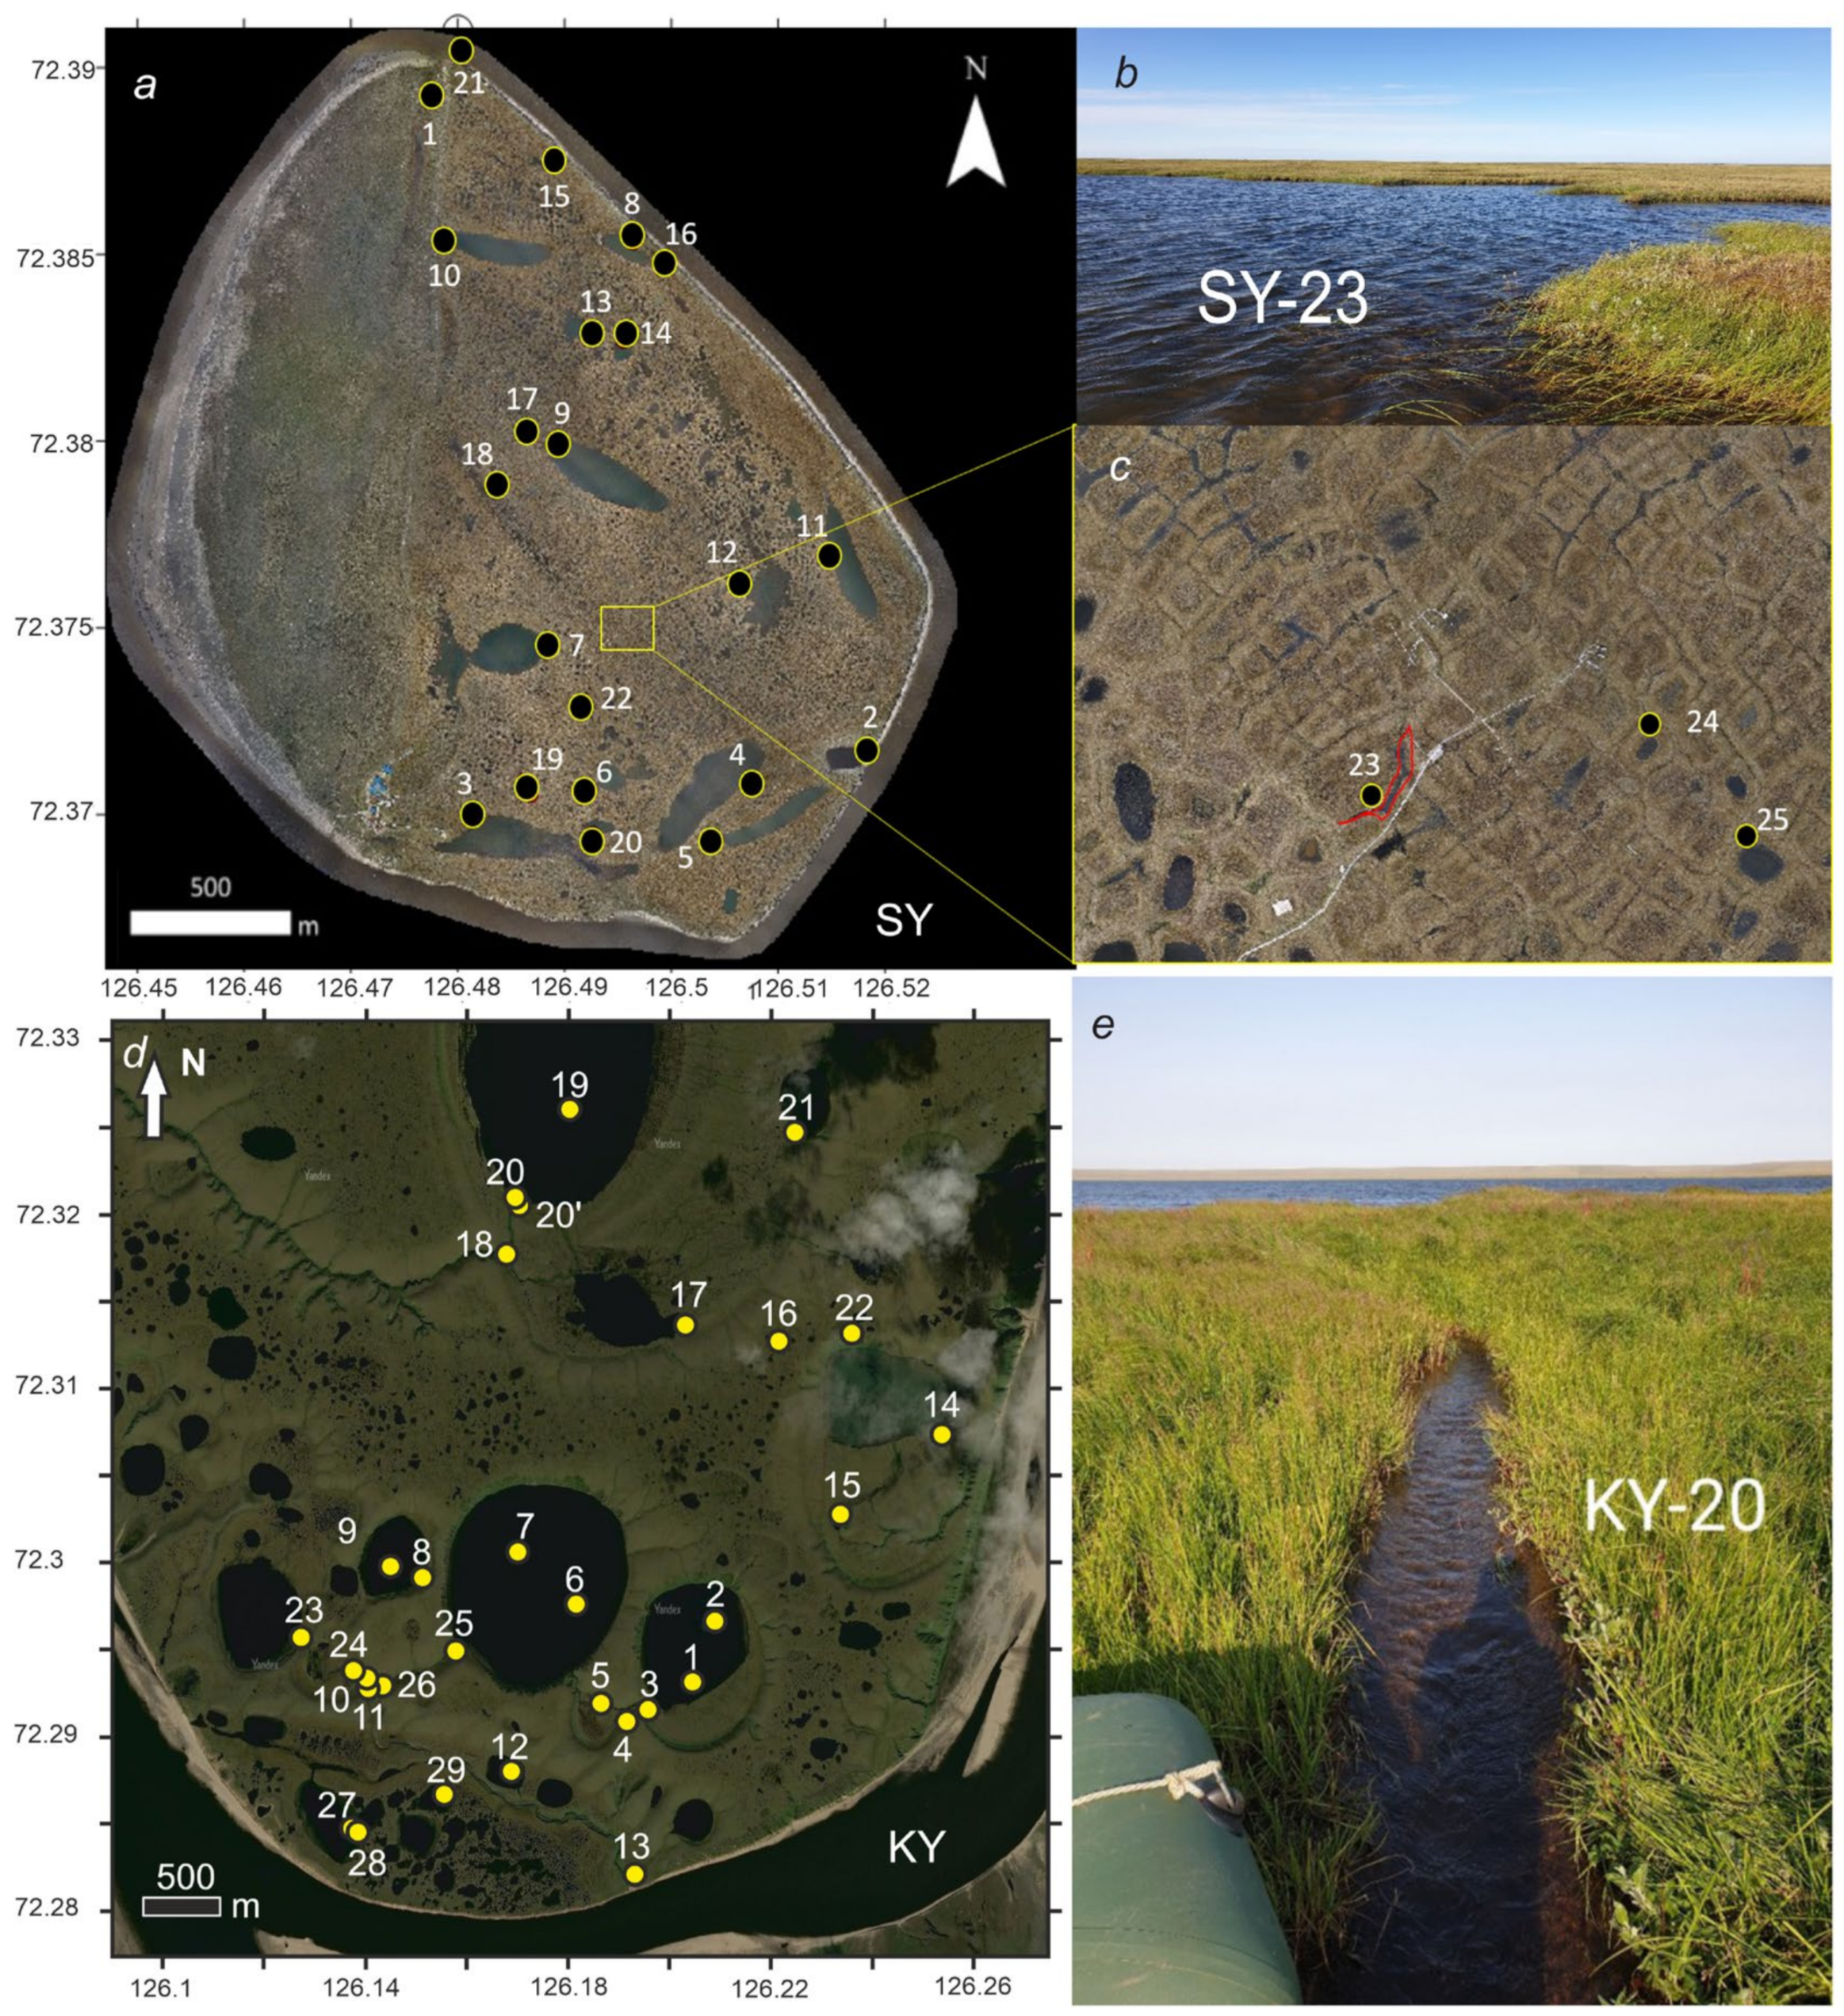
2.1. Study Area

The study area is located in the south part of the Lena River Delta. This delta is one of the largest deltas in the world. Its total area is about 29,278 km2 [18] and has an average annual discharge of about 513 km3 [19]. Consistent with previous studies, three uneven-aged terraces compose the delta [20,21]. Moreover, some erosional remnants (e.g., Sardakh, Stolb, and America-Haya islands), which are consisted of pre-Quaternary sediments, complicate the delta.
The first terrace is the youngest one. It formed during the Holocene stage of the delta formation. Generally, it is located in the eastern half of the delta and represents an active river delta [21]. Organic-rich sands or silty-sandy peats compose the first terrace [22]. The height of its surface reaches 12–14 m A.S.L. The second terrace is completely situated in the western part of the delta. The formation of the second terrace occurred in two stages: first in the marine isotope stage (MIS) 3 Interstadial and then in the MIS 2 glacial period [23]. The only thin layer of aeolian deposits formed during the Holocene [20]. This terrace is mainly composed of fluvial massive fine-grained deposits [21,23]. Organic matter, silt, and clay almost did not find in its sediments [21,23]. The second terrace surface may reach a height of 20–30 m A.S.L. The oldest terrace is the third one. It is an erosional remnant of a late Pleistocene broad foreland plain that formed from the Late Pleistocene to Holocene [21,23,24]. The third terrace has a height of about 45–50 m A.S.L. We described the geology of this terrace further in the example of Kurungnakh Island.
Studied water bodies are located on Samoylov Island (25 water bodies) and the southeastern part of Kurungnakh Island (29 water bodies). In general, Samoylov Island could be divided into two geomorphological parts. The western part is a modern floodplain and the eastern part is the first terrace (Figure 1). Holocene organic-rich deposits constitute the eastern part. Modern river sands compose the western half of the island. According to [25], the mean monthly air temperature varies, with the coldest being −32.7 °C (−25.6 °F, February) and the warmest being 9.5 °C (48.2 °F, July). The active layer thickness of the soil varies from 0.2 to 1 m. It depends on the location. The Island floodplain melts more intensively during the summer season (from May to September). The average ice content of the first terrace upper meter on Samoylov Island is >65% [26]. Thawing near-surface permafrost leads to broad thermokarst activity, tundra polygons degradation, and thermokarst hollows formation.
The site with studied water bodies on Kurungnakh Island belongs to the third and the first terrace of the Lena River Delta. The geology of the Kurungnakh Island’s third terrace was described in a number of studies [21,23,24]. Three geological members compose the third terrace. The oldest one is Early Weichselian fluvial sands. Middle-Late Weichselian Ice complex (IC) deposits (Yedoma [27]) constitute the middle part of the sequence. The youngest deposits, Holocene peaty and sandy silts with peat lenses and plant detritus compose the uppermost part of the section. Described temperature parameters on Samoylov Island are applicable for Kurungnakh as well. The active layer thickness reaches an average maximum thickness of about 50 cm on the third terrace Kurungnakh surface [28]. Since the geology and geomorphology of the first terrace are similar to Samoylov Island [21,22], we are able to presume analogical ice content and active layer depth here. Two stages of Holocene thermokarst intensity formed the modern landscape of the island third terrace [29]. It appeared to be the formation of typical thermokarst landforms such as depressions and gullies. The high gravimetric ice content (38 to 133 wt.%) of IC and syngenetic ice wedges presence were the main factors of intensive permafrost degradation here [23,24]. Generally, studied water bodies are located in various scale thermokarst hollows.
Thus, there is a specific set of described geological and geomorphological features of the study site. In particular, the water in the Kurungnakh Island water bodies occupies hollows with obvious different geomorphological features. Therefore, this territory is a good study area for investigating the relationship between chemical characteristics of water and reservoir bottom sediments, characteristics of the degraded deposits, as well as geomorphology features of the depressions, where studied water bodies have appeared.

2.2. Sampling and Field Measurements

Water was sampled from the 0.2 m depth in three different points in plastic bottles rinsed with the sampled water. We used the rubber boat to sample the medium and big water bodies. In the water samples, the pH value, the ox-red potential (ORP), temperature, concentration of the dissolved oxygen (DO), and electrical conductivity were measured in situ using a multi-meter (WTW Multi 340I, Weilheim, Germany), a combined glass electrode for pH/°C, a SenTix electrode for the ORP voltage, a CellOx 325 probe for DO. Neutral and sub-alkaline water samples were acidified with distilled HNO3 (purity 99%). Samples were divided into two sets. The first 50 mL aliquot was filtered at the sampling site to <0.25 µm using a microfiltration hydrophobic membrane (Vladipor, Vladimir, Russia) and acidified with distilled HNO3 (purity 99%) to pH < 2. The second one, intended for analyses on anion was left without filtration. Samples were transported to the laboratory and stored at a temperature not exceeding 5 °C.
Bottom sediments were collected using the UWITEC sampler into WHIRL-PAK plastic bags. Samples were divided into two sets. The first 500-gram part, intended for major and trent, mineralogical and granular composition, was cooled at a temperature not exceeding 5 °C and transported to the laboratory in a Styrofoam cooler. Another 10 g, intended for the total organic substance content analyses, was dried at 105 °C for 24 h in the NABERTHERM L-240K2CN oven in the Samoylov Station laboratory.

2.3. GIS-Analysis

Since Samoylov Island’s water bodies concern only the first terrace and do not vary among themselves in hydrochemical characteristics, we analysed geomorphological features for only Kurungnakh Island’s water bodies. We took into account two parameters of water bodies, recognising their geomorphology features. These are the area and altitude of the water surface. We revealed areas using manual mapping of reservoir borders in unmanned aerial vehicles (UAV) imageries. We described the process of UAV-based imaging in [17].
We concluded UAV-based imaging at the end of July 2016. We used a Supercam S 250 UAV manufactured by “Unmanned Systems” LLC, 2, Ordzhonikidze St., Izhevsk, Russian Federation, which was equipped with a geodetic-class GPS receiver and a Sony Alpha 6000 24.7 MP APS-C digital camera. UAV captured 5755 images which covered 34,75 km2. The total UAV flight time was 4 h and 7 min. The altitude of UAV flight was about 250 m above ground level. Then we used specialized software for photogrammetry: Agisoft PhotoScan (Professional Edition, Version 1.2.5, St. Petersburg, Russia) from Geoscan Ltd. and Photomod package (version 5.0, Moscow, Russia) from JSC Racurs. As a result of the photogrammetry, we received several georeferenced orthophoto map tiles with a 0.05 m/px resolution. High-level orthophoto map spatial resolution provided accurate estimations of the reservoir areas.
Then we used ArcGIS 10.2.2 from ESRI CIS Limited (sourced via Data East software distributor, Novosibirsk, Russia) built-in tools (zonal statistics) for calculating the mean altitudes of mapped water bodies. ArcticDEM with the 2-metre spatial resolution was a value raster [30]. Thus, as a result of all GIS-analysis operations, we obtained a shapefile of water bodies with values of their areas and water surface altitudes. Besides, we used UAV imageries for manual determination of the water bodies belonging to the first or the third terrace. Since these surfaces could be simply identified, specific operations were not required for it.

2.4. Sampling and Field Measurements

In water samples, major cation (Al, Fe, Ca, Mg, K, Na, and Si) and trace element analyses were carried out using ICP-MS (ELAN-9000 DRC-e, PerkinElmer Instruments LLC, USA). Accuracy and precision were estimated to be 7% or better at the mg·L−1 concentration level and 10% or better at the µg L−1 concentration level. Another aliquot was analyzed for major anions (SO42−, Cl, HCO3) using potentiometry, photometric and titrimetric methods. Accuracy and precision were estimated to be 7% or better at mg L−1 concentrations. The one part of the bottom sediment samples (10 g) was weighed after 105 °C heating, heated one more at 550 °C for four hours, left in the oven until 200 °C, placed in the desiccator and weighed. The second part of the solid samples (500 g) was dried at room temperature for 48 h, homogenized by folding (ISO, 2007), sieved using a 250 µm nylon filter (Fritsch, Idar-Oberstein, Germany) and powdered to a size of <74 µm by abrasion in an agate mortar for bulk analysis. ICP-MS was used to determine their elemental compositions (ELAN-9000 DRC-e, PerkinElmer Instruments LLC, Waltham, MA, USA). The accuracy and precision of the analyses were estimated to be 10% or better at the g·t−1 concentration level.

3. Results

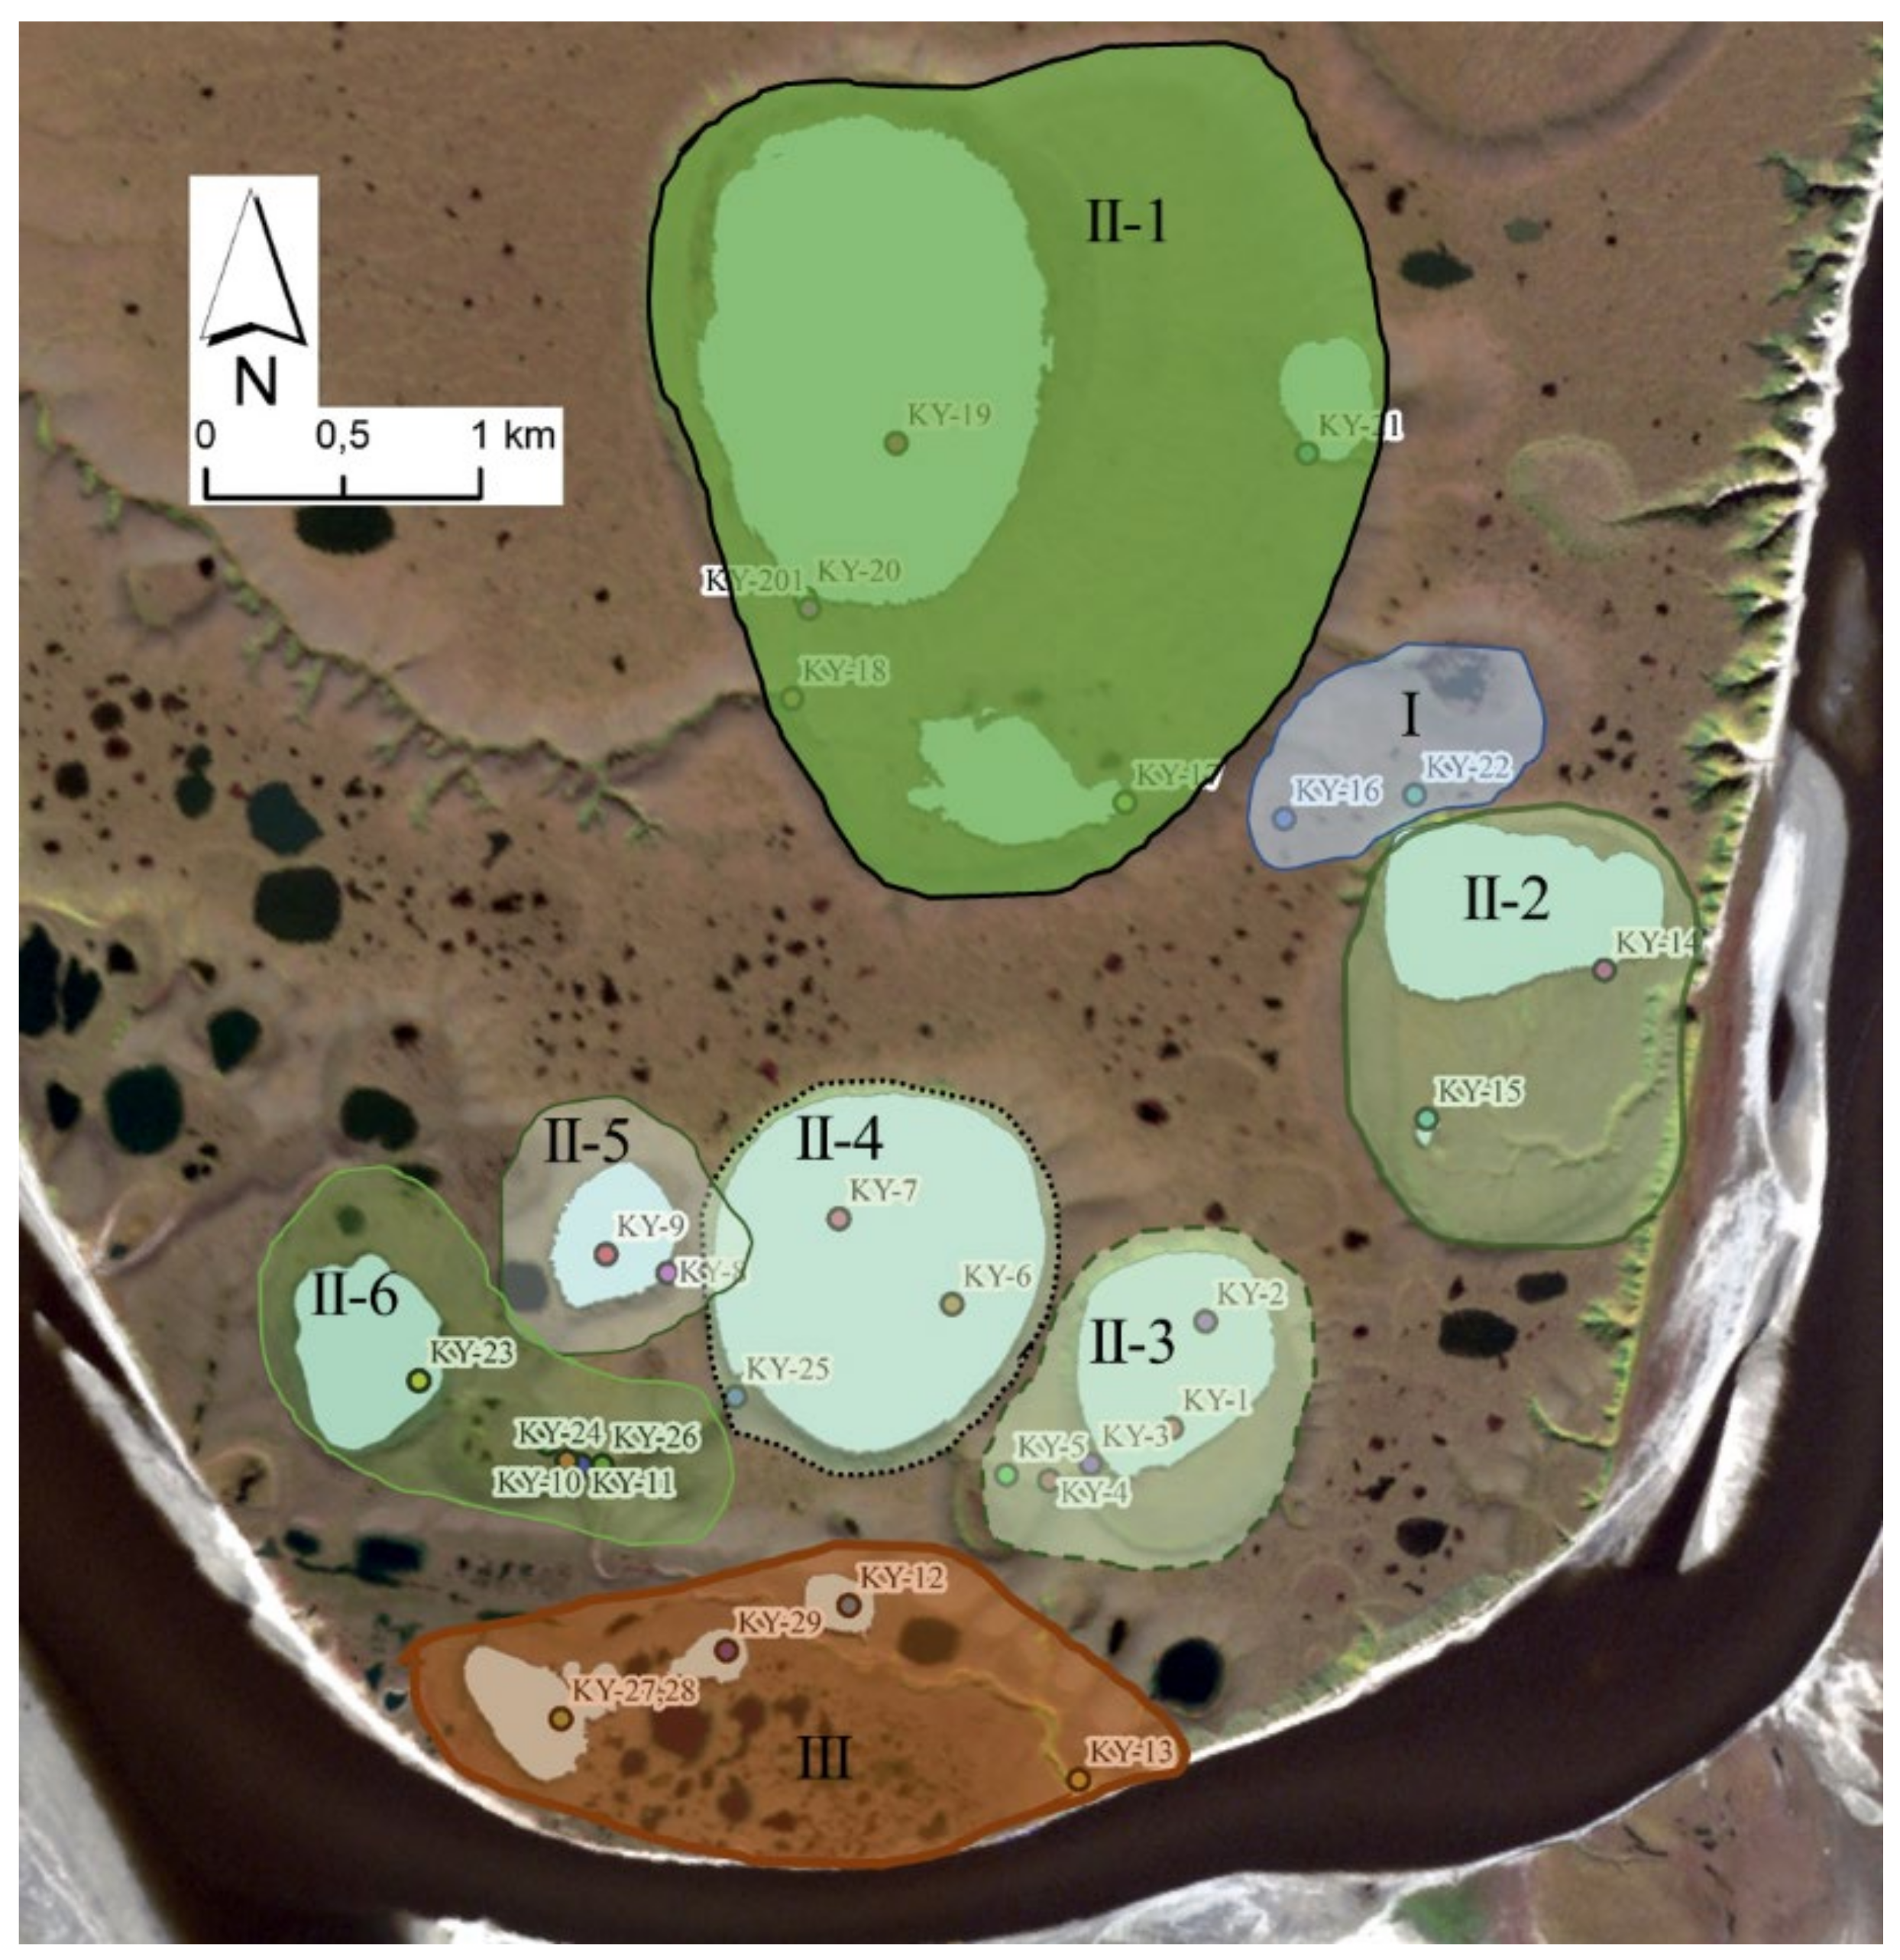
3.1. Geomorphological Features of the Studied Water Bodies

We recognised three groups of studied water bodies, which differ in their geomorphological features (Figure 2, Table 1). The first is water bodies on the Yedoma upland surface. These are two small water bodies with an area of 392 and 1756 m2. The altitude of their water surfaces is 45 and 46 m. These are relatively modern water bodies, and they have not suffered long-term thermokarst processes. Their compositions could be considered typical parameters of modern periglacial water bodies on the Lena Delta Yedoma uplands before the thermokarst process impact.
The second group unites several water bodies that occupy thermokarst hollow bottoms. These are nine water bodies, which are located in six thermokarst hollows. Water bodies’ areas vary from 6416 m2 to 1,791,884 m2. The altitudes are also different and vary from 8 m to 25 m. This difference reflects a degree of thermokarst processes development. We presume water bodies that have minimal altitudes occupy the oldest and the deepest thermokarst hollows. The third group consist of three water bodies that occupy hollows on the first terrace surface of Kurungnakh Island (area: 40,780–169,460 m2; altitudes: 6–8 m). Generally, their geomorphological features are similar to Samoylov Island’s water bodies. All of them developed in similar first terrace deposits and with the analogous influence of thermokarst and river processes. Spring floodwater masses periodically cover the first terrace surfaces of Kurungnakh and Samoylov Islands. Thus, the difference in water physicochemical parameters of the two first groups reflects the thermokarst process duration and intensity. Water bodies of the third group suffer periodical spring flood impact.

3.2. Composition of the Studied Water Bodies

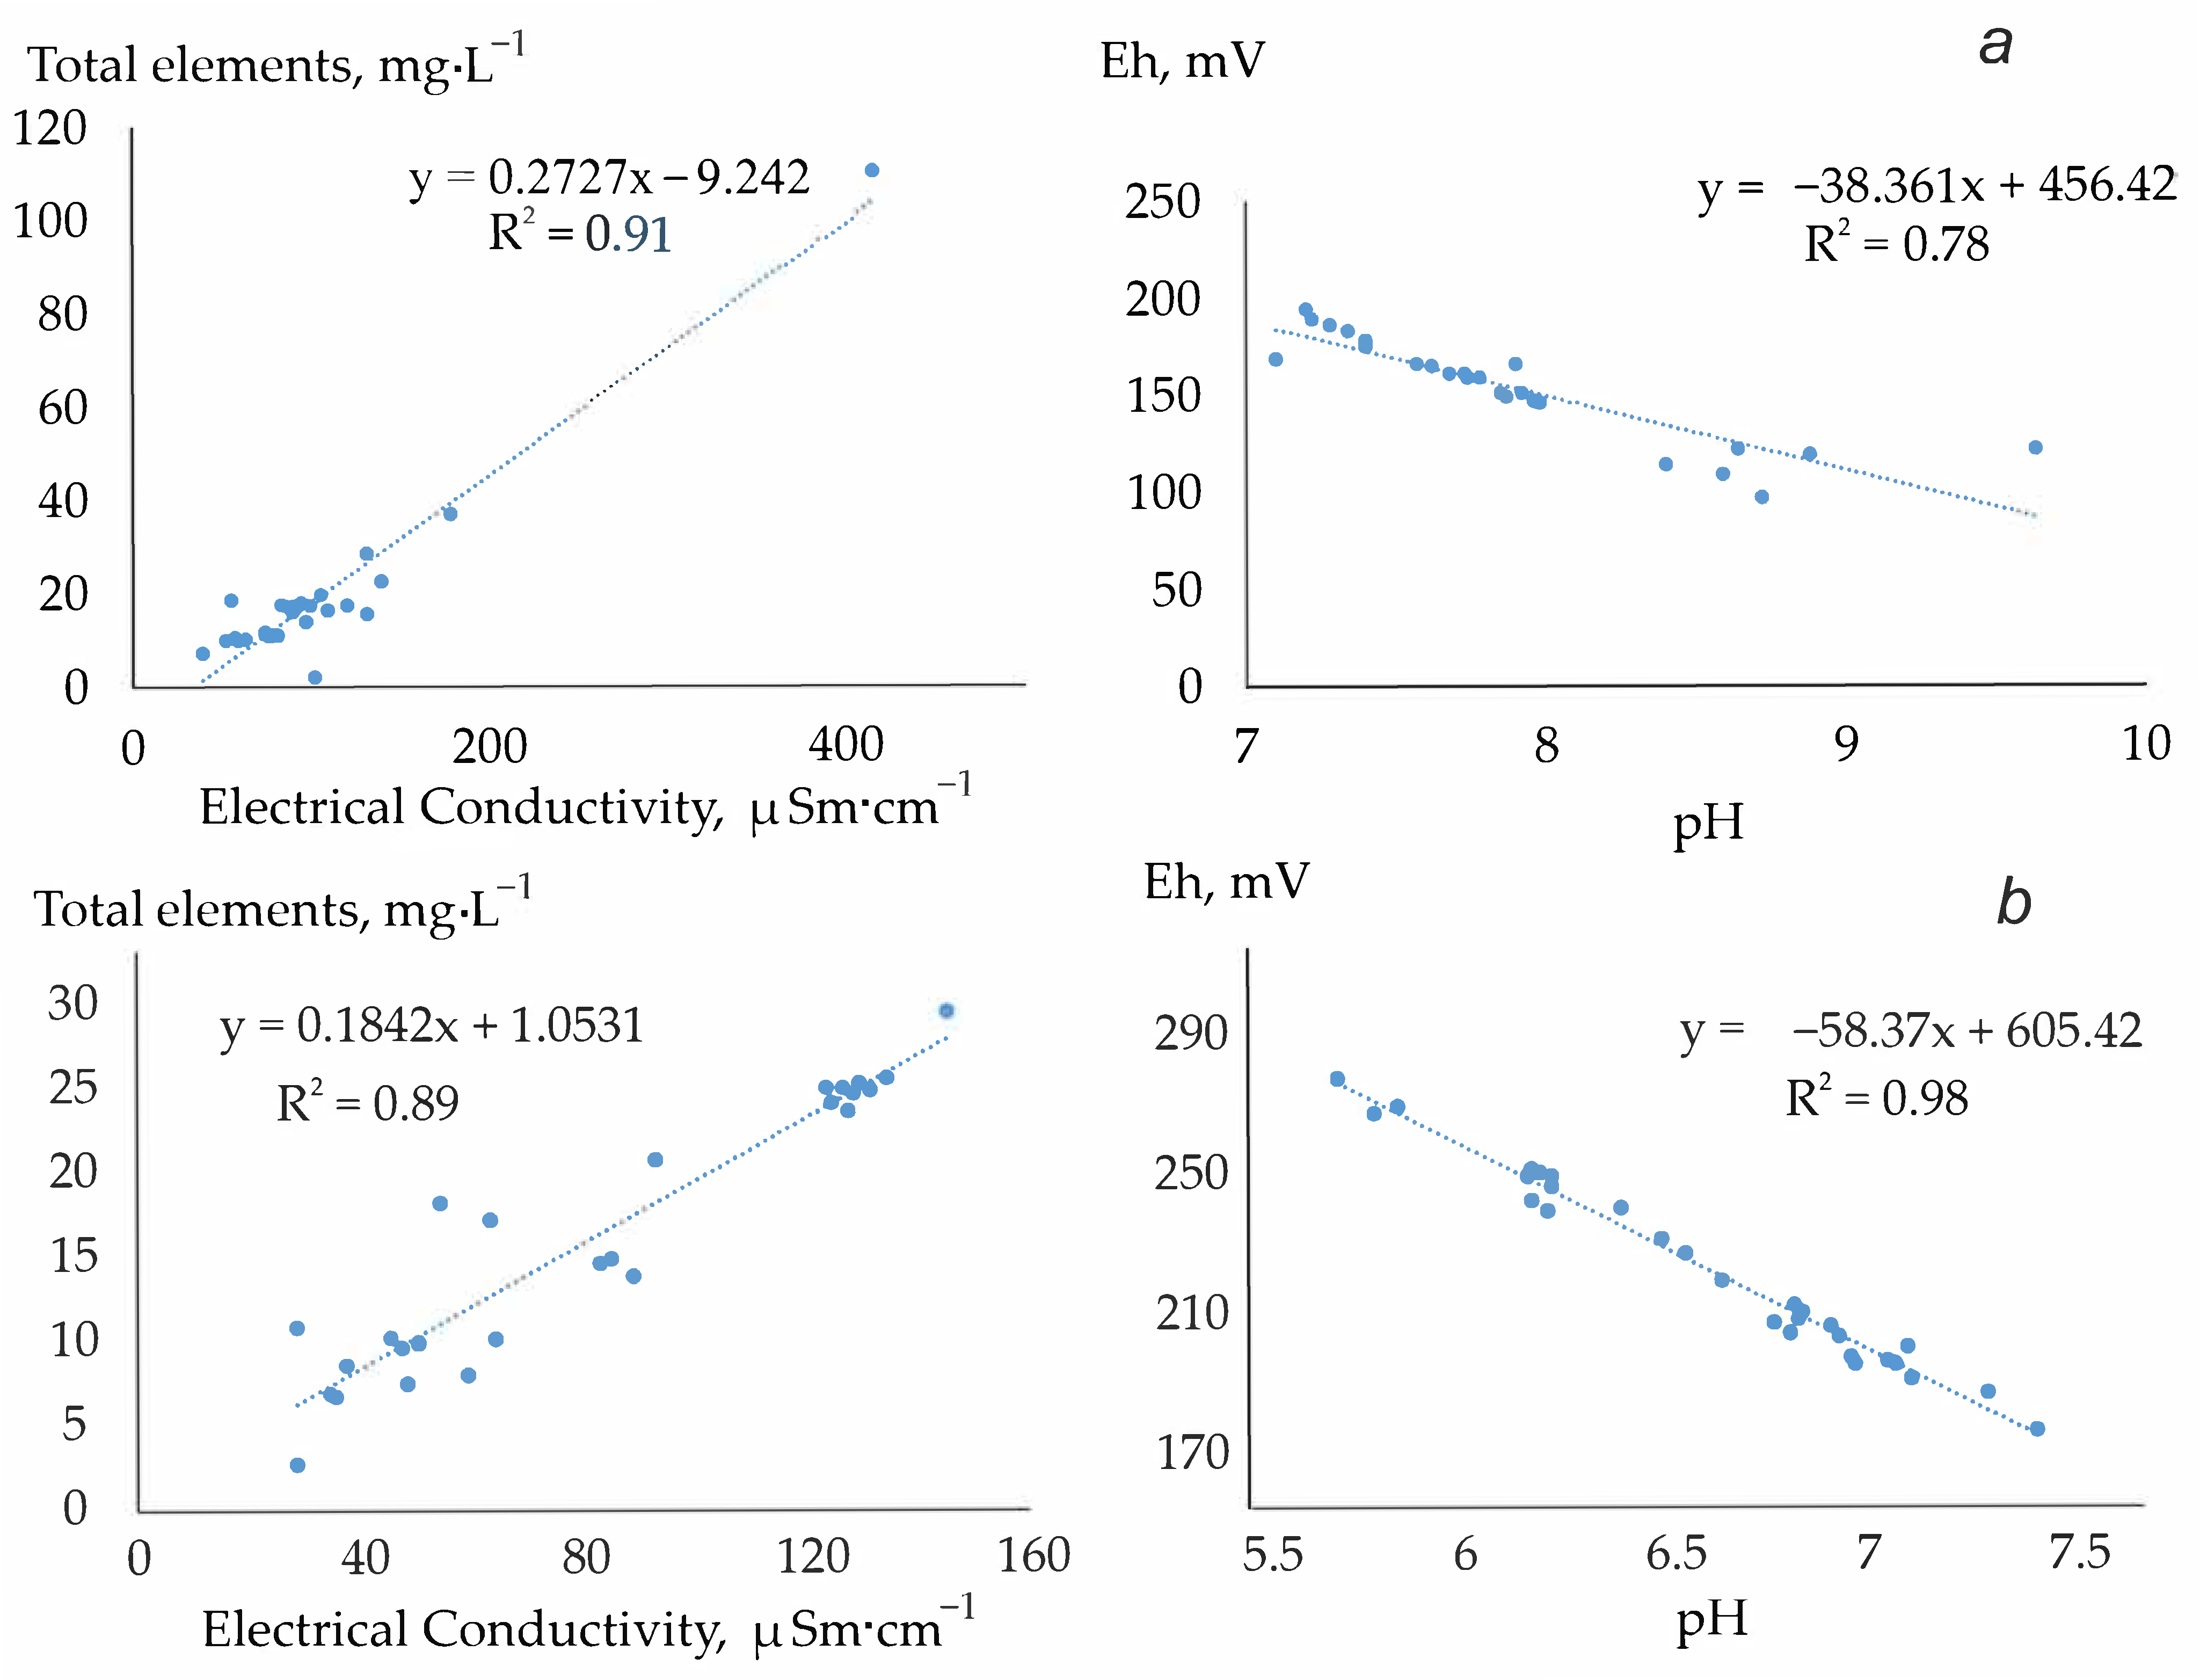
3.2.1. Chemical Composition of Water

The specific electrical conductivity (EC) of the water body waters on Samoylov Island varies in a wide range from 39 to 415 μSm∙cm−1(Figure 3a), and the total concentration of chemical elements from 9 to 110 mg∙L−1. The relationship of conductivity with the sum of the elements is shown in the graph (Figure 3a). The pH values vary in the range of 7.40 to 9.63, and the ORP values from 97 to 178 mV. Physical and chemical conditions correspond to the conditions typical for freshwater body waters in contact with the atmosphere. The water in the polygonal ponds has an EC of about 20–30 µSm/cm, the lowest in the comparison with other water bodies, while thermokarst (merged polygons) and oxbow water bodies are characterized by higher mineralization (close to the mineralization of the Lena River). The highest EC (415 μSm∙cm−1) is in watercourse 1 (Figure 1a), which is seasonally flooded by the river waters. At the time of testing, the water is stagnant, sediments silted up, and conditions for the accumulation of chemical elements are created. Manganese and iron concentrations are also highest among all the sampled points.
As for the water bodies on Kurungnakh Island, the total amount of elements and electrical conductivity are significantly lower than in the Samoylov water bodies and vary from 2 to 28 mg∙L−1 and from 30 to 150 μSm∙cm−1, respectively. Similar to Samoylov’s waters, there is a linear relationship between electrical conductivity and the total number of elements (Figure 3b). The oxidation-reduction potential of water bodies in the Kurungnakh water bodies is slightly higher than in the Samoilov’s water bodies and varies from 170 to 274 mV. The pH values, on the contrary, are slightly lower and are in the range of 5.7–7.4 units (Figure 3b). No significant differences in the physicochemical characteristics of the Kurungnakh water bodies, located in different geological groups, have been identified. Based on these data, it can be judged that the waters of both islands are ultra-fresh; however, the water bodies located on Kurngnah Island are characterized by relatively low mineralization and acidic oxidizing environment.
On average, the concentrations of macronutrients (Ca, Mg, K, Na, Al, Si, Fe, Mn, and P) in the waters of the lakes of Samoylov Island are higher than in the lakes of Kurungnakh Island (Table 2). The authors for the first time established the presence of Sc, Ge, Ag, Te, Bi, Au, and Tl in the water lakes of the Samoylov, Kurungnakh islands and the Lena River in the area of these islands, there is no information about their presence in the water of thermokarst lakes of the Arctic in the literature. Note the increased contents of Li, As, Cr, Ni, Pb, U, Co, and Be in the water of Samoylov Island in comparison with clarks and concentrations in the Lena River (by 1–2 orders of magnitude). The concentration of Li in the water of the Samoylov lakes is 5.1 mg∙L−1, which is almost five times higher than in the lakes of Kurungnakh Island (1.2 mg∙L−1), Average thermokarst in summer, continuous permafrost [6] (0.97 mg∙L−1) and two times higher than the Clark concentration (2.5 mg∙L−1) and the content in the Lena river (2.1 mg∙L−1). As concentrations in the waters of Samoloilovsky Island (3.1 mg∙L−1) are almost 10 times higher than in the waters of Kurungnakh Island lakes (0.39 mg∙L−1), 1.5 times higher than clark (2 mg∙L−1) and 5 times the average contents in thermokarst lakes [6,31] and the Lena River (Table 2). Concentrations of Cr, Ni, Pb, U, Co, and Be in the lakes of Samoylov Island are higher than clark concentrations, the average contents in the Lena River and Average thermokarst in summer, and continuous permafrost [6] by 1–2 orders of magnitude.

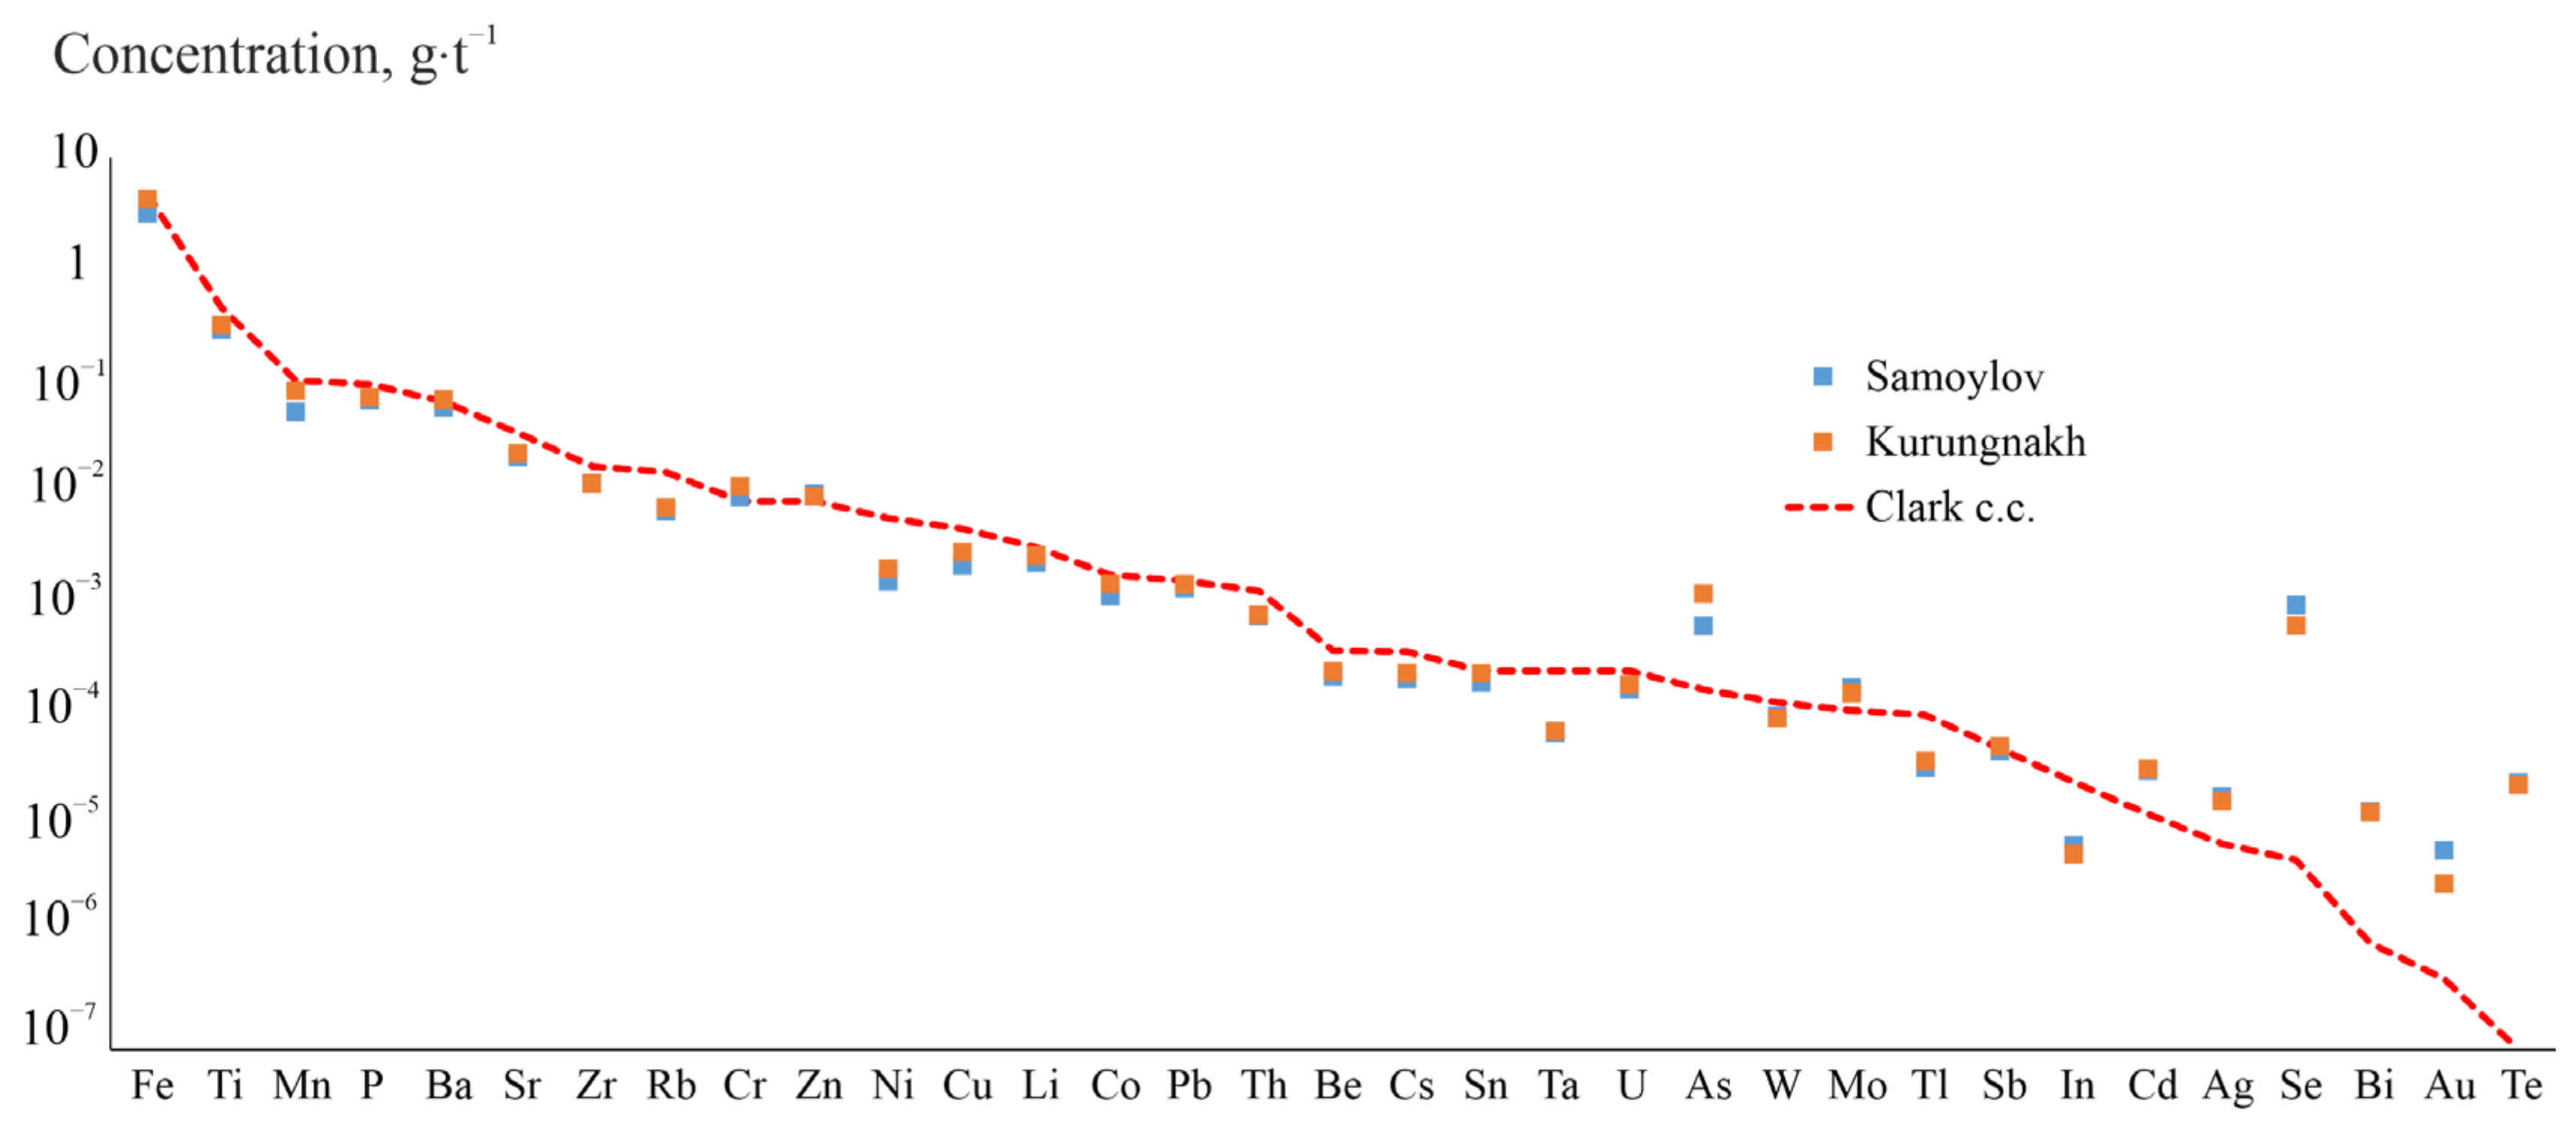
3.2.2. Chemical Composition of Bottom Sediments

A whole spectrum of chemical elements has been found in the bottom sediments of the Samoylov and Kurungnakh islands: rock-forming elements and metals, including noble and rare earth elements (REE).
When comparing the concentrations of the elements in the bottom sediments of the islands with average concentrations of these elements in the earth’s crust (Clark), a number of anomalies are revealed: in Cd, Ag, As, Mo, Se, Bi, Au, Te (Figure 4). The concentration of As in the bottom sediments of water bodies of the Samoylov Island is 0.0006 g·t−1, Kurunghnakh Island—0.0012 g·t−1 and clark in the continental crust is 0.00017 g·t−1. So, the anomalie for As is 3.7 in Samoylov waterbodies and 7.2—in Kurungnakh. The anomalies for Mo, Cd and Ag in the Samoylov and Kurungnakh waterbodies are equal to 1.6 and 1.4; 2.4 and 2.5; 2.7 and 2.4 correspondingly. The concentrations of Se in bottom sediments are higher than clark in 195 and 127 times in Samoylov and Kurungnakh waterbodies correspondingly. Anomalies for Bi and Au are equal to 15 for both Islands. The most significant excess corresponds to Te, which has a higher concentration than clark by 240 times.
When considering the concentrations of chemical elements normalized to clark in different groups corresponding to different stages of permafrost degradation (for example, Kurungnakh Island), several obvious trends can be identified (Figure 5). Firstly, the behaviour of arsenic is interesting. In the lakes of group I (on the surface of Yedoma). its concentration is the lowest, and in groups II and III, the concentration of As increases. It can be assumed that as the permafrost degrades (group I changes successively to group II and III), this element is removed from permafrost rocks into bottom sediments, and their enrichment occurs. Interestingly, for Zn, and Mo, we observe the opposite picture: the Clark-normalized concentrations of these elements are higher in the lakes of the first group located on the Yedoma, and as the permafrost (groups II and III) degrades, the concentrations of these elements in the bottom sediments decrease, which may indicate that the compounds of these elements come out from bottom sediments into solution in the course of geochemical processes accompanying the degradation of permafrost.
Generally recognized geochemical indicators for the classification and determination of conditions for the formation of geological objects are rare earth elements. The composition and content of REE characterize the specifics of the accumulation process and the sources of demolition of the substance in the bottom sediments of water bodies.
Distribution of normalized to the chondrite concentrations of rare earth elements (REE) in sediments of water bodies on the surface of Yedoma (group I, waterbodies with altitudes 45 m) and in the water bodies of the first stage of degradation of permafrost (II-1, waterbodies with altitudes 25 m) is identical and differs from the distribution of rare earth elements in other studied objects (Figure 6). Distribution of REE in the bottom sediments in the waterbodies of group II-6 (water bodies on the third geological terrace with altidues 8–10 m), group III (late stage of the permafrost degradation, first geological terrace, waterbodies with altitudes 8 m) and Samoylov Island are identical and correspond to distribution in Clays of the Russian platform and North American Shale Composite (NASC) [34] (Figure 6).

4. Discussion

The information on the features of the microelement composition of waters, including rare earth elements, in the arctic water bodies and other deltaic systems, is necessary for long-term monitoring of arctic aquatic ecosystems. It should be noted that information on the microelement composition of the water bodies on the islands of the Lena Delta is practically absent.
It is worth noting that the concentrations of Fe, Mn, P, and Al in the waters of waterbodies on the Samoylov Island are 1–2 orders of magnitude higher than the average concentration in the hydrosphere (clark) [31] and the contents in the Lena River, as well as average concentrations in thermokarst in summer, continuous permafrost [6,32]. In the waters of the Kurungnakh waterbodies, the concentrations of macronutrients are at the level of clark and concentrations in the Lena River or lower. The exception is Fe, whose concentration in the waterbodies of Kurungnakh Island is higher than Clark’s and is 0.86 mg·L−1 (see Table 2), but it is, however, lower than the concentration in the Lena river (1.2 mg·L−1). Separately, we note the high concentrations of the biogenic element P in the lakes of Samoylov Island, 10 times higher than the average clark concentrations [31], concentrations in the Lena River water and average concentration in the thermokarst lakes in summer, continuous permafrost [6]. It is necessary to pay attention to anomalies of As and Be, elements of the first class of danger, in comparison with Clarks (Table 2). Moreover, if the anomalies in Fe and Mn are associated with the peculiarities of the regional background, then the question of the sources of a number of metals remains debatable. We suppose that the main sources of arsenic and beryllium entering the waters of the lakes are leaching from bottom sediments. Under oxidizing conditions in the range of Eh values of 150–200 mV and at sub-alkaline pH (7–9), soluble complexes of the type HAsO42-, BeOH+ BeO(aq) are most likely formed in lake waters [35].
The fundamental differences in the distribution of rare earth elements in the bottom sediments of reservoirs on the surface of Yedoma and at the highest elevations of the third geological terrace, which corresponds to the least degraded permafrost, from the distribution in water bodies with elevations of 8 m located on the first river terrace are shown: higher concentrations of La and relatively low contents of Ce and Nd in the bottom sediments of Yedoma waterbodies (group I, II-6, Figure 6) in comparison with the water bodies of the first river terrace (group III, Figure 6).
Ce and Nd are elements of variable valence, which can be in a two-, three- and four-valent state [36]. Therefore, anomalies in the contents of these elements in the sediments of the studied water bodies reflect, in our opinion, the features of the redox conditions of the formation of based rocks.
The measured Ce anomaly appears to represent an integrated signal related to the redox history of the based rocks [37]. A negative Ce anomaly may reflect water chemistry in organic poor conditions [38].
As for La, indeed, we observe a significant enrichment of this element in the bottom sediments of lakes located on Yedoma relative to lakes located on the degraded territory. Moreover, the ratio of water bodies of Yedoma normalized to chondrite La/Yb is equal to 160–234, while for waterbodies of the first river terrace (group I) and lakes on the surface of the degraded part of Yedoma (subgroup II-6), this ratio is 0.99 and 0.75, respectively. Such a sharp contrast, according to the authors, can only be associated with differences in La content in the based rocks. Thus, it can be assumed that the bottom sediments in the water bodies of the Yedoma complex are more enriched with light REE (La) compared to heavy ones (Yb).
The results obtained will serve as a basis for determining the mechanisms of redistribution of chemical compounds between water and bottom sediments during permafrost thawing and creating a conceptual model for the transformation of water bodies over time. In addition, the results will be important for those researchers who are interested in the regional geochemical background for a wide range of chemical elements, including the first hazard class. A separate task of future research will be the search for sources of elements of the 1st hazard class in the water and bottom sediments of small Arctic water bodies (including As). It was found that the water bodies on the Samoylov and Kurungnakh Islands can be divided into three groups depending on their location: (1) on the ice complex of the third terrace, (2) in thermokarst basins (of varying degrees of degradation) on the third terrace, (3) on the surface of the first river terrace. The water is fresh with low concentrations of chemical elements, but the specification varies depending on the degree of permafrost degradation.
It is shown that the bottom sediments of water bodies located on the surface of Yedoma (elevations of 45 m) are characterized by lower As contents, relative to the waterbodies on the first river terrace (elevations of 8 m). In addition, the bottom sediments in the water bodies on the surface of Yedoma are enriched with La and depleted with Ce and Nd relative to the water bodies on the first river terrace and the waterbodies of Samoylov Island, as well as in comparison with the clays of the Russian platform and North American Shale Composite (NASC).
The authors managed to show that the combined use of geomorphological, hydrochemical methods and remote sensing techniques allows mapping various stages of permafrost degradation. Further observations of the territory using remote sensing methods will allow us to indirectly evaluate the trends in the change of the chemical composition of the water bodies in course of the permafrost degradation.

Author Contributions

Conceptualization, N.Y. and A.K.; methodology, N.Y. and A.K.; software, A.K.; validation, N.Y., A.K. and E.T.; formal analysis, N.Y.; investigation, N.Y. and A.K.; resources, N.Y.; data curation, N.Y. and A.K.; writing—original draft preparation, N.Y., A.K. and E.T.; writing—review and editing, N.Y., A.K. and E.T.; visualization, N.Y. and A.K.; supervision, N.Y.; project administration, A.K.; funding acquisition, N.Y. and A.K. All authors have read and agreed to the published version of the manuscript.

Funding

The research was supported by Basic research projects of Ministry of Science and Higher Education of the Russial Federation FWZZ-2022-0029 and FWZZ-2022-0031. Besides, work is done on state assignment of IGM SB RAS.

Institutional Review Board Statement

Not applicable.

Informed Consent Statement

Not applicable.

Data Availability Statement

The data presented in this study are available on request from the corresponding author.

Acknowledgments

The study was carried out according to the program of BSR 0266-2019-0008.

Conflicts of Interest

The authors declare no conflict of interest.

References

  1. Bouchard, F.; Francus, P.; Pienitz, R.; Laurion, I. Sedimentology and geochemistry of thermokarst ponds in discontinuous permafrost, subarctic Quebec. Canada. J. Geophys. Res. Biogeosci. 2011, 116, G00M04. [Google Scholar] [CrossRef] [Green Version]
  2. Manasypov, R.M.; Pokrovsky, O.S.; Shirokova, L.S.; Auda, Y.; Zinner, N.S.; Vorobyev, S.N.; Kirpotin, S.N. Biogeochemistry of macrophytes, sediments and porewaters in thermokarst lakes of permafrost peatlands, western Siberia. Sci. Total Environ. 2021, 763, 144201. [Google Scholar] [CrossRef]
  3. Polishchuk, Y.M.; Bogdanov, A.N.; Polishchuk, V.Y.; Manasypov, R.M.; Shirokova, L.S.; Kirpotin, S.N.; Pokrovsky, O.S. Size distribution, surface coverage, water, carbon, and metal storage of thermokarst lakes in the permafrost zone of the Western Siberia Lowland. Water 2017, 9, 228. [Google Scholar] [CrossRef]
  4. Grosse, G.; Goetz, S.; McGuire, A.D.; Romanovsky, V.E.; Schuur, E.A.G. Changing permafrost in a warming world and feedbacks to the earth system. Environ. Res. Lett. 2016, 11, 040201. [Google Scholar] [CrossRef]
  5. Vonk, J.E.; Tank, S.E.; Bowden, W.B.; Laurion, I.; Vincent, W.F.; Alekseychik, P.; Amyot, M.; Billet, M.F.; Canário, J.; Cory, R.M.; et al. Reviews and syntheses: Effects of permafrost thaw on Arctic aquatic ecosystems. Biogeosciences 2015, 12, 7129–7167. [Google Scholar] [CrossRef] [Green Version]
  6. Manasypov, R.M.; Lim, A.G.; Krickov, I.V.; Shirokova, L.S.; Vorobyev, S.N.; Kirpotin, S.N.; Pokrovsky, O.S. Spatial and Seasonal Variations of C, Nutrient, and Metal Concentration in Thermokarst Lakes of Western Siberia Across a Permafrost Gradient. Water 2020, 12, 1830. [Google Scholar] [CrossRef]
  7. Beilman, D.W.; Vitt, D.H.; Halsey, L.A. Localized permafrost peatlands in western Canada: Definition, distributions, and degradation. Arct. Antarct. Alp. Res. 2001, 33, 70–77. [Google Scholar] [CrossRef]
  8. Karlsson, J.M.; Lyon, S.W.; Destouni, G. Temporal behavior of lake size-distribution in a thawing permafrost landscape in northwestern Siberia. Remote Sens. 2014, 6, 621–636. [Google Scholar] [CrossRef] [Green Version]
  9. Selroos, J.O.; Cheng, H.; Vidstrand, P.; Destouni, G. Permafrost thaw with thermokarst wetland-lake and societal-health risks: Dependence on local soil conditions under large-scale warming. Water 2019, 11, 574. [Google Scholar] [CrossRef] [Green Version]
  10. Zhan, S.; Beck, R.A.; Hinkel, K.M.; Liu, H.; Jones, B.M. Spatio-temporal analysis of gyres in oriented lakes on the Arctic Coastal Plain of northern Alaska based on remotely sensed images. Remote Sens. 2014, 6, 9170–9193. [Google Scholar] [CrossRef] [Green Version]
  11. Antonova, S.; Duguay, C.R.; Kääb, A.; Heim, B.; Langer, M.; Westermann, S.; Boike, J. Monitoring bedfast ice and ice phenology in lakes of the Lena river delta using TerraSAR-X backscatter and coherence time series. Remote Sens. 2016, 8, 903. [Google Scholar] [CrossRef] [Green Version]
  12. Nitze, I.; Grosse, G.; Jones, B.M.; Arp, C.D.; Ulrich, M.; Fedorov, A.; Veremeeva, A. Landsat-based trend analysis of lake dynamics across northern permafrost regions. Remote Sens. 2017, 9, 640. [Google Scholar] [CrossRef] [Green Version]
  13. Fraser, R.H.; Kokelj, S.V.; Lantz, T.C.; McFarlane-Winchester, M.; Olthof, I.; Lacelle, D. Climate sensitivity of high Arctic permafrost terrain demonstrated by widespread ice-wedge thermokarst on Banks Island. Remote Sens. 2018, 10, 954. [Google Scholar] [CrossRef] [Green Version]
  14. Lindgren, P.; Grosse, G.; Meyer, F.J.; Anthony, K.W. An object-based classification method to detect methane ebullition bubbles in early Winter lake ice. Remote Sens. 2019, 11, 822. [Google Scholar] [CrossRef] [Green Version]
  15. Veremeeva, A.; Nitze, I.; Günther, F.; Grosse, G.; Rivkina, E. Geomorphological and climatic drivers of thermokarst lake area increase trend (1999–2018) in the Kolyma lowland yedoma region, north-eastern Siberia. Remote Sens. 2021, 13, 178. [Google Scholar] [CrossRef]
  16. Bergstedt, H.; Jones, B.M.; Hinkel, K.; Farquharson, L.; Gaglioti, B.V.; Parsekian, A.D.; Kanevskiy, M.; Ohara, N.; Breen, A.L.; Rangel, R.C.; et al. Remote sensing-based statistical approach for defining drained lake basins in a continuous permafrost region, North Slope of Alaska. Remote Sens. 2021, 13, 2539. [Google Scholar] [CrossRef]
  17. Kartoziia, A. Assessment of the ice wedge polygon current state by means of UAV imagery analysis (Samoylov Island, the Lena Delta). Remote Sens. 2019, 11, 1627. [Google Scholar] [CrossRef] [Green Version]
  18. Kravtsova, V.I.; Mit’kinykh, N.S. Mouths of World Rivers in the Atlas of Space Images. Water Resour. 2011, 38, 1–17. [Google Scholar] [CrossRef]
  19. Degtyarev, V. Lena River Delta (Russia). In The Wetland Book: II: Distribution, Description, and Conservation; Finlayson, C.M., Milton, G.R., Prentice, R., Davidson, N., Eds.; Springer: Dordrecht, The Netherlands, 2018; pp. 1451–1456. [Google Scholar] [CrossRef]
  20. Grigoriev, M.N. Criomorphogenesis in the Lena Delta; Permafrost Institute Press: Yakutsk, Russia, 1993; p. 176. (In Russian) [Google Scholar]
  21. Schwamborn, G.; Rachold, V.; Grigoriev, M.N. Late Quaternary Sedimentation History of the Lena Delta. Quat. Int. 2002, 89, 119–134. [Google Scholar] [CrossRef] [Green Version]
  22. Bolshiyanov, D.; Makarov, A.; Savelieva, L. Lena River Delta Formation during the Holocene. Biogeosciences 2015, 12, 579–593. [Google Scholar] [CrossRef] [Green Version]
  23. Schirrmeister, L.; Grosse, G.; Schnelle, M.; Fuchs, M.; Krbetschek, M.; Ulrich, M.; Kunitsky, V.; Grigoriev, M.; Andreev, A.; Kienast, F.; et al. Late Quaternary Paleoenvironmental Records from the Western Lena Delta, Arctic Siberia. Palaeogeogr. Palaeoclimatol. Palaeoecol. 2011, 299, 175–196. [Google Scholar] [CrossRef] [Green Version]
  24. Wetterich, S.; Kuzmina, S.; Andreev, A.A.; Kienast, F.; Meyer, H.; Schirrmeister, L.; Kuznetsova, T.; Sierralta, M. Palaeoenvironmental Dynamics Inferred from Late Quaternary Permafrost Deposits on Kurungnakh Island, Lena Delta, Northeast Siberia, Russia. Quat. Sci. Rev. 2008, 27, 1523–1540. [Google Scholar] [CrossRef] [Green Version]
  25. Boike, J.; Nitzbon, J.; Anders, K.; Grigoriev, M.; Bolshiyanov, D.; Langer, M.; Lange, S.; Bornemann, N.; Morgenstern, A.; Schreiber, P.; et al. A 16-Year Record (2002–2017) of Permafrost, Active-Layer, and Meteorological Conditions at the Samoylov Island Arctic Permafrost Research Site, Lena River Delta, Northern Siberia: An Opportunity to Validate Remote-Sensing Data and Land Surface, Snow, and Permafrost Models. Earth Syst. Sci. Data 2019, 11, 261–299. [Google Scholar] [CrossRef] [Green Version]
  26. Zubrzycki, S.; Kutzbach, L.; Grosse, G.; Desyatkin, A. Organic Carbon and Total Nitrogen Stocks in Soils of the Lena River Delta. Biogeosciences 2013, 10, 3507–3524. [Google Scholar] [CrossRef] [Green Version]
  27. Schirrmeister, L.; Froese, D.; Tumskoy, V.; Grosse, G.; Wetterich, S. Yedoma: Late Pleistocene Ice-Rich Syngenetic Permafrost of Beringia. In Encyclopedia of Quaternary Science, 2nd ed.; Elias, S.A., Mock, C.J., Eds.; Elsevier: Amsterdam, The Netherlands, 2013; pp. 542–552. [Google Scholar]
  28. Antonova, S.; Sudhaus, H.; Strozzi, T.; Zwieback, S.; Kääb, A.; Heim, B.; Langer, M.; Bornemann, N.; Boike, J. Thaw Subsidence of a Yedoma Landscape in Northern Siberia, Measured In Situ and Estimated from TerraSAR-X Interferometry. Remote Sens. 2018, 10, 494. [Google Scholar] [CrossRef] [Green Version]
  29. Morgenstern, A.; Ulrich, M.; Günther, F.; Roessler, S.; Fedorova, I.V.; Rudaya, N.A.; Wetterich, S.; Boike, J.; Schirrmeister, L. Evolution of thermokarst in East Siberian ice-rich permafrost: A case study. Geomorphology 2013, 201, 363–379. [Google Scholar] [CrossRef]
  30. Morin, P.; Porter, C.; Cloutier, M.; Howat, I.M.; Noh, M.J.; Willis, M.; Bates, B.; Willamson, C.; Peterman, K. ArcticDEM; a publically available, high resolution elevation model of the Arctic. EGU Gen. Assem. Conf. Abstr. 2016, 18, 8396. [Google Scholar]
  31. Manasypov, R.M.; Vorobyev, S.N.; Loiko, S.V.; Kritzkov, I.V.; Shirokova, L.S.; Shevchenko, V.P.; Kirpotin, S.N.; Kulizhsky, S.P.; Kolesnichenko, L.G.; Zemtzov, V.A.; et al. Seasonal dynamics of organic carbon and metals in thermokarst lakes from the discontinuous permafrost zone of western Siberia. Biogeosciences 2015, 12, 3009–3028. [Google Scholar] [CrossRef] [Green Version]
  32. Arkhipov, A.Y.; Bugrov, V.A.; Vorobyev, S.A.; Gershman, D.M.; Grigoryan, S.V.; Kiyatovskiy, E.M.; Matveev, A.A.; Milyaev, S.A.; Nikolaev, V.A.; Perelman, A.I.; et al. Handbook of Geochemical Prospecting for Minerals; Solovov, A.P., Ed.; Nedra: Moscow, Russia, 1990; p. 335. (In Russian) [Google Scholar]
  33. Chetverova, A.; Skorospekhova, T.; Morgenstern, A.; Alekseeva, N.; Spiridonov, I.; Fedorova, I. Hydrological and hydrochemical characteristics of lakes in the Lena River delta (Northeast-Siberia, Russia). Polarforschung 2018, 87, 111–124. [Google Scholar] [CrossRef]
  34. Boynton, W.V. Cosmochemistry of the rare earth elements: Meteorite studies. In Rare Earth Element Geochemistry; Henderson, P., Ed.; Elsevier: Amsterdam, The Netherlands, 1984; pp. 63–114. [Google Scholar]
  35. Brookins, D.G. Eh-pH Diagrams for Geochemistry; Springer Science & Business Media: Berlin/Heidelberg, Germany, 2012; p. 176. [Google Scholar]
  36. Moeller, T. The Chemistry of Lanthanides; Rheinhold Publ. Co.: New York, NY, USA, 1963; p. 177. [Google Scholar]
  37. German, C.R.; Elderfield, H. Application of the Ce anomaly as a paleoredox indicator: The ground rules. Paleoceanography 1990, 5, 823–833. [Google Scholar] [CrossRef]
  38. Seto, M.; Akagi, T. Chemical condition for the appearance of a negative Ce anomaly in stream waters and groundwaters. Geochem. J. 2008, 42, 371–380. [Google Scholar] [CrossRef] [Green Version]
Figure 1. Sample points at the Samoylov ((a)—orthophoto map) and Kurungnakh ((d)—Landsat satellite image) Islands, Star Water body on the Samoylov Island (b), interpolygonal pond SY-23 (red line), and small ponds SY-24 and 25 in the near-central part of the Samoylov Island ((c)—fragment of the orthophoto map), watercourse KY-20 (e) flowing from the alas water body KY-19 on the Kurungnakh Island. SY and KY—abbreviation for sample points on Samoylov and Kurungnakh Island, respectively.
Water 14 02322 g001
Figure 2. Satellite image (Sentinel 2) of the studied area on Kurungnakh Island with three geological groups. I—water bodies on the Yedoma upland surface; II—water bodies in the thermokarst hollows; III—water bodies on the 1st terrace.
Water 14 02322 g002
Figure 3. Total elements concentrations, Electrical Conductivity, ORP (Eh), pH values in water bodies waters of Samoylov (a) and Kurungnakh Island (b).
Water 14 02322 g003
Figure 4. Elements concentrations in the bottom sediments of Samoylov and Kurungnakh Islands and comparison with Clark concentrations in the continental crust (Clark c.c.). Circles highlight elements whose concentrations are higher than Clark c.c. values.
Water 14 02322 g004
Figure 5. Ratios of element concentrations in the bottom sediments of Samoylov and Kurungnakh Islands/clark in the continental crust (c.c.) in water bodies of I, II, III groups.
Water 14 02322 g005
Figure 6. Chondrite Normalized Concentrations of Rare Earth Elements in Bottom Sediments of Groups I-III Water bodies on Kurungnakh and Samoylov Islands, in Clays of Russian Platform and North American Shale Composite (NASC).
Water 14 02322 g006
Table 1. Geomorphological characteristics of the water bodies. Points of sampling—according to the map in Figure 1. Groups and subgroups are in Figure 2.
GroupDescriptionSubgroupArea, m2Depth, mAltitude, mPoints
IWater bodies on the Yedoma upland surface-3920.546KY-22
17560.545KY-16
IIThermokarst hollow water bodies of the third terraceII-1122,5601.623KY-21
1,791,8841–316KY-19, KY-20, KY-20.1, KY-18
242,5723.518KY-17
II-2512,8041.225KY-14
64160.722KY-15
II-3454,2241–519KY-2, KY-1,
KY-3, KY-4,
KY-5
II-41,244,3564.512KY-6, KY-7,
KY-25
II-5179,0523.514KY-8, KY-9
II-6289,9080.5–7.88KY-23, KY-24, KY-26, KY-10, KY-11
IIIWater bodies on the 1st terrace-46,8687.26KY-12
40,7803.58KY-29
169,4603–78KY-27,28
Table 2. Concentrations of the chemical elements in water bodies waters of the Samoylov and Kurungnakh Island. Bold—concentrations exceeding Clarks values. Underline—concentrations exceeding concentrations in the Lena River.
ElementAverage Samoylov (n = 25)Average Kurungnakh (n = 27)Clark [32]Lena RiverAverage ThermokarstAverage Thermokarst in Summer, Water Body Size 100–500,000 m2 [31]Average Thermokarst in Summer, Water Body Size > 500,000 m2 [31]Average Thermokarst in Summer, Continous Permafrost [6]
mg∙L−1
Ca279.712158.9 [33]0.29 ± 0.160.47 ± 0.371.9 ± 1.4
Mg7.83.62.94.24.2 [33]0.23 ± 0.190.13 ± 0.0120.81 ± 1.1
K3.00.532.00.61 0.21 ± 0.200.27 ± 0.0950.082 ± 0.058
Na7.41.15.04.92.4 [33]1.2 ± 1.20.90 ± 0.350.68 ± 0.39
Al3.90.0760.160.49 0.10 ± 0.0690.14 ± 0.0770.0400.037
Si3.70.316.02.20.57 [33] 0.29 ± 0.36
Fe2.90.860.0401.2 0.25 ± 0.160.27 ± 0.240.19 ± 0.43
Mn0.770.0360.0100.047 0.016 ± 0.010.018 ± 0.0040.007 ± 0.015
P0.480.0240.040.049 0.012 ± 0.01
μg∙L−1
Li5.11.22.52.1 0.97 ± 0.63
Be2600.0560.0050.050 0.007 ± 0.0040.012 ± 0.003
Sc7.35.00.05.0
Ti7.93.33.014 1.2 ± 0.664.5 ± 2.83.6 ± 5.4
V120.281.01.7 0.36 ± 0.250.84 ± 0.370.47 ± 0.38
Cr431.01.02.1 0.37 ± 0.170.46 ± 0.130.31 ± 0.27
Co110.440.300.57 0.10 ± 0.050.095 ± 0.0350.23 ± 0.27
Ni240.442.51.0 0.32 ± 0.150.56 ± 0.431.5 ± 0.69
Cu110.687.01.9 0.47 ± 0.290.63 ± 0.440.72 ± 0.97
Zn552.2203.6 62 ± 47108 ± 9724.5 ± 60
Ga1.20.0410.100.19 0.023 ± 0.0160.037 ± 0.0230.01 ± 0.006
Ge0.400.0080.0700.037
As3.10.392.00.65 0.64 ± 0.190.63 ± 0.0570.72 ± 0.24
Se0.540.100.200.010 38 ± 15
Rb8.30.290.01.1 0.21 ± 0.2050.388 ± 0.1660.03 ± 0.13
Sr21047507550 [33]5.9 ± 4.08.9 ± 4.711 ± 7.1
Y130.140.700.83 0.12 ± 0.09
Zr1.40.0552.60.24 0.1 ± 0.0680.309 ± 0.1380.11 ± 0.11
Nb0.0440.00410.0010.025 0.014 ± 0.0120.024 ± 0.0120.004 ± 0.003
Mo0.180.0771.00.27 0.01 ± 0.0090.021 ± 0.0030.03 ± 0.06
Ag0.0140.0020.200.0073
Cd0.310.0260.200.018 0.024 ± 0.0150.017 ± 0.010.003 ± 0.003
In0.0130.004n.d.0.0010
Sb0.0970.0301.00.15 0.046 ± 0.0120.064 ± 0.0150.017 ± 0.012
Te0.500.503.00.50
Cs0.0580.0070.0300.042 0.008 ± 0.0070.013 ± 0.0070.001 ± 0.0006
Ba3707.1301615 [33]126 ± 81139 ± 7778 ± 117
La180.210.051.5 0.037 ± 0.0310.072 ± 0.020.09 ± 0.06
Ce390.410.083.0 0.09 ± 0.0830.15 ± 0.0520.18 ± 0.17
Pr4.20.0500.0070.35 0.011 ± 0.010.018 ± 0.0060.024 ± 0.02
Nd16.00.190.0401.3 0.047 ± 0.0450.078 ± 0.0260.101 ± 0.09
Sm3.50.039n.d.0.24 0.012 ± 0.0110.019 ± 0.0070.024 ± 0.02
Eu0.760.0090.0010.05 0.019 ± 0.0180.014 ± 0.0050.011 ± 0.01
Gd3.80.0410.0080.26 0.013 ± 0.0110.019 ± 0.0070.027 ± 0.02
Tb0.510.0050.0010.04 0.004 ± 0.003
Dy2.40.0270.0050.19 0.012 ± 0.0090.019 ± 0.0050.021 ± 0.02
Ho0.450.0050.0010.028 0.003 ± 0.0020.004 ± 0.0020.004 ± 0.003
Er1.20.0110.0040.068 0.006 ± 0.0050.012 ± 0.0030.012 ± 0.01
Tm0.160.0030.0010.013 0.002 ± 0.0010.002 ± 0.0010.002 ± 0.001
Yb1.00.009n.d.0.056 0.006 ± 0.0050.01 ± 0.0030.01 ± 0.008
Lu0.150.0020.00100.007 0.002 ± 0.0010.002 ± 0.0010.002 ± 0.001
Hf0.0600.001n.d.0.0040 0.007 ± 0.0060.012 ± 0.0030.02 ± 0.01
W0.00.0020.0300.0079 0.083 ± 0.0810.059 ± 0.046
Au0.00.0060.00200.0050
Tl0.00.01.00.0078
Pb7.10.11.00.84 0.27 ± 0.180.18 ± 0.0670.05 ± 0.06
Bi0.0090.0010.0300.006
Th0.700.0130.100.060 0.011 ± 0.0090.023 ± 0.0070.01 ± 0.01
U0.940.0270.500.17 0.006 ± 0.0050.01 ± 0.0050.01 ± 0.01
Publisher’s Note: MDPI stays neutral with regard to jurisdictional claims in published maps and institutional affiliations.

