
High Ecological Health Risks of Potentially Toxic Metals in Polluted Drainage Sediments: Is There a Need for Public Concern during Flash Floods?


1
Department of Biology, Faculty of Science, Universiti Putra Malaysia, UPM, Serdang 43400, Malaysia
2
Department of Biology, Faculty of Science, University of Tabuk, Tabuk P.O. Box 741, Saudi Arabia
*
Author to whom correspondence should be addressed.
Water 2022, 14(15), 2316; https://doi.org/10.3390/w14152316
Submission received: 5 July 2022
/
Revised: 22 July 2022
/
Accepted: 24 July 2022
/
Published: 26 July 2022
(This article belongs to the Section Water and One Health)
Abstract
:The present study aimed to investigate the concentrations of potentially toxic metals (PTMs) in the drainages, rivers, and coast of Malacca in Peninsular Malaysia. The ranges of total PTM concentrations (mg/kg dry weight) were 1.88–7.01 for Cd, 18.9–1689 for Cu, 26.0–850 for Ni, 56.5–307 for Pb, and 75.4–312 for Zn. Based on an ecological risk assessment and geochemical fractions, it was concluded that heavy metals pollute the drainages and the Malacca River. The potential ecological risk index (PERI) categorised the drainage and river sites as a “very high ecological risk”. Therefore, it was shown that elevated levels of PTMs in the drainages near Malacca Industrial Area and in the Malacca River sediment were most probably attributed to untreated (or incomplete treatment of) industrial effluents. The drainage sediments were found to have higher hazard quotient (HQ) values for the three pathways of the PTMs for children and adults. Although in general, the non-carcinogenic risks of the PTMs for children and adults indicated no significant detrimental health effects, the hazard index (HI) for Pb in children at drainage locations surpassed 1.0, suggesting a non-carcinogenic risk (NCR), which is a cause for worry. Consequently, the ecological health risk assessments offered critical information for PTM pollution reduction and environmental management in future sustainable development initiatives in Peninsular Malaysia’s drainages and rivers. The present findings on the ecological health risks of PTMs based on 2006 samples can serve as an important baseline for future reference and comparison. This work should encourage future investigations on the direct impact of the risks to the residents during floods in Malaysia, as part of mitigation and risk assessments of the contaminated drainage and river sediments in an attempt to lower the hazards for the surrounding residents.
1. Introduction
The present study on the ecological health risk assessment of potentially toxic metals (PTMs) was prompted in part by the high probability of drainage and river overflow during flash flood incidents. In Malaysia, flooding is caused by widespread, prolonged, intense rainfall that produces a vast quantity of water runoff that greatly exceeds the capacity of streams and rivers. Typically, extensive areas are swamped or inundated during flash floods.
Due to the tropical depression phenomenon, massive amounts of precipitation contributed to the December 2021 flooding in Malaysia. This event submerged the lowland area on the west coast of Peninsular Malaysia by about four metres. The overflowing water from the drainages and river had visibly inundated the residential areas. There is a question that arises: “Would these overflown waters from the polluted drainages and rivers carry PTMs in the resuspending sedimentary particles with it?” There have been reports of overflowing water carrying sedimentary particles into the residential houses during the floodplain occurrence in time of flash floods. What could be the ecological health risks of PTMs in these polluted sediments if they were to overflow and be carried into the residential areas? Even though this study did not directly study the impact of the overflowed water with the toxic metals in the upwelling sedimentary particles from the polluted drainages, the findings on the ecological health risks of PTMs could lend us a hint of the possibility.
Sediment is a crucial part of the aquatic ecology. It is not only a secondary pollution source that can affect the water quality and the ecosystem’s biota [1,2,3,4,5,6,7,8], but it is also a site where pollutants are collected from the water body. Heavy metal poisoning in river sediment negatively influences aquatic creatures and may provide a health risk to humans [1,4,5]. It is critical that the environmental hazards caused by PTMs be identified and reviewed so that potential contamination may be detected early and corrected before it causes irreversible damage to ecosystem health.
Human activities cause a considerable input of nutrients, heavy metals, and sedimentation enhancement in drainage systems [8,9,10]. However, the impact of diverse human activities and land uses on the distribution and related environmental risk of PTMs in rivers, ditches/drainages, and the Malacca River remains largely unknown, which is critical for future water management.
Malaysia’s rapid development has increased anthropogenic PTM inputs into the environment [11,12]. PTM contamination has been recorded in coastal areas, estuary rivers, mangroves, urban areas, lakes, and other bodies of water in Peninsular Malaysia, according to various studies [3]. In Malaysia, however, just a few researchers have focused on drainage contamination. Long-term exposure to PTM contaminants can impair human health [4,5,13]. PTM pollution has been linked to human health risk (HHR) in several studies [4]. PTM-polluted sediment can enter the human body through three routes: ingestion, inhalation, and skin contact [1,4,5]. In addition, various studies have indicated the detrimental effects of high metal levels on human health [14,15,16,17,18,19,20,21,22].
In the present study, we focused on Malacca Industrial Area, Malacca River, and the nearby coastal sediments in Malacca due to three reasons. Firstly, there have been no reported studies on the ecological health risks of PTMs in the three areas of Malacca. Secondly, we focused on these three locations (drainages, rivers, and the shoreline) because it is good for comparison purposes and to understand the potential sources of PTMs in the Malacca Industrial Area. Thirdly, we hypothesised that the high ecological health risks of PTMs in the polluted drainages from Malacca would potentially be hazardous to human health if flooding occurs. Thus, this study could trigger future studies on the direct impacts on human health due to the floodplain of flash floods in Malaysia.
The aim of this study was to assess the potential ecological health risks of PTMs (Cd, Cu, Zn, Pb, and Ni), in drainage sediments collected from Malacca Industrial Area, Malacca River, and the nearby coastal sediments in Malacca. Later in this paper, the discussion and assumptions analyse the risks of overflowing water from the polluted drainages and river that could inundate the residential area during flooding periods.
2. Materials and Methods
2.1. Sampling Site Descriptions and Sediment Collection
The surface sediments from 4 sites in the Malacca River and six sites in the drainages of the Malacca Industrial Area were collected on 15 December 2006 (Figure 1). In addition, two sampling sites near the coast were collected on 17 January 2005. Convenient samplings of surface sediments (0–5 cm) were conducted at the sampling sites by using a stainless-steel shovel. Three subsamples (about 2 kg) were collected from each sampling site. The collected sediment samples were put into clean polyethene zip-lock bags and transported back to the laboratory for further analysis. The site descriptions are presented in Table S1.
Before analysis, sediment samples were oven-dried at 60 °C for 72 h until constant dry weights. The particles of the dry silt were sieved through a 63 μm stainless-steel mesh. During the sifting procedure, the samples were also vigorously shaken to ensure homogeneity.
2.2. Metal Analysis
2.2.1. Acid Digestions
Sediment samples were digested using direct aqua regia, a technique of wet digestion. A total of 0.50 g of dried sediment samples was put into a digestion tube (3 replicates). The aqua regia was a 4:1 mixture of nitric acid (HNO3, AnalaR grade, BDH 69%) and perchloric acid (HClO4, AnalaR grade, BDH 60–70%). On a digestion block, the digestion tube was heated at 40 °C for one hour and then at 140 °C for the next three hours [6]. The digested solution was then mixed with up to 40 mL of double-distilled water. Using Whatman No. 1 filter paper, the solution was filtered. The solution was stored in a plastic bottle that was acid-washed [23]. Using an air-acetylene flame atomic absorption spectrophotometer (FAAS, PerkinElmer AAnalyst 800; PerkinElmer LLC, Branford, CT, USA), the solution was determined for Cd, Cu, Fe, Ni, Pb, and Zn.
The modified sequential extraction procedure (SEP) from Badri and Aston [23] and, as used by Wong et al. [24], was used to determine the geochemical fractions (GFs) of Cd, Cu, Fe, Ni, Pb, and Zn in the sediments. This SEP could separate the metals in the sediment into four GFs, namely, (a) the easily, freely, leachable or exchangeable (EFLE; F1) fraction, (b) acid-reducible (AR; F2) fraction, and (c) oxidisable-organic (OO; F3) fraction. The last fraction is a (d) resistant or residual (R; F4) fraction.
2.2.2. Quality Control for Heavy Metal Analysis
All equipment and glassware used in the present study were acid-washed to avoid external contamination. Along with the digested samples, procedure blanks and quality control samples produced from the standard solution for each metal were analysed. After every 5–10 samples, these standard solutions were analysed to verify the correctness of the samples analysed. The correctness of the procedures for analysing Zn, Pb, Ni, Fe, Cu, and Cd was confirmed using the certified reference materials (CRMs) of IAEA Soil-5, NSC DC73319 Soil China, TH-1 Sediment Canada, MESS-3 NRC, and SRM 1547. The recoveries were 82.8–115% for Zn, 99.8–116% for Pb, 102–112% for Ni, 96.6–106% for Fe, 85.0–93.1% for Cu, and 102–156% for Cd (Table S2). The detection limits of the FAAS for Zn, Pb, Ni, Fe, Cu, and Cd were 0.007, 0.009, 0.010, 0.010, 0.010, and 0.009 mg/L, respectively.
2.3. Ecological Risks
2.3.1. Ratios of Non-Resistant to Resistant Fractions
The ratios of non-resistant to resistant fractions (NR/R) were based on Yap and Wong [6], as seen in Equation (1):
where the non-resistant fraction is the combination of fractions of EFLE, AR, and OO, and the resistant fraction is the residual fraction from the modified SEP from Badri and Aston [23].
2.3.2. Enrichment Factors
The enrichment factor (EF) tabulations were based on Buat-Menard and Chesselt [25]. The EF calculation was based on Equation (2):
where (Me/Fe)sample is the metal to Fe ratio in the sediment samples. The background concentrations of the PTMs and Fe were based on the Earth’s upper continental crust (UCC) (Wedepohl [26]), which is composed of, namely, Zn (52.0 mg/kg), Pb (17.0 mg/kg), Ni (18.6 mg/kg), Cu (14.3 mg/kg), Cd (0.102 mg/kg), and. Fe (3.09%), In the present study, Fe was used as a normaliser to make an accurate estimate to mitigate the possible differences in sedimentary grain size and mineralogy [27,28]. Sutherland [29] established five classifications based on the EF values, namely, “extremely high enrichment” (EF ≥ 40), “very high enrichment” (20 ≤ EF < 40), “significant enrichment” (5 ≤ EF < 20), “moderate enrichment” (2 ≤ EF < 5), and “depletion of metal enrichment” (EF < 2).
2.3.3. Geoaccumulation Index
The geoaccumulation index (Igeo) has been demonstrated to be a useful approach for evaluating sediment heavy metal pollution [4,30,31,32]. Utilizing the Igeo, the level of metal pollution in the area was calculated using Equation (3) [33].
where the background concentrations were based on the Earth’s UCC, as mentioned above.
The value (1.5) is the correction factor in mitigating the lithogenic effluents. There are six established classifications of pollution: “very strongly polluted” (>5), “strongly to very strongly polluted” (4–5), “strongly polluted” (3–4), “moderately polluted to strongly polluted” (2–3), “moderately polluted” (1–2), “unpolluted” (0–1), and “practically unpolluted” (<0) [33].
2.3.4. Ecological Risk Index
Firstly, the contamination factor (CF) calculation was based on the pollution of a single metal factor in Equation (4).
where CF is the contamination factor; Cs is the mean metal concentration in the sediment; CB is the background levels based on Wedepohl [26], as mentioned previously. According to Hakanson [34], the four classifications for CR values are “very high” (CF ≥ 6), “considerable” (3 ≤ CF < 6), “moderate” (1 ≤ CF < 3), and “low” (CF < 1).
Later, the calculation of the ecological risk (ER), which is the potential ecological risk of a single element, was calculated based on Equation (5).
The TR values used in the present study were Zn = 1.00, Pb = 5.00, Ni = 5.00, Cu = 5.00, and Cd = 30.0 [34]. According to Hakanson [34], the five classifications for the ER are “very high ecological risk” (ER ≥ 320), “high potential ecological risk” (160 ≤ ER < 320), “considerable potential ecological risk” (80 ≤ ER < 160), “moderate potential ecological risk” (40 ≤ ER < 80), and “low potential ecological risk” (ER < 40).
2.3.5. Potential Ecological Risk Index
The potential ecological risk index (PERI) was utilised to estimate the possible ecological risk posed by PTMs in sediment, as proposed by Hakanson [34]. The PERI value is derived from the addition of all the ER values from each PTM, using Equation (6).
According to Hakanson [34], the four classifications for PERI values are “very high ecological risk” (PERI ≥ 600), “considerable ecological risk” (300 ≤ PERI < 600), “moderate ecological risk” (150 ≤ PERI < 300), and “low ecological risk” (PERI < 150).
2.4. Human Health Risk
In this study, the human health risk assessment (HHRA) of sediments was employed to calculate the non-carcinogenic risk (NCR) in humans via three exposure routes: dermal contact, inhalation, and ingestion. The approach utilised for the HHRA was based on the Exposure Factors Handbook and the US Environmental Protection Agency’s recommendations [35,36,37,38]. The average daily doses (ADDs) (mg/kg day) of PTMs by ingestion (ADDing), inhalation (ADDinh), and dermal contact (ADDder) were computed using Equations (7)–(9) for both children and adults:
where ADDing, ADDinh, and ADDder are the daily amounts of exposure to metals (mg/kg day) through ingestion, inhalation, and dermal contact, respectively. The hazard quotient (HQ) and hazard index (HI) [35,36] were used to calculate the NCR of PTMs. Table 1 shows the reference values, exposure factors, and their definitions that were used to calculate the risks of PTMs in sediments for the present study.
The HQ is the ratio of an element’s ADD to its reference dose (RfD) for the same exposure pathway(s) [37]. The RfD (mg/kg day) is the maximum daily dosage of metal from a particular exposure pathway for both children and adults that is considered not to pose a significant lifetime risk of adverse health consequences to sensitive persons. Table 1 displays the RfD (mg/kg per day) values of Cd, Ni, Cu, Pb, and Zn used in the present investigation for ingestion, inhalation, and dermal contact. If the ADD is below the RfD value (HQ < 1), it is believed that there would be no adverse health impacts; however, if the ADD exceeds the RfD value (HQ > 1), there will likely be adverse health effects [35,37].
The NCR is evaluated using HI, which is the sum of the three exposure paths’ HQs [41,42,43]. It was anticipated that an HI of 1.0 would not provide a considerable danger of non-carcinogenic consequences. An HI greater than 1.0 was anticipated to indicate the absence of a carcinogenic effect. There is a positive correlation between the risk of non-carcinogenic effects and the increase in the HI value [17]. The HI was computed using Formula (10).
2.5. Data Analysis
KaleidaGraph (Version 3.08, Synergy Software, Eden Prairie, MN, USA) was utilised to obtain the overall statistics of the data and to create the graphical bar charts in this study.
3. Results and Discussion
3.1. Potentially Toxic Metals in Drainage Sediments
The overall concentrations of PTMs in the sediment sampled from Peninsular Malaysia are presented in Table 2. For drainage sediments, the concentrations (mg/kg dry weight) ranged from 2.53 to 7.01 for Cd, 102 to 1689 for Cu, 26.0 to 850 for Ni, 56.5 to 307 for Pb, 232 to 312 for Zn, and ranged from 3.81 to 6.15 for Fe (%). For Malacca River sediments, the concentrations (mg/kg dry weight) ranged from 1.88 to 2.37 for Cd, 18.9 to 580 for Cu, 13.1 to 222 for Ni, 74.4 to 90.4 for Pb, 75.4 to 255 for Zn, and ranged from 1.76 to 3.70 for Fe (%). For coastal sediments, the concentrations (mg/kg dry weight) ranged from 0.96 to 1.45 for Cd, 8.02 to 43.9 for Cu, 16.6 to 28.5 for Ni, 32.2 to 59.5 for Pb, 34.9 to 126 for Zn, and ranged from 3.34 to 3.39 for Fe (%). Overall, the metal levels were highest in drainage sediments, followed by the river and coastal sediments.
Table 2 also provides comparisons with pre-industrial reference levels and UCC levels. All sampling sites had mean Cd concentrations that exceeded the pre-industrial reference levels [34] and UCC limits by Taylor and McLennan [44], and Rudnick and Gao [45]. For Cu, Ni, and Pb, the mean values for the drainage and river sites exceeded all the pre-industrial reference and UCC levels. For Zn, the mean values for the three areas (drainage, river, and coast) exceeded all the pre-industrial reference levels. These comparisons showed that the PTM levels from the study were mostly exceeding the background levels, and this should be an environmental concern.
3.2. Assessment of Potentially Toxic Metal Pollution
Values of NR/R, EF, Igeo, CF, and ER
The overall statistics of percentages (%) of fractions of F1, F2, F3, F4, and NR, ratios of NR/R, and values of EF, Igeo, CF, and ER for Cd, Cu, Ni, Pb, and Zn of sediments collected from the drainages, Malacca River, and coast in Malacca are presented in Table S3.
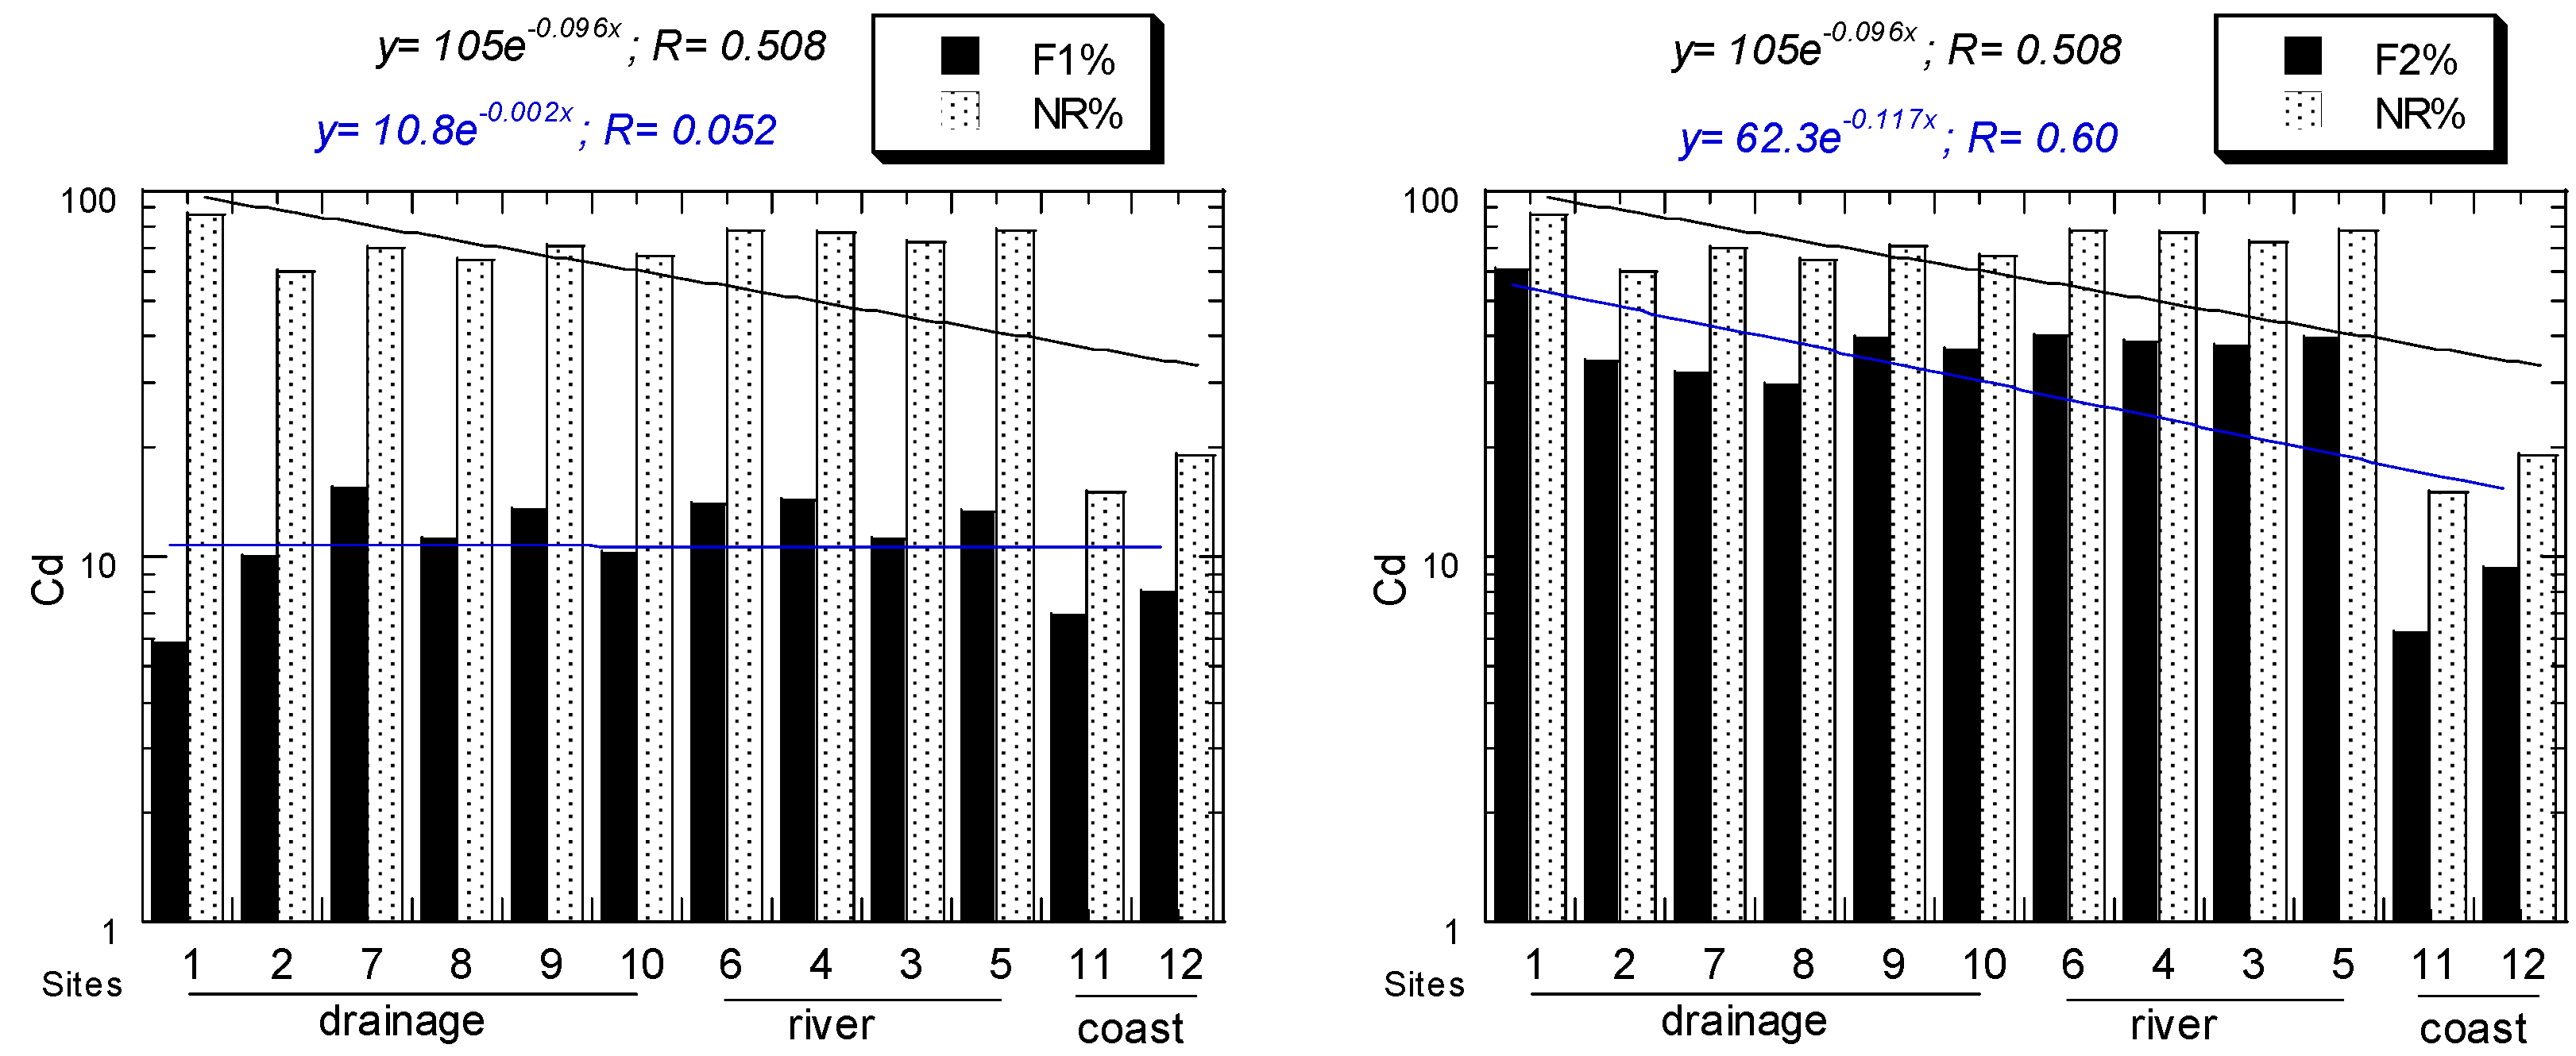
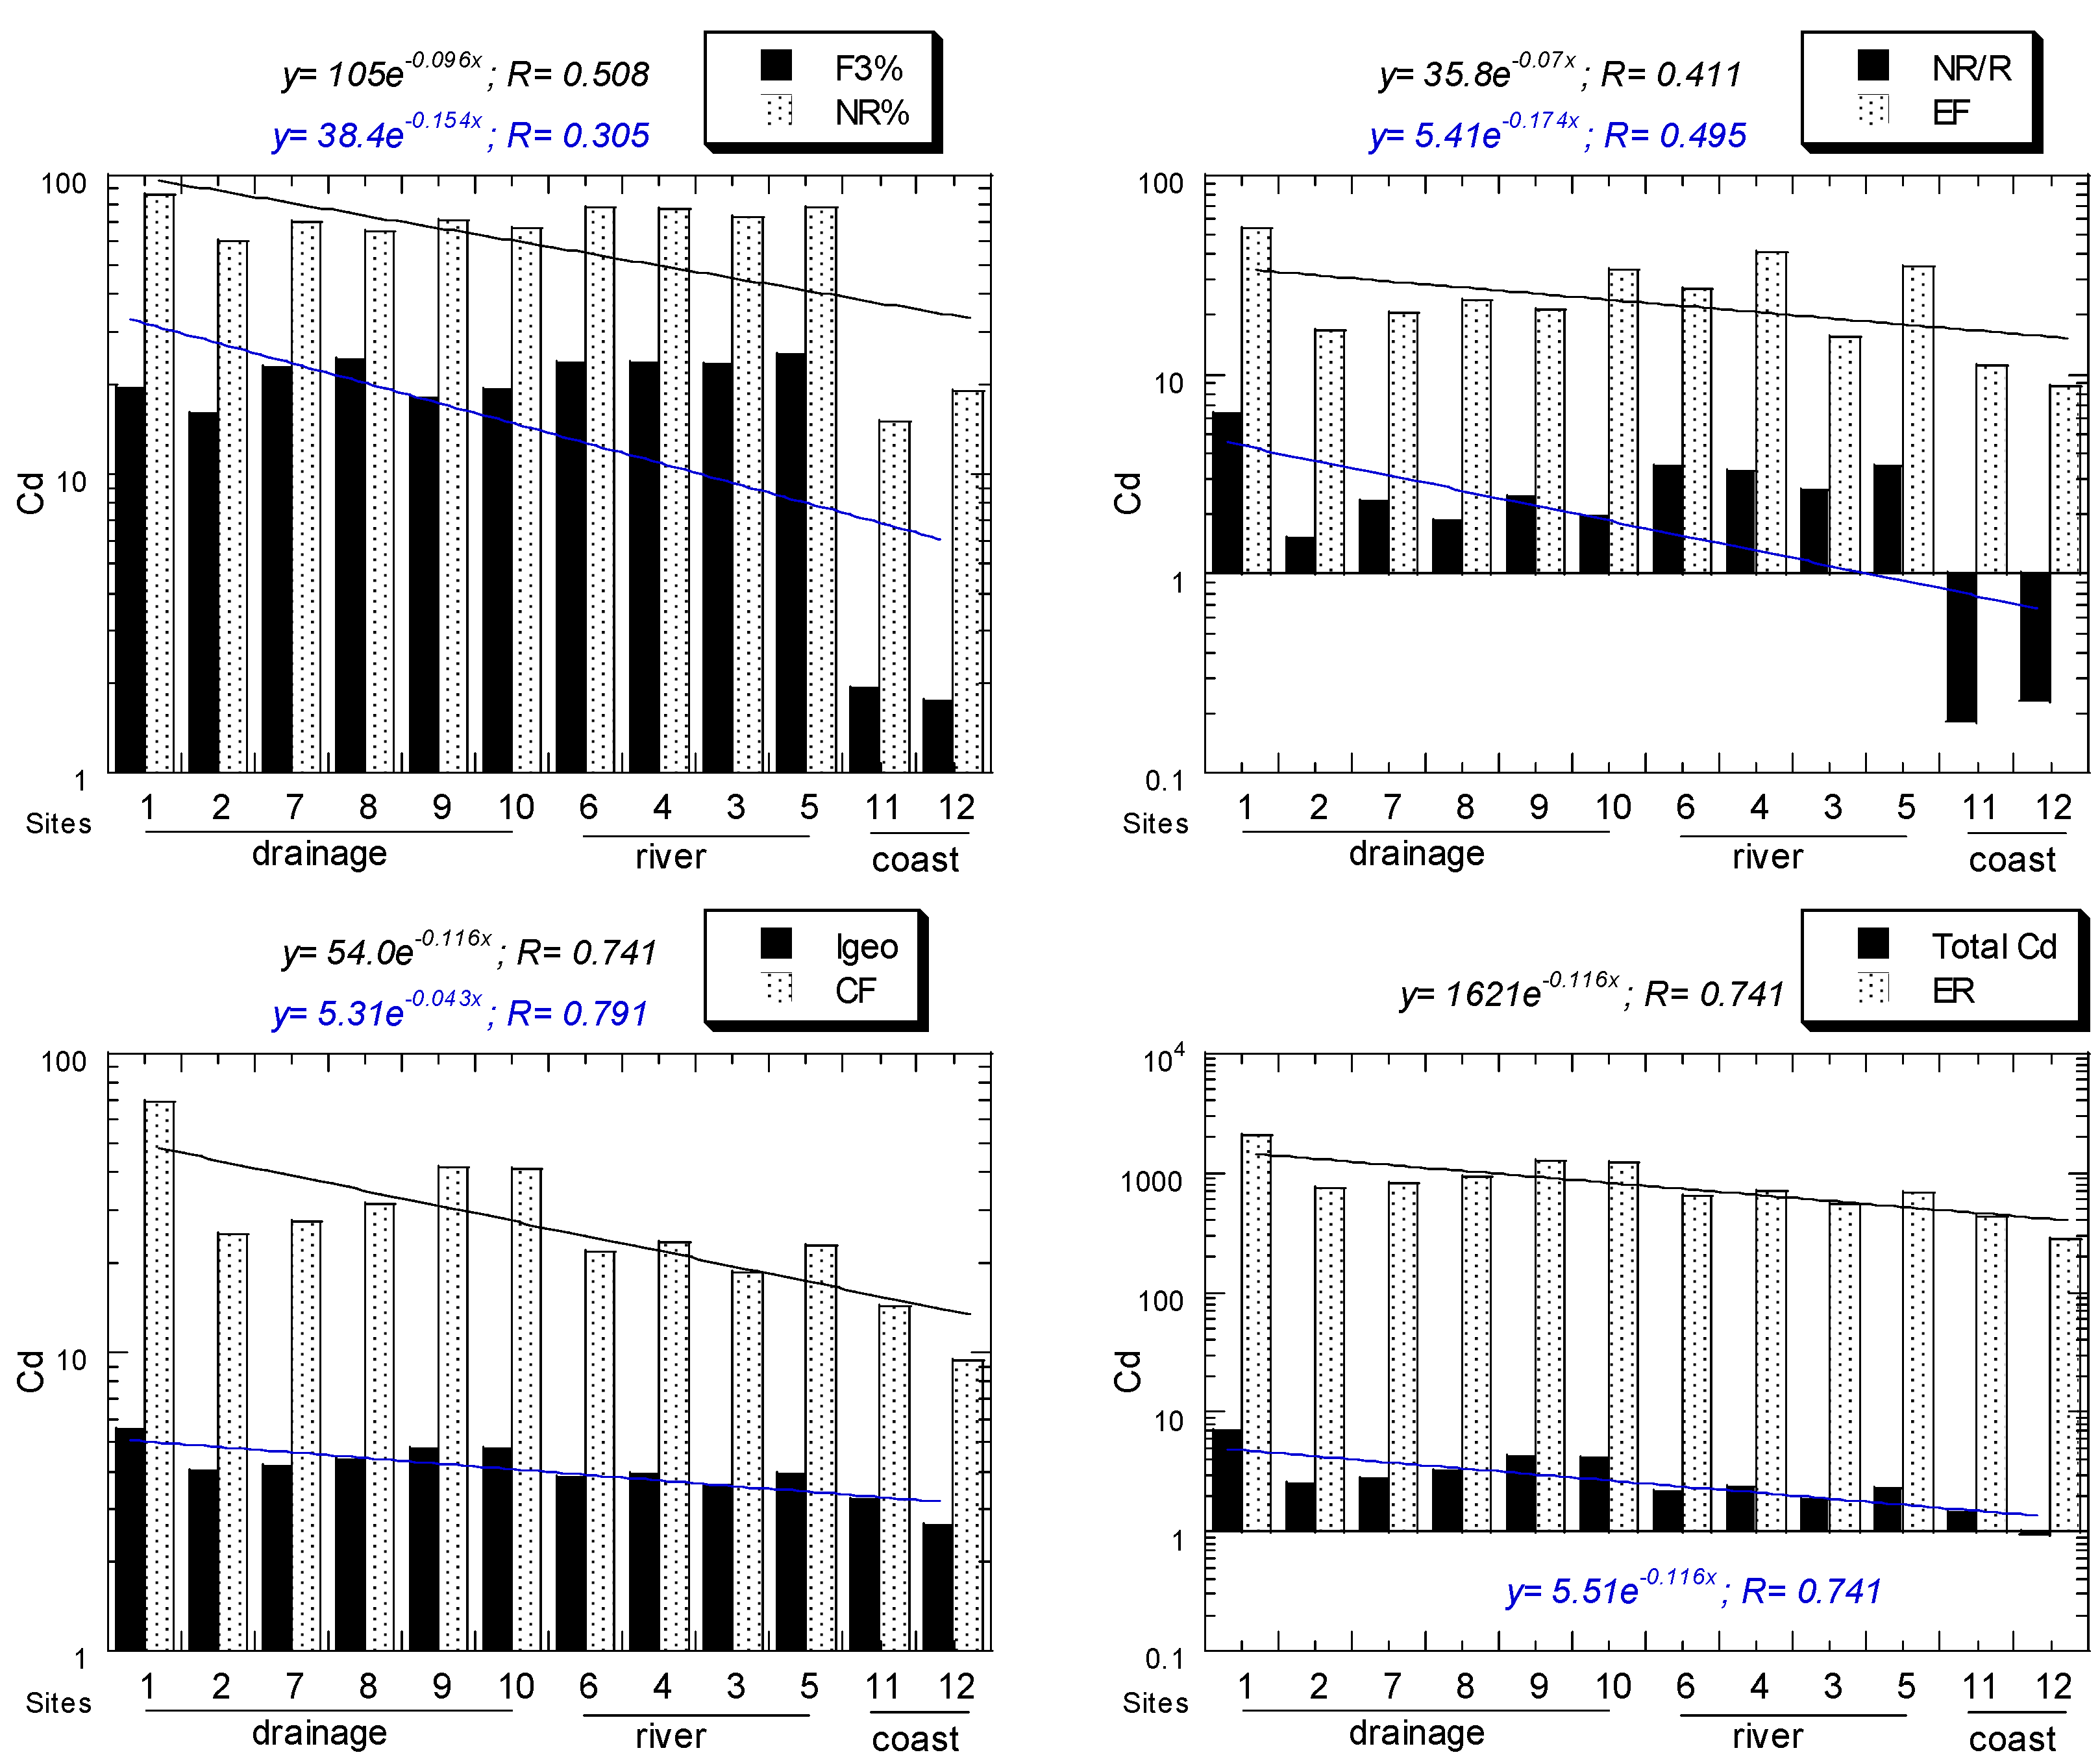
For Cd, all NR/R ratios of all sites ranged from 0.18 to 6.37. For Cd, all EF values of all sites ranged from 8.71, “significant enrichment”, to 54.3, “extremely high enrichment”. For Cd, all Igeo values of all sites ranged from 2.65, “moderately polluted to strongly polluted”, to 5.52, “very strongly polluted”. For Cd, all CF values of all sites ranged from 9.43, “very high”, to 68.7, “very high”. For Cd, all ER values of all sites ranged from 283, “high potential ecological risk”, to 2062, “very high ecological risk”. All the above Cd values decreased from the drainage to river and coastal sediments (Figure 2).
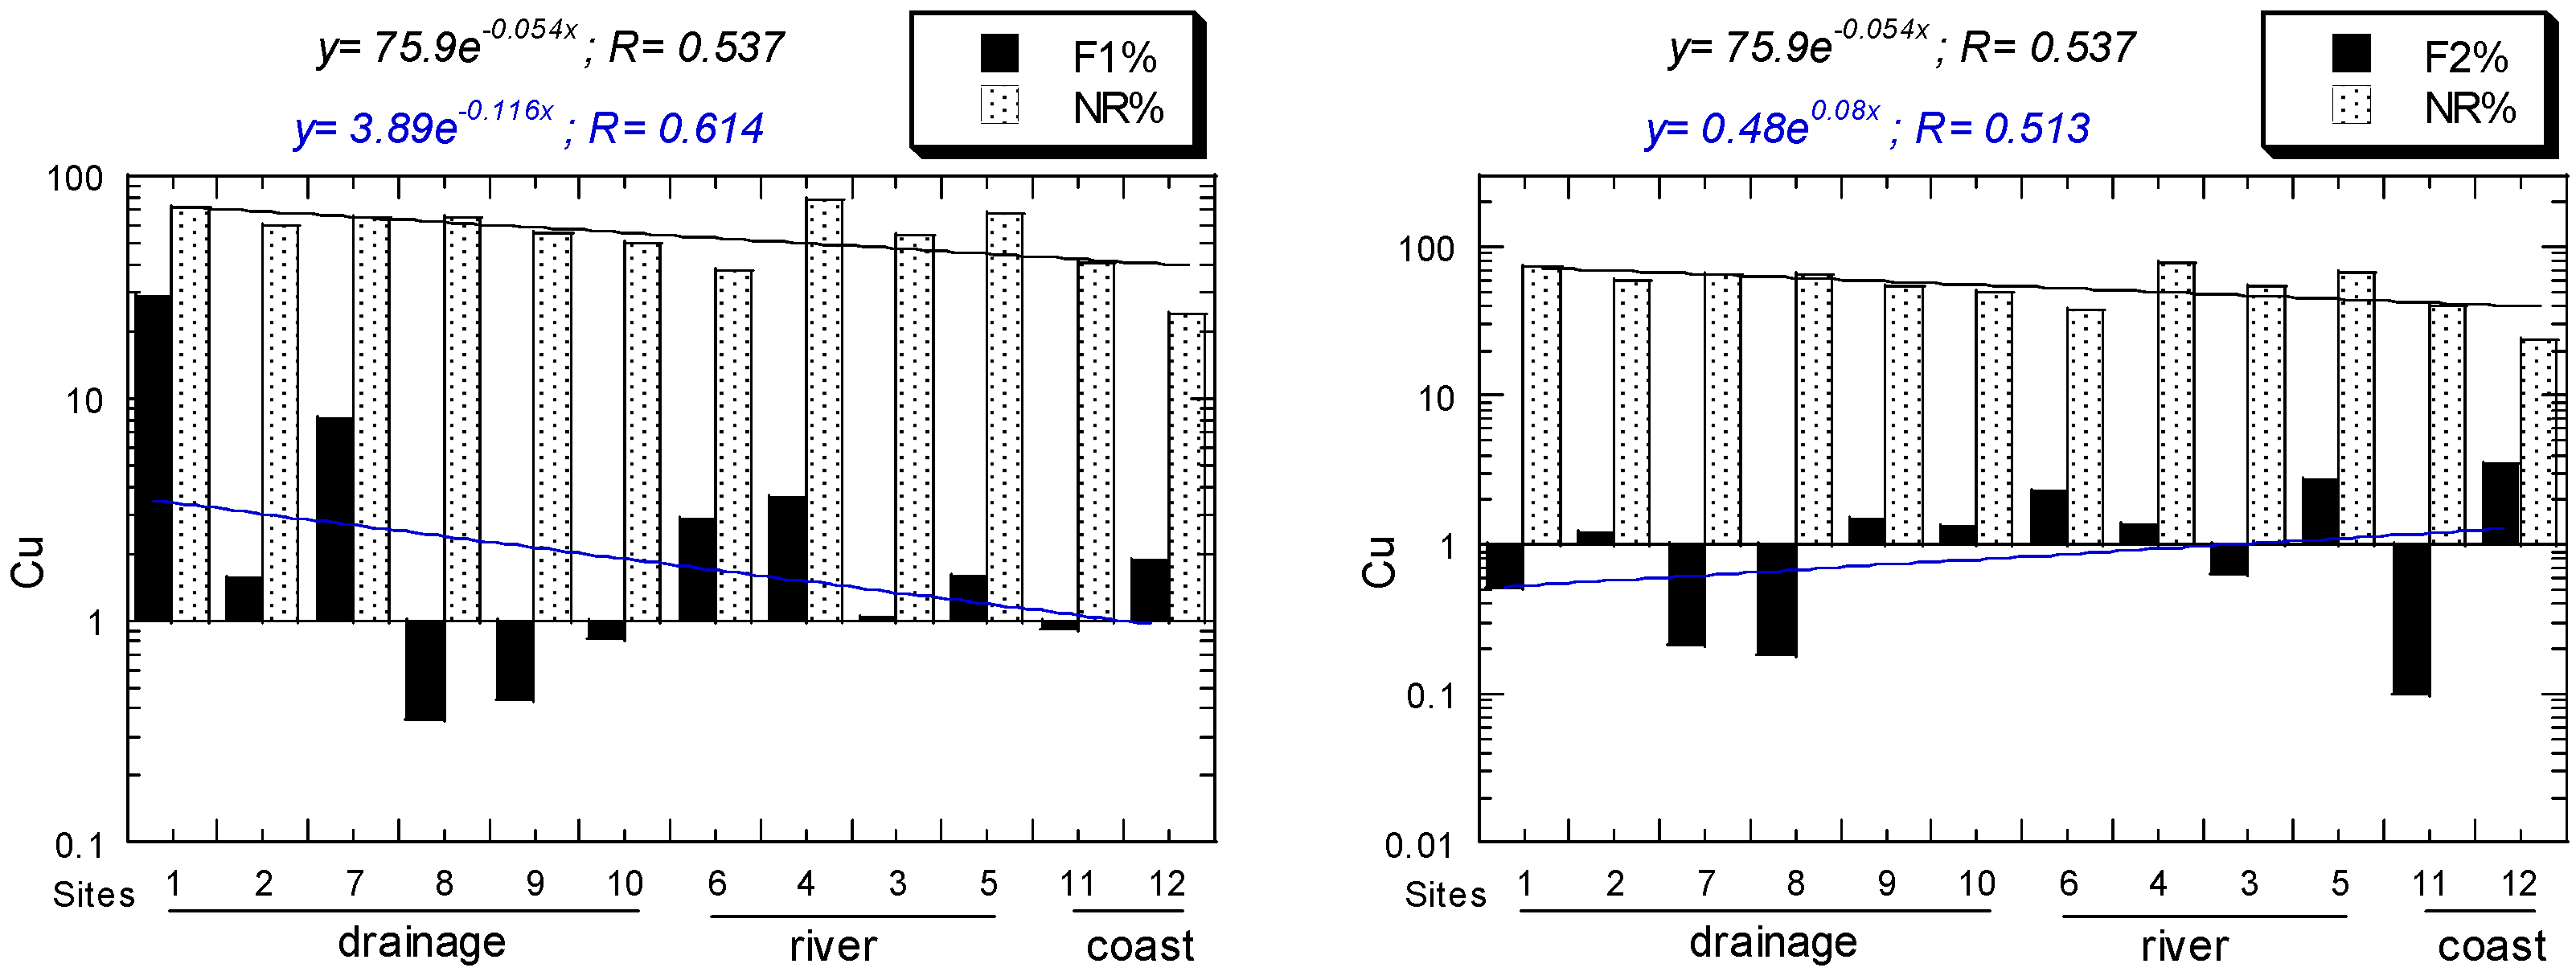
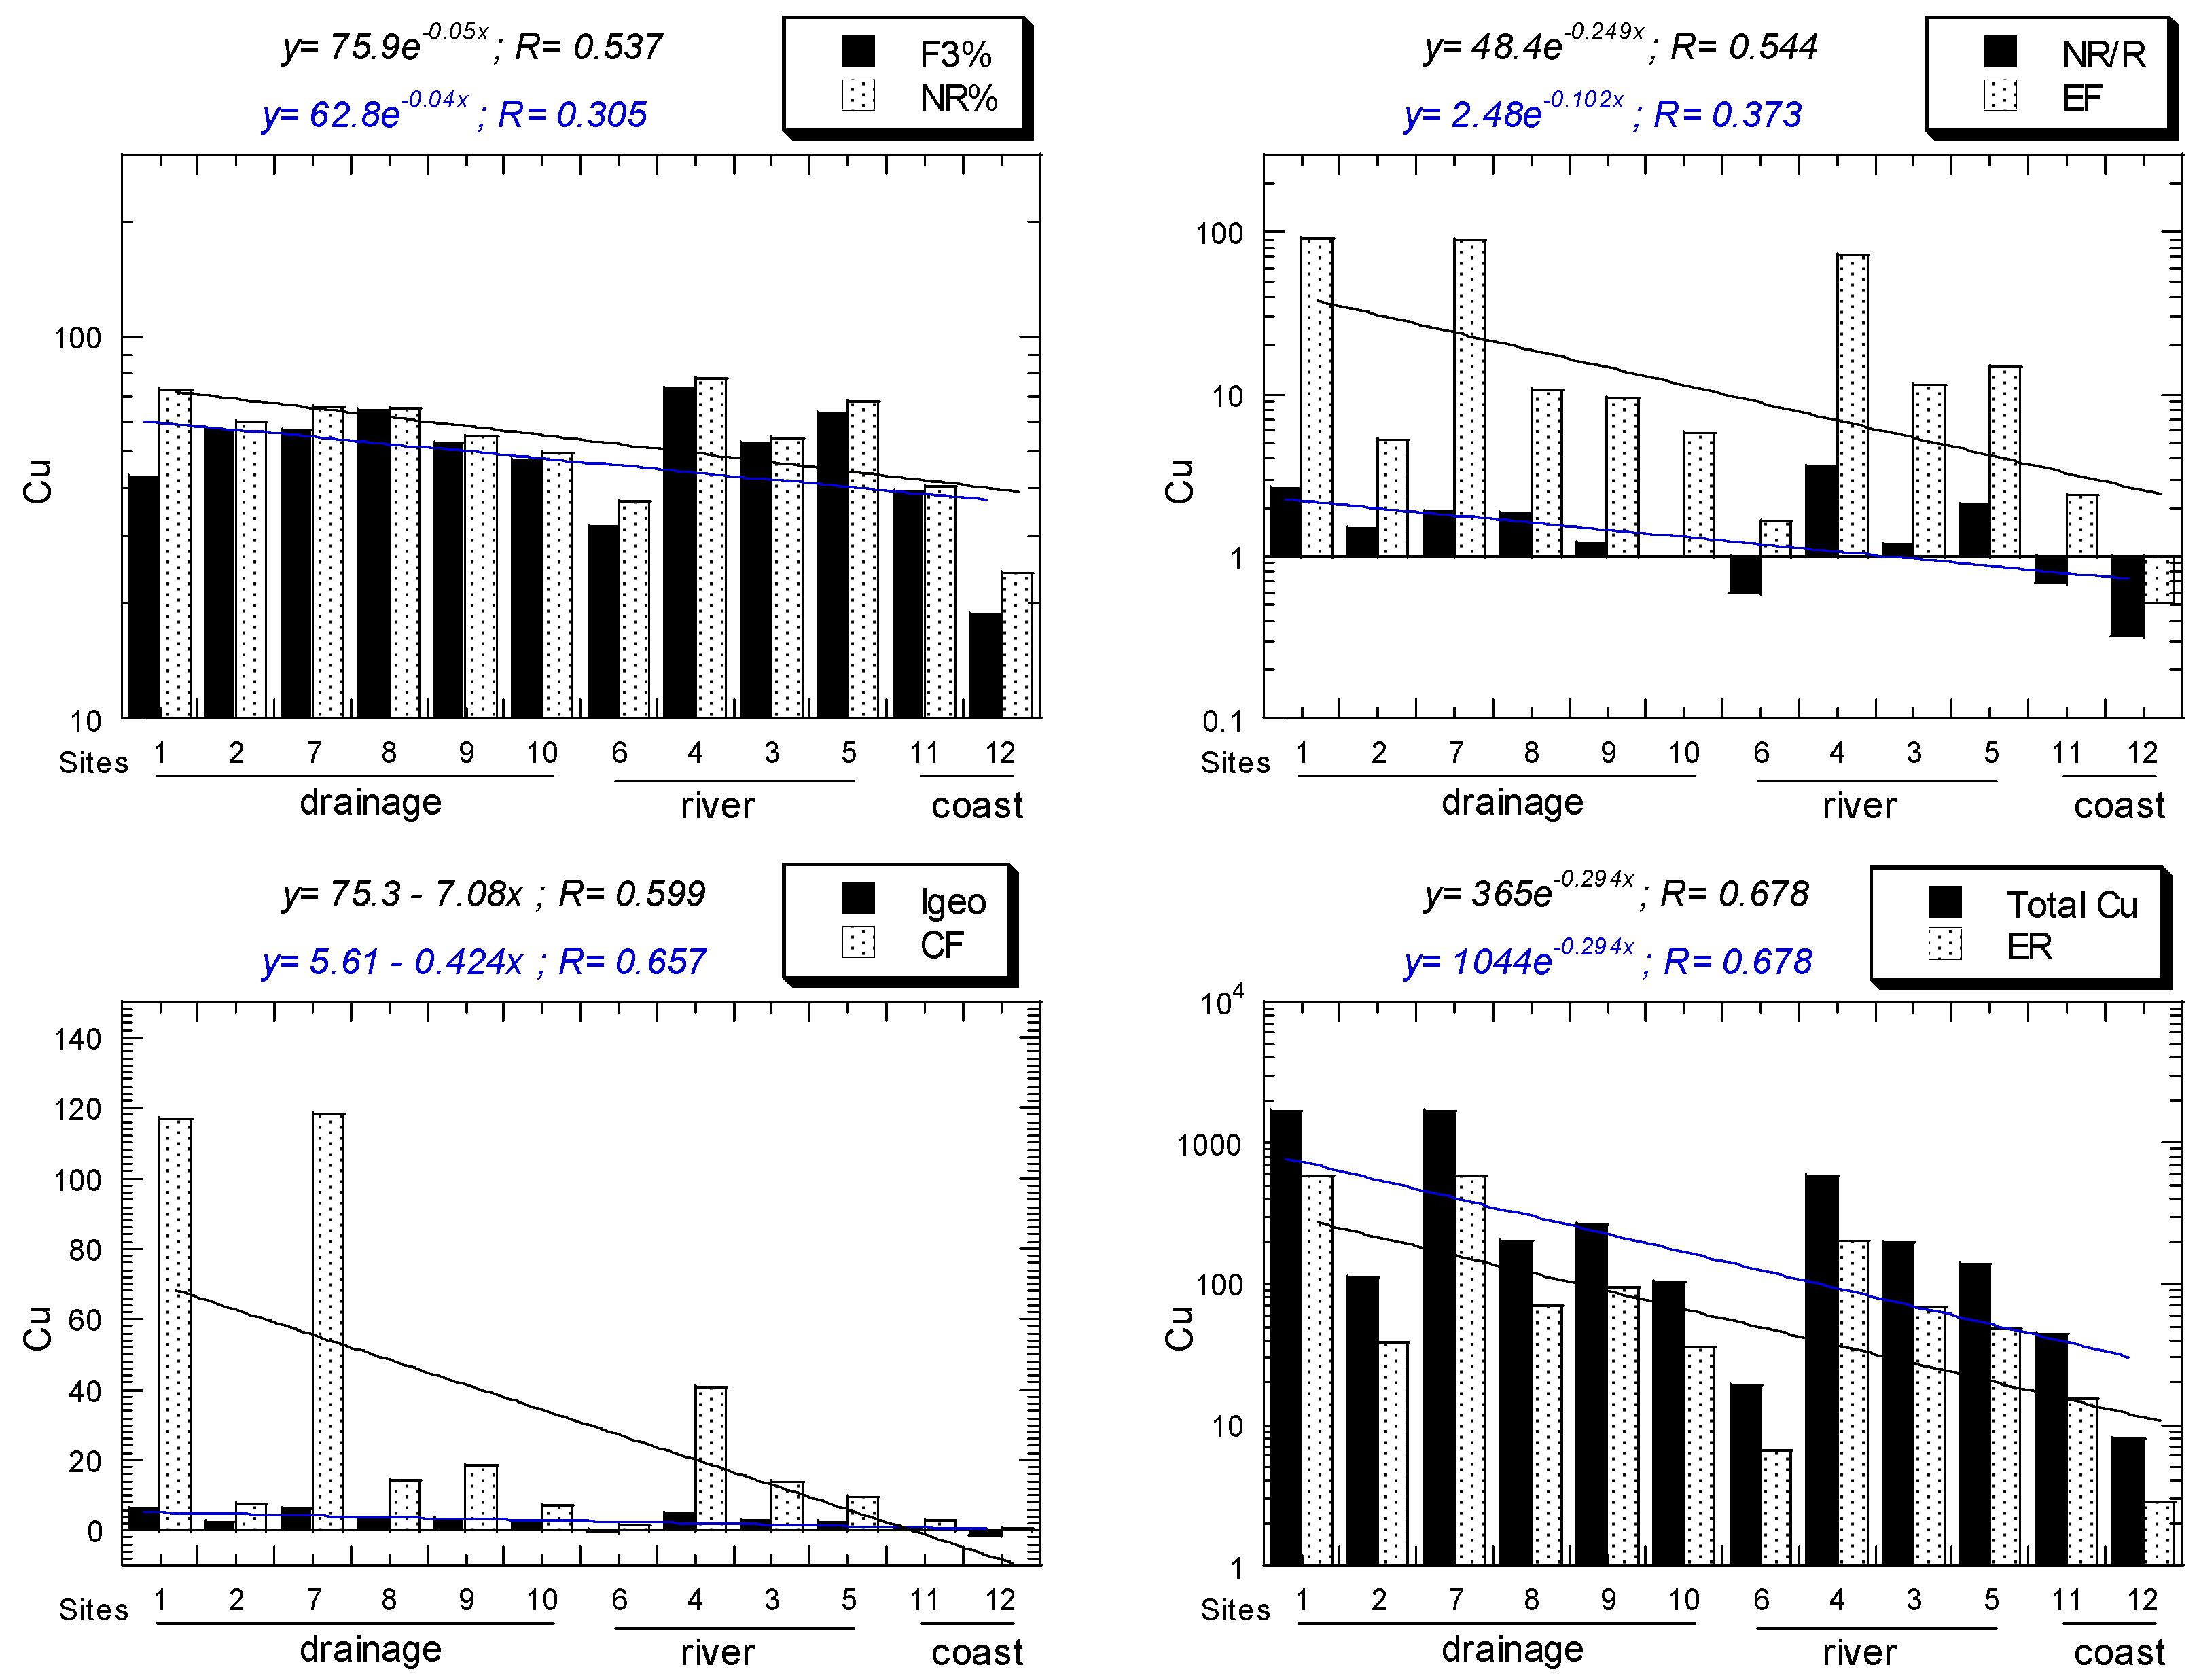
For Cu, all NR/R ratios of all sites ranged from 0.32 to 2.62. For Cu, all EF values of all sites ranged from 0.52, “depletion of metal enrichment”, to 92.4, “extremely high enrichment”. For Cu, all Igeo values of all sites ranged from −1.42, “practically unpolluted” to 6.30, “very strongly polluted”. For Cu, all CF values of all sites ranged from 0.56, “low”, to 118, “very high”. For Cu, all ER values of all sites ranged from 2.81, “low potential ecological risk”, to 591, “very high ecological risk”. All the Cu values above decreased from the drainage to river and coastal sediments (Figure 3).
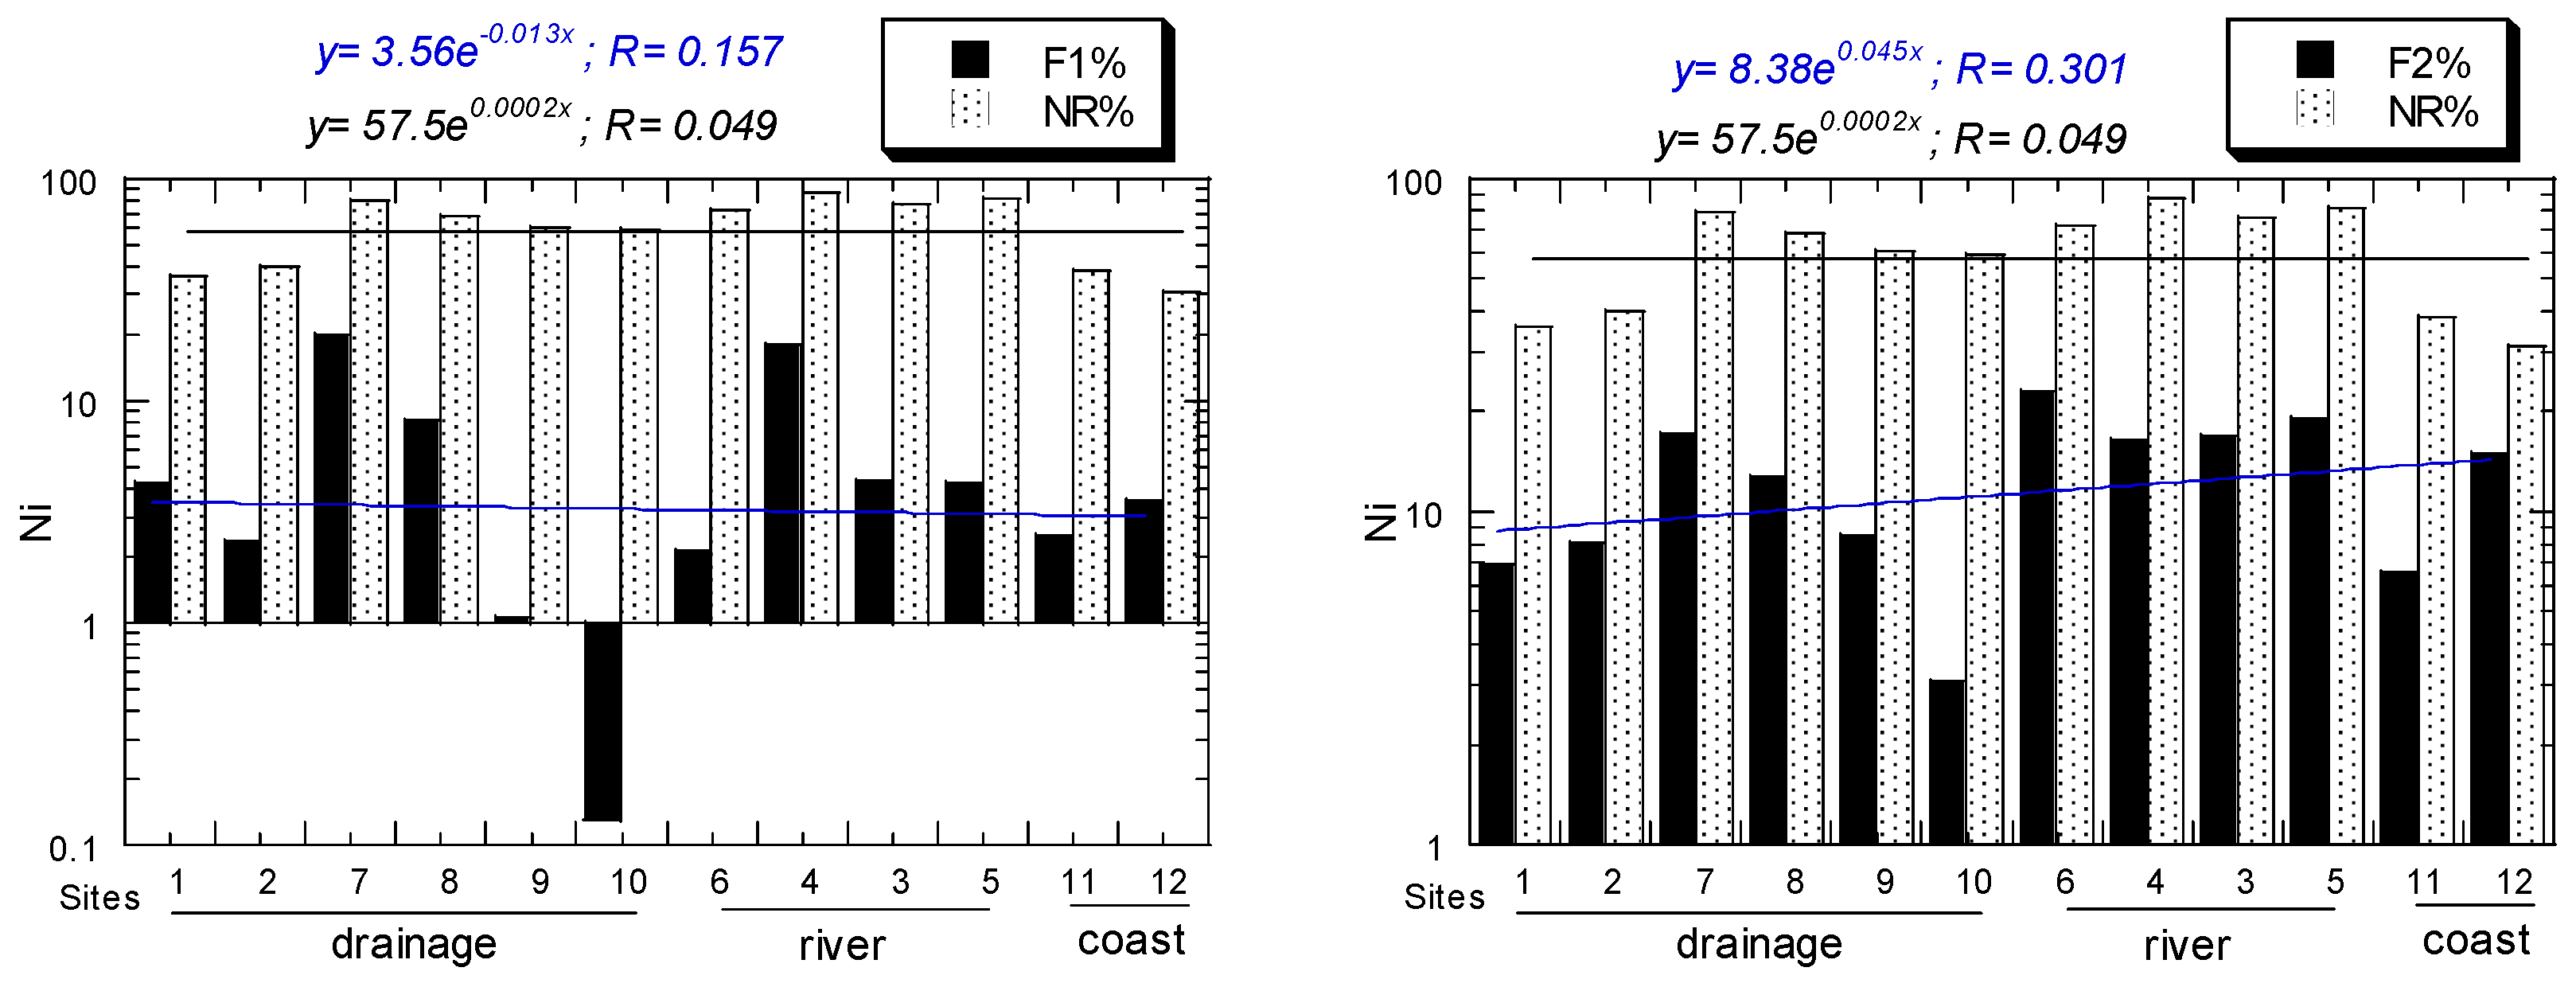
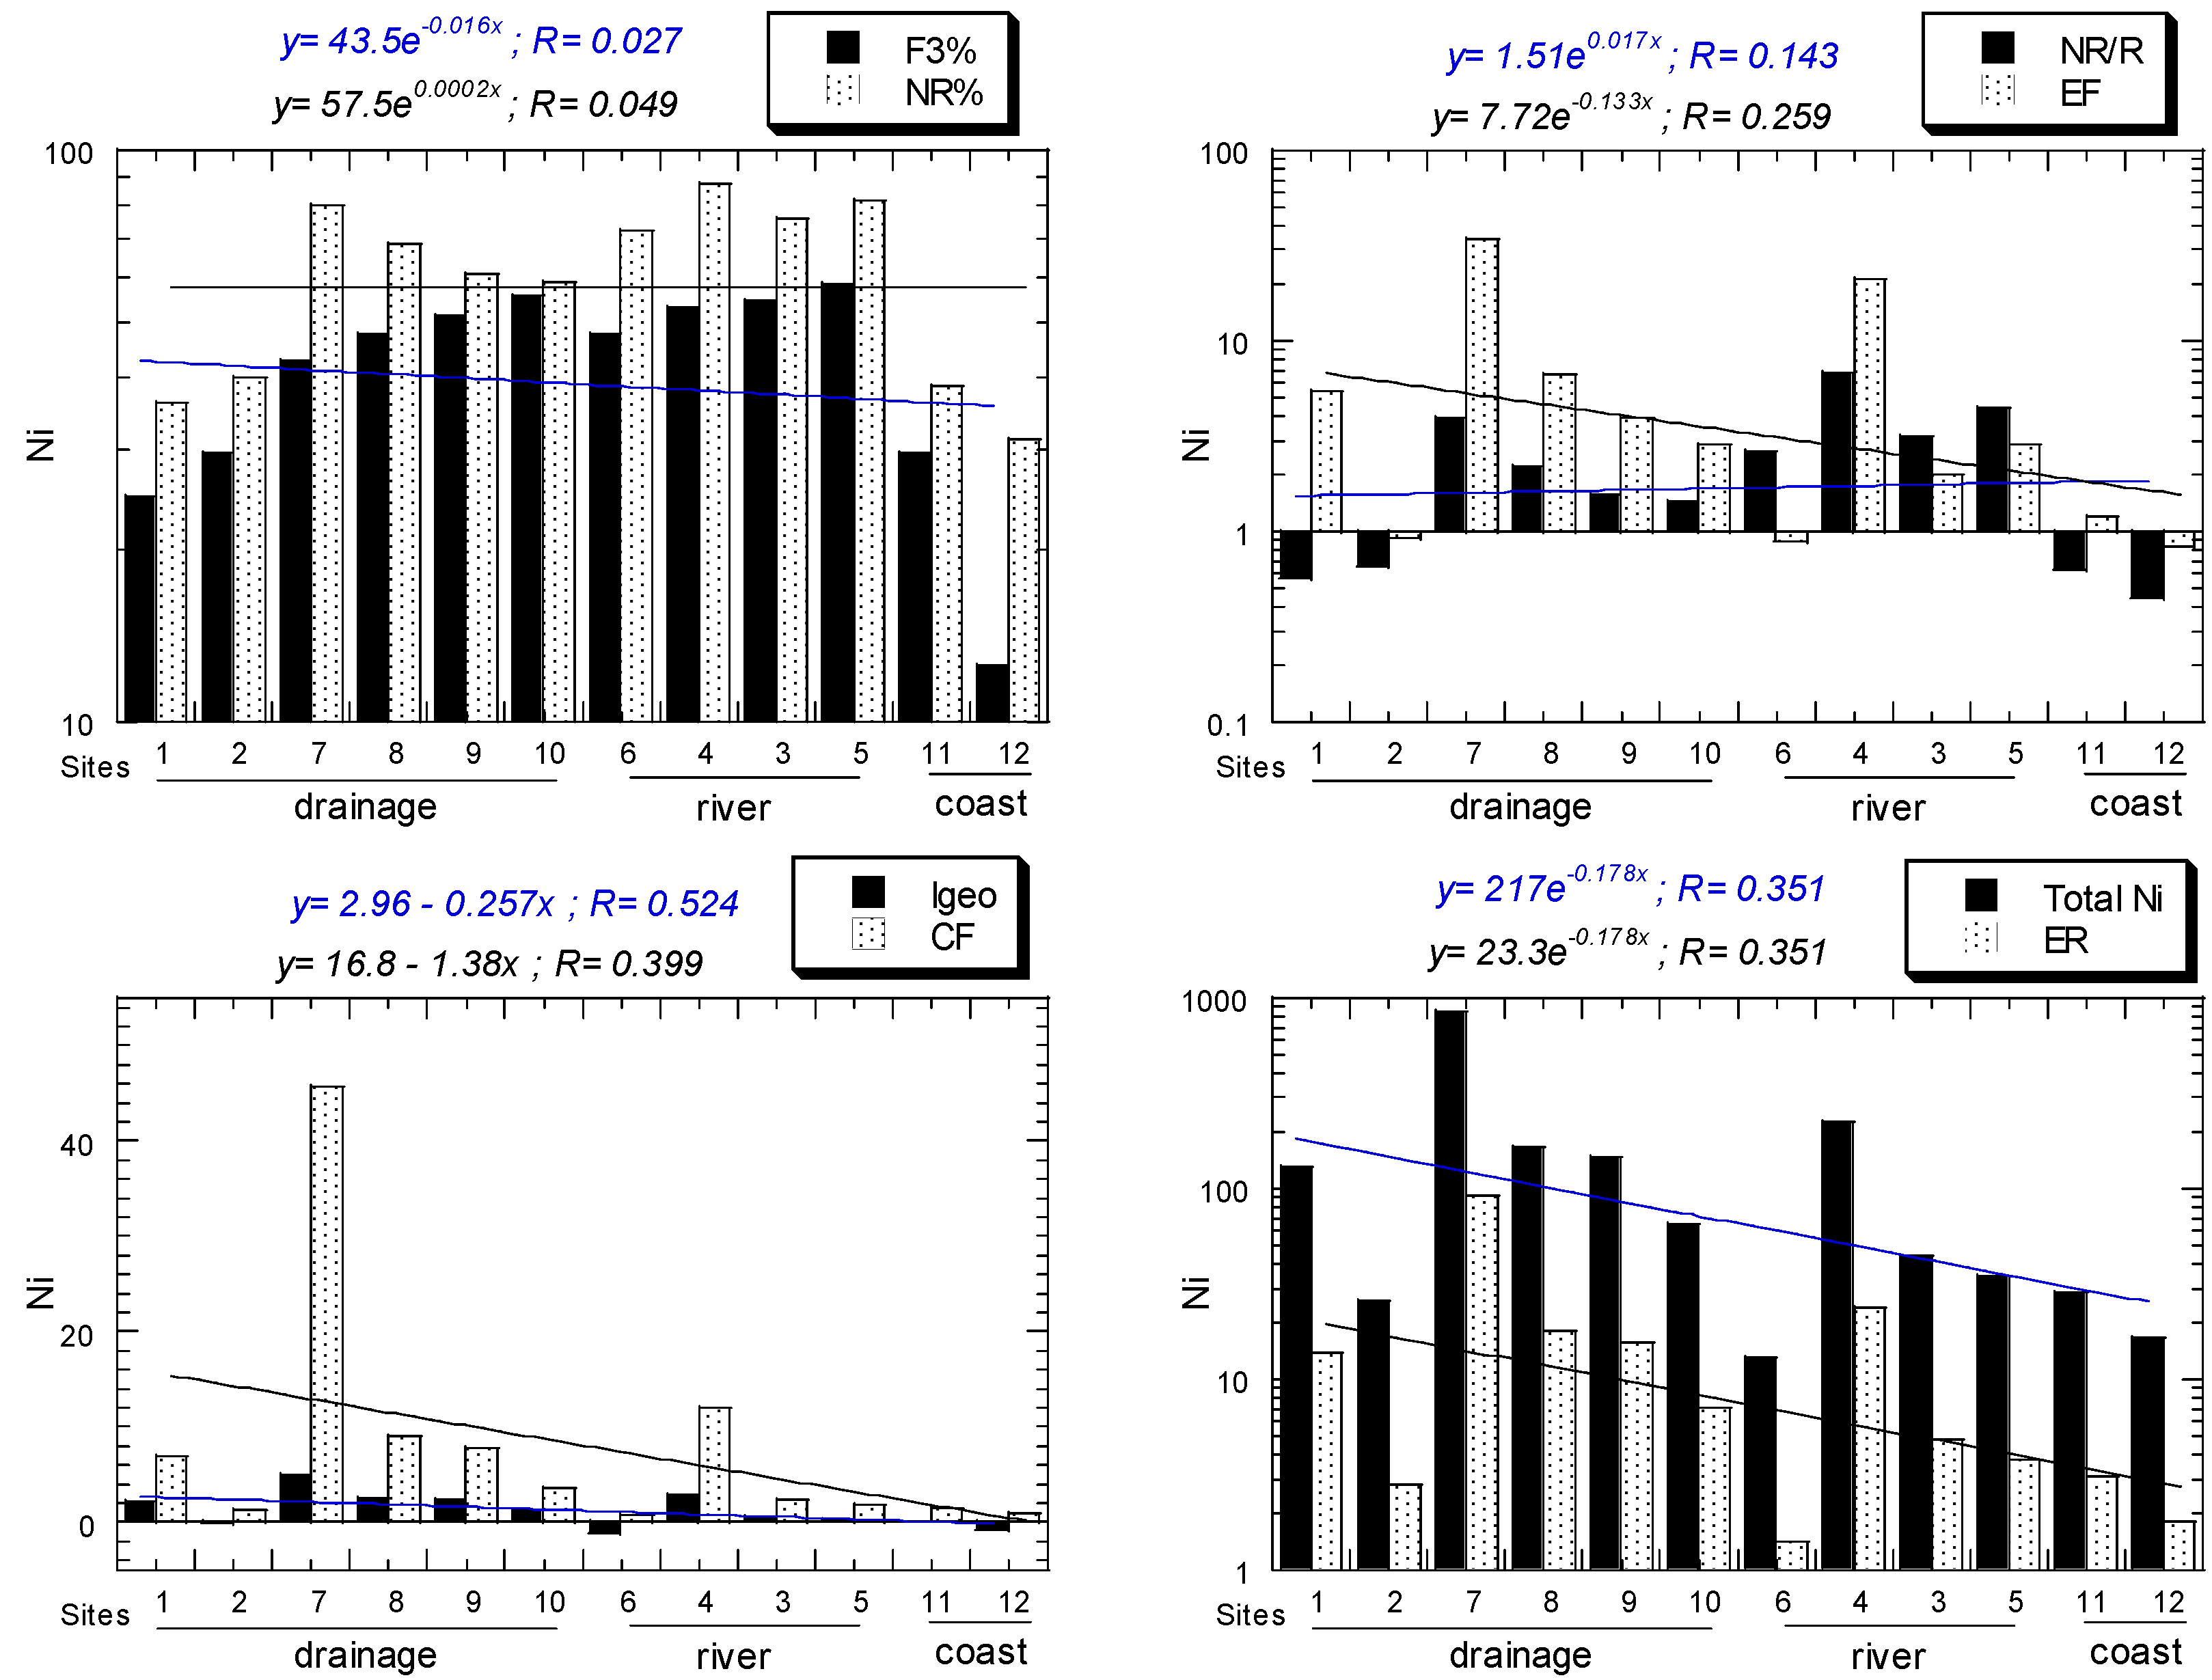
For Ni, all NR/R ratios of all sites ranged from 0.45 to 3.94. For Ni, all EF values of all sites ranged from 0.83, ”depletion of metal enrichment”, to 34.2, "very high enrichment". For Ni, all Igeo values of all sites ranged from −0.75, "practically unpolluted”, to 4.93, “strongly to very strongly polluted”. For Ni, all CF values of all sites ranged from 0.89, "low", to 45.70, "very high". For Ni, all ER values of all sites ranged from 1.79, "low potential ecological risk", to 91.4, "considerable potential ecological risk". All the above Ni values decreased from the drainage to river and coastal sediments (Figure 4).
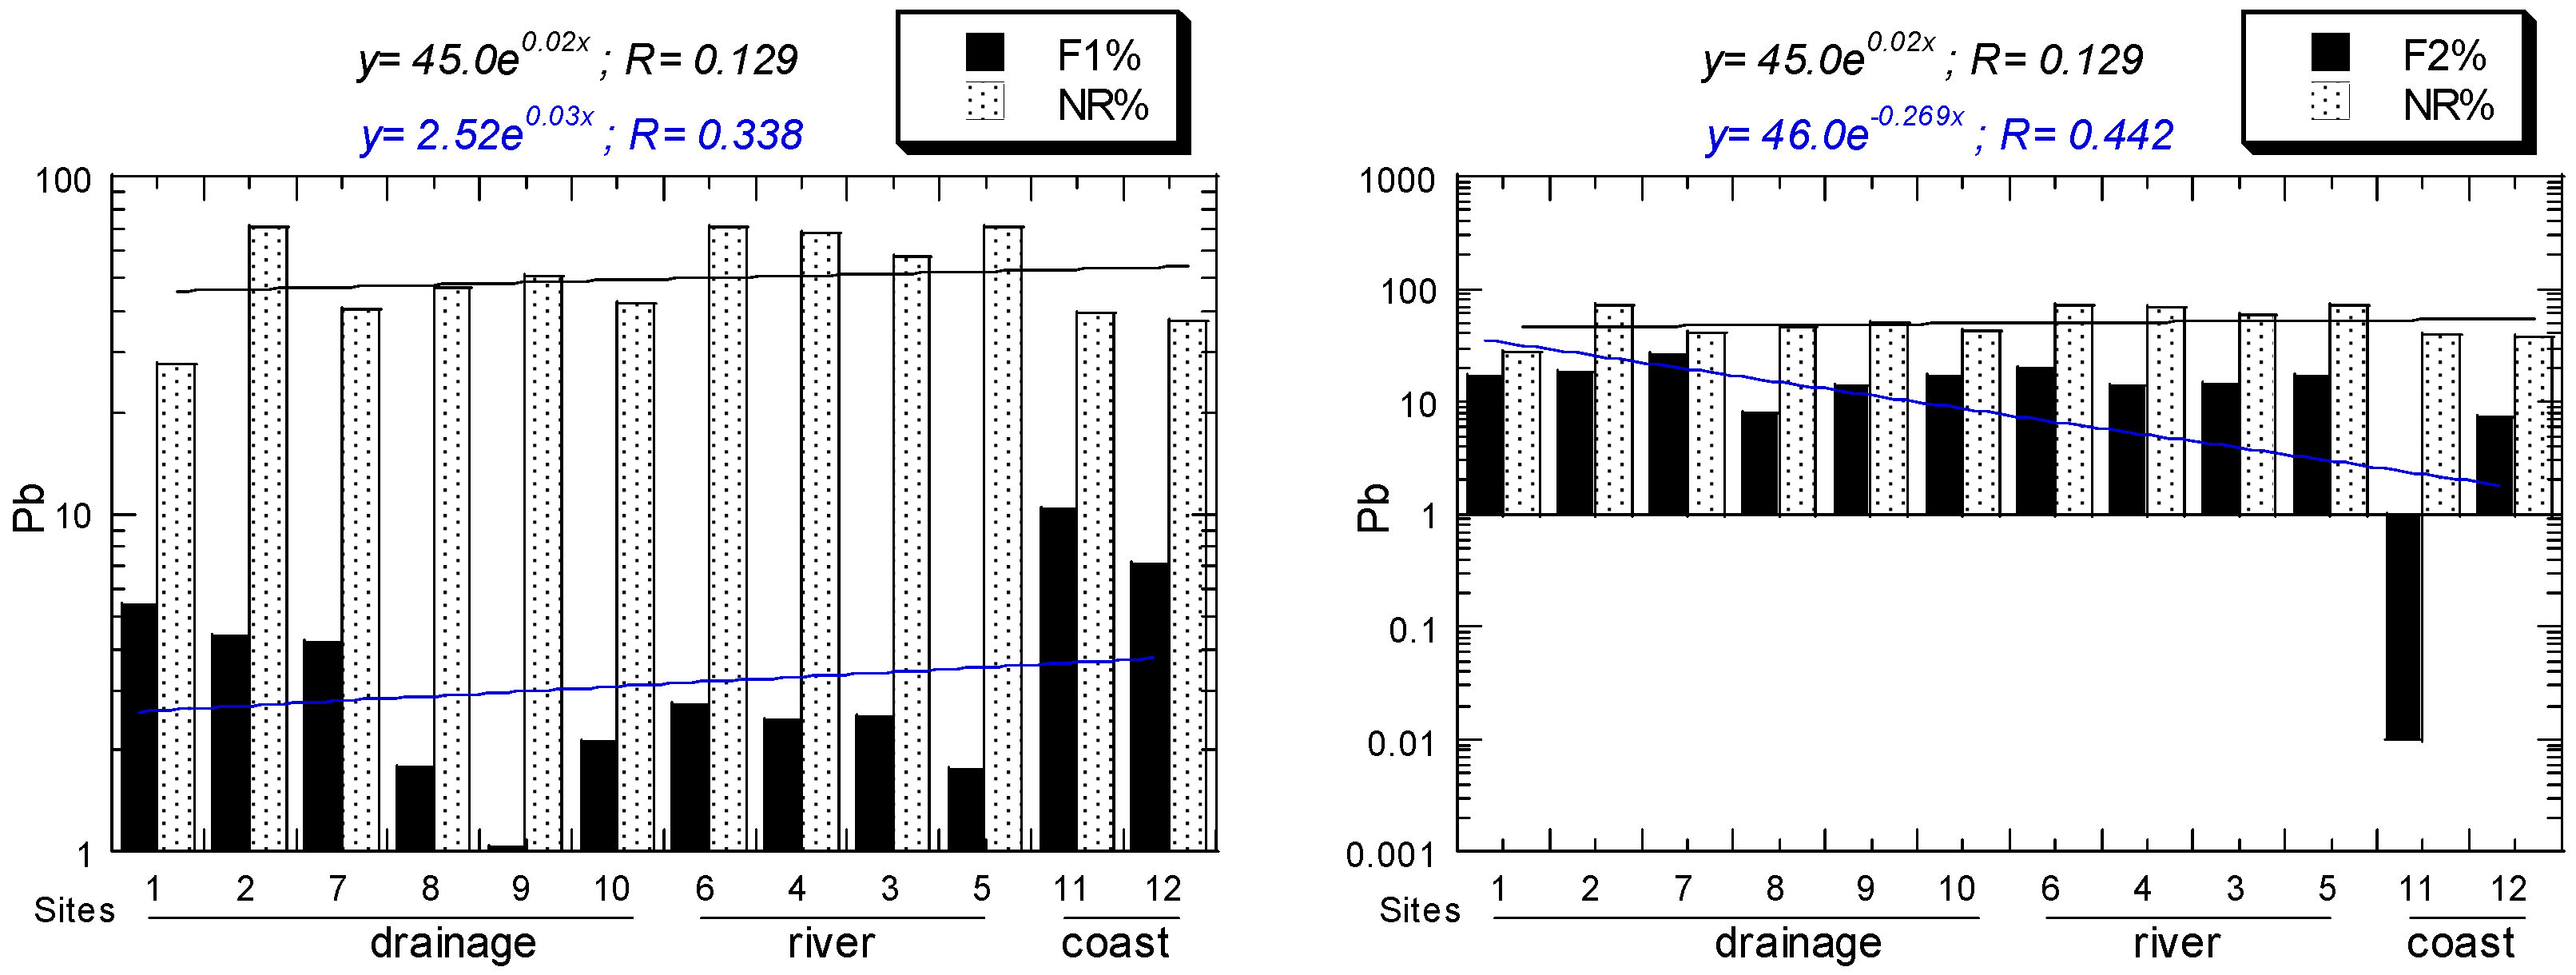
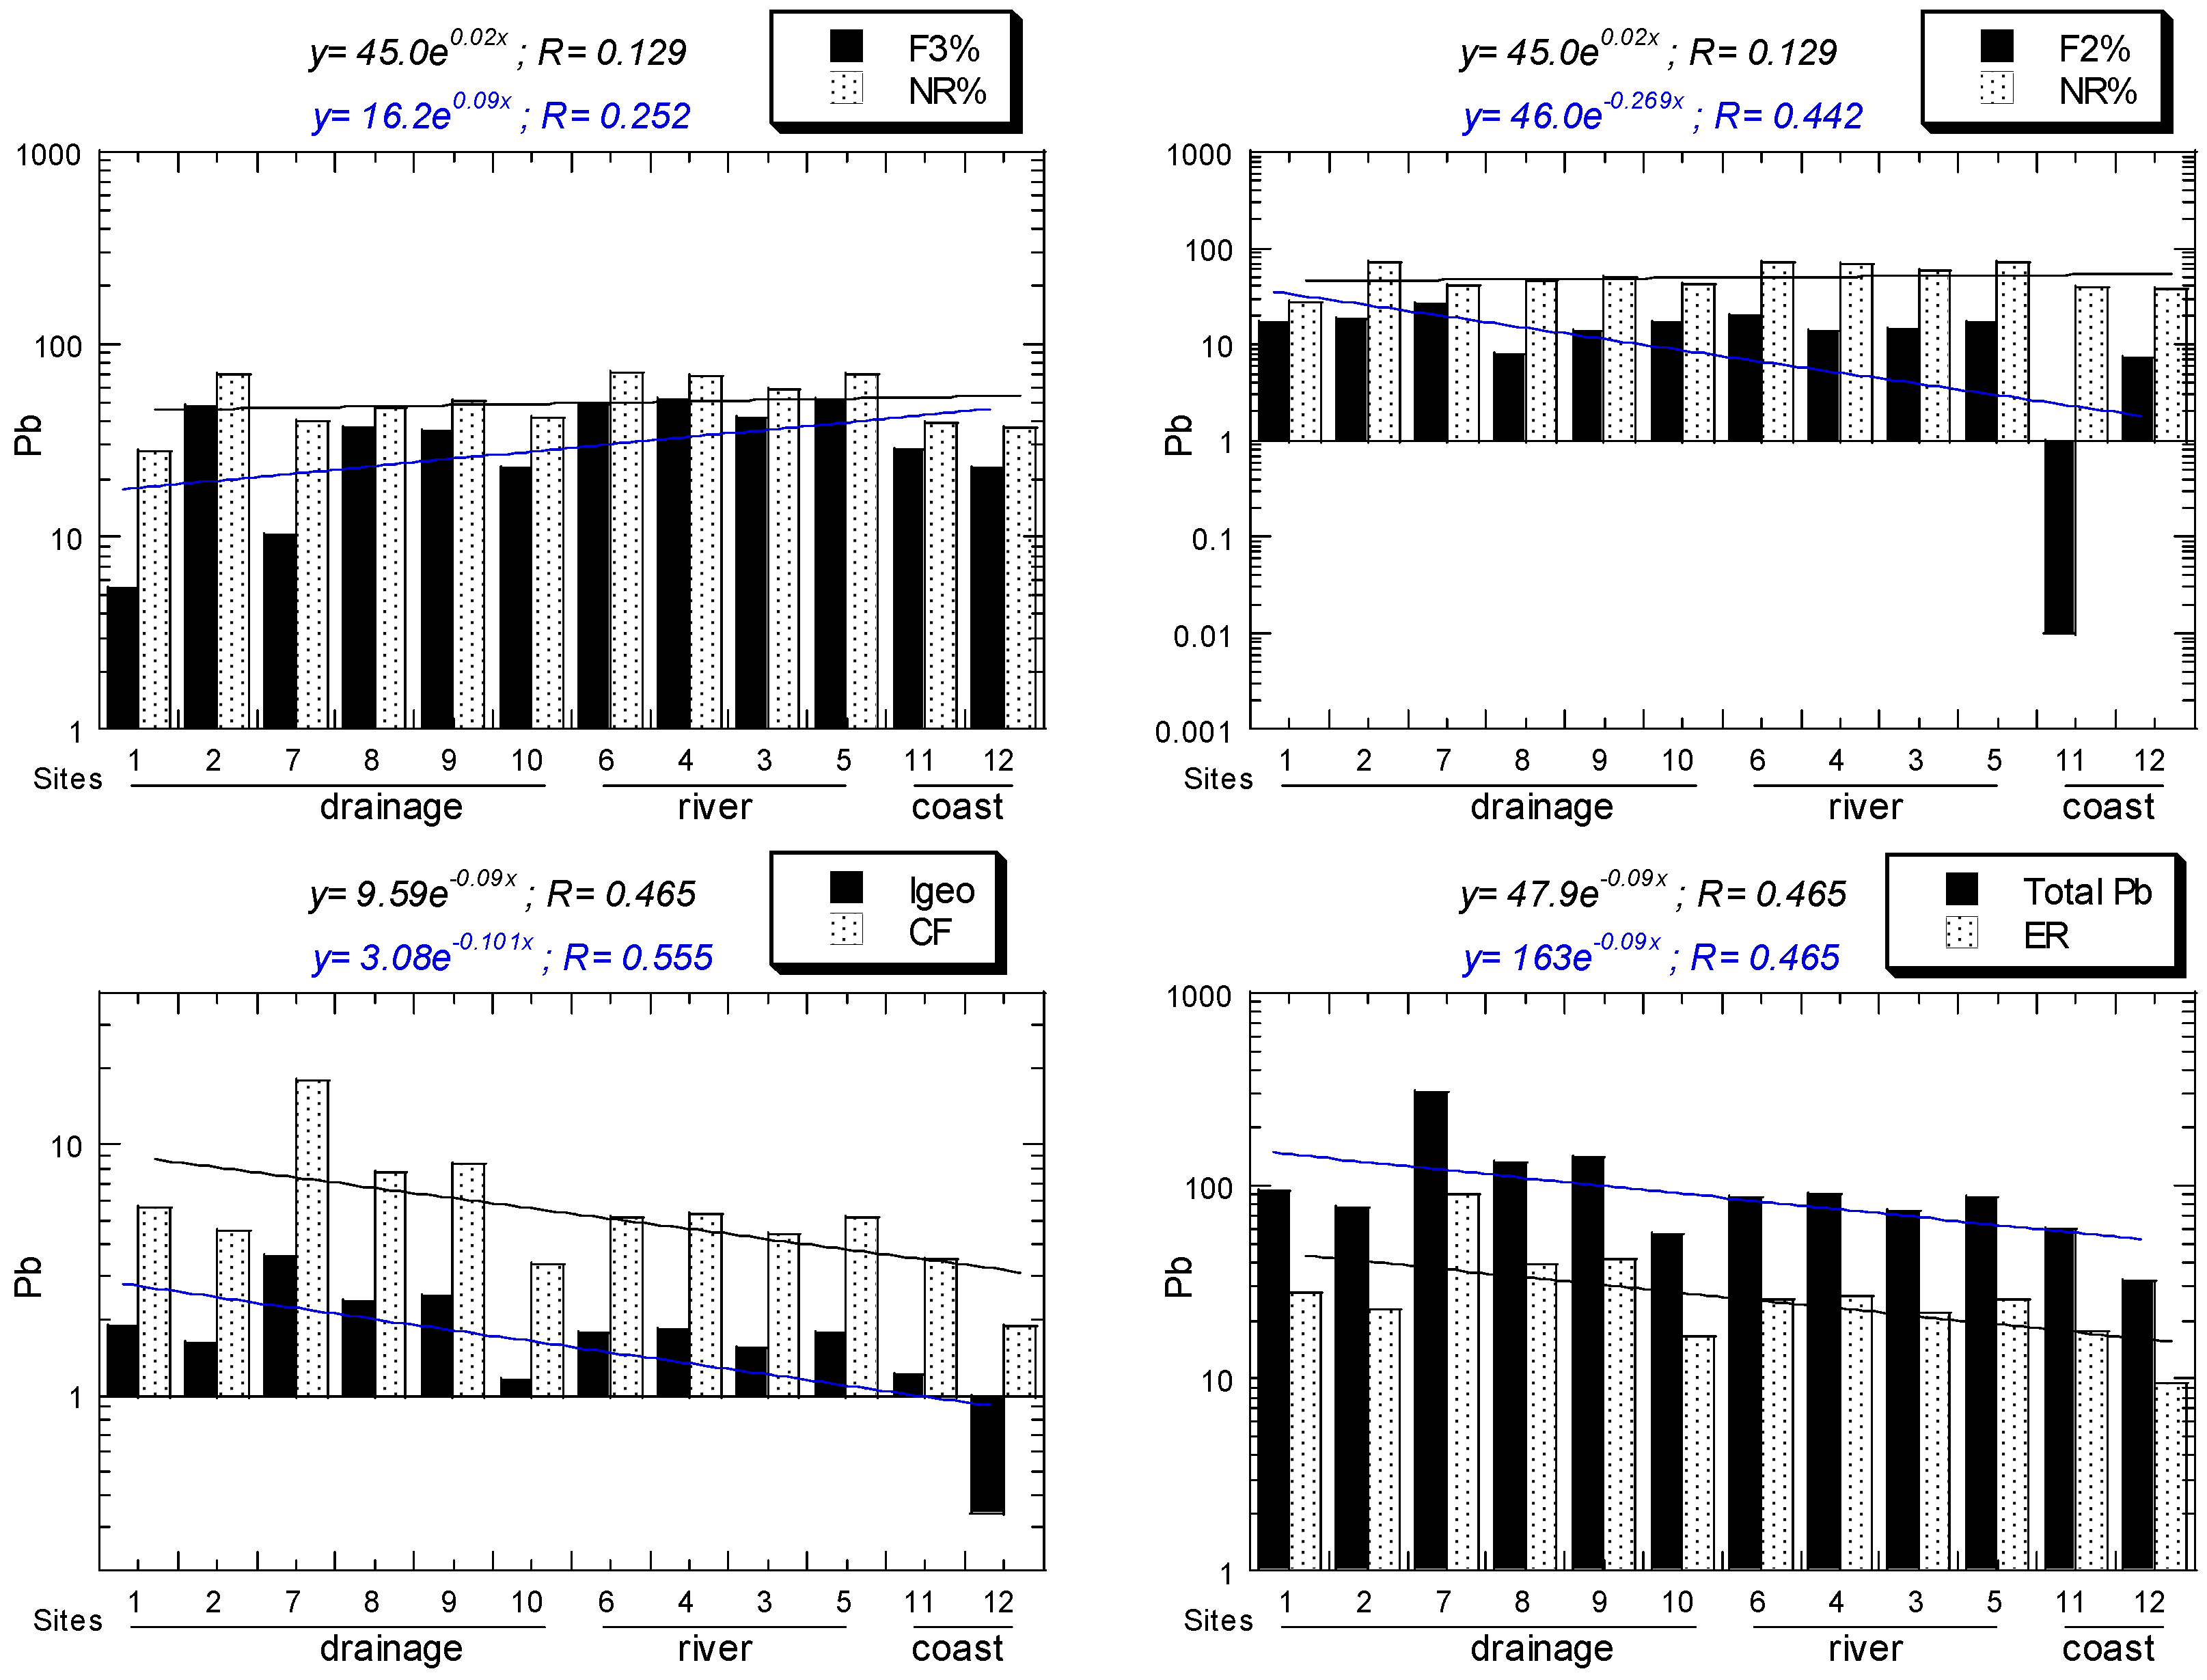
For Pb, all NR/R ratios of all sites ranged from 0.59 to 2.40. For Pb, all EF values of all sites ranged from 1.75, "depletion of metal enrichment", to 13.5, "significant enrichment". For Pb, all Igeo values of all sites ranged from 0.34, "practically unpolluted", to 3.59, "strongly polluted". For Pb, all CF values of all sites ranged from 1.90, "moderate", to 18.1, "very high". For Pb, all ER values of all sites ranged from 9.47, "low potential ecological risk", to 90.3, "considerable potential ecological risk". All the above Pb values decreased from the drainage to river and coastal sediments (Figure 5).
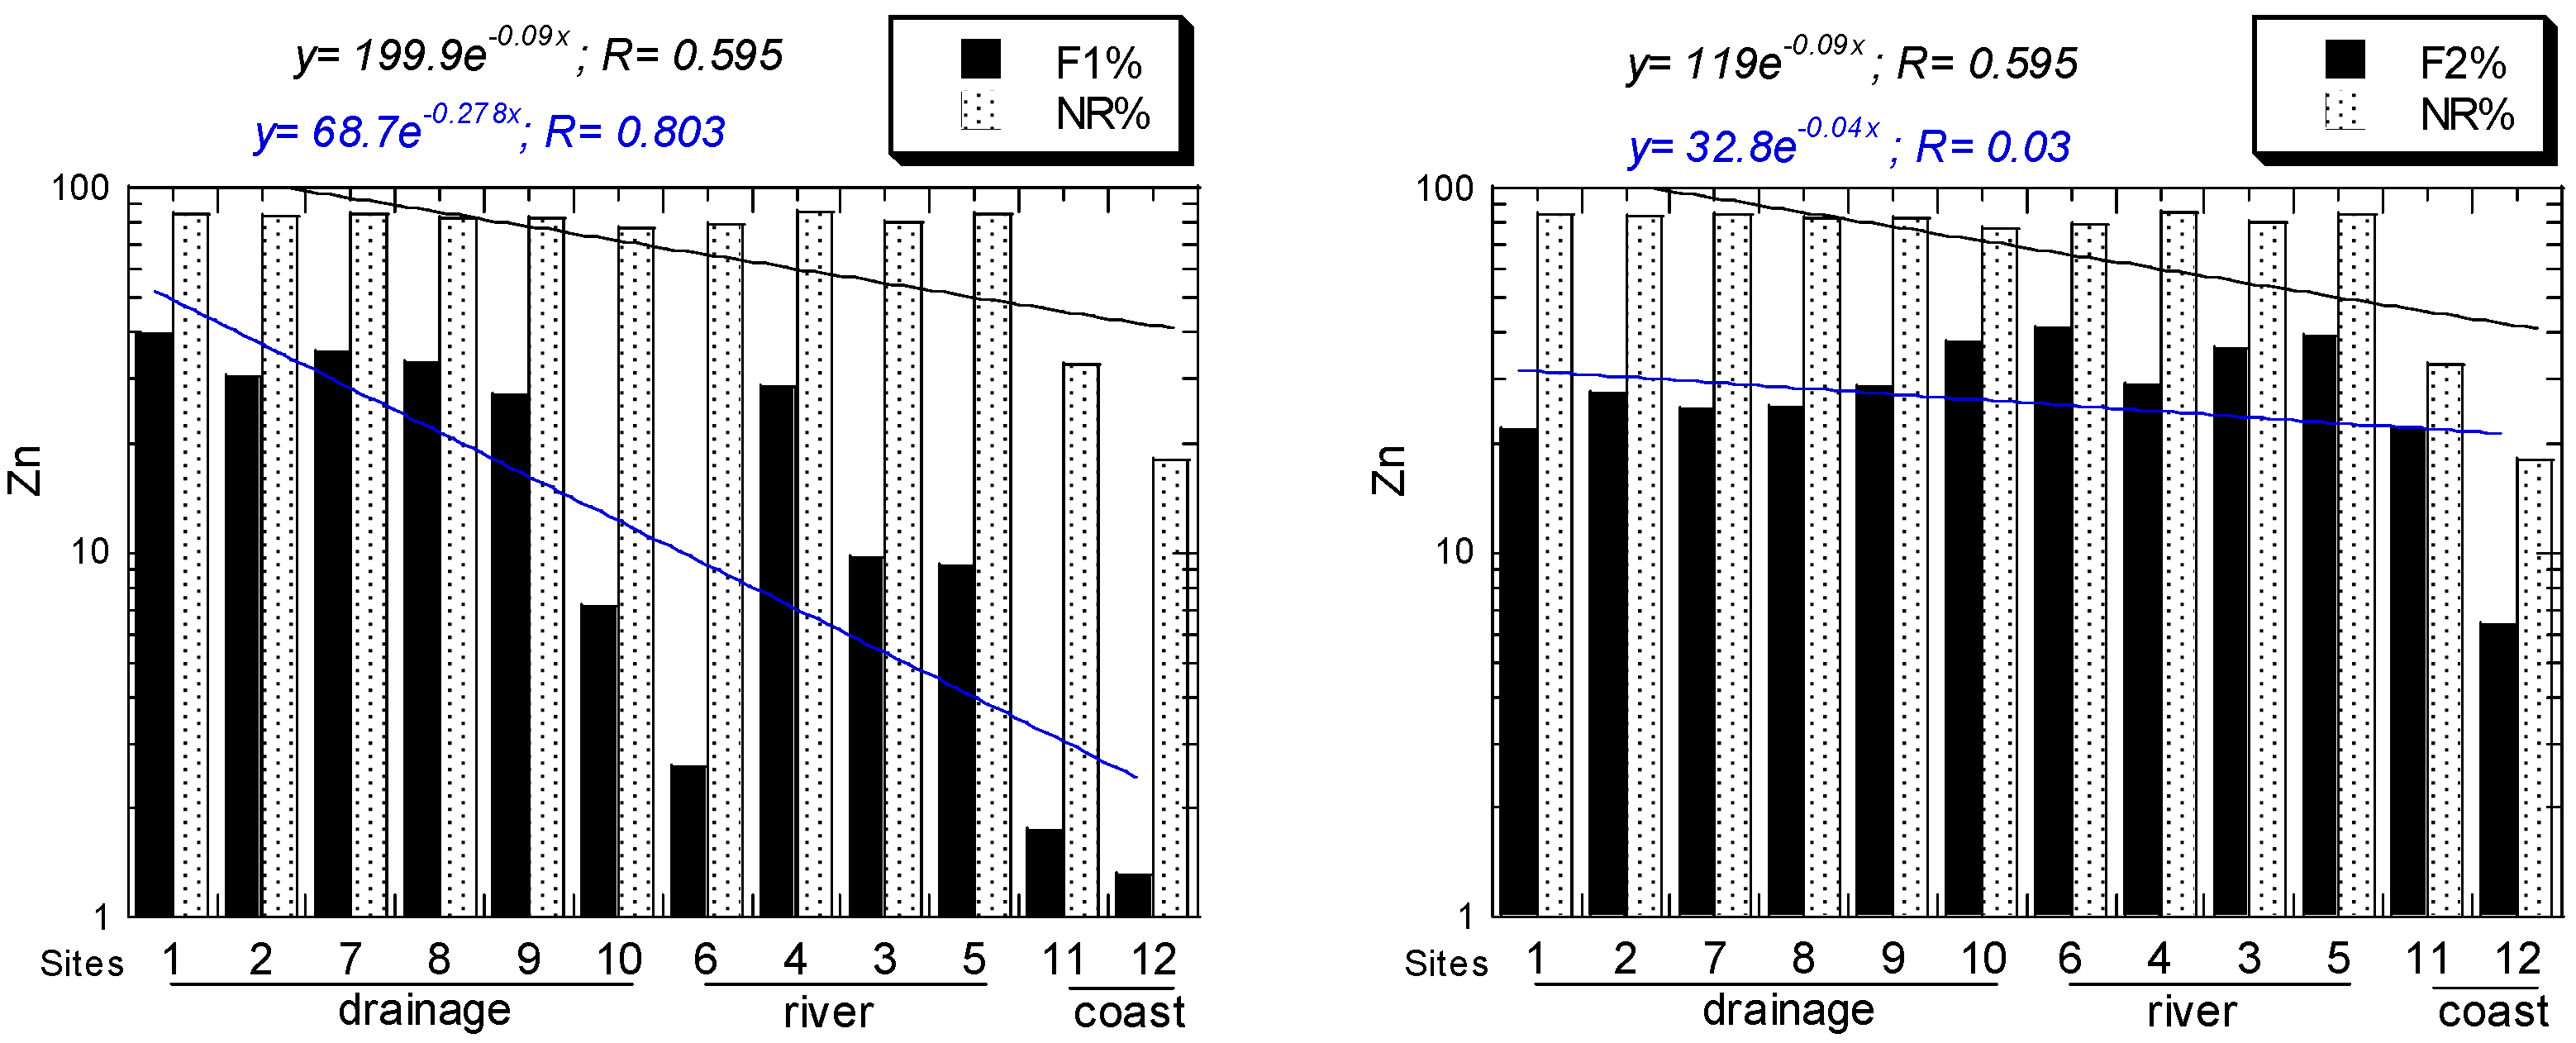
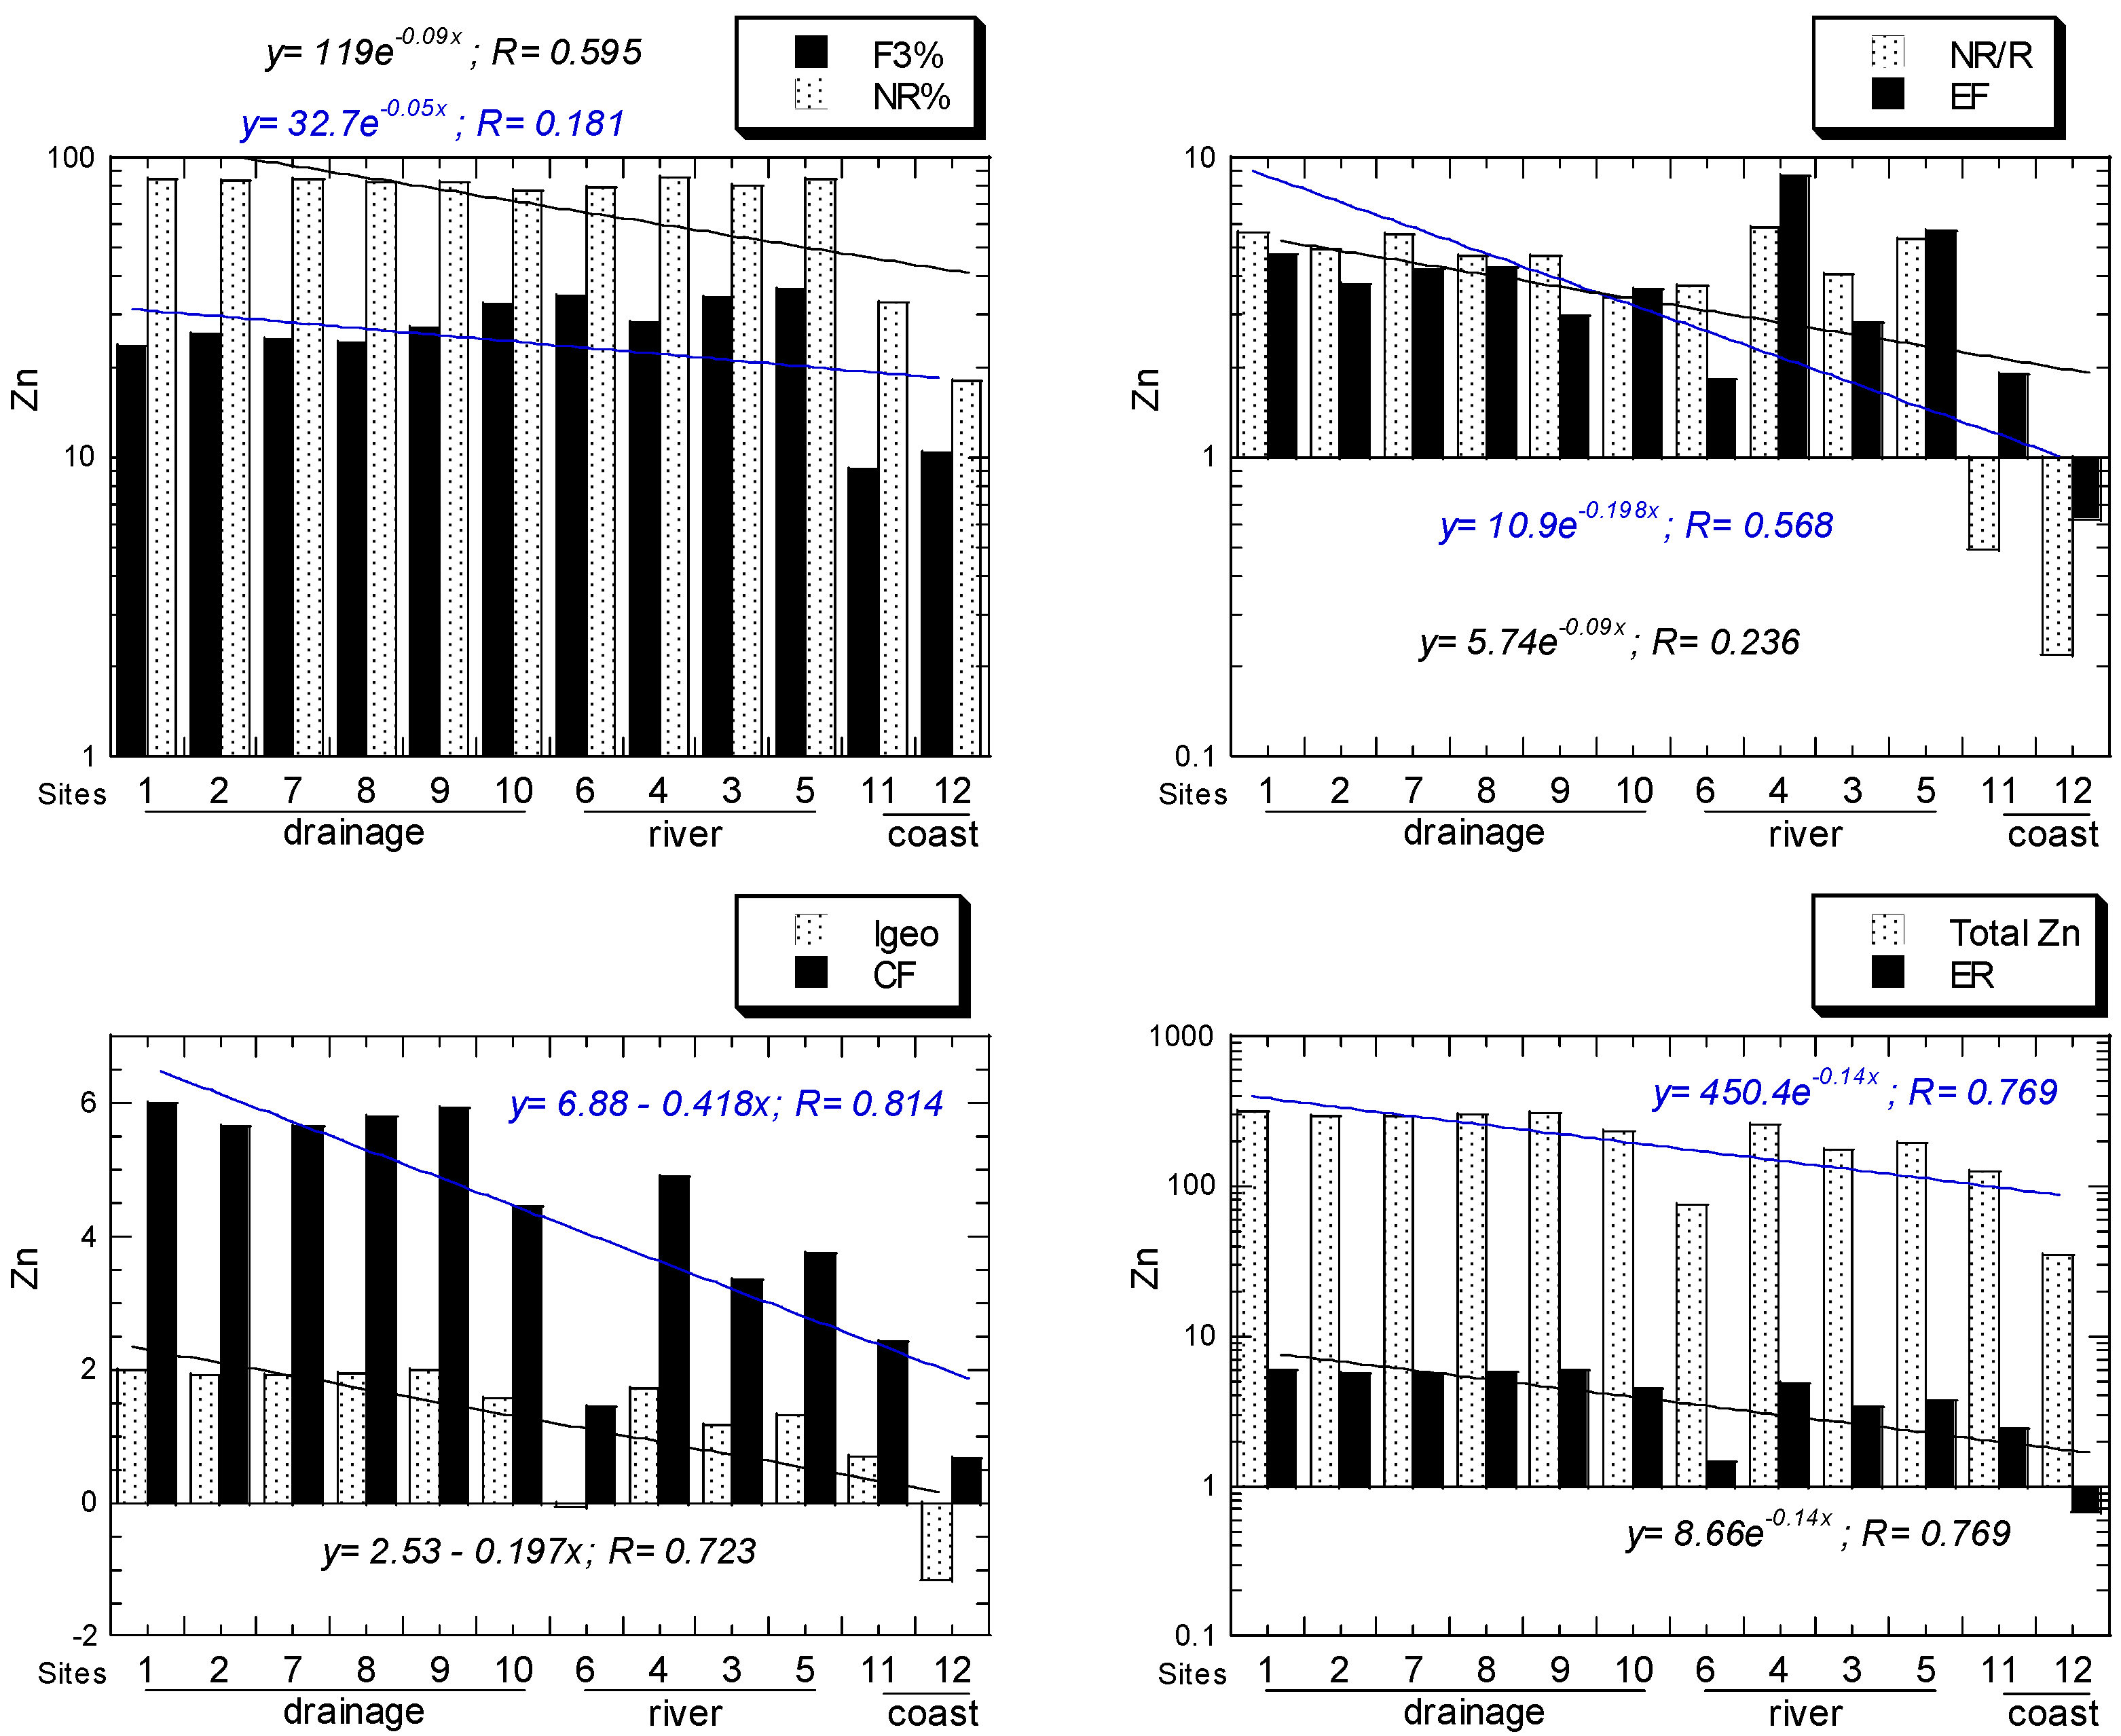
For Zn, all NR/R ratios of all sites ranged from 0.22 to 5.60. For Zn, all EF values of all sites ranged from 0.62, "depletion of metal enrichment", to 4.74, "moderate enrichment". For Zn, all Igeo values of all sites ranged from −1.16, "practically unpolluted", to 2.00, "moderately polluted to strongly polluted". For Zn, all CF values of all sites ranged from 0.67, "low", to 6.00, "very high". For Zn, all ER values of all sites ranged from 0.67 to 6.00, which both are under the category of "low potential ecological risk". All the above Zn values decreased from the drainage to river and coastal sediments (Figure 6).
However, no categories of pollution levels for NR/R ratios have been established. Overall, the ratios of NR/R had values higher than unitless, as indicated by pollution from anthropogenic sources [6] since the non-resistant portion of the sediments were likely to be related to anthropogenic inputs [23,24].
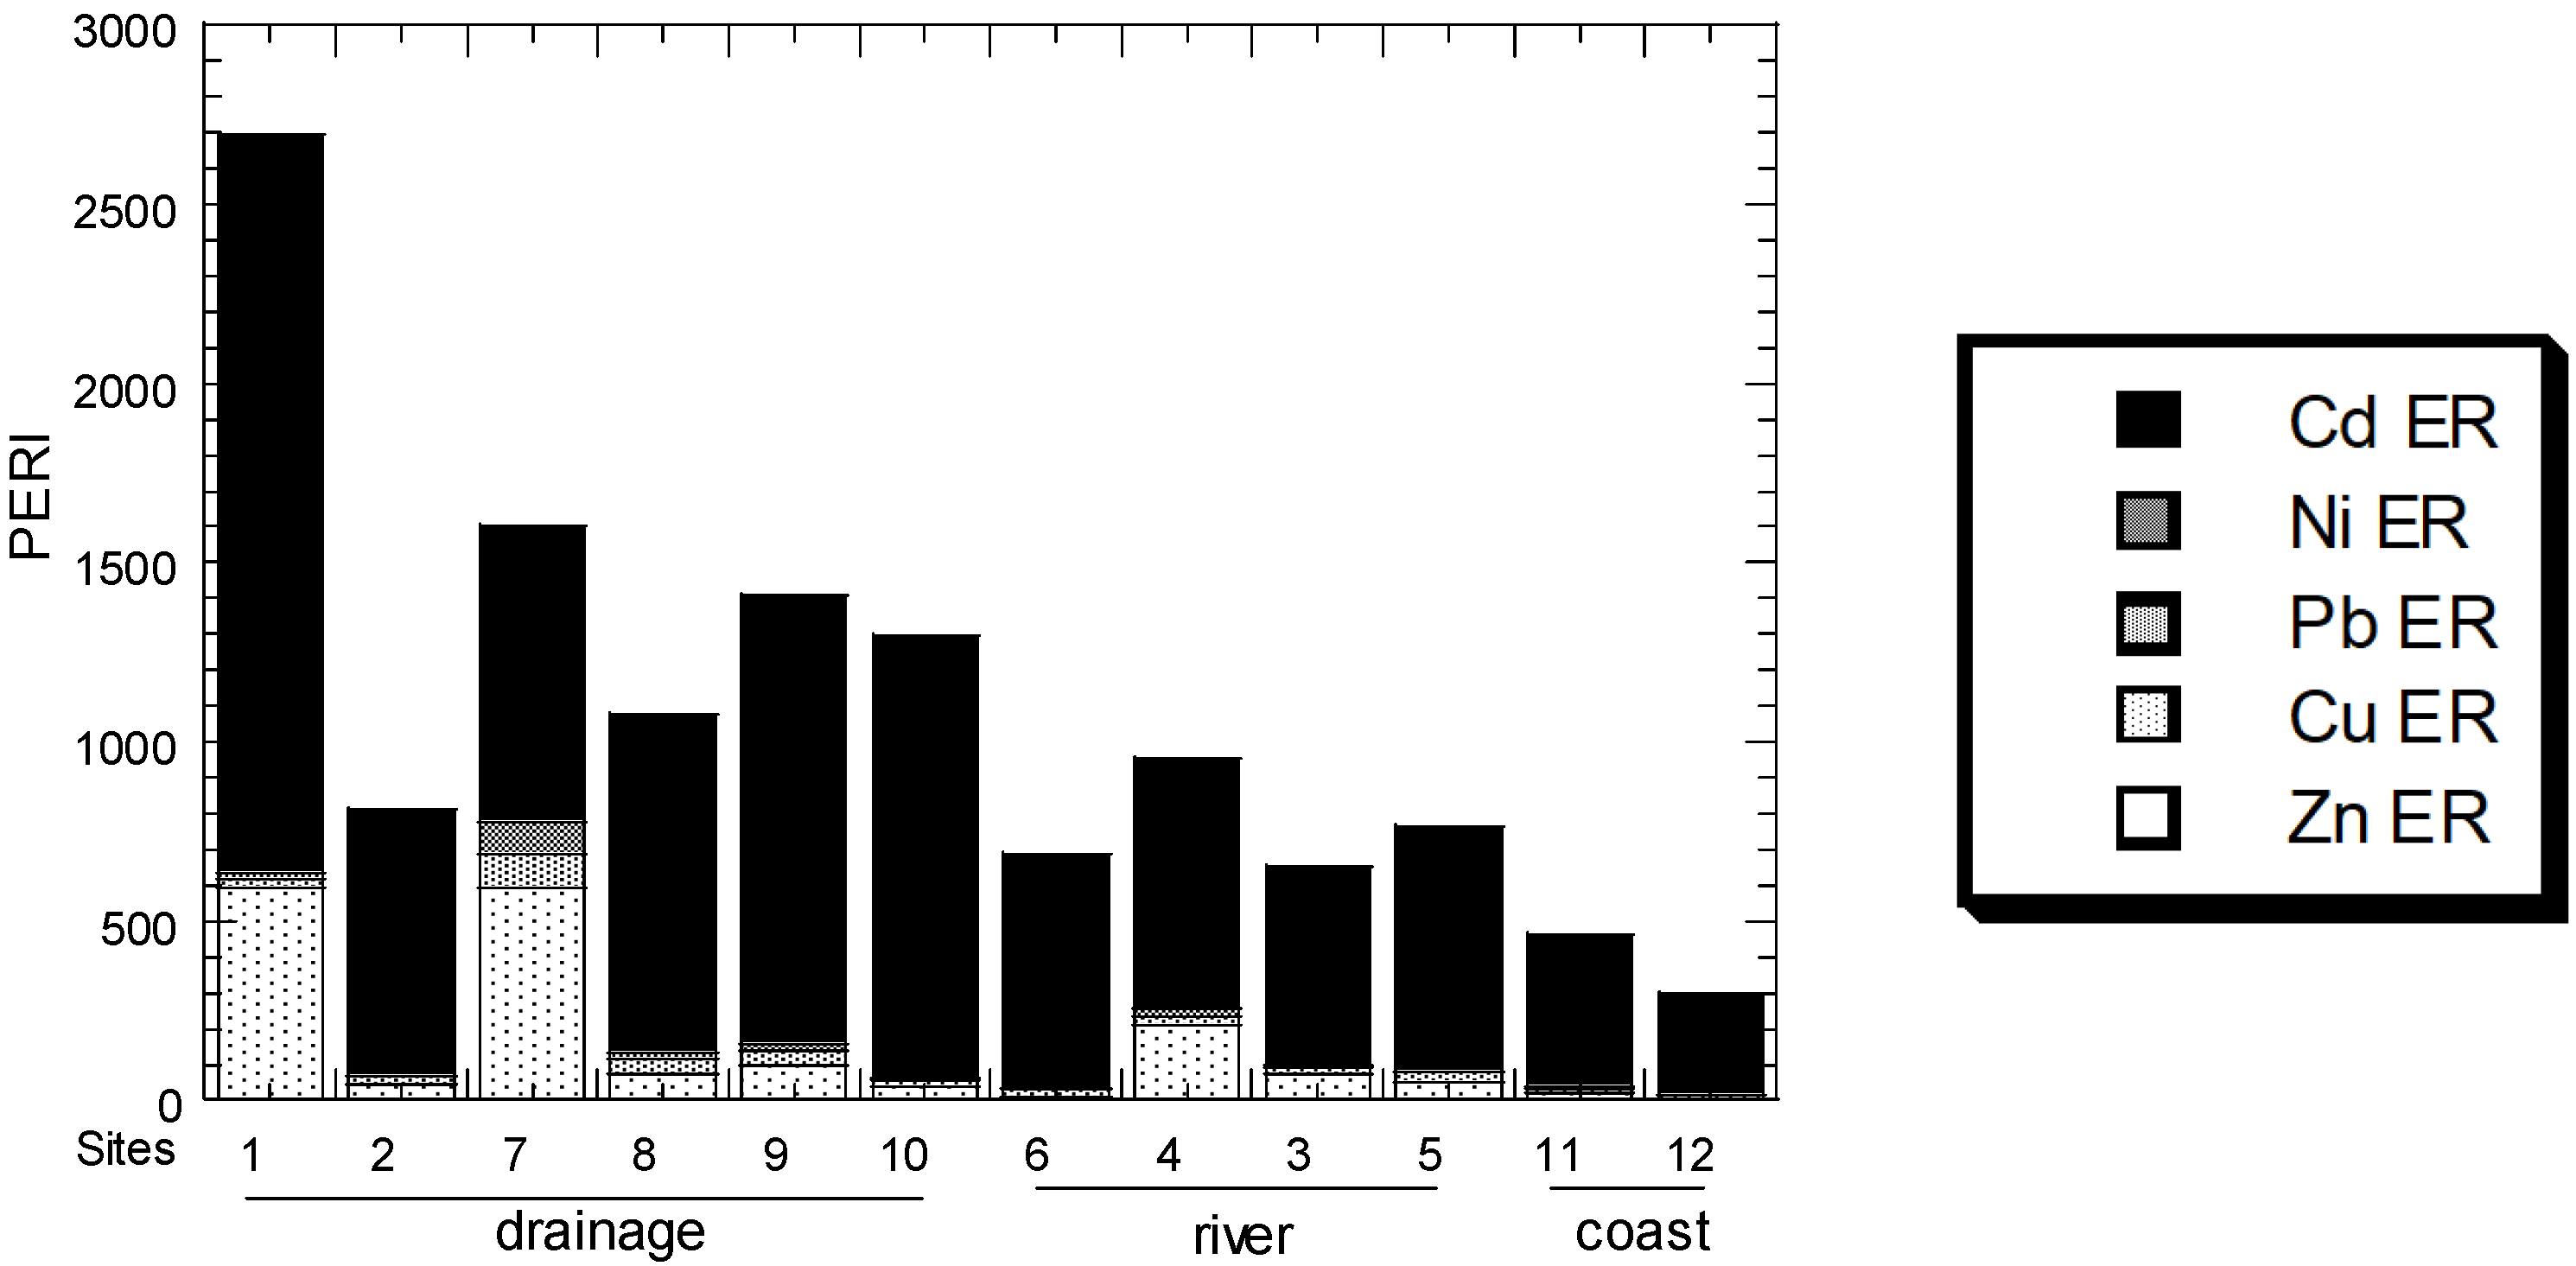
The comparison of PERI values in the drainages, river, and coast are presented in Figure 7. The PERI values ranged from 814 to 2695 (mean: 1482), 614 to 955 (mean: 764), and 298 to 465 (382), for the drainages, river, and coast, respectively. Overall, the PERI values were contributed to mainly by the ER of Cd. Therefore, the drainages and river were categorised as "very high ecological risk" (PERI ≥ 600), according to Hakanson [34]. This clearly showed that the major sources of anthropogenic inputs came from the two areas before being emptied into the coastal area.
3.3. Human Health Risk Assessment
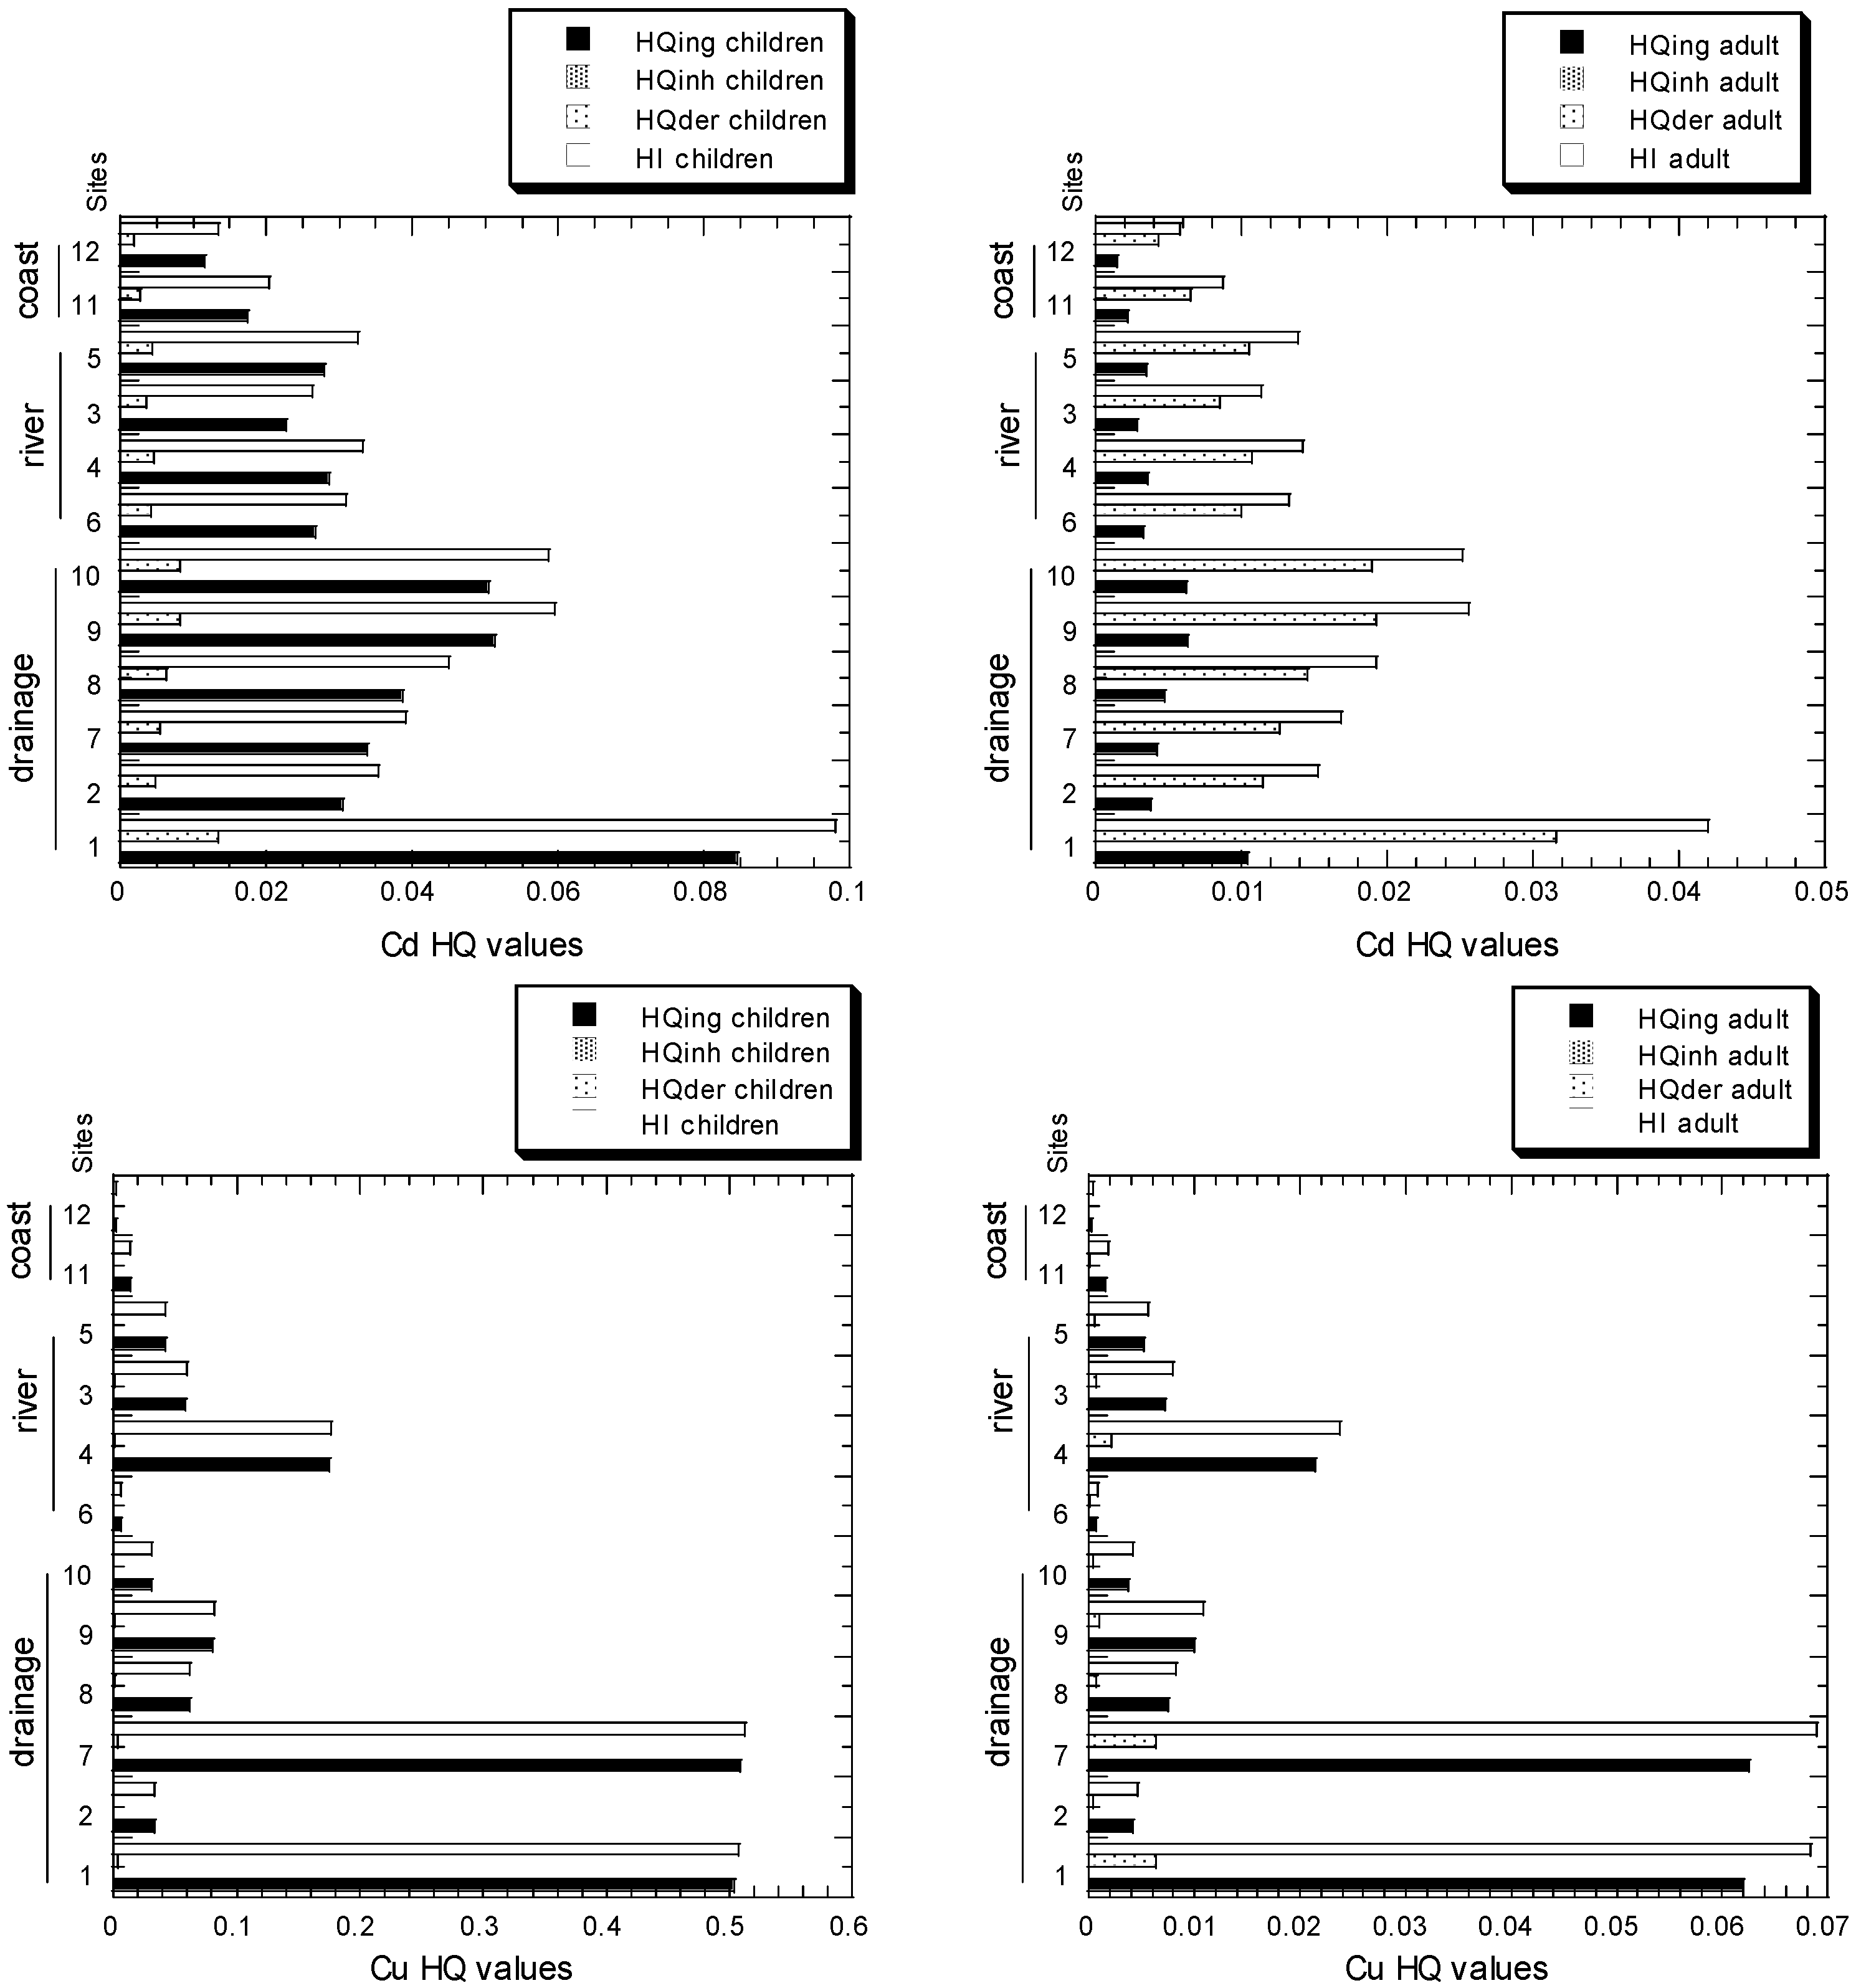
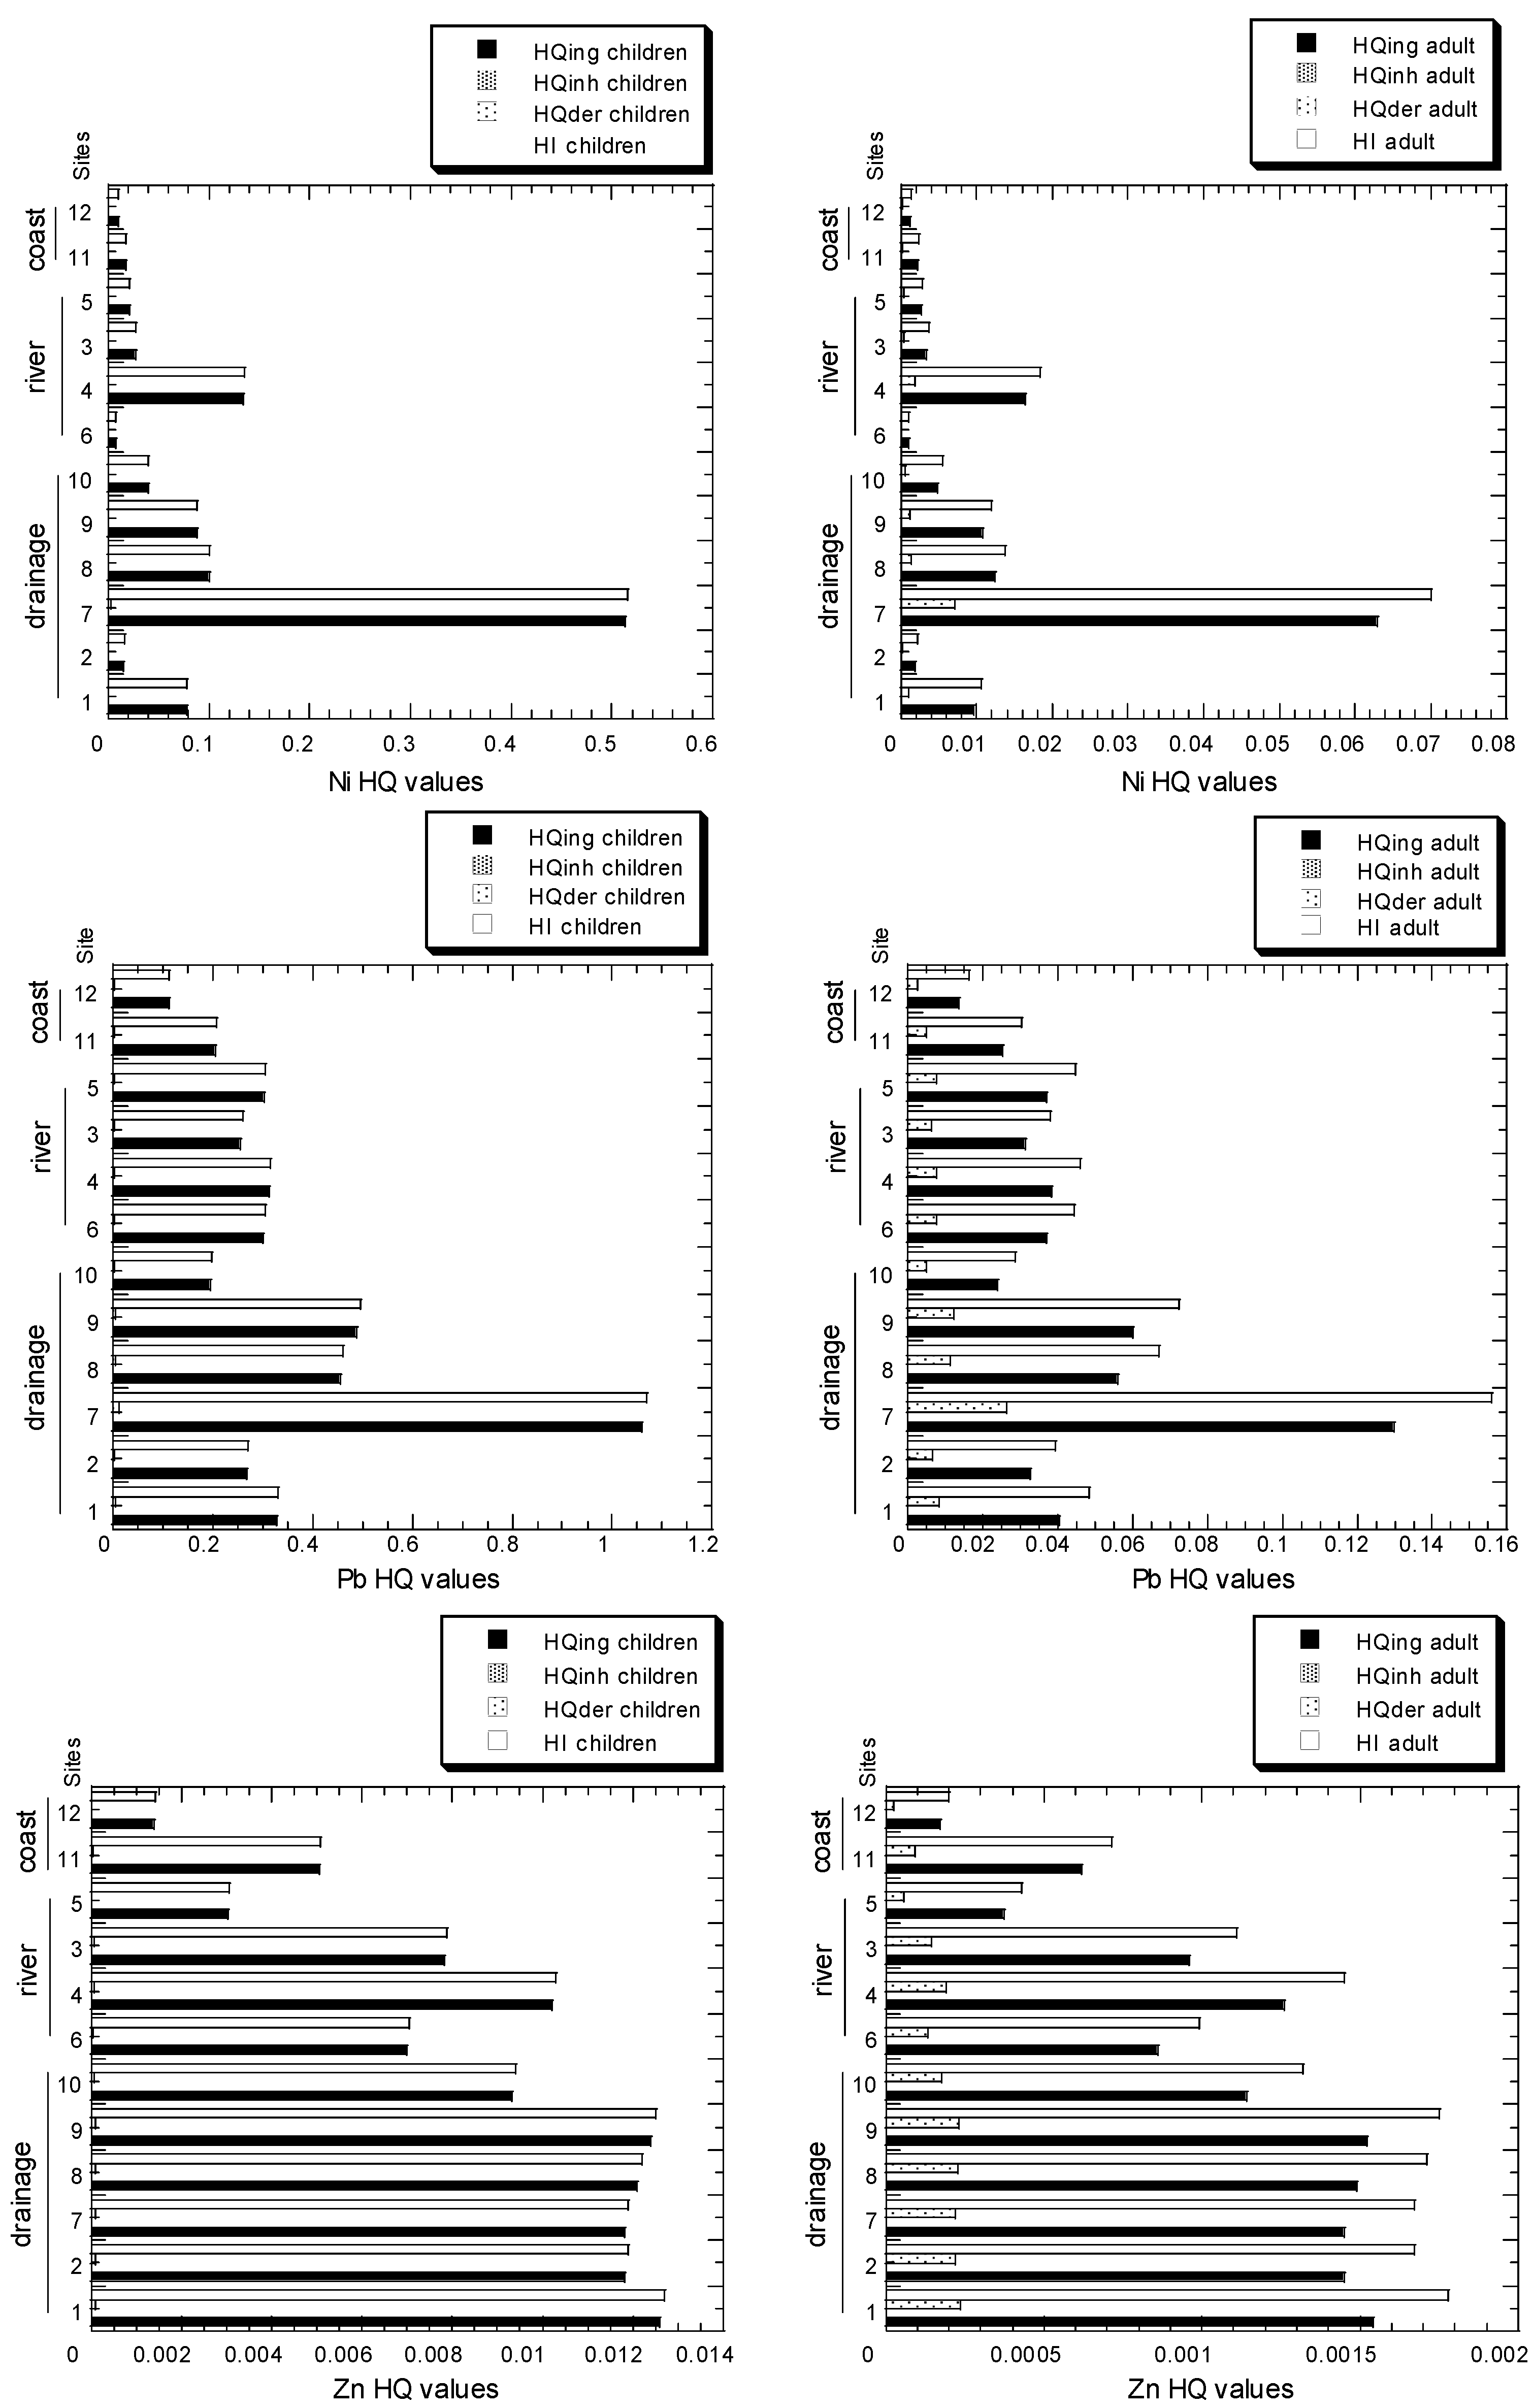
Figure 8 depicts the HHRA results owing to PTM exposures in sediments from the drainages, river, and coast in Malacca. The overall values of HQ and HI for the three exposure pathways of Cd, Ni, Cu, Pb, and Zn in children and adults divided by the three areas are presented in Table S4. Overall, five distinct patterns were identified.
Firstly, the HQ and HI values of the three pathways are greater in children than in adults. This is consistent with findings from various land uses in Peninsular Malaysia [4]. According to Yap et al. [4], the values of HQing and HQinh were greater in children than in adults, but the values of HQder were greater in adults than in children.
Secondly, the drainage sediments have the highest HQ and HI values, followed by river and coastal sediments. This is consistent with the highest metal levels and ecological risks found in drainage sediments, followed by the river and coastal sediments.
Thirdly, the HQ values for the various routes of exposure were as follows: ingestion > dermal contact > inhalation. This is consistent with findings from various land uses in Peninsular Malaysia [4]. It was determined that exposure to Cd, Cu, Ni, Pb, and Zn decreased in the following order for children and adults: ingestion > skin contact > inhalation. Gu et al. [20] observed that the percentage of the contribution of intake of HI levels varied between 77.9 and 99.1% for children and between 71.0 and 98.7% for adults.
Fourthly, one drainage location showed an HQing value for children that exceeded 1.0. At one site with drainage sediments, the HI for Pb in children surpassed 1, indicating a non-carcinogenic danger for children, which is of public concern. Yap et al. [4] observed that a landfill could pose a non-carcinogenic health risk (HI > 1 for Pb). Comparing the HI values of children and adults revealed that children had a greater risk of NCR from PTMs in drainage and river sediments than adults. Pica and thumb or finger licking were similarly associated with a larger NCR in children compared to adults [46,47]. At this drainage sediment site, children were exposed to an unhealthy, non-carcinogenic Pb risk (HI > 1). Due to the risks, it is not advised that children play in that area.
Fifthly, Cd was the metal that contributed the most to the HHR. This is consistent with the PERI values that were contributed to mainly by the ER of Cd. Identical findings were also reported for various land uses in Peninsular Malaysia [4], and Zhao et al. [46] found that the geographical pattern of the HQs in the soils near Dabaoshan Mine suggested that Cd was the most important PTM contributing to the HHR.
The children were at a greater risk of having unfavourable health effects due to the influence of the contaminants. The findings indicated that dermal absorption of contaminants was the greatest risk factor for the child population. The increase in NCR risk was proportionate to the amount of human skin exposed to the environment. Children, on the other hand, are more likely to be exposed to pollution due to their behaviours and physiologies [47]. They display increased hand-to-mouth activity, respiration rates, and gastrointestinal absorption of some PTMs.
The present studies revealed that PTMs gradually decreased in the drainages, followed by river and coastal areas. The highest PTM levels were discovered around drainage sites near Malacca’s industrial region. This finding improved our knowledge of PTM pollution in sediments collected from the drainages and the Malacca River, which could impact the ecosystem and human health in Peninsular Malaysia [5]. Furthermore, the present ecological indices (EF, Igeo, CF, and ER) were crucial in the integrated pollution and ecological risk assessments. These assessments could provide an empirical basis for long-term planning and comprehensive adaptive management strategies [5] for the Malacca River.
3.4. Possibility of Potentially Toxic Metal Transfer to Residential Area during Floods
The present study on the ecological health risk assessments of PTMs was partially prompted by the considerable chance of water from drainages and river overflow during flash floods. In Malaysia, flooding arises due to widespread, extended severe rainfall, resulting in a massive concentration of runoff which is very much in excess of the functional capacity of rivers. Extensive places are typically inundated. In particular, the floods of December 2021 in Malaysia were caused by massive volumes of rainfall that left districts on the west coast of Peninsular Malaysia under nearly four metres of water and changed highways into rivers [48]. During flooding, the overflow of water from the drainages and river floods the residential area, which could take along the contaminated sedimentary particles. Hence, remobilisation of PTMs is highly predicted [49].
The occurrence of floodplain (or alluvial; silt or gravel carried by rushing rivers and deposited as the river slows down) sediments during a flash flood is a prominent factor of drainage sediments, which were evaluated for their ecological health concerns of containing PTMs in this study. According to Aslan [50], floodplain sediments hold abundant evidence of geologic events and continental habitats from the past and present. PTMs deposited in floodplains and riverbeds can be remobilised and become secondary sources of diffuse contamination of PTMs [51] during flooding. Sediments could bind PTMs, and hence, there is high potential for accumulation of PTMs in floodplains [52]. The PTMs are only carried from a canal to the surface of the floodplain when the water table exceeds the river carrying capacity. Since at least 90% of metal burden can be connected with sediment particles, the pathways of metals to the floodplain are comparable to those of suspended sediments [53], although it is believed that dissolved PTMs have a minor role in the transmission of metals to the floodplain [54]. The effect of floods on the transport of contaminated sediments within a river system is generally proportional to their magnitude [49].
Numerous research on the PTMs in floodplain sediments has been published in the scientific literature. Narayan et al. [55] investigated the concentrations of PTMs in the sediments of polluted and unpolluted lagoons in the Orinoco River floodplain. They found that the sediments dwelling in the riverbed were remobilised, together with the PTMs, into the floodplain-inundating river flows. Liang et al. [56] reported that the Cu levels in floodplain soils ranged from 211 to 656 mg/kg in the upper reaches of the Le’an River. Owca et al. [57] analysed the surface sediment samples from 61 previously flooded lakes in the Peace–Athabasca Delta (PAD) (northern Alberta, Canada) and found no evidence of a significant enrichment of silt supplied by the Athabasca River to lakes in the PAD with PTMs coming from oil sands.
Garvin et al. [58] evaluated the Cd, Pb, and Zn contents of streambed sediment from the Tri-State Mining District (TSMD) and floodplain soil from the Grand Lake watershed. They found that metal concentrations in streambed sediments and floodplain soils were much greater downstream of major mining effects compared to upstream reference locations, and that mining releases from the TSMD were the source of PTM contamination in these media. The distribution of PTMs in alluvial sediments could be shaped by their natural background concentrations and the dynamics of present erosional and depositional processes due to flood-induced activities [59]. Falkowska and Falkowski [59] reported that the distribution of PTMs is directly correlated to the geological land formation of the alluvial floodplain.
PTMs accumulate in the floodplain sediments next to a number of rivers in the industrial and mining watersheds of western European nations such as Germany [60]. Martin [60] found that PTM concentrations often peak between 0.2 and 0.7 m below the surface of the floodplain, which was believed to be the period of maximum metal discharges to the environment from upstream industrial activity, ore extraction, or both. These sediments in the watershed bear the chemical imprint of prior industrial or mining operations. Strzeboska et al. [61] reported that the Wilga River flood sediment pollution was less severe than the Vistula River contamination.
Even though there is no direct health risk assessment of PTMs for the adults and children that are the affected residents, the present findings could be a reflection of the hazards that could be experienced by the people due to remobilisation of PTMs to the residential areas during flash floods.
4. Conclusions
This study investigated the ecological health risks of Cd, Pb, Ni, Cu, and Zn in the sediments of Malacca’s drainage system, river, and coast. The PERI values suggested that the five metals decreased in the following order: Cd > Cu > Pb > Zn > Ni; the amount of PTMs in the study areas decreased in this order: drainage > river > coast. The drainage system and river were deemed to be of "very high ecological risk". When comparing the three pathways for HHRA, drainage and river sediments have greater HQ values than coastal sediments. Even though children had higher health risks due to the PTMs than adults, the three exposure pathways of PTMs for children and adults were reduced in the following order: ingestion > dermal contact > inhalation. Overall, all metals in all drainage, river, and coastal sites showed no non-carcinogenic risks of PTMs for children and adults, except for Pb in children at one of the drainage sites that exceeded 1.0, indicating a non-carcinogenic risk to children. Continuous monitoring studies and HHRA of PTMs in drainages are highly recommended in Malaysia.
This study should prompt future investigations on the direct impact of the risks to residents during flash floods in Malaysia as part of mitigation and risk assessments of the polluted drainage and river sediments in the efforts to lower the risks to the people. Therefore, contaminated sediments in the drainages and rivers receiving effluents from the industries should be seriously attended to by the authorities. Currently, they are not due to a non-ecotoxicological mindset, since children do not usually play in the stinky, polluted drainage sediments and there is no direct impact on human health. However, flash floods in Malaysia are becoming a common phenomenon nowadays and are attracting public concern when the contaminated sediments overflowing from the drainages and rivers become a health risk hazard.
Supplementary Materials
The following supporting information can be downloaded at: https://www.mdpi.com/article/10.3390/w14152316/s1, Table S1: Site descriptions of surface sediments were collected from the Malacca Industrial Area and Malacca River drainages; Table S2: Heavy metal analysis recovery percentages of the certified reference materials (CRMs); Table S3: Overall statistics of percentages (%) of EFLE (F1), acid-reducible (F2), oxidisable-organic (F3), resistant (F4), non-resistant (NR) fractions, ratios of non-resistant to resistant (NR/R) fractions, and values of enrichment factor (EF), geoaccumulation index (Igeo), contamination factor (CF), and ecological risk (ER) for Cd, Cu, Ni, Pb, and Zn of sediments collected from the coast (N = 2), river (N = 6), and drainage (N = 6) sites in Malacca, Peninsular Malaysia; Table S4: Overall statistics of the values of hazard quotient (HQ) and hazard index (HI) in the three exposure routes of Cd, Ni, Cu, Pb, and Zn in children (C) and adults (A) separated into coastal, drainage, and river sites from the present study.
Author Contributions
Conceptualisation, C.K.Y. and K.A.A.-M.; methodology and validation, C.K.Y. and K.A.A.-M.; formal analysis, C.K.Y.; investigation, C.K.Y.; resources, K.A.A.-M.; data curation, C.K.Y.; writing—original draft preparation, C.K.Y.; writing—review and editing, C.K.Y. and K.A.A.-M. All authors have read and agreed to the published version of the manuscript.
Funding
This research received no external funding.
Institutional Review Board Statement
Not applicable.
Informed Consent Statement
Not applicable.
Data Availability Statement
Not applicable.
Acknowledgments
The authors would like to thank undergraduate student Hisham Ishak for providing the metal data.
Conflicts of Interest
The authors declare no conflict of interest.
References
- Luo, X.-S.; Ding, J.; Xu, B.; Wang, Y.-J.; Li, H.-B.; Yu, S. Incorporating Bioaccessibility into Human Health Risk Assessments of Heavy Metals in Urban Park Soils. Sci. Total Environ. 2012, 424, 88–96. [Google Scholar] [CrossRef] [PubMed]
- Xu, D.-M.; Fu, R.-B.; Liu, H.-Q.; Guo, X.-P. Current Knowledge from Heavy Metal Pollution in Chinese Smelter Contaminated Soils, Health Risk Implications and Associated Remediation Progress in Recent Decades: A Critical Review. J. Clean. Prod. 2020, 286, 124989. [Google Scholar] [CrossRef]
- Yap, C.K. Soil Pollution: Sources, Management Strategies and Health Effects; Nova Science Publishers, Inc.: Hauppauge, NY, USA, 2019; ISBN 978-1-5361-3942-6. [Google Scholar]
- Yap, C.K.; Chew, W.; Al-Mutairi, K.A.; Nulit, R.; Ibrahim, M.H.; Wong, K.W.; Bakhtiari, A.R.; Sharifinia, M.; Ismail, M.S.; Leong, W.J.; et al. Assessments of the Ecological and Health Risks of Potentially Toxic Metals in the Topsoils of Different Land Uses: A Case Study in Peninsular Malaysia. Biology 2022, 11, 2. [Google Scholar] [CrossRef]
- Yap, C.K.; Al-Mutairi, K.A. Ecological-Health Risk Assessments of Heavy Metals (Cu, Pb, and Zn) in Aquatic Sediments from the ASEAN-5 Emerging Developing Countries: A Review and Synthesis. Biology 2022, 11, 7. [Google Scholar] [CrossRef] [PubMed]
- Yap, C.K.; Wong, C.H. Assessment Cu, Ni and Zn Pollution in the Surface Sediments in the Southern Peninsular Malaysia Using Cluster Analysis, Ratios of Geochemical Nonresistant to Resistant Fractions, and Geochemical Indices. Environ. Asia 2011, 4, 53–61. [Google Scholar] [CrossRef]
- Yap, C.K.; Pang, B.H. Assessment of Cu, Pb, and Zn Contamination in Sediment of North Western Peninsular Malaysia by Using Sediment Quality Values and Different Geochemical Indices. Environ. Monit. Assess. 2011, 183, 23–39. [Google Scholar] [CrossRef] [PubMed]
- Yap, C.K.; Pang, B.H. Anthropogenic Concentrations of Cd, Ni and Zn in the Intertidal, River and Drainage Sediments Collected from North Western Peninsular Malaysia. Pertanika J. Sci. Technol. 2011, 19, 93–107. [Google Scholar]
- Hoodaji, M.; Tahmourespour, A.; Amini, H. Assessment of Copper, Cobalt and Zinc Contaminations in Soils and Plants of Industrial Area in Esfahan City (in Iran). Environ. Earth Sci. 2010, 61, 1353–1360. [Google Scholar] [CrossRef]
- Mojiri, A.; Ohashi, A.; Ozaki, N.; Shoiful, A.; Kindaichi, T. Pollutant Removal from Synthetic Aqueous Solutions with a Combined Electrochemical Oxidation and Adsorption Method. Int. J. Environ. Res. Public Health 2018, 15, 1443. [Google Scholar] [CrossRef] [Green Version]
- Omar, N.Y.M.J.; Abas, M.R.B.; Rahman, N.A.; Tahir, N.M.; Rushdi, A.I.; Simoneit, B.R.T. Levels and Distributions of Organic Source Tracers in Air and Roadside Dust Particles of Kuala Lumpur, Malaysia. Environ. Geol. 2007, 52, 1485–1500. [Google Scholar] [CrossRef]
- Maimon, A.; Jusoh, K.; Mahir, A.R.; Ismail, B.S. Comparative Accumulation of Heavy Metals in Selected Vegetables, Their Availability and Correlation in Lithogenic and Nonlithogenic Fractions of Soils from Some Agricultural Areas in Malaysia. Adv. Environ. Biol. 2009, 3, 314–321. [Google Scholar]
- Ashraf, M.A.; Maah, M.J.; Yusoff, I. Heavy Metals Accumulation in Plants Growing in Ex Tin Mining Catchment. Int. J. Environ. Sci. Technol. 2011, 8, 401–416. [Google Scholar] [CrossRef] [Green Version]
- Chen, H.; Teng, Y.; Lu, S.; Wang, Y.; Wang, J. Contamination Features and Health Risk of Soil Heavy Metals in China. Sci. Total Environ. 2015, 512–513, 143–153. [Google Scholar] [CrossRef] [PubMed]
- Chabukdhara, M.; Nema, A.K. Heavy Metals Assessment in Urban Soil around Industrial Clusters in Ghaziabad, India: Probabilistic Health Risk Approach. Ecotoxicol. Environ. Saf. 2013, 87, 57–64. [Google Scholar] [CrossRef]
- Qing, X.; Yutong, Z.; Shenggao, L. Assessment of Heavy Metal Pollution and Human Health Risk in Urban Soils of Steel Industrial City (Anshan), Liaoning, Northeast China. Ecotoxicol. Environ. Saf. 2015, 120, 377–385. [Google Scholar] [CrossRef]
- Li, Z.; Ma, Z.; van der Kuijp, T.J.; Yuan, Z.; Huang, L. A Review of Soil Heavy Metal Pollution from Mines in China: Pollution and Health Risk Assessment. Sci. Total Environ. 2014, 468, 843–853. [Google Scholar] [CrossRef]
- Wei, X.; Gao, B.; Wang, P.; Zhou, H.; Lu, J. Pollution Characteristics and Health Risk Assessment of Heavy Metals in Street Dusts from Different Functional Areas in Beijing, China. Ecotoxicol. Environ. Saf. 2015, 112, 186–192. [Google Scholar] [CrossRef]
- Wu, S.; Peng, S.; Zhang, X.; Wu, D.; Luo, W.; Zhang, T.; Zhou, S.; Yang, G.; Wan, H.; Wu, L. Levels and Health Risk Assessments of Heavy Metals in Urban Soils in Dongguan, China. J. Geochem. Explor. 2015, 148, 71–78. [Google Scholar] [CrossRef]
- Gu, Y.-G.; Lin, Q.; Gao, Y.-P. Metals in Exposed-Lawn Soils from 18 Urban Parks and Its Human Health Implications in Southern China’s Largest City, Guangzhou. J. Clean. Prod. 2016, 115, 122–129. [Google Scholar] [CrossRef]
- Khan, S.; Munir, S.; Sajjad, M.; Li, G. Urban Park Soil Contamination by Potentially Harmful Elements and Human Health Risk in Peshawar City, Khyber Pakhtunkhwa, Pakistan. J. Geochem. Explor. 2016, 165, 102–110. [Google Scholar] [CrossRef]
- Xu, X.; Hu, X.; Wang, T.; Sun, M.; Wang, L.; Zhang, L. Non-Inverted U-Shaped Challenges to Regional Sustainability: The Health Risk of Soil Heavy Metals in Coastal China. J. Clean. Prod. 2021, 279, 123746. [Google Scholar] [CrossRef]
- Badri, M.A.; Aston, S.R. Observations on Heavy Metal Geochemical Associations in Polluted and Non-Polluted Estuarine Sediments. Environ. Pollut. Ser. B Chem. Phys. 1983, 6, 181–193. [Google Scholar] [CrossRef]
- Wong, K.W.; Yap, C.K.; Nulit, R.; Hamzah, M.S.; Chen, S.K.; Cheng, W.H.; Karami, A.; Al-Shami, S.A. Effects of Anthropogenic Activities on the Heavy Metal Levels in the Clams and Sediments in a Tropical River. Environ. Sci. Pollut. Res. 2017, 24, 116–134. [Google Scholar] [CrossRef] [PubMed]
- Buat-Menard, P.; Chesselet, R. Variable influence of the atmospheric flux on the trace metal chemistry of oceanic suspended matter. Earth Planet. Sci. Lett. 1979, 42, 398–411. [Google Scholar] [CrossRef]
- Wedepohl, K.H. The Composition of the Continental Crust. Geochim. Cosmochim. Acta 1995, 59, 1217–1232. [Google Scholar] [CrossRef]
- Schi, K.C.; Weisberg, S.B. Iron as a reference element for determining trace metal enrichment in Southern California coast shelf sediments. Mar. Environ. Res. 1999, 48, 161–176. [Google Scholar]
- Binta Hasan, A.; Kabir, S.; Selim Reza, A.H.M.; Nazim Zaman, M. Enrichment factor and geo-accumulation index of trace metals in sediments of the ship breaking area of Sitakund Upazilla (Bhatiary–Kumira), Chittagong, Bangladesh. J. Geochem. Exp. 2013, 125, 130–137. [Google Scholar] [CrossRef]
- Sutherland, R.A. Bed sediment-associated trace metals in an urban stream, Oahu, Hawaii. Environ. Geol. 2000, 39, 611–627. [Google Scholar] [CrossRef]
- Cheng, W.H.; Yap, C.K. Potential Human Health Risks from Toxic Metals via Mangrove Snail Consumption and Their Ecological Risk Assessments in the Habitat Sediment from Peninsular Malaysia. Chemosphere 2015, 135, 156–165. [Google Scholar] [CrossRef]
- Xiao, Y.; Guo, M.; Li, X.; Luo, X.; Pan, R.; Ouyang, T. Spatial Distribution, Pollution, and Health Risk Assessment of Heavy Metal in Agricultural Surface Soil for the Guangzhou-Foshan Urban Zone, South China. PLoS ONE 2020, 15, e0239563. [Google Scholar] [CrossRef]
- Tian, S.; Wang, S.; Bai, X.; Zhou, D.; Luo, G.; Yang, Y.; Hu, Z.; Li, C.; Deng, Y.; Lu, Q. Ecological Security and Health Risk Assessment of Soil Heavy Metals on a Village-Level Scale, Based on Different Land Use Types. Environ. Geochem. Health 2020, 42, 3393–3413. [Google Scholar] [CrossRef] [PubMed]
- Muller, G. Index of Geoaccumulation in Sediments of the Rhine River. Geojournal 1969, 2, 108–118. [Google Scholar]
- Hakanson, L. An Ecological Risk Index for Aquatic Pollution Control.a Sedimentological Approach. Water Res. 1980, 14, 975–1001. [Google Scholar] [CrossRef]
- US EPA. Baseline Human Health Risk Assessment Vasquez Boulevard and I-70 Superfund Site Demver, Co; U.S. Environmental Protection Agency: Washington, DC, USA, 2001.
- US EPA. Exposure Factors Handbook (1997); EPA/600/P-95/002F; National Center for Environmental Assessment, US EPA Office of Research and Development: Washington, DC, USA, 1997.
- US EPA. Human Health Evaluation Manual. In Risk Assessment Guidance for Superfund; EPA/540/1-89/002; Office of Emergency and Remedial Response, U.S. Environmental Protection Agency: Washington, DC, USA, 1989; Volume 1. [Google Scholar]
- US EPA. Superfund Public Health Evaluation Manual; U.S. Environmental Protection Agency: Washington, DC, USA, 1986; pp. 1–86.
- DB11/T 656-2009; Environmental Site Assessment Guideline. Beijing Quality and Technology Supervision Bureau: Beijing, China, 2009.
- Barnes, D.G.; Dourson, M.; Dourson, M.; Preuss, P.; Barnes, D.G.; Bellin, J.; Derosa, C.; Engler, R.; Erdreich, L.; Farber, T.; et al. Reference Dose (RfD): Description and Use in Health Risk Assessments. Regul. Toxicol. Pharmacol. 1988, 8, 471–486. [Google Scholar] [CrossRef]
- Ferreira-Baptista, L.; De Miguel, E. Geochemistry and Risk Assessment of Street Dust in Luanda, Angola: A Tropical Urban Environment. Atmos. Environ. 2005, 39, 4501–4512. [Google Scholar] [CrossRef] [Green Version]
- Hu, X.; Zhang, Y.; Luo, J.; Wang, T.; Lian, H.; Ding, Z. Bioaccessibility and Health Risk of Arsenic, Mercury and Other Metals in Urban Street Dusts from a Mega-City, Nanjing, China. Environ. Pollut. 2011, 159, 1215–1221. [Google Scholar] [CrossRef]
- Kelepertzis, E. Investigating the Sources and Potential Health Risks of Environmental Contaminants in the Soils and Drinking Waters from the Rural Clusters in Thiva Area (Greece). Ecotoxicol. Environ. Saf. 2014, 100, 258–265. [Google Scholar] [CrossRef]
- Taylor, S.R.; McLennan, S.M. The Geochemical Evolution of the Continental Crust. Rev. Geophys. 1995, 33, 241–265. [Google Scholar] [CrossRef]
- Rudnick, R.L.; Gao, S. 3.01—Composition of the Continental Crust. In Treatise on Geochemistry; Holland, H.D., Turekian, K.K., Eds.; Pergamon: Oxford, UK, 2003; pp. 1–64. ISBN 978-0-08-043751-4. [Google Scholar]
- Zhao, H.; Xia, B.; Fan, C.; Zhao, P.; Shen, S. Human Health Risk from Soil Heavy Metal Contamination under Different Land Uses near Dabaoshan Mine, Southern China. Sci. Total Environ. 2012, 417–418, 45–54. [Google Scholar] [CrossRef]
- Moya, J.; Bearer, C.F.; Etzel, R.A. Various Life Stages. Pediatrics 2004, 113, 996–1006. [Google Scholar] [CrossRef]
- Rahman, S. Malaysia’s Floods of December 2021: Can Future Disasters be Avoided? Reseachers at ISEAS, Yusof Ishak Institute Analyse Current Events, Singapore, 16 March 2022; ISEAS: Singapore, 2022; 2022, No. 26. [Google Scholar]
- Ciszewski, D.; Grygar, T.M. A Review of Flood-Related Storage and Remobilization of Heavy Metal Pollutants in River Systems. Water Air Soil Pollut. 2016, 227, 239. [Google Scholar] [CrossRef] [PubMed] [Green Version]
- Aslan, A. Floodplain sediments. In Encyclopedia of Sediments and Sedimentary Rocks; Middleton, G.V., Church, M.J., Coniglio, M., Hardie, L.A., Longstaffe, F.J., Eds.; Encyclopedia of Earth Sciences Series; Springer: Dordrecht, The Netherlands, 1978. [Google Scholar] [CrossRef]
- Zhao, Y.; Marriott, S.B. Dispersion and remobilisation of heavy metals in the River Severn system, UK. Procedia Environ. Sci. 2013, 18, 167–173. [Google Scholar] [CrossRef] [Green Version]
- Szabó, Z.; Buró, B.; Szabó, J.; Tóth, C.A.; Baranyai, E.; Herman, P.; Prokisch, J.; Tomor, T.; Szabó, Z. Geomorphology as a Driver of Heavy Metal Accumulation Patterns in a Floodplain. Water 2020, 12, 563. [Google Scholar] [CrossRef] [Green Version]
- Wyżga, B.; Ciszewski, D. Hydraulic controls on the entrapment of heavy metal-polluted sediments on a floodplain of variable width, the upper Vistula River, southern Poland. Geomorphology 2010, 117, 272–286. [Google Scholar] [CrossRef]
- Hostache, R.; Hissler, C.; Matgen, P.; Guignard, C.; Bates, P. Modelling suspended-sediment propagation and related heavy metal contamination in floodplains: A parameter sensitivity analysis. Hydrol. Earth Syst. Sci. 2014, 18, 3539–3551. [Google Scholar] [CrossRef] [Green Version]
- Narayan, A.; Mora, A.; Sánchez, L.; Rosales, J. Temporal and spatial variability of heavy metals in bottom sediments and the aquatic macrophyte Paspalum repens of the Orinoco River floodplain lagoons impacted by industrial activities. Environ. Sci. Pollut. Res. 2020, 27, 37074–37086. [Google Scholar] [CrossRef]
- Liang, Y.; Xiao, H.; Liu, X.; Shi, H. The risk and phytotoxicity of metal(loid)s in the sediment, floodplain soil, and hygrophilous grasses along Le’an River. Int. J. Environ. Sci. Technol. 2020, 17, 1963–1974. [Google Scholar] [CrossRef]
- Owca, T.J.; Kay, M.L.; Faber, J.; Remmer, C.R.; Zabel, N.; Wiklund, J.A.; Wolfe, B.B.; Hall, R.I. Use of pre-industrial baselines to monitor anthropogenic enrichment of metals concentrations in recently deposited sediment of floodplain lakes in the Peace-Athabasca Delta (Alberta, Canada). Environ. Monit. Assess. 2020, 192, 106. [Google Scholar] [CrossRef] [Green Version]
- Garvin, E.M.; Bridge, C.F.; Garvin, M.S. Screening Level Assessment of Metal Concentrations in Streambed Sediments and Floodplain Soils within the Grand Lake Watershed in Northeastern Oklahoma, USA. Arch. Environ. Contam. Toxicol. 2017, 72, 349–363. [Google Scholar] [CrossRef]
- Falkowska, E.; Falkowski, T. Trace metals distribution pattern in floodplain sediments of a lowland river in relation to contemporary valley bottom morphodynamics. Earth Surf. Processes Landf. 2015, 40, 876–887. [Google Scholar] [CrossRef]
- Martin, C.W. Trace metal storage in recent floodplain sediments along the Dill River, central Germany. Geomorphology 2015, 235, 52–62. [Google Scholar] [CrossRef]
- Strzebońska, M.; Kostka, A.; Helios-Rybicka, E.; Jarosz-Krzemińska, E. Effect of flooding on heavy metals contamination of vistula floodplain sediments in Cracow; historical mining and smelting as the most important source of pollution. Pol. J. Environ. Stud. 2015, 24, 1317–1326. [Google Scholar]
Figure 1.
Map showing sampling sites in the Malacca area. Note: The sampling map was remade based on google.com/maps (accessed on 18 July 2022).
Figure 1.
Map showing sampling sites in the Malacca area. Note: The sampling map was remade based on google.com/maps (accessed on 18 July 2022).

Figure 2.
Cd percentages of “easily, freely leachable or exchangeable” (F1; %), “acid-reducible” (F2; %), “oxidisable-organic” (F3; %), and non-resistant (%) fractions, ratios of non-resistant to resistant fractions (NR/R; unitless), enrichment factor (EF; unitless), geoaccumulation index (Igeo; unitless), contamination factor (CF; unitless), total Cd concentrations (Total Cd; mg/kg dry weight), and ecological risk (ER; unitless) of Cd. Note: hyphen (-) means minus.


Figure 3.
Cu percentages of "easily, freely leachable or exchangeable" (F1; %), "acid-reducible" (F2; %), "oxidisable-organic" (F3; %), and non-resistant (%) fractions, ratios of non-resistant to resistant fractions (NR/R; unitless), enrichment factor (EF; unitless), geoaccumulation index (Igeo; unitless), contamination factor (CF; unitless), total Cu concentrations (Total Cu; mg/kg dry weight), and ecological risk (ER; unitless) of Cu. Note: hyphen (-) means minus.


Figure 4.
Ni percentages of "easily, freely leachable or exchangeable" (F1; %), "acid-reducible" (F2; %), "oxidisable-organic" (F3; %), and non-resistant (%) fractions, ratios of non-resistant to resistant fractions (NR/R; unitless), enrichment factor (EF; unitless), geoaccumulation index (Igeo; unitless), contamination factor (CF; unitless), total Ni concentrations (Total Ni; mg/kg dry weight), and ecological risk (ER; unitless) of Ni. Note: hyphen (-) means minus.


Figure 5.
Pb percentages of "easily, freely leachable or exchangeable" (F1; %), "acid-reducible" (F2; %), "oxidisable-organic" (F3; %), and non-resistant (%) fractions, ratios of non-resistant to resistant fractions (NR/R; unitless), enrichment factor (EF; unitless), geoaccumulation index (Igeo; unitless), contamination factor (CF; unitless), total Pb concentrations (Total Pb; mg/kg dry weight), and ecological risk (ER; unitless) of Pb. Note: hyphen (-) means minus.


Figure 6.
Zn percentages of "easily, freely leachable or exchangeable" (F1; %), "acid-reducible" (F2; %), "oxidisable-organic" (F3; %), and non-resistant (%) fractions, ratios of non-resistant to resistant fractions (NR/R; unitless), enrichment factor (EF; unitless), geoaccumulation index (Igeo; unitless), contamination factor (CF; unitless), total Zn concentrations (Total Zn; mg/kg dry weight), and ecological risk (ER; unitless) of Zn. Note: hyphen (-) means minus.


Figure 7.
Values of potential ecological risk index (PERI) in drainage, river, and coast in the sediments collected from Malacca, Peninsular Malaysia.
Figure 7.
Values of potential ecological risk index (PERI) in drainage, river, and coast in the sediments collected from Malacca, Peninsular Malaysia.

Figure 8.
Comparisons of the values of the hazard quotient (HQ) and hazard index (HI) in the three exposure routes of Cd, Ni, Cu, Pb, and Zn in children (C) and adults (A) from the present study.
Figure 8.
Comparisons of the values of the hazard quotient (HQ) and hazard index (HI) in the three exposure routes of Cd, Ni, Cu, Pb, and Zn in children (C) and adults (A) from the present study.


Table 1.
Exposure factors, reference values, and their definitions that were used to estimate the intake values and health risks of potentially toxic metals in sediment for the present study.
Table 1.
Exposure factors, reference values, and their definitions that were used to estimate the intake values and health risks of potentially toxic metals in sediment for the present study.
| Factor | Definition | Unit | Values | References | |
|---|---|---|---|---|---|
| Children | Adults | ||||
| ABF | Dermal absorption factor | Unitless | 1.00 × 10⁻³ | 1.00 × 10⁻³ | [15] |
| Cd RfD | Reference dose for ingestion | mg/kg day | 1.00 × 10⁻³ | 1.00 × 10⁻³ | [16] |
| Ni RfD | Reference dose for ingestion | mg/kg day | 2.00 × 10⁻² | 2.00 × 10⁻² | [16] |
| Cu RfD | Reference dose for ingestion | mg/kg day | 4.00 × 10⁻² | 4.00 × 10⁻² | [16] |
| Pb RfD | Reference dose for ingestion | mg/kg day | 3.50 × 10⁻³ | 3.50 × 10⁻³ | [16] |
| Zn RfD | Reference dose for ingestion | mg/kg day | 3.00 × 10⁻¹ | 3.00 × 10⁻¹ | [16] |
| Cd RfD | Reference dose for inhalation | mg/kg day | 1.00 × 10⁻³ | 1.00 × 10⁻³ | [16] |
| Ni RfD | Reference dose for inhalation | mg/kg day | 2.06 × 10⁻² | 2.06 × 10⁻² | [16] |
| Cu RfD | Reference dose for inhalation | mg/kg day | 4.02 × 10⁻² | 4.02 × 10⁻² | [16] |
| Pb RfD | Reference dose for inhalation | mg/kg day | 3.52 × 10⁻³ | 3.52 × 10⁻³ | [16] |
| Zn RfD | Reference dose for inhalation | mg/kg day | 3.00 × 10⁻¹ | 3.00 × 10⁻¹ | [16] |
| Cd RfD | Reference dose for dermal contact | mg/kg day | 1.00 × 10⁻⁵ | 1.00 × 10⁻⁵ | [16] |
| Ni RfD | Reference dose for dermal contact | mg/kg day | 5.40 × 10⁻³ | 5.40 × 10⁻³ | [16] |
| Cu RfD | Reference dose for dermal contact | mg/kg day | 1.20 × 10⁻² | 1.20 × 10⁻² | [16] |
| Pb RfD | Reference dose for dermal contact | mg/kg day | 5.25 × 10⁻⁴ | 5.25 × 10⁻⁴ | [16] |
| Zn RfD | Reference dose for dermal contact | mg/kg day | 6.00 × 10⁻² | 6.00 × 10⁻² | [16] |
| InhR | Inhalation rate of sediment | m3/day | 7.63 | 12.8 | [17] |
| IngR | Ingestion rate of sediment | mg/day | 200 | 100 | [35] |
| ED | Exposure duration | Years | 6 | 24 | [35] |
| PEF | Particle emission factor | m3/kg | 1.36 × 10⁹ | 1.36 × 10⁹ | [35] |
| AT | Average time | Days | 365 × 6 | 365 × 24 | [36] |
| BW | Bodyweight of the exposed individual | Kg | 15 | 55.9 | [39] |
| EF | Exposure frequency | Days/year | 350 | 350 | [39] |
| SA | Exposed skin surface area | cm2 | 1600 | 4350 | [39] |
| AF | Skin adherence factor | mg/cm day | 0.2 | 0.7 | [40] |
Table 2.
The overall mean concentrations (mg/kg dry weight) of potentially toxic metals in sediment sampled in Peninsular Malaysia and their comparisons with pre-industrial reference levels and upper continental crust (UCC) background levels.
Table 2.
The overall mean concentrations (mg/kg dry weight) of potentially toxic metals in sediment sampled in Peninsular Malaysia and their comparisons with pre-industrial reference levels and upper continental crust (UCC) background levels.
| Cd Coast | Total Cd | Total Cu | Fe% | Total Ni | Total Pb | Total Zn | |
|---|---|---|---|---|---|---|---|
| Coast | Min | 0.96 | 8.02 | 3.34 | 16.6 | 32.2 | 34.9 |
| Max | 1.45 | 43.9 | 3.96 | 28.5 | 59.5 | 126 | |
| Mean | 1.21 | 26.0 | 3.65 | 22.6 | 45.8 | 80.3 | |
| Median | 1.21 | 26.0 | 3.65 | 22.6 | 45.8 | 80.3 | |
| SD | 0.35 | 25.4 | 0.44 | 8.41 | 19.3 | 64.2 | |
| SE | 0.25 | 17.9 | 0.31 | 5.95 | 13.6 | 45.4 | |
| Drainage | Min | 2.53 | 102 | 3.81 | 26.0 | 56.5 | 232 |
| Max | 7.01 | 1689 | 6.15 | 850 | 307 | 312 | |
| Mean | 4.00 | 674 | 4.47 | 231 | 135 | 289 | |
| Median | 3.70 | 236 | 4.14 | 138 | 113 | 297 | |
| SD | 1.64 | 782 | 0.87 | 308 | 90.2 | 29.5 | |
| SE | 0.67 | 319 | 0.36 | 126 | 36.8 | 12.1 | |
| River | Min | 1.88 | 18.9 | 1.76 | 13.1 | 74.4 | 75.4 |
| Max | 2.37 | 580 | 3.70 | 222 | 90.4 | 255 | |
| Mean | 2.20 | 233 | 2.49 | 78.8 | 84.9 | 175 | |
| Median | 2.27 | 167 | 2.26 | 39.9 | 87.4 | 184 | |
| SD | 0.22 | 243 | 0.86 | 96.4 | 7.14 | 74.5 | |
| SE | 0.11 | 121 | 0.43 | 48.2 | 3.57 | 37.3 | |
| Reference Values | Cd | Cu | Fe | Ni | Pb | Zn | |
| Pre-industrial reference level [34] | 1.00 | 50.0 | NA | NA | 70.0 | 175 | |
| UCC [26] | 0.102 | 14.3 | 30,900 | 19.0 | 17.0 | 52.0 | |
| UCC [44] | 0.098 | 25.0 | NA | 44.0 | 17.0 | 71.0 | |
| UCC [45] | 0.090 | 28.0 | NA | 47.0 | 17.0 | 67.0 | |
Publisher’s Note: MDPI stays neutral with regard to jurisdictional claims in published maps and institutional affiliations. |
© 2022 by the authors. Licensee MDPI, Basel, Switzerland. This article is an open access article distributed under the terms and conditions of the Creative Commons Attribution (CC BY) license (https://creativecommons.org/licenses/by/4.0/).
Share and Cite
MDPI and ACS Style
Yap, C.K.; Al-Mutairi, K.A. High Ecological Health Risks of Potentially Toxic Metals in Polluted Drainage Sediments: Is There a Need for Public Concern during Flash Floods? Water 2022, 14, 2316. https://doi.org/10.3390/w14152316
AMA Style
Yap CK, Al-Mutairi KA. High Ecological Health Risks of Potentially Toxic Metals in Polluted Drainage Sediments: Is There a Need for Public Concern during Flash Floods? Water. 2022; 14(15):2316. https://doi.org/10.3390/w14152316
Chicago/Turabian StyleYap, Chee Kong, and Khalid Awadh Al-Mutairi. 2022. "High Ecological Health Risks of Potentially Toxic Metals in Polluted Drainage Sediments: Is There a Need for Public Concern during Flash Floods?" Water 14, no. 15: 2316. https://doi.org/10.3390/w14152316
Note that from the first issue of 2016, this journal uses article numbers instead of page numbers. See further details here.