Communication

The Feasibility of Monitoring Great Plains Playa Inundation with the Sentinel 2A/B Satellites for Ecological and Hydrological Applications

1
Department of Life, Earth and Environmental Sciences, West Texas A&M University, Canyon, TX 79015, USA
2
College of Engineering, West Texas A&M University, Eng & Computer Science Building (ECS), 2501 4th Ave, Canyon, TX 79015, USA
*
Author to whom correspondence should be addressed.
Water 2022, 14(15), 2314; https://doi.org/10.3390/w14152314
Submission received: 16 June 2022 / Revised: 14 July 2022 / Accepted: 22 July 2022 / Published: 26 July 2022

Abstract

:
Playas are ecologically and hydrologically important ephemeral wetlands found in arid and semi-arid regions of the world. Urbanization, changes in agricultural land use and irrigation practices, and climate change all threaten playas. While variations in playa inundation on the Great Plains of North America have been previously analyzed by satellite using annual and decadal time scales, no study to our knowledge has monitored the Great Plains playa inundation area using sub-monthly time scales. Thousands of playas smaller than ~50 m in diameter, which were not previously identified by the Landsat satellite platform, can now be captured by higher resolution satellite data. In this preliminary study, we demonstrate monitoring spatial and temporal changes in the playa water inundation area on sub-monthly times scales between September 2018 and February 2019 over a region in West Texas, USA, using 10 m spatial resolution imagery from the Sentinel-2A/B satellites. We also demonstrate the feasibility and potential benefits of using the Sentinel-2A/B satellite retrievals, in combination with precipitation and evaporation data, to monitor playas for environmental, ecological, groundwater recharge, and hydrological applications.

1. Introduction

Playas, which are generally defined as shallow, ephemeral wetlands located within closed basins, are found in many arid or semi-arid climates. Playas are generally more sensitive to changes in climate, land use, and irrigation practices than permanent bodies of water [1,2]. Thousands of small playas (both Great Plains playas and prairie potholes) are observed across the Great Plains of North America. Playa surfaces and their underlying soils are typically characterized by variable amounts of soluble salts, sand, clay, and silt that are deposited within these closed basins [3]. The frequency and duration of water inundation in playas also varies greatly.
Water is a critical resource on the Great Plains of North America, and the shallow, circular playa basins scattered across these environs are often hotspots of ecological diversity. These playa wetlands provide crucial habitats for many species of mammals, migratory birds, amphibians, and invertebrates [4]. Playas are also important in some regions for aquifer recharge. The Southern High Plains depend heavily on groundwater from the Ogallala Aquifer, which stretches from southern South Dakota to the Texas Panhandle. However, the magnitude of spatial variability of groundwater recharge from playas into the Ogallala Aquifer recharge remains somewhat uncertain and is an active area of research [5,6].
Many hundreds of thousands of playas dot the landscape across the Great Plains of North America [7]. Despite their ecological and hydrological importance to the region, to our knowledge, the use of frequent, high-resolution satellite data that has become available in the last several years has thus far been underutilized in monitoring these threatened and important ecosystems. While a number of satellite-derived analyses of playas have been conducted over the past 20 years, these have mainly used the Landsat satellite platform (e.g., Spain [8], California, USA [9], Texas, USA [10]) which provides a resolution that is too coarse to capture smaller playas, and the platform is infrequently available. On the Great Plains of North America, Starr and McIntyre [2] found a 77% decrease in the percentage of playa inundation (on playas resolved by Landsat) between 1980 and 2008 regarding a study region in West Texas, USA, as irrigation practices changed and warmer and drier conditions occurred.
In the last 10 years, the advent of new higher-resolution, frequent satellite imagery has revolutionized remote sensing for wetlands, lakes, and rivers. A number of studies have utilized the increased spatial and temporal resolution of the European Space Agency Sentinel-2 twin satellites: Sentinel-2A (launched in 2015) and Sentinel-2B (launched in 2017)) (e.g., [11,12,13,14]). Many previous playa studies were limited by lower spatial resolution and less frequent satellite imagery (Landsat spatial resolution is ~30 m, with a return period for satellite observations of ~16 days. For the Sentinel-2 satellites, the spatial resolution is ~10 m, and the return interval for observations is ~10 days (~5 days by utilizing both Sentinel-2A and 2B satellites). Thus, the Sentinel-2 satellite data effectively triples the spatial resolution and doubles the temporal resolution capabilities (compared to Landsat) to monitor changes in small, ephemeral lakes such as playas.
More recently, optical and radar satellite imagery have been combined to obtain a sophisticated analysis of vegetation, soils, and playa water inundation on seasonal scales from 1984–2019 over the Lordsburg Playa in New Mexico [15], while another recent study in Spain demonstrated using genetic programming to improve the reliability of algorithms to discern water versus non-water surfaces in complex shallow lakes and wetlands [16]. Improving satellite retrievals over the variable underlying soil surfaces and spectral characteristics of shallow, turbid waters with variable amounts of aquatic vegetation continues to be an active area of research.
Many different remote sensing techniques exist to identify water bodies by satellite, including image classification and derived water indices. It is beyond the scope of this short communication to review them all here. Because water has a distinct reflectance signature in the visible light wavelengths of the electromagnetic spectrum, the spectral contrast between land and water surfaces are generally pronounced. The normalized difference water index (NDWI) [17], and subsequent variations on this index are the most widely used water detection techniques, using visible and near-infrared (NIR) satellite spectral bands [18]. The goal of this short communication is not to test or recommend the most accurate techniques for retrieving water properties from satellite images taken over playas (which is certainly needed, and future work in this area is encouraged), but to demonstrate the general feasibility of monitoring the Great Plains playa inundation for hydrological and ecological applications using the freely available Sentinel 2A/B satellite data. Using an open-source remote sensing land surface classification tool, we demonstrate how playa inundation can be monitored on a sub-monthly basis, and then discuss the potential of utilizing the satellite-derived playa inundation area data, along with concurrent precipitation and water level imagery, to support ecological and hydrological applications, such as estimating groundwater recharge.

2. Materials and Methods

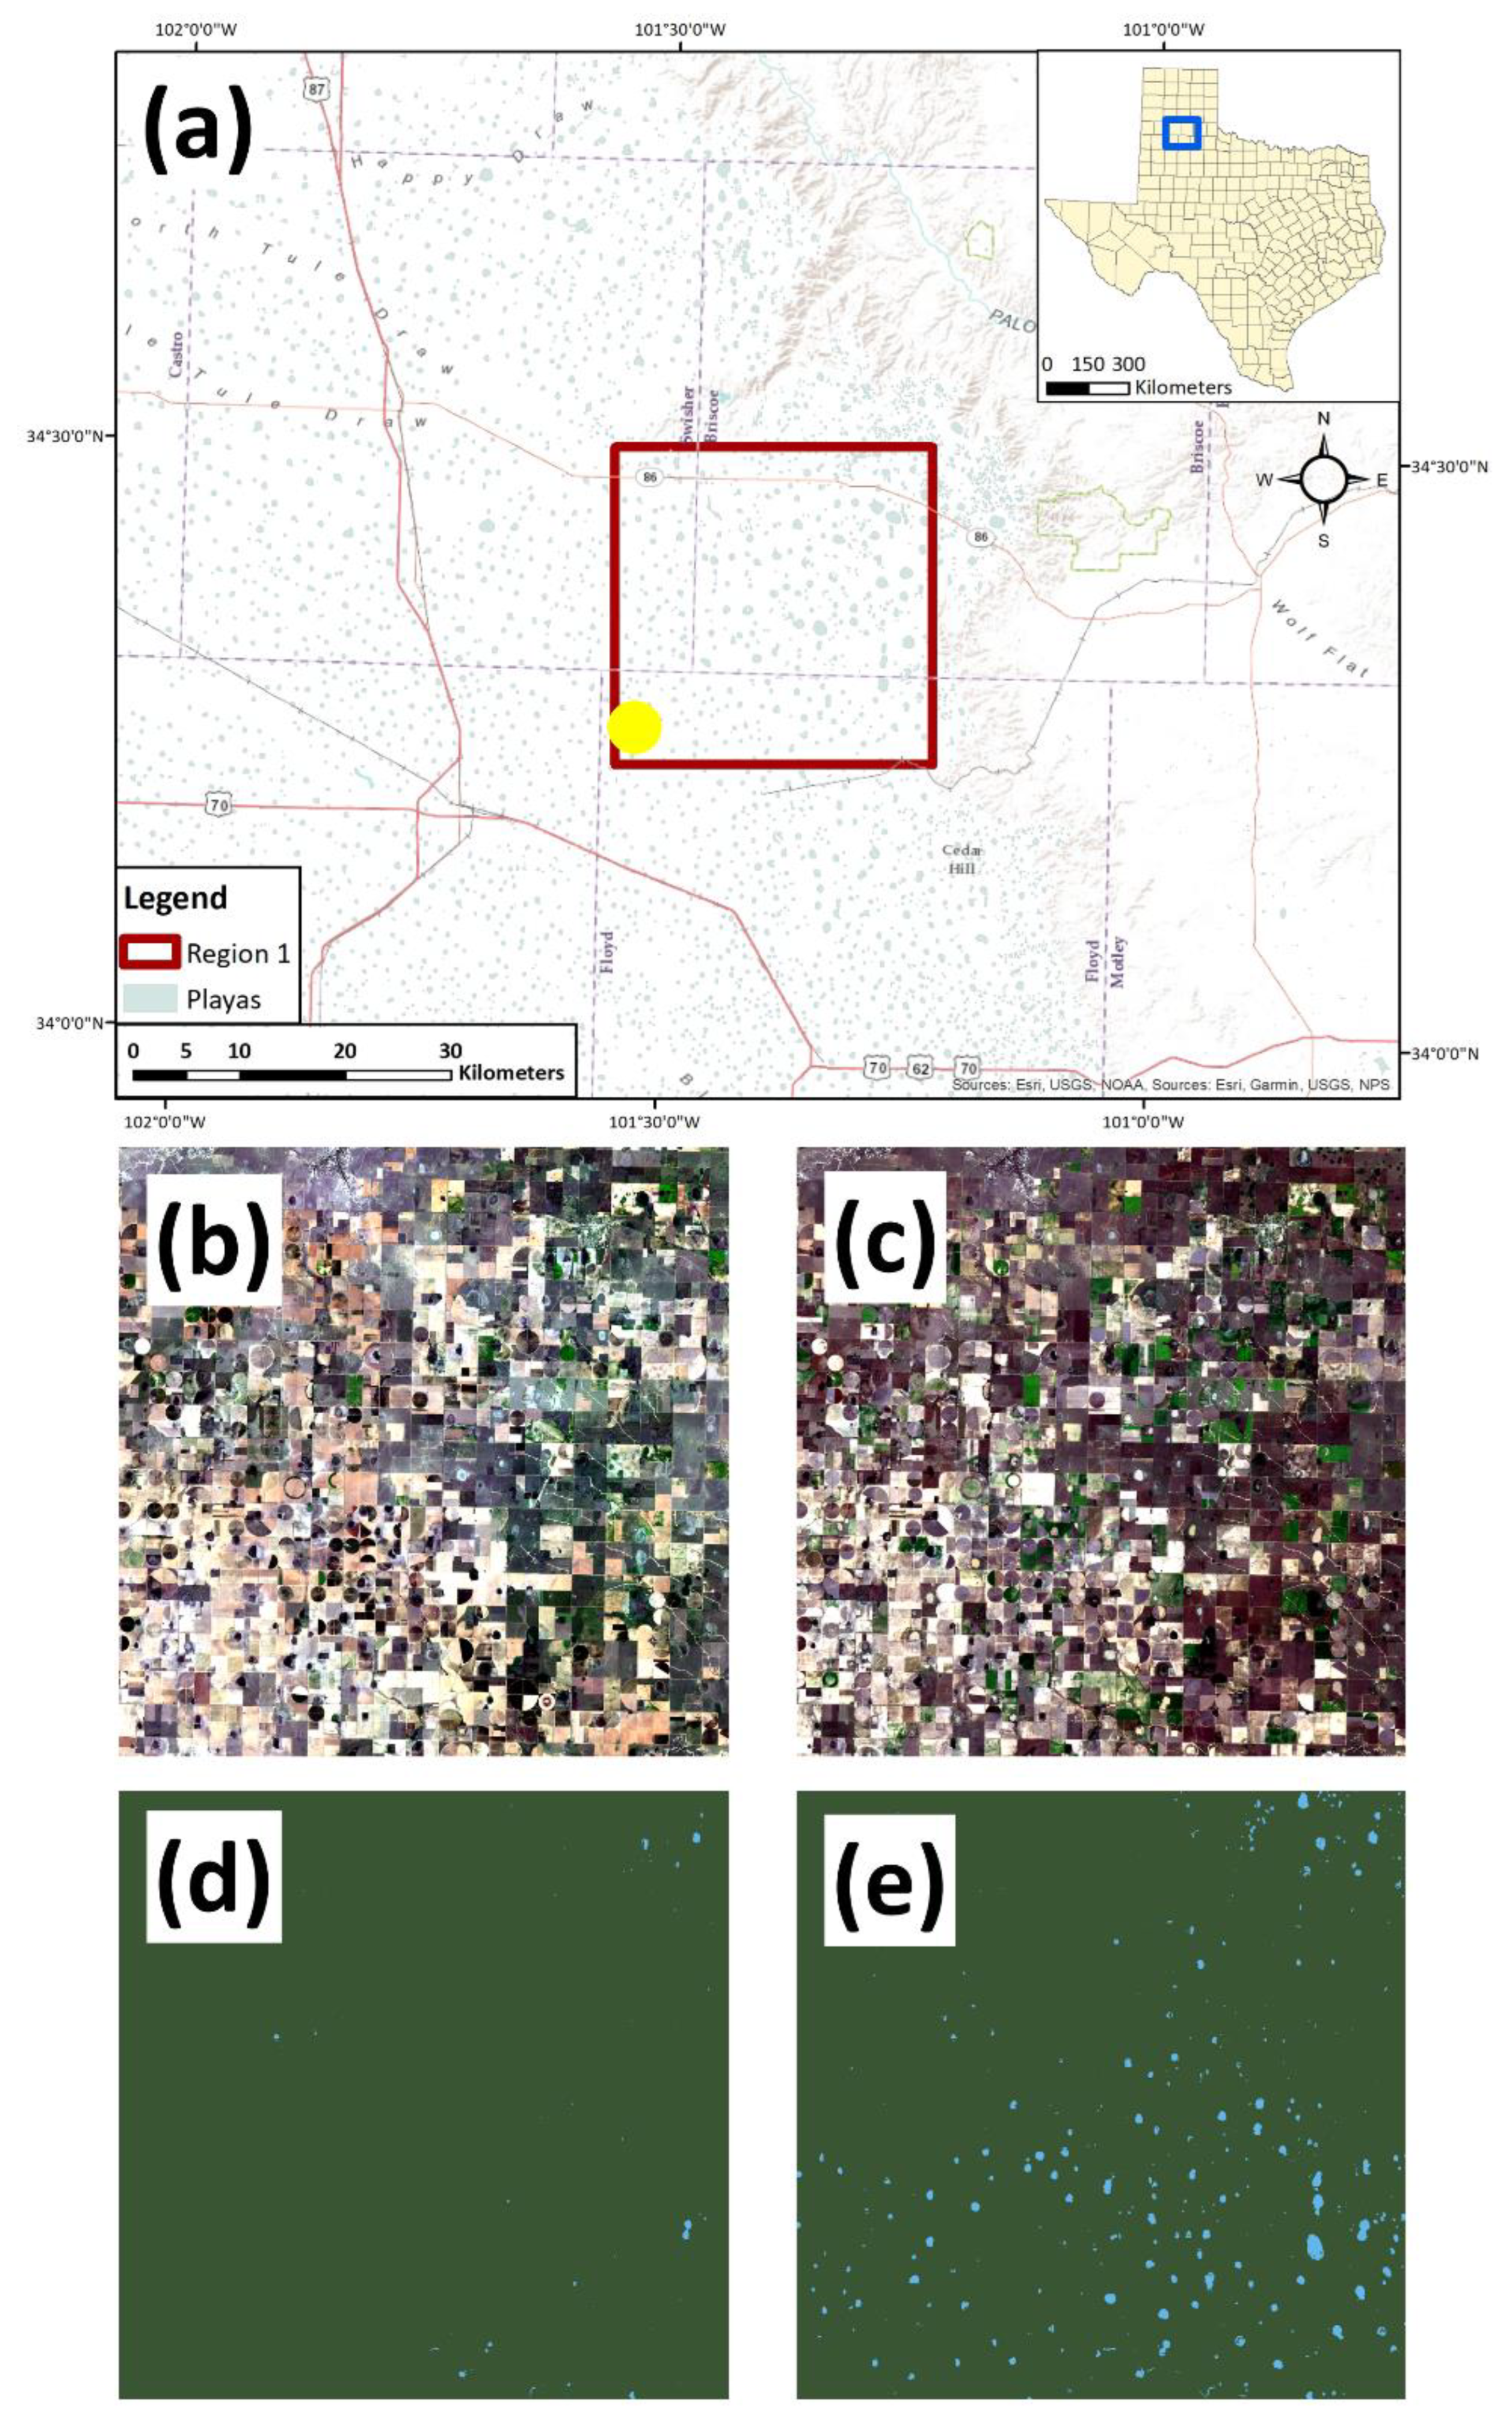
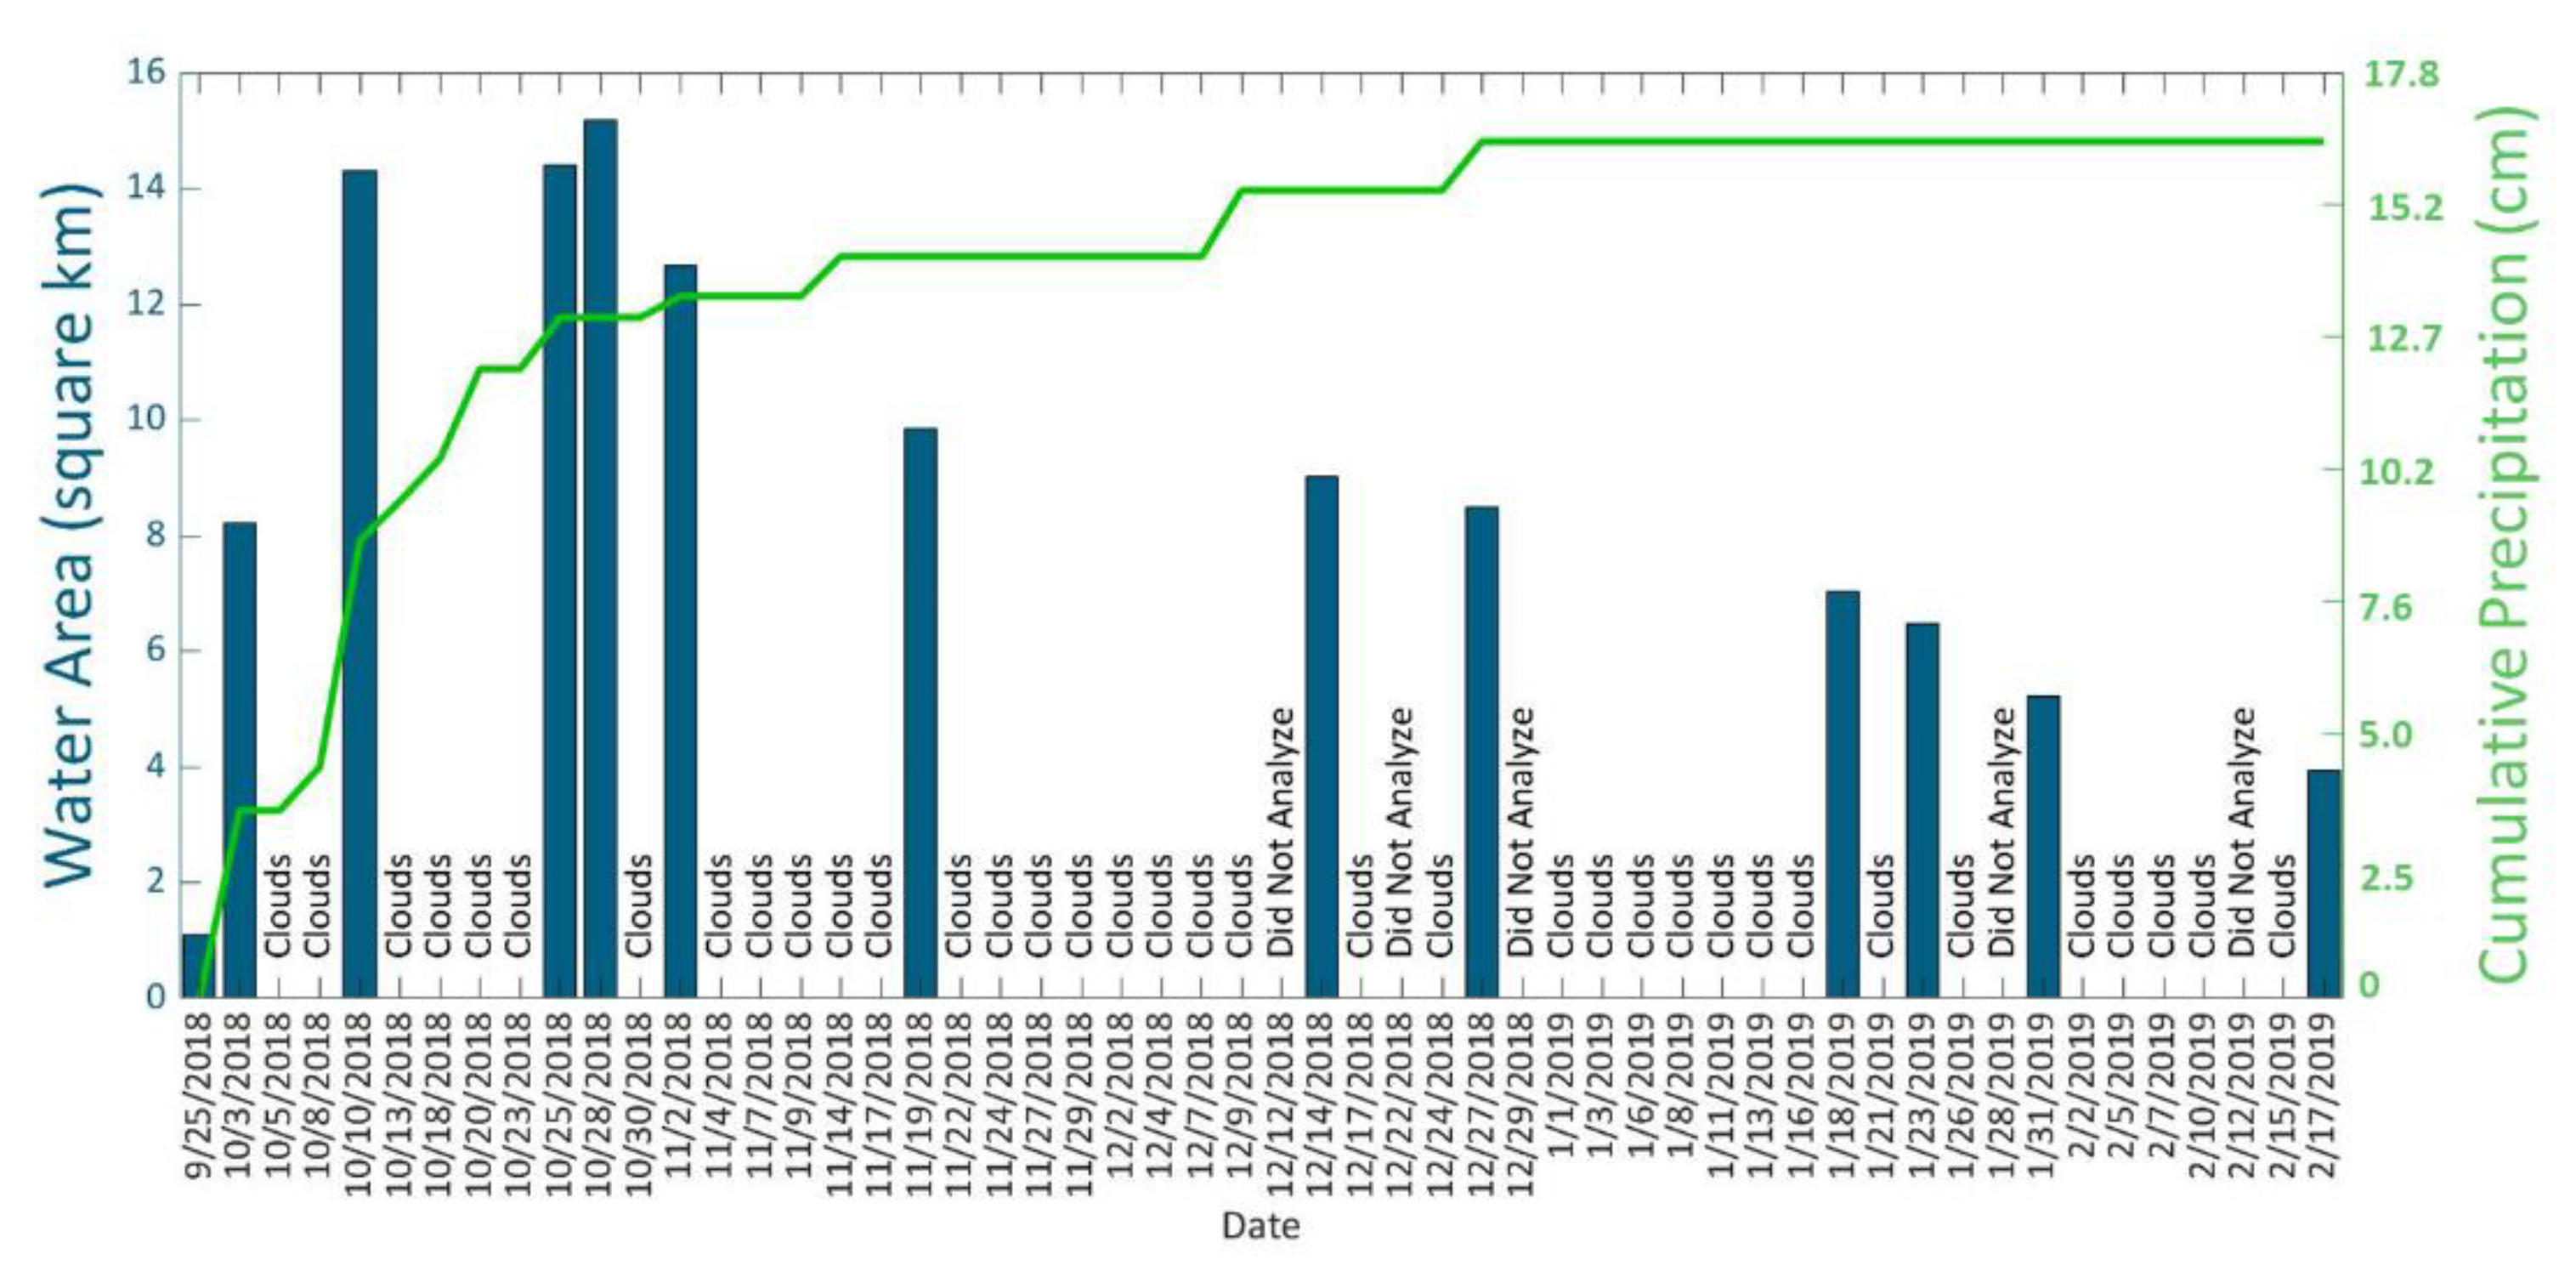
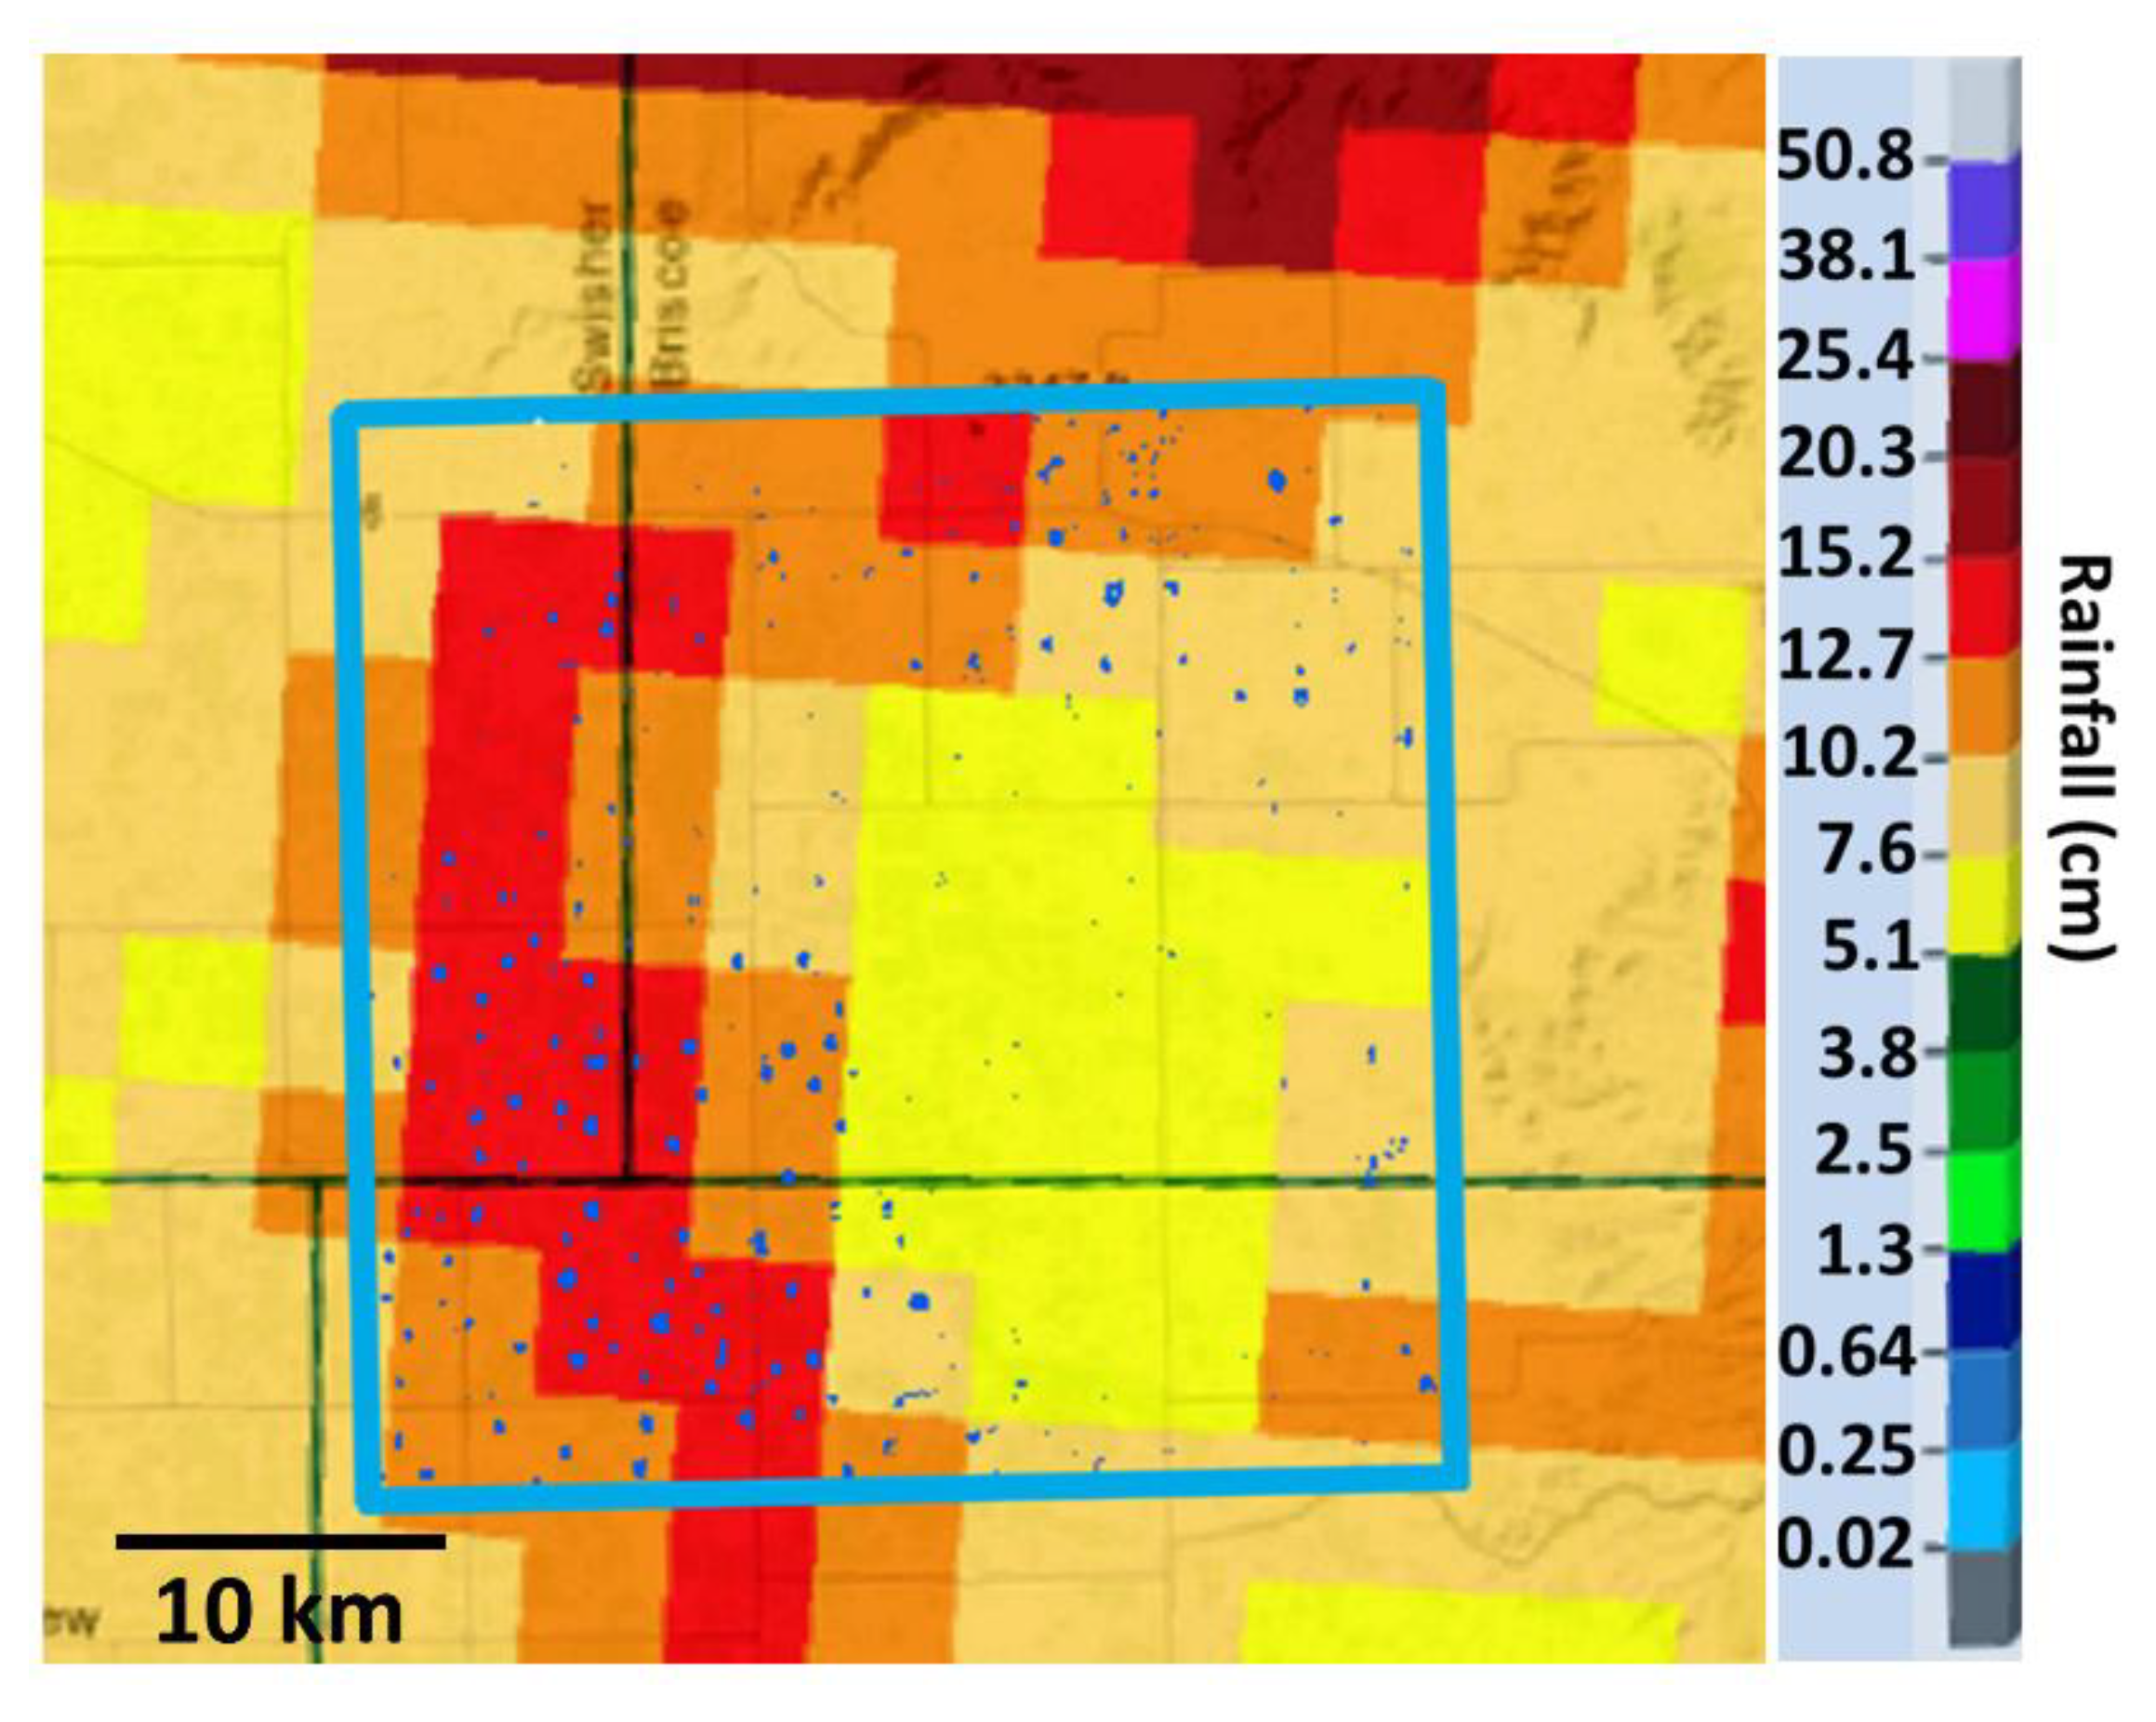
2.1. Study Area and 25 September 2018–17 February 2019 Case Study

The 900 km2 (30 km × 30 km) study area analyzed in this paper was selected to represent a classic clay-lined playa environment in the Ogallala Aquifer region of the Southern High Plains (Figure 1). The time period between 25 September 2018 and 17 February 2019 was selected as a case study example of monitoring changes in playa inundation and water surface area for ecological and hydrological applications with Sentinel-2A/B satellite data. This time period was chosen to demonstrate how a sequence of Sentinel-2 satellite images is able to capture a rapid filling of the playas with water in late September through October 2018, followed by a slow decrease in the playa inundation between November 2018 and February 2019.

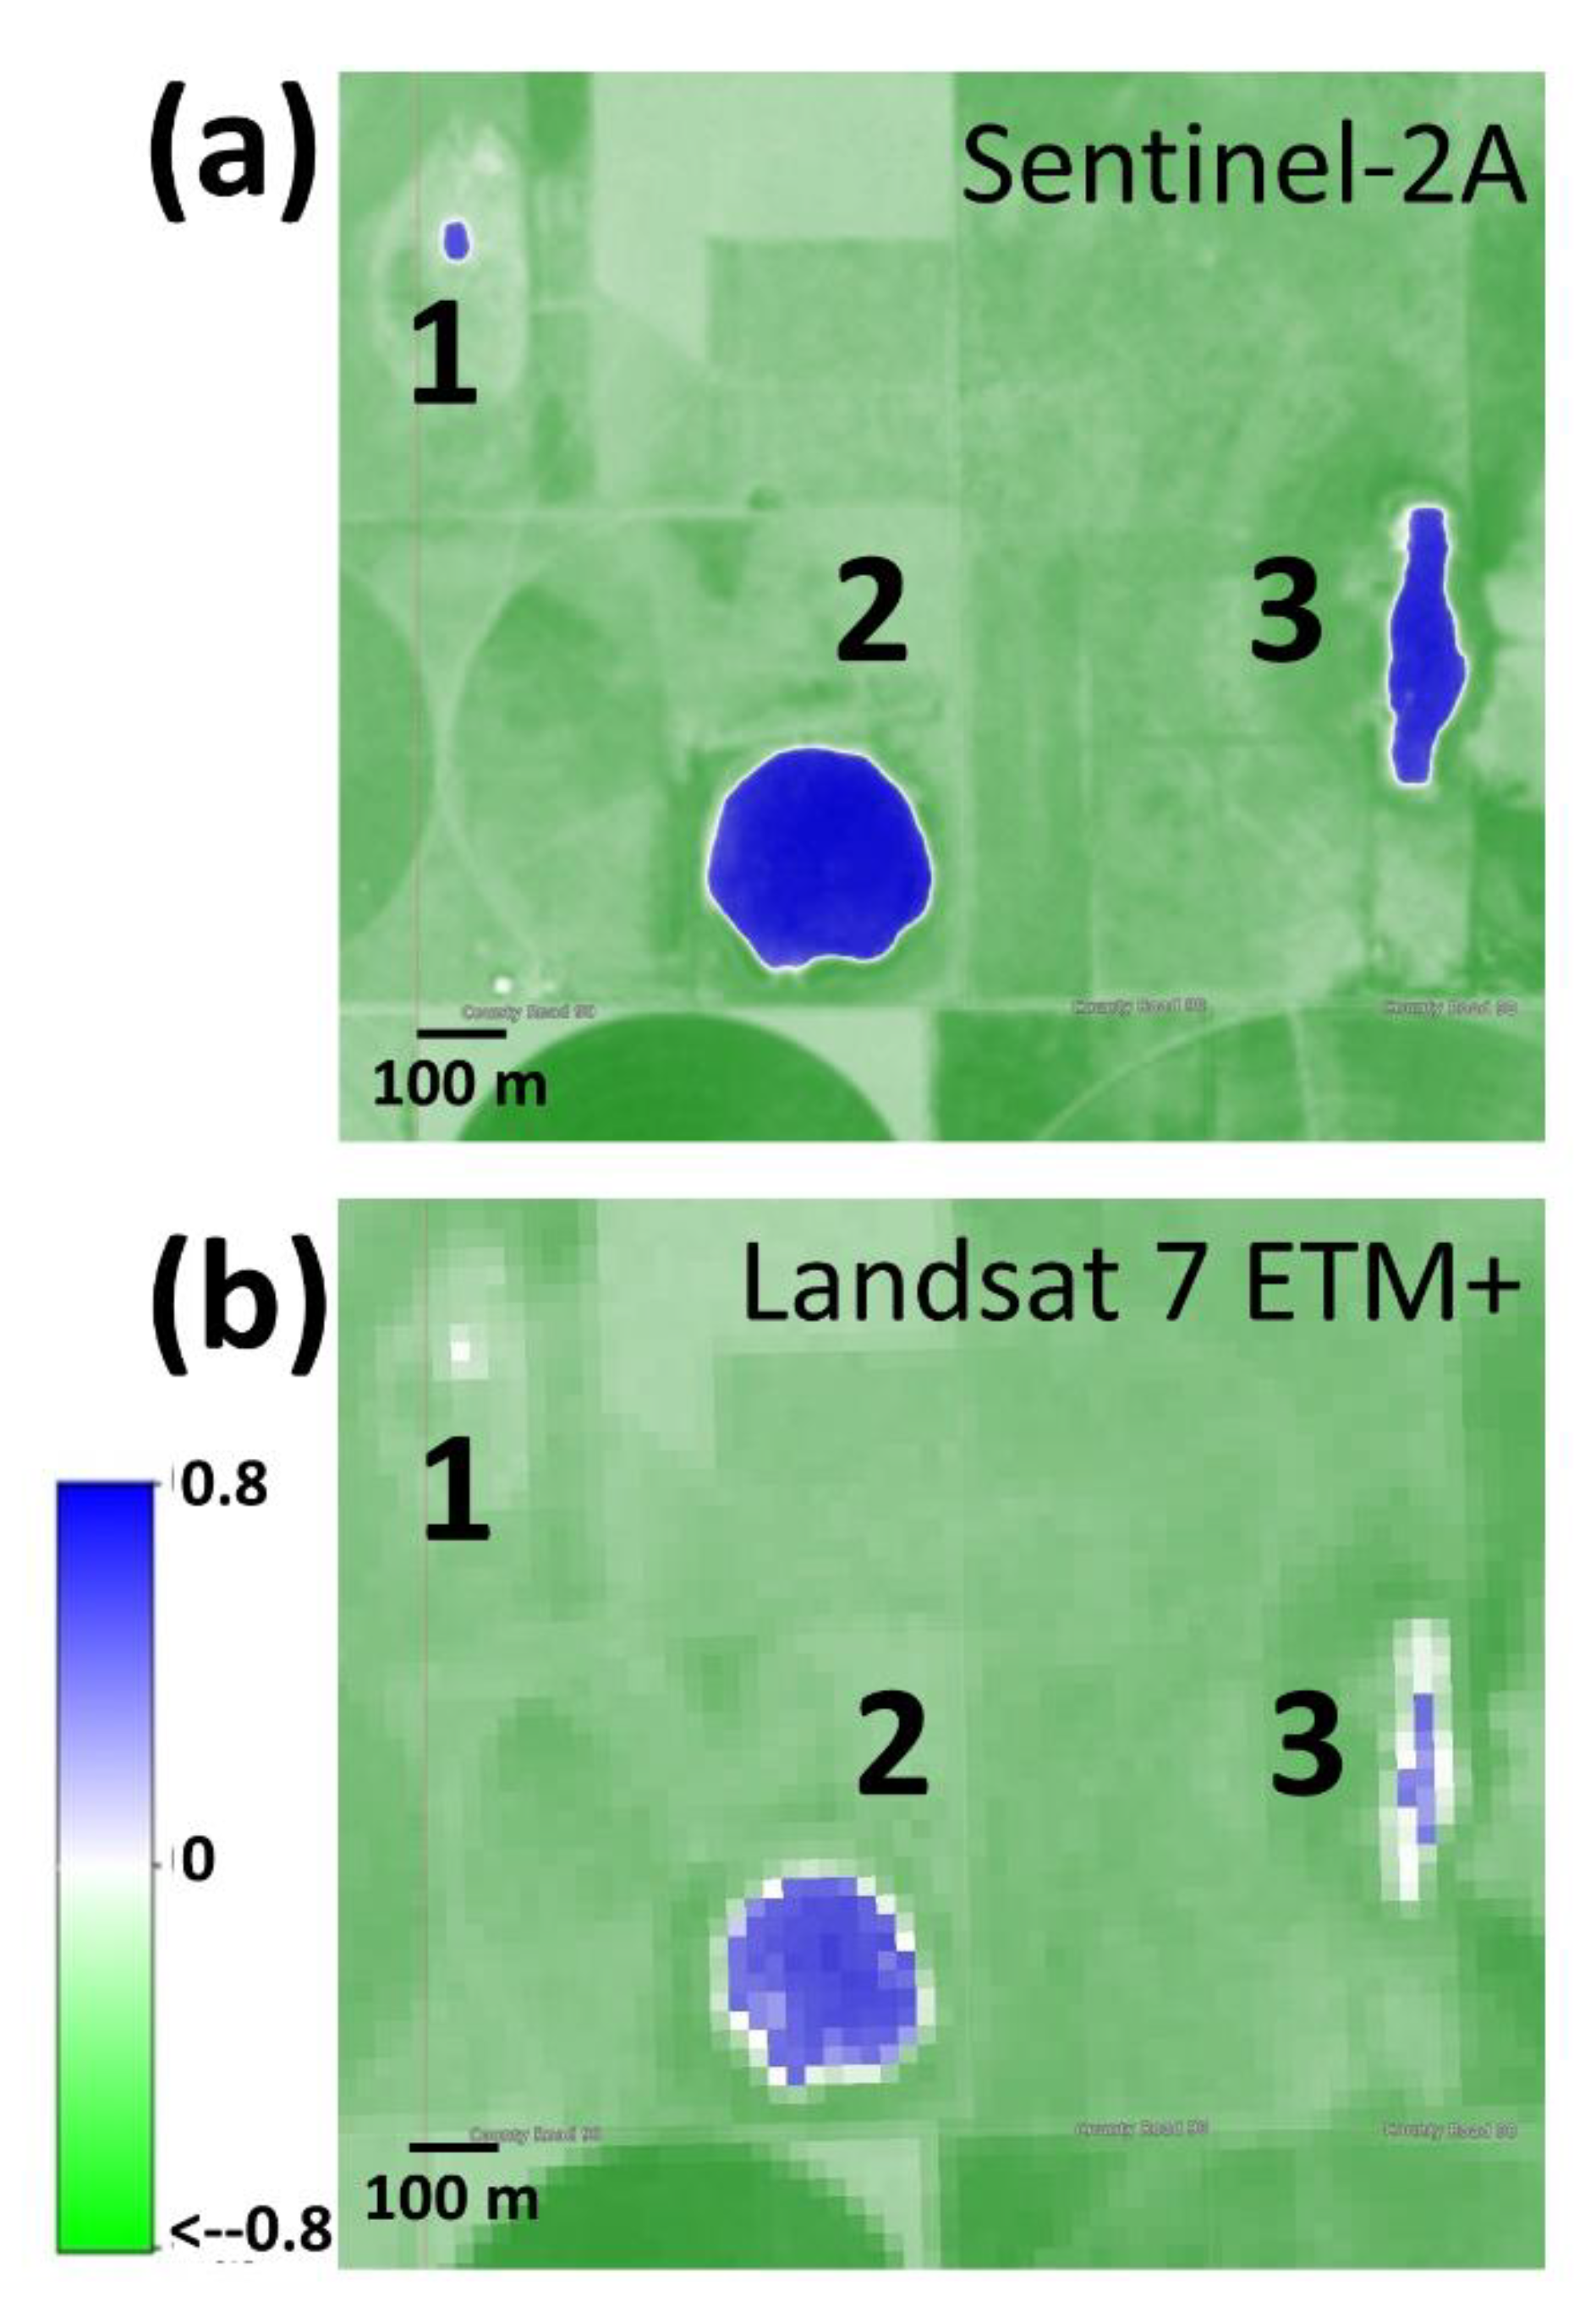
2.2. Sentinel-2A/B Satellite Imagery and Rainfall and Evaporation Data

The Sentinel-2 satellite mission is comprised of two sun-synchronous polar-orbiting satellites, phased at 180° to each other. The goal of the mission is to monitor land and ocean surface variability [19]. Sentinel-2A (Sentinel-2B) was launched by the European Space Agency (ESA) on 23 June 2015 (7 March 2017), each with a return frequency of ~10 days, such that data over any given area of the earth is obtained approximately every 5 days. The multispectral imager (MSI) on the Sentinel-2 satellite contains 13 spectral bands. These bands vary in wavelength from 442.7 nm to 2202.4 nm. The visible reflectance band images from these satellites (channels 2, 3, 4, 8) have a resolution of approximately 10 m, which is 3 times the resolution of previously widely utilized Landsat satellites [20].
For this study, the Sentinel-2A/B satellite data were downloaded through the Copernicus Open Access Hub maintained by the European Space Agency. A free account allowed easy downloading and retrieval of the satellite images. For this paper, 13 Sentinel-2A and Sentinel-2B satellite images from different days were analyzed between 25 September 2018 and 17 February 2019. A 2TB external hard drive provided adequate storage for storing the Sentinel-2 satellite images, which were 14.3 GB total in size (~1.1 GB per file). Each downloaded Sentinel-2A/B satellite data ZIP file (which contains 13 files for each of the 13 bands described below) was 10,980 pixels by 10,980 pixels, at 10 m resolution. A smaller 3000 by 3000 pixel subsection was selected for analysis in the selected 900 km2 study area.
Several precipitation and evaporation estimate datasets were also used in this study, including daily precipitation data from the National Climate Data Center (NCDC) for Plainview, Texas (for Region 1), as well as radar precipitation estimates from the Advanced Hydrologic Prediction Service (AHPS) website: https://water.weather.gov/precip/ (accessed on 1 June 2022). Monthly evaporation estimates from the Texas Water Development Board (TWDB) were obtained from the online download portal at: https://waterdatafortexas.org/lake-evaporation-rainfall (accessed on 15 July 2022). The TWDB provides evaporation estimates on gridded one-degree latitude by one-degree longitude quadrangles for the entire state of Texas. The ‘gross lake evaporation’ rate, which is defined as the ‘water loss caused by evaporation’ was derived from Class A pan evaporation data.

2.3. Processing Methodoloy for Water Classification and Surface Area Calculations

Only images without clouds were used in this study. The images were loaded into QGIS software and subsected into 30 km by 30 km tiles over the region of interest, as previously discussed. Then, pixels in the image indicating water were identified through image classification by the free, open source QGIS Semi-Automatic Classification Plugin (SACP) [21]. Obtaining accurate retrieval of images showing shallow, turbid, and muddy waters, such as playas, remains an active area of research [22,23,24,25,26], and no efforts were made in this pilot study to evaluate the accuracy of the SACP for playa water retrieval. For this study, visual analysis of the water bodies after widespread heavy rains confirmed that the SACP did capture playa water inundation for hundreds of playas, but more rigorous evaluation is needed for future work.
The SACP, which is a Python tool in the QGIS environment, has been shown to be an effective application tool for land and water cover classification [27]. The SACP allows the user to download the images and perform both unsupervised and supervised classification, either manually or automatically. The SACP computes the spectral signatures of selected training features in the images and then compares these against the spectral signatures of other pixels in the image. In our study, we used supervised classification, in which we manually selected multiple lake surfaces that were known to have filled with water after heavy rains to define or ‘train’ the SACP regarding what the spectral characteristics of the water surfaces should be, and these characteristics were then used to define inundated playa surfaces throughout the remainder of the image.
The spectral signatures of data from the various bands, 2, 3, 4, 5, 6, 7, 8, 8A, 11, and 12, from the multispectral imager (MSI) on the Sentinel-2A and 2B satellites were evaluated by the Semi-Automatic Classification Plugin [21]. Briefly, the exact processing steps were as follows: (1) the satellite raw band data were loaded into QGIS, (2) the raw band images were converted to reflectance values appropriate for Sentinel-2, (3) simple atmospheric correction using the DOS1 method (dark object subtraction) was applied [21], (3) the spectral signatures of each of the satellite bands were manually selected by clicking on multiple known water surfaces (to train for classification according to the range of the spectral signatures of shallow water surfaces), as well as known non-water surfaces, in multiple regions of interest (ROIs). Then, (4) using the default minimum distance classification algorithm in the QGIS classification plug-in, the spectral signatures of the manually selected water and non-water surface ROIs were used to classify the entire image as either water or non-water. A total of 41 images obtained during this period were not classified, either because they were cloudy, or because they were within a week or two of another available non-cloudy image. The classification output accuracy and ability to identify water surfaces was manually checked through visual analysis of the satellite imagery and classification of several know water surface areas. Raster math calculations in QGIS were then used to compute the water surface area in each of the Sentinel-2 satellite images.

3. Results

The Sentinel-2A/B satellite data was collected and processed over the 900 km2 study area to evaluate variations in water inundation of the several hundred observed playas during the 25 September 2018 to 17 February 2019 time period. Many of these playas would not be identified by the lower resolution Landsat Imagery used in many previous playa studies. Figure 2 provides a visual comparison of Sentinel-2A and Landsat 7 imagery, using the Normalized Water Difference Index (NDWI) [17], over a small region defined in Figure 1 with 3 different-sized playas. As can be clearly seen, a very small playa (playa 1 in Figure 2), with a diameter of less than 50 m, is clearly resolved by the 10 m resolution Sentinel-2A imagery (Figure 2a), but is not identified by the Landsat 7 imagery (Figure 2b). Similarly, the outline of a larger, elongated playa is well-characterized by Sentinel-2A, but poorly resolved by Landsat 7 (playa 3 in Figure 2). Finally, a large playa (diameter > 250 m, playa 2 in Figure 2) is resolved by both Sentinel-2A and Landsat 7; however, the full shape and edge regions are much better defined by Sentinel-2A. For determining the total surface area of playas, edge land contamination on the lower-resolution Landsat would also negatively bias the water inundation area estimates compared to the more defined playa edges resolved by the Sentinal-2 imagery.
The variations in playa inundation of the several hundred observed playas within the study region (Figure 1) during the 25 September 2018 to 17 February 2019 time period followed a realistic pattern based on the rainfall observed at a nearby weather station (Figure 3). Between 25 September and 20 October 2018, several weather systems each delivered 2.5–6.0 cm of rainfall (Figure 3). Prior to this rainfall, dry conditions resulted in only a few of the larger playas retaining water (Figure 1d). A rapid increase in the water area associated with playa inundation was observed across the region between late September and late October 2018 (Figure 1d,e and Figure 3). Between 25 September and 3 October, the total surface water area in the 900 km2 study area in West Texas, USA, increased from 1.1 to 8.2 square kilometers, with additional increases up to 14.5 km2 by 10 October. These increases in water surface area are attributed to two main rainfall events—one in late September and another ~9 October (Figure 3).
These two wet periods were then followed by a generally dry weather pattern through February 2019. The absence of significant precipitation from November 2018 through February 2019 implies that the steady observed rates of change (decreases) in playa lake surface area would be primarily driven by evaporation or groundwater infiltration (Figure 3). The available retrievals indicate temporal variations in the rate of decrease in water surface area, e.g., between 28 October and 19 November, the water surface areas average rate of decrease was ~0.33 km2 per day, whereas between 19 November and 17 February, the rate of decrease was ~0.08 square km2 per day (Figure 3). The rates of change in playa inundation were also observed to vary between playas of different sizes (not shown).
The time-varying estimates of playa inundation can be combined with precipitation, evaporation, and playa depth estimates to provide potential added value for ecological and hydrological applications, such as the total playa water volume for ecological habitat or aquifer recharge estimates (Table 1).
For this study, estimates of lake surface net evaporation are obtained by the Texas Water Development Board and may or may not be representative for playa surfaces with varying salinity. Moreover, we do not have enough detailed measurements of (1) playa lake depth, and (2) playa basin size and runoff efficiency (the playa basin area controls how quickly a playa fills up for a given amount of rain [28]) across the many hundreds of playas to create accurate water budgets for the playas without the use of additional remote sensing and in situ datasets. However, if we analyze the period from November 2018–January 2019, the rainfall was negligible, so the playa basin rainfall catchment can be ignored, as water would not be entering the playas and the only escape mechanisms would be evaporation and ground infiltration. The average depth of the playas in the study region is not well-known, but based on general observations of depth [29], we estimate them here to be around 20 cm in our study region in early November 2018, and we assume that the depth of the playa water then decreases at a constant rate proportional to the playa water surface area (this may or may not be a good approximation). Based on these assumptions, we calculate the playa volumes in Table 1 using a simple relationship:
Surface volume = surface area estimated from satellite data × estimated mean playa depth.
The changes in volume in the study region, due to either evaporation or ground infiltration, are then calculated using the following simple equation:
Change in volume due to evaporation = monthly change in water surface area estimated from satellite data × net surface evaporation.
Finally, the difference between the total playa volume each month and the change due to evaporation can be inferred to be ground infiltration. The results of these simple illustrative calculations demonstrate that the changes in playa volume are mainly driven by evaporation (about 70–85%), followed by percolation into the ground (15–30%). Better known observations or estimates of the aforementioned variables (playa depth, basin size, evaporation rates, etc.) are needed to confidently close the hydrological budget of the playas and make more useful estimates of the groundwater infiltration rates using the satellite inundation surface area measurements, but the previous discussion lays out a realistic scenario, provided the assumptions we chose are reasonable.
Even within the relatively small 900 km2 study area, large variations in playa inundation, driven by variations in rainfall, are observed. As an example, a period of heavy rainfall occurred in the study region (shown in Figure 1a) in West Texas, USA, between 15 June and 15 July 2021. The total rainfall in the region was highly variable, ranging between 5 and 18 cm over just 10 km (Figure 4). All playas in this region were observed to be dry in spring 2021 (not shown) with no surface water previous to the heavy rainfall in summer 2021. However, heavy thunderstorms in late June and early July 2021 resulted in significant increases in total playa inundation, and an increase in observed water surface area (15.23 km2 of playa lake surface area) was noted in the study (Figure 4)). However, those areas in the southeastern third of the region of interest, where less rainfall was observed, saw only minimal increases in water surface area, compared to large increases in the regions where the heaviest rainfall occurred (Figure 4).

4. Discussion

In this paper, we provide a preliminary framework for others to build upon. This short study leaves many questions unanswered for future research to consider. Future work will need to more carefully evaluate any limitations of using Sentinel-2 or other satellite imagery to monitor playas. In our study, many small playas had diameters around 50 m, with larger playa diameters of 300 m or more. Assuming a circular playa shape and edge detection errors of 10 m (one pixel) due to subpixel (half of pixel ground, half water, which will sometimes be detected as water, and sometimes as land) or other effects, this would result in possible area calculation errors in excess of 40% for small playas, with smaller estimated uncertainty (less than 10%) for larger diameter playas. To carefully evaluate the limitations of potential remote sensing errors, we recommend using in situ datasets to rigorously evaluate which water detection algorithms work best over the range of water depths, water colors, and water turbidity observed in shallow playas, to avoid biases or missed detections from the satellites of these complex surface features. A number of recent studies in the literature illustrate a wide range of potential errors and corrections that should be addressed, such as classification uncertainty [30], threshold detection errors [31], using frequency analyses of pixels rather than a single detection threshold (e.g., [32]), and combining the Sentinel-2 data with altimetric satellite missions to derive shoreline locations [33]. There are many possible avenues for future work, as there currently is no single universally approved detection algorithm for shallow lakes or wetlands, although the NDWI has been found to be problematic when used in shallow waters (e.g., [34]). The recent study by Jiang et al. [35] demonstrates a more sophisticated water detection methodology for use with water bodies of different clarity that could potentially be applied to playa lakes. Future work could also investigate blending the Sentinel-2 water surface area calculations with Sentinel-3 water level measurements, as demonstrated by recent studies [36], or using newly developed automated and hierarchical surface water fraction mapping developed by Wang et al. [37] for the thousands of playa lakes across the world. This limited demonstration study used a very simple manual classification detection algorithm, and made no attempt at evaluating uncertainties in either under- or over-detection, or at assessing the impacts of not resolving sub-pixel shoreline features, which would increase the potential errors in playa lake surface area calculations for small lakes nearing the detection limits (± 10 m). Some analysis of the impacts of aquatic plants and vegetation beneath the shallow water should also be considered [38,39,40]. Moreover, additional satellite platforms could also be considered in future work, including the proprietary Planet Scope and Worldview satellites (which have even higher temporal and spatial resolution than Sentinel-2). Recent studies have demonstrated using these platforms for the temporal classification of lake surfaces [41,42,43].
Evaluating spatial analyses of precipitation, in combination with the spatial analyses, may also help reveal which regions have adequate water in their playa lakes and which do not. The semi-arid climates that contain most of the world’s playas are also regions with high variability in precipitation intensity and frequency. One single large localized rainstorm might mean the difference between a playa filling up with much-needed water for several months, or occasionally, even a year or more, or remaining dry for months or even years. The high-resolution spatial and temporal data from the Sentinel-2 satellites can also be used with precipitation data to determine playa inundation on sub-monthly time scales for hydrological and ecological applications.
In addition to the monitoring of playa lake surface area from the Sentinel-2 satellites, the satellite reflectance signatures could potentially be utilized to evaluate changes in playa lake water quality, as changes in water turbidity are sometimes correlated with water quality. Recent work has already developed regression algorithms for using Sentinel-2 satellites as proxies for the water quality monitoring of agricultural reservoirs in Oklahoma [43], as well as for utilizing remote sensing reflectance signatures for developing a water quality index [44]. Coupling the satellite reflectance data with in situ water quality sensors for a ‘training set’ of playa lakes could potentially be used to obtain water quality information for many thousands of playas where installing in situ measurements for playa lake water quality is not feasible. Because the satellite reflectance signatures differ between waters of differing turbidity and quality, properties of the water quality or wetland vegetation types could potentially be estimated; this is also recommended for future applications of Sentinel-2 or similar resolution satellite imagery for investigating playa lakes.

5. Conclusions

Over the last 5 years, the improved spatial (and temporal) resolution of Sentinel-2 satellite imagery has allowed many small, variable inland water bodies, such as rivers, glacial lakes, and rice paddies, to be studied globally for the first time. This study is the first to the authors’ knowledge to demonstrate using Sentinel-2 satellite mission imagery to improve the monitoring of American Great Plains playa water inundation on sub-monthly time scales for ecological and hydrological applications. While many studies have documented the importance of the playa wetland ecosystems for wildlife in the American Great Plains, along with the variable infiltration and aquifer recharge rates occurring for different playas on the Great Plains, in situ monitoring of potential water inflow, evaporation, and infiltration rates for the many tens of thousands of North American Great Plains playas is simply not feasible due to the large number of small playas observed. The high-resolution Sentinel-2 mission satellite data, in combination with survey data on playa depth and nearby meteorological data (to determine evaporation rates), could be a major step forward in extensively and inexpensively quantifying the importance of playa lake groundwater recharge.
Evaluating the changes in specific playas across broad regions using satellite imaging on sub-monthly time scales may be useful for identifying playas with higher groundwater recharge potential (those that lose water more rapidly than others), and for analyzing periods when evaporation potential is low (such as during winter). Monitoring playas, as demonstrated in this short paper, would also be useful for ecological applications for determining the lakes that contain sufficient water to support wildlife, without requiring an airplane flyover or time-intensive field visits.

Author Contributions

Conceptualization, H.L.T., E.T.C. and W.J.R.; methodology, H.L.T., E.T.C., J.B.J. and N.L.H.; software, H.L.T. and E.T.C.; validation, H.L.T. and E.T.C.; formal analysis, H.L.T., E.T.C., J.B.J. and N.L.H.; investigation, H.L.T., E.T.C., J.B.J. and N.L.H.; resources, H.L.T. and E.T.C.; data curation, H.L.T. and E.T.C.; writing—original draft preparation, H.L.T., E.T.C., J.B.J. and N.L.H.; writing—review and editing, H.L.T., E.T.C., J.B.J. and N.L.H.; supervision, H.L.T., E.T.C., J.B.J. and N.L.H.; project administration, E.T.C. and H.L.T.; funding acquisition, E.T.C. and H.L.T. All authors have read and agreed to the published version of the manuscript.

Funding

This research was partially funded by a West Texas A&M University Kilgore graduate student research grant awarded to H.L.T. as part of her M.S. thesis research.

Institutional Review Board Statement

Not applicable.

Informed Consent Statement

Not applicable.

Data Availability Statement

Several publicly available datasets were used in this study. Satellite data from the Sentinel-2A and 2B satellites were freely downloaded from the European Space Agency (ESA) Copernicus Open Access Hub (https:scihub.copernicus.eu) (accessed on 1 June 2022). The QGIS software and Semi-Automatic Classification Plugin used in this study are also both freely available (https:qgis.org and https://plugins.qgis.org/plugins/SemiAutomaticClassificationPlugin/) (accessed on 1 June 2022). Radar derived precipitation estimate data was obtained from the National Weather Service Advanced Hydrological Prediction Service https://water.weather.gov/precip/ (accessed on 15 June 2022). Actual rainfall measurements from the National Weather Service Plainview Texas weather station were freely downloaded from Mesowest (https:mesowest.utah.edu) (accessed on 15 March 2022).

Acknowledgments

The authors are very thankful to the three anonymous expert reviewers whose time and effort improved this manuscript. The support of graduate school personnel and other faculty and staff at West Texas A&M University regarding the overall research efforts, including Angela Spaulding, Teresa Clemons, and Glenda Norton is acknowledged. West Texas A&M Information Technology also helped support the computing capabilities for research conducted at West Texas A&M. We also acknowledge the SentinelHub EO Browser for its help with creating Figure 2.

Conflicts of Interest

The authors declare no conflict of interest. The funders had no role in the design of the study; in the collection, analyses, or interpretation of data; in the writing of the manuscript, or in the decision to publish the results.

References

  1. Covich, A.P.; Fritz, S.C.; Lamb, P.J.; Marzolf, R.D.; Matthews, W.J.; Poiani, K.A.; Prepas, E.E.; Richman, M.B.; Winter, T.C. Potential effects of climate change on aquatic ecosystems of the Great Plains of North America. Hydrol. Process 1997, 11, 993–1021. [Google Scholar] [CrossRef]
  2. Starr, S.M.; McIntyre, N.E. Land-cover changes and influences on playa wetland inundation on the Southern High Plains. J. Arid Environ. 2020, 175, 104096. [Google Scholar] [CrossRef]
  3. Last, W. Paleochemistry and paleohydrology of Ceylon Lake, a salt-dominated playa basin in the northern Great Plains, Canada. J. Paleolimnol. 1990, 4, 219–238. [Google Scholar] [CrossRef]
  4. Smith, L.M. Playas of the Great Plains: Peter T. Flawn Endowment in Natural Resource Management and Conservation; University of Texas Press: Austin, TX, USA, 2003; Volume 3. [Google Scholar]
  5. Gurdak, J.J.; Roe, C.D. Recharge rates and chemistry beneath playas of the High Plains aquifer, USA. Hydrogeol. J. 2010, 18, 1747–1772. [Google Scholar] [CrossRef]
  6. McKenna, O.P.; Sala, O. Groundwater recharge in desert playas: Current rates and future effects of climate change. Environ. Res. Lett. 2018, 13, 014025. [Google Scholar] [CrossRef]
  7. McIntyre, N.E.; Wright, C.K.; Swain, S.; Hayhoe, K.; Liu, G.; Schwartz, F.W.; Henebry, G.M. Climate forcing of wetland landscape connectivity in the Great Plains. Front. Ecol. Environ. 2014, 12, 59–64. [Google Scholar] [CrossRef]
  8. Castañeda, C.; Herrero, J.; Casterad, M.A. Landsat monitoring of playa-lakes in the Spanish Monegros desert. J. Arid Environ. 2005, 63, 497–516. [Google Scholar] [CrossRef] [Green Version]
  9. French, R.H.; Miller, J.J.; Dettling, C.; Carr, J.R. Use of remotely sensed data to estimate the flow of water to a playa lake. J. Hydrol. 2006, 325, 67–81. [Google Scholar] [CrossRef]
  10. Collins, S.D.; Heintzman, L.J.; Starr, S.M.; Wright, C.K.; Henebry, G.M.; McIntyre, N.E. Hydrological dynamics of temporary wetlands in the southern Great Plains as a function of surrounding land use. J. Arid Environ. 2014, 109, 6–14. [Google Scholar] [CrossRef]
  11. Walker, D.; Smigaj, M.; Jovanovic, N. Ephemeral sand river flow detection using satellite optical remote sensing. J. Arid Environ. 2019, 168, 17–25. [Google Scholar] [CrossRef]
  12. Yang, X.; Chen, Y.; Wang, J. Combined use of Sentinel-2 and Landsat 8 to monitor water surface area dynamics using Google Earth Engine. Remote Sens. Lett. 2020, 11, 687–696. [Google Scholar] [CrossRef]
  13. Li, M.; Hong, L.; Guo, J.; Zhu, A. Automated Extraction of Lake Water Bodies in Complex Geographical Environments by Fusing Sentinel-1/2 Data. Water 2022, 14, 30. [Google Scholar] [CrossRef]
  14. Chen, Q.; Liu, W.; Huang, C. Long-Term 10 m Resolution Water Dynamics of Qinghai Lake and the Driving Factors. Water 2022, 14, 671. [Google Scholar] [CrossRef]
  15. Eibedingil, I.G.; Gill, T.E.; Van Pelt, R.S.; Tong, D.Q. Combining Optical and Radar Satellite Imagery to Investigate the Surface Properties and Evolution of the Lordsburg Playa, New Mexico, USA. Remote Sens. 2021, 13, 3402. [Google Scholar] [CrossRef]
  16. Doña, C.; Morant, D.; Picazo, A.; Rochera, C.; Sánchez, J.M.; Camacho, A. Estimation of Water Coverage in Permanent and Temporary Shallow Lakes and Wetlands by Combining Remote Sensing Techniques and Genetic Programming: Application to the Mediterranean Basin of the Iberian Peninsula. Remote Sens. 2021, 13, 652. [Google Scholar] [CrossRef]
  17. Mcfeeters, S.K. The use of normalized difference water index (NDWI) in the delineation of open water features. Int. J. Remote Sens. 1996, 17, 1425. [Google Scholar] [CrossRef]
  18. Huang, C.; Chen, Y.; Zhang, S.; Wu, J. Detecting, extracting, and monitoring surface water from space using optical sensors: A review. Rev. Geophys. 2018, 56, 333–360. [Google Scholar] [CrossRef]
  19. Drusch, M.; Del Bello, U.; Carlier, S.; Colin, O.; Fernandez, V.; Gascon, F.; Hoersch, B.; Isola, C.; Laberinti, P.; Martimort, P.; et al. Sentinel-2: ESA’s optical high-resolution mission for GMES operational services. Remote Sens. Environ. 2012, 120, 25–36. [Google Scholar] [CrossRef]
  20. Mandanici, E.; Bitelli, G. Preliminary Comparison of Sentinel-2 and Landsat 8 Imagery for a Combined Use. Remote Sens. 2016, 8, 1014. [Google Scholar] [CrossRef] [Green Version]
  21. Congedo, L. Semi-Automatic Classification Plugin: A Python tool for the download and processing of remote sensing images in QGIS. J. Open Source Softw. 2021, 6, 3172. [Google Scholar] [CrossRef]
  22. Ghobadi, Y.; Pradhan, B.; Shafri, H.Z.M.; Bin Ahmad, N.; Kabiri, K. Spatio-temporal remotely sensed data for analysis of the shrinkage and shifting in the Al Hawizeh wetland. Environ. Monit. Assess. 2014, 187, 4156. [Google Scholar] [CrossRef] [PubMed]
  23. Reif, M.; Frohn, R.C.; Lane, C.R.; Autrey, B. Mapping Isolated Wetlands in a Karst Landscape: GIS and Remote Sensing Methods. GIScience Remote Sens. 2009, 46, 187–211. [Google Scholar] [CrossRef]
  24. Rokni, K.; Ahmad, A.; Selamat, A.; Hazini, S. Water Feature Extraction and Change Detection Using Multitemporal Landsat Imagery. Remote Sens. 2014, 6, 4173–4189. [Google Scholar] [CrossRef] [Green Version]
  25. Sánchez-Espinosa, A.; Schröder, C. Land use and land cover mapping in wetlands one step closer to the ground: Sentinel-2 versus landsat 8. J. Environ. Manag. 2019, 247, 484–498. [Google Scholar] [CrossRef] [PubMed]
  26. Wu, G.; Xiao, X.; Liu, Y. Satellite-Based Surface Water Storage Estimation: Its History, Current Status, and Future Prospects. IEEE Geosci. Remote Sens. Mag. 2022, 2–23. [Google Scholar] [CrossRef]
  27. Tempa, K.; Aryal, K.R. Semi-automatic classification for rapid delineation of the geohazard-prone areas using Sentinel-2 satellite imagery. SN Appl. Sci. 2022, 4, 141. [Google Scholar] [CrossRef]
  28. Howell, N.L.; Butler, E.B.; Guerrero, B. Water quality variation with storm runoff and evaporation in playa wetlands. Sci. Total Environ. 2018, 652, 583–592. [Google Scholar] [CrossRef]
  29. Anderson, J.T.; Smith, L.M. The effect of flooding regimes on decomposition of Polygonum pensylvanicum in playa wetlands (Southern Great Plains, USA). Aquat. Bot. 2002, 74, 97–108. [Google Scholar] [CrossRef]
  30. Dronova, I.; Gong, P.; Wang, L. Object-based analysis and change detection of major wetland cover types and their classification uncertainty during the low water period at Poyang Lake, China. Remote Sens. Environ. 2011, 115, 3220–3236. [Google Scholar] [CrossRef]
  31. Reis, L.G.d.M.; Souza, W.d.O.; Ribeiro Neto, A.; Fragoso, C.R., Jr.; Ruiz-Armenteros, A.M.; Cabral, J.J.d.S.P.; Montenegro, S.M.G.L. Uncertainties involved in the use of thresholds for the detection of water bodies in multitemporal analysis from Landsat-8 and Sentinel-2 Images. Sensors 2021, 21, 7494. [Google Scholar] [CrossRef]
  32. Borro, M.; Morandeira, N.; Salvia, M.; Minotti, P.; Perna, P.; Kandus, P. Mapping shallow lakes in a large South American floodplain: A frequency approach on multitemporal Lansat TM/ETM data. J. Hydrol. 2014, 512, 39–52. [Google Scholar] [CrossRef]
  33. Li, X.; Long, D.; Huang, Q.; Han, P.; Zhao, F.; Wada, Y. High-temporal-resolution water level and storage change data sets for lakes on the Tibetan Plateau during 2000–2017 using multiple altimetric missions and Landsat-derived lake shoreline positions. Earth Syst. Sci. Data 2019, 11, 1603–1627. [Google Scholar] [CrossRef] [Green Version]
  34. Singh, K.; Ghosh, M.; Sharma, S.R. WSB-DA: Water surface boundary detection algorithm using Landsat 8 OLI data. IEEE J. Sel. Top Appl. Earth Obs. Remote Sens. 2015, 9, 363–368. [Google Scholar] [CrossRef]
  35. Jiang, W.; Ni, Y.; Pang, Z.; Li, X.; Ju, H.; He, G.; Lv, J.; Yang, K.; Fu, J.; Qin, X. An Effective Water Body Extraction Method with New Water Index for Sentinel-2 Imagery. Water 2021, 13, 1647. [Google Scholar] [CrossRef]
  36. Gourgouletis, N.; Bariamis, G.; Anagnostou, M.N.; Baltas, E. Estimating Reservoir Storage Variations by Combining Sentinel-2 and 3 Measurements in the Yliki Reservoir, Greece. Remote Sens. 2022, 14, 1860. [Google Scholar] [CrossRef]
  37. Wang, Y.; Li, X.; Zhou, P.; Jiang, L.; Du, Y. AHSWFM: Automated and Hierarchical Surface Water Fraction Mapping for Small Water Bodies Using Sentinel-2 Images. Remote Sens. 2022, 14, 1615. [Google Scholar] [CrossRef]
  38. Zhang, F.; Wang, J.; Wang, X. Recognizing the Relationship between Spatial Patterns in Water Quality and Land-Use/Cover Types: A Case Study of the Jinghe Oasis in Xinjiang, China. Water 2018, 10, 646. [Google Scholar] [CrossRef] [Green Version]
  39. Jiang, X.; Wang, J.; Liu, X.; Dai, J. Landsat Observations of Two Decades of Wetland Changes in the Estuary of Poyang Lake during 2000–2019. Water 2022, 14, 8. [Google Scholar] [CrossRef]
  40. Soria, J.; Ruiz, M.; Morales, S. Monitoring Subaquatic Vegetation Using Sentinel-2 Imagery in Gallocanta Lake (Aragón, Spain). Earth 2022, 3, 363–382. [Google Scholar] [CrossRef]
  41. Tuzcu, A.; Taskin, G.; Musaoğlu, N. Comparison of Object Based Machine Learning Classifications of Planetscope and WORLDVIEW-3 Satellite Images for Land Use/Cover. Int. Arch. Photogramm. Remote Sens. Spat. Inf. Sci. 2019, 42, 1887–1892. [Google Scholar] [CrossRef] [Green Version]
  42. Qayyum, N.; Ghuffar, S.; Ahmad, H.M.; Yousaf, A.; Shahid, I. Glacial Lakes Mapping Using Multi Satellite Planet Scope Imagery and Deep Learning. ISPRS Int. J. Geo-Inf. 2020, 9, 560. [Google Scholar] [CrossRef]
  43. Mansaray, A.S.; Dzialowski, A.R.; Martin, M.E.; Wagner, K.L.; Gholizadeh, H.; Stoodley, S.H. Comparing PlanetScope to Landsat-8 and Sentinel-2 for Sensing Water Quality in Reservoirs in Agricultural Watersheds. Remote Sens. 2021, 13, 1847. [Google Scholar] [CrossRef]
  44. Zhang, F.; Chan, N.W.; Liu, C.; Wang, X.; Shi, J.; Kung, H.-T.; Li, X.; Guo, T.; Wang, W.; Cao, N. Water Quality Index (WQI) as a Potential Proxy for Remote Sensing Evaluation of Water Quality in Arid Areas. Water 2021, 13, 3250. [Google Scholar] [CrossRef]
Figure 1. (a). Map of 30 km by 30 km study area (shown in brown square) in West Texas, USA (upper right inset). True color imagery of the study area for (b) 25 September 2018 and (c) 28 October 2018. The corresponding classified water surface area (water represented by blue colored areas, while all non-water surfaces are represented by green colored areas) for (d) 25 September 2018 and (e) 28 October 2018. The yellow dot in (a) represents the area shown in Figure 2.
Water 14 02314 g001
Figure 2. (a). Sentinel-2A imagery of the Normalized Difference Water Index (NDWI) for the location denoted with a yellow dot in Figure 1 on 22 September 2021, and (b) Landsat 7 ETM+ NDWI imagery from the same location on 19 September 2021. Blue areas represent water, while green areas indicate non-water areas. The 3 playas referenced in the text are indicated by the numbers 1–3. NDWI is processed by Sentinel Hub. The imagery contains modified European Space Agency Copernicus Sentinel data processed by Sentinel Hub, and Landsat 7 images are courtesy of the U.S. Geological Survey, processed by Sentinel Hub.
Water 14 02314 g002
Figure 3. Observed surface water area (blue bar graph, in square kilometers) calculated for the 30 × 30 km square region shown in the brown square in Figure 1a for the period between 25 September 2018 and 17 February 2019. Missing dates are due to either cloud cover or data not being analyzed, as indicated on the plots. The corresponding cumulative precipitation at Plainview, Texas (in inches), is indicated by a green solid line (data courtesy of the National Weather Service through Mesowest https://mesowest.utah.edu (accessed on 15 March 2022).
Water 14 02314 g003
Figure 4. Playa lake surface area and radar-estimated precipitation for the 30 × 30 km square region shown in Figure 1a (and delineated here by the blue square). Playa water surface area for 9 July 2021 within the blue square is denoted in blue and calculated using the QGIS Semi-Automatic Classification Plugin [16,21]. The underlying map of radar-estimated rainfall between 15 June and 14 July 2021 is courtesy of the National Weather Service Advanced Hydrological Prediction Service https://water.weather.gov/precip/ (accessed on 15 March 2022).
Water 14 02314 g004
Table 1. Approximation of total surface evaporation and playa volume in the study region between November 2018–January 2019. See text for description of assumptions used.
MonthNet Surface Evaporation (Rainfall Minus Evaporation (cm))Estimated Playa Volume in Study Region 1Estimated Changes from Previous Month in Playa Volume Due to Evaporative Loss 1Estimated Changes from Previous Month in Playa Volume Due to Ground Infiltration 1
November 2018−7.92.25 × 106 m3----
December 2018−5.51.35 × 106 m37.9 × 105 m31.1 × 105 m3
January 2019−6.40.8 × 106 m34.3 × 105 m31.2 × 105 m3
1 Note that this table is shown for illustrative purposes only, and all calculations in this table are based merely on approximations and assumptions.
Publisher’s Note: MDPI stays neutral with regard to jurisdictional claims in published maps and institutional affiliations.

