
Photocatalytic Dye Degradation and Bio-Insights of Honey-Produced α-Fe2O3 Nanoparticles

 , and
, and 
Abstract
:1. Introduction
2. Materials and Methods
2.1. Materials
2.2. Synthesis Method
2.3. Characterizations
2.4. Antimicrobial Activity
2.5. Photocatalytic Activity
3. Result and Discussion
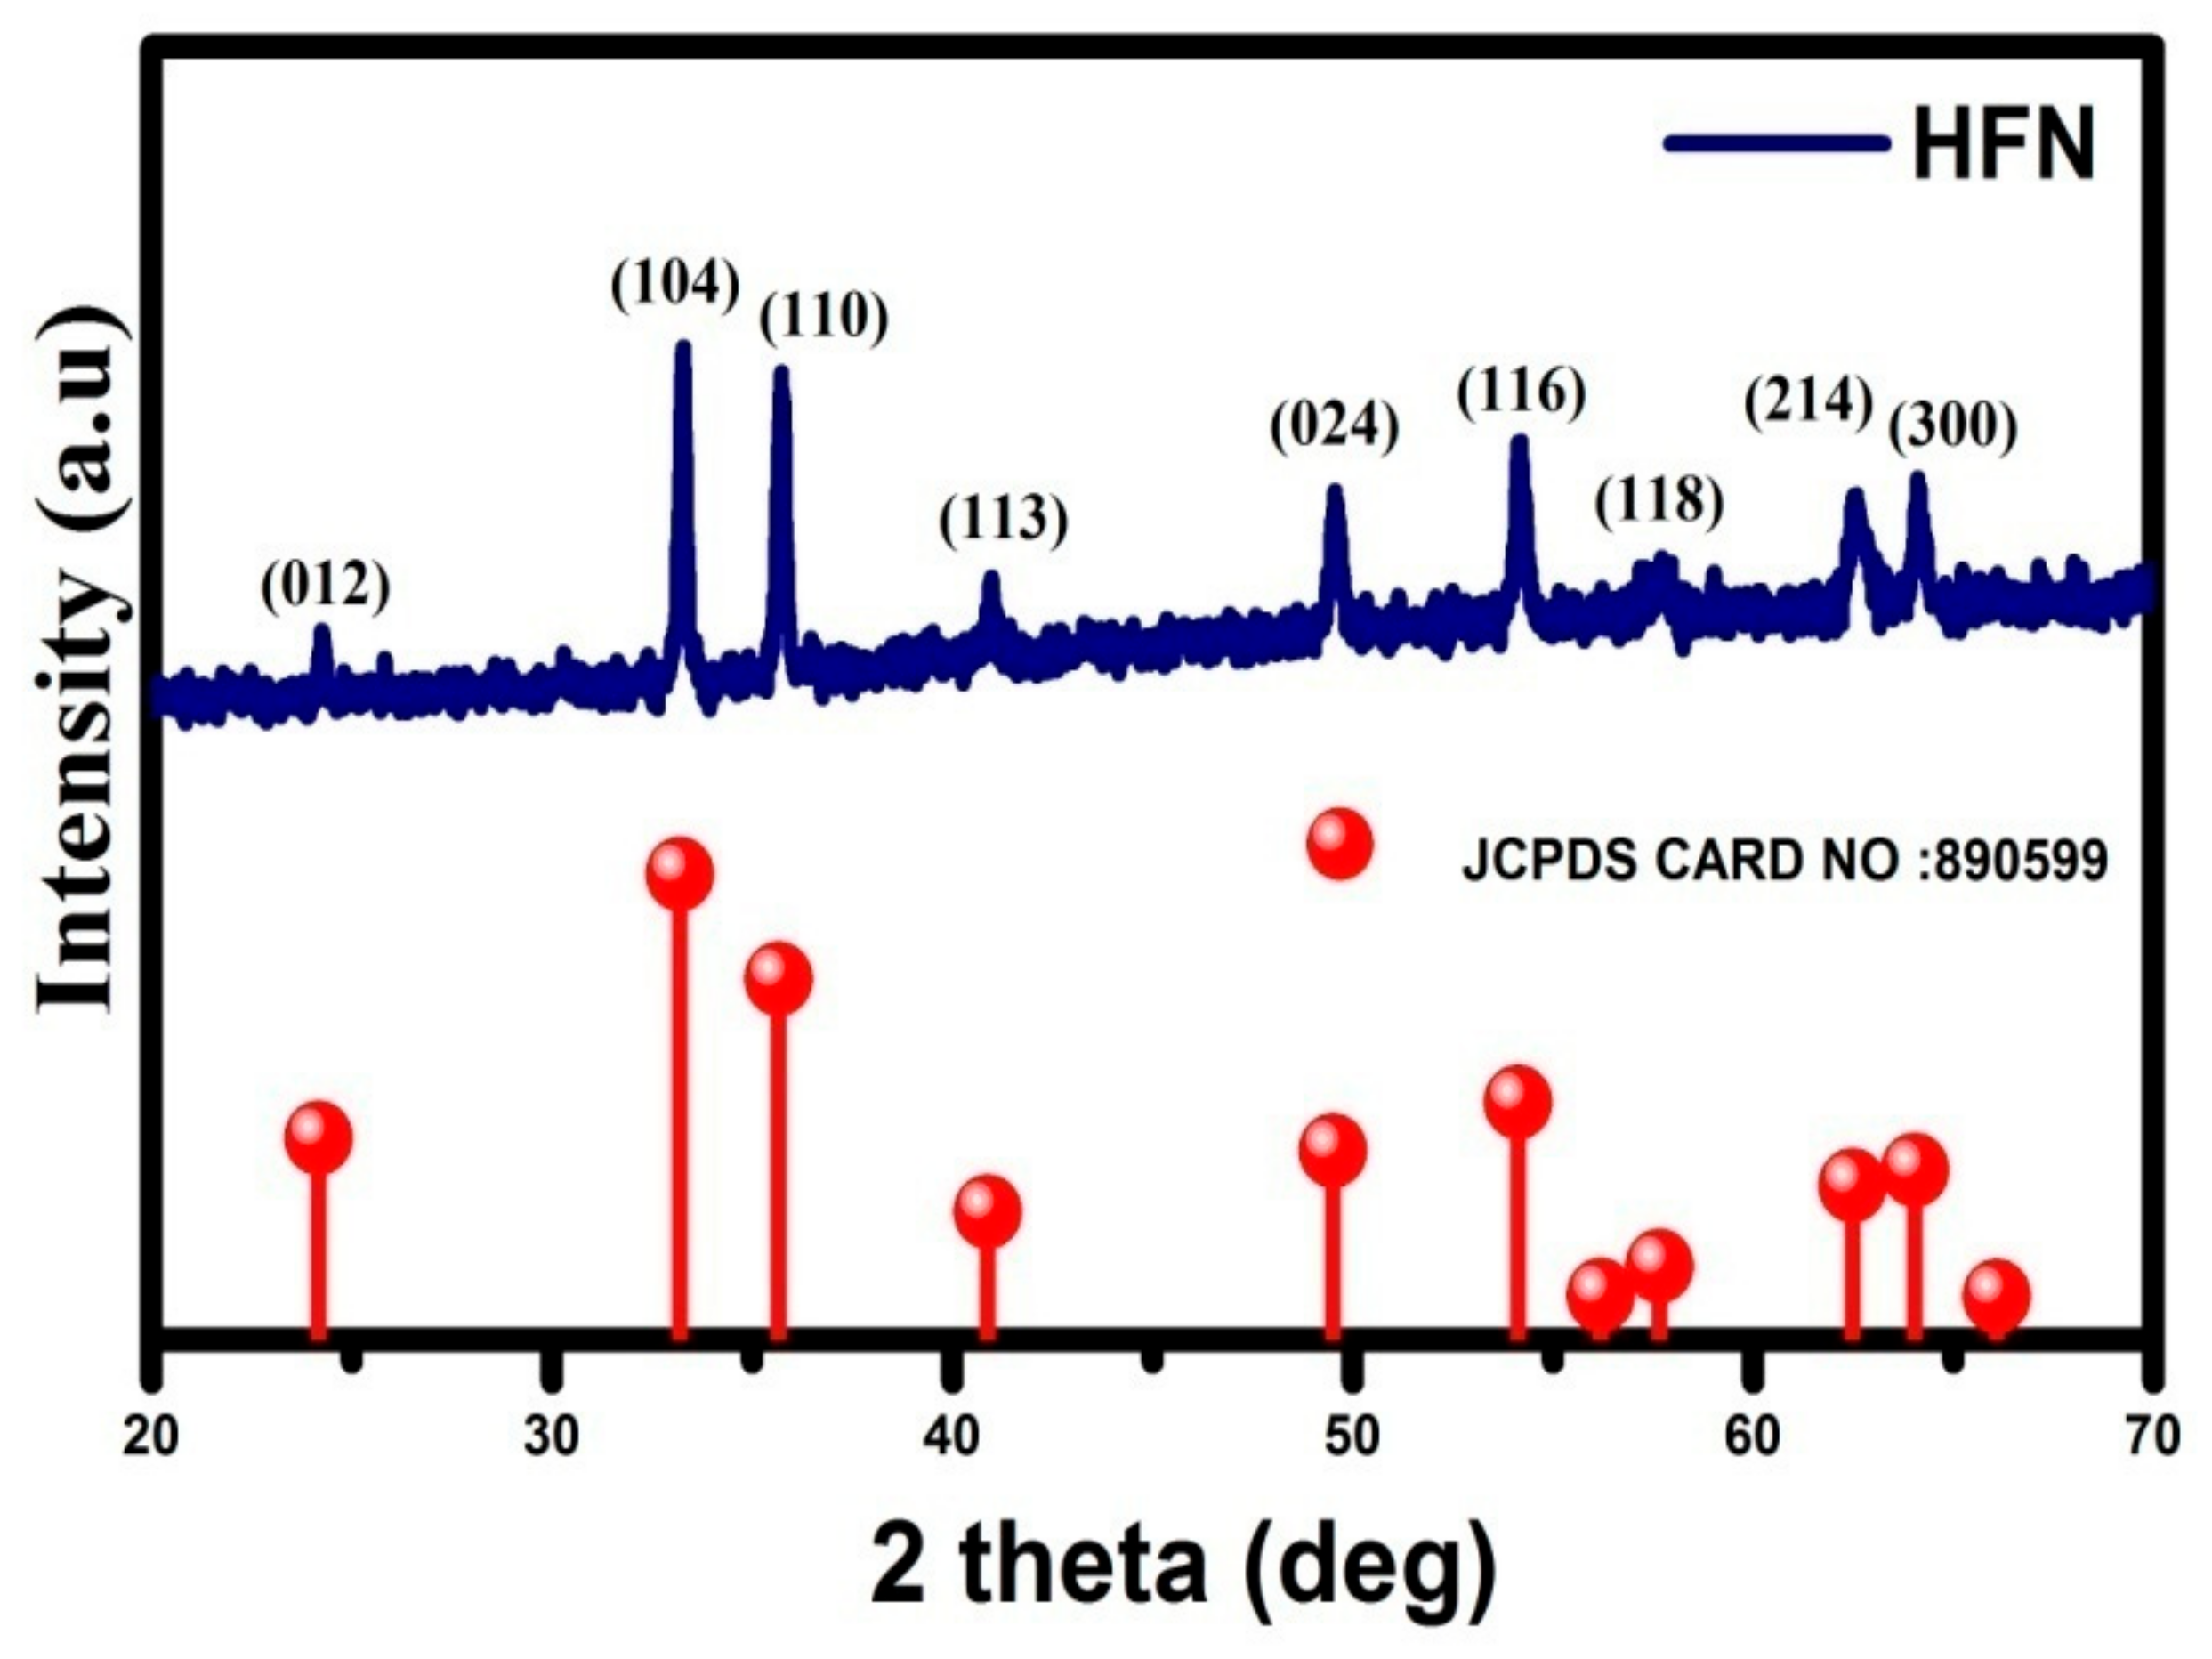
3.1. XRD Analysis
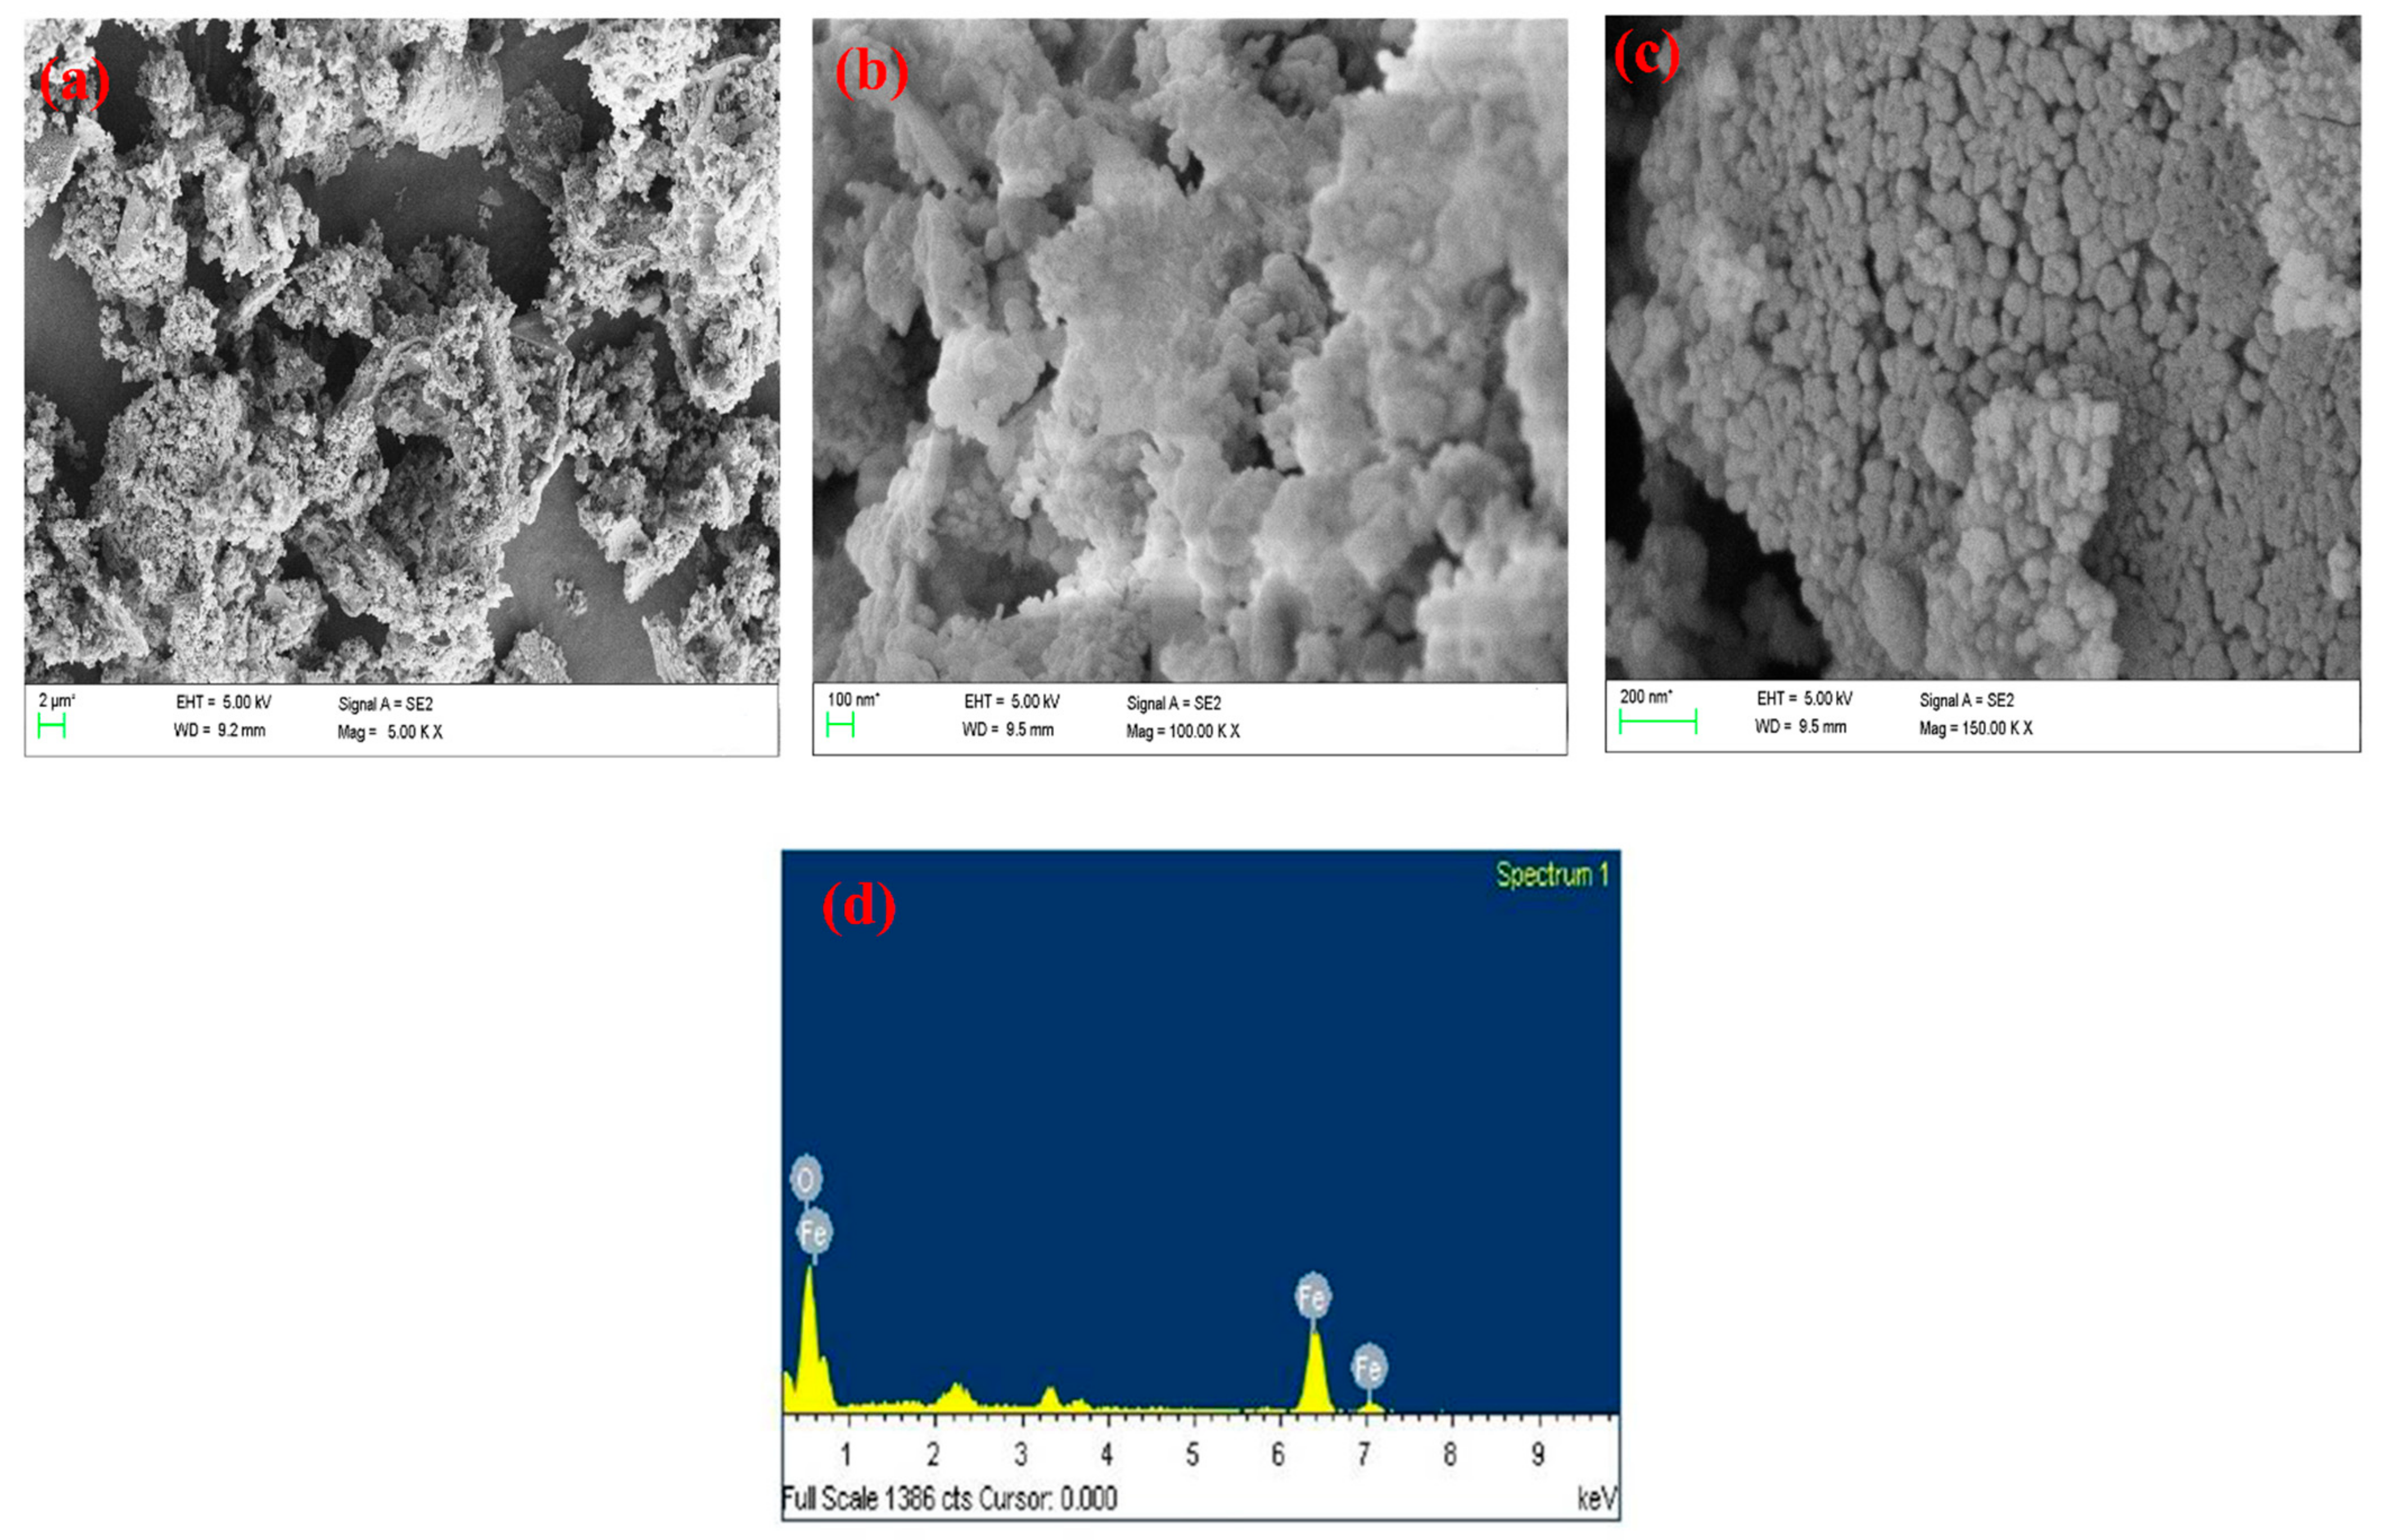
3.2. FESEM Analysis
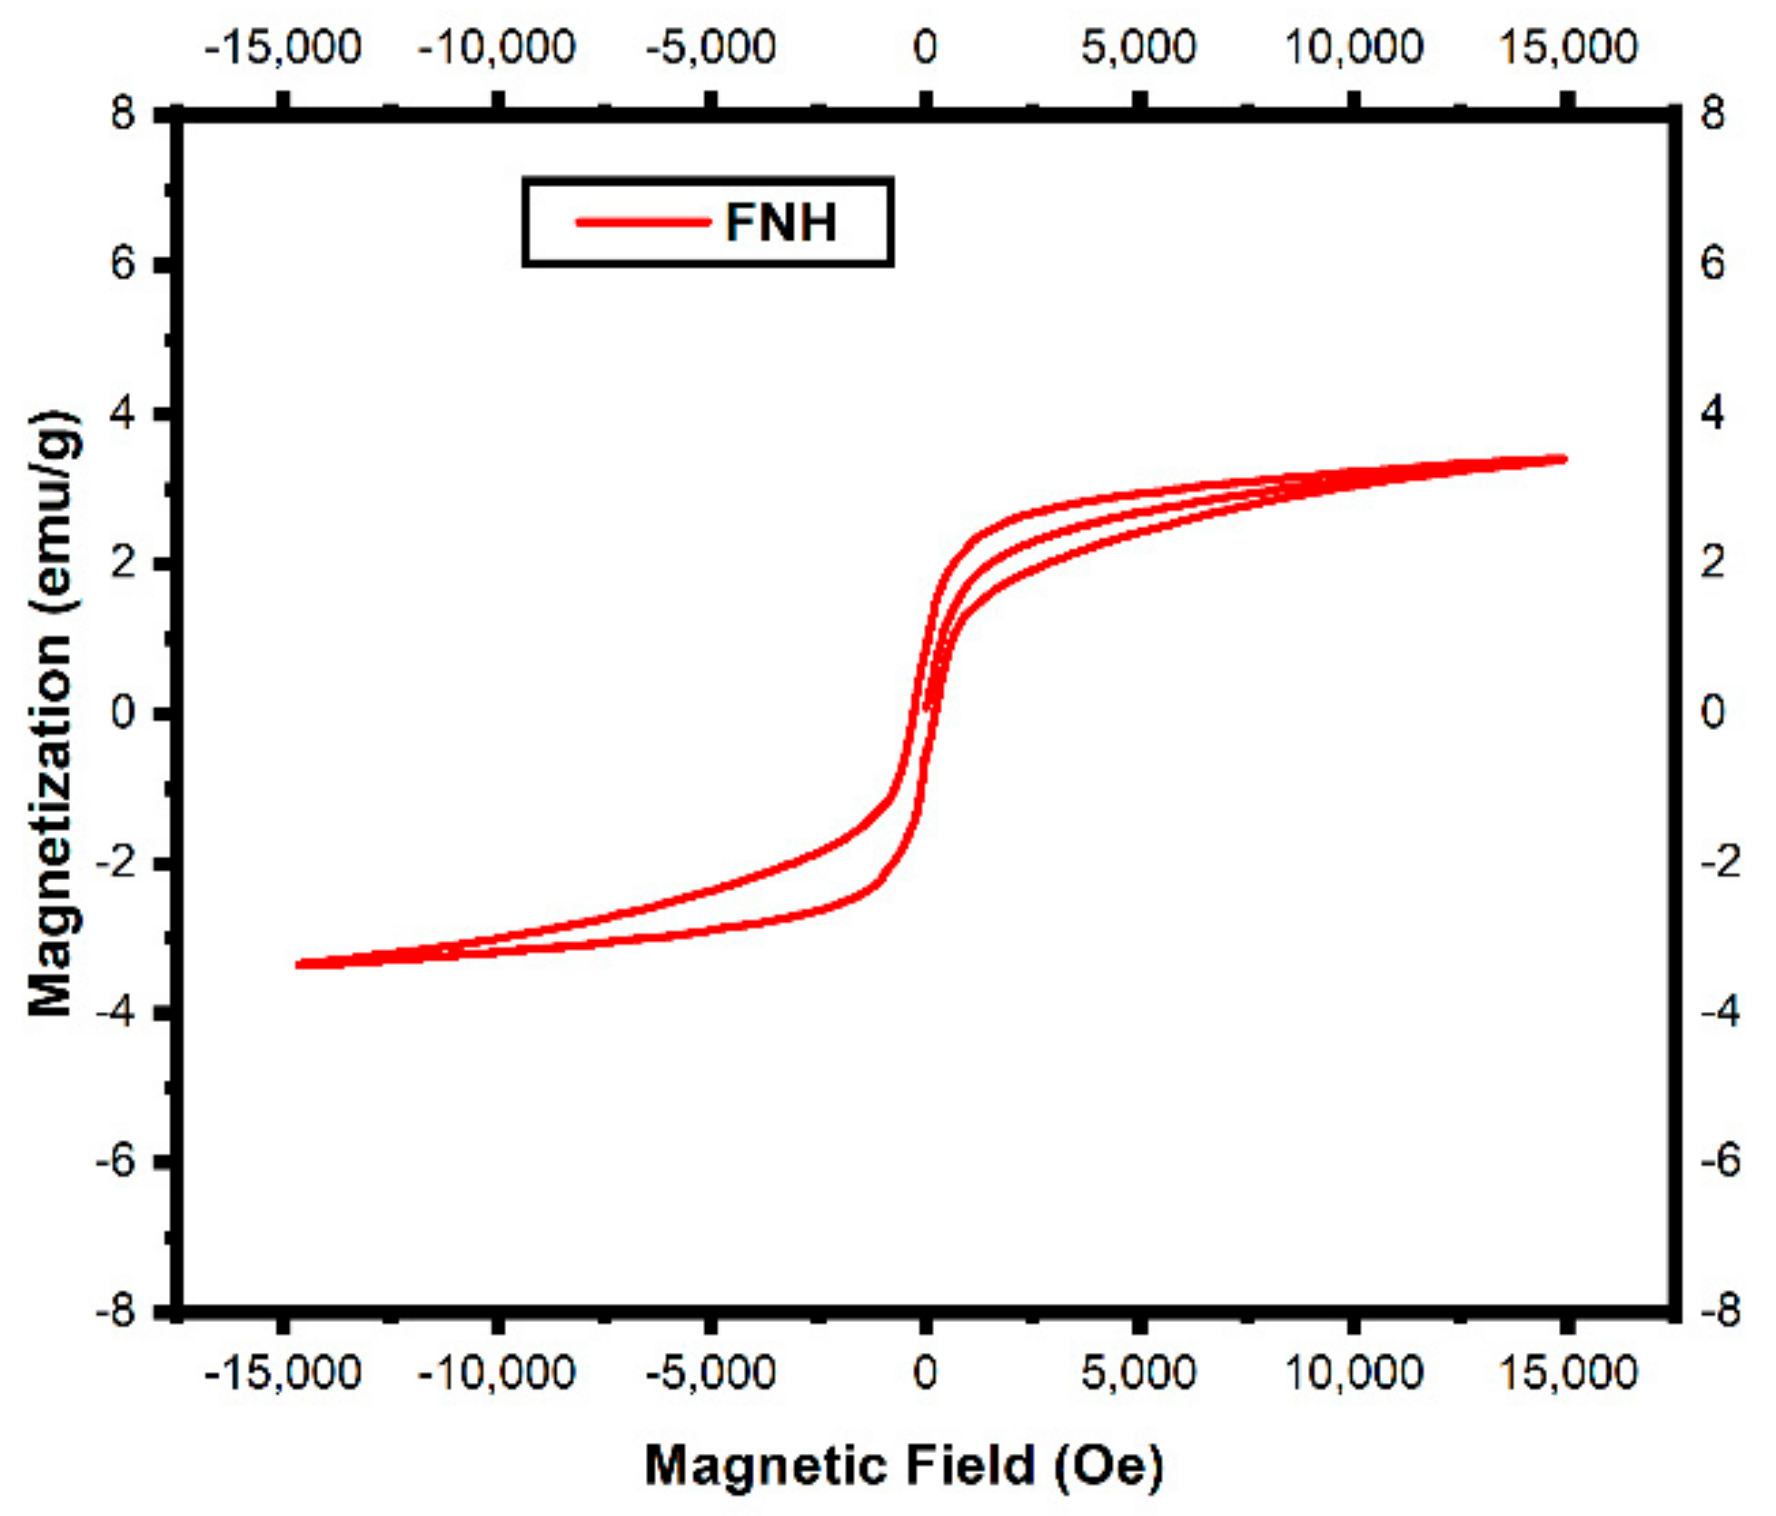
3.3. VSM Analysis
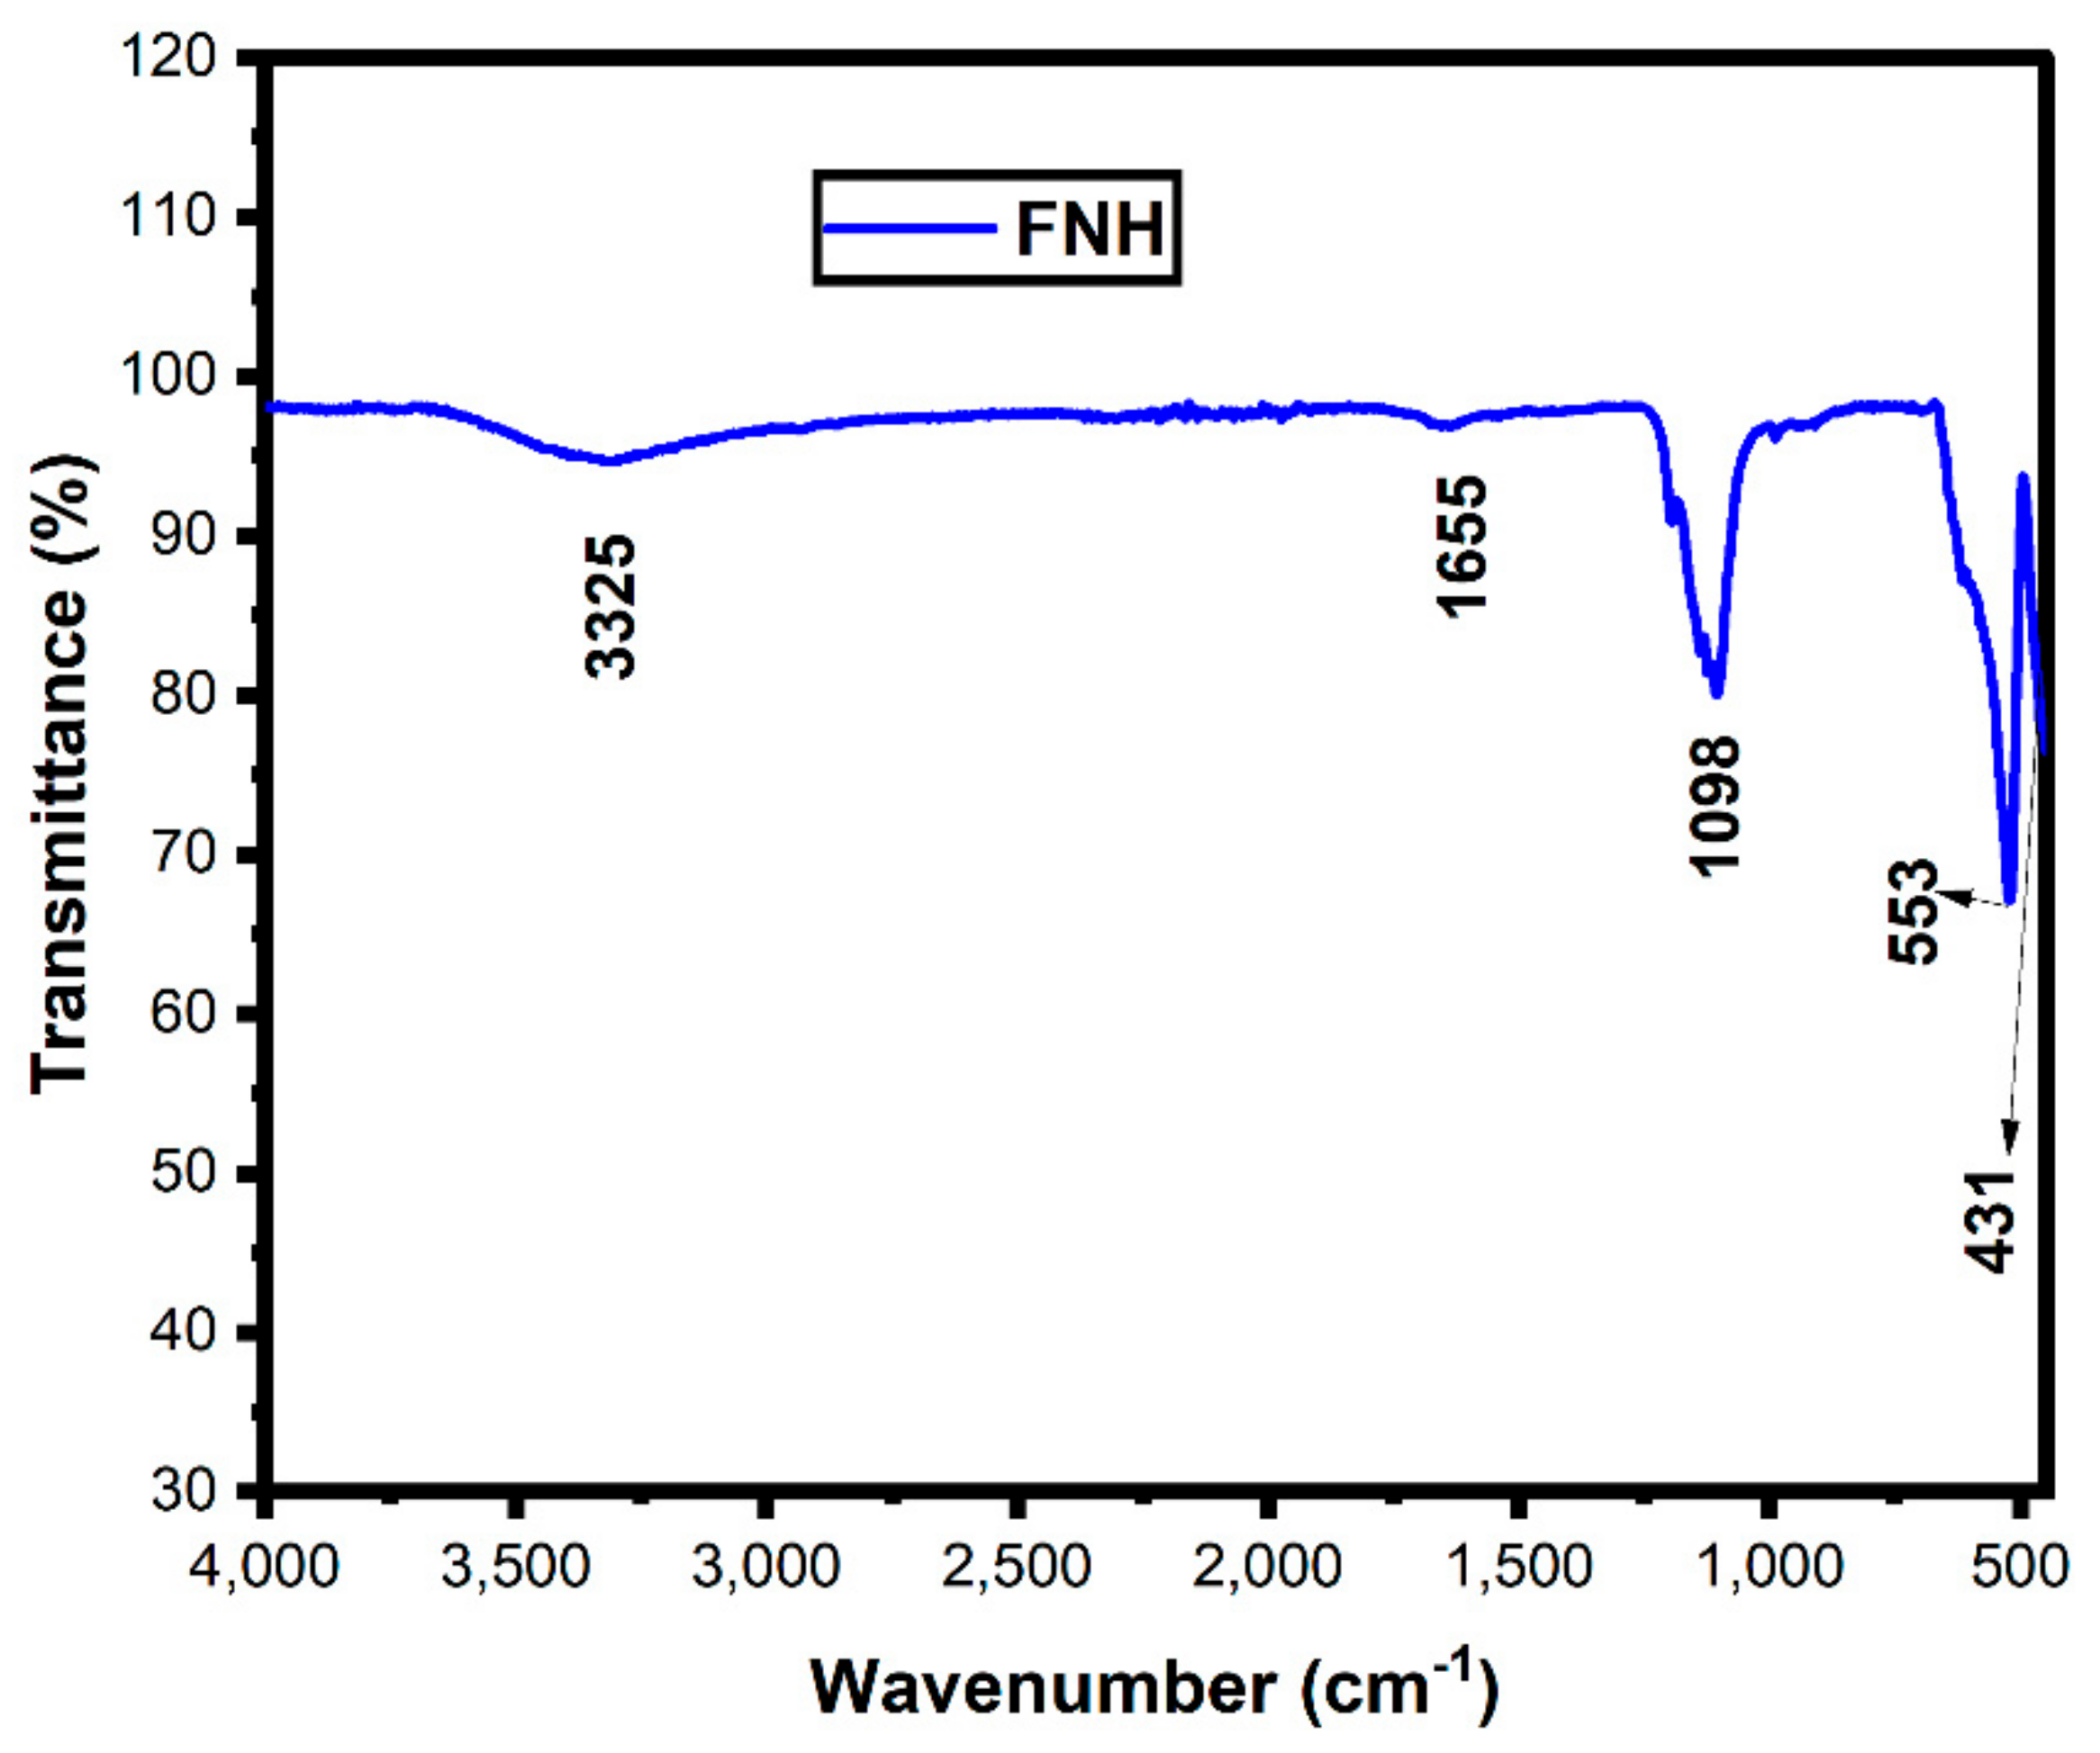
3.4. FTIR Analysis
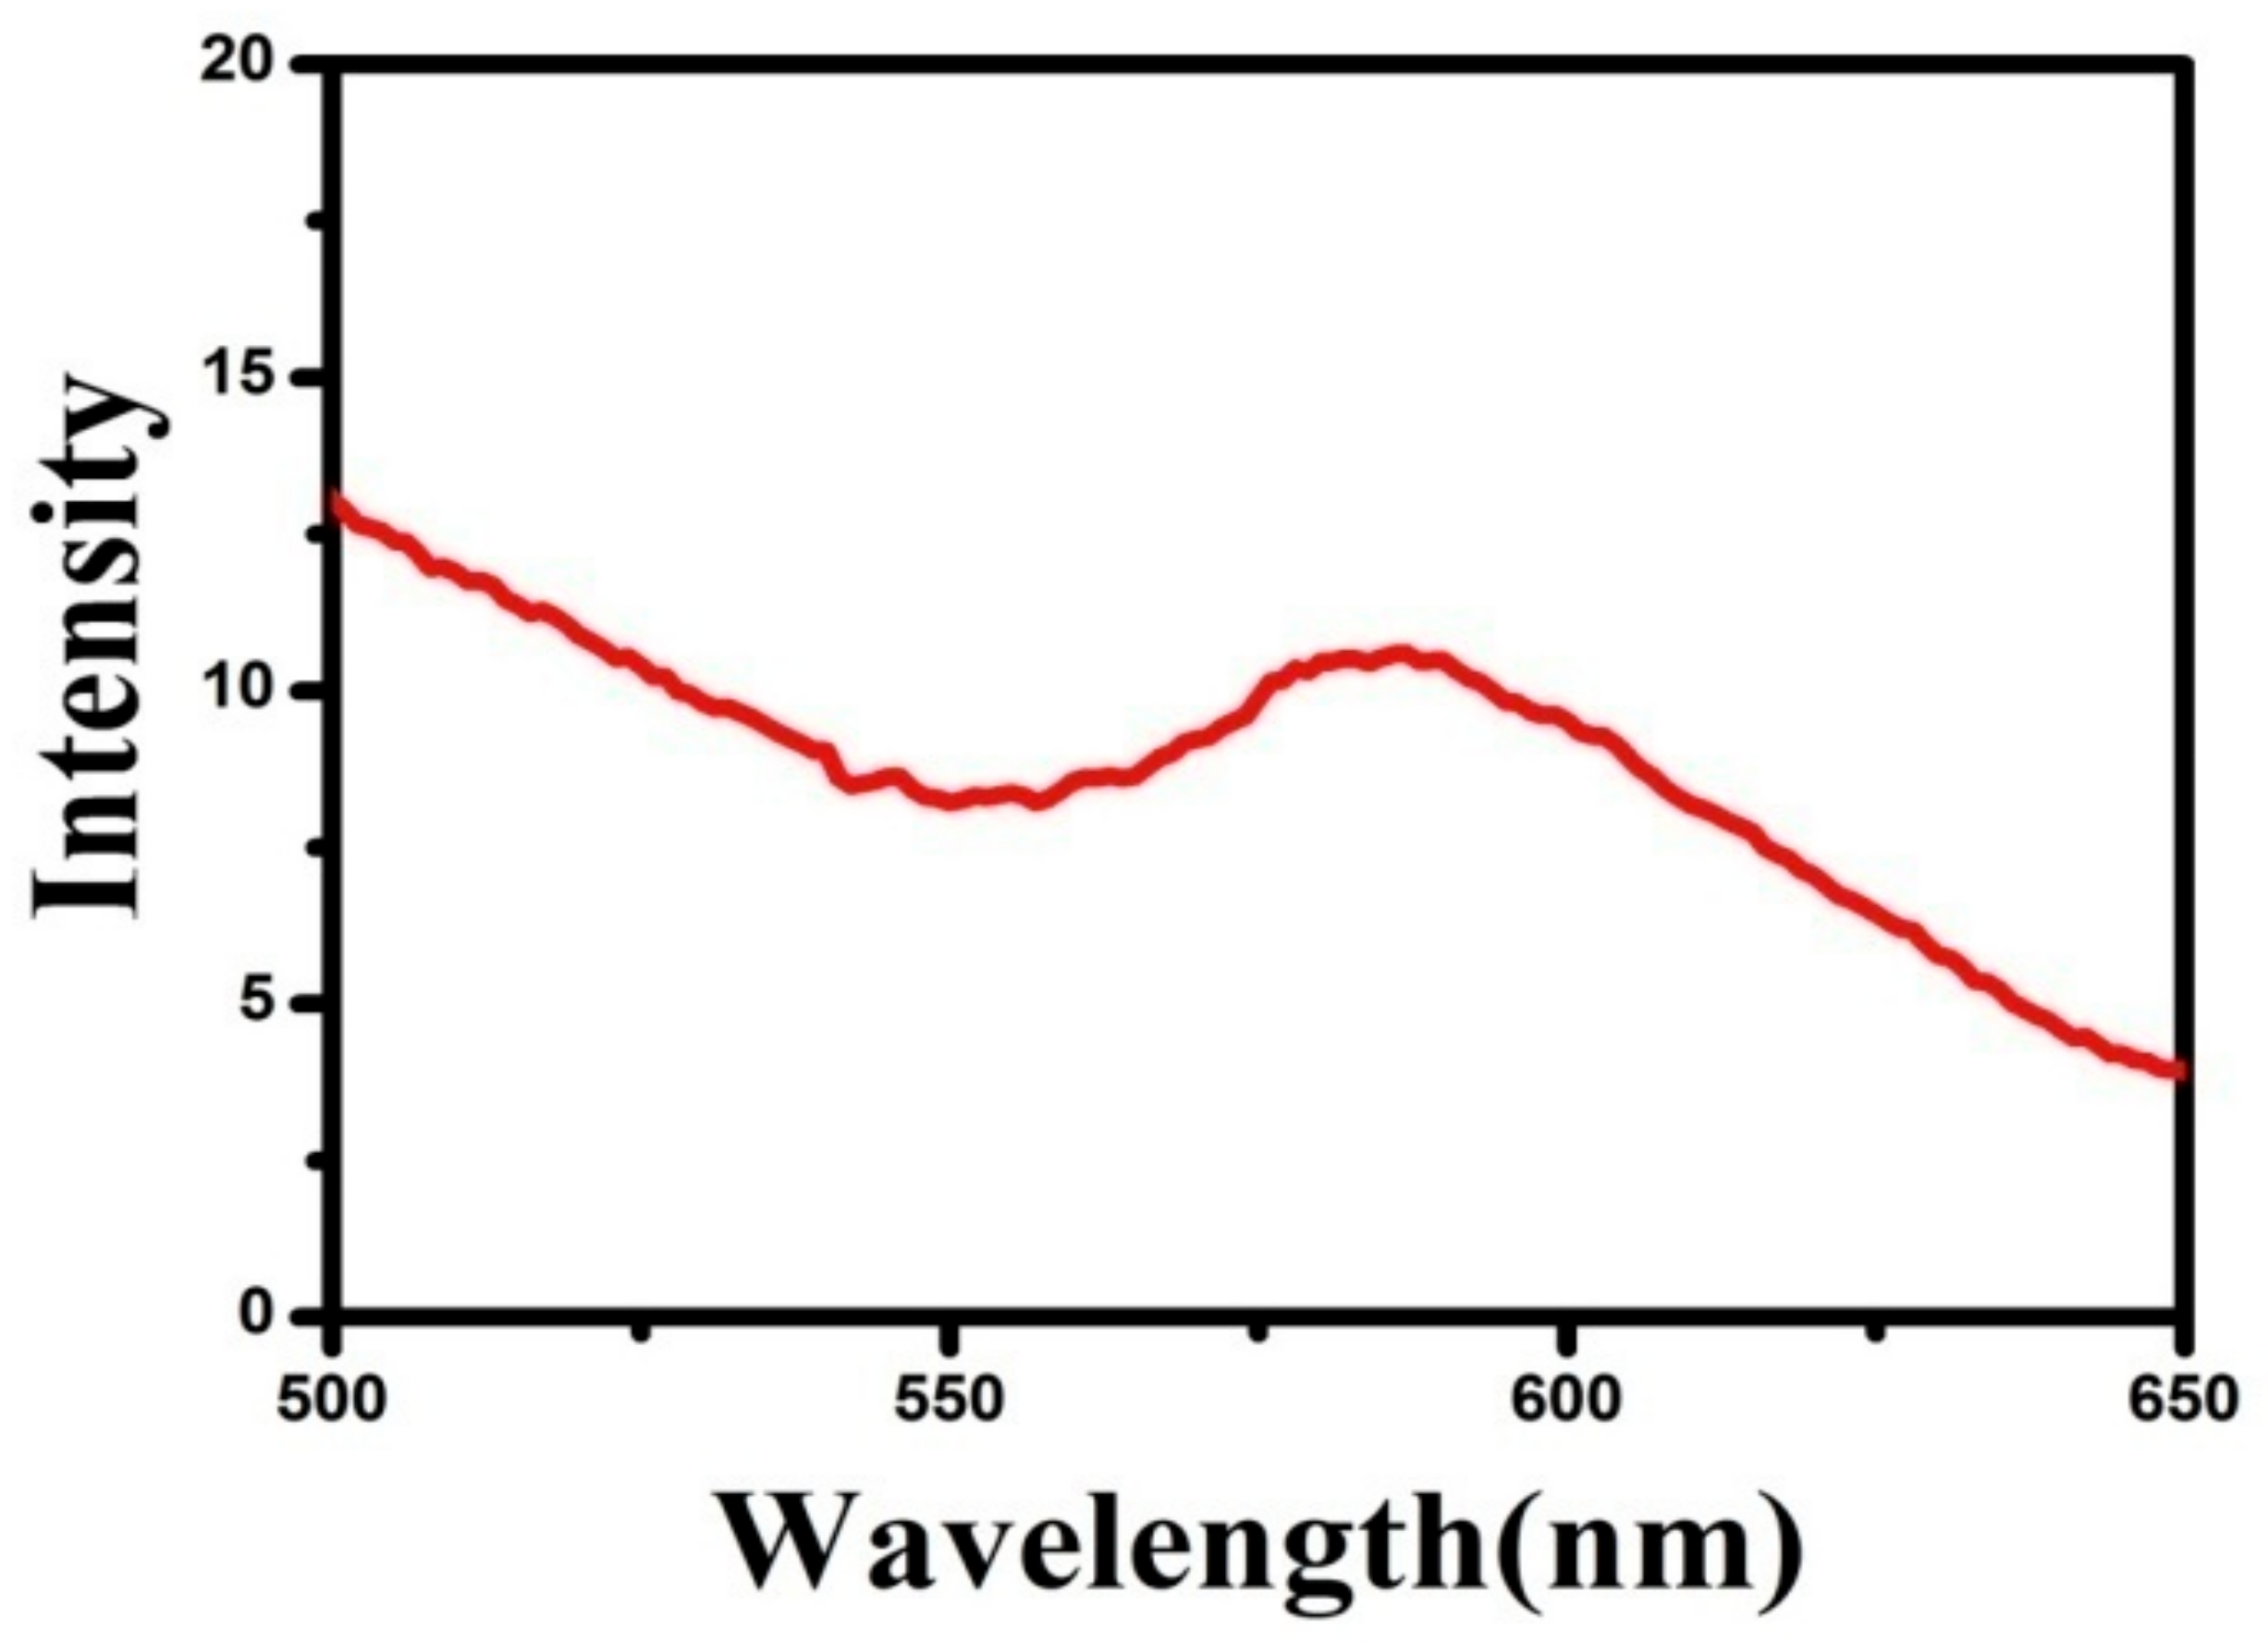
3.5. PL Analysis
3.6. UV DRS Analysis
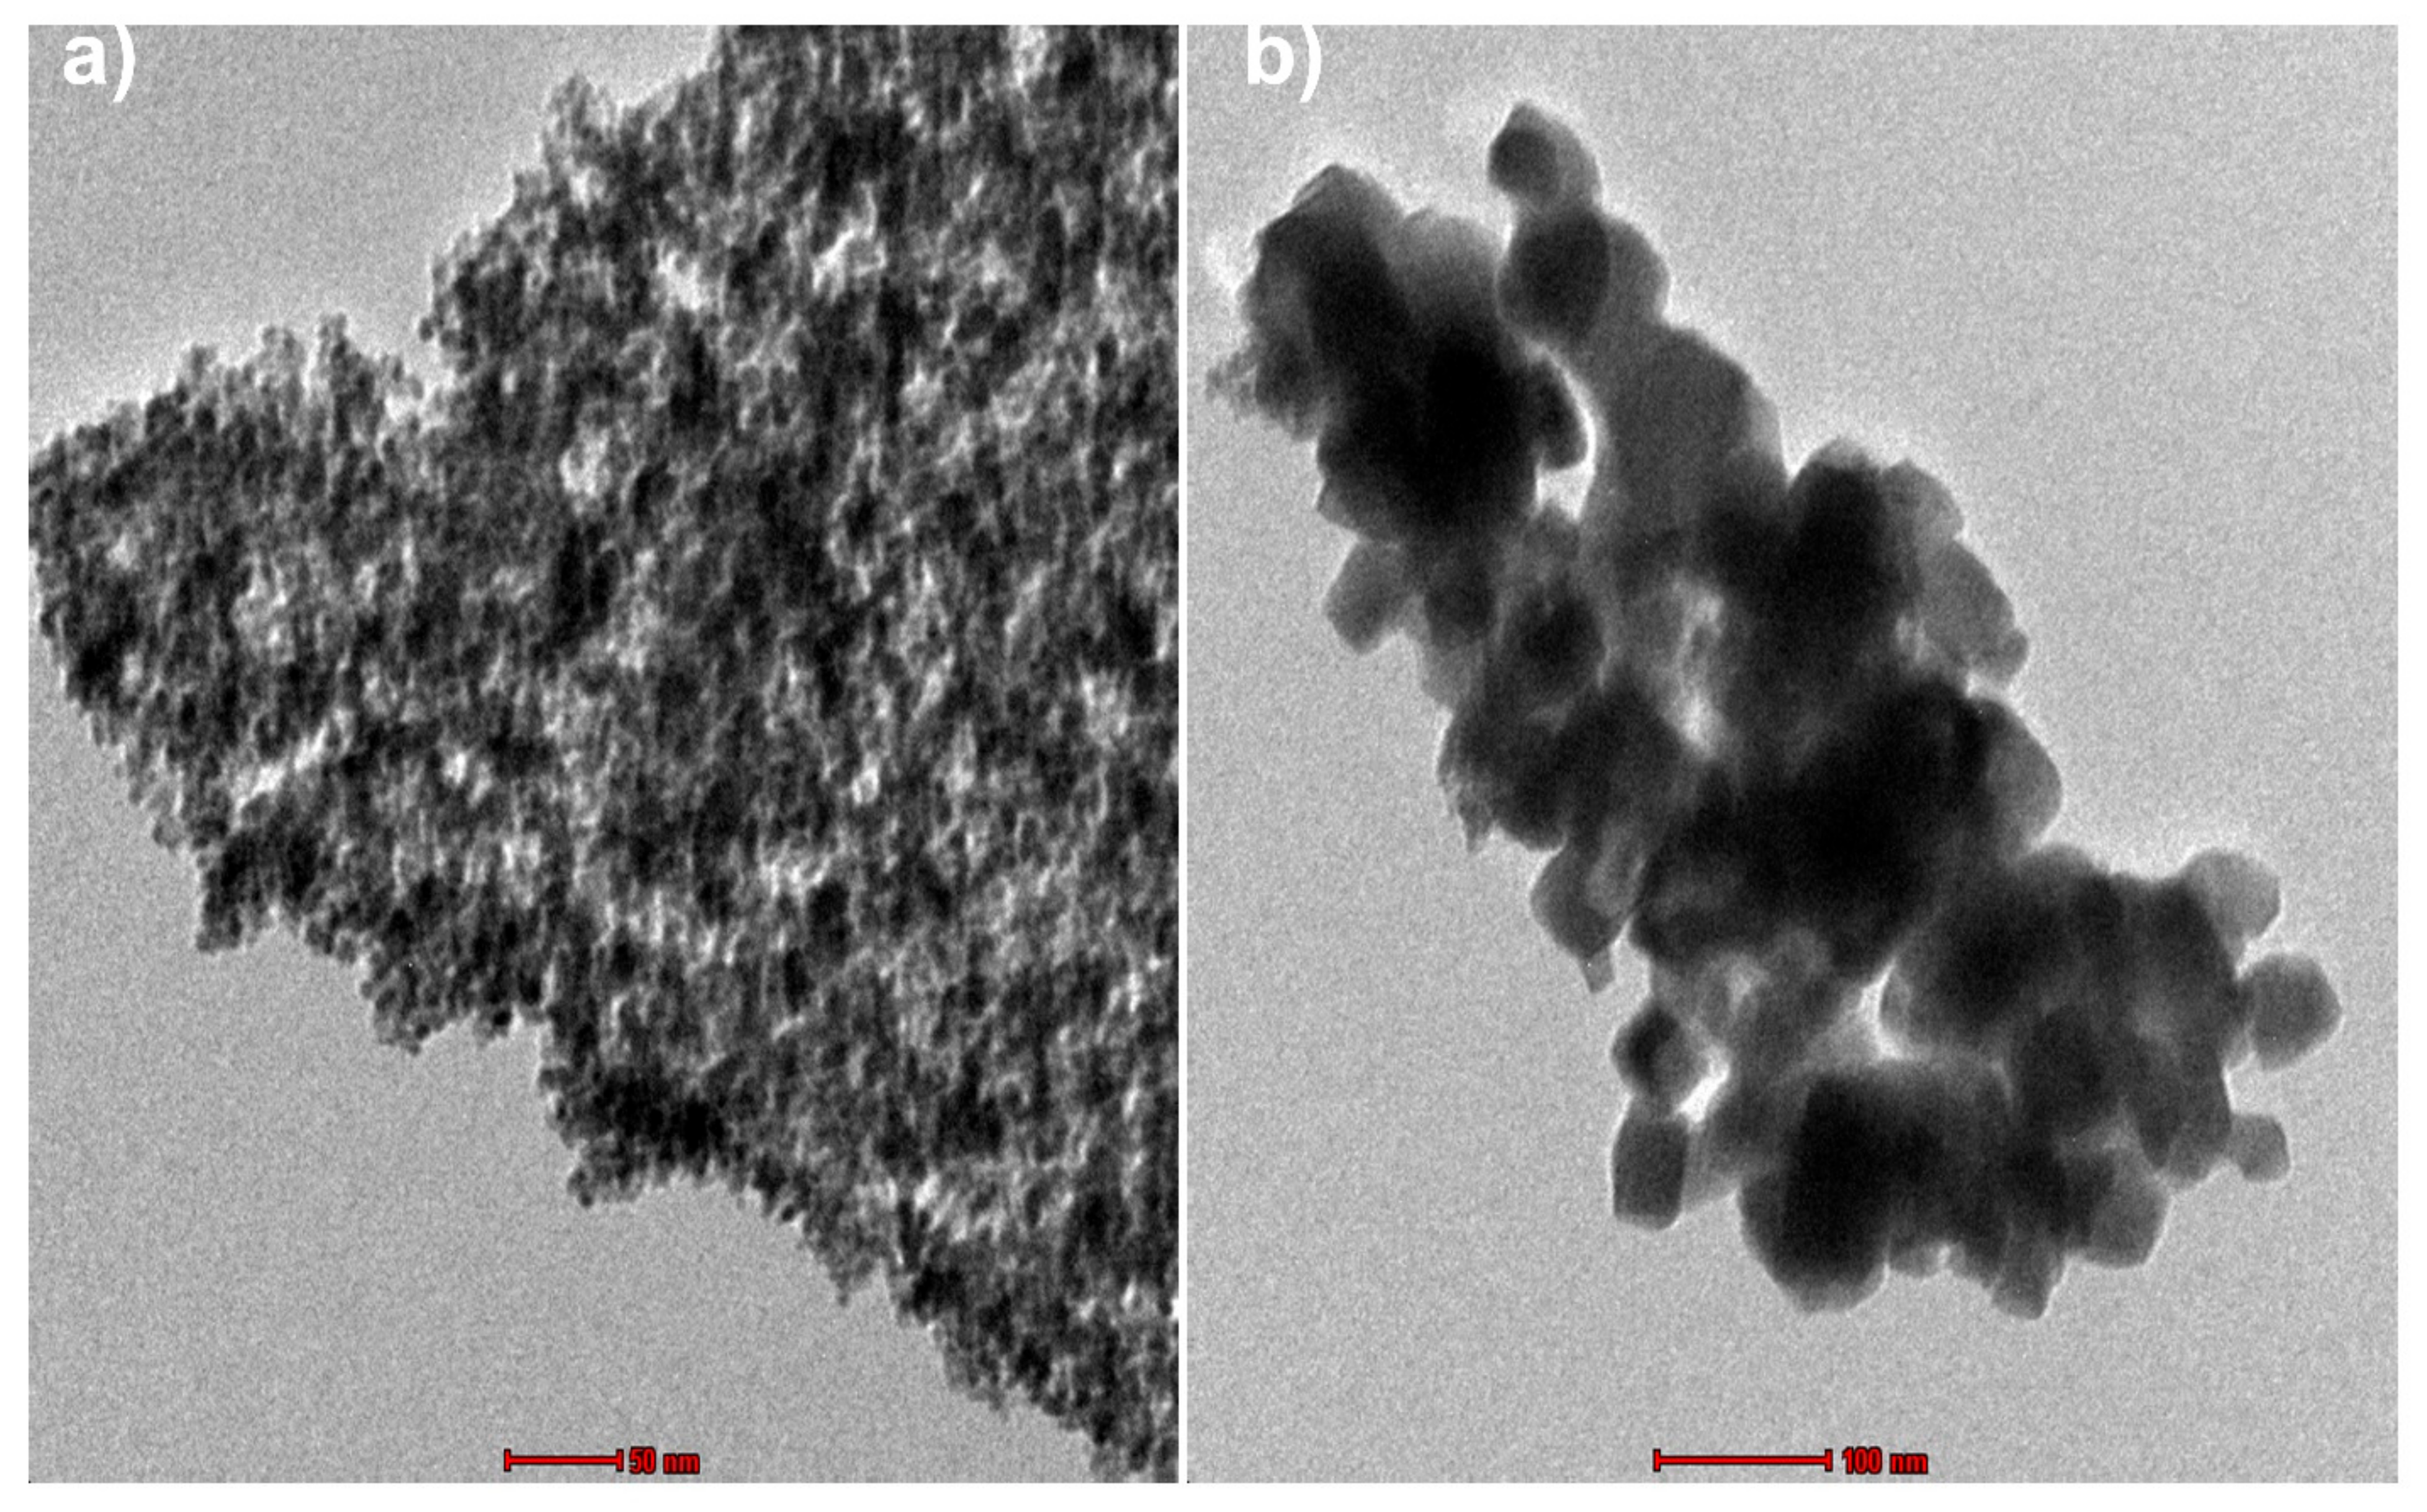
3.7. TEM Analysis
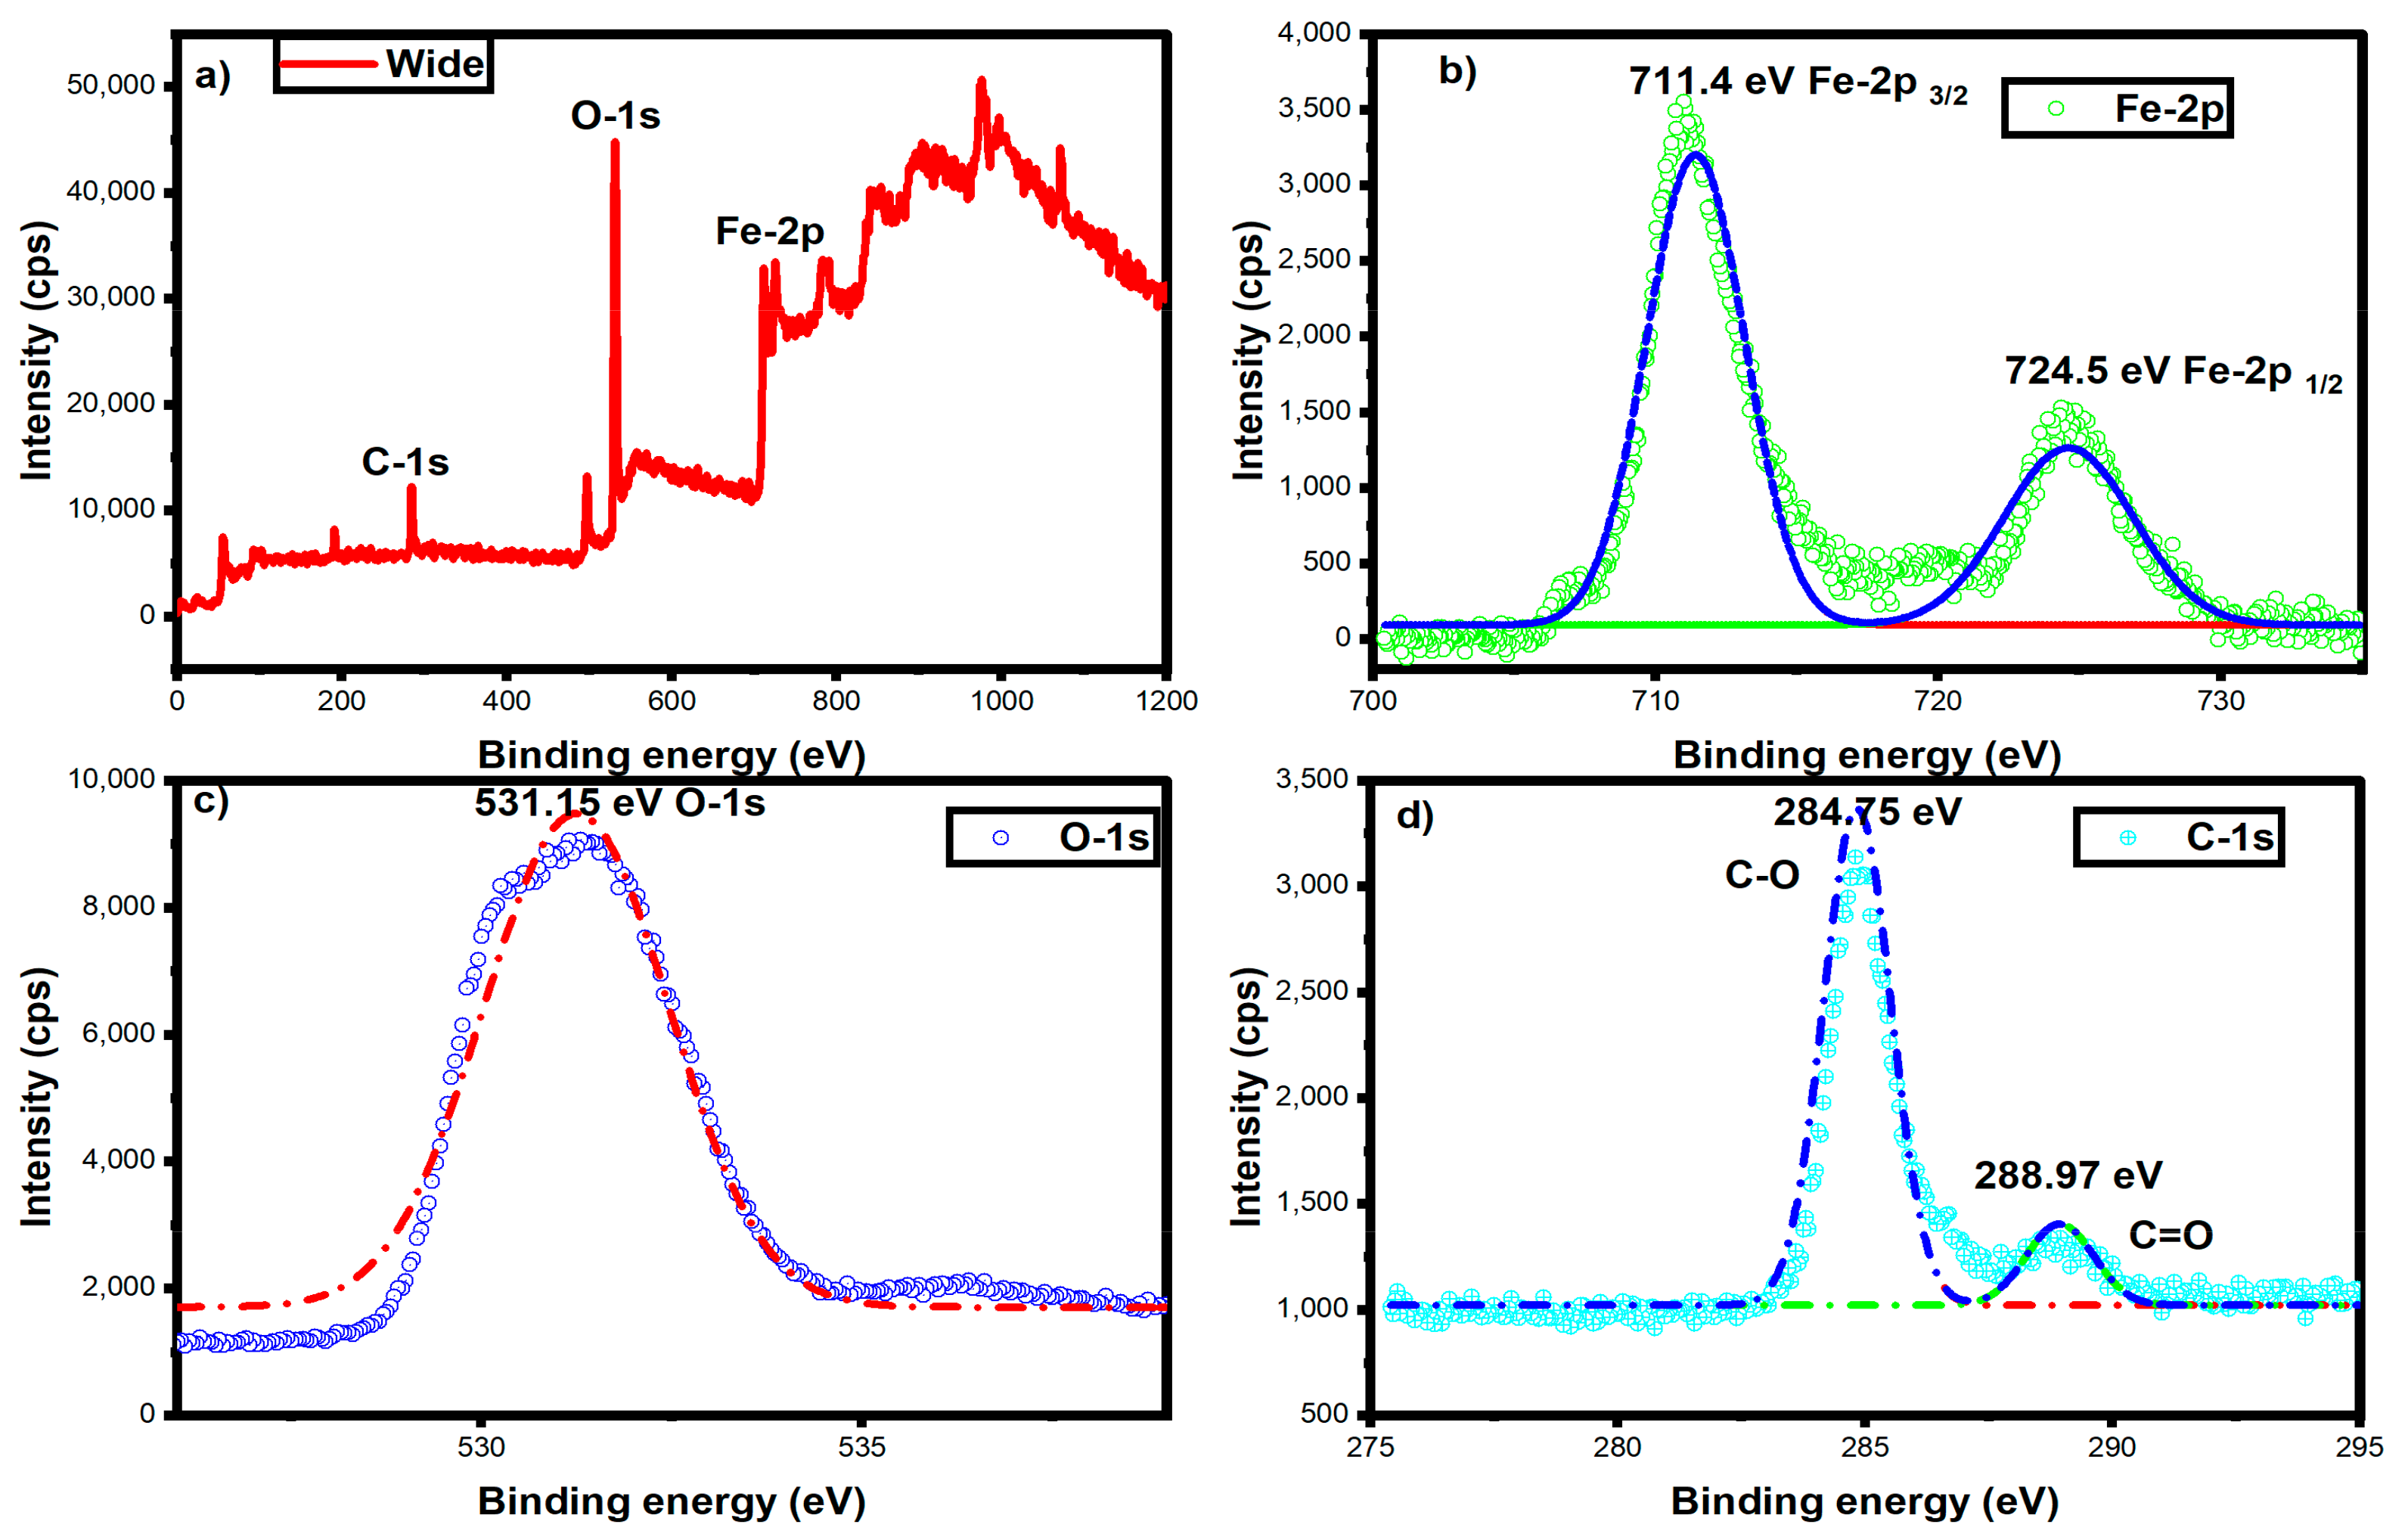
3.8. XPS Analysis
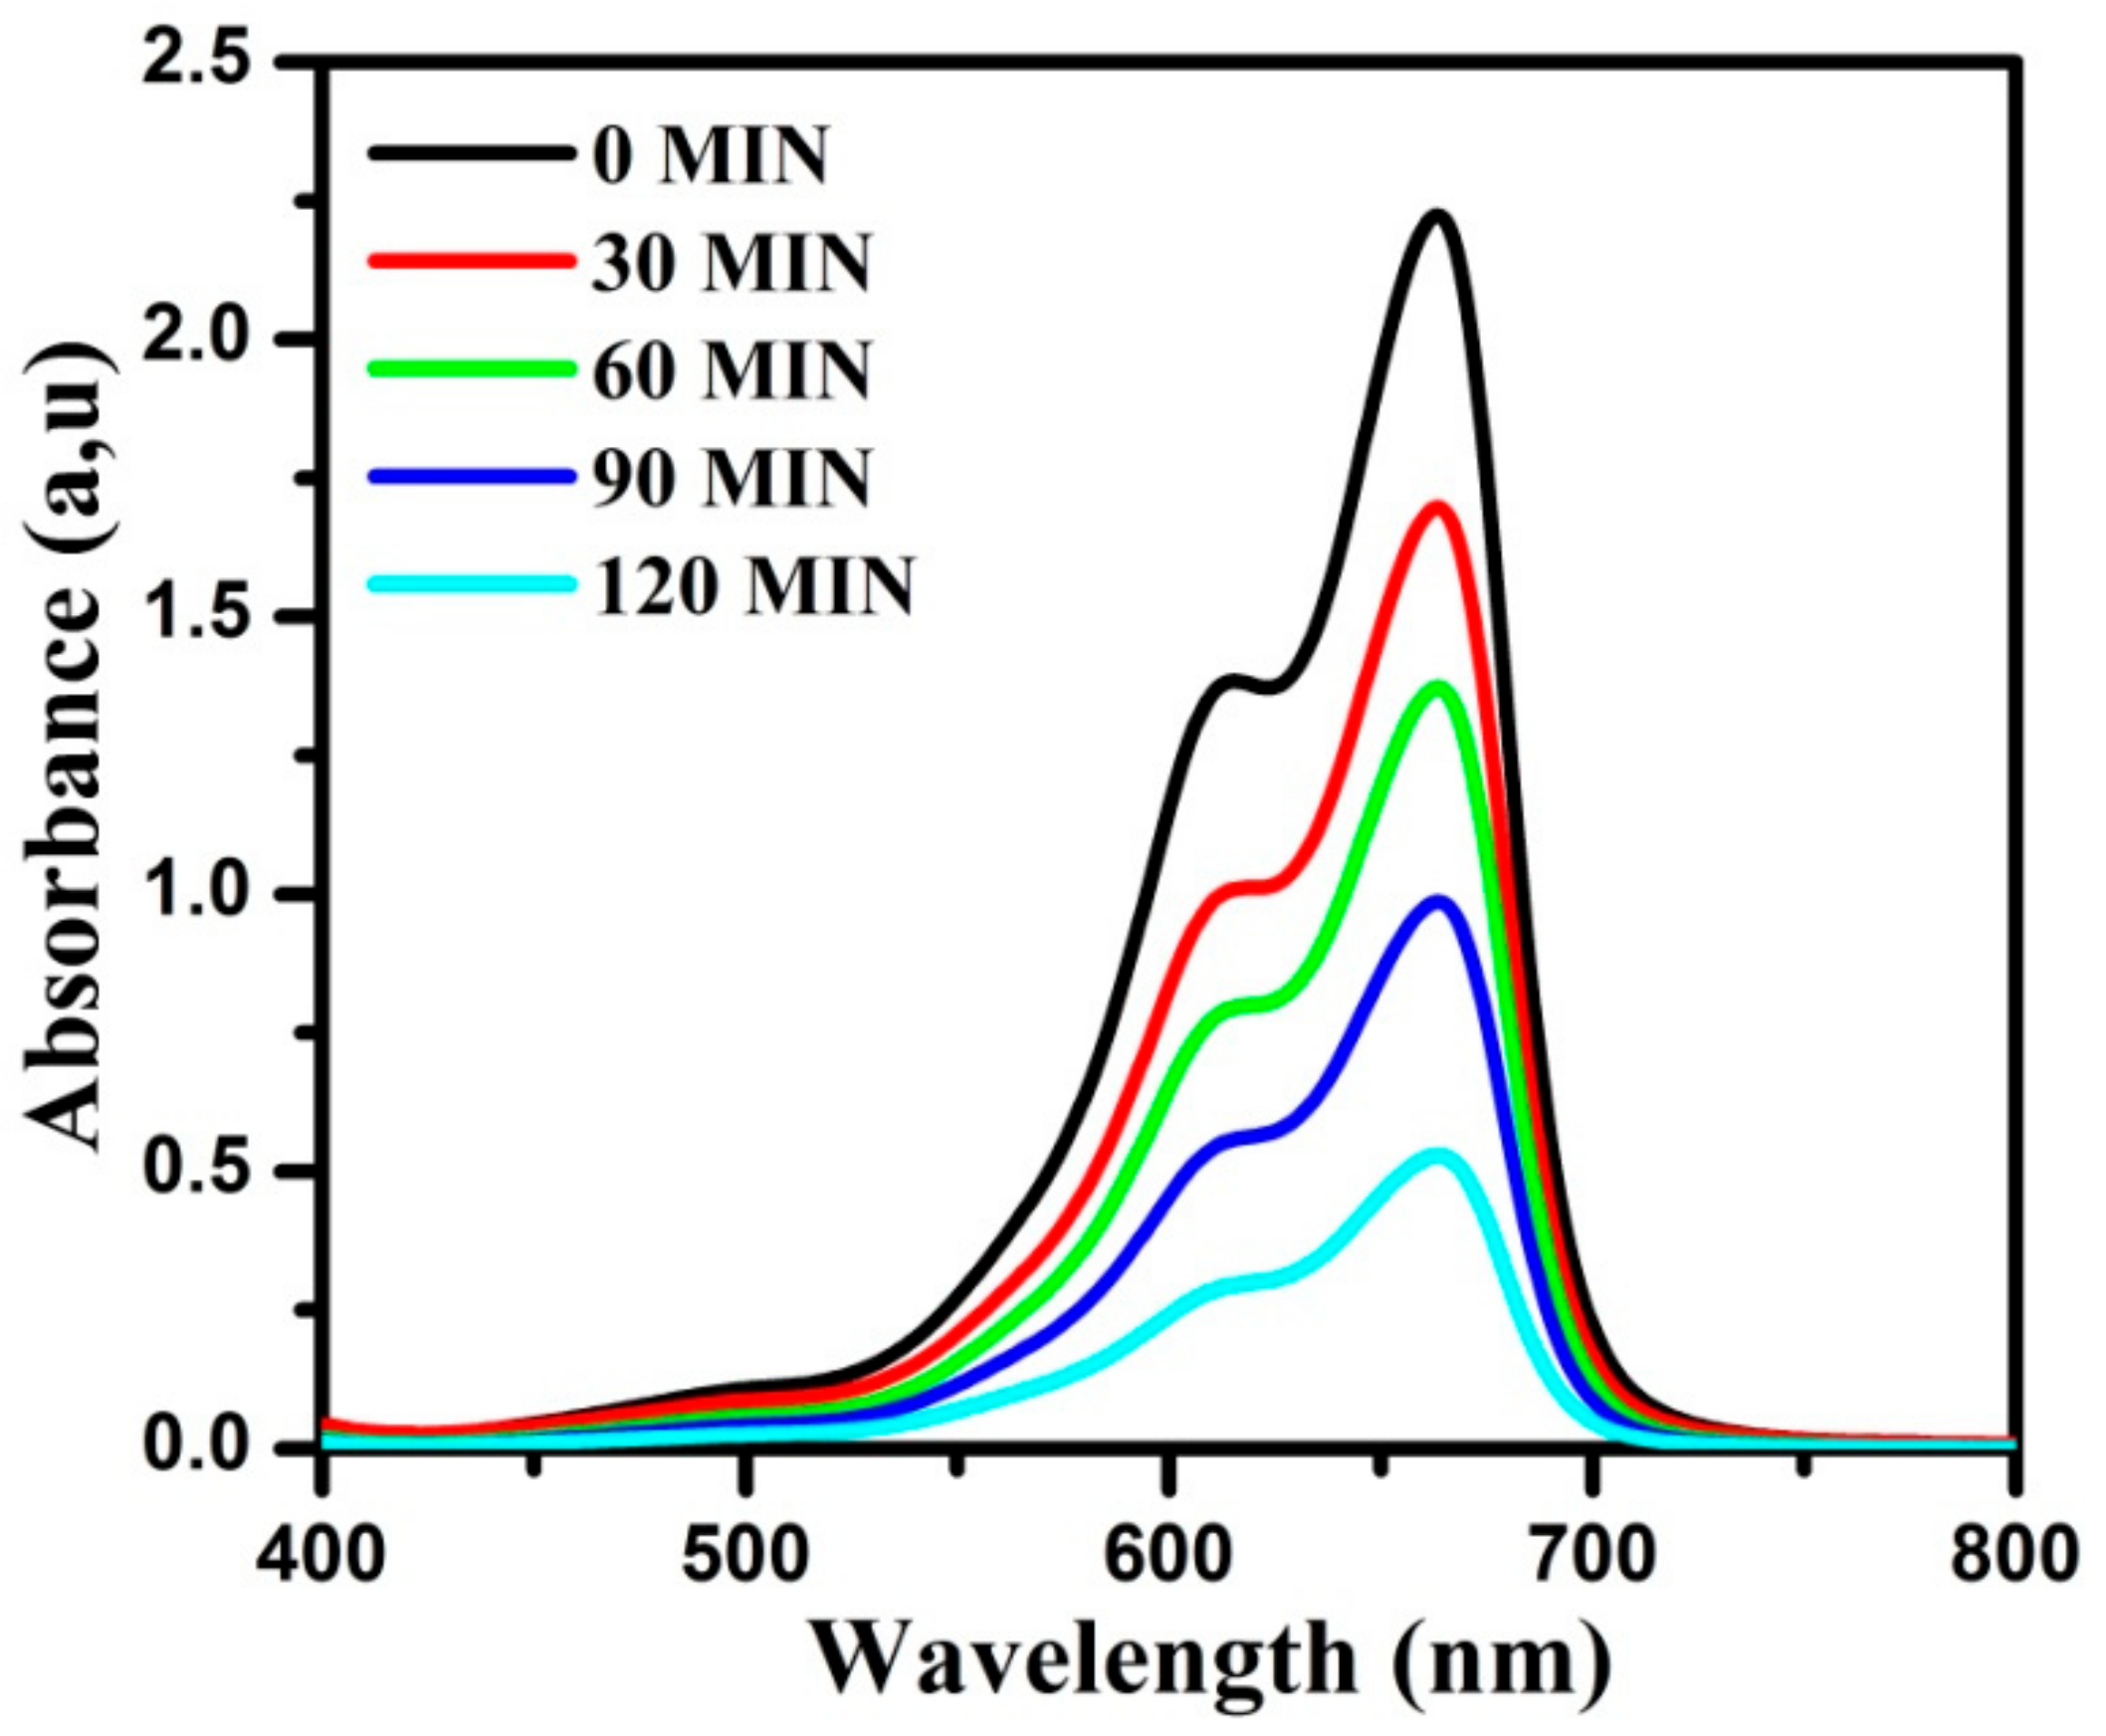
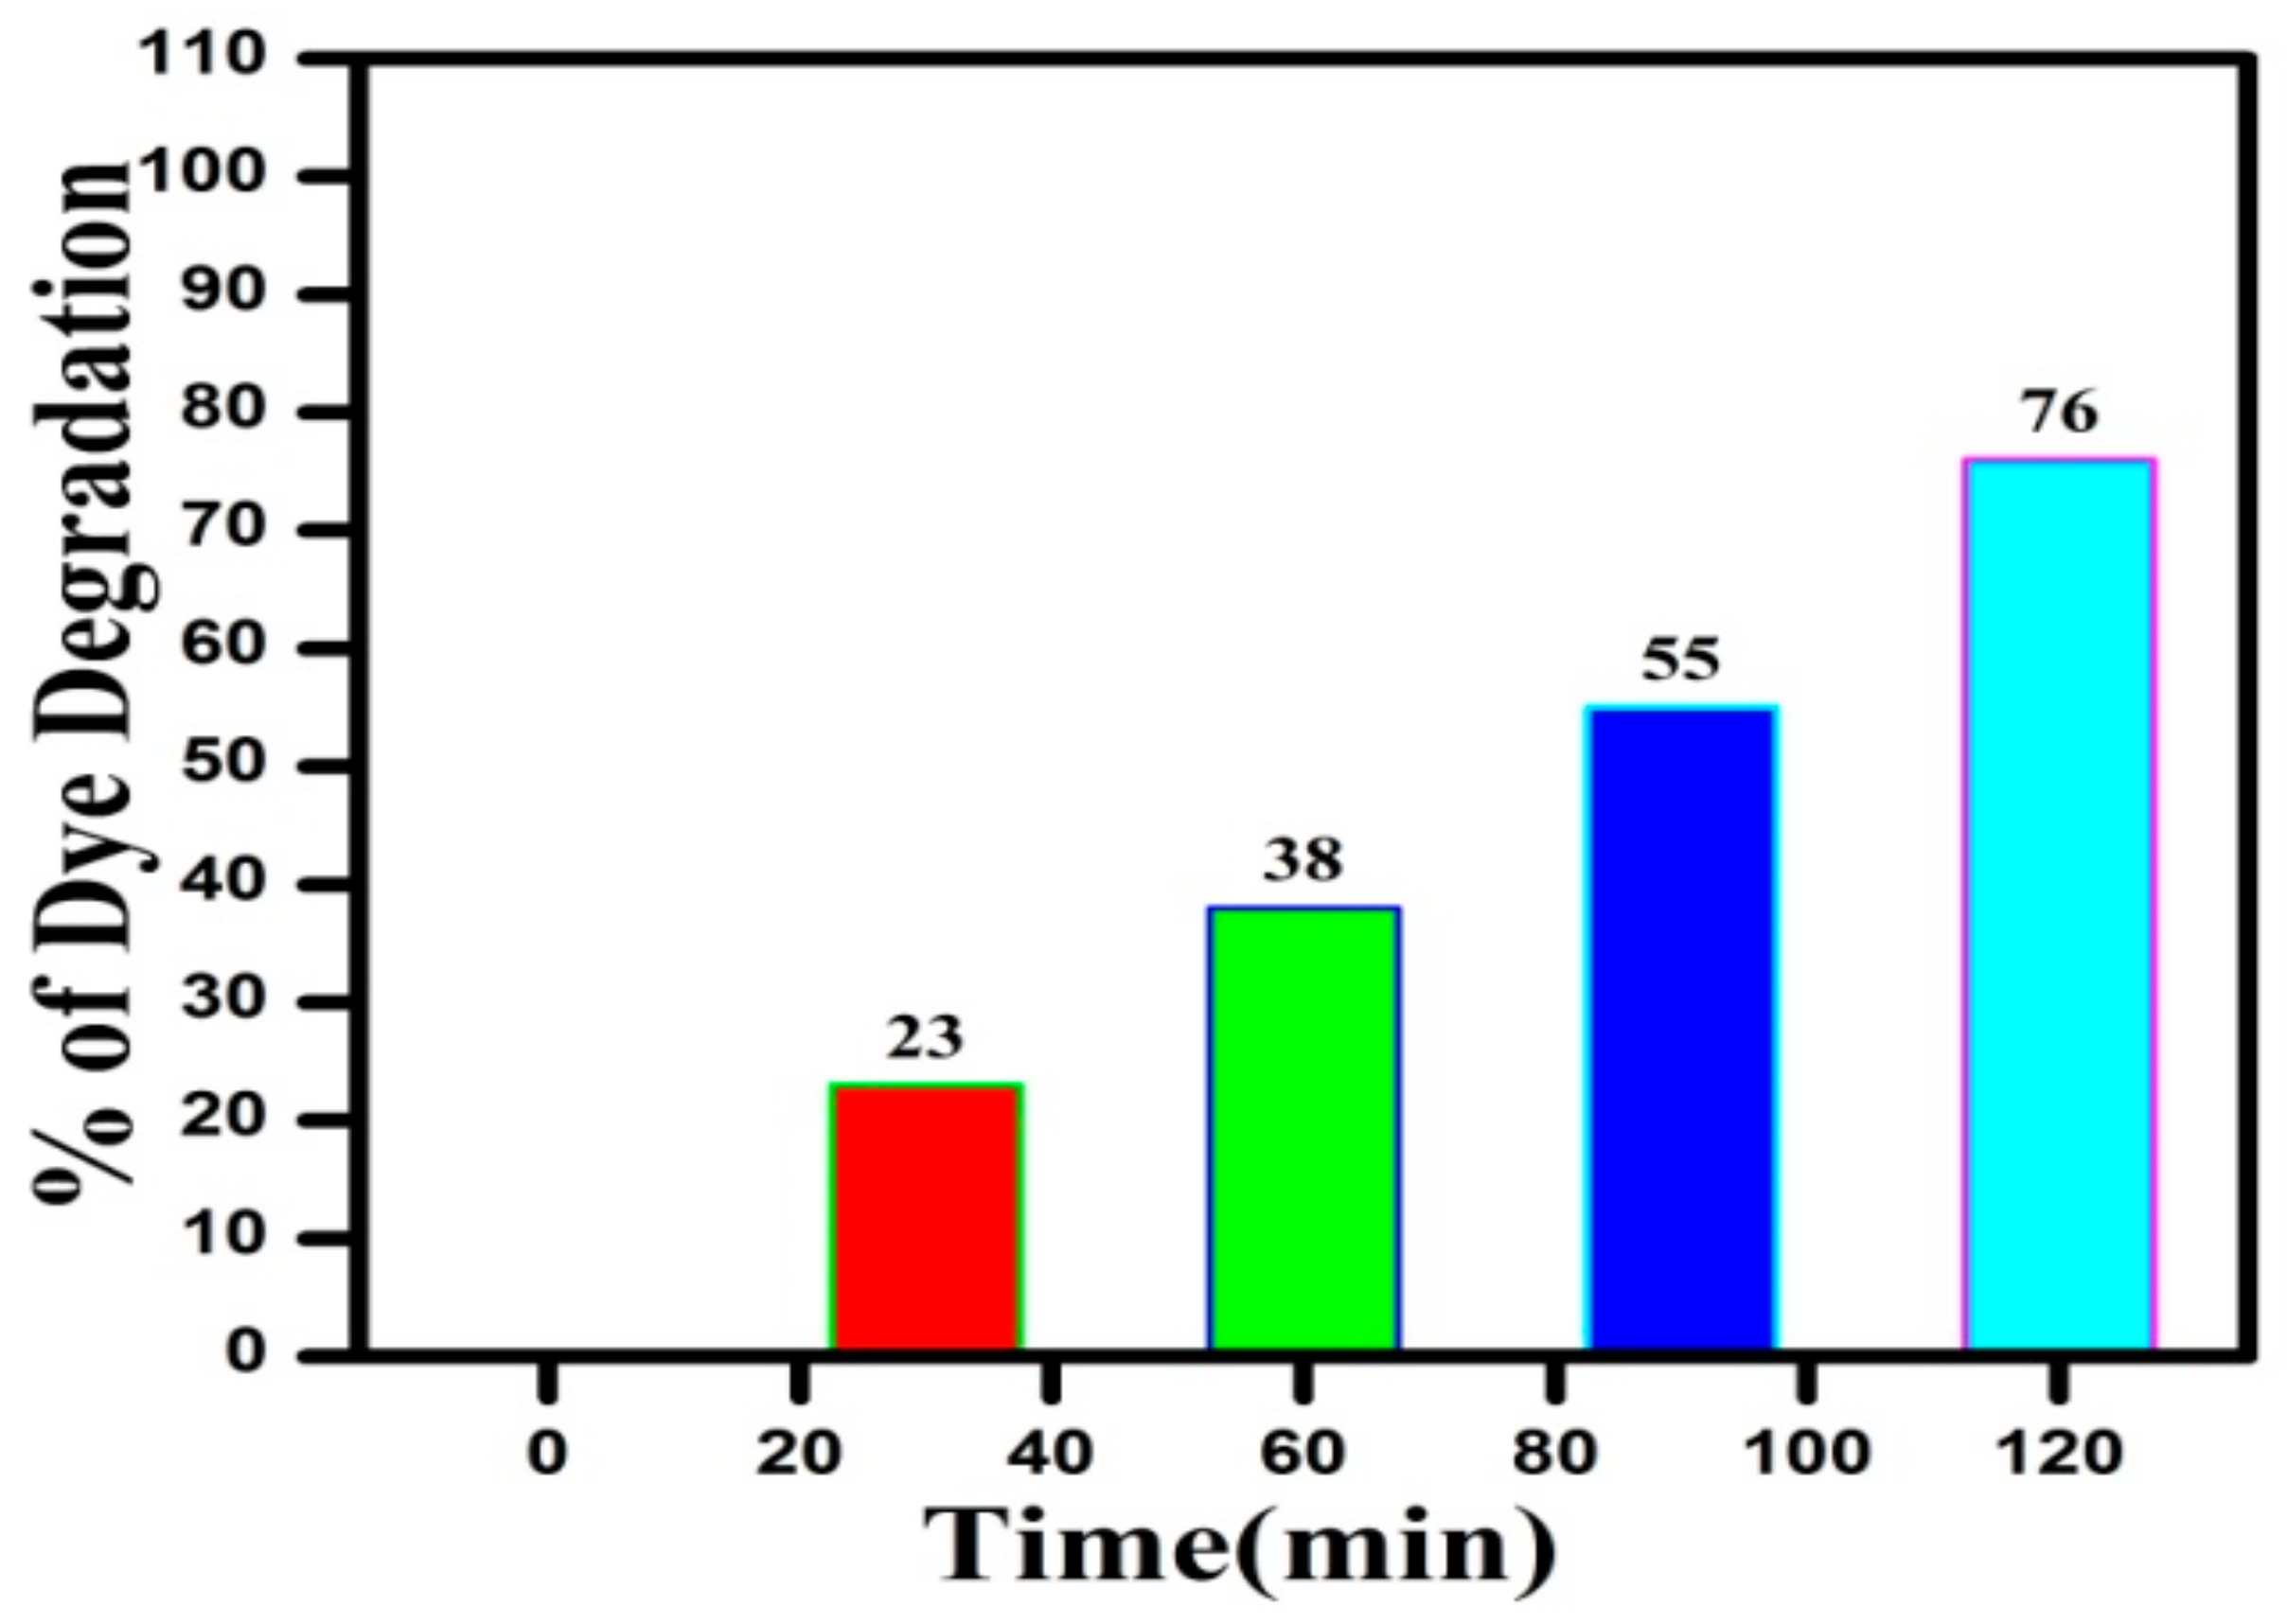
3.9. Photocatalytic Studies
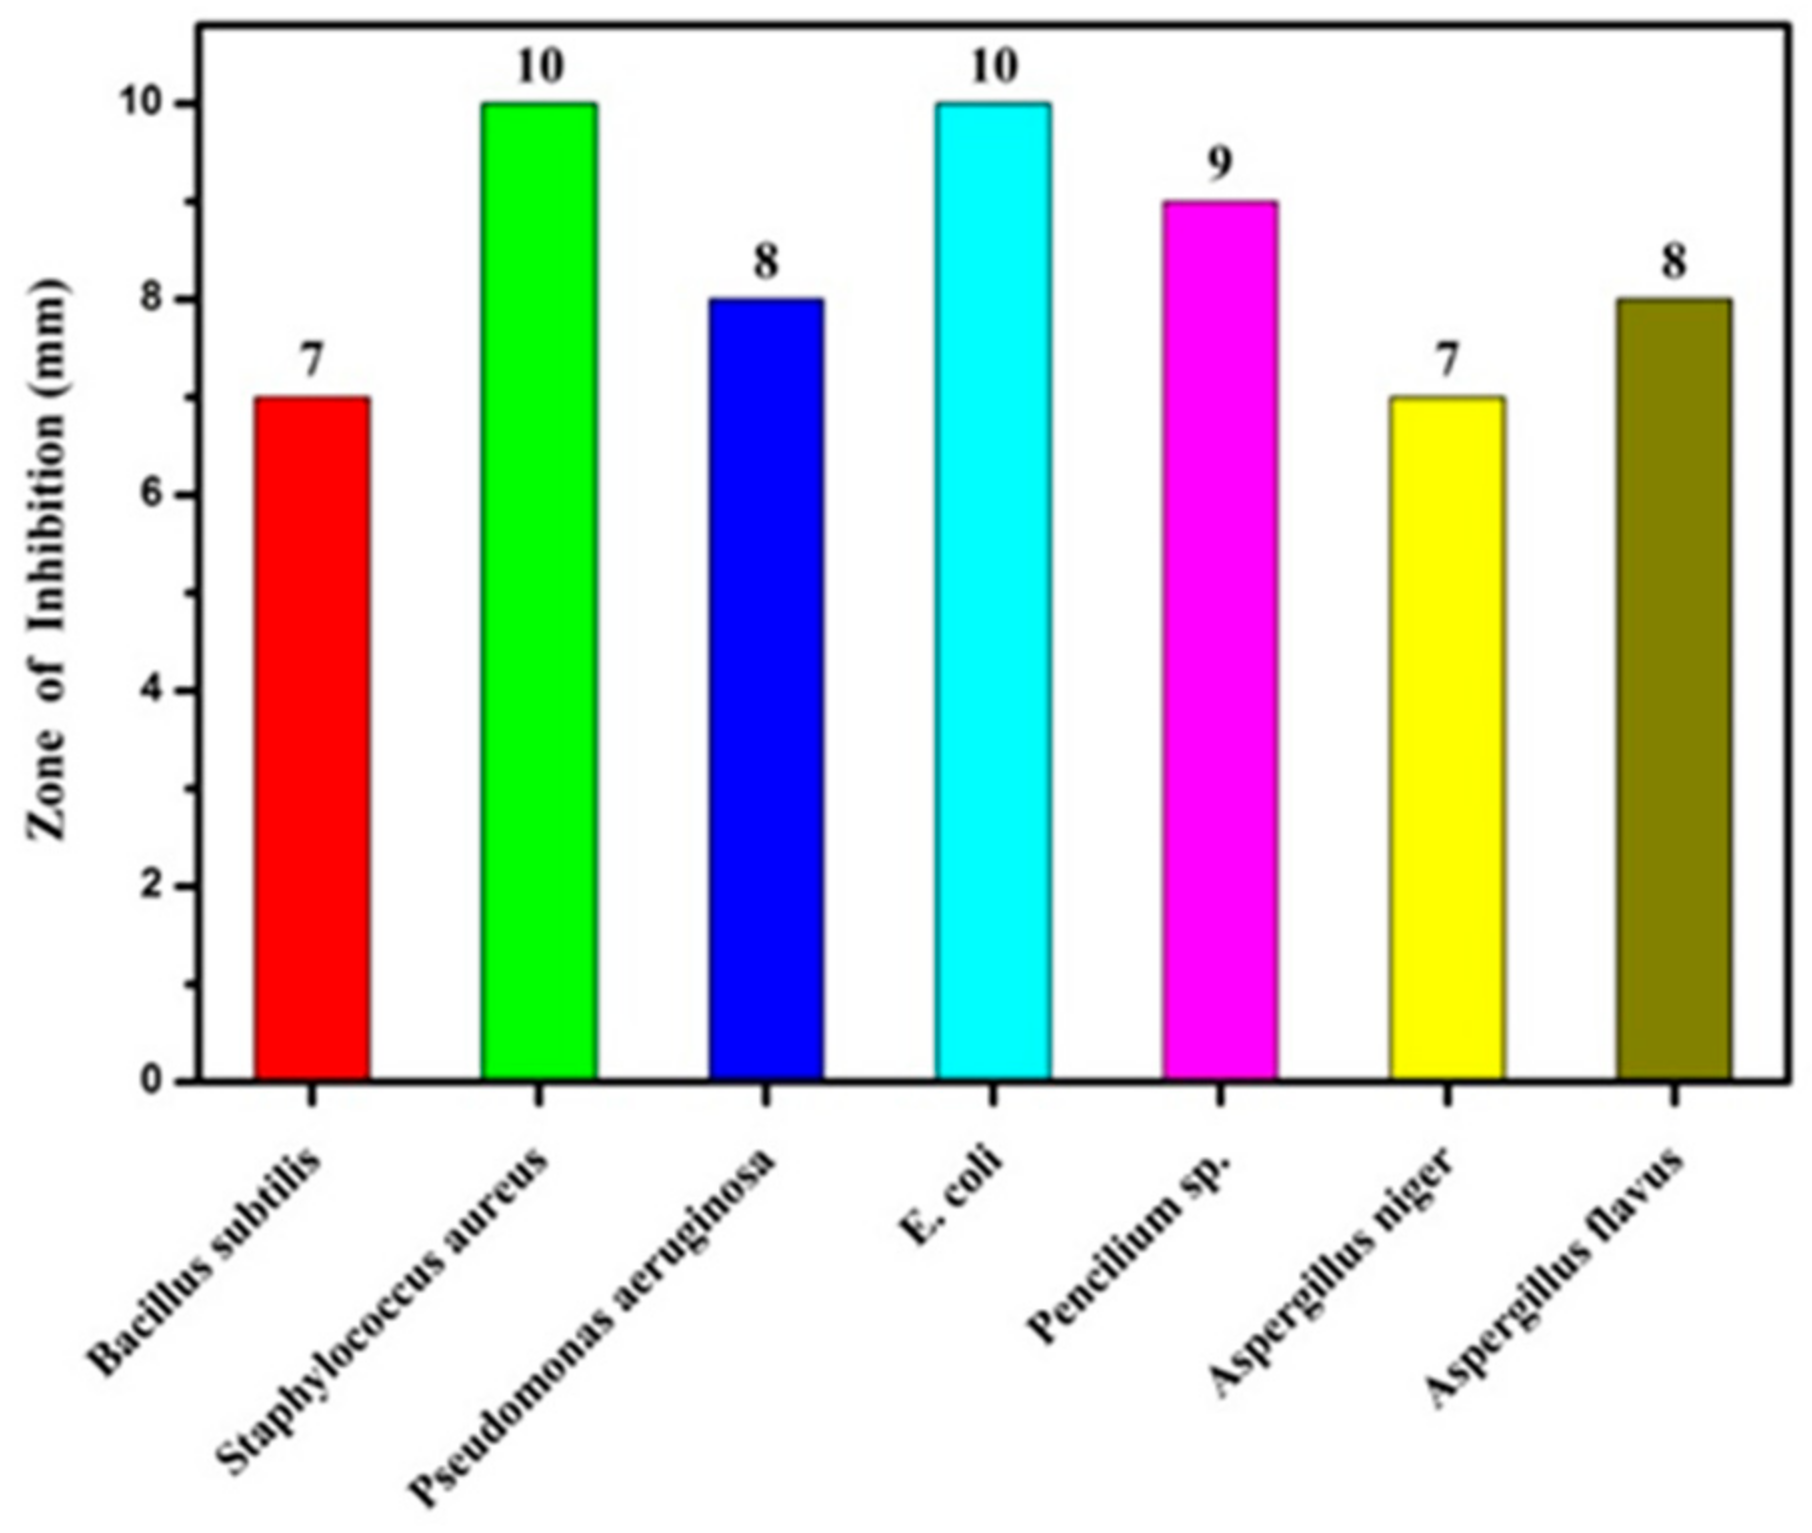
3.10. Antimicrobial and Antifungal Activity
4. Conclusions
Author Contributions
Funding
Institutional Review Board Statement
Informed Consent Statement
Data Availability Statement
Acknowledgments
Conflicts of Interest
References
- Mehra, S.; Singh, M.; Chadha, P. Adverse impact of textile dyes on the aquatic environment as well as on human beings. Toxicol. Int. 2021, 28, 165–176. [Google Scholar]
- Bose, S.; Tripathy, B.K.; Debnath, A.; Kumar, M. Boosted sono-oxidative catalytic degradation of Brilliant green dye by magnetic MgFe2O4 catalyst: Degradation mechanism, assessment of bio-toxicity and cost analysis. Ultrason. Sonochem. 2021, 75, 105592. [Google Scholar] [CrossRef] [PubMed]
- Rafiq, A.; Ikram, M.; Ali, S.; Niaz, F.; Khan, M.; Khan, Q.; Maqbool, M. Photocatalytic degradation of dyes using semiconductor photocatalysts to clean industrial water pollution. J. Ind. Eng. Chem. 2021, 97, 111–128. [Google Scholar] [CrossRef]
- Issaka, E.; Amu-Darko, J.N.O.; Yakubu, S.; Fapohunda, F.O.; Ali, N.; Bilal, M. Advanced catalytic ozonation for degradation of pharmaceutical pollutants―A review. Chemosphere 2022, 289, 133208. [Google Scholar] [CrossRef]
- Gupta, S.K.; Mao, Y. A review on molten salt synthesis of metal oxide nanomaterials: Status, opportunity, and challenge. Prog. Mater. Sci. 2021, 117, 100734. [Google Scholar] [CrossRef]
- Manjakkal, L.; Szwagierczak, D.; Dahiya, R. Metal oxides based electrochemical pH sensors: Current progress and future perspectives. Prog. Mater. Sci. 2020, 109, 100635. [Google Scholar] [CrossRef]
- Lizundia, E.; Armentano, I.; Luzi, F.; Bertoglio, F.; Restivo, E.; Visai, L.; Torre, L.; Puglia, D. Synergic effect of nanolignin and metal oxide nanoparticles into Poly (l-lactide) bionanocomposites: Material properties, antioxidant activity, and antibacterial performance. ACS Appl. Bio. Mater. 2020, 3, 5263–5274. [Google Scholar] [CrossRef]
- Zhou, K.L.; Wang, Z.; Han, C.B.; Ke, X.; Wang, C.; Jin, Y.; Zhang, Q.; Liu, J.; Wang, H.; Yan, H. Platinum single-atom catalyst coupled with transition metal/metal oxide heterostructure for accelerating alkaline hydrogen evolution reaction. Nat. Commun. 2021, 12, 3783. [Google Scholar] [CrossRef]
- Gautam, S.; Agrawal, H.; Thakur, M.; Akbari, A.; Sharda, H.; Kaur, R.; Amini, M. Metal oxides and metal organic frameworks for the photocatalytic degradation: A review. J. Environ. Chem. Eng. 2020, 8, 103726. [Google Scholar] [CrossRef]
- Park, C.; Kim, T.; Kim, Y.I.; Lee, M.W.; An, S.; Yoon, S.S. Supersonically sprayed transparent flexible multifunctional composites for self-cleaning, anti-icing, anti-fogging, and anti-bacterial applications. Compos. Part B Eng. 2021, 222, 109070. [Google Scholar] [CrossRef]
- Fatima, R.; Warsi, M.F.; Zulfiqar, S.; Ragab, S.A.; Shakir, I.; Sarwar, M.I. Nanocrystalline transition metal oxides and their composites with reduced graphene oxide and carbon nanotubes for photocatalytic applications. Ceram. Int. 2020, 46, 16480–16492. [Google Scholar] [CrossRef]
- Dehghani, F.; Ayatollahi, S.; Bahadorikhalili, S.; Esmaeilpour, M. Synthesis and characterization of mixed–metal oxide nanoparticles (CeNiO3, CeZrO4, CeCaO3) and application in adsorption and catalytic oxidation–decomposition of asphaltenes with different chemical structures. Pet. Chem. 2020, 60, 731–743. [Google Scholar] [CrossRef]
- Dheyab, M.A.; Aziz, A.A.; Jameel, M.S.; Noqta, O.A.; Mehrdel, B. Synthesis and coating methods of biocompatible iron oxide/gold nanoparticle and nanocomposite for biomedical applications. Chin. J. Phys. 2020, 64, 305–325. [Google Scholar] [CrossRef]
- Han, D.; Zhao, M. Facile and simple synthesis of novel iron oxide foam and used as acetone gas sensor with sub-ppm level. J. Alloy. Compd. 2020, 815, 152406. [Google Scholar] [CrossRef]
- Gahrouei, Z.E.; Imani, M.; Soltani, M.; Shafyei, A. Synthesis of iron oxide nanoparticles for hyperthermia application: Effect of ultrasonic irradiation assisted co-precipitation route. Adv. Nat. Sci. Nanosci. Nanotechnol. 2020, 11, 025001. [Google Scholar] [CrossRef]
- Imran, M.; Riaz, S.; Shah, S.M.H.; Batool, T.; Khan, H.N.; Sabri, A.N.; Naseem, S. In-vitro hemolytic activity and free radical scavenging by sol-gel synthesized Fe3O4 stabilized ZrO2 nanoparticles. Arab. J. Chem. 2020, 13, 7598–7608. [Google Scholar] [CrossRef]
- Belles, L.; Moularas, C.; Smykała, S.; Deligiannakis, Y. Flame spray pyrolysis Co3O4/CoO as highly-efficient nanocatalyst for oxygen reduction reaction. Nanomaterials 2021, 11, 925. [Google Scholar] [CrossRef]
- Garcia-Osorio, D.; Hidalgo-Falla, P.; Peres, H.E.; Gonçalves, J.M.; Araki, K.; Garcia-Segura, S.; Picasso, G. Silver enhances hematite nanoparticles-based ethanol sensor response and selectivity at room temperature. Sensors 2021, 21, 440. [Google Scholar] [CrossRef]
- Frindy, S.; Sillanpää, M. Synthesis and application of novel α-Fe2O3/graphene for visible-light enhanced photocatalytic degradation of RhB. Mater. Des. 2020, 188, 108461. [Google Scholar] [CrossRef]
- Najaf, Z.; Nguyen, D.L.T.; Chae, S.Y.; Joo, O.S.; Shah, A.U.H.A.; Vo, D.V.N.; Nguyen, V.H.; Van Le, Q.; Rahman, G. Recent trends in development of hematite (α-Fe2O3) as an efficient photoanode for enhancement of photoelectrochemical hydrogen production by solar water splitting. Int. J. Hydrogen Energy 2021, 46, 23334–23357. [Google Scholar] [CrossRef]
- Mazloum-Ardakani, M.; Sadri, N.; Eslami, V. Detection of dexamethasone sodium phosphate in blood plasma: Application of hematite in electrochemical sensors. Electroanalysis 2020, 32, 1148–1154. [Google Scholar] [CrossRef]
- Al-Zaban, M.I.; Mohamed, A.M.; Maha, A.A. Catalytic degradation of methylene blue using silver nanoparticles synthesized by honey. Saudi J. Biol. Sci. 2021, 28, 2007–2013. [Google Scholar] [CrossRef]
- Nivethitha, P.R.; Rachel, D.C.J. A study of antioxidant and antibacterial activity using honey mediated Chromium oxide nanoparticles and its characterization. Mater. Today Proc. 2020, 48, 276–281. [Google Scholar] [CrossRef]
- Gingasu, D.; Mindru, I.; Culita, D.C.; Calderon-Moreno, J.M.; Bartha, C.; Greculeasa, S.; Iacob, N.; Preda, S.; Oprea, O. Structural, morphological and magnetic investigations on cobalt ferrite nanoparticles obtained through green synthesis routes. Appl. Phys. A 2021, 127, 892. [Google Scholar] [CrossRef]
- Inbaraj, D.J.; Chandran, B.; Mangalaraj, C. Synthesis of CoFe2O4 and CoFe2O4/g-C3N4 nanocomposite via honey mediated sol-gel auto combustion method and hydrothermal method with enhanced photocatalytic and efficient Pb+2 adsorption property. Mater. Res. Express 2019, 6, 055501. [Google Scholar] [CrossRef]
- Yadav, R.S.; Kuřitka, I.; Vilcakova, J.; Havlica, J.; Masilko, J.; Kalina, L.; Tkacz, J.; Enev, V.; Hajdúchová, M. Structural, magnetic, dielectric, and electrical properties of NiFe2O4 spinel ferrite nanoparticles prepared by honey-mediated sol-gel combustion. J. Phys. Chem. Solids 2017, 107, 150–161. [Google Scholar] [CrossRef]
- GarcíaMartínez, T.; López, J.M.; Solsona, B.; Sanchis, R.; Willock, D.J.; Davies, T.E.; Lu, L.; He, Q.; Kiely, C.J.; Taylor, S.H. The key role of nanocasting in gold-based Fe2O3 nanocasted catalysts for oxygen activation at the metal-support interface. ChemCatChem 2019, 11, 1915–1927. [Google Scholar]
- Kumar, D.; Singh, H.; Jouen, S.; Hannoyer, B.; Banerjee, S. Effect of precursor on the formation of different phases of iron oxide nanoparticles. RSC Adv. 2015, 5, 7138–7150. [Google Scholar] [CrossRef]
- Basavegowda, N.; Mishra, K.; Lee, Y.R. Synthesis, characterization, and catalytic applications of hematite (α-Fe2O3) nanoparticles as reusable nanocatalyst. Adv. Nat. Sci. Nanosci. Nanotechnol. 2017, 8, 025017. [Google Scholar] [CrossRef]
- Karade, V.C.; Parit, S.B.; Dawkar, V.V.; Devan, R.S.; Choudhary, R.J.; Kedge, V.V.; Pawarh, N.V.; Kim, J.H.; Chougale, A.D. A green Approach for the Synthesis of α-Fe2O3 Nanoparticles from Gardenia Resinifera Plant and It’s In vitro hyperthermia application. Heilyon 2019, 5, e02044. [Google Scholar] [CrossRef] [Green Version]
- Islam, M.S.; Kurawaki, J.; Kusumoto, Y.; Abdulla-Al-Mamun, M.; Mukhlish, M.B. Hydrothermal novel synthesis of neck-structured hyperthermia-suitable magnetic (Fe3O4 2019, γ-Fe2O3 and α-Fe2O3) nanoparticles. J. Sci. Res. 2012, 4, 99–107. [Google Scholar] [CrossRef] [Green Version]
- Dehsari, H.S.; Ribeiro, A.H.; Ersöz, B.; Tremel, W.; Jakob, G.; Asadi, K. Effect of precursor concentration on size evolution of iron oxide nanoparticles. CrystEngComm 2017, 19, 6694–6702. [Google Scholar] [CrossRef] [Green Version]
- Rufus, A.; Sreeju, N.; Philip, D. Synthesis of biogenic hematite (α-Fe2O3) nanoparticles for antibacterial and nanofluid applications. RSC Adv. 2016, 6, 94206–94217. [Google Scholar] [CrossRef]
- Arora, A.K.; Sharma, M.; Kumari, R.; Jaswal, V.S.; Kumar, P. Synthesis, characterization, and magnetic studies of-nanoparticles. J. Nanotechnol. 2014, 2014, 474909. [Google Scholar] [CrossRef] [Green Version]
- Si, J.-C.; Xing, Y.; Peng, M.L.; Zhang, C.; Buske, N.; Chen, C.; Cui, Y.L. Solvothermal synthesis of tunable iron oxide nanorods and their transfer from organic phase to water phase. CrystEngComm 2014, 16, 512–516. [Google Scholar] [CrossRef]
- Rosliza, R.; Nik, W.W.; Izman, S.; Prawoto, Y. Anti-corrosive properties of natural honey on Al–Mg–Si alloy in seawater. Curr. Appl. Phys. 2010, 10, 923–929. [Google Scholar] [CrossRef]
- Bouhjar, F.; Ullah, S.; Chourou, M.L.; Mollar, M.; Marí, B.; Bessaïs, B. Electrochemical fabrication and characterization of p-CuSCN/n-Fe2O3 heterojunction devices for hydrogen production. J. Electrochem. Soc. 2017, 164, H936. [Google Scholar] [CrossRef]
- Lassoued, A.; Lassoued, M.S.; Dkhil, B.; Ammar, S.; Gadri, A. Synthesis, structural, morphological, optical and magnetic characterization of iron oxide (α-Fe2O3) nanoparticles by precipitation method: Effect of varying the nature of precursor. Phys. E: Low-Dimens. Syst. Nanostruct. 2018, 97, 328–334. [Google Scholar] [CrossRef]
- Bashir, A.K.H.; Furqan, C.M.; Bharuth-Ram, K.; Kaviyarasu, K.; Tchokonté, M.B.T.; Maaza, M. Structural, optical and Mössbauer investigation on the biosynthesized α-Fe2O3: Study on different precursors. Phys. E Low-Dimens. Syst. Nanostruct. 2019, 111, 152–157. [Google Scholar] [CrossRef]
- Dehno Khalaji, A. Spherical α Fe2O3 Nanoparticles: Synthesis and Characterization and Its Photocatalytic Degradation of Methyl Orange and Methylene Blue. Phys. Chem. Res. 2022, 10, 473–483. [Google Scholar]
- Liu, T.; Zhang, S.; Wang, Z.; Xu, Y. Preparation and characterization of α-Fe2O3/Fe3O4 heteroplasmon nanoparticles via the hydrolysis-combustion-calcination process of iron nitrate. Mater. Res. Express 2022, 9, 045011. [Google Scholar] [CrossRef]
- Kushwaha, P.; Chauhan, P. Influence of different surfactants on morphological, structural, optical, and magnetic properties of α-Fe2O3 nanoparticles synthesized via co-precipitation method. Appl. Phys. A 2022, 128, 18. [Google Scholar] [CrossRef]
- Vijayakumar, T.; Benoy, M.; Duraimurugan, J.; Kumar, G.S.; Shkir, M.; Maadeswaran, P.; Srinivasan, R.; Prabhu, S.; Ramesh, R.; Haseena, S. Investigation on photocatalytic activity of g-C3N4 decorated α-Fe2O3 nanostructure synthesized by hydrothermal method for the visible-light assisted degradation of organic pollutant. Diam. Relat. Mater. 2022, 125, 109021. [Google Scholar] [CrossRef]
- Fatimah, I.; Purwiandono, G.; Hidayat, A.; Sagadevan, S.; Kamari, A. Mechanistic insight into the adsorption and photocatalytic activity of a magnetically separable γ-Fe2O3/Montmorillonite nanocomposite for rhodamine B removal. Chem. Phys. Lett. 2022, 792, 139410. [Google Scholar] [CrossRef]
- Zhang, W.; Guan, H.; Kuang, C.; Wang, W.; Hu, Y.; Yang, X. Boosting charge transfer for α-Fe2O3 semiconductor with the coupling of chiral monolayer. Mater. Lett. 2022, 308, 131130. [Google Scholar] [CrossRef]
- Nguyen, T.B.; Dinh Thi, T.H.; Pham Minh, D.; Bui Minh, H.; Nguyen Thi, N.Q.; Nguyen Dinh, B. Photoreduction of CO2 to CH4 over Efficient Z-Scheme-Fe2O3/g-C3N4 Composites. J. Anal. Methods Chem. 2022, 2022, 1358437. [Google Scholar] [CrossRef] [PubMed]
- Zhang, Y.; Wang, Q.; Zhu, K.; Ye, K.; Wang, G.; Cao, D.; Yan, J. Edge sites-driven accelerated kinetics in ultrafine Fe2O3 nanocrystals anchored graphene for enhanced alkali metal ion storage. Chem. Eng. J. 2022, 428, 131204. [Google Scholar] [CrossRef]
- Güneş, F.; Aykaç, A.; Erol, M.; Erdem, Ç.; Hano, H.; Uzunbayir, B.; Şen, M.; Erdem, A. ;Synthesis of hierarchical hetero-composite of graphene foam/α-Fe2O3 nanowires and its application on glucose biosensors. J. Alloy. Compd. 2022, 895, 162688. [Google Scholar] [CrossRef]
- Bai, J.; Shen, R.; Chen, W.; Xie, J.; Zhang, P.; Jiang, Z.; Li, X. Enhanced photocatalytic H2 evolution based on a Ti3C2/Zn0.7Cd0.3S/Fe2O3 Ohmic/S-scheme hybrid heterojunction with cascade 2D coupling interfaces. Chem. Eng. J. 2022, 429, 132587. [Google Scholar] [CrossRef]
- Barbero, N.; Vione, D. Why does should not be used to test the photocatalytic activity of semiconductor oxides. Environ. Sci. Technol. 2016, 50, 2130. [Google Scholar] [CrossRef]
- Sapkota, K.P.; Lee, I.; Hanif, M.A.; Islam, M.A.; Akter, J.; Hahn, J.R. Enhanced visible-light photocatalysis of nanocomposites of copper oxide and single-walled carbon nanotubes for the degradation of methylene blue. Catalysts 2020, 10, 297. [Google Scholar]
- Sorekine, G.; Anduwan, G.; Waimbo, M.N.; Osora, H.; Velusamy, S.; Kim, S.; Kim, Y.S.; Charles, J. Photocatalytic studies of copper oxide nanostructures for the degradation of methylene blue under visible light. J. Mol. Struct. 2022, 1248, 131487. [Google Scholar] [CrossRef]
- Dhiman, S.; Gupta, B. Co3O4 nanoparticles synthesized from waste Li-ion batteries as photocatalyst for degradation of methyl blue dye. Environ. Technol. Innov. 2021, 23, 101765. [Google Scholar] [CrossRef]
- Miri, A.; Mahabbati, F.; Najafidoust, A.; Miri, M.J.; Sarani, M. Nickel oxide nanoparticles: Biosynthesized, characterization and photocatalytic application in degradation of methylene blue dye. Inorg. Nano-Met. Chem. 2022, 52, 122–131. [Google Scholar] [CrossRef]
- Lu, J.; Batjikh, I.; Hurh, J.; Han, Y.; Ali, H.; Mathiyalagan, R.; Ling, C.; Ahn, J.C.; Yang, D.C. Photocatalytic degradation of methylene blue using biosynthesized zinc oxide nanoparticles from bark extract of Kalopanaxseptemlobus. Optik 2019, 182, 980–985. [Google Scholar] [CrossRef]
- Narath, S.; Koroth, S.K.; Shankar, S.S.; George, B.; Mutta, V.; Wacławek, S.; Černík, M.; Padil, V.V.T.; Varma, R.S. Cinnamomumtamala leaf extract stabilized zinc oxide nanoparticles: A promising photocatalyst for methylene blue degradation. Nanomaterials 2021, 11, 1558. [Google Scholar] [CrossRef]
- Raghavan, N.; Thangavel, S.; Venugopal, G. Enhanced photocatalytic degradation of methylene blue by reduced graphene-oxide/titanium dioxide/zinc oxide ternary nanocomposites. Mater. Sci. Semicond. Process. 2015, 30, 321–329. [Google Scholar] [CrossRef]
- Whang, T.-J.; Huang, H.Y.; Hsieh, M.T.; Chen, J.J. Laser-induced silver nanoparticles on titanium oxide for photocatalytic degradation of methylene blue. Int. J. Mol. Sci. 2009, 10, 4707–4718. [Google Scholar] [CrossRef] [Green Version]
- Sackey, J.; Bashir, A.K.H.; Ameh, A.E.; Nkosi, M.; Kaonga, C.; Maaza, M. Date pits extracts assisted synthesis of magnesium oxides nanoparticles and its application towards the photocatalytic degradation of methylene blue. J. King Saud Univ.-Sci. 2020, 32, 2767–2776. [Google Scholar] [CrossRef]
- Patil, H.R.; Murthy, Z.V.P. Vanadium-doped magnesium oxide nanoparticles formation in presence of ionic liquids and their use in photocatalytic degradation of methylene blue. Acta Metall. Sin. Engl. Lett. 2016, 29, 253–264. [Google Scholar] [CrossRef] [Green Version]
- He, W.; Kim, H.K.; Wamer, W.G.; Melka, D.; Callahan, J.H.; Yin, J.J. Photogenerated charge carriers and reactive oxygen species in ZnO/Au hybrid nanostructures with enhanced photocatalytic and antibacterial activity. J. Am. Chem. Soc. 2014, 136, 750–757. [Google Scholar] [CrossRef]
- Maezono, T.; Tokumura, M.; Sekine, M.; Kawaswe, Y. Hydroxyl radical concentration profile in photo-Fenton oxidation process: Generation and consumption of hydroxyl radicals during the discoloration of azo-dye Orange II. Chemosphere 2011, 82, 1422–1430. [Google Scholar] [CrossRef]


| Precursors | Synthesized Method | Temperature | MS emu/g | HC Oe | Mr emu/g | Reference |
|---|---|---|---|---|---|---|
| FeCl3 | Green | 60 °C/2 h | 10.01 | 200 | 1.03 | [29] |
| FeCl3·6H2O | Green | 60 °C/2 h | 8.5 | [30] | ||
| Fe(C5H7O2)3 | Chemical | 400 °C/6 h | 0.41 | [31] | ||
| FeCl3 | Chemical | 300 °C/1 h | 66.6 | SPM | [32] | |
| FeCl3 | Chemical | 600 °C/3 h | 0.3152 | 771.52 | 0.0369 | [33] |
| FeNO3 | Chemical | 500 °C/5 h | 1.7 | 200 | [34] | |
| Fe(NO3)3·9H2O | Green | 600 °C/2 h | 0.8448 | 501.18 | 0.25531 | Present Work |
| S. No | D (nm) | FTIR Metal Oxide Bond (cm−1) | Band Gap Eg (eV) | Reference | |
|---|---|---|---|---|---|
| 1 | 38 | 527 | 434 | 2.13 | [38] |
| 2 | 37.6 | 545 | 480 | 2.53 | [39] |
| 3 | 33 | 525 | 433 | 2.01 | Present work |
| Si No | Compound Name | Dye Source | Degradation Efficiency | Dye Volume | Catalytic Load | Reference |
|---|---|---|---|---|---|---|
| 1 | CuO-SWCNT | MB | 97.33%/2 h | 100 mL | 150 mg | [52] |
| 2 | CuO | MB | 78%/120 min | 50 mL (10 ppm) | 50 mg | [53] |
| 3 | Co3O4 | MB | 86%/45 min | 20 mL 50 mg/L | 5 mg | [54] |
| 4 | NiO NPs | MB | 65.5%/180 min | 20 mL | 10 mg | [55] |
| 5 | ZnO | MB | 97.5%/30 min | 20mL | 0.5mg | [56] |
| 6 | ZnO NPs | MB | 98%/90 min | 50 mL (10 µM) | 5–15 mg | [57] |
| 7 | rGO/TiO2/ ZnO | MB | 92%/120 min | 100 mL (0.3 mg/L) | 0.1 g/L | [58] |
| 8 | Ag doped TiO2) | MB | 82.3%/2 h | 100 mL (7000 mg/L) | 1.0 g | [59] |
| 9 | MgO | MB | 64%/150 min | 25.0 mL | 10.0 mg | [60] |
| 10 | Vanadium-doped MgO nanoparticles | MB | 92%/120 min | 400 mL (10 ppm) | 50 mg (125 mg/L) | [61] |
| Zone of Inhibition (mm) | ||||||
|---|---|---|---|---|---|---|
| Bacillus subtilis | Staphylococcus aureus | Pseudomonas aeruginosa | E. coli | Pencilium sp. | Aspergillus niger | Aspergillus flavus |
| 7 | 10 | 8 | 10 | 9 | 7 | 8 |
Publisher’s Note: MDPI stays neutral with regard to jurisdictional claims in published maps and institutional affiliations. |
© 2022 by the authors. Licensee MDPI, Basel, Switzerland. This article is an open access article distributed under the terms and conditions of the Creative Commons Attribution (CC BY) license (https://creativecommons.org/licenses/by/4.0/).
Share and Cite
Sharmila, M.; Mani, R.J.; Parvathiraja, C.; Kader, S.M.A.; Siddiqui, M.R.; Wabaidur, S.M.; Islam, M.A.; Lai, W.-C. Photocatalytic Dye Degradation and Bio-Insights of Honey-Produced α-Fe2O3 Nanoparticles. Water 2022, 14, 2301. https://doi.org/10.3390/w14152301
Sharmila M, Mani RJ, Parvathiraja C, Kader SMA, Siddiqui MR, Wabaidur SM, Islam MA, Lai W-C. Photocatalytic Dye Degradation and Bio-Insights of Honey-Produced α-Fe2O3 Nanoparticles. Water. 2022; 14(15):2301. https://doi.org/10.3390/w14152301
Chicago/Turabian StyleSharmila, Mohamed, Ramasamy Jothi Mani, Chelliah Parvathiraja, Sheik Mohammed Abdul Kader, Masoom Raza Siddiqui, Saikh Mohammad Wabaidur, Md Ataul Islam, and Wen-Cheng Lai. 2022. "Photocatalytic Dye Degradation and Bio-Insights of Honey-Produced α-Fe2O3 Nanoparticles" Water 14, no. 15: 2301. https://doi.org/10.3390/w14152301