
How Can We Identify Active, Former, and Potential Floodplains? Methods and Lessons Learned from the Danube River


 , ,
, ,  ,
,  , , , , , , ,
Abstract
:1. Introduction
1.1. Research Context
1.2. Background
1.3. Research Questions
- What are the most suitable methods for identifying active, former, and potential floodplains?
- Where are the active, former, and potential floodplains along the Danube River, and what are their land uses?
- What is the ratio between active, former, and potential floodplains along the Danube River?
2. Material and Methods
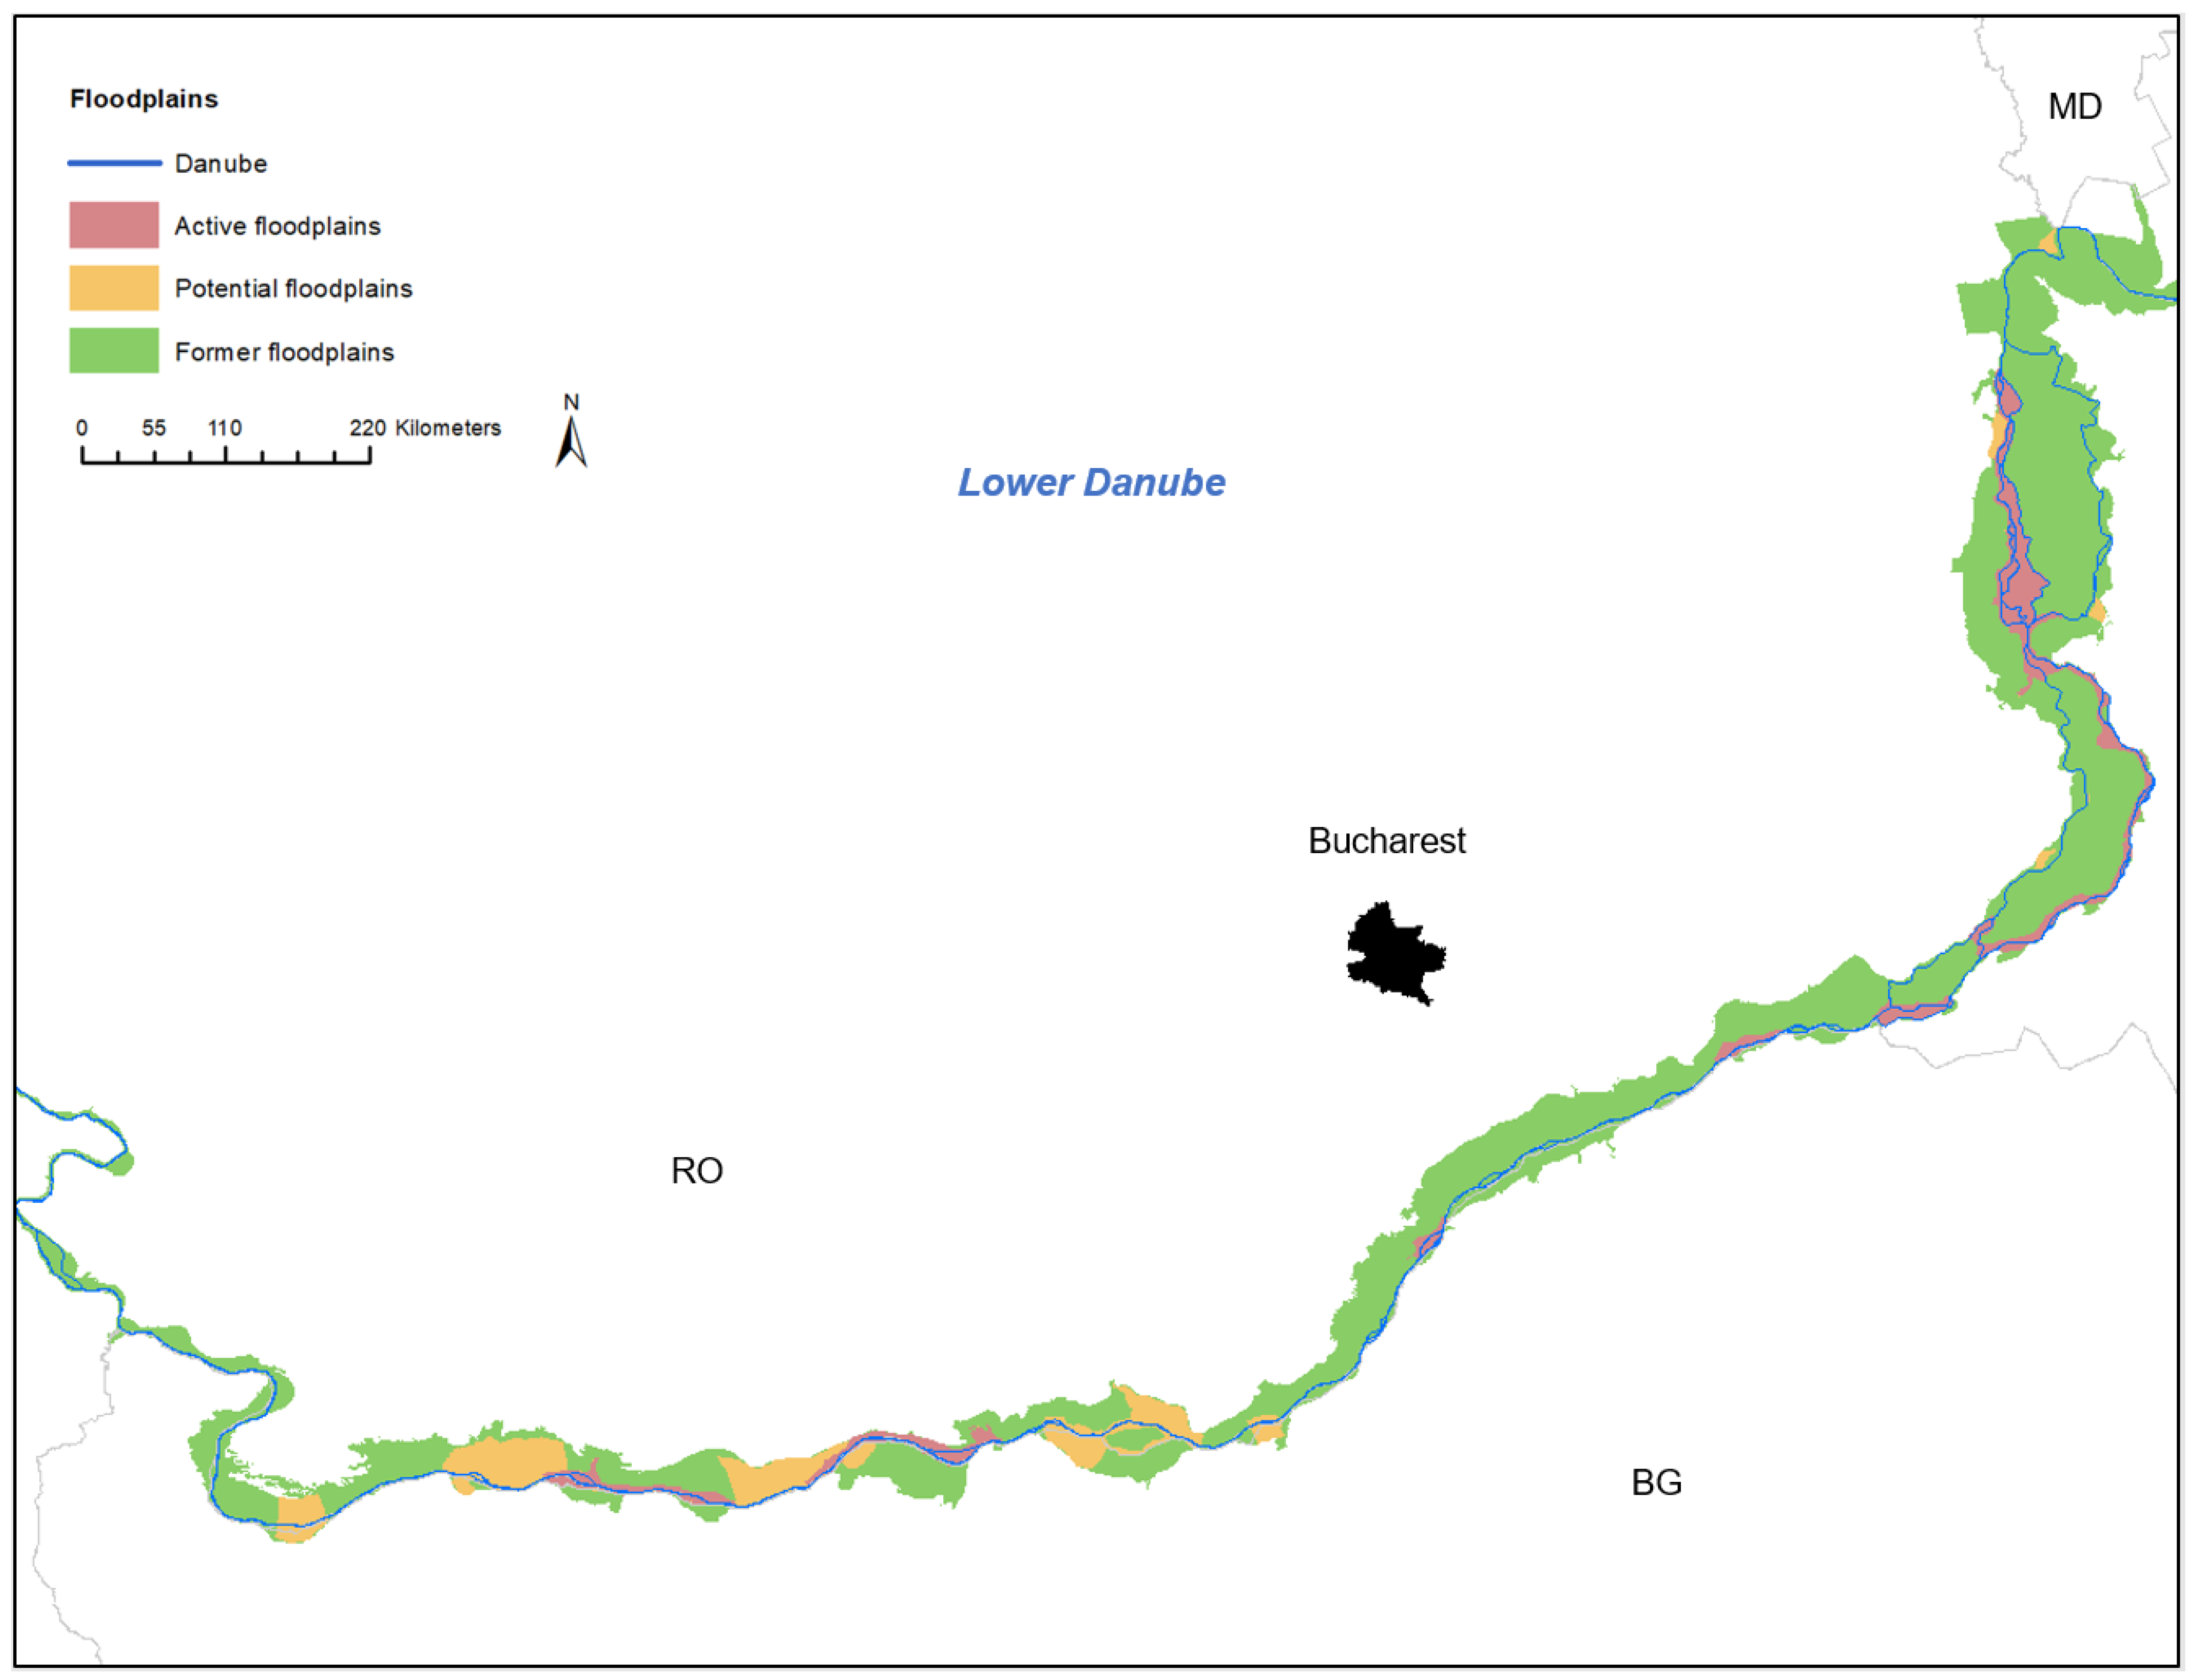
2.1. Study Area—Danube River
2.2. Data Sources
2.3. Identification of Active, Former, and Potential Floodplains
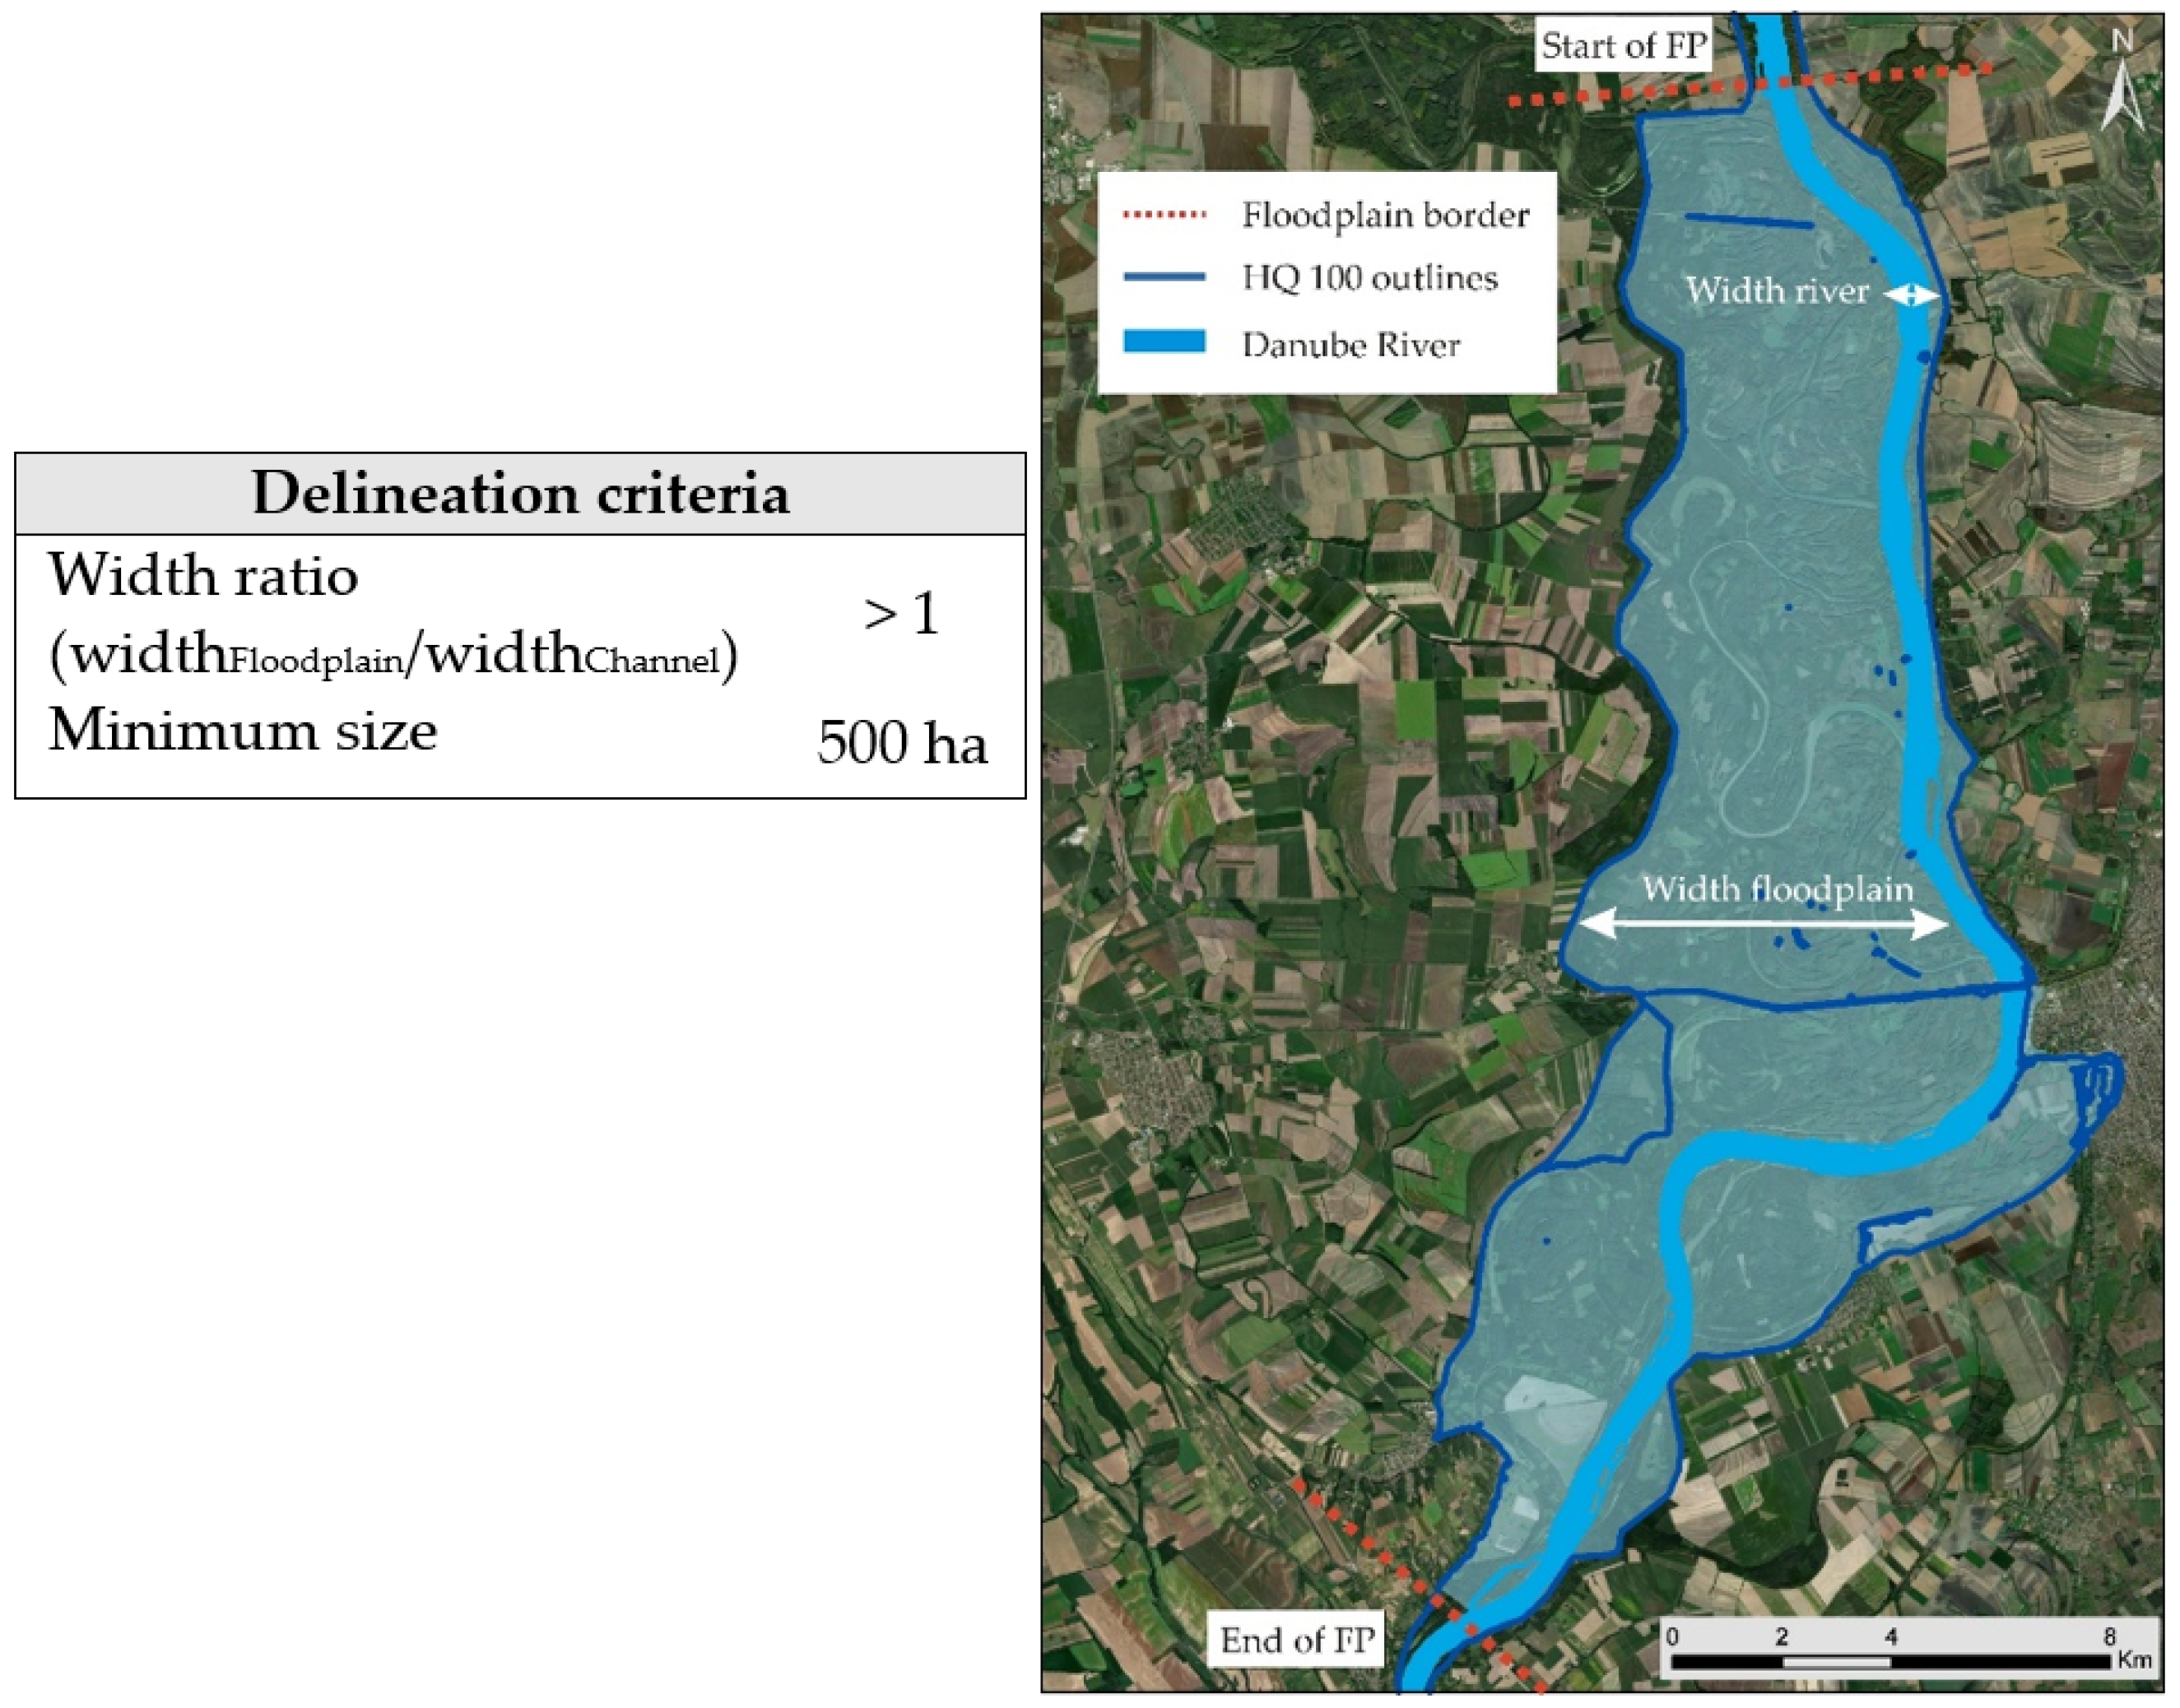
2.3.1. Active Floodplains
- 1st group: floodplains with delineated start- and endpoint and larger than the defined minimum size;
- 2nd group: floodplains with delineated start- and endpoint but smaller than the minimum size;
- 3rd group: riparian zones, where the two delineation criteria are not fulfilled.
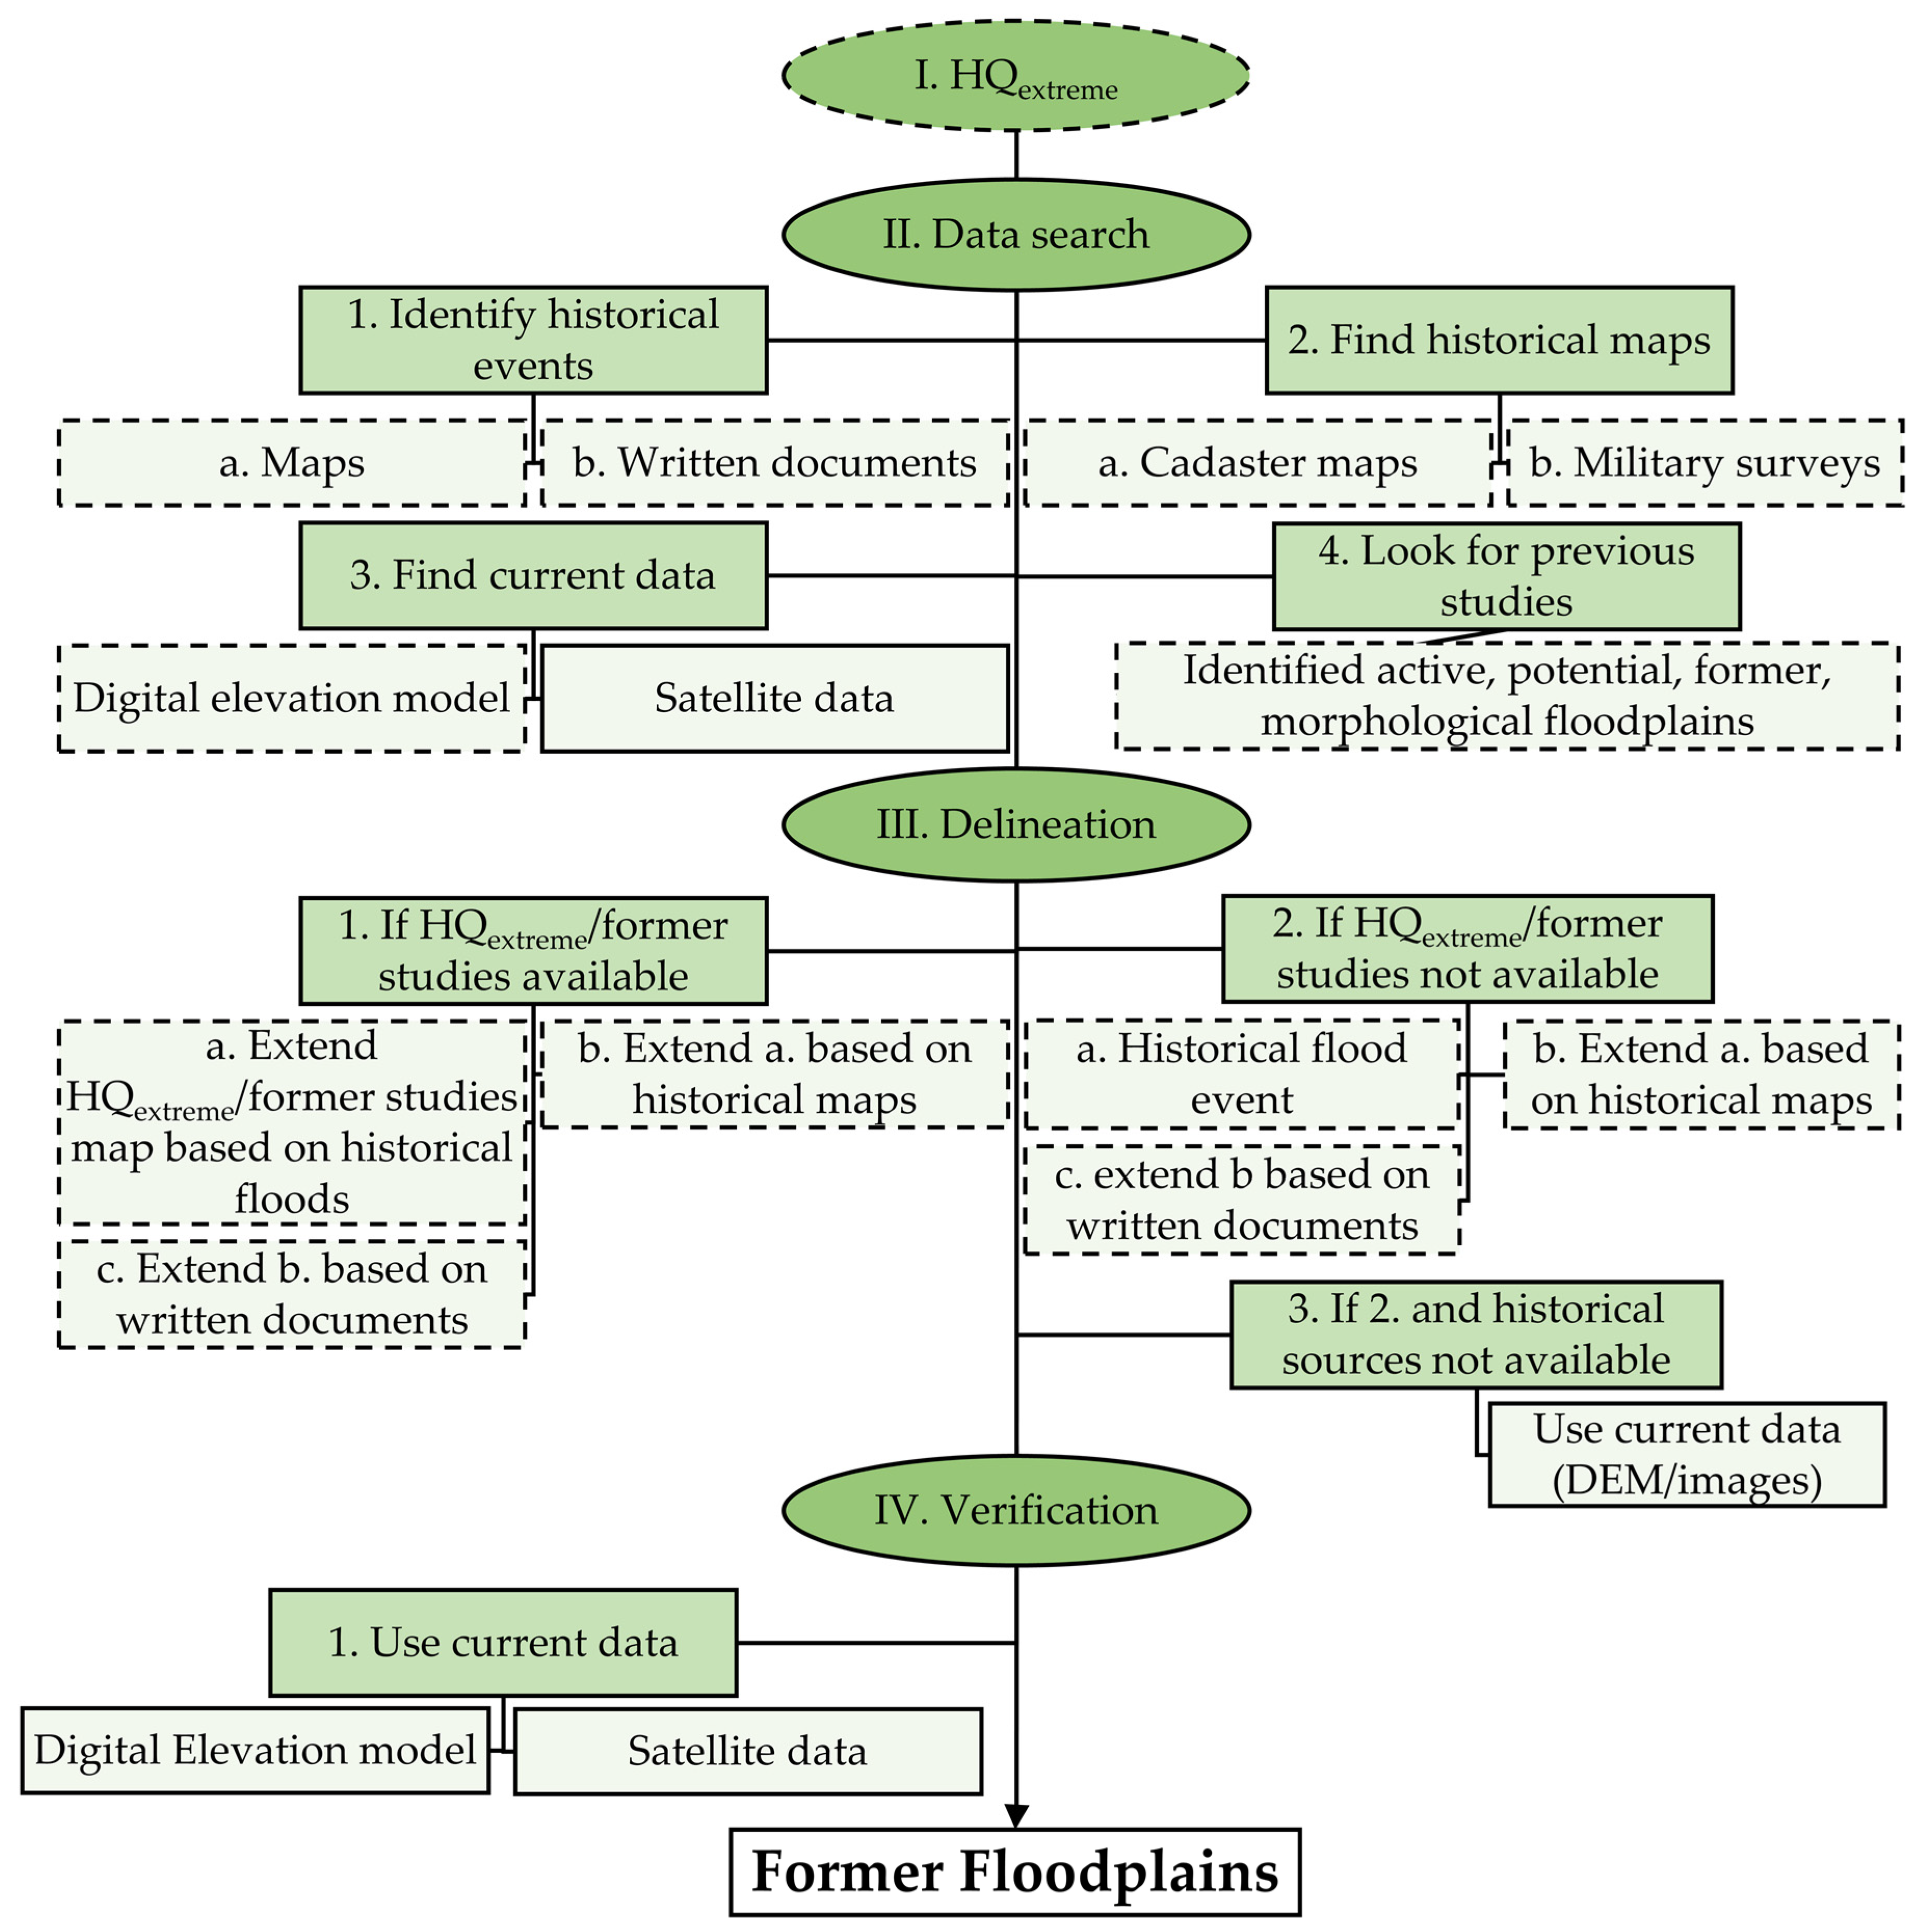
2.3.2. Former Floodplains
- Step I: Estimation of former floodplains with current HQextreme outlines
- Step II + III: Search for data sources (historical, current) and delineation of former floodplains
- Step IV: Verification of former floodplains with DEM and satellite images
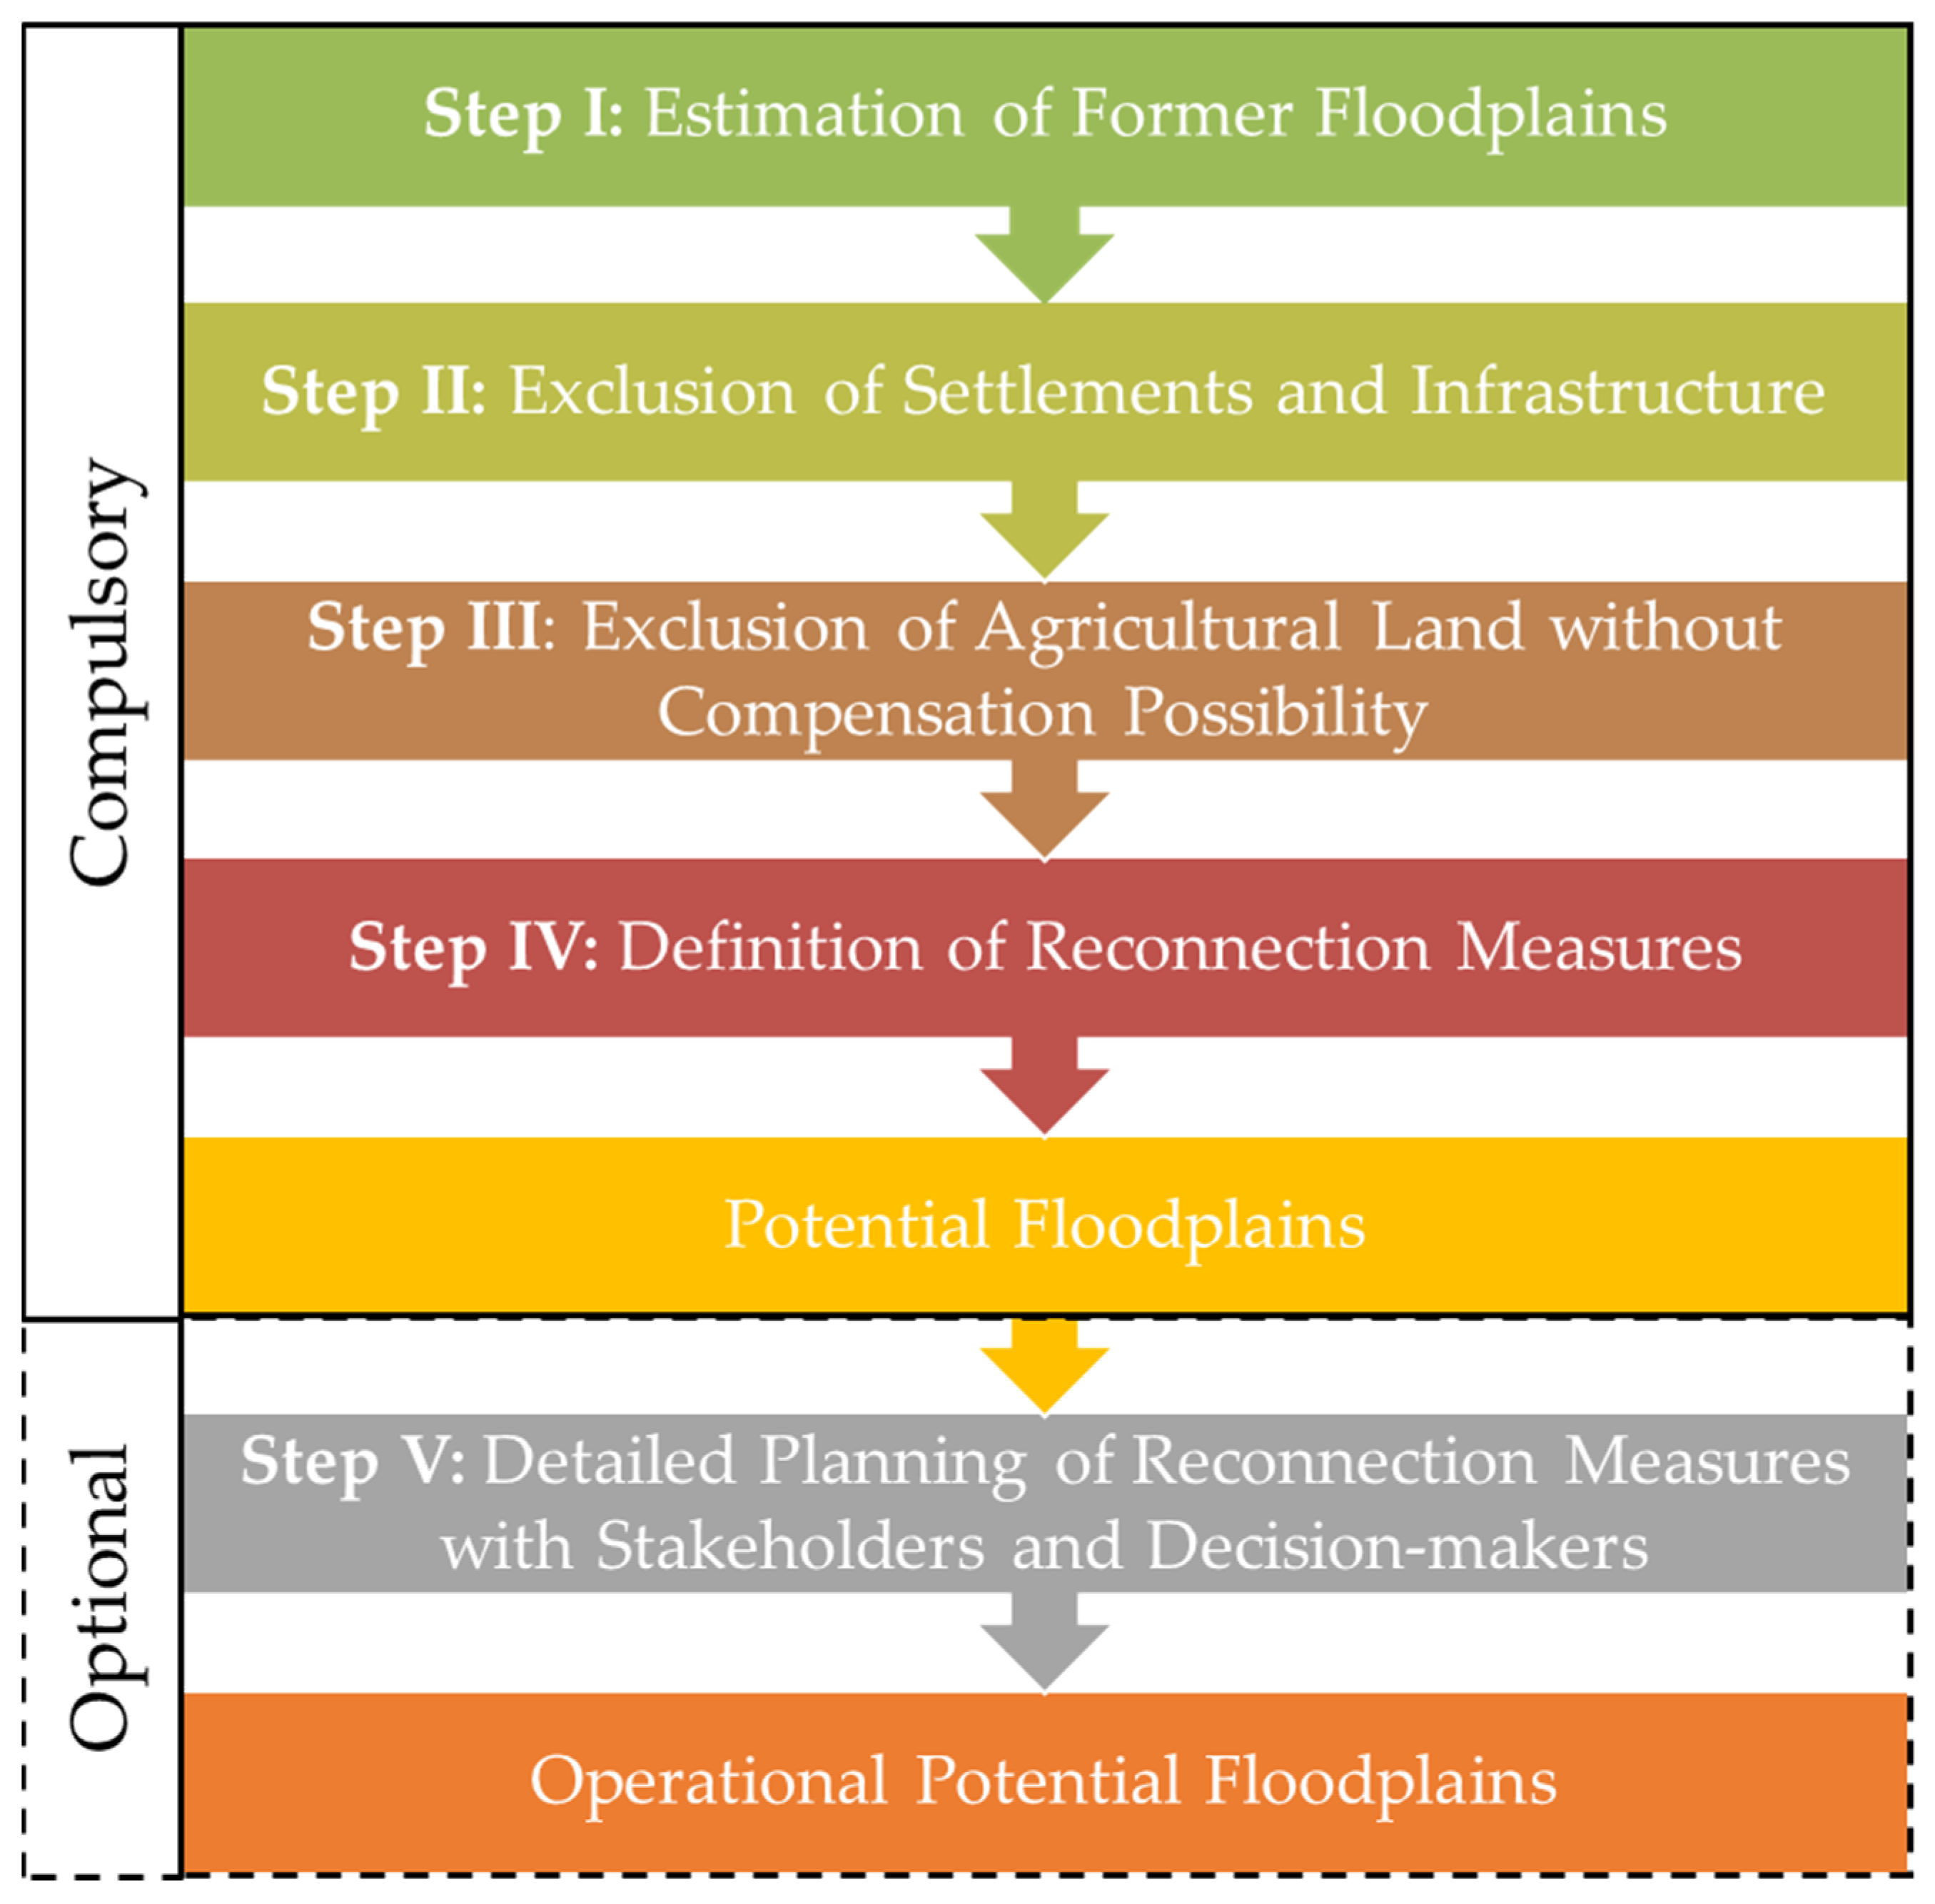
2.3.3. Potential Floodplains
- Step I: Estimation of Former Floodplains
- Step II: Exclusion of Settlements and Infrastructure
- Step III: Exclusion of Agricultural Land without Compensation Possibility
- Step IV: Definition of Restoration Measures
- Step V: Detailed Planning of Restoration Measures with Stakeholders and Decision Makers
2.3.4. Naming Convention
- The 1st transboundary active floodplain at the Danube River between Austria and Slovakia, AT_SK_DU_AFP_01;
- The 4th potential floodplain at the Danube River in Germany, DE_DU_PFP_04.
3. Results
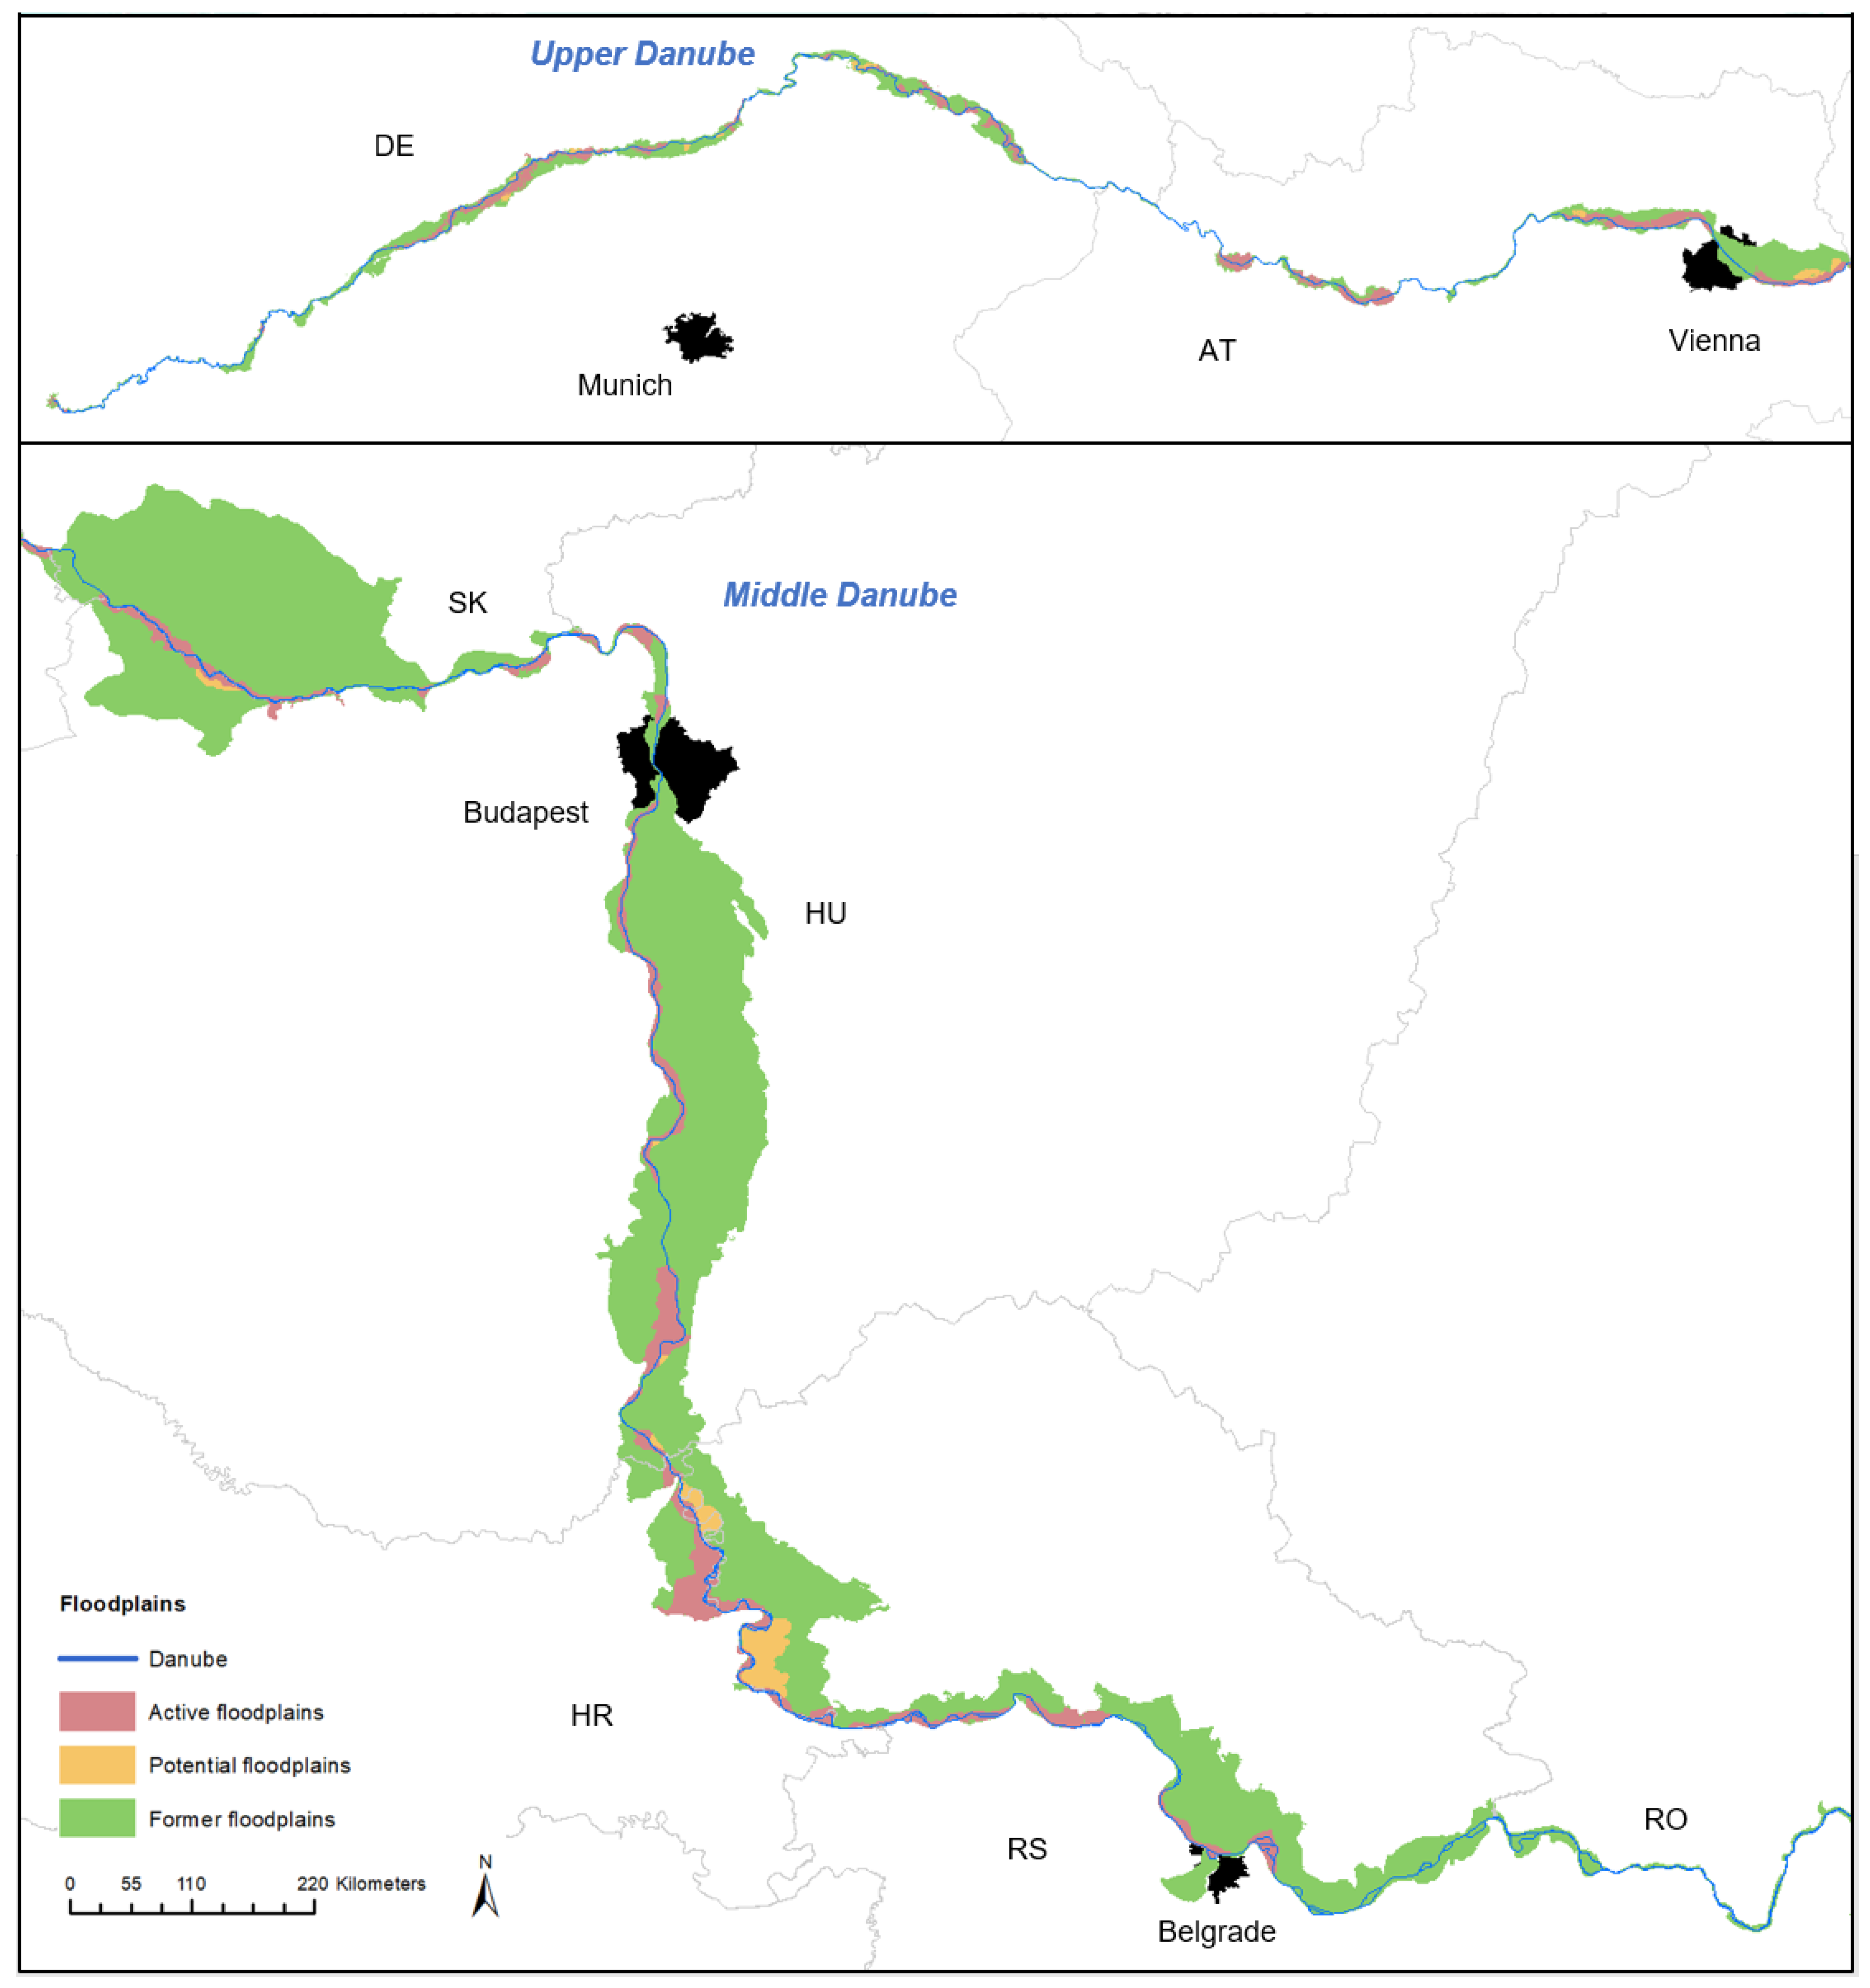
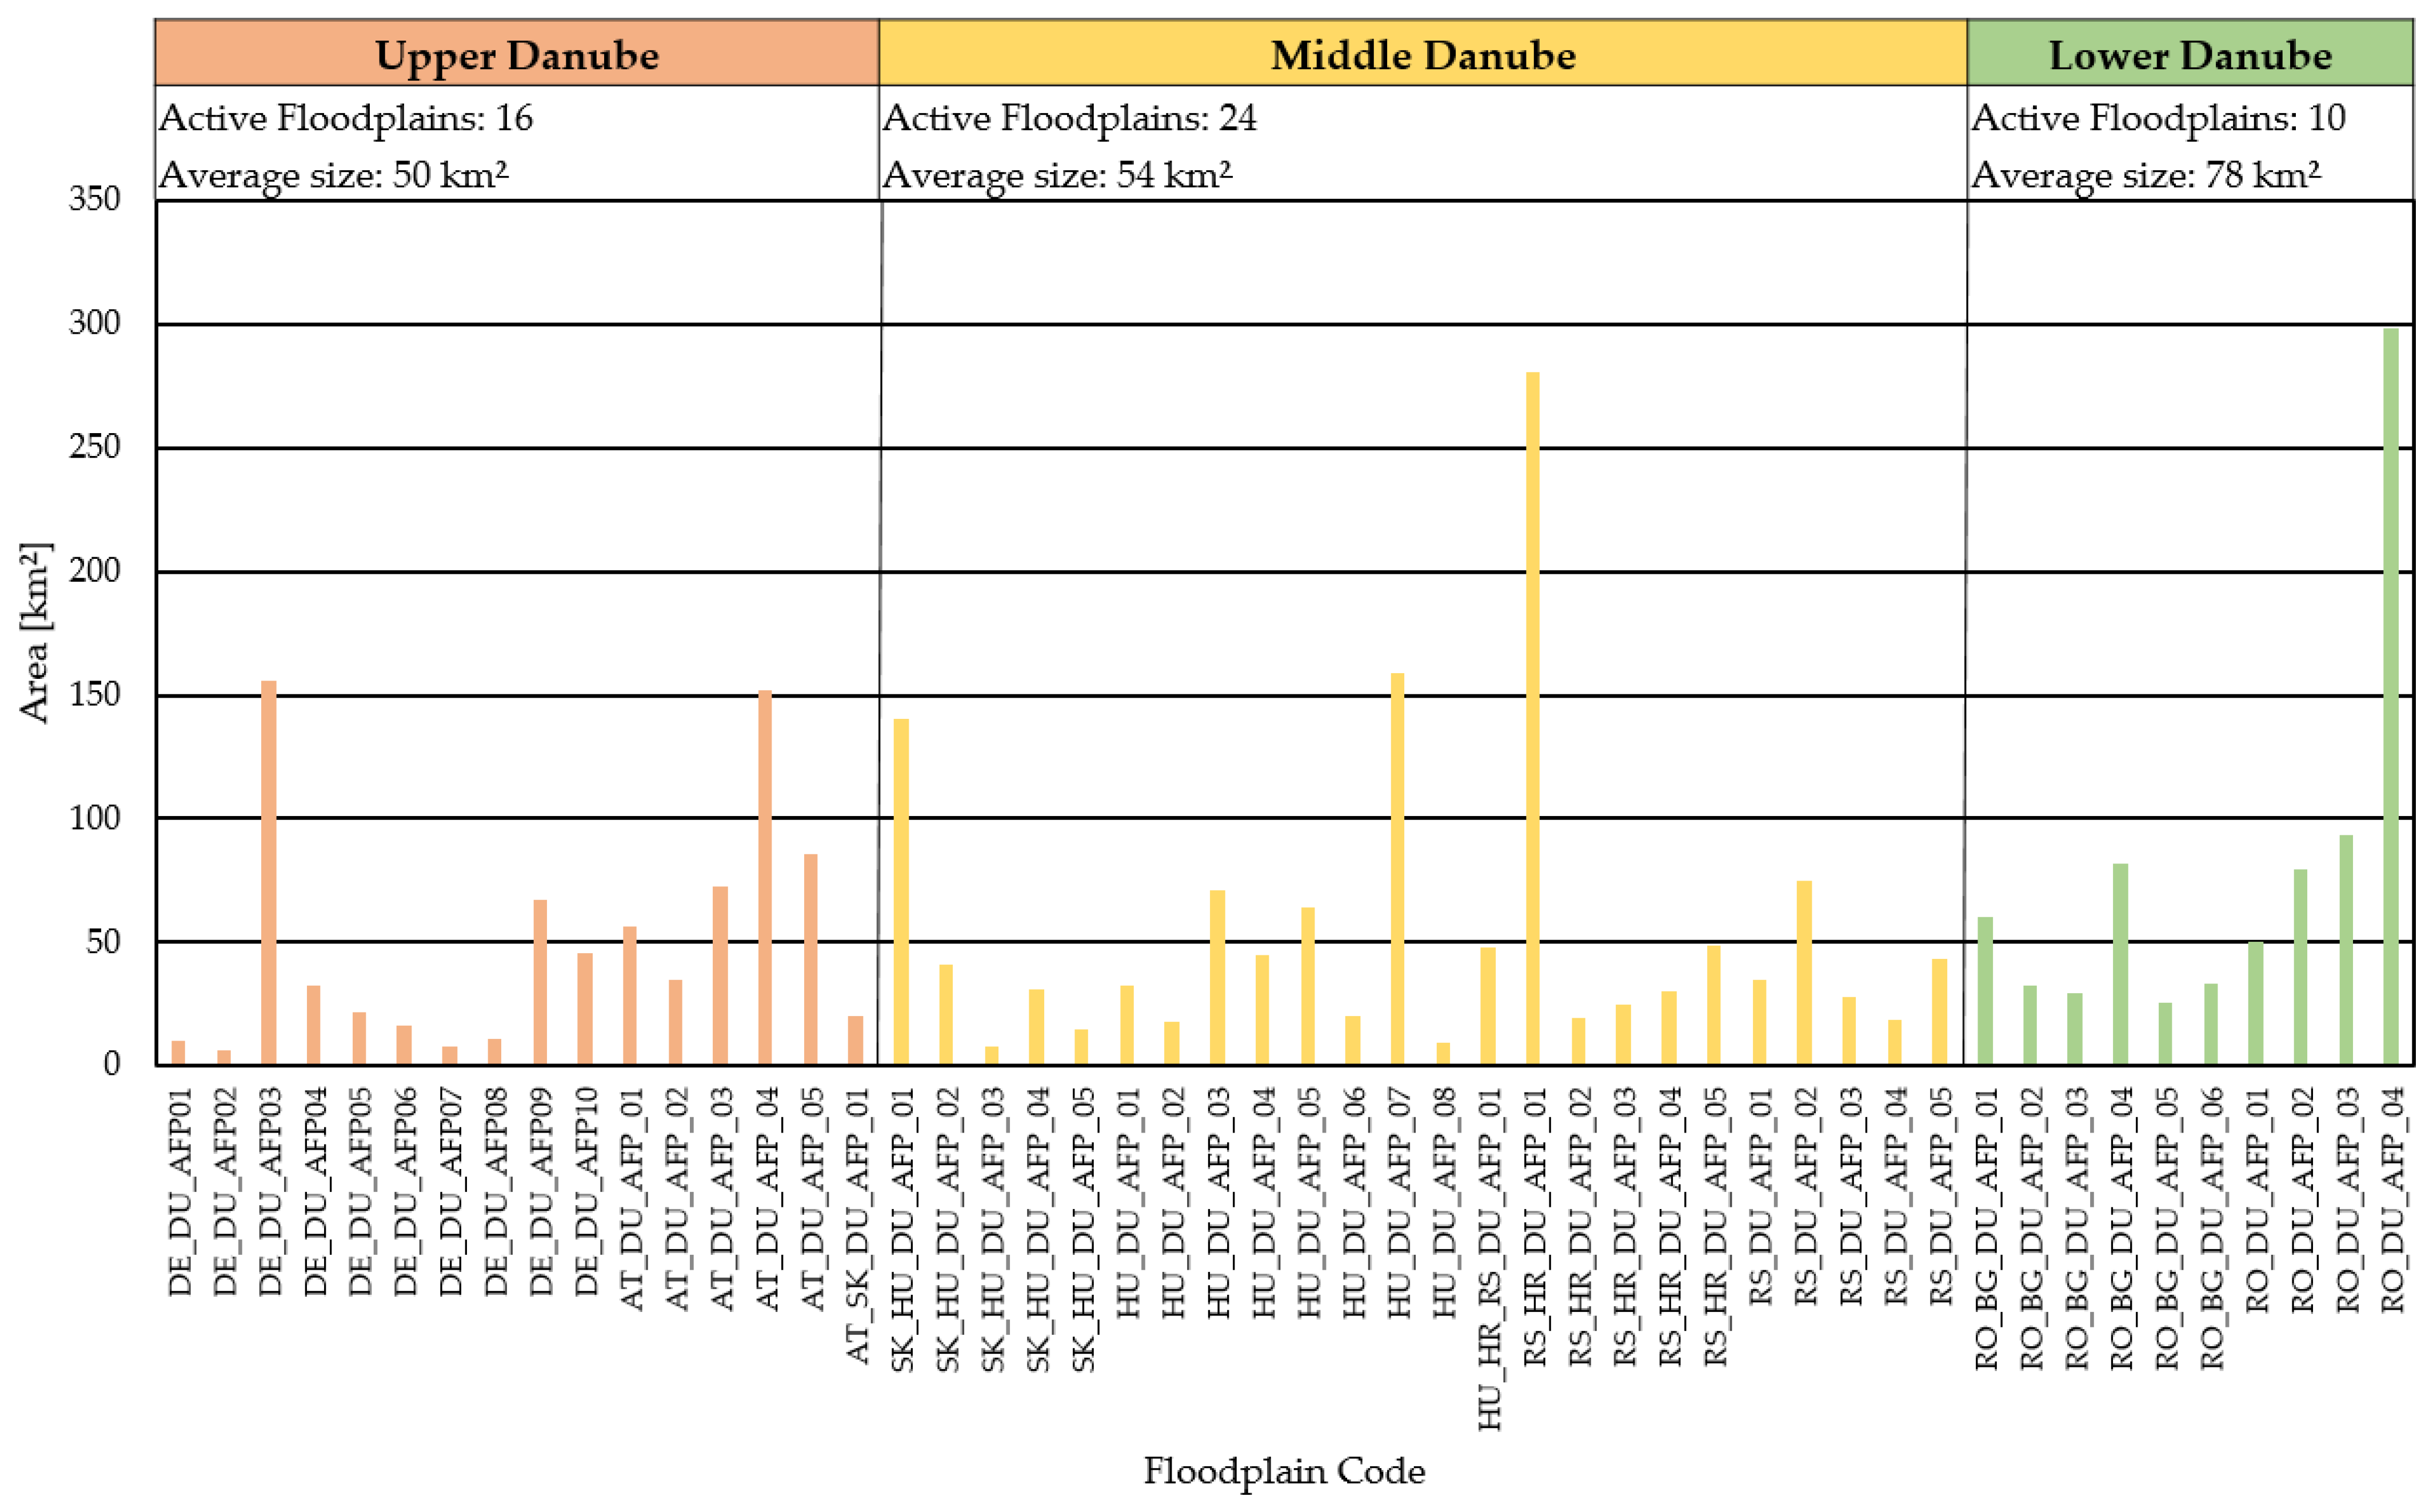
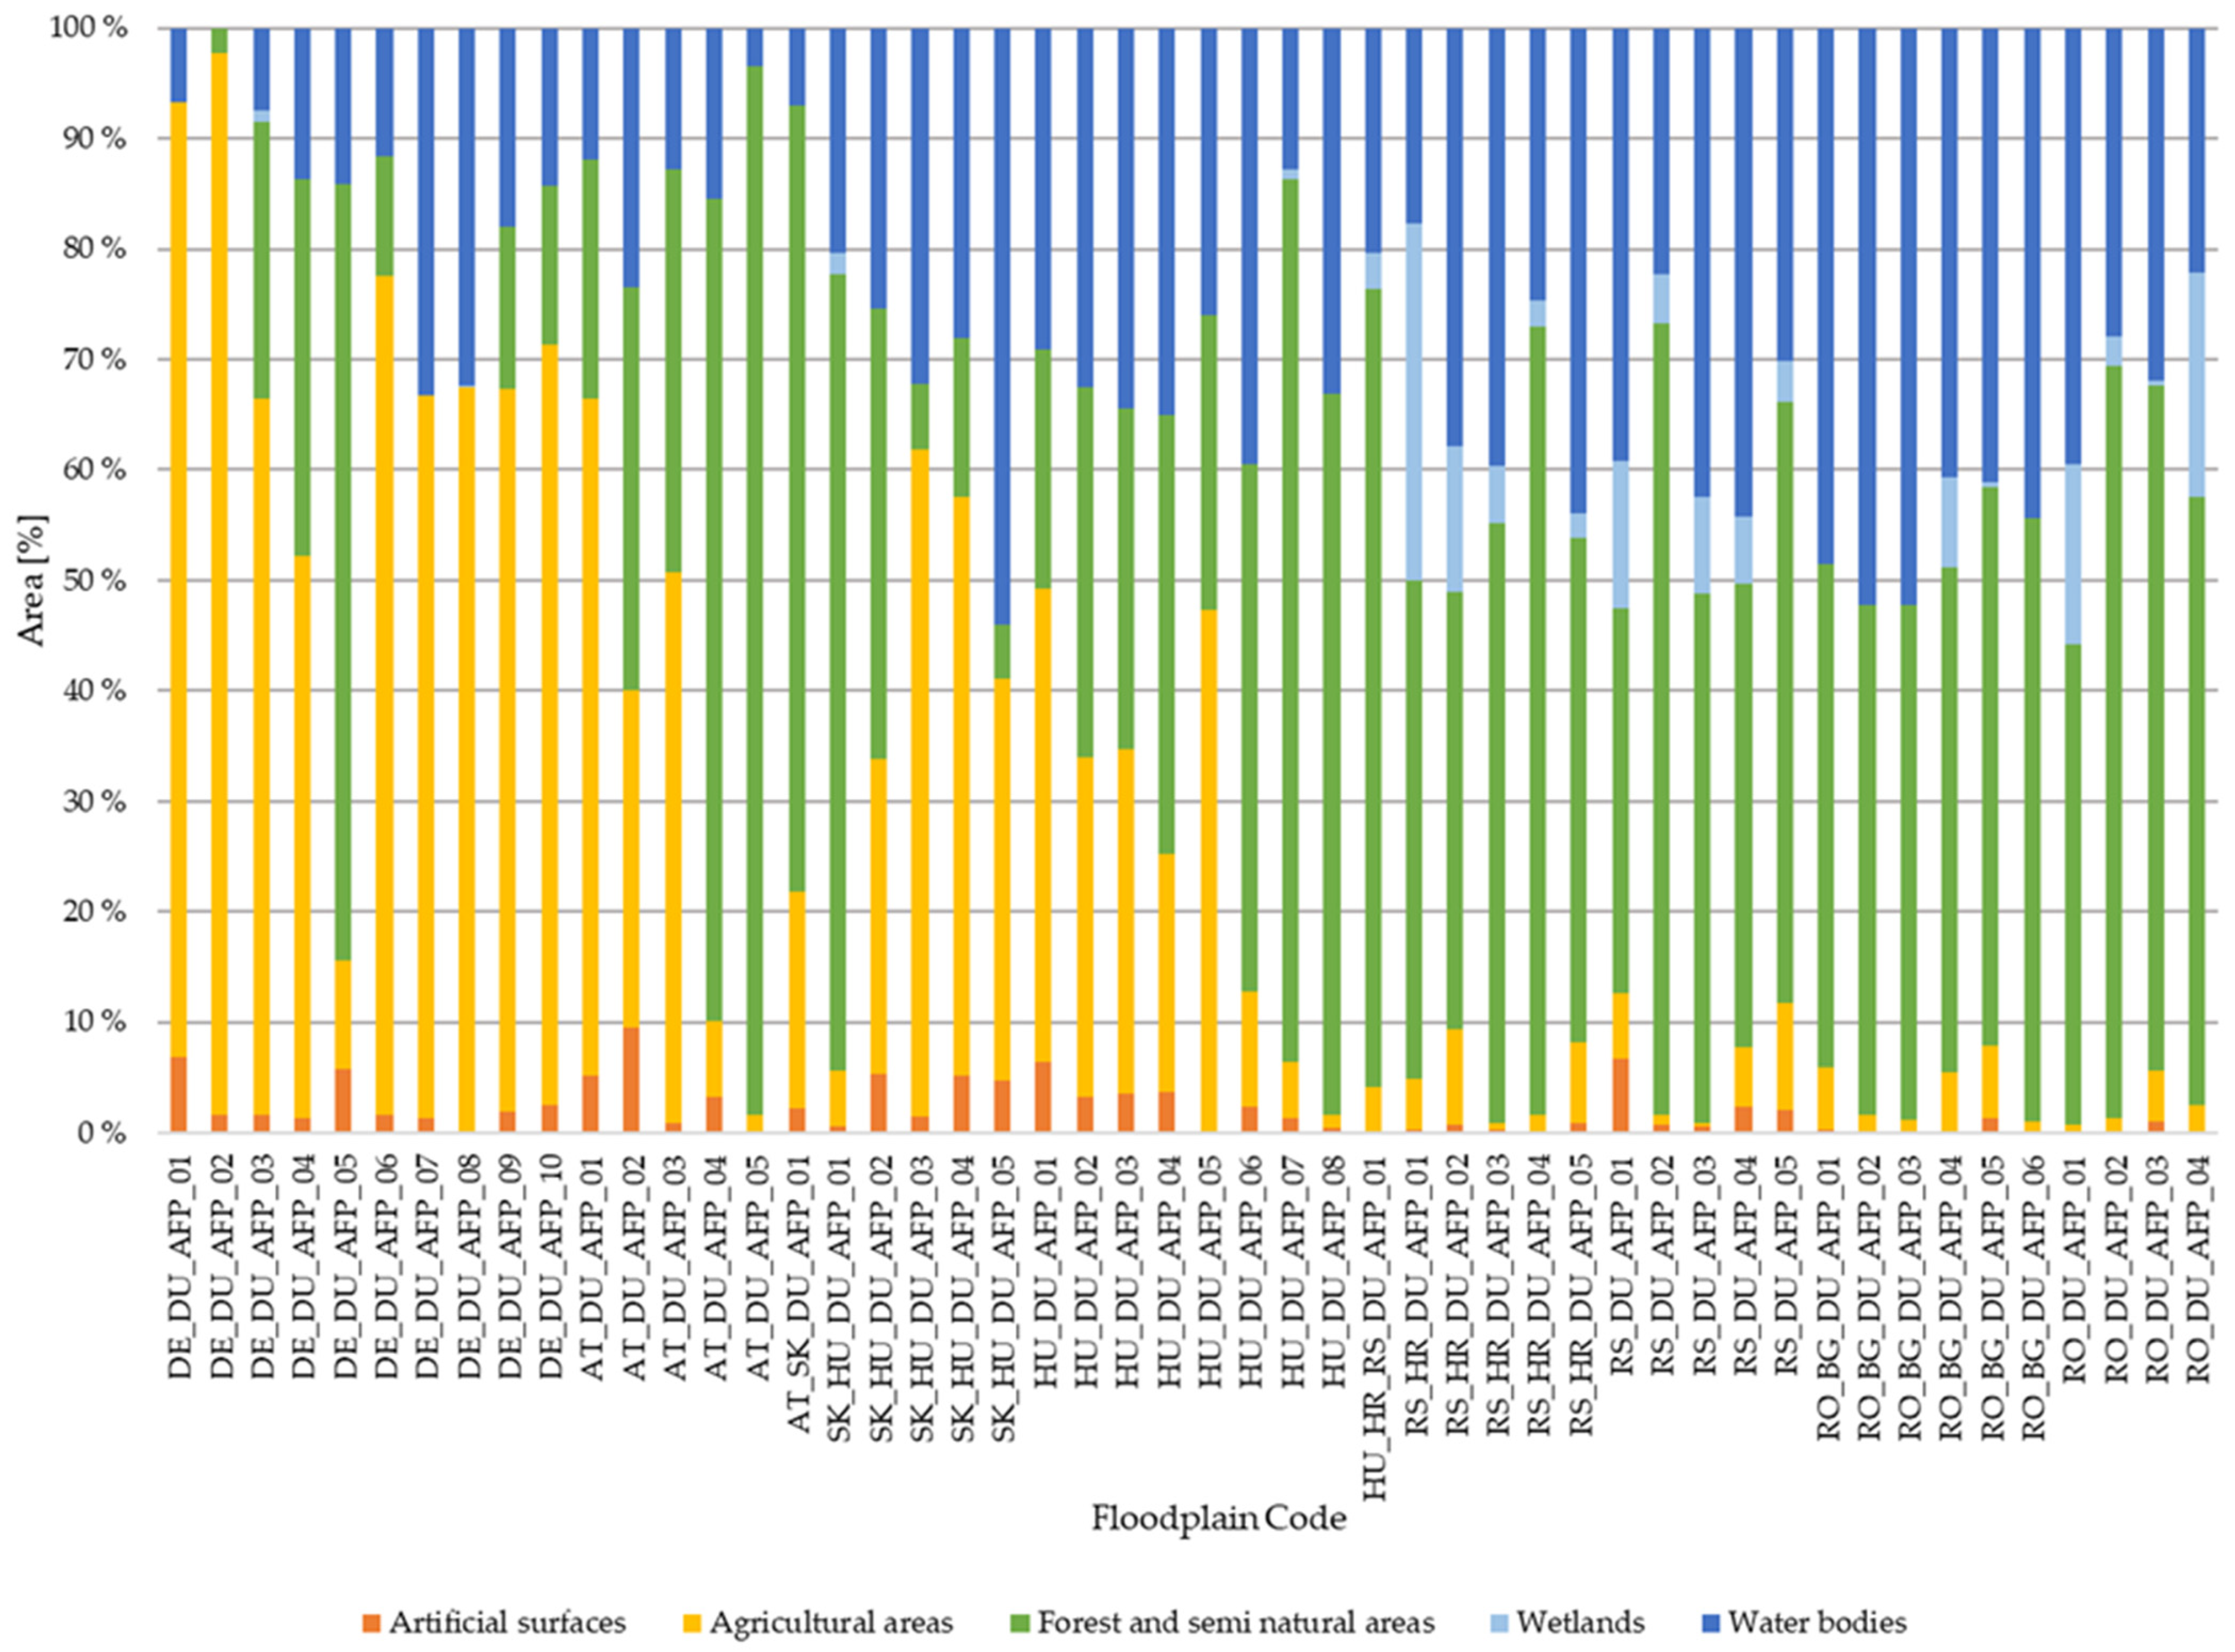
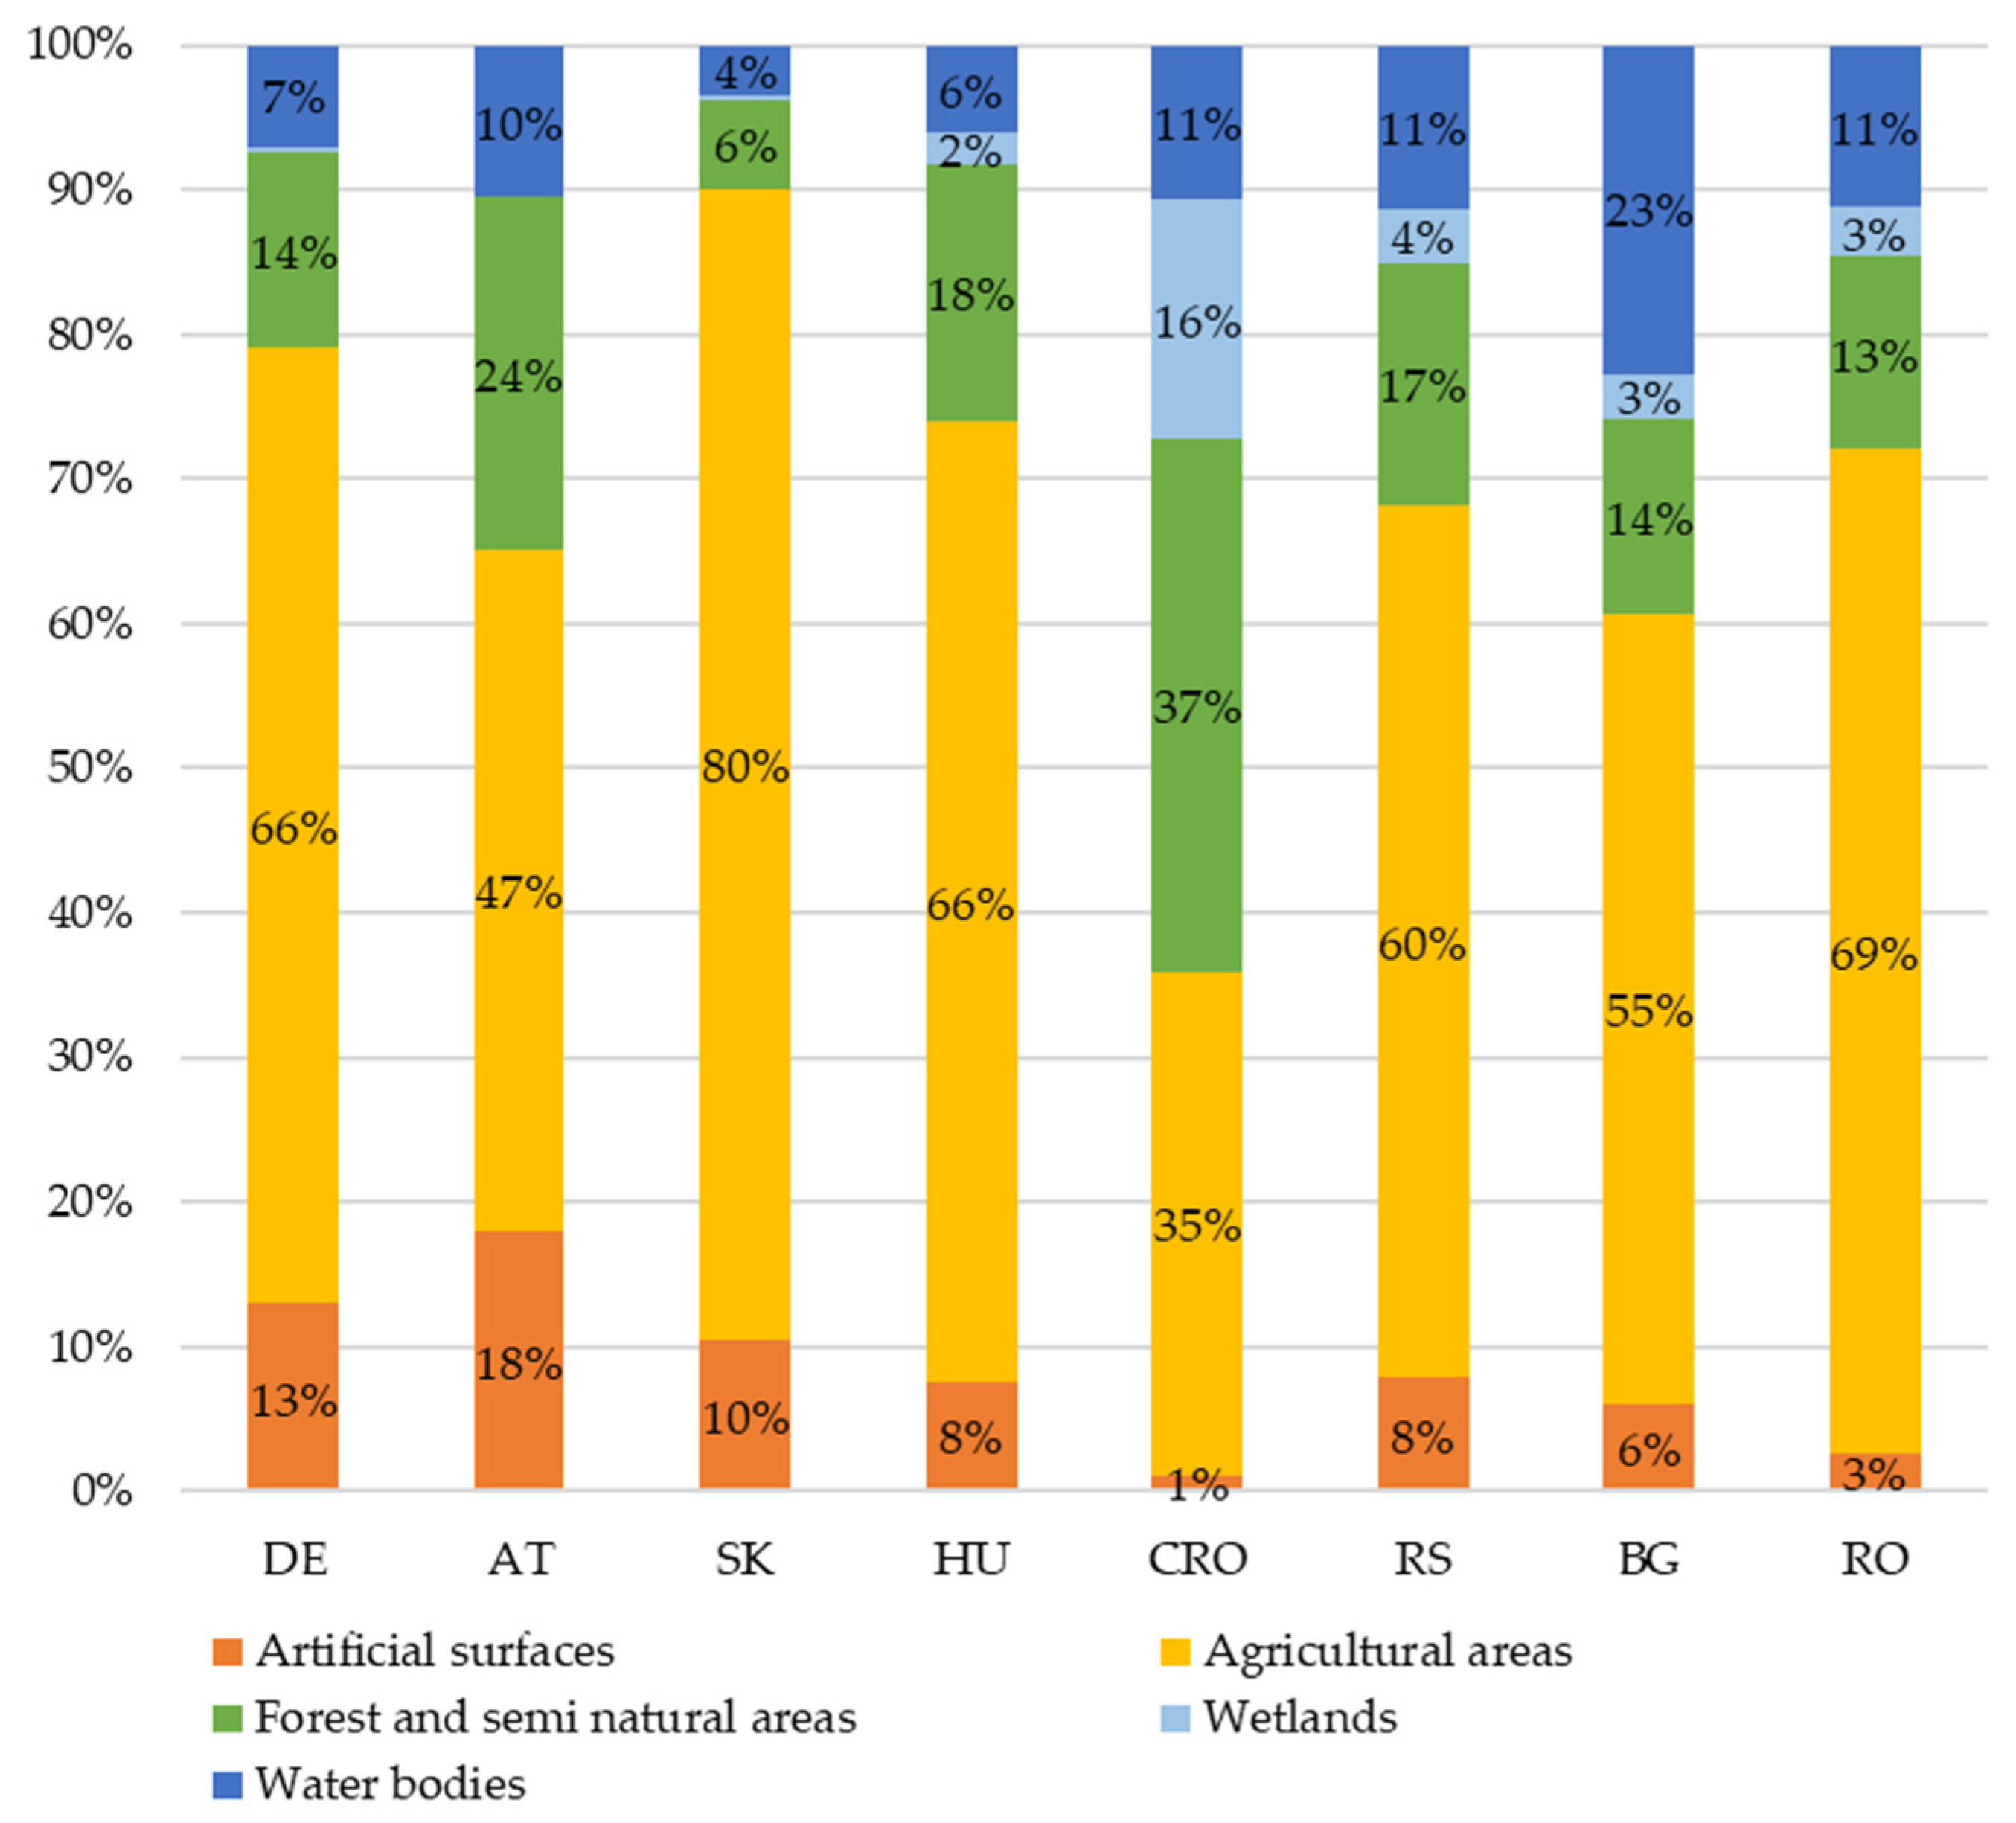
3.1. Active Floodplains along the Danube River
3.2. Former Floodplains along the Danube River
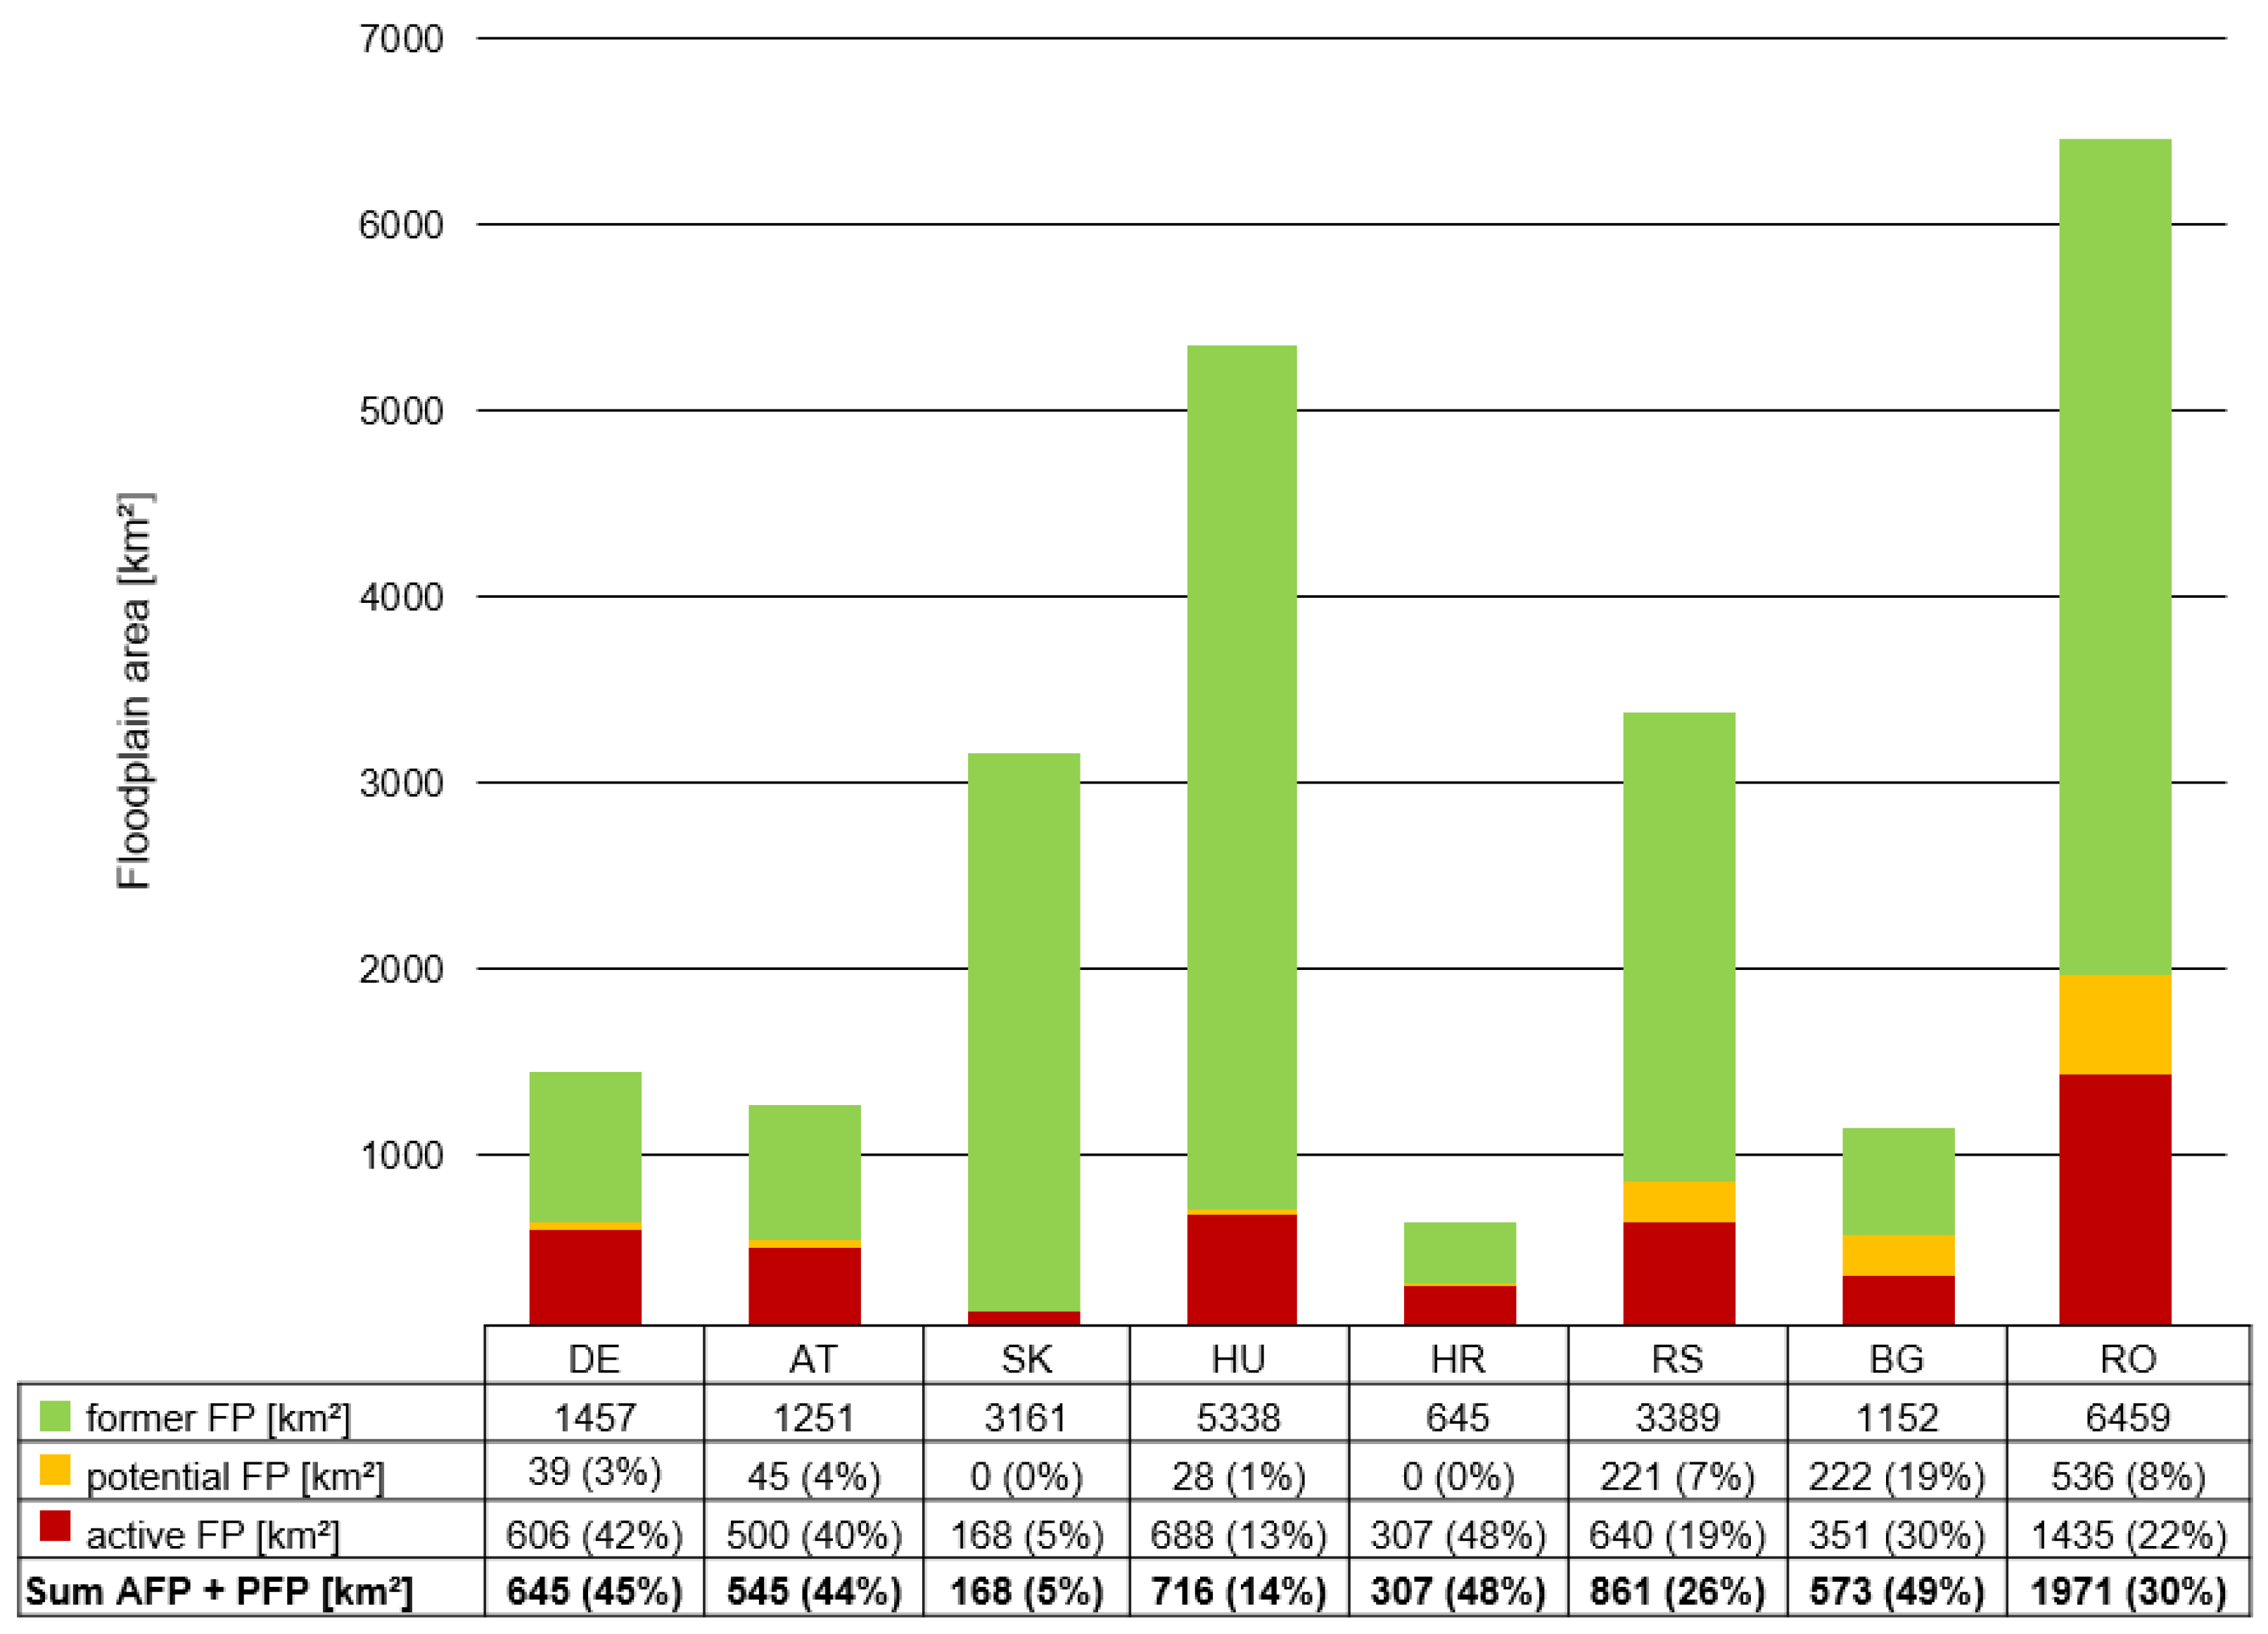
3.3. Potential Floodplains along the Danube River
4. Discussion
4.1. Methods for Identifying Active, Former, and Potential Floodplains
4.2. Active, Former, and Potential Floodplains at the Danube River
4.3. Floodplain Management
5. Conclusions
Author Contributions
Funding
Institutional Review Board Statement
Informed Consent Statement
Data Availability Statement
Acknowledgments
Conflicts of Interest
Appendix A

References
- Funk, A.; Martínez-López, J.; Borgwardt, F.; Trauner, D.; Bagstad, K.J.; Balbi, S.; Magrach, A.; Villa, F.; Hein, T. Identification of Conservation and Restoration Priority Areas in the Danube River Based on the Multi-Functionality of River-Floodplain Systems. Sci. Total Environ. 2019, 654, 763–777. [Google Scholar] [CrossRef] [PubMed]
- Schindler, S.; Sebesvari, Z.; Damm, C.; Euller, K.; Mauerhofer, V.; Schneidergruber, A.; Biró, M.; Essl, F.; Kanka, R.; Lauwaars, S.G.; et al. Multifunctionality of Floodplain Landscapes: Relating Management Options to Ecosystem Services. Landsc. Ecol. 2014, 29, 229–244. [Google Scholar] [CrossRef]
- Meli, P.; Rey Benayas, J.M.; Balvanera, P.; Martínez Ramos, M. Restoration Enhances Wetland Biodiversity and Ecosystem Service Supply, but Results Are Context-Dependent: A Meta-Analysis. PLoS ONE 2014, 9, e93507. [Google Scholar] [CrossRef] [PubMed]
- Opperman, J.; Luster, R.A.; McKenney, B.; Roberts, M.; Meadows, A.W. Ecologically Functional Floodplains: Connectivity, Flow Regime, and Scale 1. JAWRA J. Am. Water Resour. Assoc. 2010, 46, 211–226. [Google Scholar] [CrossRef]
- Habersack, H.; Schober, B. Floodplain Evaluation Matrix FEM: A Multiparameter Assessment Methodology. J. Flood Risk Manag. 2020, 13, e12614. [Google Scholar] [CrossRef] [Green Version]
- Schober, B.; Hauer, C.; Habersack, H. A Novel Assessment of the Role of Danube Floodplains in Flood Hazard Reduction (FEM Method). Nat. Hazards 2013, 75, 33–50. [Google Scholar] [CrossRef]
- Kundzewicz, Z.W.; Menzel, L. Natural Flood Reduction Strategies—A Challenge. Int. J. River Basin Manag. 2005, 3, 125–131. [Google Scholar] [CrossRef]
- EEA: European Environment Agency. Green Infrastructure and Flood Management—Promoting Cost-Efficient Flood Risk Reduction via Green Infrastructure Solutions; European Environment Agency: Luxembourg, 2017; p. 156. [Google Scholar]
- Tockner, K.; Stanford, J.A. Riverine Flood Plains: Present State and Future Trends. Environ. Conserv. 2002, 29, 308–330. [Google Scholar] [CrossRef] [Green Version]
- Koenzen, U.; Günther-Diringer, D. Auenzustandsbericht 2021: Flussauen in Deutschland; Bundesministerium für Umwelt, Naturschutz und nukleare Sicherheit (BMU), Bundesamt für Naturschutz (BfN): Berlin, Germany; Bonn, Germany, 2021. [Google Scholar]
- Sanon, S.; Hein, T.; Douven, W.; Winkler, P. Quantifying Ecosystem Service Trade-Offs: The Case of an Urban Floodplain in Vienna, Austria. J. Environ. Manag. 2012, 111, 159–172. [Google Scholar] [CrossRef]
- Schneider, E. Floodplain Restoration of Large European Rivers, with Examples from the Rhine and the Danube. In Restoration of Lakes, Streams, Floodplains, and Bogs in Europe: Principles and Case Studies; Eiseltová, M., Ed.; Springer: Dordrecht, The Netherlands, 2010; pp. 185–223. ISBN 978-90-481-9265-6. [Google Scholar]
- Thiele, J.; von Haaren, C.; Albert, C. Are River Landscapes Outstanding in Providing Cultural Ecosystem Services? An Indicator-Based Exploration in Germany. Ecol. Indic. 2019, 101, 31–40. [Google Scholar] [CrossRef]
- Stammel, B.; Fischer, C.; Cyffka, B.; Albert, C.; Damm, C.; Dehnhardt, A.; Fischer, H.; Foeckler, F.; Gerstner, L.; Hoffmann, T.G.; et al. Assessing Land Use and Flood Management Impacts on Ecosystem Services in a River Landscape (Upper Danube, Germany). River Res. Appl. 2021, 37, 209–220. [Google Scholar] [CrossRef]
- Grill, G.; Lehner, B.; Thieme, M.; Geenen, B.; Tickner, D.; Antonelli, F.; Babu, S.; Borrelli, P.; Cheng, L.; Crochetiere, H.; et al. Mapping the World’s Free-Flowing Rivers. Nature 2019, 569, 215–221. [Google Scholar] [CrossRef] [PubMed]
- Tockner, K.; Uehlinger, U.; Robinson, C.T. Rivers of Europe; Academic Press: Cambridge, MA, USA, 2009; ISBN 0-08-091908-1. [Google Scholar]
- Zischg, A.P. River Corrections and Long-Term Changes in Flood Risk in the Aare Valley, Switzerland; EDP Sciences: Les Ulis, France, 2016; Volume 7, p. 11010. [Google Scholar]
- Schwarz, U. Assessment of the Restoration Potential along the Danube and Main Tributaries. WWF Int. Danub.-Carpathian Progr. 2010, 58. Available online: http://awsassets.panda.org/downloads/wwf_restoration_potential_danube.pdf (accessed on 20 May 2022).
- Hein, T.; Schwarz, U.; Habersack, H.; Nichersu, I.; Preiner, S.; Willby, N.; Weigelhofer, G. Current Status and Restoration Options for Floodplains along the Danube River. Sci. Total Environ. 2016, 543, 778–790. [Google Scholar] [CrossRef] [PubMed]
- DPRP: Danube Pollution Reduction Programme. Evaluation of Wetlands and Floodplain Areas in the Danube River Basin. WWF Danub.-Carpathian Progr. WWF-Auen-Inst. 1999, 92. Available online: https://www.icpdr.org/main/sites/default/files/EVALUATIONWETLANDSFLOODPLAINAREAS.pdf (accessed on 20 May 2022).
- EEA: European Environment Agency. Floodplains: A Natural System to Preserve and Restore; European Environment Agency: Luxembourg, 2019; p. 56. [Google Scholar]
- Vörösmarty, C.J.; McIntyre, P.B.; Gessner, M.O.; Dudgeon, D.; Prusevich, A.; Green, P.; Glidden, S.; Bunn, S.E.; Sullivan, C.A.; Liermann, C.R.; et al. Global Threats to Human Water Security and River Biodiversity. Nature 2010, 467, 555–561. [Google Scholar] [CrossRef]
- Steffen, W.; Crutzen, P.J.; McNeill, J.R. The Anthropocene: Are Humans Now Overwhelming the Great Forces of Nature? Ambio 2007, 36, 614–621. [Google Scholar] [CrossRef]
- BMU & BFN. Bundesministerium für Umwelt, Naturschutz und Reaktorsicherheit & Bundesamt für Naturschutz Auenzustandsbericht 2021; Flussauen in Deutschland: Berlin/Bonn, Germany, 2021. [Google Scholar]
- EC: European Commission Our Life Insurance, Our Natural Capital: An EU Biodiversity Strategy to 2020. 2011. Available online: https://eur-lex.europa.eu/legal-content/EN/TXT/PDF/?uri=CELEX:52011DC0244&from=EN (accessed on 13 May 2022).
- EC: European Commission. Directive 2007/60/EC on the Assessment and Management of Flood Risks; European Commission: Brussels, Belgium, 2007. [Google Scholar]
- EC: European Commission. Directive (2000/60/EC) for Establishing a Framework for Community Action in the Field of Water Policy (Water Framework Direction); European Commission: Brussels, Belgium, 2000. [Google Scholar]
- Hutton, N.S.; Tobin, G.A.; Montz, B.E. The Levee Effect Revisited: Processes and Policies Enabling Development in Yuba County, California. J. Flood Risk Manag. 2019, 12, e12469. [Google Scholar] [CrossRef]
- Jüpner, R. Coping with Extremes—Experiences from Event Management during the Recent Elbe Flood Disaster in 2013. J. Flood Risk Manag. 2018, 11, 15–21. [Google Scholar] [CrossRef] [Green Version]
- De Kok, J.-L.; Grossmann, M. Large-Scale Assessment of Flood Risk and the Effects of Mitigation Measures along the Elbe River. Nat. Hazards 2010, 52, 143–166. [Google Scholar] [CrossRef]
- Serra-Llobet, A.; Jähnig, S.C.; Geist, J.; Kondolf, G.M.; Damm, C.; Scholz, M.; Lund, J.; Opperman, J.J.; Yarnell, S.M.; Pawley, A.; et al. Restoring Rivers and Floodplains for Habitat and Flood Risk Reduction: Experiences in Multi-Benefit Floodplain Management From California and Germany. Front. Environ. Sci. 2022, 9, 765. [Google Scholar] [CrossRef]
- ICPDR: International Commission for the Protection of the Danube River. Danube Flood Risk Management Plan—Update 2021; ICPDR—International Commission for the Protection of the Danube River: Vienna, Austria, 2021; p. 174. [Google Scholar]
- UNESCO. International Glossary of Hydrology; WMO: Geneva, Switzerland, 2012; ISBN 978-92-3-001154-3. [Google Scholar]
- Nanson, G.C.; Croke, J.C. A Genetic Classification of Floodplains. Geomorphology 1992, 4, 459–486. [Google Scholar] [CrossRef] [Green Version]
- Hauer, C.; Skrame, K.; Fuhrmann, M. Hydromorphologial Assessment of the Vjosa River at the Catchment Scale Linking Glacial History and Fluvial Processes. CATENA 2021, 207, 105598. [Google Scholar] [CrossRef]
- Skublics, D.; Rutschmann, P. Progress in Natural Flood Retention at the Bavarian Danube. Nat. Hazards 2015, 75, 51–67. [Google Scholar] [CrossRef]
- Hohensinner, S.; Habersack, H.; Jungwirth, M.; Zauner, G. Reconstruction of the Characteristics of a Natural Alluvial River–Floodplain System and Hydromorphological Changes Following Human Modifications: The Danube River (1812–1991). River Res. Appl. 2004, 20, 25–41. [Google Scholar] [CrossRef]
- Guerrero, P.; Haase, D.; Albert, C. Locating Spatial Opportunities for Nature-Based Solutions: A River Landscape Application. Water 2018, 10, 1869. [Google Scholar] [CrossRef] [Green Version]
- Perosa, F.; Melkisetian, H.; Disse, M. Identification of Historical Floodplains along the Bavarian Danube; Deutsche Vereinigung für Wasserwirtschaft, Abwasser und Abfall: Munich, Germany, 2022. [Google Scholar]
- Niller, H.-P. Wandel Prähistorischer Landschaften: Kolluvion, Auenlehme und Böden. Archive zur Rekonstruktion Vorgeschitlicher Anthropogener Landschaftsänderungen im Lößgebiet bei Regensburg. Erdkunde 2001, 55, 32–48. [Google Scholar] [CrossRef]
- Arauner, U. Donauschifffahrt Im Ingolstädter Becken in Römischer Zeit—Von Der Rekonstruktion Bis Zur Reisezeit. Digit. Class. Online 2020, 59–79. [Google Scholar] [CrossRef]
- Molnár, G.; Timár, G.; Előd, B. Can the First Military Survey Maps of the Habsburg Empire (1763–1790) Be Georeferenced by an Accuracy of 200 Meters? In 9th International Workshop on Digital Approaches to Cartographic Heritage; Eötvös Loránd University: Budapest, Hungary, 2014. [Google Scholar]
- Adrian von Riedl Strom-Atlas von Baiern 1806. Available online: https://www.bavarikon.de/object/bav:BSB-MAP-0002MAPP152QE120?lang=de (accessed on 12 May 2022).
- Skublics, D.; Rutschmann, P. Hochwasserrückhalt Durch Natürliche Hochwasserretention Entlang Der Bayerischen Donau. In Vorsorgender und Nachsorgender Hochwasserschutz: Ausgewählte Beiträge aus der Fachzeitschrift WasserWirtschaft Band 2; Heimerl, S., Ed.; Springer Fachmedien Wiesbaden: Wiesbaden, Germany, 2018; pp. 231–241. ISBN 978-3-658-21839-3. [Google Scholar]
- Skublics, D.; Blöschl, G.; Rutschmann, P. Effect of River Training on Flood Retention of the Bavarian Danube. J. Hydrol. Hydromech. 2016, 64, 349–356. [Google Scholar] [CrossRef] [Green Version]
- Kern, R. Die Correktion der Donau im Regierungs-Bezirke Schwaben & Neuburg; Kolb-Verlag: Dillingen, Germany, 1874. [Google Scholar]
- Schober, B.; Hauer, C.; Habersack, H. Floodplain Losses and Increasing Flood Risk in the Context of Recent Historic Land Use Changes and Settlement Developments: Austrian Case Studies. J. Flood Risk Manag. 2020, 13, e12610. [Google Scholar] [CrossRef] [Green Version]
- Habersack, H.; Schober, B.; Hauer, C. Floodplain Evaluation Matrix (FEM): An Interdisciplinary Method for Evaluating River Floodplains in the Context of Integrated Flood Risk Management. Nat. Hazards 2015, 75, 5–32. [Google Scholar] [CrossRef]
- Eder, M.; Perosa, F.; Tritthart, M.; Scheuer, S.; Gelhaus, M.; Cyffka, B.; van Leeuwen, B.; Tobak, Z.; György, S.; Csikos, N.; et al. Floodplains along the Danube River Evaluated with the Flood-Plain Evaluation Matrix (FEM) Determining Their Importance for Flood Protection, Ecology and Socio-Economics. Water, 2022; in preparation. [Google Scholar]
- Warner, J.F.; van Buuren, A.; Edelenbos, J. Making Space for the River: Governance Experiences with Multifunctional River Flood Management in the US and Europe; IWA Publishing: London, UK, 2012. [Google Scholar]
- Hartmann, T. Clumsy Floodplains: Responsive Land Policy for Extreme Floods; Routledge: Oxfordshire, UK, 2011; ISBN 978-1-317-16492-0. [Google Scholar]
- ICPDR: International Commission for the Protection of the Danube River. The Danube River Basin District Management Plan—Part A—Basin-Wide Overview; ICPDR—International Commission for the Protection of the Danube River: Vienna, Austria, 2015; p. 192. [Google Scholar]
- Habersack, H.; Hein, T.; Stanica, A.; Liska, I.; Mair, R.; Jäger, E.; Hauer, C.; Bradley, C. Challenges of River Basin Management: Current Status of, and Prospects for, the River Danube from a River Engineering Perspective. Sci. Total Environ. 2016, 543, 828–845. [Google Scholar] [CrossRef] [PubMed] [Green Version]
- Sommerwerk, N.; Baumgartner, C.; Bloesch, J.; Hein, T.; Ostojic, A.; Paunovic, M.; Schneider-Jacoby, M.; Silber, R.; Tockner, K. The Danube River Basin. In Rivers of Europe; Elsevier: Amsterdam, The Netherlands, 2009; pp. 59–112. [Google Scholar]
- Tockner, K.; Schiemer, F.; Ward, J.V. Conservation by Restoration: The Management Concept for a River-Floodplain System on the Danube River in Austria. Aquat. Conserv. Mar. Freshw. Ecosyst. 1998, 8, 71–86. [Google Scholar] [CrossRef]
- Blöschl, G.; Hall, J.; Viglione, A.; Perdigão, R.A.P.; Parajka, J.; Merz, B.; Lun, D.; Arheimer, B.; Aronica, G.T.; Bilibashi, A.; et al. Changing Climate Both Increases and Decreases European River Floods. Nature 2019, 573, 108–111. [Google Scholar] [CrossRef]
- Sartori, F. Beschreibung der Unerhörten Ueberschwemmung der Donau im Erzherzogthume Oesterreich unter der Enns im Jahre 1830; Gerold, C., Ed.; J. Lindauer Sche Universitätsbuchhandlung: München, Germany, 1832; Volume 1. [Google Scholar]
- Sartori, F. Wien’s Tage der Gefahr und die Retter Aus der Noth: Eine Authentische Beschreibung der Unerhörten Ueberschwemmung Wien’s…und des Flachen an der Donau Gelegenen Landes; Gerold, C., Ed.; J. Lindauer Sche Universitätsbuchhandlung: München, Germany, 1830; Volume 1. [Google Scholar]
- LfU: Bayerisches Landesamt für Umwelt. Leben Mit Dem Fluss, Hochwasser im Spiegel Der Zeit; Bayerisches Landesamt für Umwelt: Augsburg, Germany, 2008; ISBN 978-3-936385-29-8. [Google Scholar]
- Pekarova, P.; Miklánek, P.; Onderka, M.; Halmová, D.; Bacová Mitková, V.; Mészáros, I.; Skoda, P. Flood Regime of Rivers in the Danube River Basin. J. Hydrol. Hydromech. 2009, 57, 142–150. [Google Scholar]
- Nagy, L. Az 1876. évi Árvizek. (Floods in 1876); Innova-Print Publishing: Budapest, Hungary, 2007; ISBN 978-963-87073-5-2. [Google Scholar]
- Günther-Diringer, D.; Konrad, B.; Koenzen, U.; Kurth, A.; Modrak, P.; Ackermann, W.; Ehlert, T.; Heyden, J. Methodische Grundlagen zum Auenzustandsbericht 2021: Erfassung, Bilanzierung und Bewertung von Flussauen; BfN-Skripten; BfN, Bundesamt für Naturschutz: Bonn, Germany, 2021; ISBN 978-3-89624-352-2. [Google Scholar]
- Zeilinger, E. Die “Pasetti-Karte”: Der Lauf Der Donau von Passau Bis Zum Eisernen Tor. In ie Donau. Eine Reise in die Vergangenheit; Hans Petschar: Wien, Austria, 2021; pp. 148–161. [Google Scholar]
- ICPDR: International Commission for the Protection of the Danube River. Danube River Basin District Management Plan—Part A—Basin-Wide Overview; International Commission for the Protection of the Danube River: Vienna, Austria, 2009; p. 105. [Google Scholar]
- Landesamt für Umwelt Baden-Württemberg Daten- Und Kartendienst Der Überflutungsflächen. 2022. Available online: https://udo.lubw.baden-wuerttemberg.de/public/pages/map/command/index.xhtml;jsessionid=7EF0B38DCF767D66A0B2DAB3D981D2E9?mapId=bddc229c-dd67-47d9-9174-38cd75bb22b1&mapSrs=EPSG%3A25832&mapExtent=245730.85793562708%2C5240158%2C752675.1420643729%2C5525631 (accessed on 6 February 2022).
- Bayerisches Landesamt für Umwelt Hochwassergefahrenflächen. Details zu WMS-Dienst Überschwemmungsgebiete und Hochwassergefahren—WMS des LfU. 2022. Available online: https://www.lfu.bayern.de/umweltdaten/geodatendienste/index_detail.htm?id=4cab2c12-fa7e-49c3-97ba-f4f33af3a598&profil=WMS (accessed on 8 February 2022).
- Hohensinner, S. Historische Hochwässer Der Wiener Donau Und Ihrer Zubringer (Historical Floods at the Viennese Danube and Its Tributaries); Zentrum für Umweltgeschichte: Vienna, Austria, 2020; ISBN 2414-0643. [Google Scholar]
- LfU: Bayerisches Landesamt für Umwelt Historische Hochwasserereignisse. 2013. Available online: https://www.lfu.bayern.de/umweltdaten/geodatendienste/index_detail.htm?id=130c82fa-9310-4140-bfd5-6c5ab8976f96&profil=Download (accessed on 25 April 2022).
- Hohensinner, S.; Atzler, U.; Berger, M.; Bozzetta, T.; Höberth, C.; Kofler, M.; Rapottnig, L.; Sterle, Y.; Haidvogl, G. Land Use and Cover Change in the Industrial Era: A Spatial Analysis of Alpine River Catchments and Fluvial Corridors. Front. Environ. Sci. 2021, 9, 647247. [Google Scholar] [CrossRef]
- QGIS.org. QGIS Geographic Information System; Open Source Geospatial Foundation Project: Beaverton, OR, USA, 2020. [Google Scholar]
- Globevnik, L.; Januschke, K.; Kail, J.; Snoj, L.; Manfrin, A.; Azlak, M.; Christiansen, T.; Birk, S. Preliminary Assessment of River Floodplain Condition in Europe. In ETC/ICM Technical Report 5/2020: European Topic Centre on Inland, Coastal and Marine Waters; European Topic Centre on Inland, Coastal and Marine waters (ETC/ICM): Magdeburg, Germany, 2020; p. 121. Available online: https://www.eionet.europa.eu/etcs/etc-icm/products/etc-icm-reports/preliminary-assessment-of-river-floodplain-condition-in-europe/@@download/file/Preliminary%20assessment%20of%20river%20floodplain%20condition%20in%20Europe.pdf (accessed on 2 February 2022).
- Hohensinner, S.; Sonnlechner, C.; Schmid, M.; Winiwarter, V. Two Steps Back, One Step Forward: Reconstructing the Dynamic Danube Riverscape under Human Influence in Vienna. Water Hist. 2013, 5, 121–143. [Google Scholar] [CrossRef] [PubMed] [Green Version]
- Kiss, T.; Fiala, K.; Sipos, G. Alterations of Channel Parameters in Response to River Regulation Works since 1840 on the Lower Tisza River (Hungary). Geomorphology 2008, 98, 96–110. [Google Scholar] [CrossRef]
- Lorenz, C.; Van Dijk, G.; Van Hattum, A.; Cofino, W. Concepts in River Ecology: Implications for Indicator Development. Regul. Rivers Res. Manag. Int. J. Devoted River Res. Manag. 1997, 13, 501–516. [Google Scholar] [CrossRef]
- Moss, B. The Water Framework Directive: Total Environment or Political Compromise? Sci. Total Environ. 2008, 400, 32–41. [Google Scholar] [CrossRef]
- Buijse, A.D.; Coops, H.; Staras, M.; Jans, L.; Van Geest, G.; Grift, R.; Ibelings, B.W.; Oosterberg, W.; Roozen, F.C. Restoration Strategies for River Floodplains along Large Lowland Rivers in Europe. Freshw. Biol. 2002, 47, 889–907. [Google Scholar] [CrossRef]
- Scheuer, S.; Haase, D.; Meyer, V. Towards a Flood Risk Assessment Ontology—Knowledge Integration into a Multi-Criteria Risk Assessment Approach. Comput. Environ. Urban Syst. 2013, 37, 82–94. [Google Scholar] [CrossRef]
- Ramsey, M.M.; Muñoz-Erickson, T.A.; Mélendez-Ackerman, E.; Nytch, C.J.; Branoff, B.L.; Carrasquillo-Medrano, D. Overcoming Barriers to Knowledge Integration for Urban Resilience: A Knowledge Systems Analysis of Two-Flood Prone Communities in San Juan, Puerto Rico. Environ. Sci. Policy 2019, 99, 48–57. [Google Scholar] [CrossRef]
- Hegger, D.; Alexander, M.; Raadgever, T.; Priest, S.; Bruzzone, S. Shaping Flood Risk Governance through Science-Policy Interfaces: Insights from England, France and The Netherlands. Environ. Sci. Policy 2020, 106, 157–165. [Google Scholar] [CrossRef]
- Günther-Diringer, D. Aufbau Eines Online-Flussauenbewertungssystemes Großer Flüsse Mitteleuropas. Rhein, Elbe, Oder und Donau. Ph.D. Thesis, Universität Salzburg, Salzburg, Austria, 2003. [Google Scholar]
- Fremling, C.R.; Rasmussen, J.L.; Sparks, R.E.; Cobb, S.P.; Bryan, C.F.; Claflin, T.O. Mississippi River Fisheries: A Case History. In Proceedings of the International Large River Symposium, Honey Harbour, ON, Canada, 14–21 September 1986; Dodge, D.P., Ed.; Department of Fisheries and Oceans: Ottawa, ON, Canada, 1989; pp. 309–351. [Google Scholar]
- Holcik, J.; Bastl, I.; Ertl, M.; Vranovsky, M. Hydrobiology and Ichthyology of the Czechoslovak Danube in Relation to Predicted Changes after the Construction of the Gabcikovo-Nagymaros River Barrage System. Prace Lab. Rybar. Hydrobiol. 1981, 3, 19–158. [Google Scholar]
- Varadi, J.; Goncz, B. Flood Protection in Hungary. In Proceedings of the Seminar on Flood Prevention and Protection, Berlin, Germany, 7–8 October 1999. [Google Scholar]
- Nagy, J.; Kiss, T. Hydrological and Morphological Changes of the Lower Danube Near Mohács, Hungary. Jengeo 2016, 9, 1–6. [Google Scholar] [CrossRef] [Green Version]
- Jungwirth, M.; Muhar, S.; Schmutz, S. Re-Establishing and Assessing Ecological Integrity in Riverine Landscapes. Freshw. Biol. 2002, 47, 867–887. [Google Scholar] [CrossRef]
- Gumiero, B.; Mant, J.; Hein, T.; Elso, J.; Boz, B. Linking the Restoration of Rivers and Riparian Zones/Wetlands in Europe: Sharing Knowledge through Case Studies. Ecol. Eng. 2013, 56, 36–50. [Google Scholar] [CrossRef]
- Tudor, I.M. Evolution of Babina Polder after Restoration Works; Schneider, E., Ed.; Institutul NAtional de Cercetare-Dezvoltare Romania: Tulcea, Romania; Frankfurt, Germany; Rastatt, Germany, 2008; ISBN 978-3-00-025585-4. [Google Scholar]
- Costanza, R.; de Groot, R.; Braat, L.; Kubiszewski, I.; Fioramonti, L.; Sutton, P.; Farber, S.; Grasso, M. Twenty Years of Ecosystem Services: How Far Have We Come and How Far Do We Still Need to Go? Ecosyst. Serv. 2017, 28, 1–16. [Google Scholar] [CrossRef]
- Perosa, F.; Gelhaus, M.; Zwirglmaier, V.; Arias-Rodriguez, L.F.; Zingraff-Hamed, A.; Cyffka, B.; Disse, M. Integrated Valuation of Nature-Based Solutions Using TESSA: Three Floodplain Restoration Studies in the Danube Catchment. Sustainability 2021, 13, 1482. [Google Scholar] [CrossRef]
- Dietrich, J.; Funke, M. Integrated Catchment Modelling within a Strategic Planning and Decision Making Process: Werra Case Study. Phys. Chem. Earth Parts A/B/C 2009, 34, 580–588. [Google Scholar] [CrossRef]
- Cerulus, T. Chapter 35—Reflection on the Relevance and Use of Ecosystem Services to the LNE Department. In Ecosystem Services; Jacobs, S., Dendoncker, N., Keune, H., Eds.; Elsevier: Boston, MA, USA, 2013; pp. 373–376. ISBN 978-0-12-419964-4. [Google Scholar]
- Dominati, E.J.; Robinson, D.A.; Marchant, S.C.; Bristow, K.L.; Mackay, A.D. Natural Capital, Ecological Infrastructure, and Ecosystem Services in Agroecosystems; Elsevier: Amsterdam, The Netherlands, 2014. [Google Scholar]
- UNDRR. Words into Action—Nature-Based Solutions for Disaster Risk Reduction; United Nations Office for Disaster Risk Reduction: Geneva, Switzerland, 2021; p. 132. [Google Scholar]
- Hackbart, V.C.S.; de Lima, G.T.N.P.; Santos, R.F. Dos Theory and Practice of Water Ecosystem Services Valuation: Where Are We Going? Ecosyst. Serv. 2017, 23, 218–227. [Google Scholar] [CrossRef]
- Huybrechs, F.; Bastiaensen, J.; van Hecken, G. ES Thinking and Some of Its Implications. In Ecosystem Services. Global Issues, Local Practices; Jacobs, S., Dendoncker, N., Keune, H., Eds.; Elsevier: Amsterdam, The Netherlands; Boston, MA, USA; Heidelberg, Germany; London, UK, 2014; pp. 273–284. ISBN 978-0-12-419964-4. [Google Scholar]
- Klijn, F.; Asselman, N.; Wagenaar, D. Room for Rivers: Risk Reduction by Enhancing the Flood Conveyance Capacity of The Netherlands’ Large Rivers. Geosciences 2018, 8, 224. [Google Scholar] [CrossRef] [Green Version]
- Rijke, J.; van Herk, S.; Zevenbergen, C.; Ashley, R. Room for the River: Delivering Integrated River Basin Management in the Netherlands. Int. J. River Basin Manag. 2012, 10, 369–382. [Google Scholar] [CrossRef]
- Yu, S.; Brand, A.D.; Berke, P. Making Room for the River. Null 2020, 86, 417–430. [Google Scholar] [CrossRef]
- Dorondel, S. Policy Report Concerning The Socio-Economic And Environmental Transformations in the Lower Danube Floodplain. 2016. Available online: https://www.researchgate.net/profile/Stefan-Dorondel/publication/308886022_POLICY_REPORT_CONCERNING_THE_SOCIO-ECONOMIC_AND_ENVIRONMENTAL_TRANSFORMATIONS_IN_THE_LOWER_DANUBE_FLOODPLAIN/links/57f4827c08ae280dd0b74940/POLICY-REPORT-CONCERNING-THE-SOCIO-ECON= (accessed on 2 February 2022).
- Opperman, J.; Galloway, G.; Duvail, S. The Multiple Benefits of River–Floodplain Connectivity for People and Biodiversity. In Encyclopedia of Biodiversity; Elsevier Science: Amsterdam, The Netherlands, 2013; pp. 144–160. [Google Scholar]
- Palmer, M.A.; Bernhardt, E.S.; Allan, J.D.; Lake, P.S.; Alexander, G.G.; Brooks, S.S.; Carr, J.; Clayton, S.R.; Dahm, C.N.; Shah, J.F.; et al. Standards for Ecologically Successful River Restoration. J. Appl. Ecol. 2005, 42, 208–217. [Google Scholar] [CrossRef]


| Data | Source Name | Description | Countries |
|---|---|---|---|
| Hydrological | HQ100 outlines | The project “Danube FLOODRISK 1” and/or national flood hazard maps provided the inundation areas of a flood with a 100-year return period. The representatives from each country involved in the “Danube Floodplain” project decided which sources (“Danube FLOODRISK” or national flood hazard maps) were used for their country. In the end, the HQ100 outlines used are based on calibrated 1D, quasi-2D and 2D hydraulic models. | DE, AT, SK, HU, HR, RS, BG, RO, MD, UA |
| HQ1000 outlines | The project “Danube FLOODRISK” provided the inundation areas of a flood with a 1000-year return period. As with the HQ100 outlines, the representatives from each country selected the source of the HQ1000 outlines in their country, leading to the use of results from calibrated 1D, quasi-2D and 2D hydraulic models. | AT, SK, HU, HR, RS, BG, RO, MD, UA | |
| HQextreme, BW outlines | The Baden-Württemberg State Institute for Environmental Protection provided the inundation areas of an extreme flood. An extreme event is statistically less likely than once in 100 years. | DE (State: Baden-Württemberg, BW) | |
| HQextreme, BY outlines | The Bavarian Environment Agency provided the inundation areas of an extreme flood. An extreme event is statistically less likely than once in 100 years. | DE (State: Bavaria BY) | |
| Historical | Pasetti map | A cartographic inventory of the Danube River and its riparian areas at the onset of the river regulation in the second half of the 19th century (1857–1867). | AT, SK, HU, HR, RS |
| Franziscean cadastre 2 | The “Franziscean cadastre” is an historical map created between 1817 and 1861 to calculate land taxes, showing land cover/uses of each plot for the Habsburg Monarchy. | AT, HU | |
| I. 3 and II. 4 Military Survey Maps | The military survey maps from 1763–1787 and 1806–1869 show landscape structures, such as watercourses, and terrain topography. | AT, SK, HU, HR, RS, BG, RO | |
| Schmitt’sche Map 5 | In 1797, Heinrich von Schmitt started drawing a military map on behalf of the German Emperor Franz II. | DE | |
| Historical flood events map | The Bavarian Environment Agency provided data on flood events that have been observed in the past. The areal expansion and the flood line (outer boundary of the flood), as well as historical water level marks, are recorded. | DE (State: Bavaria BY) | |
| Written historical sources | Local chronicles, newspapers, and books are used to verify the delineated former floodplains; e.g., Sartori [57,58], LfU [59], Peckarova and Miklanek [60], and Nagy [61] | DE, AT, HU, RS | |
| Geospatial data | Digital Elevation Model | The EU Digital Elevation Model 6 is found in the Copernicus database, and is based on SRTM and ASTER GDEM data, providing information in 25 m resolution. | DE, AT, SK, HU, HR, RS, BG, RO |
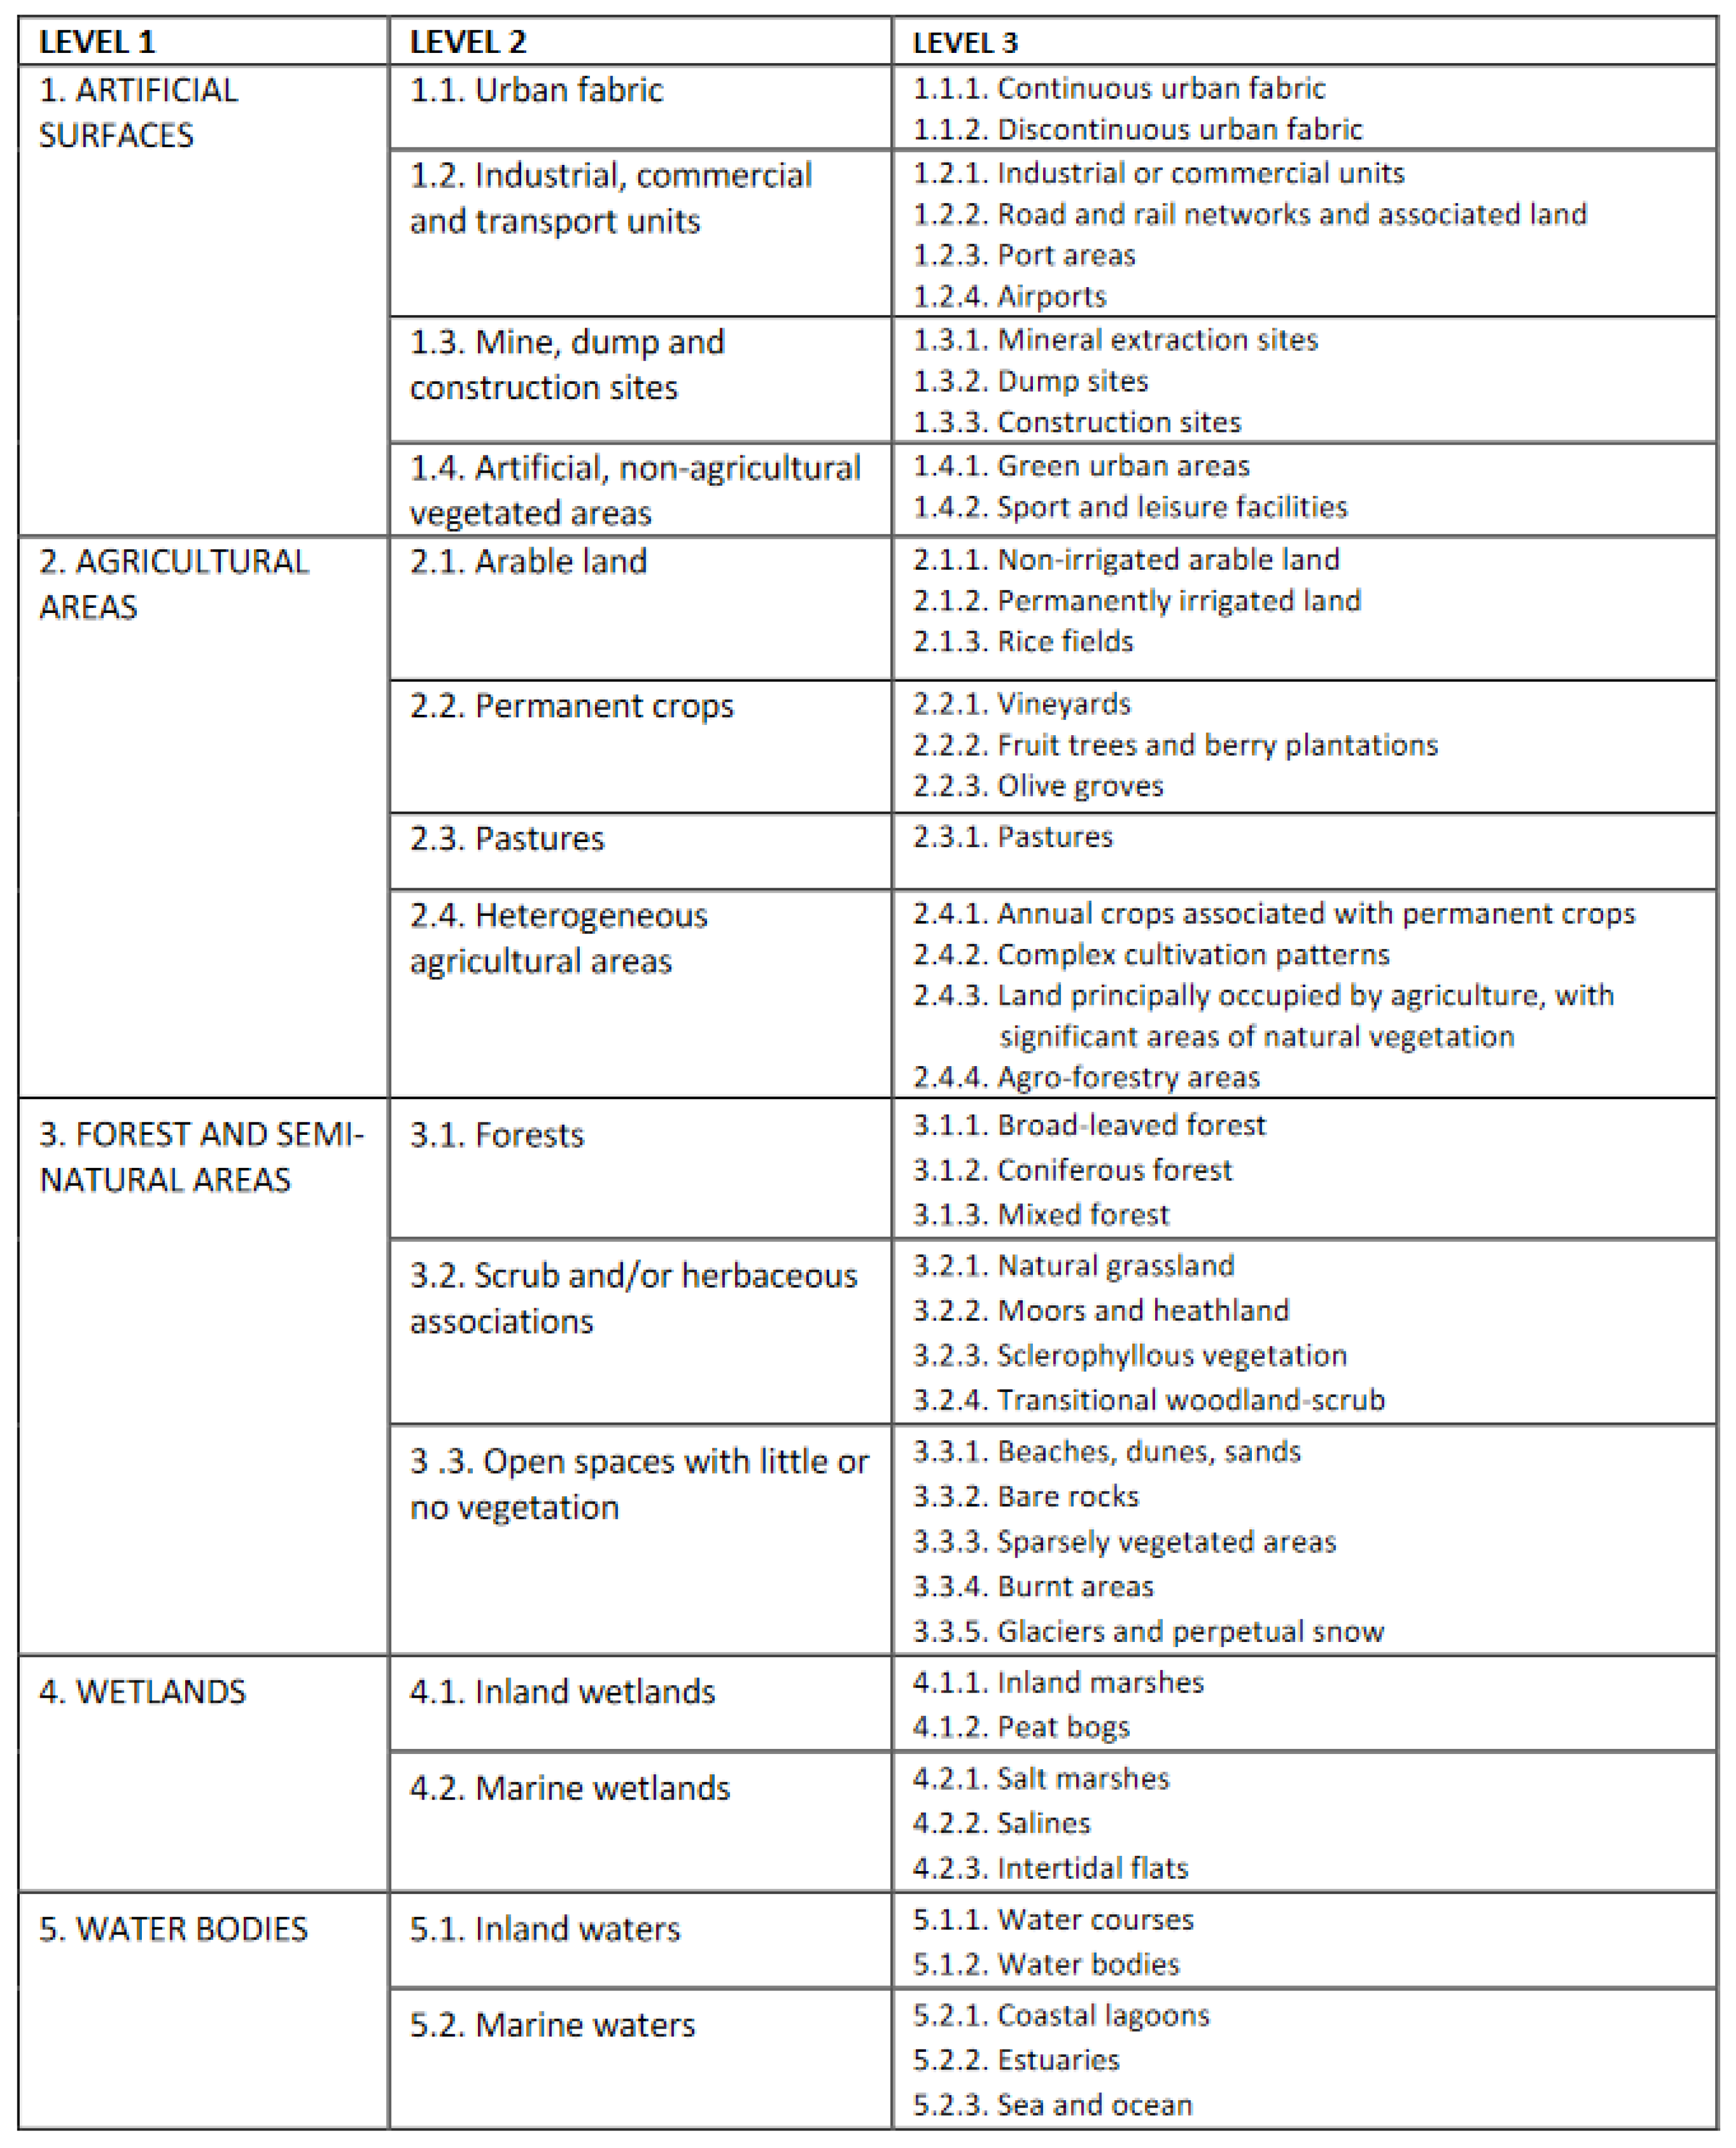
| Land cover data set | The CORINE land cover data set 7 from the Copernicus database summarizes land cover into five categories: “Artificial surfaces”, “Agricultural areas”, “Forest and semi-natural areas”, “Wetlands”, and “Water bodies”. | DE, AT, SK, HU, HR, RS, BG, RO | |
| Satellite images | Different sources (Google Earth, OpenStreetMap, World Imagery) were used for high-resolution satellite images. | DE, AT, SK, HU, HR, RS, BG, RO, MD, UA | |
| Previous projects | Floodplains | Previous delineated morphological floodplains from Schwarz [18], a WWF funded project in 2010, are used as a basic reference for identifying former floodplains in the present study. | DE, AT, SK, HU, HR, RS, BG, RO, MD, UA |
| BfN morphological floodplains (Altauen) | The morphological floodplain map was delineated by the Federal Agency for Nature Conservation [10], following the methodology reported in Günther-Diringer et al. [62]. | DE |
| Country | Model Used for HQ100 Outlines | Model Used for HQ1000 Outlines |
|---|---|---|
| Germany | 2D models used for latest national flood hazard maps | 2D models used for latest national flood hazard maps |
| Austria | 2D steady models used for latest national flood hazard maps | 2D steady models used in the "Danube FLOODRISK" project |
| Slovakia | 2D models used for latest national flood hazard maps | 2D models used for latest national flood hazard maps |
| Hungary | 2D models used for latest national flood hazard maps | 2D models used for latest national flood hazard maps |
| Croatia | 1D unsteady model used in the "Danube FLOODRISK" project | 1D unsteady model used in the "Danube FLOODRISK" project |
| Serbia | 1D unsteady model used in the "Danube FLOODRISK" project | 1D unsteady model used in the "Danube FLOODRISK" project |
| Bulgaria | 1D unsteady model used in the "Danube FLOODRISK" project | 1D steady model used in the "Danube FLOODRISK" project |
| Romania | 1D and quasi-2D unsteady models used in the "Danube FLOODRISK" project | 1D and quasi-2D unsteady models used in the "Danube FLOODRISK" project |
| Size of Active Floodplain Incl. Main Channel in km2 without Delta | Rel. Share [%] | ||||
|---|---|---|---|---|---|
| Country | 1st Group | 2nd Group | 3rd Group | Total | |
| DE | 492 | 101 | 13 | 606 | 13 |
| AT | 415 | 21 | 65 | 500 | 11 |
| SK | 89 | 0 | 78 | 168 | 4 |
| HU | 595 | 29 | 65 | 688 | 15 |
| HR | 294 | 0 | 13 | 307 | 6 |
| RS | 331 | 42 | 267 | 640 | 14 |
| BG | 82 | 37 | 232 | 351 | 7 |
| RO | 728 | 146 | 561 | 1435 | 30 |
| MD | - | - | 0.22 | 0.22 | <1 |
| UA | - | - | 15 | 15 | <1 |
| Danube River without Delta | 3027 | 375 | 1309 | 4711 | 100 |
| [%] | 64 | 8 | 28 | 100 | |
| Country | Active FP (km2) | Former FP (km2) | Floodplain Loss (%) |
|---|---|---|---|
| DE | 606 | 1457 | 58% |
| AT | 500 | 1251 | 60% |
| SK | 168 | 3161 | 95% |
| HU | 688 | 5338 | 87% |
| HR | 307 | 645 | 52% |
| RS | 640 | 3389 | 81% |
| BG | 351 | 1152 | 70% |
| RO | 1435 | 6459 | 78% |
| MD | 0.2 | - | |
| UA | 15 | - | |
| Danube without Delta | 4711 | 22,853 | 79% |
| Country | Artificial Surfaces | Agricultural Areas | Forest and Semi Natural Areas | Wetlands | Water Bodies |
|---|---|---|---|---|---|
| DE | 0% | 79% | 15% | 0% | 7% |
| AT | 0% | 83% | 17% | 0% | 0% |
| HU | 0% | 57% | 39% | 4% | 0% |
| RS | 0% | 65% | 33% | 0% | 2% |
| BG | 0% | 54% | 18% | 1% | 28% |
| RO | 0% | 67% | 13% | 7% | 13% |
Publisher’s Note: MDPI stays neutral with regard to jurisdictional claims in published maps and institutional affiliations. |
© 2022 by the authors. Licensee MDPI, Basel, Switzerland. This article is an open access article distributed under the terms and conditions of the Creative Commons Attribution (CC BY) license (https://creativecommons.org/licenses/by/4.0/).
Share and Cite
Eder, M.; Perosa, F.; Hohensinner, S.; Tritthart, M.; Scheuer, S.; Gelhaus, M.; Cyffka, B.; Kiss, T.; Van Leeuwen, B.; Tobak, Z.; et al. How Can We Identify Active, Former, and Potential Floodplains? Methods and Lessons Learned from the Danube River. Water 2022, 14, 2295. https://doi.org/10.3390/w14152295
Eder M, Perosa F, Hohensinner S, Tritthart M, Scheuer S, Gelhaus M, Cyffka B, Kiss T, Van Leeuwen B, Tobak Z, et al. How Can We Identify Active, Former, and Potential Floodplains? Methods and Lessons Learned from the Danube River. Water. 2022; 14(15):2295. https://doi.org/10.3390/w14152295
Chicago/Turabian StyleEder, Markus, Francesca Perosa, Severin Hohensinner, Michael Tritthart, Sabrina Scheuer, Marion Gelhaus, Bernd Cyffka, Tímea Kiss, Boudewijn Van Leeuwen, Zalán Tobak, and et al. 2022. "How Can We Identify Active, Former, and Potential Floodplains? Methods and Lessons Learned from the Danube River" Water 14, no. 15: 2295. https://doi.org/10.3390/w14152295