
Assessing the Impact of the Strictest Water Resources Management Policy on Water Use Efficiency in China


1
School of Public Administration, Xi’an University of Architecture and Technology, Xi’an 710055, China
2
Institute of Geographical Sciences and Natural Resources Research, Chinese Academy of Sciences, Beijing 100101, China
*
Author to whom correspondence should be addressed.
Water 2022, 14(15), 2291; https://doi.org/10.3390/w14152291
Submission received: 14 May 2022
/
Revised: 19 July 2022
/
Accepted: 21 July 2022
/
Published: 22 July 2022
(This article belongs to the Section Water Resources Management, Policy and Governance)
Abstract
:The strictest water resources management policy plays a critical role in response to the challenge of water shortage, water security, and sustainable water development in China. Despite the varied analyses of the strictest water resources management policy, the relations between the strictest water resources management policy and water use efficiency remain under-researched. This study uses an interval event-analysis method to assess the strictest water resources management policy’s impact on water use efficiency in China based on data from 2007 to 2020. In addition, the study breaks down water use efficiency into eight indicators and divides the strictest water management policy into “pre-, middle, and post-” phases. The research results show the strictest water resources management policy has a significant positive effect on water use efficiency. Further research shows the total water consumption control system and water efficiency control system have the most significant effect. The strictest water resources management policy has a lasting impact on water use efficiency. This study contributes to the global knowledge body of water governance and provides a reference value for water policy decision-making and optimization in other countries.
1. Introduction
Water scarcity and water crises are common challenges across the globe [1]. The shortage of fresh and drinking water has a major impact on life, production, and urbanization [2]. The factors affecting water scarcity are complex, including climate change in addition to geography and pollution [3]. Climate change is directly and severely impacting water resources, leading to increased uncertainty about sustainable water development [4]. Governments around the world have made unremitting efforts and put forward many measures [5]. Water governance is a key approach to rise to the challenges of water security and achieve the Sustainable Development Goals, including SDG6, SDG11, and SDG12 [6]. Access to clean drinking water is an important part of the world we want to live in. There is enough fresh water on earth to make this dream come true. However, governments need to work together, and the path to achieving it may be country-specific. With the improvement of public awareness of sustainable development, both the government and the public have realized that water resources play a critical role in urbanization, production, and consumption, and water resource management is also an important part of sustainable cities and communities, responsible consumption and production [1,7,8].
As a developing country with rapid economic growth, China faces the challenges of severe water shortages and water pollution. Establishing a good water governance policy has become a priority for the Chinese government [9]. The strictest water resources management (SWRM) policy is one of the Chinese government’s critical attempts and an important measure of integrated water resource management [10]. The SWRM policy was issued in 2011 and aims to control total water use and improve water efficiency through rational allocation, conservation, and protection of water resources. The core institutions of the SWRM policy are the “Three Red Lines” and “Four Systems”. The “Three Red Lines” refer to the red lines for controlling the utilization of water resources, controlling water use efficiency, and limiting pollution intake in water-functional areas. The “Four Systems” refer to the total amount of water consumption control system, water efficiency control system, water function area pollution limitation system, and water resources management assessment system.
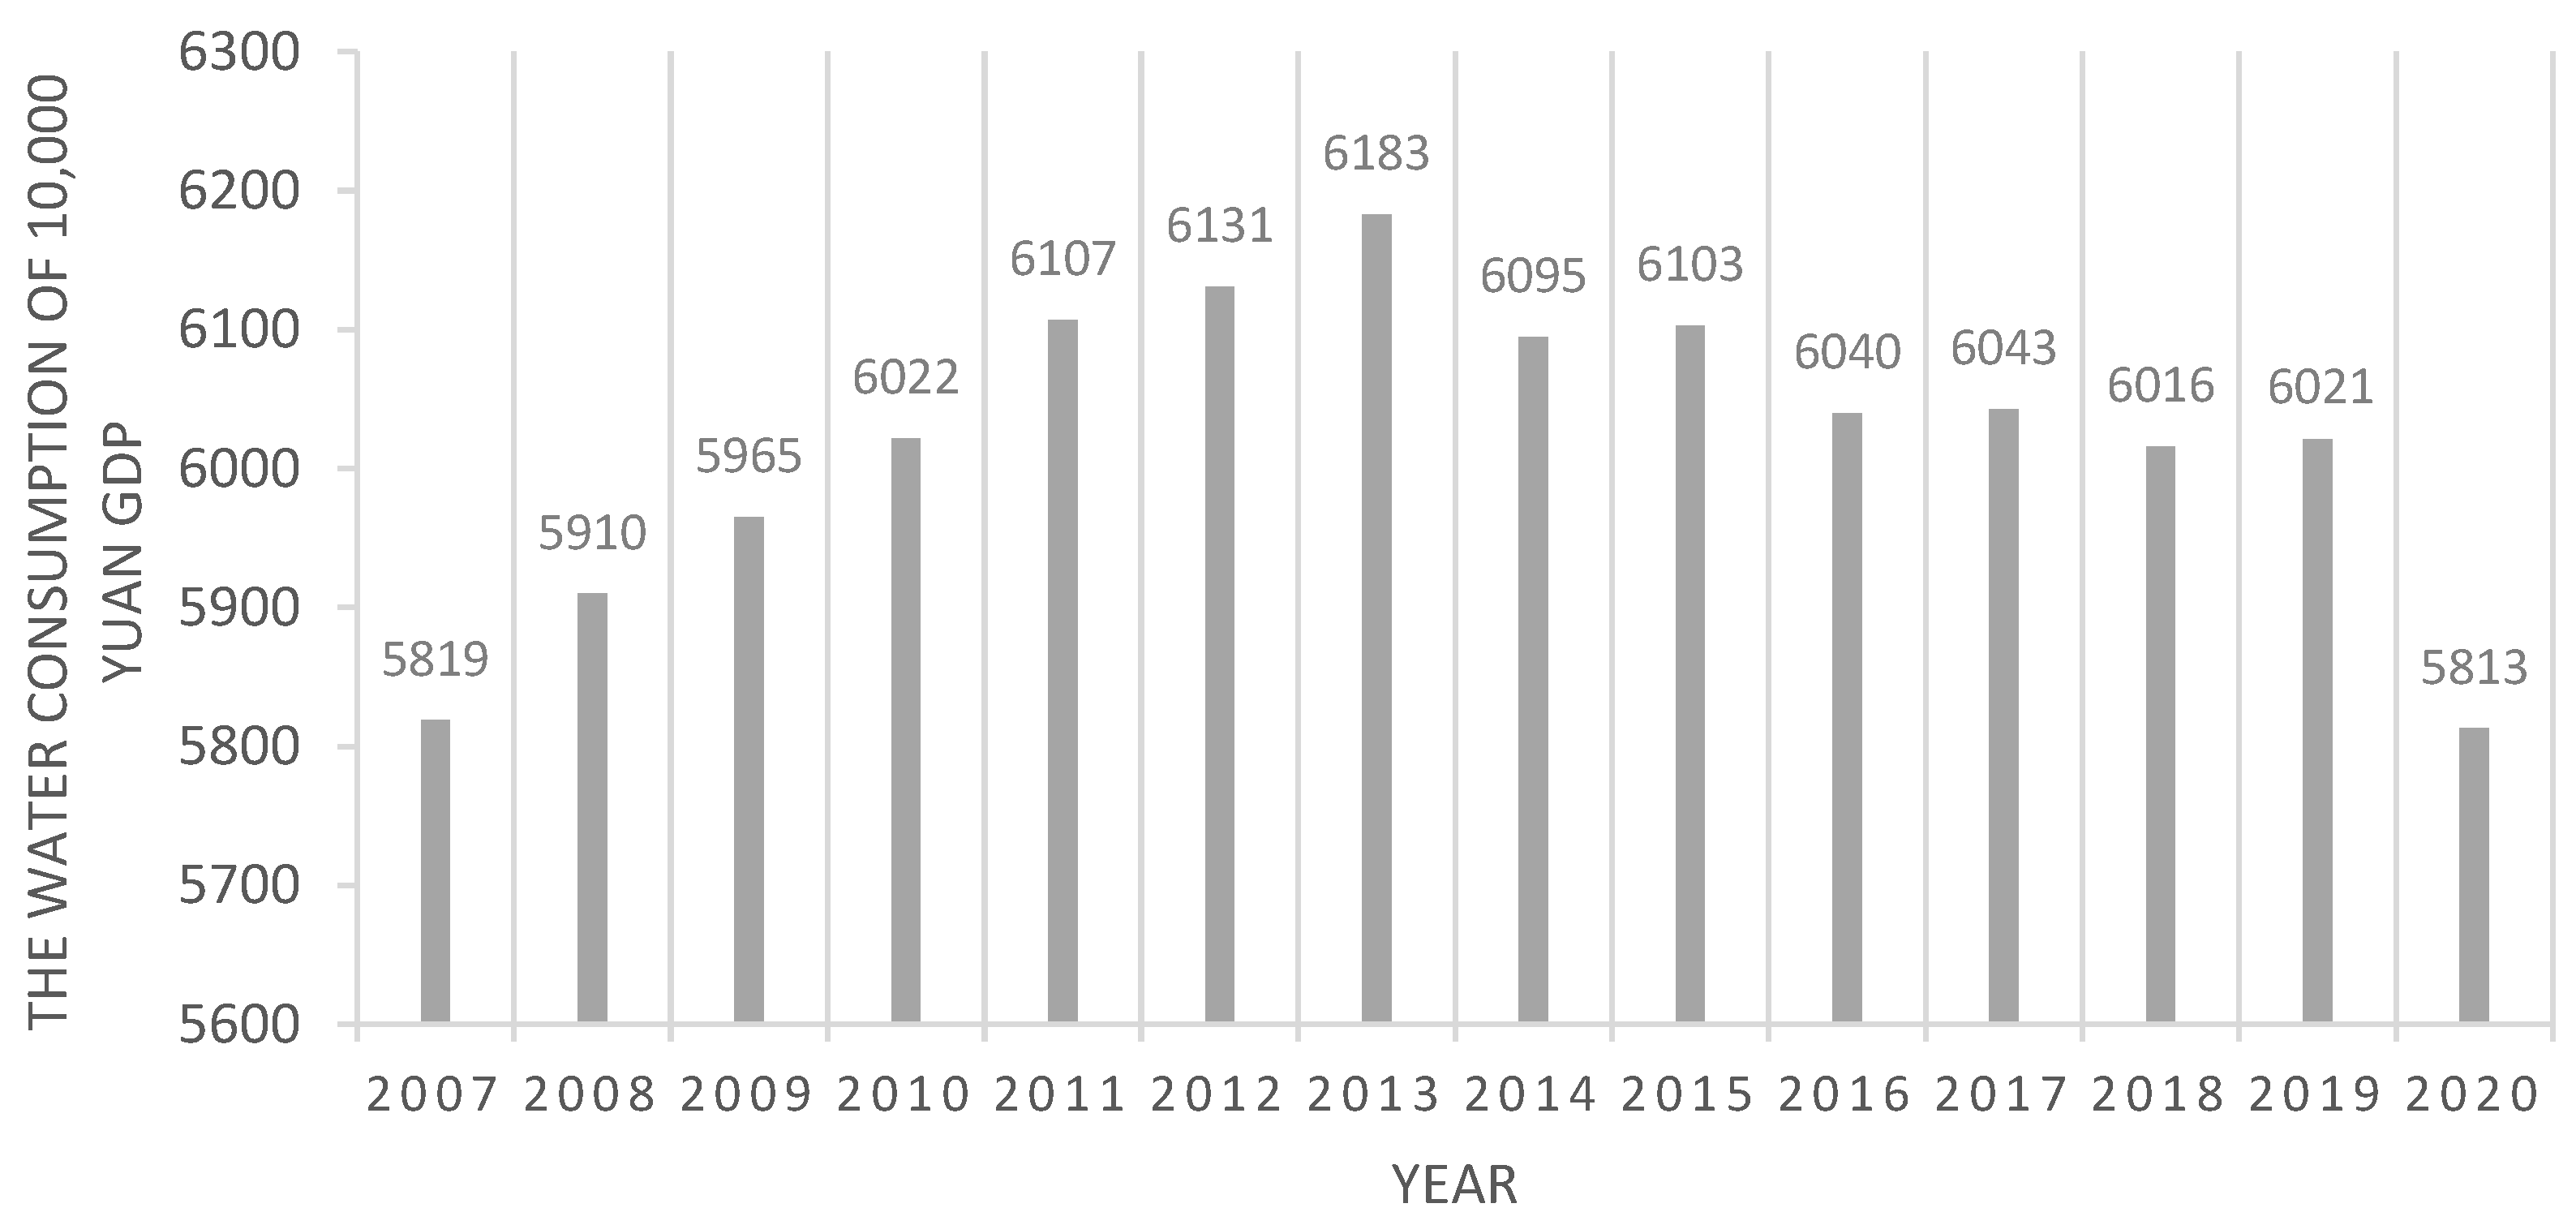
The SWRM policy has not only been widely applied in the practice of water resources management, but it has also received great concern from scholars. On the one hand, China’s water resources are effectively controlled and utilized; the trend of increasing water consumption in China has been controlled after the implementation of the SWRM policy (Figure 1). On the other hand, scholars have studied the policy implications, market demand, and key institutions of the SWRM policy [11,12,13] and evaluated the SWRM’s impact on the water rights system, assignment of initial water entitlements, agricultural water pricing, optimal scale of urbanization, and agricultural water use efficiency [14,15,16,17]. These studies have promoted the SWRM policy’s optimization, but existing studies lack a quantitative evaluation of the SWRM’s impact on water use efficiency.
To address this research gap, this study uses an interval event-analysis method to quantitatively assess the SWRM policy’s impact on water use efficiency in China based on data from 2007 to 2020. The aims of this study are to evaluate the impact of the SWRM policy and to promote water governance and sustainable water development in China. This study breaks down water use efficiency into eight indicators, including total annual water consumption, groundwater supply, industrial water consumption, agricultural water consumption, water consumption per ten thousand yuan of GDP, water consumption per ten thousand yuan of industrial added value, urban sewage discharge, and urban sewage treatment rate. Furthermore, this study divides the SWRM policy as an event into “pre-, middle, and post-” phases and conducts a comparative analysis. The contributions of this study are as follows. First, this study enriches the methods and perspectives of water policy evaluation through the interval event analysis method. Second, this study improves the research of impact factors of water use efficiency based on the perspective of water policy. Third, this study improves the scientific and robust water use efficiency research through the empirical analysis of multiple indicators and multi-source data. Finally, this study provides a reference value for water policy decision making and optimization in other countries.
The remainder of the paper is organized as follows. The following section briefly describes the research progress of the SWRM policy and water policy assessment in China. Section 3 introduces the research methods and data resources. Section 4 presents the results of the empirical analysis, which are then discussed. Finally, Section 5 summarizes our preliminary results and proposes policy implications.
2. Literature Review
The SWRM policy has become a key policy in water governance and sustainable water development both as a theoretical concept as well as part of the integrated water management system [11,12,18]. Existing studies have mainly focused on the SWRM’s policy implementation and impact assessment. The SWRM is a dynamic process of implementation feedback improvement, which must constantly summarize experiences and improve them [19]. Studies that have examined the implementation of the SWRM policy and systems included performance evaluation, government regulation, technical standards system, administrative management system, policy and regulation system, and information technology support [10,11,12,19,20]. It is important to identify and assess the impact of the SWRM policy that has been implemented. The existing evaluation studies have included the impact of the SWRM system on the optimal allocation of water resources, social economy and ecology, water right allocation, transaction and water price, the evaluation index of the “Three Red Lines” system, and the effect of policy implementation in specific regions [15,17,18,21,22].
Many methods (both qualitative and quantitative) have been applied in studies of the SWRM policy, such as the projection pursuit evaluation method, fuzzy comprehensive evaluation method, spatial panel model, fuzzy best-worst method, data envelopment analysis model, Malmquist method, neural network model, and matter-element extension evaluation model [18,23]. Especially constructing an evaluation index system is one of the most common methods. For example, Sun (2017) selected evaluation indicators from three categories of total water consumption, water use efficiency, and water functional zone, and from three aspects of water resources development and utilization, regional social and economic development, and ecological environment conditions [24]. Feng et al. (2018) constructed the water-saving evaluation index system under the constraint of the water efficiency red line [25]. Wang et al. (2017) developed an evaluation index system to evaluate the effects of the implementation of efficient control measures based on the game theory [9].
One of the SWRM policy’s aims is to improve water use efficiency, and existing studies are far from enough to provide scientific evidence. In addition, most existing evaluation studies of the SWRM policy have used post-evaluation, and few studies have examined the policy from the perspective of the whole process of “pre-, middle, and post-” phases. Therefore, this study is novel in that it adopts the interval event method to evaluate the SWRM policy’s impact on water use efficiency by multiple indicators from the “pre-, middle, and post-” phase process.
3. Materials and Methods
3.1. Interval Event Study Method
The Event Study Method (ESM) is a quantitative analysis method to evaluate the impact of a policy based on the analysis and processing of statistical data before and after the occurrence of a policy event [26]. ESM is widely applied in business analyses and policy evaluations such as stock markets, COVID-19, corporate social responsibility, and monetary policy [27,28,29,30,31,32]. The key of the event analysis method is to evaluate the impact of the event in a certain period. The process of event analysis generally includes event definition, calculating normal and abnormal returns, estimation procedure, testing procedure, empirical results, interpretation, and conclusions [33,34,35].
Drawn from the work of Han et al. (2009), this study adopts the interval event study method (IESM) to assess the SWRM policy’s impact on water use efficiency. The IESM is an improved event-analysis method. Based on the ESM, the IESM considers the characteristics of interval variables and can more comprehensively analyze and evaluate the implementation effects of a specific policy [36]. Compared to the traditional event-analysis method, the advantages of the IESM are as follows. First, interval time series analysis is introduced as a theoretical basis. As the SWRM policy has an increasing impact on interval water efficiency, interval samples can better characterize changes in water use efficiency. Second, the traditional event-analysis method usually defines “event” as the same kind of event that occurs intermittently [37]. Nevertheless, the policy event that focuses on the SWRM policy in this study is intermittent in the timeline from the time of the introduction to the explicit requirement because the time of this policy’s implementation varies from region to region. Moreover, the SWRM policy includes “Three Red Lines” and “Four Systems”, and corresponding measurement indicators are also different, which are non-similar events. Third, the traditional event study method usually only targets one event, collects a large amount of data on the cross-section to build a model, and conducts a significance test of the overall response of the event [38]. This study does not focus on the cross-sectional response of water efficiency to the data on the SWRM policy but on the response of water use efficiency to the continuing impact of the SWRM policy in the timeline.
In this study, using the IESM, the existing interval time series analysis is combined with the traditional event study method. The SWRM policy’s impact on water use efficiency is analyzed using the data analysis. This study’s significance is to use a new interval perspective to give the quantitative results of the SWRM policy’s impact on the indicators of water use efficiency and analyze the fluctuation effect of the SWRM policy on water use efficiency.
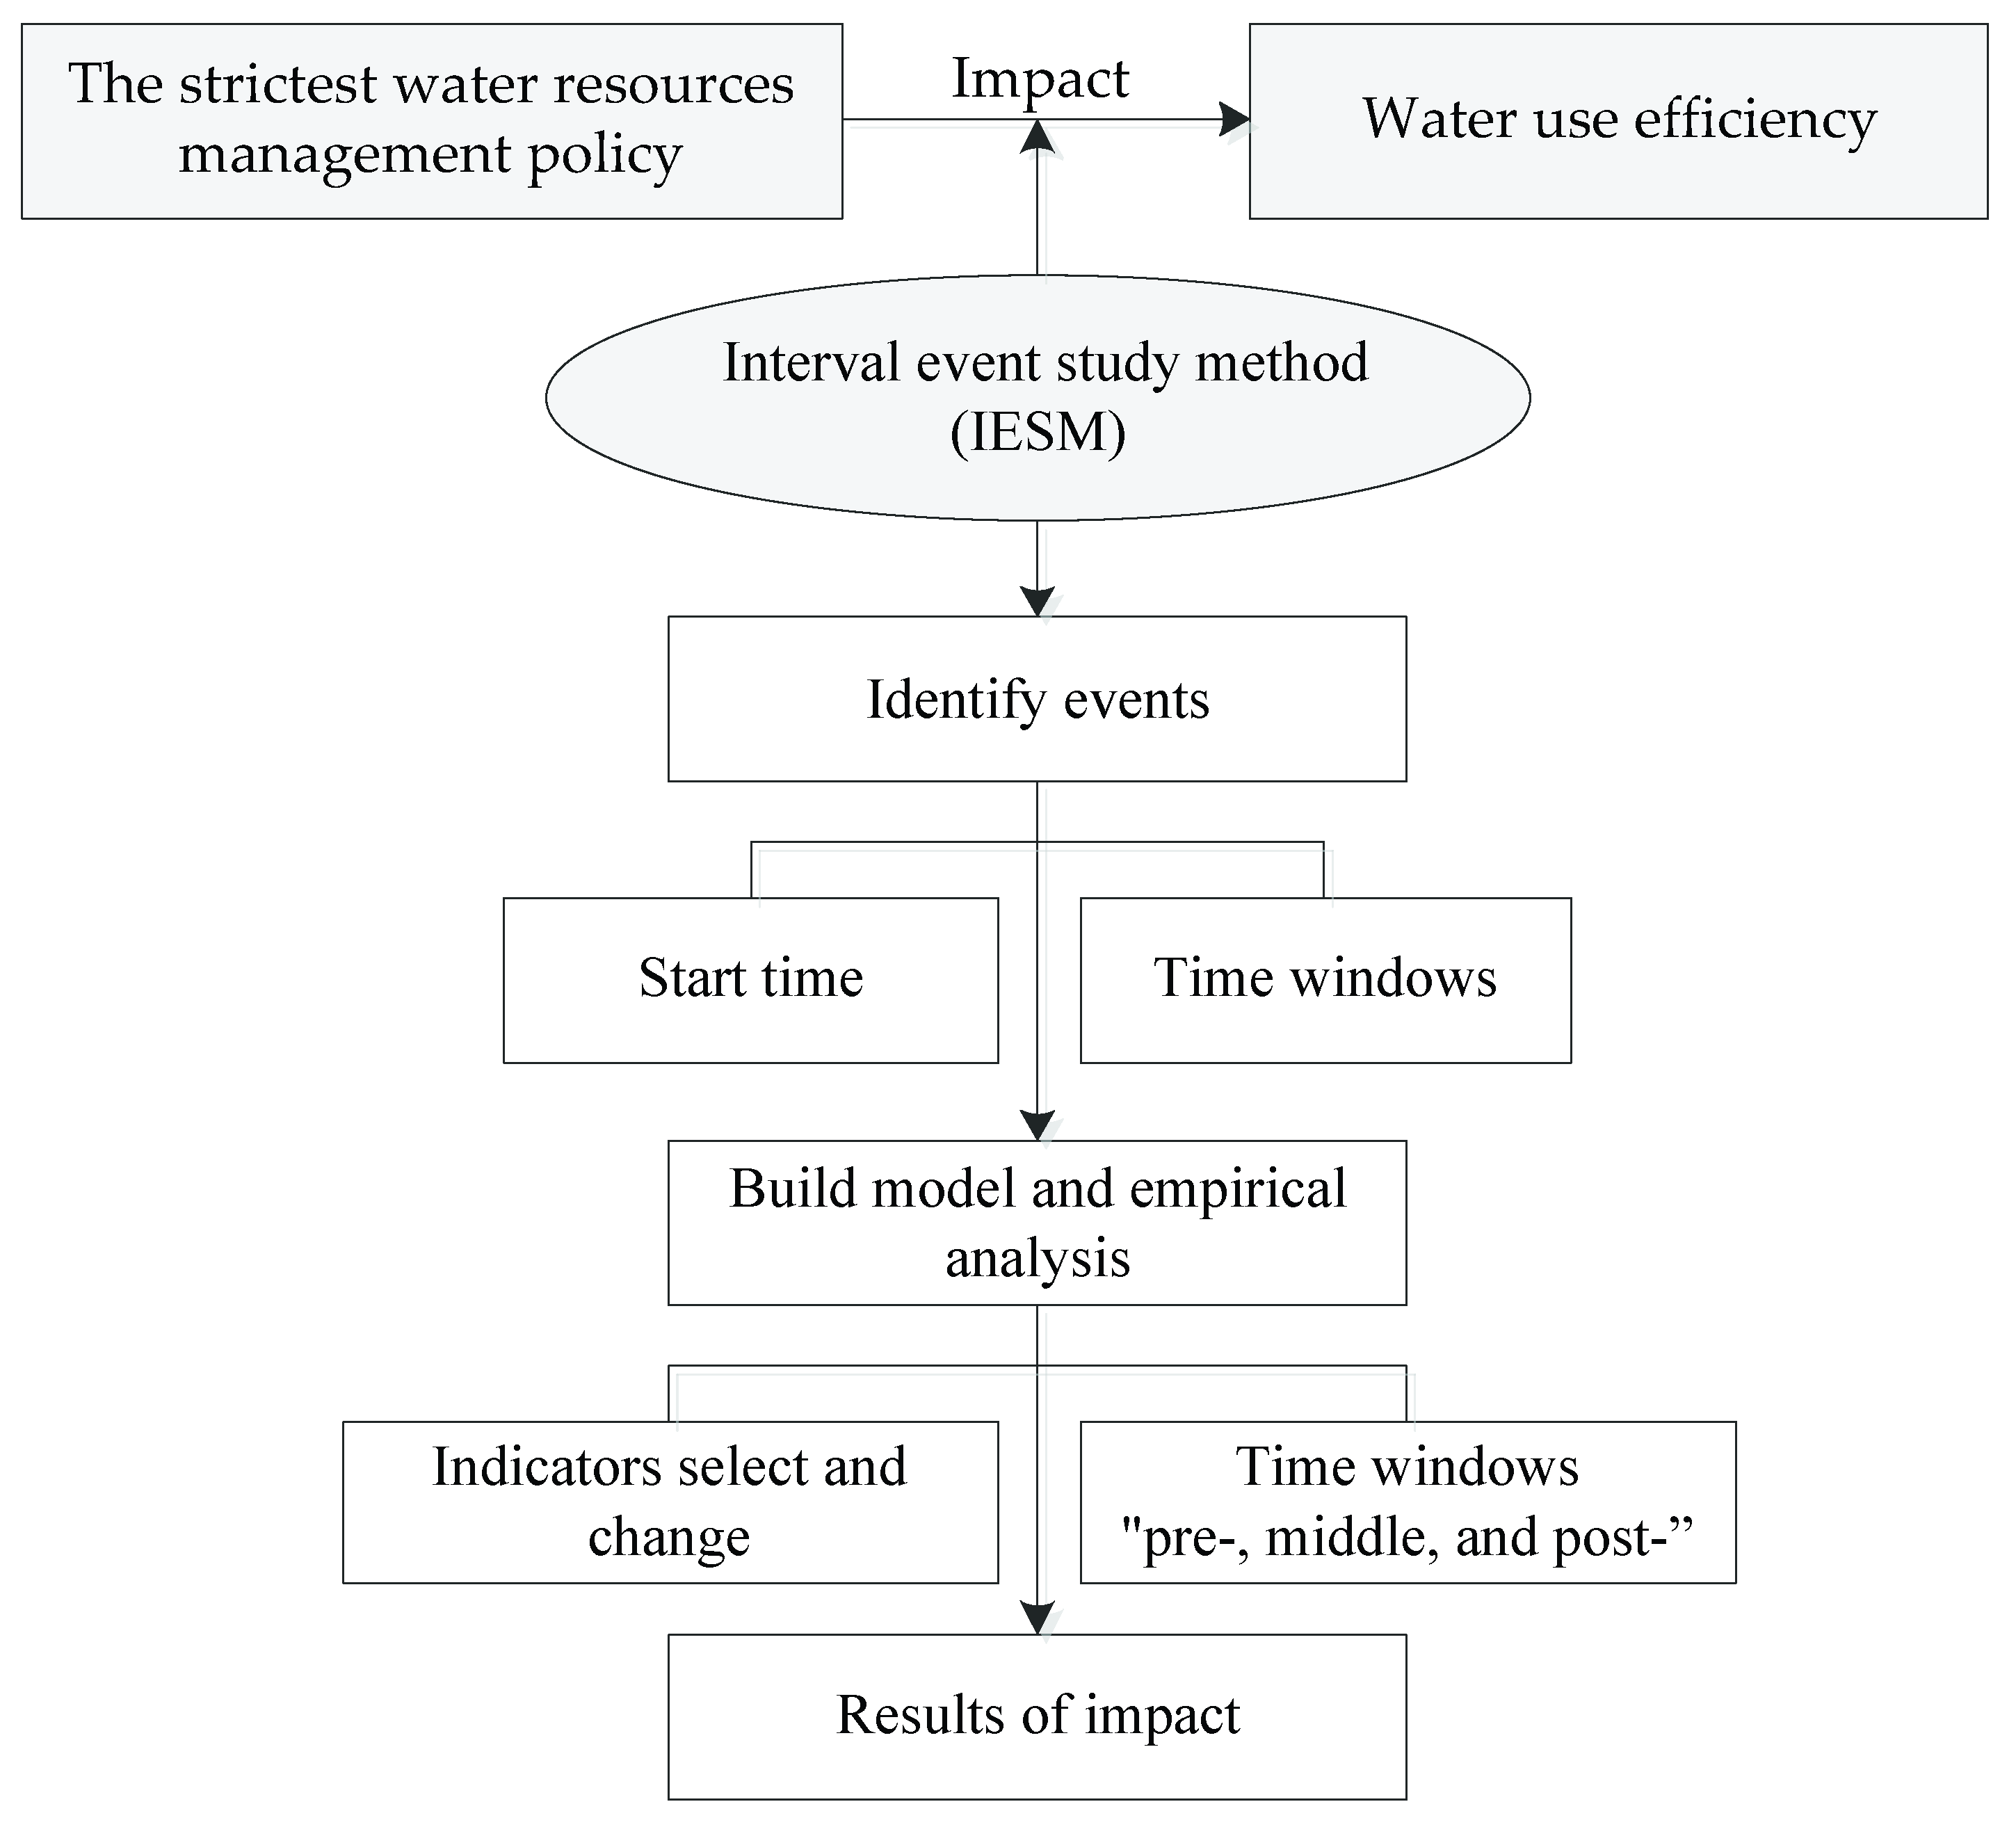
The research design is as follows (Figure 2). First, determine the start time and time windows for the event of the SWRM policy and specific policy events included in this policy event. Next, this model is constructed with the linear interval and market model commonly used in event analysis. Then, the interval coefficient of the interval water use efficiency coefficient and event dummy variable is specifically analyzed, and the SWRM policy’s impact on water use efficiency is further empirically analyzed. In the empirical analysis, we can figure out the impact of implementing this policy on water efficiency through the following two steps. First, the interval water use efficiency coefficient b is determined by calculating the change of the indicators compared with the fluctuation of water consumption per ten thousand yuan of GDP. Specifically, the changes in 2011- and 2020-related indicator data can be selected, and the impact on water use efficiency since the implementation of the SWRM policy in 2011 can be more targeted. Second, in the interval coefficient analysis of the event dummy variable, the changes in the lower bounds, upper bounds, and width function values of the eight indicators related to water use efficiency in different time windows of “pre-, middle, and post-” the event are described. At last, the SWRM policy’s impact on water use efficiency is derived.
The determination of events mainly includes two aspects. First, the start time of the SWRM policy is determined. The Ministry of Water Resources first proposed the SWRM policy in 2009. The Decision of the CPC Central Committee and State Council on Accelerating the Reform and Development of Water Conservancy in 2011 requires the implementation of the SWRM policy. Therefore, the SWRM policy was established in 2011. Second, identify specific policy events covered by the SWRM policy. The policy event identified in this study is implementing the SWRM policy. The SWRM policy includes “Three Red Lines” and “Four Systems.”
Event definition is a core step of event analysis, including determining the specific event and length of time for that event window. The “pre-, middle, and post-” phases of the event time window are defined for each selected event. Considering that the event may have early leakage and lag effects, a complete event window includes a period before the event occurs, and the post-event window includes a period after the event. Moreover, these three time windows do not overlap. In this study, the change in water use efficiency in each region before the event was investigated in “the period before the event” window (2007–2010) (Table 1). The SWRM policy’s impact on water use efficiency in each region during the event period (2011–2016) was examined. “The post-event period” window examines whether the event has a follow-up and lasting impact on water efficiency in each region (from 2017 to 2020).
3.2. Model
The model used in the ISEM combines two aspects of the linear interval model and market model commonly used in event analysis. The model form is as follows.
Specifically, represents the interval water use efficiency in year t. is the interval intercept item. Corresponding to point time series analysis, the interval intercept term is defined as an interval variable, in line with the idea of interval time series analysis. Its proposal improves the theory of interval time series analysis. represents water consumption per ten thousand yuan of GDP in the t year of the country; b is a scalar, which is the coefficient of interval water use efficiency, representing the response of the index data of water consumption per ten thousand yuan of GDP in each region to the fluctuation of water consumption per ten thousand yuan of GDP in China. is an interval dummy variable. Take D1 as an example. D1 = 0 means event 1 does not occur, and D2 = 1 means event 1 occurs. Explain as an example: firstly, it represents the event’s impact on the “location” of interval water use efficiency; Secondly, it also indicates the event’s impact on the width function value (width) of interval water efficiency or the “fluctuation range” of the point water efficiency series. represents the interval random disturbance of interval water use efficiency in year t.
In addition to the above impact on the “position” of the interval, also indicates the event’s impact on the width function value (width) of water efficiency or the “fluctuation range” of the point return series. Using the “width function” of the interval algorithm and analysis of the above paragraph, it can be obtained that the event’s impact on the water use efficiency is as follows. . When , the occurrence of the event increases the impact on water use efficiency; when , the occurrence of the event reduces the impact on water use efficiency; when , the occurrence of the event has no impact on water use efficiency.
3.3. Variables
The existing literature summarizes the factors affecting water use efficiency as a natural endowment, economic level, industrial structure, water supply and use structure, and technical level [9,23,39,40,41]. This study selects the indicators that affect water use efficiency based on the literature. It combines with the evaluation indicators in the “three red lines” established in implementing the SWRM policy. Next, implementing the SWRM policy on water use efficiency is evaluated through the interval event study model.
Specifically: first, in water resources management, establishing the red control line for the development and utilization of water resources is to control the total water use in China by 700 billion cubic meters by 2030. Combined with the goal of this red line and indicators related to water use efficiency in the literature, the total annual water consumption, total groundwater supply, total industrial water consumption, and agricultural water consumption can be selected to analyze the SWRM policy’s impact on water use efficiency [42]. Second, establishing the red line of water efficiency control aims to achieve or approach the world’s advanced level of water efficiency by 2030 and reduce the water consumption per ten thousand yuan of industrial added value to less than 40 cubic meters. According to the goal of this red line and relevant literature [43], water consumption per ten thousand yuan of GDP and water consumption per ten thousand yuan of industrial added value can be selected to analyze the SWRM policy’s impact on water efficiency. Third, as the total amount of major pollutants in rivers and lakes and water quality compliance rate of water functional zones involved in the establishment of water functional zone limit pollutant absorption red line are not mentioned in existing literature whether they can affect water use efficiency. It is necessary to consider replacing appropriate indicators to measure whether improving sewage reception and discharge can promote water efficiency. Therefore, we select urban sewage discharge and urban sewage treatment rates to analyze the change in water efficiency from an ecological aspect [44].
Therefore, combined with literature and the “three red lines” established in the SWRM policy, this study analyzes the impact of the implementation of the SWRM policy on water efficiency by indicators and includes the total annual water consumption, groundwater supply, industrial water consumption, agricultural water consumption, water consumption per ten thousand yuan of GDP, water consumption per ten thousand yuan of industrial added value, urban sewage discharge, and urban sewage treatment rate.
3.4. Data
This article uses the interval event method to further study the SWRM policy’s implementation from the three different time windows of the “pre-, middle, and post-” event. According to the specific definition of the time windows, the data from 2007 to 2020 were selected to study the impact of the implementation of the SWRM policy on water efficiency.
The research data are mainly from the China Statistical Yearbook of Water Resources, Water Resources Bulletin, China Statistical Yearbook of Urban Construction, China Statistical Yearbook, China Statistical Yearbook of Social Statistics, China Statistical Summary, and China Statistical Yearbook of Urban and Rural Construction over the years. Specifically, the research data on total annual water consumption are mainly from the China Statistical Yearbook of Water Resources and China Statistical Yearbook. The total groundwater supply data are mainly from China Environmental Statistics Yearbook. The data on total industrial water consumption and total agricultural water consumption are mainly from the China Statistical Yearbook and the China Statistical Yearbook of Social Statistics. The data on water consumption per ten thousand yuan of GDP are from China Water Resources Bulletin, and the data on water consumption per ten thousand yuan of industrial added value are from China Statistical Summary and China Environmental Statistics Yearbook. Lastly, the data on urban sewage discharge and urban sewage treatment rates are mainly from the China Statistical Yearbook of Urban Construction and the China Statistical Yearbook of Urban and Rural Construction.
The data units for the annual total water consumption, groundwater water supply, industrial water use, and agricultural water use are 1000 cubic meters. The data units for water consumption per ten thousand yuan of GDP and water consumption per ten thousand yuan of industrial added value are cubic meters per 10,000 yuan. The data unit for urban sewage discharge is 10,000 cubic meters, and the data unit for the urban sewage discharge rate is %. The descriptive statistics of variables in this study are shown in Table 2.
4. Results and Discussion
4.1. Analysis of Changes in Overall Water USE Efficiency
According to the interval time series analysis theory, the interval water use efficiency coefficient b has completely different meanings from the coefficient in the sense of “point”. The variable itself is in the form of an interval and depicts the fluctuation pattern of data; therefore, in the interval event analysis, the coefficient b represents the response of the other seven indicators to the fluctuation of the million yuan of GDP water consumption in China, which changes in the same direction as “+”, that is, b = 1. It also changes in the opposite direction to “−”, that is, b = 1.
4.1.1. Changes in Indicators in 2007 and 2020
This part analyzes the coefficient b of interval water use efficiency in the interval event study model. b is the coefficient of interval water use efficiency, representing the response of the index data of the million yuan of GDP water consumption in each region to the fluctuation of water consumption per ten thousand yuan of GDP in China. When changes in the same direction as “+”, that is, b = 1. It also changes in the opposite direction to “−”, that is, b = −1. Water consumption per ten thousand yuan of GDP is an index to comprehensively measure water use efficiency. Therefore, the interval water use efficiency coefficient b was obtained by calculating indicators from 2007 to 2011 and the variation of water consumption per ten thousand yuan of GDP in China. We then determined b in the variation of indicators compared with the fluctuation of water consumption per ten thousand yuan of GDP in China.
Table 3 and Table 4 show that the annual total water consumption, urban sewage discharge, and urban sewage treatment rates change in the same direction compared with the fluctuation of the national water consumption per ten thousand yuan of GDP, that is, b = 1. The total amount of groundwater supply, total amount of industrial water, total amount of agricultural water, and water consumption per ten thousand yuan of industrial added value fluctuated in the opposite direction compared with the national million yuan of GDP water consumption, that is, b = −1. On the whole, from 2007 to 2020, indicators related to water use efficiency showed a good development trend, and the national water use efficiency increased year by year.
4.1.2. Changes in Indicators in 2011 and 2020
This part analyzes the changes in index data between 2011 and 2020. This analysis can be more specific and targeted to examine the impact on water use efficiency since implementing the SWRM policy in 2011.
Table 5 and Table 6 show that since implementing the SWRM policy in 2011, except for urban sewage discharge and urban sewage treatment rates, the actual situation of the other six indicators in 2020 shows a negative change compared with 2011. The actual situation of urban sewage discharge and urban sewage treatment rates in 2020 showed a positive change compared with 2011. The urban sewage discharge rate increased by 41.53%, and the urban sewage treatment rate increased by 16.63%. This indicates that the continuous improvement of urban sewage treatment and the ecological environment positively impact water efficiency. The total annual water consumption in 2020 was 4.82% lower than that in 2011, the total underground water supply was 19.53%, the total industrial water consumption was 29.51%, the total agricultural water consumption was 3.50%, and water consumption per ten thousand yuan of GDP and water consumption per ten thousand yuan of industrial added value reduced by 54.29% and 42.67%, respectively. The above data changes indicate that the total water consumption control system and water efficiency control system implemented in the SWRM policy to achieve the objectives of water resources development and red utilization line and water efficiency control red line are effective, which plays a positive role in improving the national water efficiency.
4.2. Changes in Water Use Efficiency in Different Event Windows
The first and second columns in the tables indicate the name of index data and corresponding three-time windows. Furthermore, “, ” lists the results of the lower and upper bounds of the interval coefficient corresponding to events, representing the influence of events on the “position” of interval water use efficiency in different time windows. “Width” is the width function value of the interval coefficient, representing the influence of event occurrence on water use efficiency sequence with “fluctuation.”
The next section describes the indicator changes of water use efficiency in different time windows “pre-, middle, and post-” event.
4.2.1. The SWRM Policy’s Impact on Total Annual Water Consumption
In the pre-event period, the total annual water consumption data were within the range of [58,187,000, 60,220,000] (Table 7). In this period, the SWRM policy has not been adopted to control total water consumption strictly. Therefore, during the event period, the annual water consumption is still increasing, and its data range is [61,072,000, 61,834,000]. Although the value of total annual water consumption is increasing, the data fluctuation range in this period is smaller than that in the pre-event period. By introducing the SWRM policy between 2011 and 2016, the government began strictly controlling the total amount of water consumption and implementing the total water consumption control system. Therefore, from 2017 to 2020, although the fluctuation range of annual total water consumption changed to 2.35 million cubic meters, the data range is [581,290,60,434,000], which is significantly smaller than the data range of the period in the event. On the whole, the implementation of a total water consumption control system in the SWRM policy has a significant effect on controlling total annual water consumption (Figure 3).
4.2.2. The SWRM Policy’s Impact on Total Groundwater Supply
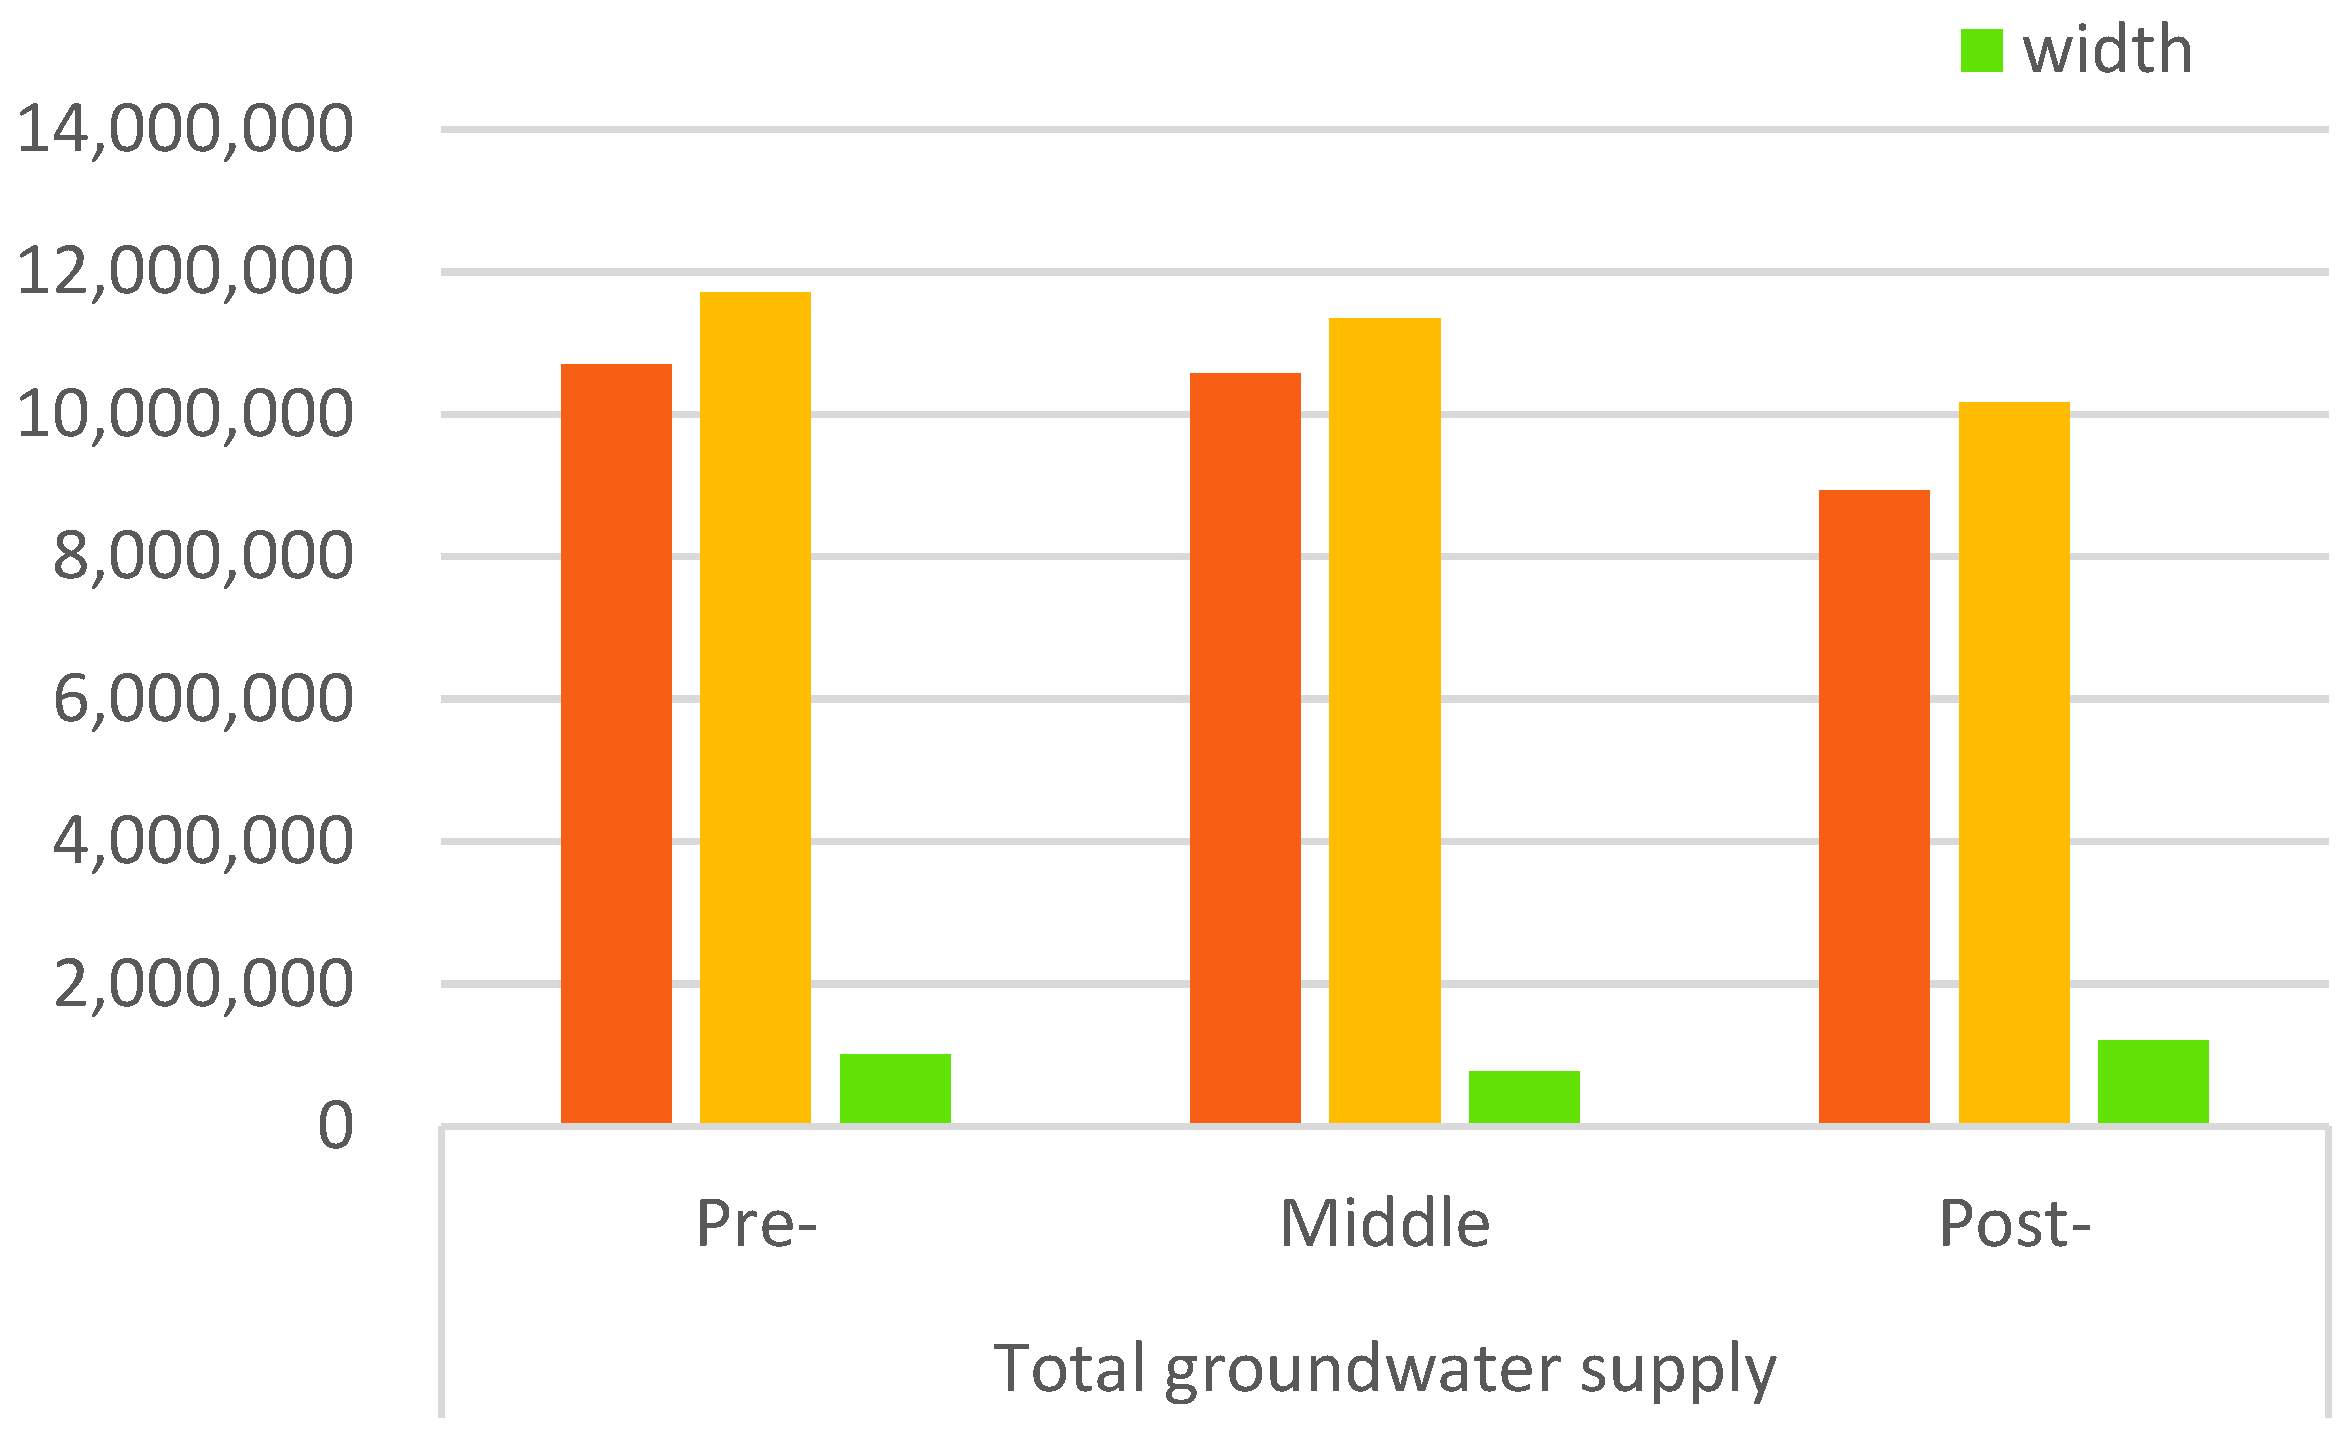
In terms of the data range, the total amount of groundwater supply gradually decreased from the pre-event period, during the event period, and then to the post-event period (Figure 4). The post-event fluctuation range of the data was the largest. The total groundwater supply was ample before the SWRM policy was implemented. China began to implement the SWRM policy in 2011, so the total amount of groundwater supply decreased during the event. Because policies have been implemented to strictly control, manage, and protect groundwater, the SWRM regime continues into the post-event period. It has a more significant impact on this period than on the post-event period. As shown in Table 3, the total amount of groundwater supply in the post-event period is smaller than during the event. The fluctuation range of data is the largest among the three periods.
4.2.3. The SWRM Policy’s Impact on Total Industrial and Agricultural Water Consumption
In the pre-event period, due to the vigorous development of economic production and lack of strict policies to control the total industrial and agricultural water consumption, the data volume within the value range of total industrial and agricultural water consumption in this period is the largest among the three periods (Figure 5). The government implemented the total water consumption control system during the event period. The total amount of industrial and agricultural water used in this period began to decrease. The SWRM policy’s impact continued into the post-event period when the total water used by industry and agriculture decreased compared to the pre-event period and during the event period.
4.2.4. The SWRM Policy’s Impact on Water Consumption Per Ten Thousand Yuan of GDP and Ten Thousand Yuan of Industrial Added Value
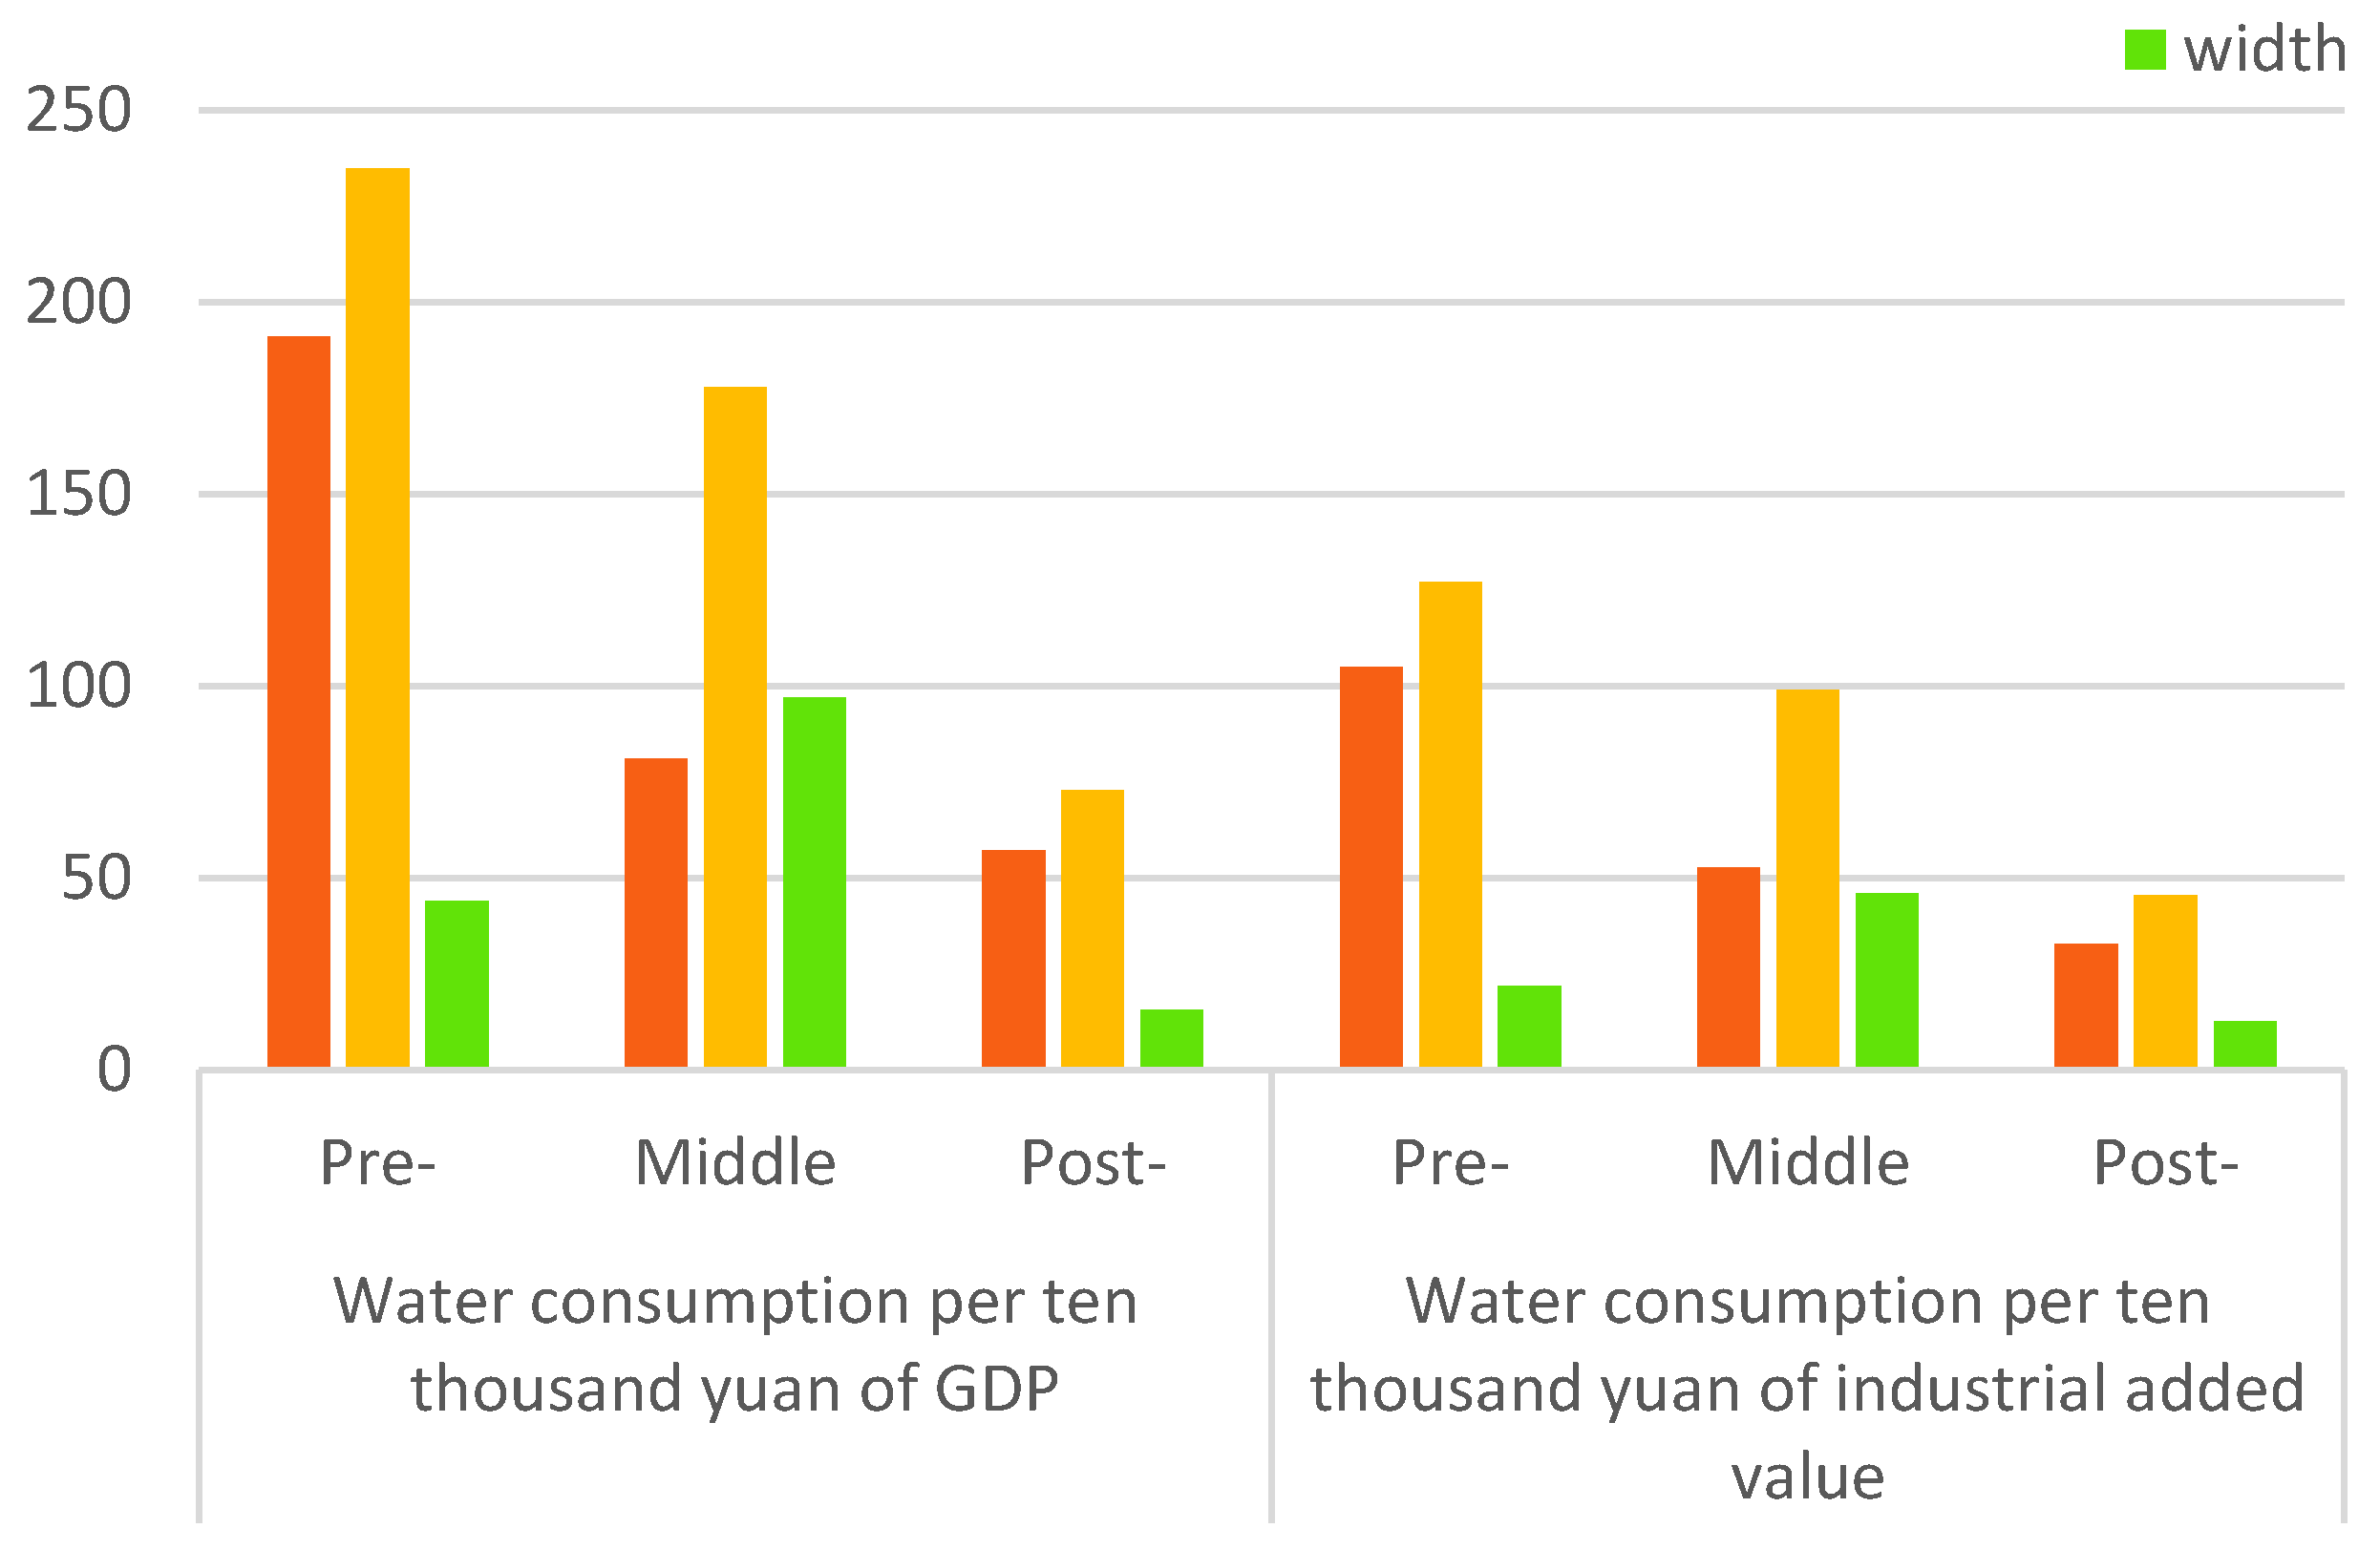
Water consumption per ten thousand yuan of GDP and ten thousand yuan of industrial added value are two leading indicators to measure water use efficiency. Before implementing the SWRM policy, the data volume within water consumption per ten thousand yuan of GDP and per ten thousand yuan of industrial added value was the largest among the three periods (Figure 6). During the event period in which water use efficiency was strictly controlled by implementing the water use efficiency control system, the numerical quantities of the two indicators decreased significantly compared with the pre-event period, and the fluctuation range of data in this period was the largest among the three periods. Implementing the SWRM policy also impacted the post-event period. In this period, although the data fluctuation range of the two indicators was not as large as that of the periods before and during the event, the amount of data within the value range of the two indicators significantly reduced compared with the previous two periods.
4.2.5. The SWRM Policy’s Impact on Urban Sewage Discharge and Urban Sewage Treatment Rates
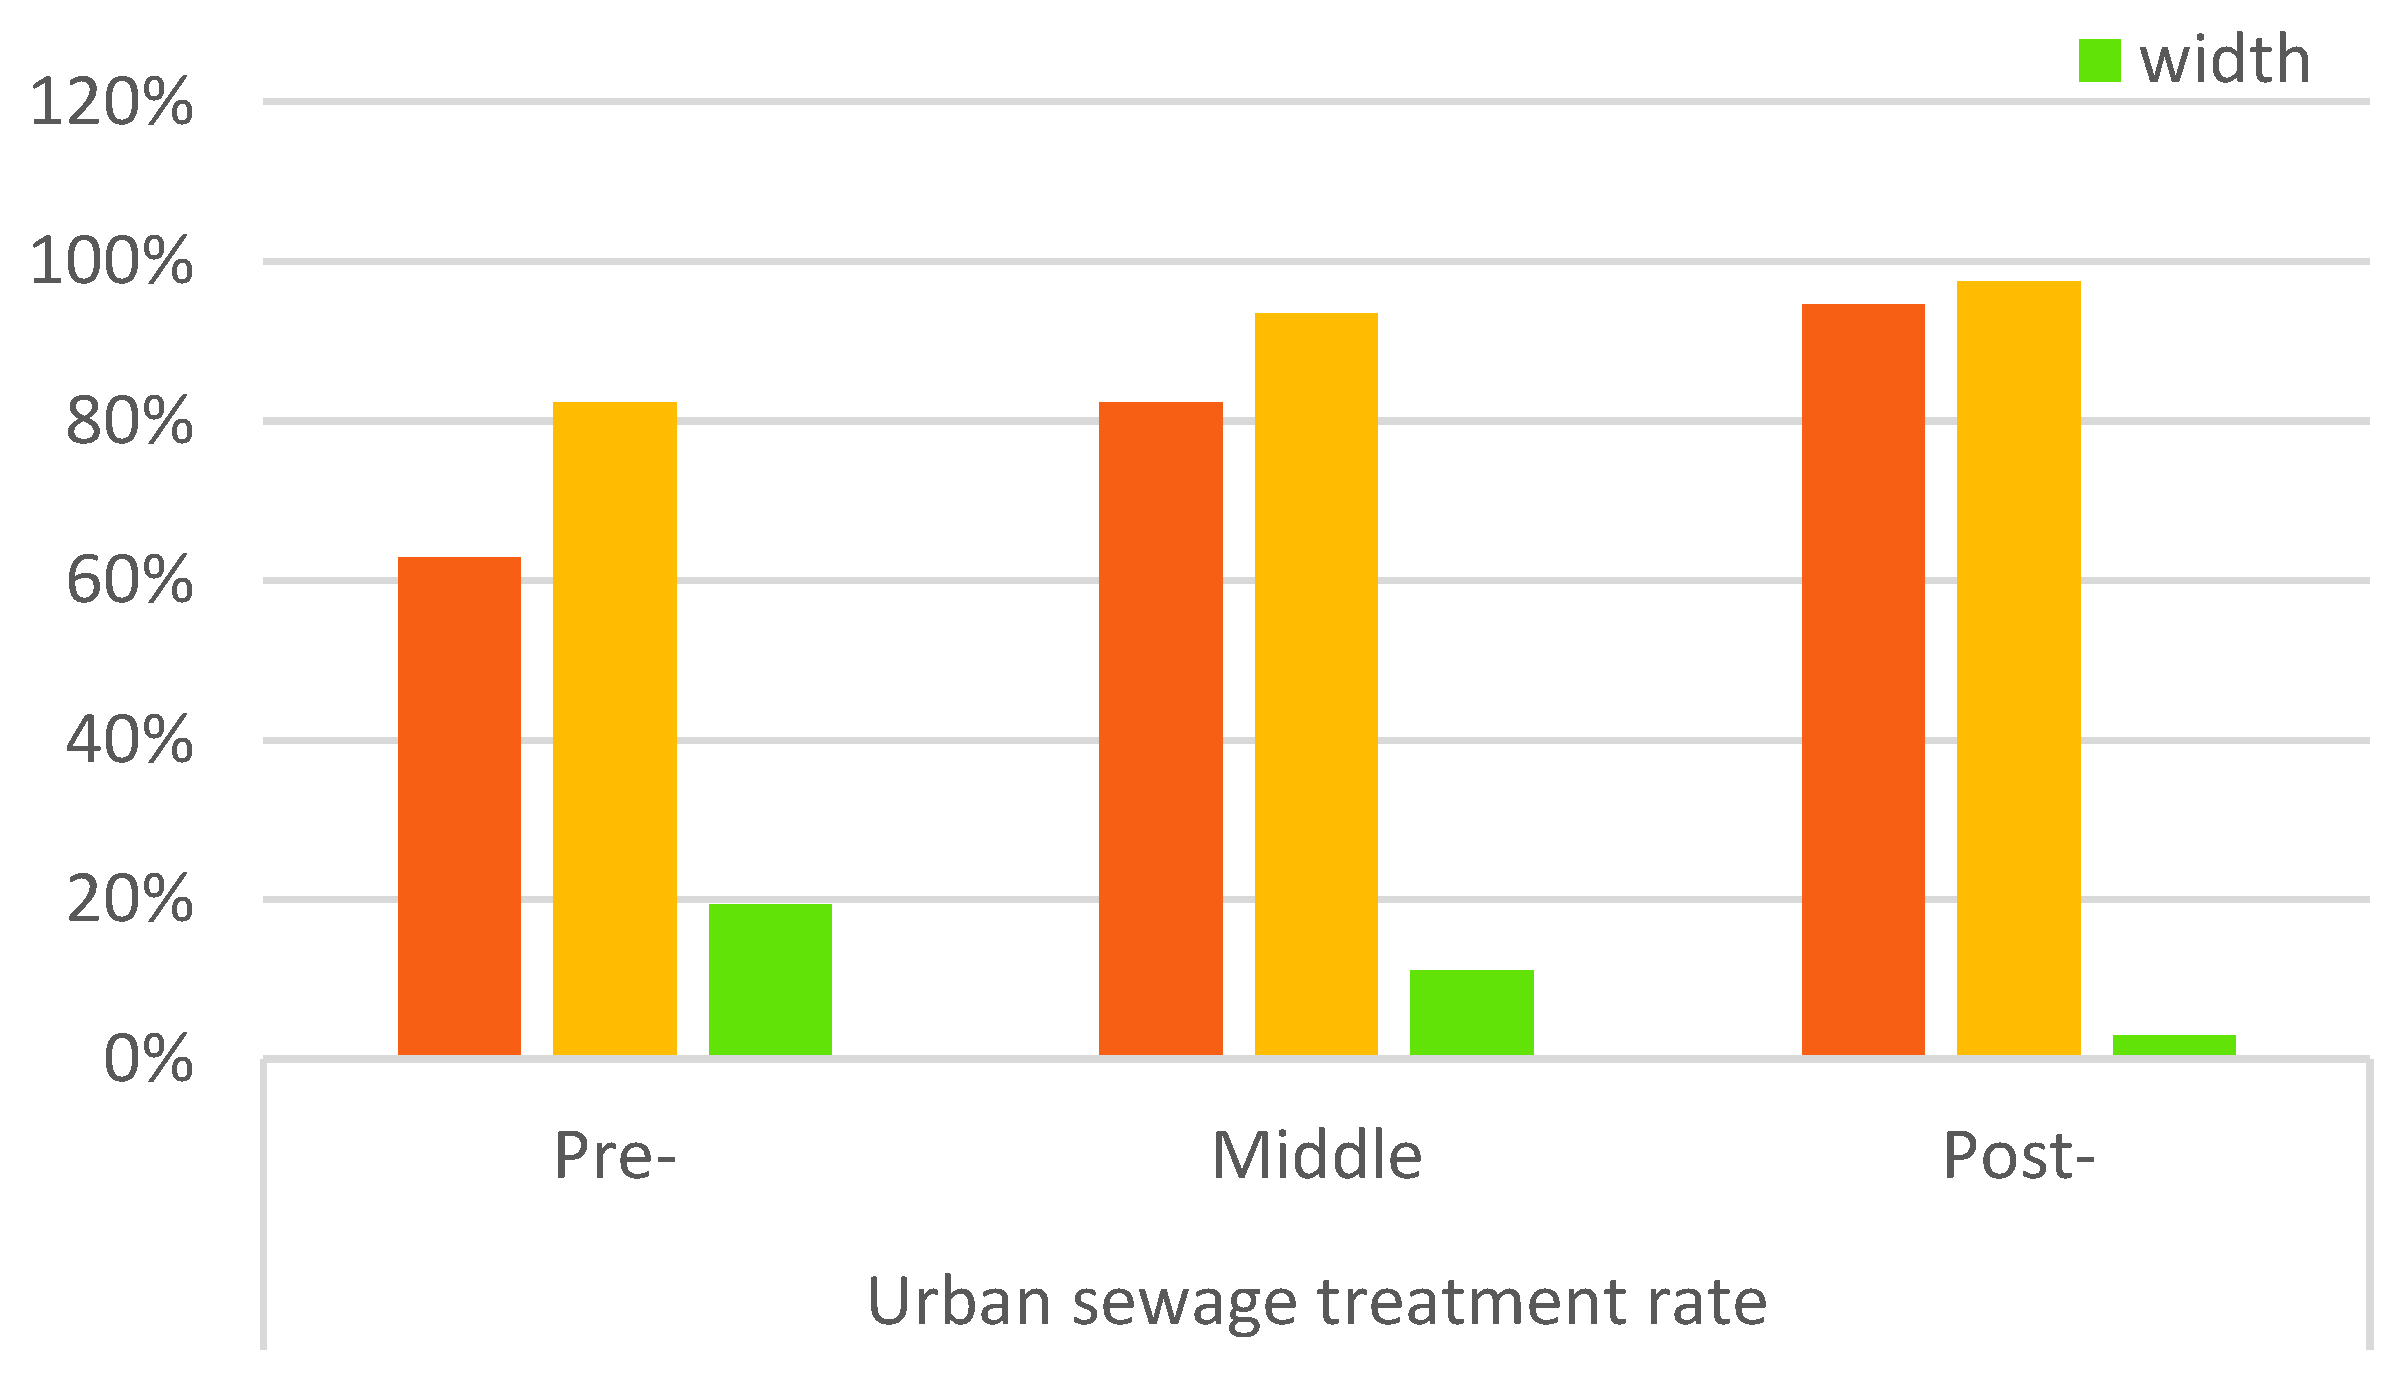
According to the specific data of the two indicators of urban sewage discharge and urban sewage treatment rates in Figure 7 and Figure 8, it can be seen that the urban sewage discharge and treatment rates pre-event are the worst among the three periods. Since the beginning of the SWRM policy, the discharge and treatment rates strictly controlled and improved China’s complex water resources and water environment problems to improve water efficiency. Therefore, the two indicators in this period began to develop well, and the amount of data in the data range of urban sewage discharge and treatment rates increased significantly. Under the continuous influence of the SWRM policy and policies, the data volume of urban sewage discharge and treatment rates in the post-event period kept increasing compared with that during the event period. Moreover, urban sewage discharge and treatment rates in the post-event period are the best among the three periods, indicating that implementing the SWRM policy in China since 2011 has been slightly effective. Implementing the SWRM policy is conducive to improving China’s overall water use efficiency.
In conclusion, implementing the SWRM policy significantly impacts water use efficiency. Before implementing the SWRM policy, all eight indicators showed a trend of free development. They were not conducive to the rational development and utilization of water resources, conservation and protection, and ecological civilization construction in China. Since implementing the SWRM policy in 2011, the government and departments have adopted the SWRM responsibility and assessment system. In addition, the implementation of this policy has a lasting impact on the post-event period, so the eight indicators related to water use efficiency improved in the periods during and after the event, which is conducive to the improvement of water use efficiency.
5. Conclusions
The active promotion and implementation of the SWRM policy are conducive to improving water use efficiency and can achieve sustainable water development. Moreover, the policy’s implementation also can achieve the excellent maintenance of the ecosystem with the sustainable use of water resources. Based on the indicators of water efficiency from 2007 to 2020, this study uses the interval event method to further evaluate the implementation of this policy and analyze its impact on water use efficiency from the three different time windows of “pre-, middle, and post-” event. The key conclusions drawn from the analysis held in this study are as follows. First, the analysis of water efficiency coefficient b shows that in the time interval from 2007 to 2020, the indicators related to water use efficiency have shown a good development trend, and the national water use efficiency has increased year by year. Second, to discover the impact of the implementation of the SWRM policy on water use efficiency more pertinently, we further analyzed the changes in 2011- and 2020-related indicator data, which show that the implementation of the total water use control system and water use efficiency control system implemented in the SWRM policy to achieve the goals of the red line of water resources development and utilization and the red line of water use efficiency control have shown results and have a positive role in promoting the improvement of national water use efficiency. At last, in the interval coefficient analysis of event dummy variables, the following result can be obtained by describing the changes of eight indicators related to water use efficiency in different time windows of “pre-, middle, and post-” event: since the implementation of the SWRM policy in 2011, the government has successively adopted the SWRM responsibility and assessment system to manage water resources, and the implementation of this policy has a lasting impact on the post-event period. Therefore, the eight indicators related to water use efficiency have improved during the event and in the post-event period, which is conducive to improving water use efficiency.
This study also has certain limitations; therefore, subsequent studies must further improve and deepen the exploration of this topic, such as research on synergies and conflicts between policy goals and water uses based on backcasting scenarios method [45]. This study mainly selects indicators based on the “three red lines” established in the SWRM policy. Among them, the red line for the control of water resources development and utilization and red line for the control of water efficiency can be measured through the indicators. However, the article does not select specific scientifically based indicators to measure and study the impact of establishing water function zones to limit pollution absorption red lines on water use efficiency. Moreover, further research and learning are needed to select specific indicators and assess their impact on water efficiency.
Author Contributions
Conceptualization, Z.C. and Z.S.; methodology, Y.Z.; software, Y.Z.; validation, T.S., N.W. and Z.C.; formal analysis, Y.Z.; data curation, N.W.; writing—original draft preparation, Y.Z. and Z.C.; writing—review and editing, Z.S. and T.S.; visualization, Y.Z.; project administration, Z.S.; funding acquisition, Z.C. All authors have read and agreed to the published version of the manuscript.
Funding
The research is sponsored by the grants of the National Natural Science Foundation of China (No. 72004175), the Major Program of Philosophy and Social Science of Guizhou Province (No. 21GZZB28), and the Major Program of Philosophy and Social Science of Chinese Ministry of Education (No.21JZD034).
Institutional Review Board Statement
Not applicable.
Informed Consent Statement
Not applicable.
Data Availability Statement
Not applicable.
Acknowledgments
The authors would like to thank the help of Rulin Ouyang.
Conflicts of Interest
The authors declare no conflict of interest.
References
- Ridoutt, B.G.; Pfister, S. A Revised Approach to Water Footprinting to Make Transparent the Impacts of Consumption and Production on Global Freshwater Scarcity. Glob. Environ. Chang. 2010, 20, 113–120. [Google Scholar] [CrossRef]
- Feng, K.; Siu, Y.L.; Guan, D.; Hubacek, K. Assessing Regional Virtual Water Flows and Water Footprints in the Yellow River Basin, China: A Consumption Based Approach. Appl. Geogr. 2012, 32, 691–701. [Google Scholar] [CrossRef]
- Ma, T.; Sun, S.; Fu, G.; Hall, J.W.; Ni, Y.; He, L.; Yi, J.; Zhao, N.; Du, Y.; Pei, T.; et al. Pollution Exacerbates China’s Water Scarcity and Its Regional Inequality. Nat. Commun. 2020, 11, 650. [Google Scholar] [CrossRef] [PubMed] [Green Version]
- Ouyang, R.; Liu, W.; Fu, G.; Liu, C.; Hu, L.; Wang, H. Linkages between ENSO/PDO Signals and Precipitation, Streamflow in China during the Last 100 Years. Hydrol. Earth Syst. Sci. 2014, 18, 3651–3661. [Google Scholar] [CrossRef] [Green Version]
- Yu, Y.; Hubacek, K.; Feng, K.; Guan, D. Assessing Regional and Global Water Footprints for the UK. Ecol. Econ. 2010, 69, 1140–1147. [Google Scholar] [CrossRef]
- World Water Council. Water and Climate Blue Book; World Water Council: Marseille, France, 2017. [Google Scholar]
- Aznar-Sánchez, J.A.; Belmonte-Ureña, L.J.; Velasco-Muñoz, J.F.; Valera, D.L. Farmers’ Profiles and Behaviours toward Desalinated Seawater for Irrigation: Insights from South-East Spain. J. Clean. Prod. 2021, 296, 126568. [Google Scholar] [CrossRef]
- Keesstra, S.D.; Bouma, J.; Wallinga, J.; Tittonell, P.; Smith, P.; Cerdà, A.; Montanarella, L.; Quinton, J.N.; Pachepsky, Y.; Van Der Putten, W.H.; et al. The Significance of Soils and Soil Science towards Realization of the United Nations Sustainable Development Goals. Soil 2016, 2, 111–128. [Google Scholar] [CrossRef] [Green Version]
- Wang, X.; Wang, G.; Wu, Y.; Xu, Y.; Gao, H. Comprehensive Assessment of Regional Water Usage Efficiency Control Based on Game Theory Weight and a Matter-Element Model. Water 2017, 9, 113. [Google Scholar] [CrossRef] [Green Version]
- Jia, S.; Zhu, W. China’s Achievements of Water Governance over the Past Seven Decades. Int. J. Water Resour. Dev. 2020, 36, 292–310. [Google Scholar] [CrossRef]
- Cheng, Z.; Wang, N.; Ouyang, R.; Wang, H.; Song, Z. A Content Analysis of the Strictest Water Resources Management Policy in China. Water Economics and Policy 2022, 08, 2250011. [Google Scholar] [CrossRef]
- Wang, X.J.; Zhang, J.Y.; Gao, J.; Shahid, S.; Xia, X.H.; Geng, Z.; Tang, L. The New Concept of Water Resources Management in China: Ensuring Water Security in Changing Environment. Environ. Dev. Sustain. 2018, 20, 897–909. [Google Scholar] [CrossRef]
- Zuo, Q.; Jin, R.; Ma, J.; Cui, G. China Pursues a Strict Water Resources Management System. Environ. Earth Sci. 2014, 72, 2219–2222. [Google Scholar] [CrossRef]
- Liu, S.; Wang, N.; Xie, J.; Jiang, R.; Zhao, M. Optimal Scale of Urbanization with Scarcewater Resources: A Case Study in an Arid and Semi-Arid Area of China. Water 2018, 10, 1602. [Google Scholar] [CrossRef] [Green Version]
- Dou, M.; Wang, Y. The Construction of a Water Rights System in China That Is Suited to the Strictest Water Resources Management System. Water Sci. Technol. Water Supply 2017, 17, 238–245. [Google Scholar] [CrossRef]
- Xu, L.; Gober, P.; Wheater, H.S.; Kajikawa, Y. Reframing Socio-Hydrological Research to Include a Social Science Perspective. J. Hydrol. 2018, 563, 76–83. [Google Scholar] [CrossRef]
- Zhu, X.; Zhang, G.; Yuan, K.; Ling, H.; Xu, H. Evaluation of Agricultural Water Pricing in an Irrigation District Based on a Bayesian Network. Water 2018, 10, 768. [Google Scholar] [CrossRef] [Green Version]
- Xu, Y.; Zhu, X.; Wen, X.; Herrera-Viedma, E. Fuzzy Best-Worst Method and Its Application in Initial Water Rights Allocation. Appl. Soft Comput. 2021, 101, 107007. [Google Scholar] [CrossRef]
- Shen, D. The Strictest Water Resources Management Strategy and Its Three Red Lines. In Global Issues in Water Policy; Springer: Berlin/Heidelberg, Germany, 2021; Volume 26. [Google Scholar]
- Zuo, Q.; Hu, D.; Dou, M.; Zhang, X.; Ma, J. Framework and Core System of the Most Stringent Water Resource Management System Based on the Concept of Human-Water Harmony. Resour. Sci. 2014, 36, 906–912. [Google Scholar]
- Ge, M.; Wu, F.; Chen, X. Using Multiple Discriminant Analysis for the Assignment of Initial Water Entitlements at River Basin-Level under the Strictest Water Resources Management System Constraints in China. Sustainability 2018, 10, 4414. [Google Scholar] [CrossRef] [Green Version]
- Wu, D.; Wang, S.D. The Interactive Allocation of Initial Water Rights Based on the Strictest Water Resources Management System in the Basin. In Proceedings of the International Conference on Management Science and Engineering—Annual Conference Proceedings, Helsinki, Finland, 17–19 August 2014. [Google Scholar]
- Fu, H.; Niu, J.; Wu, Z.; Xue, P.; Sun, M.; Zhu, H.; Cheng, B. Influencing factors of stereotypes on wastewater treatment plants-Case study of 9 wastewater treatment plants in Xi′an, China. Environ. Manage. 2022, 1–10. [Google Scholar] [CrossRef]
- Sun, S. Coordination Degree Evaluation of Water Resources and Economic Development Based on the Strictest Water Resources Management System. Guangdong Water Resour. Hydropower 1975, 24, 168. [Google Scholar] [CrossRef]
- Feng, H.; Shi, P.; Zhou, W.; Chen, J.; Zhang, X. Threshold Analysis of Urbanization with the Constraint of “Three Red Lines” on Water Resources Management: A Case Study of Zhangye City. J. Nat. Resour. 2018, 33, 287–301. [Google Scholar] [CrossRef]
- Nageswaru Rao, S.V.D.; Sreejith, U. Event Study Methodology: A Critical Review. Macrotheme Rev. 2014, 3, 40–53. [Google Scholar]
- Seraphin, H. COVID-19: An Opportunity to Review Existing Grounded Theories in Event Studies. J. Conv. Event Tour. 2021, 22, 3–35. [Google Scholar] [CrossRef]
- Ding, L.; Lam, H.K.S.; Cheng, T.C.E.; Zhou, H. A Review of Short-Term Event Studies in Operations and Supply Chain Management. Int. J. Prod. Econ. 2018, 200, 329–342. [Google Scholar] [CrossRef]
- Maul, D.; Schiereck, D. The Bond Event Study Methodology since 1974. Rev. Quant. Financ. Account. 2017, 48, 749–787. [Google Scholar] [CrossRef]
- Fuller, P.; Yamani, E.; Yu, G. The Impact of the New Real Estate Sector on REITs: An Event Study. J. Econ. Financ. 2019, 43, 143–161. [Google Scholar] [CrossRef]
- Tahir, S.H.; Tahir, F.; Syed, N.; Ahmad, G.; Ullah, M.R. Stock Market Response to Terrorist Attacks: An Event Study Approach. J. Asian Financ. Econ. Bus. 2020, 7, 31–37. [Google Scholar] [CrossRef]
- Tao, R.; Su, C.W.; Yaqoob, T.; Hammal, M. Do Financial and Non-Financial Stocks Hedge against Lockdown in COVID-19? An Event Study Analysis. Econ. Res. Istraz. 2021. [Google Scholar] [CrossRef]
- Serra, A.P. Event Study Tests: A Brief Survey. Gestão Org-Rev. Electrónica Gestão Organ. 2007, 2, 248–255. [Google Scholar]
- Getz, D. Event Studies: Discourses and Future Directions. Event Manag. 2012, 16, 171–187. [Google Scholar] [CrossRef]
- Binder, J.J. The Event Study Methodology since 1969. Rev. Quant. Financ. Account. 1998, 11, 111–137. [Google Scholar] [CrossRef]
- Han, A.; Hong, Y.; Wang, S. Impacts of Financial Crisis on State-Owned Commercial Banks: An Interval Event Study Approach. Manage. Rev. 2009, 21, 53–61. [Google Scholar]
- Corrado, C.J. Event Studies: A Methodology Review. Account. Financ. 2011, 51, 207–234. [Google Scholar] [CrossRef]
- Campbell, C.J.; Cowan, A.R.; Salotti, V. Multi-Country Event-Study Methods. J. Bank. Financ. 2010, 34, 3078–3090. [Google Scholar] [CrossRef] [Green Version]
- Li, Y.; Cui, Q.; Li, C.; Wang, X.; Cai, Y.; Cui, G.; Yang, Z. An Improved Multi-Objective Optimization Model for Supporting Reservoir Operation of China’s South-to-North Water Diversion Project. Sci. Total Environ. 2017, 575, 970–981. [Google Scholar] [CrossRef]
- Höglund, L. Household Demand for Water in Sweden with Implications of a Potential Tax on Water Use. Water Resour. Res. 1999, 35, 3853–3863. [Google Scholar] [CrossRef]
- Wang, J.; Huang, J.; Zhang, L.; Huang, Q.; Rozelle, S. Water Governance and Water Use Efficiency: The Five Principles of WUA Management and Performance in China. J. Am. Water Resour. Assoc. 2010, 46, 665–685. [Google Scholar] [CrossRef]
- Zhang, G.; Xie, C.; Li, S.; Xu, F.; Jin, D. Study on Water Use Efficiency Indicators Variation Trend in China Since 2000. Yellow River 2018, 40, 6–10. [Google Scholar]
- Ni, J.; Shi, A.; Wang, H. Study on the Comprehensive Water Use Efficiency in Jiangsu Province Based on the Improved Linear Regression Method. Jiangsu Water Resour. 2020, 1, 44–49. [Google Scholar]
- Yao, T.; Liu, S. Comparison of the Variation Characteristics of Water Resource Use Efficiency Indicators in the Beijing-Tianjin-Hebei Region. Prog. Geogr. 2021, 40, 1195–1207. [Google Scholar] [CrossRef]
- Van der Voorn, T.; Svenfelt, Å.; Björnberg, K.E.; Fauré, E.; Milestad, R. Envisioning Carbon-Free Land Use Futures for Sweden: A Scenario Study on Conflicts and Synergies between Environmental Policy Goals. Reg. Environ. Chang. 2020, 20, 35. [Google Scholar] [CrossRef] [Green Version]
Figure 1.
China’s total annual water consumption from 2007 to 2020 (unit: 100 million m3).

Figure 2.
Flow chart of the research.

Figure 3.
Change in total annual water consumption (unit: 10 thousand m3).

Figure 4.
Change in total groundwater supply (unit: 10 thousand m3).

Figure 5.
Change in total industrial water consumption and agricultural water consumption (unit: 10 thousand m3).
Figure 5.
Change in total industrial water consumption and agricultural water consumption (unit: 10 thousand m3).

Figure 6.
Change in water consumption per ten thousand yuan of GDP and ten thousand yuan of industrial added value (unit: m3).
Figure 6.
Change in water consumption per ten thousand yuan of GDP and ten thousand yuan of industrial added value (unit: m3).

Figure 7.
Change in urban sewage discharge (unit: 10 thousand m3).

Figure 8.
Change in urban sewage treatment rate.


Table 1.
Detailed list of events and breakdown of each period.
| The Event | Event Windows | Start | End | Indicators |
|---|---|---|---|---|
| Implement the strictest water resource management policy | Pre- | 2007 | 2010 | Total annual water consumption, groundwater supply, industrial water consumption, agricultural water consumption, water consumption per ten thousand yuan of GDP, water consumption per ten thousand yuan of industrial added value, urban sewage discharge, urban sewage treatment rate |
| Middle | 2011 | 2016 | ||
| Post | 2017 | 2020 |
Table 2.
Descriptive statistical analysis of variables.
| Variables | Unit | Samples | Min | Max | Mean | Standard Deviation | Median | Data Sources |
|---|---|---|---|---|---|---|---|---|
| Total annual water consumption | 10 thousand m3 | 14 | 58,129,000 | 61,834,000 | 60,192,142.86 | 1,104,845.54 | 60,311,000 | China Statistical Yearbook of Water Resources China Statistical Yearbook |
| Total groundwater supply | 10 thousand m3 | 14 | 8,925,000 | 11,338,000 | 10,562,571.43 | 745,845.39 | 10,771,500 | China Environmental Statistics Yearbook |
| Total industrial water consumption | 10 thousand m3 | 14 | 10,304,000 | 138,070,000 | 22,214,285.71 | 33,364,217.87 | 13,734,500 | China Statistical Yearbook China Statistical Yearbook of Social Statistics |
| Total agricultural water consumption | 10 thousand m3 | 14 | 35,985,000 | 39,215,000 | 37,489,357.14 | 1,036,010.44 | 37,333,500 | China Statistical Yearbook China Statistical Yearbook of Social Statistics |
| Water consumption per ten thousand yuan of GDP | 100 million m3 | 14 | 57.21 | 215.43 | 112.98 | 49.66 | 99.5 | China Water Resources Bulletin |
| Water consumption per ten thousand yuan of industrial added value | 100 million m3 | 14 | 18.57 | 52.64 | 30.4 | 10.61 | 27.81 | China Statistical Summary China Environmental Statistics Yearbook |
| Urban sewage discharge | 10 thousand m3 | 14 | 3,610,118 | 5,713,633 | 4,468,221.38 | 700,677.81 | 4,363,976.5 | China Statistical Yearbook of Urban Construction China Statistical Yearbook of Urban and Rural Construction |
| Urban sewage treatment rate | % | 14 | 62.90% | 97.50% | 86.50% | 10.60% | 89.70% | China Statistical Yearbook of Urban Construction China Statistical Yearbook of Urban and Rural Construction |
Table 3.
Data changes of indicators from 2007 to 2020 (1).
| Indicators | Total Annual Water Consumption | Total Groundwater Supply | Total Industrial Water Consumption | Total Agricultural Water Consumption |
|---|---|---|---|---|
| 2007 | 58,187,000 | 10,695,000 | 14,041,000 | 35,985,000 |
| 2020 | 58,129,000 | 8,925,000 | 10,304,000 | 36,124,000 |
| Range of change | −0.10% | −16.55% | −26.61% | 0.37% |
| b | −1 | −1 | −1 | 1 |
Table 4.
Data changes of indicators from 2007 to 2020 (2).
| Indicators | Water Consumption Per Ten Thousand Yuan of GDP | Water Consumption Per Ten Thousand Yuan of Industrial Added Value | Urban Sewage Discharge | Urban Sewage Treatment Rate |
|---|---|---|---|---|
| 2007 | 235 | 126 | 3,610,118 | 62.9% |
| 2020 | 57.2 | 32.9 | 5,713,633 | 97.5% |
| Range of change | −75.66% | −73.89% | 58.27% | 55.01% |
| b | / | −1 | 1 | 1 |
Table 5.
Data changes of indicators from 2011 to 2020 (1).
| Indicators | Total Annual Water Consumption | Total Groundwater Supply | Total Industrial Water Consumption | Total Agricultural Water Consumption |
|---|---|---|---|---|
| 2011 | 6107.2 | 1109.1 | 1461.8 | 3743.6 |
| 2020 | 5812.9 | 892.5 | 1030.4 | 3612.4 |
| Range of change | −4.82% | −19.53% | −29.51% | −3.50% |
Table 6.
Data changes of indicators from 2011 to 2020 (2).
| Indicators | Water Consumption Per Ten Thousand Yuan of GDP | Water Consumption Per Ten Thousand Yuan of Industrial Added Value | Urban Sewage Discharge | Urban Sewage Treatment Rate |
|---|---|---|---|---|
| 2011 | 178 | 99 | 4,037,022 | 83.60% |
| 2020 | 57.2 | 32.9 | 5,713,633 | 97.50% |
| Range of change | −67.87% | −66.77% | 41.53% | 16.63% |
Table 7.
Interval coefficients of event dummy variables for the SWRM policy.
| Indicators | Event Windows | Width | ||
|---|---|---|---|---|
| Total annual water consumption | Pre- | 58,187,000 | 60,220,000 | 2,033,000 |
| Middle | 61,072,000 | 61,834,000 | 1,614,000 | |
| Post- | 58,129,000 | 60,434,000 | 2,305,000 | |
| Total groundwater supply | Pre- | 10,695,000 | 11,703,000 | 1,008,000 |
| Middle | 10,570,000 | 11,338,000 | 768,000 | |
| Post- | 8,925,000 | 10,161,000 | 1,206,000 | |
| Total industrial water consumption | Pre- | 13,909,000 | 14,473,000 | 5,640,000 |
| Middle | 13,080,000 | 14,473,000 | 1,393,000 | |
| Post- | 10,304,000 | 12,770,000 | 2,466,000 | |
| Total agricultural water consumption | Pre- | 35,985,000 | 37,231,000 | 1,246,000 |
| Middle | 36,891,000 | 39,215,000 | 2,324,000 | |
| Post- | 36,124,000 | 37,664,000 | 1,540,000 | |
| Water consumption per ten thousand yuan of GDP | Pre- | 191 | 235 | 44 |
| Middle | 81 | 178 | 97 | |
| Post- | 57.2 | 73 | 15.8 | |
| Water consumption per ten thousand yuan of industrial added value | Pre- | 105 | 127 | 22 |
| Middle | 52.8 | 99 | 46.2 | |
| Post- | 32.9 | 45.6 | 12.7 | |
| Urban sewage discharge | Pre- | 3,610,118 | 3,786,986 | 176,865 |
| Middle | 3,786,983 | 4,803,049 | 1,016,066 | |
| Post- | 4,923,895 | 5,713,633 | 789,738 | |
| Urban sewage treatment rate | Pre- | 62.9% | 82.3% | 19.4% |
| Middle | 82.30% | 93.40% | 11.1% | |
| Post- | 94.50% | 97.50% | 3% |
Publisher’s Note: MDPI stays neutral with regard to jurisdictional claims in published maps and institutional affiliations. |
© 2022 by the authors. Licensee MDPI, Basel, Switzerland. This article is an open access article distributed under the terms and conditions of the Creative Commons Attribution (CC BY) license (https://creativecommons.org/licenses/by/4.0/).
Share and Cite
MDPI and ACS Style
Cheng, Z.; Zhao, Y.; Wang, N.; Song, T.; Song, Z. Assessing the Impact of the Strictest Water Resources Management Policy on Water Use Efficiency in China. Water 2022, 14, 2291. https://doi.org/10.3390/w14152291
AMA Style
Cheng Z, Zhao Y, Wang N, Song T, Song Z. Assessing the Impact of the Strictest Water Resources Management Policy on Water Use Efficiency in China. Water. 2022; 14(15):2291. https://doi.org/10.3390/w14152291
Chicago/Turabian StyleCheng, Zhe, Yuntong Zhao, Nina Wang, Tao Song, and Zhe Song. 2022. "Assessing the Impact of the Strictest Water Resources Management Policy on Water Use Efficiency in China" Water 14, no. 15: 2291. https://doi.org/10.3390/w14152291
Note that from the first issue of 2016, this journal uses article numbers instead of page numbers. See further details here.