
Assessment of Water Quality Indicators in the Orla River Nitrate Vulnerable Zone in the Context of New Threats in Poland


1
Department of Ecology and Environmental Protection, Poznań University of Life Sciences, Piatkowska 94C, 60-649 Poznań, Poland
2
Department of Mathematical and Statistical Methods, Poznań University of Life Sciences, Wojska Polskiego 28, 60-637 Poznań, Poland
*
Author to whom correspondence should be addressed.
Water 2022, 14(15), 2287; https://doi.org/10.3390/w14152287
Submission received: 3 June 2022
/
Revised: 11 July 2022
/
Accepted: 18 July 2022
/
Published: 22 July 2022
(This article belongs to the Special Issue Water Quality in Agricultural Watersheds)
Abstract
:Currently, one of the most serious threats to the environment in rural areas is industrial livestock production, which generates a significant amount of chemical and biological pollution. It causes pollution of waters, affects biodiversity, and has an impact on the climate. Research was carried out in the Orla River (Poland) with a catchment area of 1.546 km2. Studies were concentrated on pH, dissolved oxygen, alkalinity, and other factors. Analyses were conducted on the area of livestock buildings in two buffer zones, 1 and 3 km wide, respectively, and included the abundance of phosphorus and potassium in soil as well as its potential impact on the quality of river water. Seasonal variability was observed for nutrients. In the winter period the highest concentrations of nitrates were observed, while in the summer this was the case for phosphates and total phosphorus. The highest concentrations of nutrients occurred in 2012, particularly total and ammonium nitrogen. There was a positive correlation between livestock building area and parameters such as ammonium, organic, and total nitrogen in the 1 km buffer, as well as organic and total nitrogen, potassium and dissolved oxygen in the 3 km buffer. Negative correlation in the case of pH was observed in both buffer zones. Relationships were found between the area of livestock buildings and parameters analyzed during seasons.
1. Introduction
In the face of ongoing changes in the climate and environment, the starting point for regulation of ecological processes is proper water management on a river basin scale. Water is a fundamental factor shaping the evolution of ecosystems and constitutes the basis of ecosystem services [1,2]. Processes generating threats on a global scale affect the integration of hydrological and ecological knowledge. The deteriorating condition of the environment, the progressive reduction of biodiversity and the growing costs of food production indicate that the existing forms of counteracting these changes are insufficient. We are living in an epoch called the “Anthropocene”, in which humans are the main driving force behind the modifications of element cycles [3,4]. It manifests itself in the degradation of the ecosystem structure and the modification of processes shaped in the course of evolution, such as the circulation of water and biogenic elements. Currently, these phenomena are overlapping with global demographic, climatic, and socioeconomic changes, which frequently have devastating effects on local environments [5,6].
During the last several years, strongly industrialized agriculture has started to develop both in Poland and globally, thus negatively affecting the environment and its natural elements. This phenomenon is visible in large-scale industrial animal farms, which are at odds with small and medium-sized family farms. In the US, they are referred to as concentrated animal feeding operations (CAFOs) [7]. In Poland, there are approx. 1.4 million farms. The vast majority are engaged in livestock production. According to Statistics Poland, between 2010 and 2019, the number of livestock in Poland increased—cattle by 11%, chickens by up to 36%, ducks by 113%, and turkeys by 116% [8]. In 2019, industrial feed consumption increased by 44% as compared to 2010. Poland ranks 15th globally in terms of the number of pigs [9]. According to FAO statistics, in the period between 1970 and 2010, the total number of livestock in the world increased by 196% (with the increase ranging from 32 to 565% in individual farms). As shown by the Consultative Group on International Agricultural Research, if the current trend continues into 2050, the number of poultry alone will rise to 35 billion units.
The measurement of the weight of living organisms on Earth revealed that humans, amounting to 7.6 billion individuals, account for as little as 0.01% of all living organisms. Recent analyses show that poultry accounts for 70% of the global population of birds. In the case of mammals, 60% is represented by livestock, mainly cattle and pigs, humans account for 36% of the total number, while wild animals represent less than 4%. The vast majority of livestock are farm animals. Such an enormous number of livestock produces a massive volume of excrements, which requires management. A part of it is transferred directly onto fields, but due to the current recommendations and requirements arising from the implementation of the Nitrates Directive [10] in the EU, a significant proportion of excrements must be stored in designated and specially prepared areas. Manures should be stored in conditions that minimize the loss of all nutrients that occur during fermentation [11,12], but also scouring of nitrogen and potassium compounds by water, or insoluble phosphorus compounds (e.g., during manure pile flushing) [13]. High nitrates levels of up to 1860 mg NO3·dm−3 are observed in water from wells situated near manure storage sites (in the Orla River catchment area—Barycz River Basin) [14].
Over the period of several years of research on farms involved in livestock production located in Poland, as many as 42% did not have the recommended manure pad and 24% did not have a tank for liquid manure. The oldest manure pads were built in the 1950s. In the case of liquid manure tanks, some structures date back as far as 1924. Among the farms analyzed, 25% had manure pads built in the period before the accession to the EU (before 2004). Respectively, in the case of slurry or liquid manure tanks, approx. 69% of them came from the aforementioned period [15]. As large animal farms develop, the problem of manure management exacerbates. On the one hand, there is a risk of over-fertilization with animal excrements. On the other hand, there is the problem of how to store these excrements temporarily. At present, a large proportion of farms uses beddingless breeding for livestock farming, which results in liquid manure. Since these excrements are liquid, they pose a major threat to the quality of groundwater, underground water, and surface water. This makes them very easy to pass soil profiles and they quickly leach. Intensive fertilization with animal excrements contributes to increased surface water pollution levels [16,17].
Some authors indicate that the water footprint of each animal product is greater than that of plant products of equivalent nutritional value. The average water footprint per calorie of beef is 20 times higher than cereals and starchy roots. The water footprint per gram of protein for milk, egg and chicken meat is 1.5 times higher than, for example, pulses [18]. The authors note that factory farming systems consume and pollute more groundwater and surface water resources compared to traditional systems. The main problem is the detrimental efficiency of feed uptake by livestock, which is largely affected by the relatively large water footprint of animal products and the pollution of water bodies. Increasing global meat consumption and intensification of livestock production systems will put further pressure on global freshwater resources in the coming decades [18].
The consumption of industrial feeds with high nutrient content is rising along with the development of livestock production. Undigested components are excreted, causing their concentrations in manure to increase and thus posing a threat to soil and water quality. In the period from 2005 to 2017, feed consumption in Poland expanded dramatically—by 83.6% (2005 = 100%) in total for all types of livestock. The comparison of 2017 with 2016 by species shows that the largest growth (19.8%) of feed consumption was recorded in cattle rearing. For pigs and poultry, the increase amounted to 16.8% and 6.2%, respectively.
As the world’s population grows and the level of human needs in developing countries increases, so does the intensity of the use of the environment. In addition to the expected outcomes, human activity also contributes to the generation of sewage. It poses a serious threat to the environment, and its volume is directly proportional to the standard of living. Despite recent investments, rural areas in Poland are less developed in terms of technical infrastructure than urban areas. This applies particularly to water and sewage management facilities and equipment. It results from the dispersed nature of rural development, its difficult accessibility (upland and mountain areas), and thus the high cost of investment projects in non-urbanized areas. Sewage generated within farms varies in composition and nature. It primarily consists of domestic wastewater, animal excrements, leachate water from places where manures or juicy feeds are stored, or water run-off from fields and rural farms [19,20,21]. Another problem can be precipitation (rain and snowmelt) wastewater, as well as infiltration and drainage water flowing away from land on which drainage operations have been carried out. On farms, sewage may also be generated as a result of the washing of farm premises, paved areas and farm machinery. The supply of drinking and industrial water to non-urbanized areas constitutes one of the basic conditions for the evolution of agricultural and livestock production, as well as for the improvement of the standard of living and hygiene of the rural population. The continuous growth of rural areas results in an increase in the demand and consumption of water and the volume of the generated sewage. As much as 60% of rural development in Poland is scattered, with distances between neighboring properties exceeding 45 m. This is an unfavorable factor for the construction of collective water supply and sewerage facilities [22,23].
As the quality of water in agricultural catchments may be subject to pressure from various sources of pollution, this study attempts to assess the impact of large-scale animal farms, which create an increasing environmental problem both in Poland and in the world. The aim of this research is to assess the quality of water in the agricultural catchment in the context of new threats resulting from the intensive development of industrial animal farms. A working hypothesis was formulated in the research that it is possible to assess the potential impact of livestock production on water quality on the basis of the area of livestock buildings. The research and analyses included the following specific objectives: (1) analysis of the area of livestock buildings in two buffers 1 km and 3 km from the monitoring point on watercourses; (2) analysis of connections between the area of livestock buildings in buffers and water quality parameters; (3) analysis of water quality changes in the Orla River and its tributaries in years and seasons (spring, summer, autumn, winter); and (4) analysis of soils abundance in the catchment and the interaction (synergism, antagonism) between the components in the soil and in the water.
2. Materials and Methods
2.1. Study Area
The research covered the Orla River catchment in western Poland (Figure 1). Administratively, the river under study is located on the border of two voivodships: Greater Poland and Lower Silesian. The Orla River is a right tributary of the Barycz River with a length of 88 km and a catchment area of 1546 km2. There are no lakes in the catchment, only a few artificial water reservoirs. In the southern part, there is a complex of fishponds called the Milicz Ponds, which remain under legal protection. Lakes constitute 1.2% of the analysed area (0.9% of Poland in general).
The Orla River catchment has an agricultural character (with arable land and grassland accounting for 64.3% and 8.8 % of the total area). Forests cover 21.5% of the catchment area (in Poland, they account for 29.8%, in Europe—32.2%, in the world—30.6%) [24,25]. Forest complexes consist mainly of pine forests. There are differences in use between parts of the catchment in individual voivodeships. In the Greater Poland Voivodeship, the share of arable land and forest land amounts to 77% and 16%, respectively. The catchment area located in the Lower Silesian Voivodeship is characterized by a much smaller share of arable land (58%), but a larger share of forests (30%). The region of the catchment under study is rich in protected areas, which are concentrated in its southern part [26].
The catchment area is sparsely urbanized. The two largest cities are Rawicz (on the western side of the catchment) and Krotoszyn (on the eastern side). The total proportion of built-up area in the catchment region is 4.1%.
According to the agronomic soil quality classes (I—the best; II—very good; IIIa—good; IIIb—medium good; IVa—medium quality, better; IVb—medium quality, inferior; V—weak; VI—weakest) the Orla River catchment is dominated by soils of class III (41.3%) and IV (22.2%). Class V and VI soils constitute 16.1% and 10.2%, respectively [27]. The annual rainfall in the region amounts to 500–550 mm. The groundwater level fluctuates significantly. In recent years, it has considerably declined due to periods of drought.
The Orla River is considered sensitive to pollution by nitrogen compounds from agricultural sources. This results from the implementation of Council Directive 91/676/EEC of 12 December 1991 in Poland [10].
Sixteen monitoring sites located in agriculturally used areas on the main watercourse and tributaries were selected for analysis to exclude the direct influence of other sources of pollution on the study results (Table 1; Figure 2). Since the research targeted areas with intensive agricultural production, four watercourses in the southern part of the Orla catchment were not monitored. They include small watercourses: Rów Graniczny, Kanał Młyński, Kanał Książęcy and Wąsoska Struga, mostly located in the Barycz Valley Landscape Park. Their catchments are characterized by a much higher proportion of forest and woodlots, reaching 50%, on average, and a significant share of wetlands and surface water. Previous studies carried out by the authors indicate that these sub-catchments do not significantly impact the overall state of water in the Orla River catchment [28]. The studies were conducted in 2011, 2012, and 2014.
2.2. Methods
2.2.1. Physicochemical Analyses
The temperature, pH reaction, conductivity and oxygen concentration were measured at all testing sites during fieldwork. Nitrite nitrogen, nitrate nitrogen, ammonium nitrogen, total nitrogen, soluble reactive phosphates (SRP), and total phosphorus were analyzed in a laboratory using the standard Hach–Lange methodology [29]. Records of physical and chemical water parameters (alkalinity, potassium and calcium levels) and methods of their determination are summarized in Table 2.
2.2.2. Spatial Analysis
Selected results of physicochemical analyses of water from the Orla River and its tributaries were studied in terms of the presence of active livestock buildings in designated buffers. The 1- and 3-kilometer radius buffers were set around the analyzed monitoring points (Figure 3). Each of them had an area of 3.14 and 28.3 km2. The circular buffers have been selected on purpose. Livestock buildings are quite a specific source of pollution. Pollutants from animal buildings can be emitted directly (e.g., dust, microbial pollutants, or ammonia and other volatile compounds), but also indirectly (e.g., by discharging animal excrements as fertilizer to the fields located in different places and directions from farms). As for the emission, it does not depend on the boundary between the catchment area. Emission is related to the deposition (i.e., soil and water pollution with various compounds). The spread of volatile pollutants can take place in different directions, as well as the deposition. In order to obtain certainty in our results and to confirm certain trends, in this study two circular buffers were used.
The areas of buildings for keeping livestock (cattle, pigs, poultry, horses and other animals), located in the buffers, were collated and added up. This category included smaller buildings on individual farms and large industrial animal farms. Spatial analyses that included buffers were performed using the national database of spatial data with the detail corresponding to the topographic map on the scale of 1:10,000. The Database of Topographic Objects (BDOT10k) was used as the official source of information on land use. The database was created based on technical guidelines contained in the Regulation of the Minister of Internal Affairs and Administration of 17 November 2011 [33]. The analyzes used information about the P2O5 and K2O content of soils of the Orla River catchment (Figure 4).
The Map of the Hydrographic Division of Poland (MPHP10k) was used to delimit the boundaries of the Orla catchment. This is a spatial database with the detail corresponding to the topographic map on the scale of 1:10,000, which constitutes the foundation of the official hydrographic division of Poland. The database was created based on technical guidelines contained in the Regulation of the Council of Ministers of 28 December 2017 [35].
2.2.3. Statistical Analyses
In order to evaluate the correlation between monitoring sites and water quality parameters, multivariate methods were used to analyze the results of the measurements [36,37]. Canonical variate analysis, similar to principal component analysis, was selected since datasets for analyzing classifications according to two or more sources of variability were considered [38,39]. Apart from environmental research, canonical variate analysis and modifications thereof are widely used in various scientific fields [40,41], such as economics [42], food science [43] and agriculture sciences [36,44]. In this case, it is assumed that denotes the vector of water quality parameters (here ) from the th monitoring site ( here ) for the th measuring series ( here ) and th year ( here ). The canonical variate analysis studies the model in the following form:
where is the matrix of observations (N = IJK), is the vector of every element equal to 1, is the vector of general means, is the matrix of monitoring sites effects, is the matrix of measuring series effects, is the matrix of years effects, , , are design matrices (symbol denotes the Kronecker product of matrices), is the identity matrix of order , is the matrix of errors [38].
In the study of differences in water quality parameters between monitoring sites, the canonical variate analysis consists in transforming the matrix , where , into a set of new variables. Following that transformation, this matrix is presented as , where , vector is called the th canonical coordinate and vector is called the th dual canonical coordinate [36,37,40]. To compare monitoring sites or measuring series, the Mahalanobis distances [36] were calculated based on the water quality parameters.
Moreover, the correlations between the area of livestock buildings () and the particular physical and chemical water parameters () in the designated 1 and 3 km buffer were determined by calculating Pearson’s correlation coefficient () based on the equation: where: is number of replications, and are the average values of these samples. Coefficients were calculated in a similar way to assess the relationship between the level of phosphorus and potassium in soil of the studied catchment and the analyzed water parameters.
3. Results
3.1. Flow Characteristics
A water gauge is located on the Orla River in Korzeńsko. Its location corresponds approximately to that of the O10 site (Orla—Chodlewo). Specific flows (1) recorded in the Orla River catchment at the water gauge cross-section in Korzeńsko in the period 1981–2010 range from 0.06 (NNQ m3·s−1) to 4.46 m3·s−1 (Table S1). In the Korzeńsko cross-section on the Orla River, moderately dry periods (years) occurred in 1983, 1984, 1989, 1991, 1993 and 2004. For the cross section, the SSQ flow in moderately dry years represents 32% of SSQ in the multiannual period and SNQ—represents 52% of the multi-year value. Simultaneously, there is a very high monthly diversification of flows—the highest flows occur in March: SNQ = 4.613 m3·s−1, NNQ = 0.700 m3·s−1 and the lowest in July: SNQ = 0.517 m3·s−1, NNQ = 0.060 m3·s−1 [45] (Figure 5).
There are 12 municipal and 39 industrial wastewater discharge points in the Orla River catchment. In total, about 2.394 million m3·yr of sewage is discharged into the rivers in the catchment. This represents approximately 1.7% of SSQ, 24.1% of SNQ and 31.2% of QN for the water gauge located in the Korzeńsko cross-section [45]. The total pollutant loads are shown in Figure S1.
3.2. Results of Spatial Analysis
The structure of catchment use in the closing cross-sections of most testing sites is characterized by a significant dominance of arable land (usually >70%) and a small share of forests and woodlots (usually <15%). The share of urbanized areas in the catchments most frequently does not exceed 5% (Figure 6).
A very high share of outbuildings is used for livestock production (mainly pigs, poultry, cattle, but also horses). Table 3 shows areas of livestock buildings in the analyzed buffers. The vast majority of those facilities are large industrial farm halls. In the 1 km buffer, buildings located around point ZS (Żylicka Struga River) made up the largest share. Overall, the proportion of livestock buildings within the 1 km amounted to between 0 and 1.87%. There were no livestock buildings found in nine buffers.
In the 3 km buffer located around the monitoring points, the proportion of livestock buildings ranged between 0.0004% (O10) and 0.24% (ZS). Rearing without a grazing area was recorded in all analyzed buffers.
The water level in the Orla River catchment is not satisfactory. Groundwater studied in 2015–2018 in the frame of nitrate vulnerable zone (NVZ) monitoring, showed average annual concentrations reaching 121.4 mg NO3·dm−3 in Szkaradowo [46,47,48].
The water quality studies carried out by the Voivodeship Inspectorate of Environmental Protection in 2006–2015 in the Orla River catchment have revealed that the waters of the river and its tributaries are highly eutrophic due to the abnormal concentrations of nitrates, total nitrogen and total phosphorus. Levels of nitrogen compounds fluctuate considerably throughout the year. This results from the frequent occurrence of low water levels in watercourses, which are now largely as a result of climate change [49,50,51].
Research on the quality of water in the surface water body (SWB) of the Orla River from the source to Radęca in 2014–2019 shows that the achievement of environmental objectives in this SWB is at risk. Agriculture is identified as the main affecting factor. The consumption of mineral fertilizers in the area amounts to approx. 75 kg N·ha−1, 22.4 kg P·ha−1. In the catchment of the Dąbroczna River, which is a right tributary of the Orla River, soil nitrogen and phosphorus loads are 75.6 and 22.0 kg·ha−1, respectively. The analysis of this surface water body indicates a poor state of water and the risk of failing to meet environmental objectives. Moreover, it constitutes proof of the influence of agriculture. In comparison, the Wąsowska Struga watercourse, which is a left tributary of the Orla River and is not included in this study, may also fail to meet environmental objectives. However, the factor affecting this watercourse has not been identified and the loading of soil with mineral fertilizers amounts to 44.3 N·ha−1 and 11.7 kg P·ha−1 [52].
Studies conducted in 2010 at the Orla Wąsosz point revealed the presence of highly contaminated sediments. The main problem during this period was caused by polycyclic aromatic hydrocarbons [53]. In 2016, the sediments were assigned to the lowest, class IV (highly contaminated sediments according to MacDonald et al. [54]), Interim Guidance [55], primarily due to Ba, Cr, as well as Fe and Mn content.
The weakest negative correlations were observed in the case of the pH value and the area covered by livestock buildings in both buffers. The water pH value was lower in areas with more buildings, especially in the 1 km buffer (correlation coefficient equal to −0.747, Table S2). A strong positive correlation was found for organic nitrogen, total nitrogen, ammonium nitrogen, soluble reactive phosphates and total phosphorus. It indicates that the abundance of farm buildings correlates with the increasing river water trophic levels.
The presence of phosphorus in soil gives grounds to conclude that there is a negative correlation between conductivity and calcium concentration. The relation between the P level in soil and water was rather weak and negative. The potassium level in the soil surrounding watercourses exhibited a positive correlation with nitrates.
The strongest negative correlations for the 1 km buffer were observed in the case of dissolved oxygen during winter, pH value in spring, autumn and winter and temperature in spring (Table S3). A very strong positive correlation was found for different forms of phosphorus and nitrogen in samples collected in autumn and winter. This could be related to weather conditions and the lack of fully-grown cultivated plants in the fields.
The strongest negative correlations for the 3 km buffer concerned pH values (in spring and winter), while significant positive correlations were observed in the case of organic, ammonium and total nitrogen, phosphates and total phosphorus, mostly in autumn and, to some extent, in winter, similarly as in the 1 km buffer (Table S4). This might be related to the lack of fully-grown cultivated plants in the fields, which creates a certain type of vegetation barrier to surface runoff and subsurface flow containing trophic elements, such as N and P.
3.3. Analyses of Physicochemical Parameters of Water Quality
The results of canonical variate analysis based on the comparison of selected physicochemical water quality parameters according to different monitoring points were depicted in Table 4. Taking into account different locations, it was found that the results obtained for points O3, O4, O5, and R were different from those for O8, O9, O10, O11, and SZ. This is further confirmed by the Mahalanobis distance [56]. Distances between some points were significant: between O11 and O3—16.54; between O5 and O11—15.0; and between R and O11—14.66, indicating variability of these points. It is associated mostly with the changes in ALK, which differ from other parameters (the value of the first is 22.8 and the second is 11.9). A particularly high ALK level was recorded for the point located on the Radęca River (R). The difference between the values of this parameter in relation to the other points analyzed in this paper was 130.1 (Table S5). The upper part of the Orla River catchment is more and more affected by agriculture and sewage management. In many points (e.g., O2, O3, R), direct discharges of domestic wastewater were observed during all periods under study. The issue concerning the regulation of sewage management in rural areas in Poland is yet to be resolved fully. The high alkalinity of water in the point on the Radęca River (R) may result from the presence of farms, mainly mink ones, located by the source section of this river. The watercourses flowing past the farms collect pollutants, as shown by the site inspection, and fall into the Radęca River. The high alkalinity of the river may be caused by leachates from stored mink excrements, which contain high levels of ammonium nitrogen (ammonium nitrogen constitutes one-third of total nitrogen in the excrements). This parameter is strongly affected by nitrification (i.e., the conversion of NH4 into NO3). The absorption of nitrate ions (NO3) by microorganisms may lead to the alkalinization of the environment [57].
Differences in the concentrations of K, TN, TP, SRP and ammonium nitrogen are also noticeable between monitoring points. Values of these parameters are relatively high in O3, O4, O5 and R compared to O8, O9, O10, O11, and SZ. The high concentrations of these components may be caused by the hydrological drought, which affected the region and nearly entire Poland during the period under study. This directly translated into a lower level of pollutant dilution in small watercourses. Total precipitation recorded by the weather station in Koźmin Wielkopolski was: in 2011—450.7 mm; in 2012—510.6 mm; in 2014—555.4 mm [58]. The highest of total nitrogen concentration in 2012 was found in point R, reaching up to 200 mg·dm3. It was also the place where the highest concentrations of total phosphorus, phosphates and potassium were recorded. High concentrations of total phosphorus in sewage may result from the presence of detergents and cleaning products in domestic wastewater [59,60]. They flow from houses to the Orla River through small streams. As a result of poor dilution rates relative to the affecting factor, concentrations of the substances in small watercourses may have increased. This increase may also have been caused by weather conditions, primarily precipitation. Between 1951 and 2014, the average precipitation in this region amounted to 557.7 mm. Therefore, in 2011, it deviated from the multi-year average.
There are significant differences between the northern and the southern part of the catchment. The southern region is heavily forested with a high share of surface waters (large fishponds). Natura 2000 sites are also located in this area. The watercourses that flow into the Orla River and are located in this area are less affected by rural area activity and, therefore, may have a beneficial effect on the water quality of the main Orla River watercourse, while concentrations of pollutants may decrease due to dilution. Along the administrative border of the voivodeships that divides the catchment area into the southern and northern parts there is also a glaciation border, the so-called Warta Glaciation [61].
The simultaneous analysis of all studied water quality indices shows that some of them, including pH, conductivity, nitrite, and nitrate nitrogen levels, do not affect the variability identified between the sites (Figure 7). Water temperature, dissolved oxygen, ammonium nitrogen, total phosphorus and dissolved phosphates had little impact on the variability. Alkalinity, followed by potassium, calcium, and total nitrogen, had the strongest effect on the variability between the analyzed sites. Their values were high at sites O2, O3, O4 and O5 situated in the upper part of the catchment, as well as at site R (Radęca)—all located in areas dominated by farmland. However, the lowest values of these parameters were observed at sites O8–O11, which were in the middle and lower part of the Orla River catchment, characterized by a small share of agricultural land. A strong positive correlation was found between potassium and calcium concentrations, as well as, to a lesser extent, between ammonium nitrogen, total phosphorus, dissolved phosphates and total nitrogen. In terms of the indices analyzed, site ZS differed from the others to the greatest extent (Figure 7). It is the alkalinity that causes the greatest variability.
The simultaneous analysis of all studied water quality indices shows that some of them, including pH, conductivity and nitrite nitrogen level, do not cause the variability identified between the sites. Water temperature, nitrate nitrogen and dissolved oxygen concentration had little impact on site variability. Alkalinity and concentrations of potassium, calcium and total nitrogen had the strongest effect on the variability between the sites. Their values were high at sites O3, O4, and O5 located in the upper part of the catchment, as well as on site R (Radęca), all of which are located in areas dominated by farmland. However, the lowest values of these parameters were observed at sites O8–O11, which were in the middle and lower part of the Orla River catchment, characterized by a small share of agricultural land.
The statistical analysis by year reveals that alkalinity is not correlated with the years studied. Average values for this parameter were observed throughout the study period, possibly indicating a factor that may constantly affect the parameter. This means that this factor cannot include factors associated with, for example, crop production, which is characterized by a certain seasonality. These factors are probably beyond the control of environmental quality monitoring authorities in Poland or their control is insufficient. The highest TN, SRP, TP, and Ammo values were observed in 2012 (Figure 8 and Table S6).
As in the case of the variability between sites, the variability between the studied years was not affected by pH, conductivity, nitrate nitrogen concentrations and, in addition, oxygen content. Calcium concentrations had some impact on the variability between the years, they were at their highest in 2014. Potassium and total nitrogen, elevated compared to the others in 2012, also affected the variability to some extent. Alkalinity affected the variability the most.
When analyzing all of the parameters studied, the most significant variation was observed between seasons of the year (Table S7). The first axis of variability accounted for 81.4% of the variation, with a significant difference being found between the values of the studied indices in summer and winter (Figure 9). Winter had high Ca levels, while high alkalinity and a higher temperature were observed in summer.
The highest phosphorus levels (both total phosphorus and dissolved phosphates) were found at sites R, O3, O4, and O5 (i.e., on the upper course of the river (Figure 10)). These sites, including site ZS, had elevated levels of total nitrogen and ammonium nitrogen. All sites were located in areas with a predominance of arable land in the land use structure. The lowest nutrient levels were found at sites O10 and O11, which close the catchment and are located in forest land.
By comparing the levels of different forms of nitrogen and phosphorus between the seasons, elevated levels of phosphate (SRP) and total phosphorus (TP) were observed in summer while the lowest levels were found in winter (Figure 11). This relationship was very strong accounted for 76.9% of the variation. Winters had the highest nitrate levels in the watercourses studied in this paper. No significant relationships were found between spring and autumn.
Given the variation among the studied years, it was observed that nutrient levels were the highest in 2012, especially for total nitrogen and ammonium nitrogen (Figure 12). The lowest levels of the studied trophic indices were observed in 2014, in which the highest total precipitation in the studied years was also observed (555.4 mm).
When analysing other water quality indices (physical: temperature, pH, conductivity, dissolved oxygen, chemical: potassium and calcium), the share of alkalinity in the total variability was particularly high, with the highest level of this index being observed at sites R and O3 (Figure 13). The lower section of the Orla River (sites O8–O11) was characterised by low calcium and potassium concentrations and low alkalinity levels. Parameters such as pH, conductivity, and dissolved oxygen concentration showed minimal variation between the study sites.
In relation to the seasons, water quality indices such as dissolved oxygen, pH and conductivity showed no variability, as opposed to alkalinity (highest in summer), calcium concentrations (high in winter and autumn) and water temperature (higher in summer and spring) (Figure 14).
When analyzing variations in water temperature, alkalinity, pH, conductivity, potassium and calcium concentrations between the studied years, it was observed that a high variability was generated by alkalinity, which was the lowest in 2011 (Figure 15).
4. Discussion
The intensification of agricultural production is causing great environmental damage worldwide. Based on these studies, it is clear that the location of industrial animal farms in the catchment area can have an enormous impact on modifying the quality parameters of surface waters. The changes in the flow volume recorded in Poland [62], including particularly periodic flow deficits, are of great importance for the chemical and biological processes occurring in the watercourses. The study by Viza et al. [63] indicates a phenomenon of inhibited decomposition of organic matter, while strong pressure from agricultural areas combined with nutrient input counteracts this process. Oxygen concentrations and pH values are not unaffected. In the analyzed catchment, both pH and dissolved oxygen did not show much variability between the years, seasons and control points. The pH level was within the normal range, while almost all recorded values for dissolved oxygen were out of class. This is confirmed by the study by Viza et al. [63] and is also indicative of the uniform long-term pressure exerted by farming on the tributaries and the main watercourse of the Orla River.
Research conducted in Lithuania on industrial farms specializing in pig and cattle breeding indicates that both types of specialization are burdensome for water quality when paired with intensive production. However, despite similar stocking density and the amount of nitrogen from manures per hectare of farmland, pig farming was more burdensome to the water environment than cattle rearing. As farm livestock increased, which was also associated with the production of manures, pH levels decreased in surface waters whereas suspended solids, nitrate and SRP increased in surface waters [64]. As for the research in the Orla River catchment, pH did not exceed permitted standards, while high concentrations of nitrates (up to 5.48 mg N-NO3·L−1—a three-year average for point O1) and SRP (up to 7.33 mg PO4·L−1—a three-year average for point ZS) were recorded.
On the other hand, the study conducted in Vietnam in large animal farms (pigs, poultry, cattle), points to the generation of sewage in such farms that is highly polluted by organic matter (expressed as BOD5 and COD) and especially by microorganisms (expressed as total coli-CF) [65]. This kind of sewage ends up as leachate in surface water and groundwater near the farms, affecting water quality. According to the authors of [65], as many as 70% of groundwater samples did not meet the accepted standards. Areas around poultry farms were in the worst situation.
The study conducted on animal farms (cattle, pigs, poultry, sheep) in the Yangtze River Delta reveals that the pollutant load from livestock farming (N-NH3, TP and TN) is about twice the average level for the whole of China [66]. The amount of pollution produced from animal husbandry was similar to that produced in industry. Pigs and poultry produced the most pollutants, followed by cattle and sheep. Pigs and poultry produced about 90% of all pollutants from animal husbandry.
The study conducted in an agricultural catchment by Huttunen et al. [67] indicates that by the end of the 21st century, the agricultural TP load in the Aura River catchment (Finland) may increase by 18% relative to the current phosphorus load, while the TN load may decrease by 9%. To this end, the application of good agricultural practices during soil fertilization process can help reduce the load on watercourses from agricultural TP and TN inflows. As some authors have shown, there is another risk associated with the presence of phosphorus in the form of phosphate ions. With high phosphate concentrations in the waters of lowland rivers with an increased proportion of arable, livestock, and mixed land, much of it is absorbed by the bottom sediments. Releasing takes place at low phosphate concentrations. This concerns British rivers [68]. In the present study, the highest concentrations of both total phosphorus and phosphate were observed in points in areas with a predominant amount of arable land. The lowest levels of nutrients were found in sites located in areas with a high proportion of forest land.
Studies conducted in Ankara Province in 2017–2019 reveal that the exceedances of parameters, such as total dissolved solids (TDS), pH, calcium, sodium, magnesium, sulphate and boron, in waters used as drinking water affect up to 7.5% of samples at most [69]. Water quality was assessed in the light of manure management practices. The stocking density in the Ankara Province is not high, averaging 0.25 LSU·ha−1 UAA. Although the number of contaminated samples was not large manure storage sites are recommended to be monitored, especially in districts with a higher stocking density, to minimize the negative impact of livestock production on water resources and to prevent water pollution. The Orla River catchment is monitored as part of national monitoring and as part of implementing the recommendations of the EU Nitrates Directive [10]. The Orla River was classified as a nitrate sensitive area (NSA), while the catchment was designated as a nitrate vulnerable zone (NVZ) [35,70].
According to EUROSTAT data, a quarter (24.5%) of all farms in the EU in 2016 were specialist livestock farms and just over half (52.9%) were specialist crop farms. The stocking density is an indicator of the environmental pressure of livestock farming [71]. The mean livestock density in some European countries ranges from 0.2 (Bulgaria) to 3.8 LSU·ha−1 UAA (Netherlands)—average in the EU 0.8 LU·ha−1 UAA [72]. The average amount of N in animal manure range from 100 to 300 kg·ha−1 of agricultural land [73].
Nine objectives for the future CAP were proposed, which highlight the key role of farms and farmers in meeting the challenges associated with climate change, creating vibrant rural areas, preserving rural landscapes, environmental care, and protecting food and health quality [74,75,76,77].
Scientific and practical issues related to water quality changes in agricultural landscape is a worldwide problem. The impact of intensified agriculture on freshwater was studied in many countries from different continents. Interesting results were obtained in Brasil [78] were similar water quality parameters in Córrego da Olaria Basin were studied (total phosphorus, nitrate, ammonium) and water quality of river was correlated with the land use. Ohter studies in Jaboatão River (Brasil) were focused on differences between selected water quality parameters between summer and winter periods [79]. It was found that during summer, that parameters describing water trophy (total phosphorus, nitrate) had mostly higher values in comparison to winter.
Studies by some authors show that rainwater in intensively farmed areas may pose a serious threat to groundwater and underground water and, consequently, to surface water as well. Rainwater from livestock farm yards may discharge large quantities of organic compounds. Chemical oxygen demand (COD) values in precipitation wastewater from a farm may even reach 221.54 g O2·m−3. Significant phosphate levels may also be present in rainwater runoff. Their average levels in precipitation wastewater may even reach 9.53 g PO4·m−3. Surface waters receiving rainwater runoff from farm yards are characterized by increased COD values [80].
Alkalinity was one of the parameters affecting variation. This parameter is a property of water that depends on the presence of certain chemicals such as hydrogencarbonates, carbonates and hydroxides. Alkalinity is the ability to buffer and neutralise acids and alkalis in water bodies and, thus, to maintains fairly stable pH levels. Highly alkaline water is less subject to pH changes when, for example, acidic liquid (acid rain, leachate from silage piles, atmospheric deposition of sulphur compounds and nitrogen compounds in the form of oxides) is introduced into surface water. According to some authors, domestic wastewater and agricultural wastewater are alkaline in nature due to the presence of ammonium compounds, while industrial wastewater can have a different pH [81]. Due to the nature of the Orla River catchment, a high volume of agricultural wastewater may affect alkalinity formation.
In the study conducted by Krasowska [82], there was intensive leaching and elevated nutrient levels on a watercourse in the agricultural landscape in northeastern Poland during high water levels caused by snowmelt and rainfall in winter and early spring. Therefore, this period may have a decisive impact on surface water quality in the agricultural landscape. As in Krasowska’s [82] study, seasonal variation was also observed for some parameters in the present study. In winter, there were high Ca levels but low PO4 levels. In contrast, the highest NO3 levels were observed in March during higher runoff values caused by heavy rainfall, as this was the case in this study. According to Krasowska, factors such as the volume of precipitation, water level, runoff and the inflow of deep circulating waters affected the concentrations of the above-mentioned parameters.
When studying water quality indices in South Africa, Walsh and Wepener [83] pointed to agricultural production as a factor modifying surface water quality. In intensive agriculture areas, river waters were in poor to moderate water quality classes. Skinner et al. [84] as well as Walsh and Wepener [83] highlighted the potential for increased nutrient runoff from modern agriculture and deterioration of water quality in contact with farmland. The Orla River and its tributaries are subject to significant agricultural pressure from both plant and livestock production. The catchment area is one of the most intensive agricultural regions in Poland.
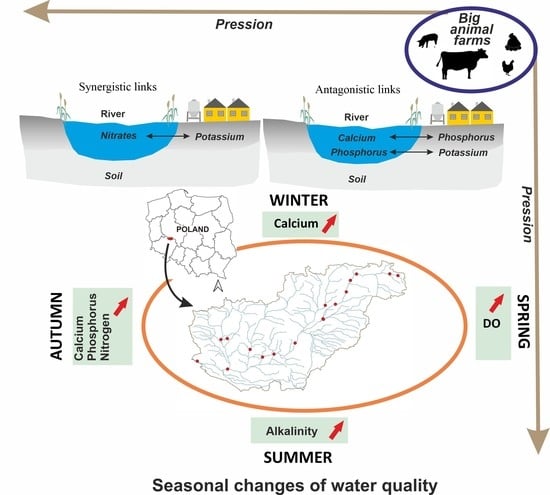
The quality of surface water is often modified by the condition of soil such as its richness, agronomic category, but also the way it is used or fertilized. It is a process caused by phenomena such as erosion, surface runoff, and eluviation [85,86,87,88]. As regards the relationship between phosphorus and potassium levels in soils in the analyzed catchment area, the calculated correlations highlighted some antagonistic and synergistic links between some water parameters. Antagonistic links can be seen between calcium in water and phosphorus in soil and between potassium in soil and phosphorus in water, while synergistic links can be seen between potassium in soil and nitrates.
Lei et al. [89,90] found that agricultural land can significantly affect water quality due to presence of erosion, but that simple shape patches of arable field can play important role in limitation of erosion and thus help in maintaining of water quality. Most of the authors emphasized the role of environmental laws and land planning in rural landscape in limitation of river water deterioration worldwide.
Studies by some authors indicate that proper catchment management contributes to water conservation and enables a multi-directional use of river valleys [91]. Changes towards uncontrolled urbanization may significantly increase the intensity of threats such as soil erosion, resulting in deterioration of river water quality and habitat fragmentation [92]. This study highlights the link between the area of buildings and livestock production. The area of livestock buildings reveals an increase in the intensity of livestock production. On the one hand, fertilization using manure increases in the immediate vicinity of such buildings. On the other hand, livestock buildings emit an enormous number of pollutants, such as dust, which increase the proportion of phosphorus and potassium in surface waters but also nitrogen compounds (e.g., ammonium, nitrogen oxides) that, when deposited in the immediate vicinity of the source, lead to habitat over-fertilization and water pollution. The study conducted in the Orla River catchment reveals high values of the parameters in the tributaries, where a higher share of livestock buildings was observed.
Rosso and Cirelli [93] investigated watercourses located in Rio de la Plata Grasslands (Argentina), which were dominated by arable land in the catchment or by intensive livestock production. They found a potential effect of arable land on lowering the pH value and on increasing nitrate nitrogen levels in water and total phosphorus levels. Areas with intensive livestock production were associated with higher conductivity. Ritter [94] and Foy and O’Connor [95] argue that point sources of pollution in agricultural areas affect groundwater and surface water quality in their immediate surroundings. The Orla River catchment is currently under increasing pressure from livestock production. In addition to individual farms with intensive agriculture, there are many large industrial animal farms in the catchment area. In 2010–2020, Koźmin Wielkopolski, one of 22 communes in the Orla River catchment, implemented 85 investment projects related to large-scale livestock production. The Radęca River analyzed in this paper has its source in this commune.
5. Conclusions
Based on these studies, it can be concluded that industrial livestock production is a serious problem in river catchments. Knowing the area of livestock buildings, it is possible to identify the scale of the threat to surface waters. The results show that this type of threat cannot be assessed only in the catchment or micro-catchment scale, due to the volatile pollutants also emitted by animal production, which can spread in different directions, regardless of the hydrographic division and the catchment boundaries. A good method is therefore to designate buffers around research points.
Results of statistical analysis showed that in the agricultural watershed, the alkalinity was not correlated with the studied years, and values similar to the mean were observed throughout the whole studies. It may indicate the presence of an additional factor that constantly affects this water quality parameter. Therefore, it was found that factors associated with, for example, crop production which have a certain seasonality were not a source of this phenomenon. These factors are probably not controlled by environmental quality monitoring system in Poland or their control is insufficient. The highest concentrations of TN, SRP, TP, and Ammo were observed in 2012 with the presence of seasonal variability. In the winter period the studied area showed the highest concentrations of nitrate nitrogen, while in summer, this was the case for phosphates and total phosphorus.
The highest concentrations of nutrients in the Orla River and its tributaries occurred in 2012, particularly in terms of total nitrogen and ammonium nitrogen, whilst in 2014, the lowest levels of the trophic parameters were observed in river waters. Comparisons of results between seasons showed lack of variability in case of dissolved oxygen, pH reaction, and conductivity. In contrary, alkalinity (highest in summer) and calcium levels (high in winter and autumn) showed differences between warm and cold periods of year. Additionally, alkalinity had high variations between years and most visible discrepancy was observed for the year 2011.
A negative correlation was observed between the area covered by livestock buildings and pH reaction of water. As the area of the buildings increased, the pH of the water decreased in both the 1 km and 3 km buffers. An opposite correlation was observed for dissolved oxygen in 1 km buffer zone. A positive correlation was observed in case of parameters such as ammonium nitrogen, organic nitrogen, and total nitrogen in the 1 km buffer. In contrast, there was a positive correlation between organic nitrogen, total nitrogen, potassium, and dissolved oxygen in the 3 km buffer.
The results of the studies exposed a seasonal variation between buildings area and pH reaction. There was a negative correlation between these parameters in winter and spring in both the 1 km and 3 km buffers. Dissolved oxygen levels were the lowest in winter in the 1 km buffer. There were positive correlations in spring between building area and conductivity, especially in the 3 km buffer. In autumn, phosphorus and nitrogen compounds were highly correlated with the area of livestock buildings in both the 1 km and 3 km buffers. In the 3 km buffer zone, this was also the case for calcium. In winter, higher levels were mainly associated with nitrogen compounds in both surveyed buffers.
Statistical analyses indicated some antagonistic and synergistic links between certain water parameters and the abundance of phosphorus and potassium in soil. Antagonistic links can be seen between calcium in water and phosphorus in soil and between potassium in soil and phosphorus in water, while synergistic links can be seen between potassium in soil and nitrates. Such interactions may be intensified by increased fertilization with organic manure and the negative impact of livestock production on pH both in soil and water.
Supplementary Materials
The following supporting information can be downloaded at: https://www.mdpi.com/article/10.3390/w14152287/s1, Figure S1: Flows from the multiannual period of 1981–2010 (1) and specific flows in moderately dry years (2) at the Korzeńsko gauge cross-section; Table S1: Selected pollutant loads carried with the discharge of treated water from treatment plants located in the Orla River catchment; Table S2: Correlation coefficients of the studied physicochemical parameters and the area of livestock buildings in selected buffers; Table S3: Correlation coefficients of the studied physicochemical parameters during seasons and the area of livestock buildings within the 1 km buffer; Table S4: Correlation coefficients of the studied physicochemical parameters during seasons and the area of livestock buildings within the 3 km buffer; Table S5: Mahalanobis distances between monitoring points; Table S6: Differences in physicochemical parameters between the mean value of the studied year and the general mean; Table S7: Differences in physicochemical parameters between the mean value for the season of the year and the overall mean.
Author Contributions
Conceptualization, J.M.K.; methodology, J.M.K.; software, J.M.K.; validation, J.M.K. and R.S.; formal analysis, J.M.K., R.S. and D.K.; investigation, J.M.K.; resources, J.M.K.; data curation, J.M.K., R.S., and D.K.; writing—original draft preparation, J.M.K. and R.S.; writing—review and editing, J.M.K. and R.S.; visualization, J.M.K. and D.K.; supervision, J.M.K.; project administration, J.M.K.; funding acquisition, J.M.K. All authors have read and agreed to the published version of the manuscript.
Funding
This research was co-funded by the Polish Ministry of Science and Higher Education, 506.868.06.00/UPP. The publication was financed within the framework of the Ministry of Science and Higher Education program as Regional Initiative Excellence in from 2019 to 2022, Project No. 005/RID/2018/19.
Institutional Review Board Statement
Not applicable.
Informed Consent Statement
Not applicable.
Data Availability Statement
The data that support the findings of this study are available from the corresponding author upon reasonable request.
Acknowledgments
We want to thank Barbara Andrzejewska for her help with laboratory analysis of the water samples from the Orla River.
Conflicts of Interest
The authors declare no conflict of interest.
References
- Martin-Ortega, J.; Ferrier, R.C.; Gordon, I.J.; Khan, S. Water Ecosystem Services: A Global Perspective. International Hydrology Series; UNESCO: Paris, France; Cambridge University Press: Cambridge, UK, 2015; ISBN 9789231000683/9781107100374. [Google Scholar]
- Vári, Á.; Podschun, S.A.; Erős, T.; Hein, T.; Pataki, B.; Ioja, I.; Adamescu, C.M.; Gerhardt, A.; Gruber, T.; Dedić, A.; et al. Freshwater systems and ecosystem services: Challenges and chances for cross-fertilization of disciplines. Ambio 2021, 51, 135–151. [Google Scholar] [CrossRef] [PubMed]
- Walker, M.; Gibbard, P.; Lowe, J. Comment on “When did the Anthropocene begin? A mid-twentieth century boundary is stratigraphically optimal” by Jan Zalasiewicz et al. (2015). Quat Int. 2015, 383, 204–207. [Google Scholar] [CrossRef]
- Manuel-Navarrete, D.; Morehart, C.; Tellman, B.; Eakin, H.; Siqueiros-García, J.M.; Hernández Aguilar, B. Intentional disruption of path-dependencies in the Anthropocene: Gray versus green water infrastructure regimes in Mexico City, Mexico. Anthropocene 2019, 26, 100209. [Google Scholar] [CrossRef]
- IPCC. Managing the Risks of Extreme Events and Disasters to Advance Climate Change Adaptation. A Special Report of Working Groups I and II of the Intergovernmental Panel on Climate Change; Field, C.B., Barros, V., Stocker, T.F., Qin, D., Dokken, D.J., Ebi, K.L., Mastrandrea, M.D., Mach, K.J., Plattner, G.-K., Allen, S.K., et al., Eds.; Cambridge University Press: Cambridge, UK; New York, NY, USA, 2012; p. 582. [Google Scholar]
- IEMed. Socioeconomic Impacts of Climate Change in the Mediterranean; Policy Study; Apprioual, A., Ibáñez, M., Eds.; European Institute of the Mediterranean: Barcelona, Spain, 2021; Volume 6, p. 61. Available online: https://www.iemed.org/wp-content/uploads/2021/11/Policy-Study-6-PRIMA_IEMed.pdf (accessed on 1 January 2022).
- NRDC Report. CAFOS: What We Don’t Know Is Hurting US; Environmental Law and Policy Clinic, Yale Environmental Protection Clinic: 2019. Available online: https://www.nrdc.org/sites/default/files/cafos-dont-know-hurting-us-report.pdf (accessed on 5 January 2022).
- GUS. Statistical Yearbook of Agriculture; Statistics Poland (Zakład Wydawnictw Statystycznych): Warszawa, Poland, 2020; Volume 447. [Google Scholar]
- GUS. International Statistics Yearbook; Statistics Poland (Zakład Wydawnictw Statystycznych): Warszawa, Poland, 2018; Volume 133. [Google Scholar]
- Council of the European Union. Council Directive 91/676/EEC of 12 December 1991 concerning the protection of waters against pollution caused by nitrates from agricultural sources. Off. J. L 1991, 375, 0001–0008. [Google Scholar]
- Dobkowski, A.; Woliński, J. Urządzenia do przechowywania obornika i gnojówki. Projektowanie i Budowa. Poradnik; IMUZ: Falenty, Poland, 1999; Volume 34, p. 45. [Google Scholar]
- Ali, B.; Shah, G.A.; Traore, B.; Shah, S.A.A.; Shah, S.U.; Al-Solaimani, S.G.M.; Hussain, Q.; Ali, N.; Shahzad, K.; Shahzad, T.; et al. Manure storage operations mitigate nutrient losses and their products can sustain soil fertility and enhance wheat productivity. J. Environ. Manag. 2019, 241, 468–478. [Google Scholar] [CrossRef]
- Kuszelewski, L. Racjonalna gospodarska odchodami zwierzęcymi pod kątem ograniczenia strat azotu. In Rolnictwo Polskie i Ochrona Jakości Wody. Zeszyty Edukacyjne; Sapek, B., Ed.; IMUZ: Falenty, Poland, 1997; pp. 17–29. [Google Scholar]
- Kupiec, J.M.; Bednarek, A.; Szklarek, S. Raport końcowy. In Projekt Finansowany z Europejskiego Funduszu Rozwoju Regionalnego w Ramach Wielkopolskiego Regionalnego Programu Operacyjnego na Lata 2014–2020, osi priorytetowej 1. Innowacyjna i Konkurencyjna Gospodarka, Działania 1.2 Wzmocnienie Potencjału Innowacyjnego Przedsiębiorstw Wielkopolski, pt. “Rozwój i Optymalizacja Innowacyjnej Metody Redukcji Istotnych Zanieczyszczeń Punktowych Rozproszonych Oraz Obszarowych na Terenach Wiejskich” (No: RPWP.01.02.00-30-0010/17-00). 2018–2019; Mikronatura Środowisko Spółka Z Ograniczoną Odpowiedzialnością: Poznan, Poland, 2020; p. 160. [Google Scholar]
- Kupiec, J.M. Identification of potential hazardous farms in nitrate vulnerable water catchments based on the rapid identifi-cation system. Pol. J. Environ. Stud. 2019, 28, 1233–1240. [Google Scholar] [CrossRef]
- McDowell, R.; Sharpley, A. Phosphorus Transport in Overland Flow in Response to Position of Manure Application. J. Environ. Qual. 2002, 31, 217–227. [Google Scholar] [CrossRef]
- Burzyńska, I. Monitoring of selected fertilizer nutrients in surface waters and soils of agricultural land in the river valley in Central Poland. J. Water Land Dev. 2019, 43, 41–48. [Google Scholar] [CrossRef] [Green Version]
- Mekonnen, M.M.; Hoekstra, A.Y. A Global Assessment of the Water Footprint of Farm Animal Products. Ecosystems 2012, 15, 401–415. [Google Scholar] [CrossRef] [Green Version]
- Dymaczewski, Z.; Sozański, M. Wodociągi I Kanalizacja W Polsce: Tradycja I Współczesność; Polska Fundacja Ochrony Zasobów Wodnych: Poznań-Bydgoszcz, Poland, 2002; pp. 935–952. [Google Scholar]
- Goutry, P.; Zajkowski, J.; Wierzbicki, K. Czy można taniej oczyszczać ścieki na obszarach wiejskich? Wiadomości Melioracyjne i Łąkarskie 2009, 3, 132–135. [Google Scholar]
- Kupiec, J.M.; Oliskiewicz-Krzywicka, A.; Stachowski, P. Ocena wybranych elementów gospodarki wodno-ściekowej i obciążenia użytków rolnych makroelementami ze ścieków bytowych w wybranych gospodarstwach Wielkopolski. Annu. Set Environ. Prot. 2015, 17, 1017–1033. [Google Scholar]
- Wierzbicki, K.; Gromada, O. Związek między klasą wsi i jej infrastrukturą kanalizacyjną. Wiadomości Melioracyjne i Łąkarskie 2000, 2, 79–83. [Google Scholar]
- Kaca, E. Infrastruktura wodno-ściekowa na wsi na przełomie wieków. In Problemy Inżynierii Rolniczej; IBMER: Warszawa, Poland, 2007; Volume 1, pp. 42–44. [Google Scholar]
- GUS. Statistical Yearbook of Forestry; Statistics Poland (Zakład Wydawnictw Statystycznych): Warszawa, Poland, 2020; Volume 368. [Google Scholar]
- Forest Europe. State of Europe’s Forests; UNECE, FAO UN: Liaison Unit Bratislava, Slovak Republic, 2020; Volume 394. [Google Scholar]
- Available online: http://www.barycz.pl/ (accessed on 30 November 2018).
- Council of Ministers. Urzędowa Tabela Klas Gruntów. Rozporządzenie z Dnia 12 Września 2012 r. w Sprawie Gleboznawczej Klasyfikacji Gruntów (Dz.U. 2012 poz. 1246). 2012. Available online: https://isap.sejm.gov.pl/isap.nsf/DocDetails.xsp?id=wdu20120001246 (accessed on 30 October 2021).
- Kupiec, J.M.; Staniszewski, R.; Jusik, S. Assessment of the impact of land use in an agricultural catchment area on water quality of lowland rivers. PeerJ 2021, 9, e10564. [Google Scholar] [CrossRef]
- Hach Company. DR/890 Colorimeter Procedures Manual. 2013. Available online: https://www.hach.com›asset-get.download.jsa (accessed on 11 January 2022).
- Dojlido, J.; Dożańska, W.; Hermanowicz, W. Fizyczno-Chemiczne Badanie Wody I Ścieków; Arkady: Warszawa, Poland, 1999; Volume 2, p. 558. [Google Scholar]
- Skoog, D.A.; Holler, F.J.; Stanley, R.; Crouch, S.R. Principles of Instrumental Analysis: An Introduction, 7th ed.; Cengage Learning: Boston, MA, USA, 2021; Volume 961, ISBN 9781305577213. [Google Scholar]
- Kenny, A.D.; Cohn, V.H. Complexometric Titration of Calcium in Presence of Magnesium. Anal. Chem. 1958, 30, 1366–1368. [Google Scholar] [CrossRef]
- Minister of Internal Affairs and Administration. Regulation of November 17, 2011. J. Laws 2011, 279, 1642. (In Polish) [Google Scholar]
- WIOŚ Poznań, OSCHR. Agrochemiczne Badania Gleb Wielkopolski w Latach 2000–2004; Biblioteka Monitoringu Środowiska: Poznań, Poland, 2005; p. 59. [Google Scholar]
- Council of Ministers of Poland. Regulation of the Council of Ministers of 28 December 2017 on the method of establishing and recording the boundaries of river basins, water regions and sub-basins. J. Laws 2017, 2017, 2505. (In Polish) [Google Scholar]
- Lejeune, M.; Caliński, T. Canonical analysis applied to multivariate analysis of variance. J. Multivar. Anal. 2000, 72, 100–119. [Google Scholar] [CrossRef] [Green Version]
- Kayzer, D.; Frankowski, P.; Zbierska, J.; Staniszewski, R. Evaluation of trophic parameters in newly built reservoir using canonical variates analysis. In Proceedings of the XLVIII Seminar of Applied Mathematics, Boguszów-Gorce, Poland, 9–11 September 2018; Volume 23, p. 00019. [Google Scholar] [CrossRef] [Green Version]
- Budka, A.; Borowiak, K.; Kayzer, D.; Hanć, A.; Zbierska, J.; Barałkiewicz, D.; Wolna-Maruwka, A.; Lisiak, M. Nickel and chro-mium concentrations in Italian ryegrass exposed to ambient air in urban, suburban and rural areas. Atmos. Pollut. Res. 2015, 6, 1123–1131. [Google Scholar] [CrossRef]
- Kayzer, D. A Note on testing hypotheses concerning interaction with special reference to a graphical presentation in the space of canonical variates. Biom. Lett. 2019, 56, 89–104. [Google Scholar] [CrossRef] [Green Version]
- Kayzer, D.; Borowiak, K.; Budka, A.; Zbierska, J. Study of interaction in bioindication research on tobacco plant injuries caused by ground level ozone. Environmetrics 2009, 20, 666–675. [Google Scholar] [CrossRef]
- Staniszewski, R.; Frankowski, P.; Kayzer, D.; Zbierska, J.; Achtenberg, K. Reconstruction of ancient lake after peat excavation-a case study about water quality. Appl. Sci. 2021, 11, 4213. [Google Scholar] [CrossRef]
- Czerwińska-Kayzer, D.; Florek, J.; Staniszewski, R.; Kayzer, D. Application of canonical variate analysis to compare different groups of food industry companies in terms of financial liquidity and profitability. Energies 2021, 14, 4701. [Google Scholar] [CrossRef]
- Sajnóg, A.; Koko, E.; Kayzer, D.; Barałkiewicz, D. Chemometric approach to find relationships between physiological elements and elements causing toxic effects in herb roots by ICP-MS. Sci. Rep. 2021, 11, 20683. [Google Scholar] [CrossRef]
- Wolna-Maruwka, A.; Piechota, T.; Niewiadomska, A.; Kamiński, A.; Kayzer, D.; Grzyb, A.; Pilarska, A.A. The effect of biochar-based organic amendments on the structure of soil bacterial community and yield of maize (Zea mays L.). Agronomy 2021, 11, 1286. [Google Scholar] [CrossRef]
- Hobot, A.; Banaszak, K.; Cichy, J.; Darul, J.; Garda, M.; Gurwin, J.; Komosa, M.; Paluszkiewicz, B.; Stachura-Węgierek, A.; Wałęga, A.; et al. Warunki korzystania z wód zlewni Baryczy. Charakterystyka zlewni Baryczy. Lectore Eco-Consulting w Ochronie Środowiska. Praca wykonana na zlecenie Dyrektora Regionalnego Zarządu Gospodarki Wodnej we Wrocławiu w ramach umowy nr ZZ-02/EP224/2012 z dnia 19 07 2012 r. 2012. Available online: https://wroclaw.rzgw.gov.pl/files_mce/Region%20wodny/Planowanie/RDW/Barycz%20Widawa/zadanie_ii_cz_tekstowa.pdf (accessed on 11 January 2022).
- WIOŚ Poznań. 2015. Available online: http://poznan.wios.gov.pl/monitoring-srodowiska/wyniki-badan-i-oceny/monitoring-wod-podziemnych/Sprawozdanie%20za%202015%20wody%20podziemne.pdf (accessed on 5 January 2022).
- WIOŚ Poznań. 2017. Available online: http://poznan.wios.gov.pl/monitoring-srodowiska/wyniki-badan-i-oceny/monitoring-wod-podziemnych/Sprawozdanie%20za%202017%20wody%20podziemne.pdf (accessed on 5 January 2022).
- WIOŚ Poznań. 2018. Available online: http://poznan.wios.gov.pl/monitoring-srodowiska/Monitoring%20wod%20podziemnych/Sprawozdanie%20za%202018%20wody%20podziemne.pdf (accessed on 5 January 2022).
- WIOŚ. Stan Środowiska w Wielkopolsce w Roku 2006; WIOŚ: Poznań, Poland, 2007; p. 84. [Google Scholar]
- Melcer, B.; Olejnik, M. Wpływ Wybranych Czynników Na Zanieczyszczenie Związkami Biogennymi Powierzchniowych Wód Płynących W Zlewni Baryczy; AR: Poznań, Poland, 2006; pp. 59–70. [Google Scholar]
- WIOŚ Wrocław. 2016. Available online: https://www.wroclaw.pios.gov.pl/index.php?dzial=publikacje&pod=opracowania (accessed on 5 January 2022).
- GIOŚ. Ocena Stanu Jednolitych Części Wód Rzek I Zbiorników Zaporowych W Latach 2014-2019 Na Podstawie Monitoring. 2021. Available online: https://www.gios.gov.pl/pl/stan-srodowiska/monitoring-wod (accessed on 11 January 2022).
- PIG PIB. Ocena Stanu Zanieczyszczenia Osadów Dennych Rzek I Jezior W Latach 2010-2015. 2015. Available online: https://www.gios.gov.pl/images/dokumenty/pms/monitoring_wod/osady_ocena_stanu_2010-2015.pdf (accessed on 5 January 2022).
- MacDonald, D.D.; Ingersol, C.G.; Berger, T.A. Development and Evaluation of consensus-based Sediment Development and evaluation of consensus-based sediment quality guidelines for freshwater ecosystems. Arch. Environ. Contam. Toxicol. 2000, 39, 20–31. [Google Scholar] [CrossRef]
- Interim Guidance. Consensus-Based Sediment Quality Guidelines. Recommendations for Use & Application; Wisconsin Department of Natural Resources: Washington, DC, USA, 2003. Available online: http://dnr.wi.gov/org/aw/rr/technical/cbsqg_interim_final.pdf (accessed on 1 November 2021).
- Etherington, T.R. Mahalanobis distances for ecological niche modelling and outlier detection: Implications of sample size, error, and bias for selecting and parameterising a multivariate location and scatter method. PeerJ 2021, 9, e11436. [Google Scholar] [CrossRef]
- Kołwzan, B.; Adamiak, W.; Grabas, K.; Pawełczyk, A. Podstawy Mikrobiologii W Ochronie Środowiska; Oficyna Wydawnicza Politechniki: Wrocławskiej, Poland, 2005; p. 117. ISBN 8370858791. [Google Scholar]
- IMGW PIB. Dane Pomiarowo Obserwacyjne. 2015. Available online: https://dane.imgw.pl (accessed on 11 January 2022).
- Comber, S.; Gardner, M.; Georges, K.; Blackwood, D.J.; Gilmour, D. Domestic source of phosphorus to sewage treatment works. Environ. Technol. 2013, 34, 1349–1358. [Google Scholar] [CrossRef] [Green Version]
- Gomes de Quevedo, C.M.; da Silva Paganini, W. Detergents as a Source of Phosphorus in Sewage: The Current Situation in Brazil. Water Air Soil Pollut. 2016, 227, 14. [Google Scholar] [CrossRef]
- Lindner, L.; Marks, L. Zarys paleogeomorfologii obszaru Polski podczas zlodowaceń skandynawskich. Przegląd Geologiczny 1995, 43, 591–594. [Google Scholar]
- Piniewski, M.; Marcinkowski, P.; Kundzewicz, Z.W. Trend detection in river flow indices in Poland. Acta Geophys. 2018, 66, 347–360. [Google Scholar] [CrossRef] [Green Version]
- Viza, A.; Muñoz, I.; Oliva, F.; Menéndez, M. Contrary effects of flow intermittence and land uses on organic matter decom-position in a Mediterranean river basin. Sci. Total Environ. 2021, 812, 151424. [Google Scholar] [CrossRef] [PubMed]
- Cesoniene, L.; Dapkiene, M.; Sileikiene, D. The impact of livestock farming activity on the quality of surface water. Environ. Sci. Pollut. Res. Int. 2019, 26, 32678–32686. [Google Scholar] [CrossRef] [PubMed]
- Cao, S.T.; Tran, H.P.; Le, H.T.T.; Bui, H.P.K.; Nguyen, G.T.H.; Nguyen, L.T.; Nguyen, B.T.; Luong, A.D. Impacts of effluent from different livestock farm types (pig, cow, and poultry) on surrounding water quality: A comprehensive assessment using in-dividual parameter evaluation method and water quality indices. Environ. Sci. Pollut. Res. Int. 2021, 28, 50302–50315. [Google Scholar] [CrossRef] [PubMed]
- Gu, P.; Shen, R.F.; Chen, Y.D. Diffusion pollution from livestock and poultry rearing in the Yangtze Delta, China. Environ. Sci. Pollut. Res. Int. 2008, 15, 273–277. [Google Scholar] [CrossRef] [PubMed]
- Huttunen, I.; Hyytiäinen, K.; Huttunen, M.; Sihvonen, M.; Veijalainen, N.; Korppoo, M.; Heiskanen, A.-S. Agricultural nutrient loading under alternative climate, societal and manure recycling scenarios. Sci. Total Environ. 2021, 783, 146871. [Google Scholar] [CrossRef] [PubMed]
- Withers, P.J.A.; Neal, C.; Jarvie, H.P.; Doody, D.G. Agriculture and eutrophication: Where do we go from here? Sustainability 2014, 6, 5853–5875. [Google Scholar] [CrossRef] [Green Version]
- Yıldırır, M. Water Quality and Two-Way Effects in Terms of Animal Production. Toprak Su Dergisi Araştırma Makalesi 2020, 9, 122–129. [Google Scholar] [CrossRef]
- Regulation of the Director of the Regional Water Management Authority in Wrocław no. 1/2017 of 1 02 2017 on Identification of Surface and Underground Waters in the Central Odra River Region, Sensitive to Pollution with Nitrogen Compounds from Agricultural Sources and the Nitrate Vulnerable Zone, from which Nitrate Leaching from Agricultural Sources Needs to be Reduced] (Dz. Urz. Woj. Dolnośląskiego of 2017 item 559)(Dz. Urz. Woj. Lubuskiego of 2017 Item 271)(Dz. Urz. Woj. Wielkopolskiego of 2017 Item 1153). 2017. Available online: https://edzienniki.duw.pl/eli/POL_WOJ_DS/2017/559/ogl/pol/pdf (accessed on 1 November 2021). (In Polish).
- Eurostat. Agriculture, Forestry and Fishery Statistics. 2020. Available online: https://ec.europa.eu/eurostat/documents/3217494/12069644/KS-FK-20-001-EN-N.pdf/a7439b01-671b-80ce-85e4-4d803c44340a?t=1608139005821 (accessed on 11 January 2022).
- Eurostat. Agriculture, Forestry and Fishery Statistics. 2019. Available online: https://ec.europa.eu/eurostat/documents/3217494/10317767/KS-FK-19-001-EN-N.pdf/742d3fd2-961e-68c1-47d0-11cf30b11489 (accessed on 11 January 2022).
- Oenema, O. Governmental policies and measures regulating nitrogen and phosphorus from animal manure in European Agriculture. J. Anim. Sci. 2005, 82, 13. [Google Scholar]
- European Commission. Modernising & Simplifyng the CAP. Economic Challenges Facing EU Agriculture. 2017. Available online: https://ec.europa.eu/info/sites/default/files/food-farming-fisheries/key_policies/documents/soc_background_final_en.pdf (accessed on 20 December 2021).
- European Commission. Modernising & Simplifyng the CAP. Climate & Environmental Challenges Facing Agriculture and Rural Areas. 2017. Available online: https://ec.europa.eu/info/sites/info/files/food-farming-fisheries/key_policies/documents/env_background_final_en.pdf (accessed on 20 December 2021).
- European Commission. Modernising & Simplifyng the CAP. Socio-Economic Challenges Facing Agriculture and Rural Areas. 2017. Available online: https://ec.europa.eu/info/sites/info/files/food-farming-fisheries/key_policies/documents/soc_background_final_en.pdf (accessed on 20 December 2021).
- European Commission. The New Common Agricultural Policy: 2023-27. 2022. Available online: https://ec.europa.eu/info/food-farming-fisheries/key-policies/common-agricultural-policy/future-cap_en (accessed on 11 January 2022).
- Simedo, M.B.L.; Martins, A.L.M.; Pissarra, T.C.T.; Lopes, M.C.; Costa, R.C.A.; Valle-Junior, R.F.; Campanelli, L.C.; Rojas, N.E.T.; Finoto, E.L. Effect of watershed land use on water quality: A case study in Córrego da Olaria Basin, São Paulo State, Brazil. Braz. J. Biol. 2018, 78, 625–635. [Google Scholar] [CrossRef] [Green Version]
- Souza, A.D.G.; Tundisi, J.G. Water quality in watershed of the Jaboatão River (Pernambuco, Brazil): A case study. Braz. Arch. Biol. Technol. 2003, 46, 711–721. [Google Scholar] [CrossRef] [Green Version]
- Rossa, L. Zanieczyszczenie wód powierzchniowych I podziemnych przez odpływ ścieków opadowych z ferm chowu bydła. Water-Environ.-Rural Areas. 2012, 12, 119–137. [Google Scholar]
- Ravindra, K.; Kaushik, A.; Meenakshi, A.; Rani, M. Seasonal variations in physico-chemical characteristics of River Yamuna in Haryana and its ecological best-designated use. J. Environ. Monit. 2003, 5, 419–426. [Google Scholar] [CrossRef] [Green Version]
- Krasowska, M. Seasonal changes of the chemical composition of river waters in agricultural catchment. Ecol. Eng. Environ. Technol. 2017, 18, 175–183. [Google Scholar] [CrossRef]
- Walsh, G.; Wepener, V. The influence of land use on water quality and diatom community structures in urban and agricul-turally stressed rivers. Water 2009, 35, 579–594. [Google Scholar] [CrossRef]
- Skinner, J.; Lewis, K.; Bardon, K.; Tucker, P.; Catt, J.; Chambers, B. An overview of the environmental impact of agriculture in the UK. J. Environ. Manag. 1997, 50, 111–128. [Google Scholar] [CrossRef] [Green Version]
- Zalidis, G.; Stamatiadis, S.; Takavakoglou, V.; Eskridge, K.; Misopolinos, N. Impacts of agricultural practices on soil and water quality in the Mediterranean region and proposed assessment methodology. Agric. Ecosyst. Environ. 2002, 88, 137–146. [Google Scholar] [CrossRef]
- Issaka, S.; Ashraf, M.A. Impact of soil erosion and degradation on water quality: A review. Geol. Ecol. Landsc. 2017, 1, 1–11. [Google Scholar] [CrossRef] [Green Version]
- FAO UN. Water Pollution from Agriculture: A Global Review. The Food and Agriculture Organization of the United Nations and the International Water Management Institute on Behalf of the Water Land and Ecosystems Research Program, Rome and Colombo. 2017. Available online: https://www.fao.org/3/i7754e/i7754e.pdf (accessed on 20 December 2021).
- Razali, A.; Syed Ismail, S.N.; Awang, S.; Praveena, S.M.; Abidin, E.Z. Land use change in highland area and its impact on river water quality: A review of case studies in Malaysia. Ecol. Process 2018, 7, 19. [Google Scholar] [CrossRef] [Green Version]
- Lei, C.; Wagner, P.D.; Fohrer, N. Influences of land use changes on the dynamics of water quantity and quality in the German lowland catchment of the Stör. Hydrol. Earth Syst. Sci. 2022, 26, 2561–2582. [Google Scholar] [CrossRef]
- Lei, C.; Wagner, P.D.; Fohrer, N. Effects of land cover, topography, and soil on stream water quality at multiple spatial and seasonal scales in a German lowland catchment. Ecol. Indic. 2021, 120, 106940. [Google Scholar] [CrossRef]
- Hua, A.K. Land use land cover changes in detection of water quality: A study based on remote sensing and multivariate statistics. J. Environ. Public Health 2017, 1, 1–12. [Google Scholar] [CrossRef] [Green Version]
- Hua, A.K. An indication of policy study towards water resources in Malacca state: A case study of Malacca river, Malaysia. Int. J. Soc. Sci. Res. 2015, 4, 15–20. [Google Scholar]
- Rosso, J.J.; Fernandez Cirelli, A. Effects of land use on environmental conditions and macrophytes in prairie lotic ecosystems. Limnologica 2013, 43, 18–26. [Google Scholar] [CrossRef]
- Ritter, W.F. Nonpoints sources pollution and livestock manure management. In Agricultural Nonpoints Sources Pollution; Ritter, W.F., Shirmohammadi, A., Eds.; Lewis Publishing: Boca Raton, FL, USA, 2001; pp. 135–168. [Google Scholar]
- Foy, H.; O’Connor, W.C.K. Managing the effect of agriculture and water quality in Northern Ireland. In Agriculture, Hydrology and Water Quality; Haygarth, P.M., Jarvis, S.C., Eds.; CAB International: Wallingford, Oxfordshire, UK, 2002; pp. 417–440. [Google Scholar]
Figure 1.
Location of the Orla River catchment area in comparison to Poland and neighboring countries.
Figure 1.
Location of the Orla River catchment area in comparison to Poland and neighboring countries.

Figure 2.
Location of the testing points in the Orla River catchment (site codes in Table 1) O1—Orla (Koźminiec), O2—Orla (Wyki), O3—Orla (Staniew), O4—Orla (Skałów), O5—Orla (Unisław), O6—Orla (Kuklinów), O7—Orla (Baszków), O8—Orla (Dubin), O9—Orla (Sowy), O10—Orla (Chodlewo), O11—Orla (Wąsosz), R—Radęca (Wyganów), SZ—Szpatnica (Dębionka), D—Dąbrocznia (Stwolno), M—Masłówka (Żylice), ZP—Żydowski Potok (Baszków).

Figure 3.
Buffers around the control points.

Figure 4.
Share of soils with low and very low contents of P2O5 and K2O in nitrate vulnerable zone of the Orla River catchment [34].
Figure 4.
Share of soils with low and very low contents of P2O5 and K2O in nitrate vulnerable zone of the Orla River catchment [34].

Figure 5.
Monthly flow variability in the Orla River in the multiannual period of 1981–2010 at the Korzeńsko gauge cross-section. (ALD—average discharge from the lowest, LLD—the lowest from lowest discharges).
Figure 5.
Monthly flow variability in the Orla River in the multiannual period of 1981–2010 at the Korzeńsko gauge cross-section. (ALD—average discharge from the lowest, LLD—the lowest from lowest discharges).

Figure 6.
The use structure of catchments located in the studied sites (based on MPHP10k and BDOT10k, site codes are provided in Table 1).
Figure 6.
The use structure of catchments located in the studied sites (based on MPHP10k and BDOT10k, site codes are provided in Table 1).

Figure 7.
Position of monitoring sites determined by physicochemical parameters in the space of the first two canonical varieties and spacing of these parameters in the dual space (trait coordinates rescaled and multiplied by 0.4).
Figure 7.
Position of monitoring sites determined by physicochemical parameters in the space of the first two canonical varieties and spacing of these parameters in the dual space (trait coordinates rescaled and multiplied by 0.4).

Figure 8.
Position of selected years determined by physicochemical parameters in the space of the first two canonical varieties and spacing of these parameters in the dual space (trait coordinates rescaled and divided by 4).
Figure 8.
Position of selected years determined by physicochemical parameters in the space of the first two canonical varieties and spacing of these parameters in the dual space (trait coordinates rescaled and divided by 4).

Figure 9.
Position of measuring series determined by physicochemical parameters in the space of the first two canonical varieties and spacing of these parameters in the dual space (trait coordinates rescaled and multiplied by 0.4).
Figure 9.
Position of measuring series determined by physicochemical parameters in the space of the first two canonical varieties and spacing of these parameters in the dual space (trait coordinates rescaled and multiplied by 0.4).

Figure 10.
Position of monitoring sites determined by trophic parameters in the space of the first two canonical varieties and spacing of these parameters in the dual space (trait coordinates rescaled and divided by five).
Figure 10.
Position of monitoring sites determined by trophic parameters in the space of the first two canonical varieties and spacing of these parameters in the dual space (trait coordinates rescaled and divided by five).

Figure 11.
Position of measuring series determined by trophic parameters in the space of the first two canonical varieties and spacing of these parameters in the dual space (trait coordinates rescaled and multiplied by 0.3).
Figure 11.
Position of measuring series determined by trophic parameters in the space of the first two canonical varieties and spacing of these parameters in the dual space (trait coordinates rescaled and multiplied by 0.3).

Figure 12.
Position of selected years determined by trophic parameters in the space of the first two canonical varieties and spacing of these parameters in the dual space (trait coordinates rescaled and divided by 20).
Figure 12.
Position of selected years determined by trophic parameters in the space of the first two canonical varieties and spacing of these parameters in the dual space (trait coordinates rescaled and divided by 20).

Figure 13.
Position of monitoring sites determined by physicochemical parameters and macroelements in the space of the first two canonical varieties and spacing of these parameters in the dual space (trait coordinates rescaled and multiplied by 0.3).
Figure 13.
Position of monitoring sites determined by physicochemical parameters and macroelements in the space of the first two canonical varieties and spacing of these parameters in the dual space (trait coordinates rescaled and multiplied by 0.3).

Figure 14.
Position of measuring series determined by physicochemical parameters and macroelements in the space of the first two canonical varieties and spacing of these parameters in the dual space (trait coordinates rescaled and multiplied by 0.4).
Figure 14.
Position of measuring series determined by physicochemical parameters and macroelements in the space of the first two canonical varieties and spacing of these parameters in the dual space (trait coordinates rescaled and multiplied by 0.4).

Figure 15.
Position of selected years determined by selected physicochemical parameters and macroelements in the space of the first two canonical varieties and spacing of these parameters in the dual space (trait coordinates rescaled and divided by four).
Figure 15.
Position of selected years determined by selected physicochemical parameters and macroelements in the space of the first two canonical varieties and spacing of these parameters in the dual space (trait coordinates rescaled and divided by four).


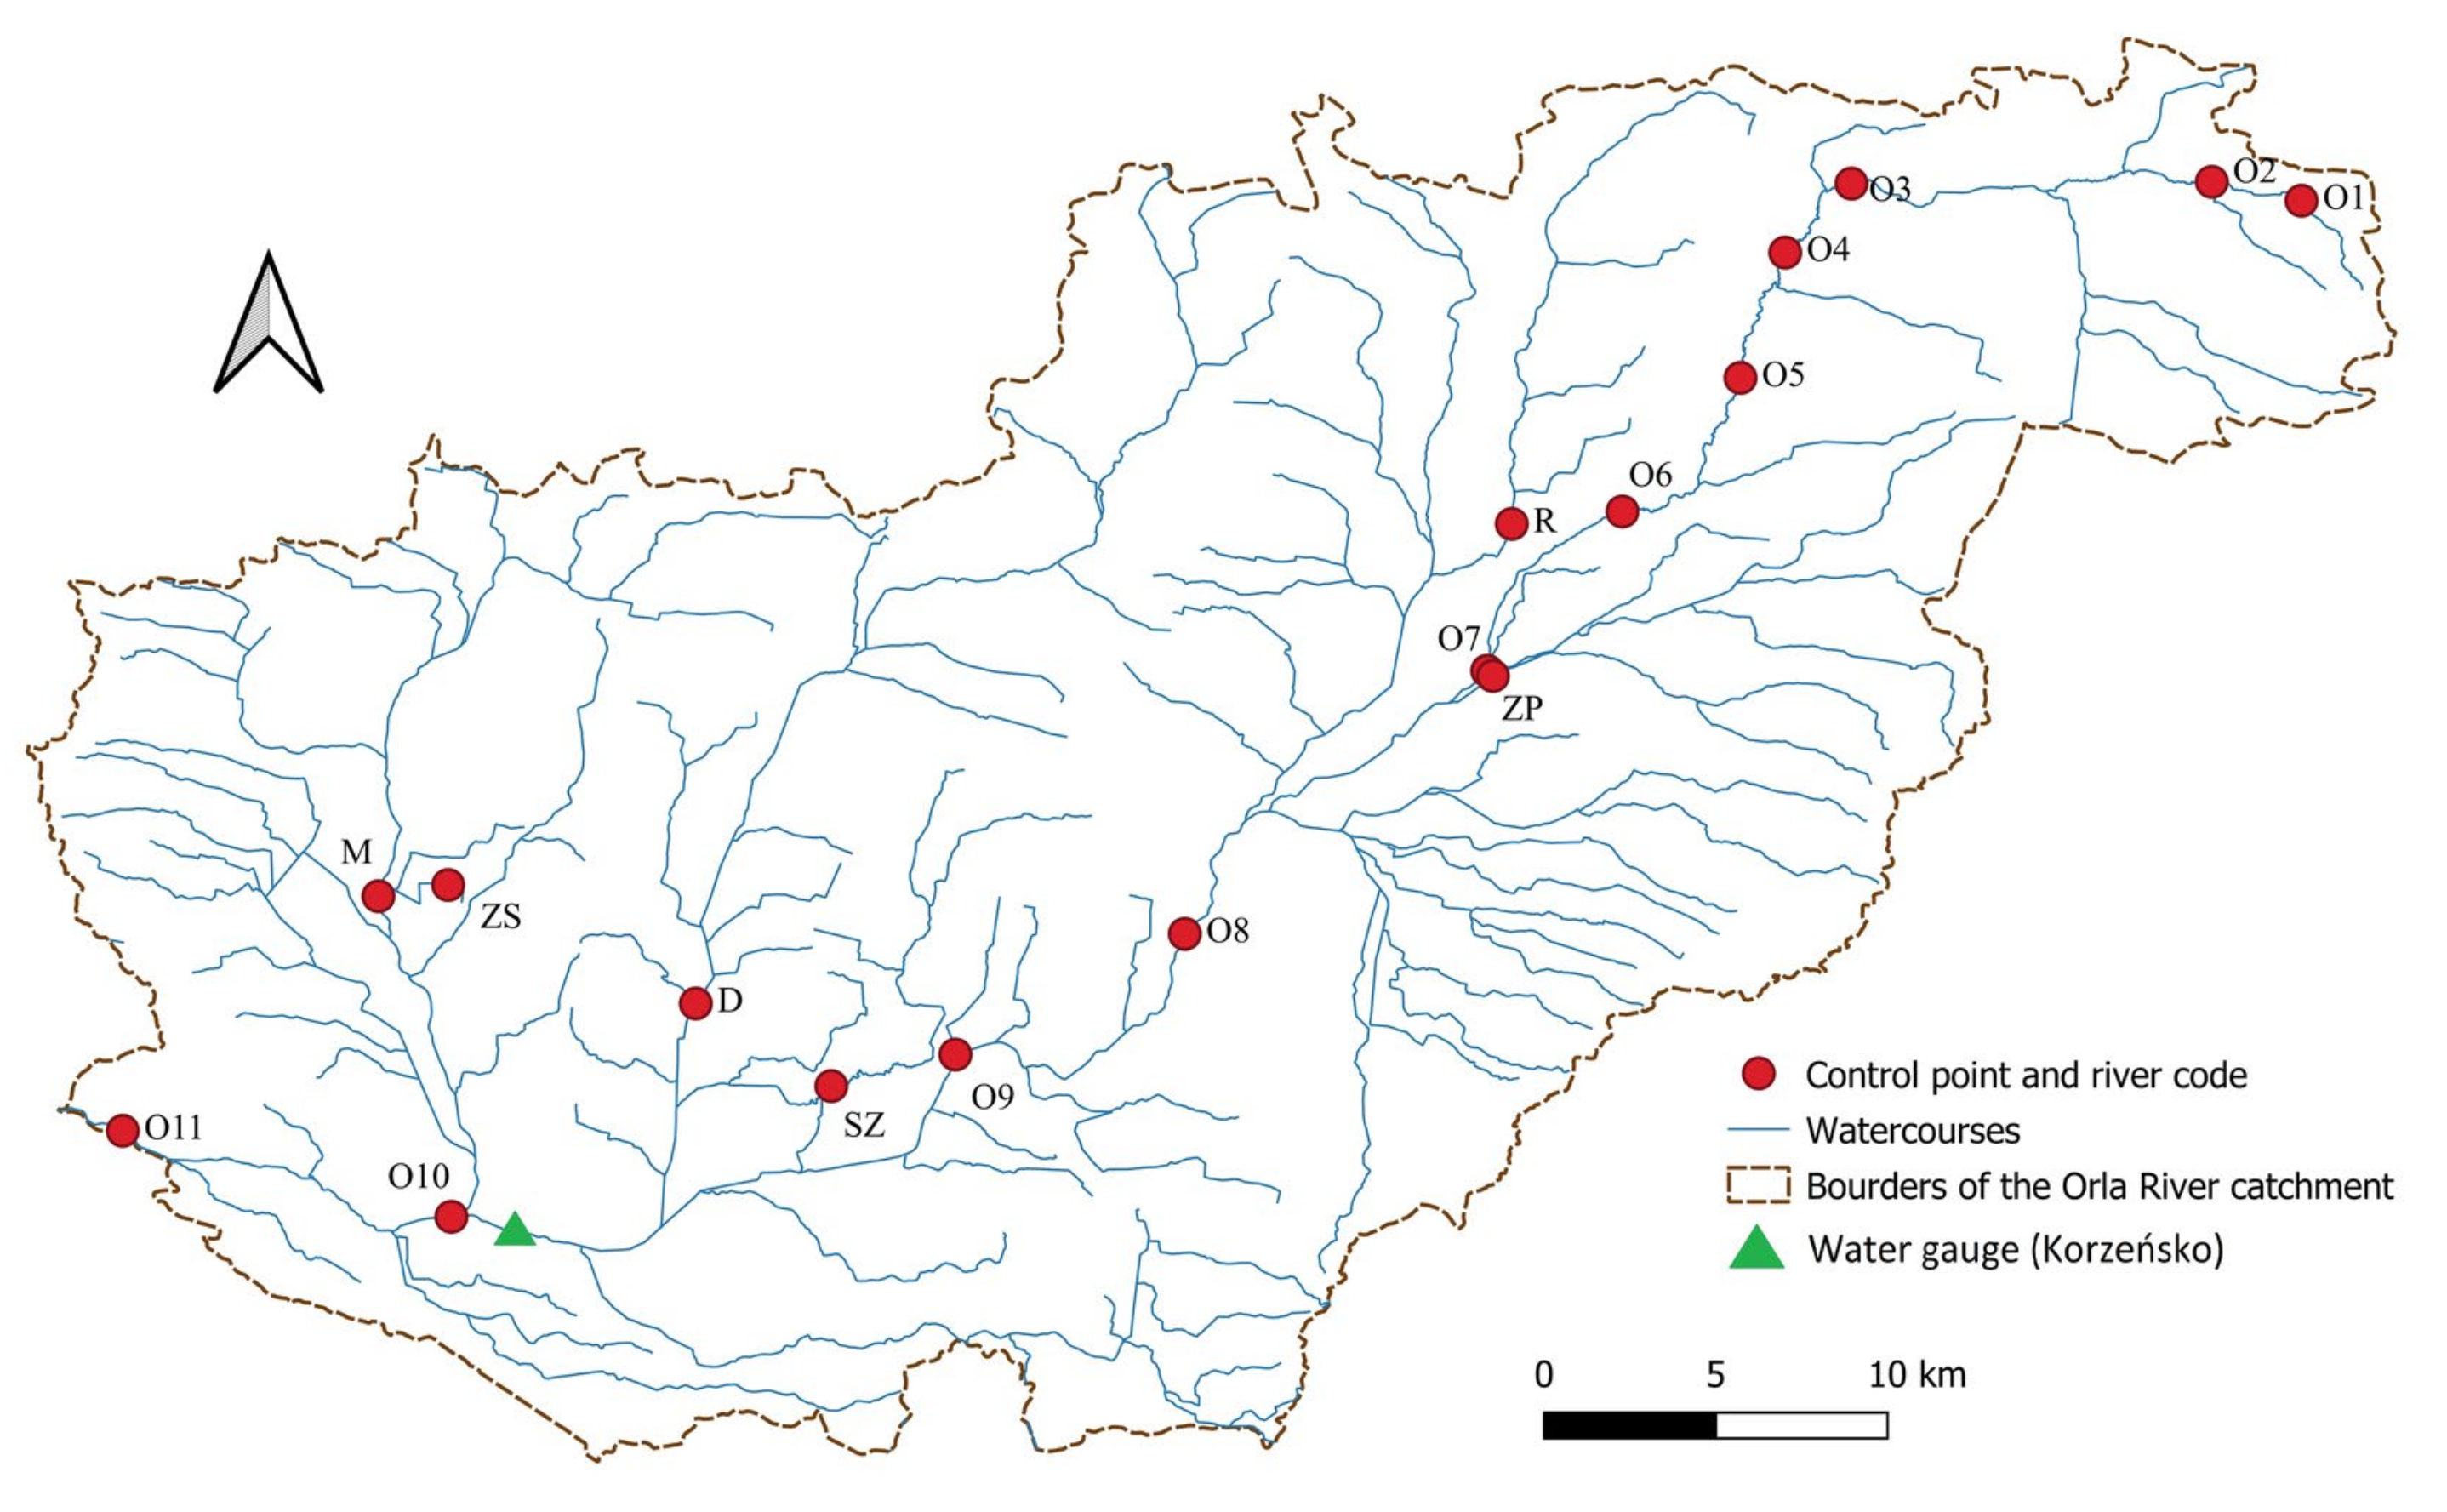
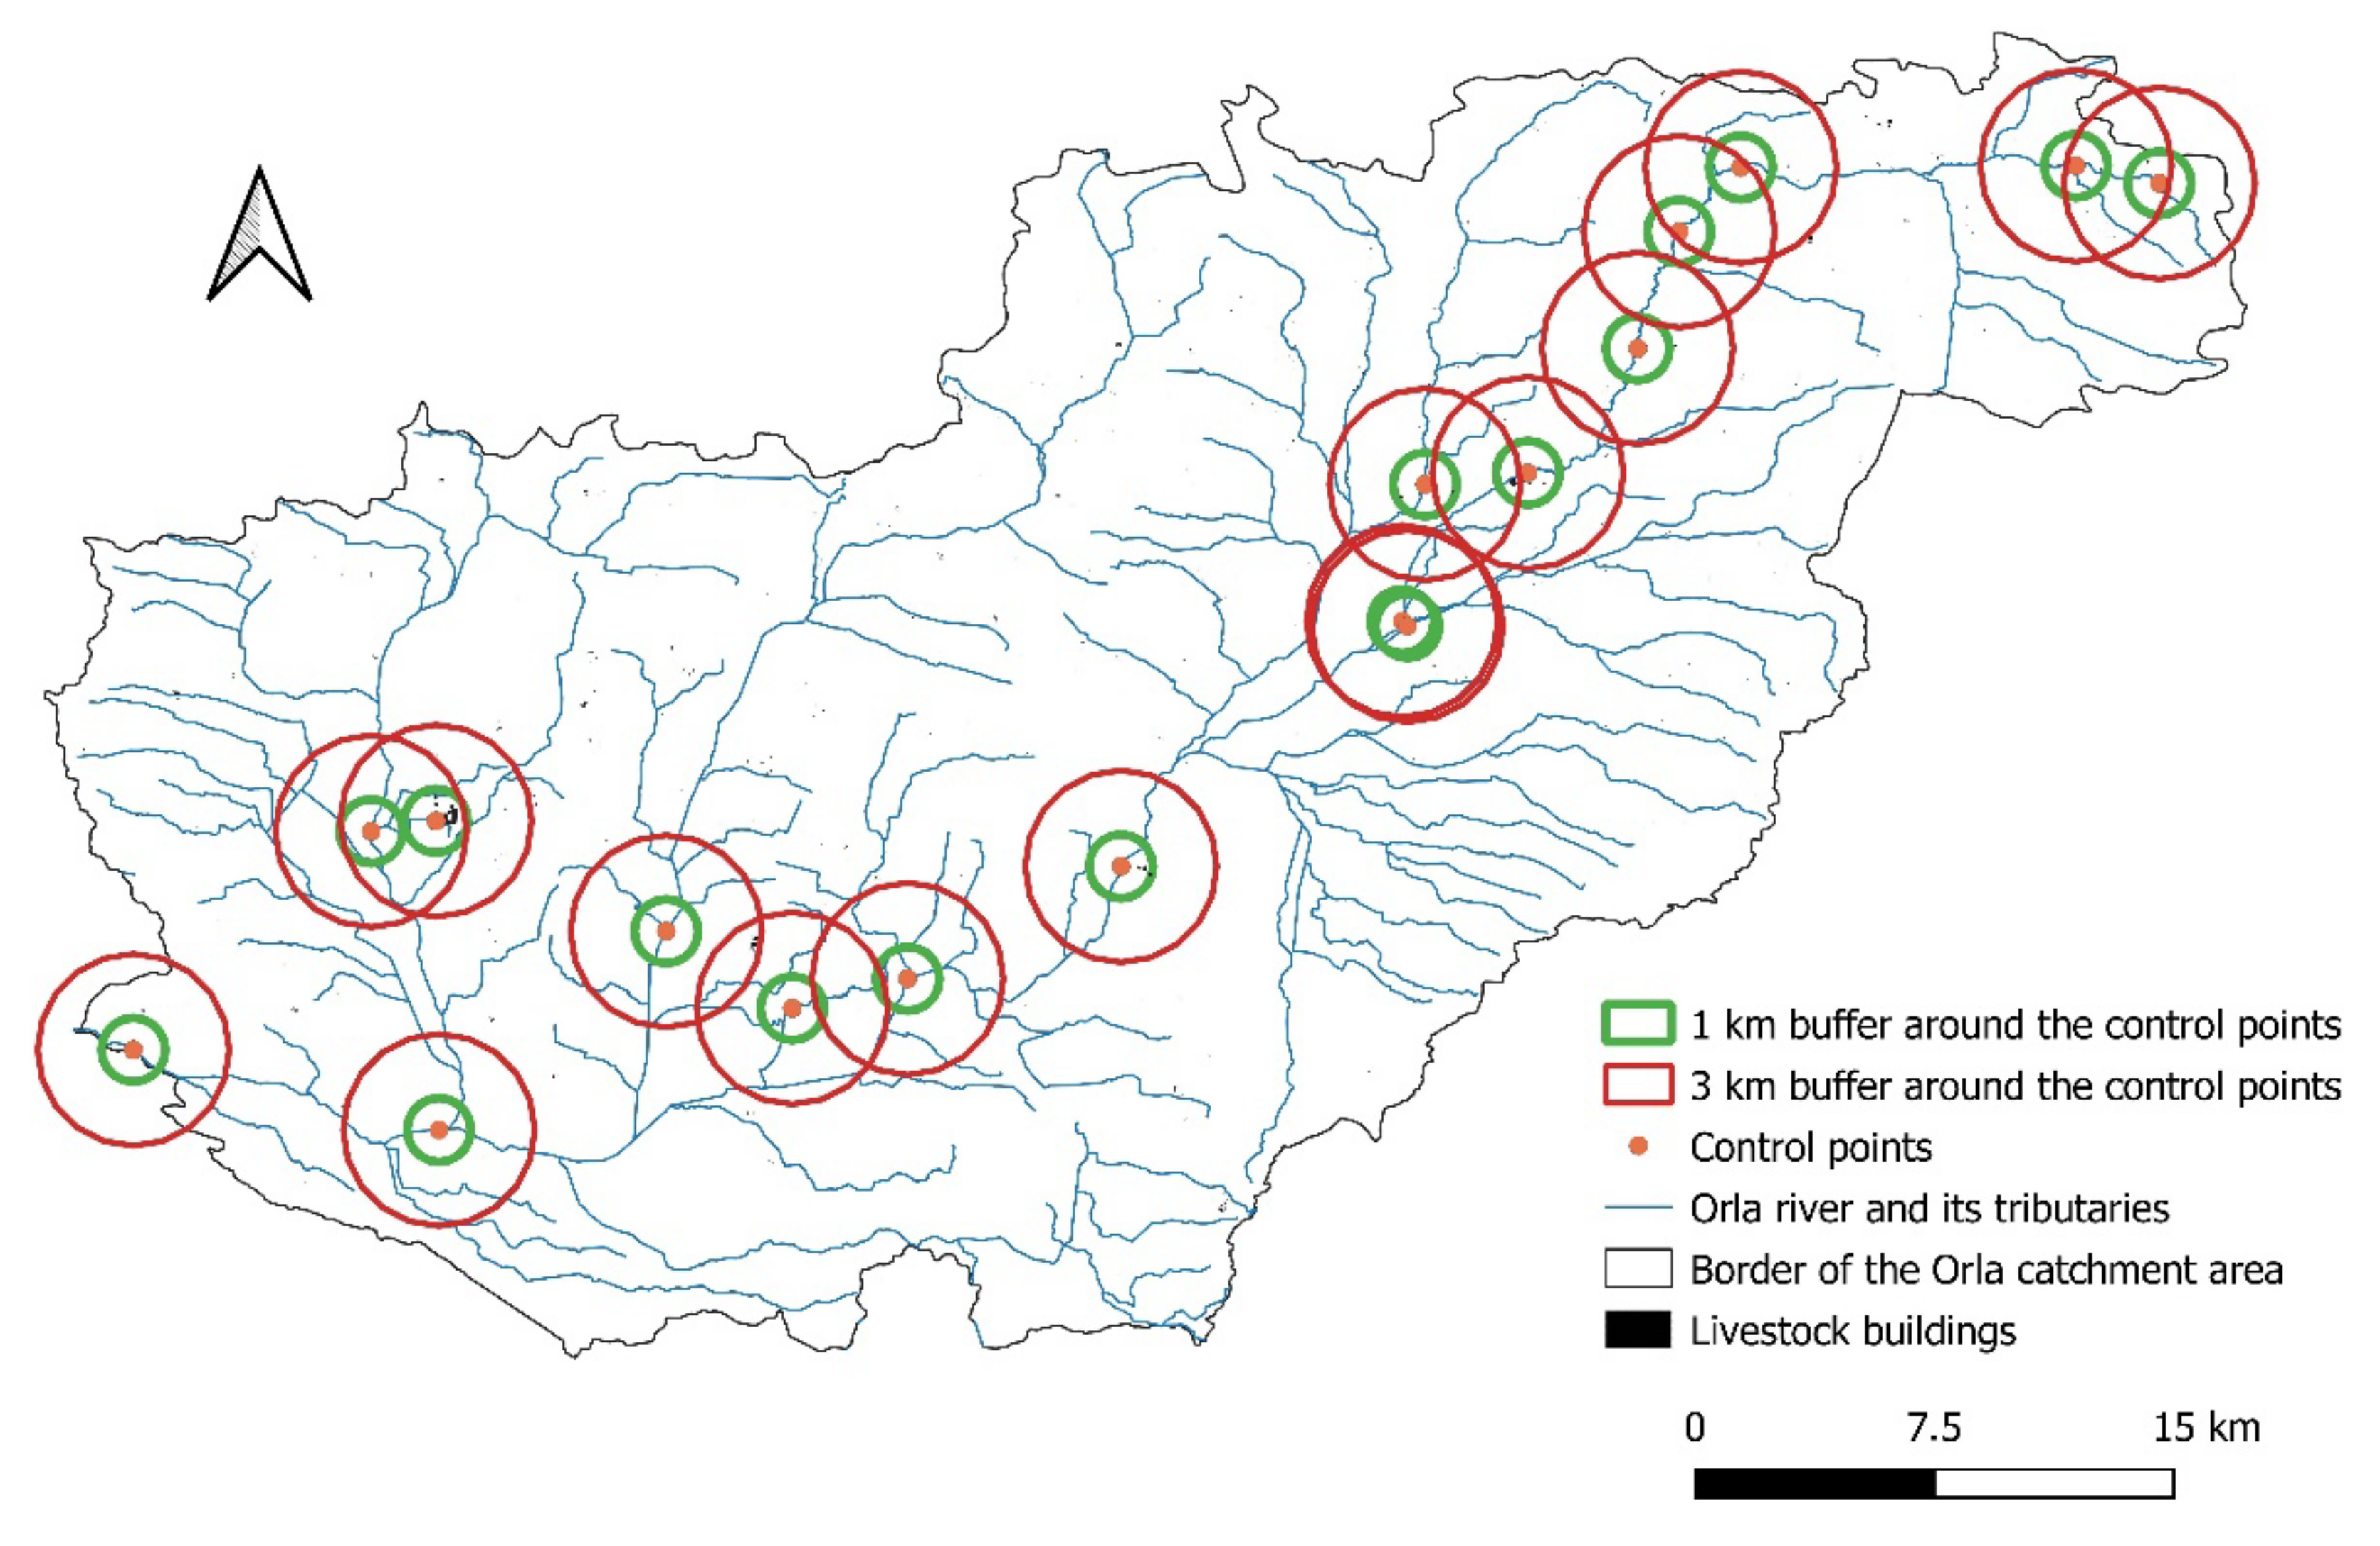
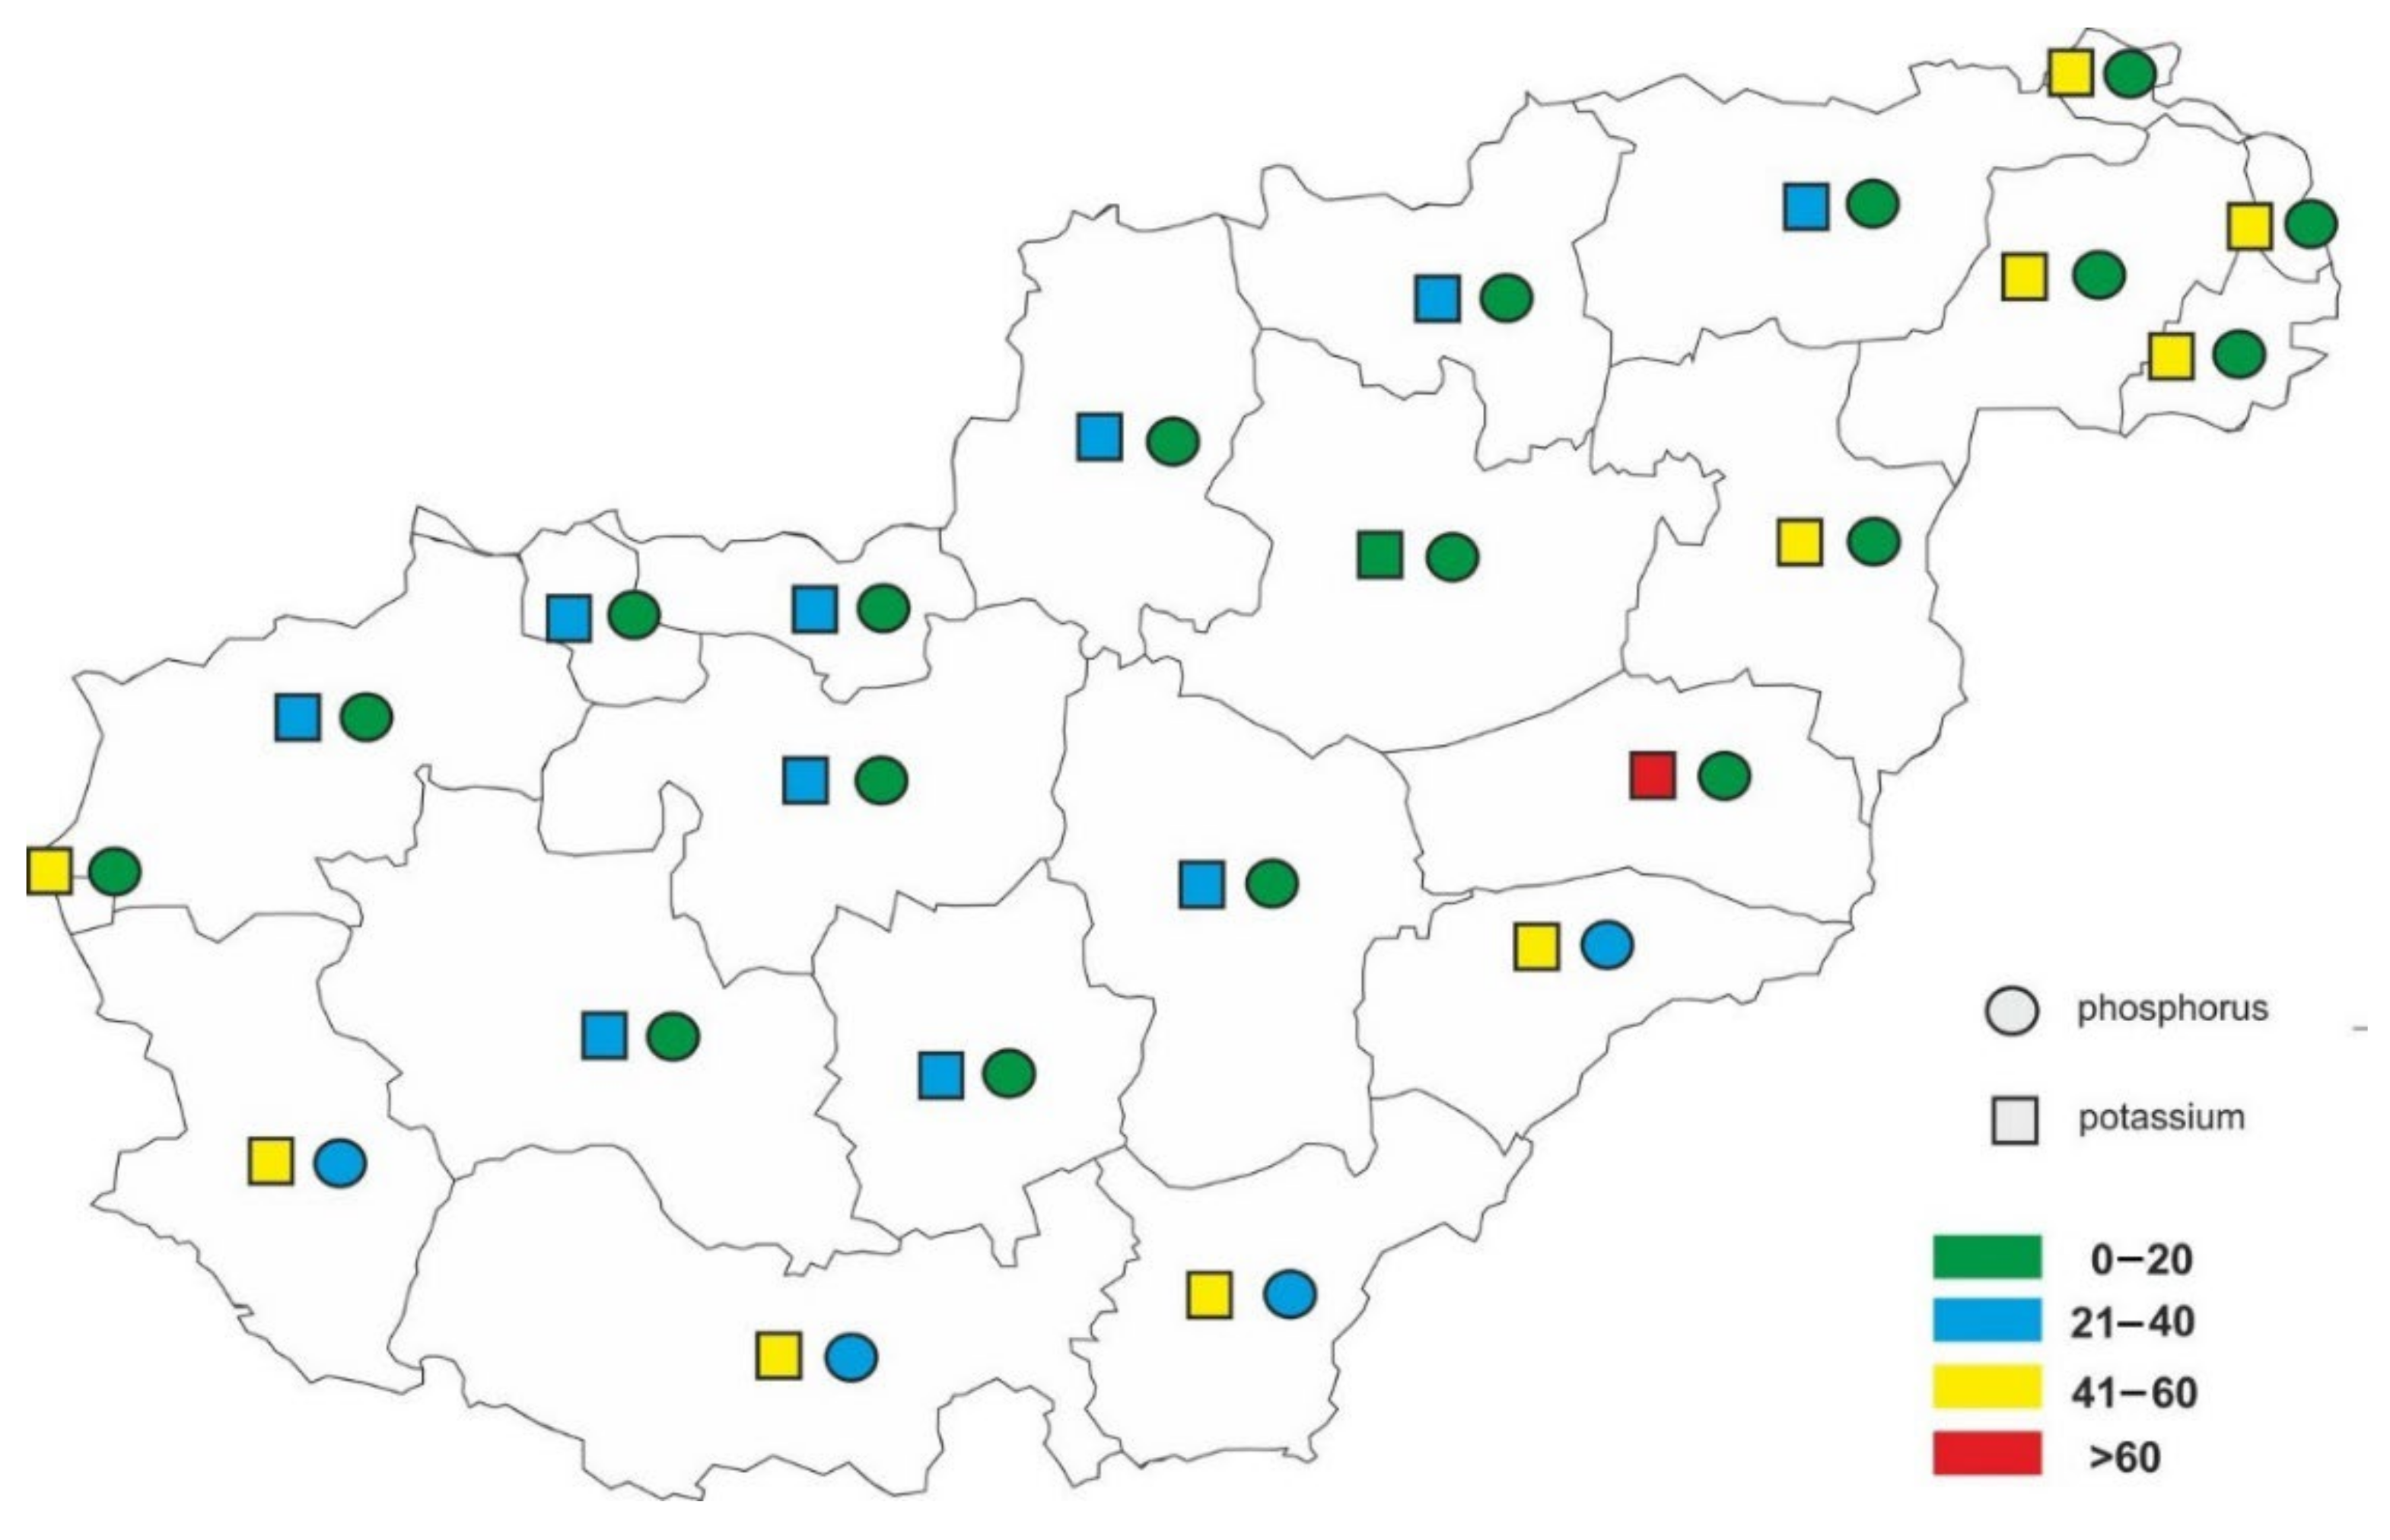
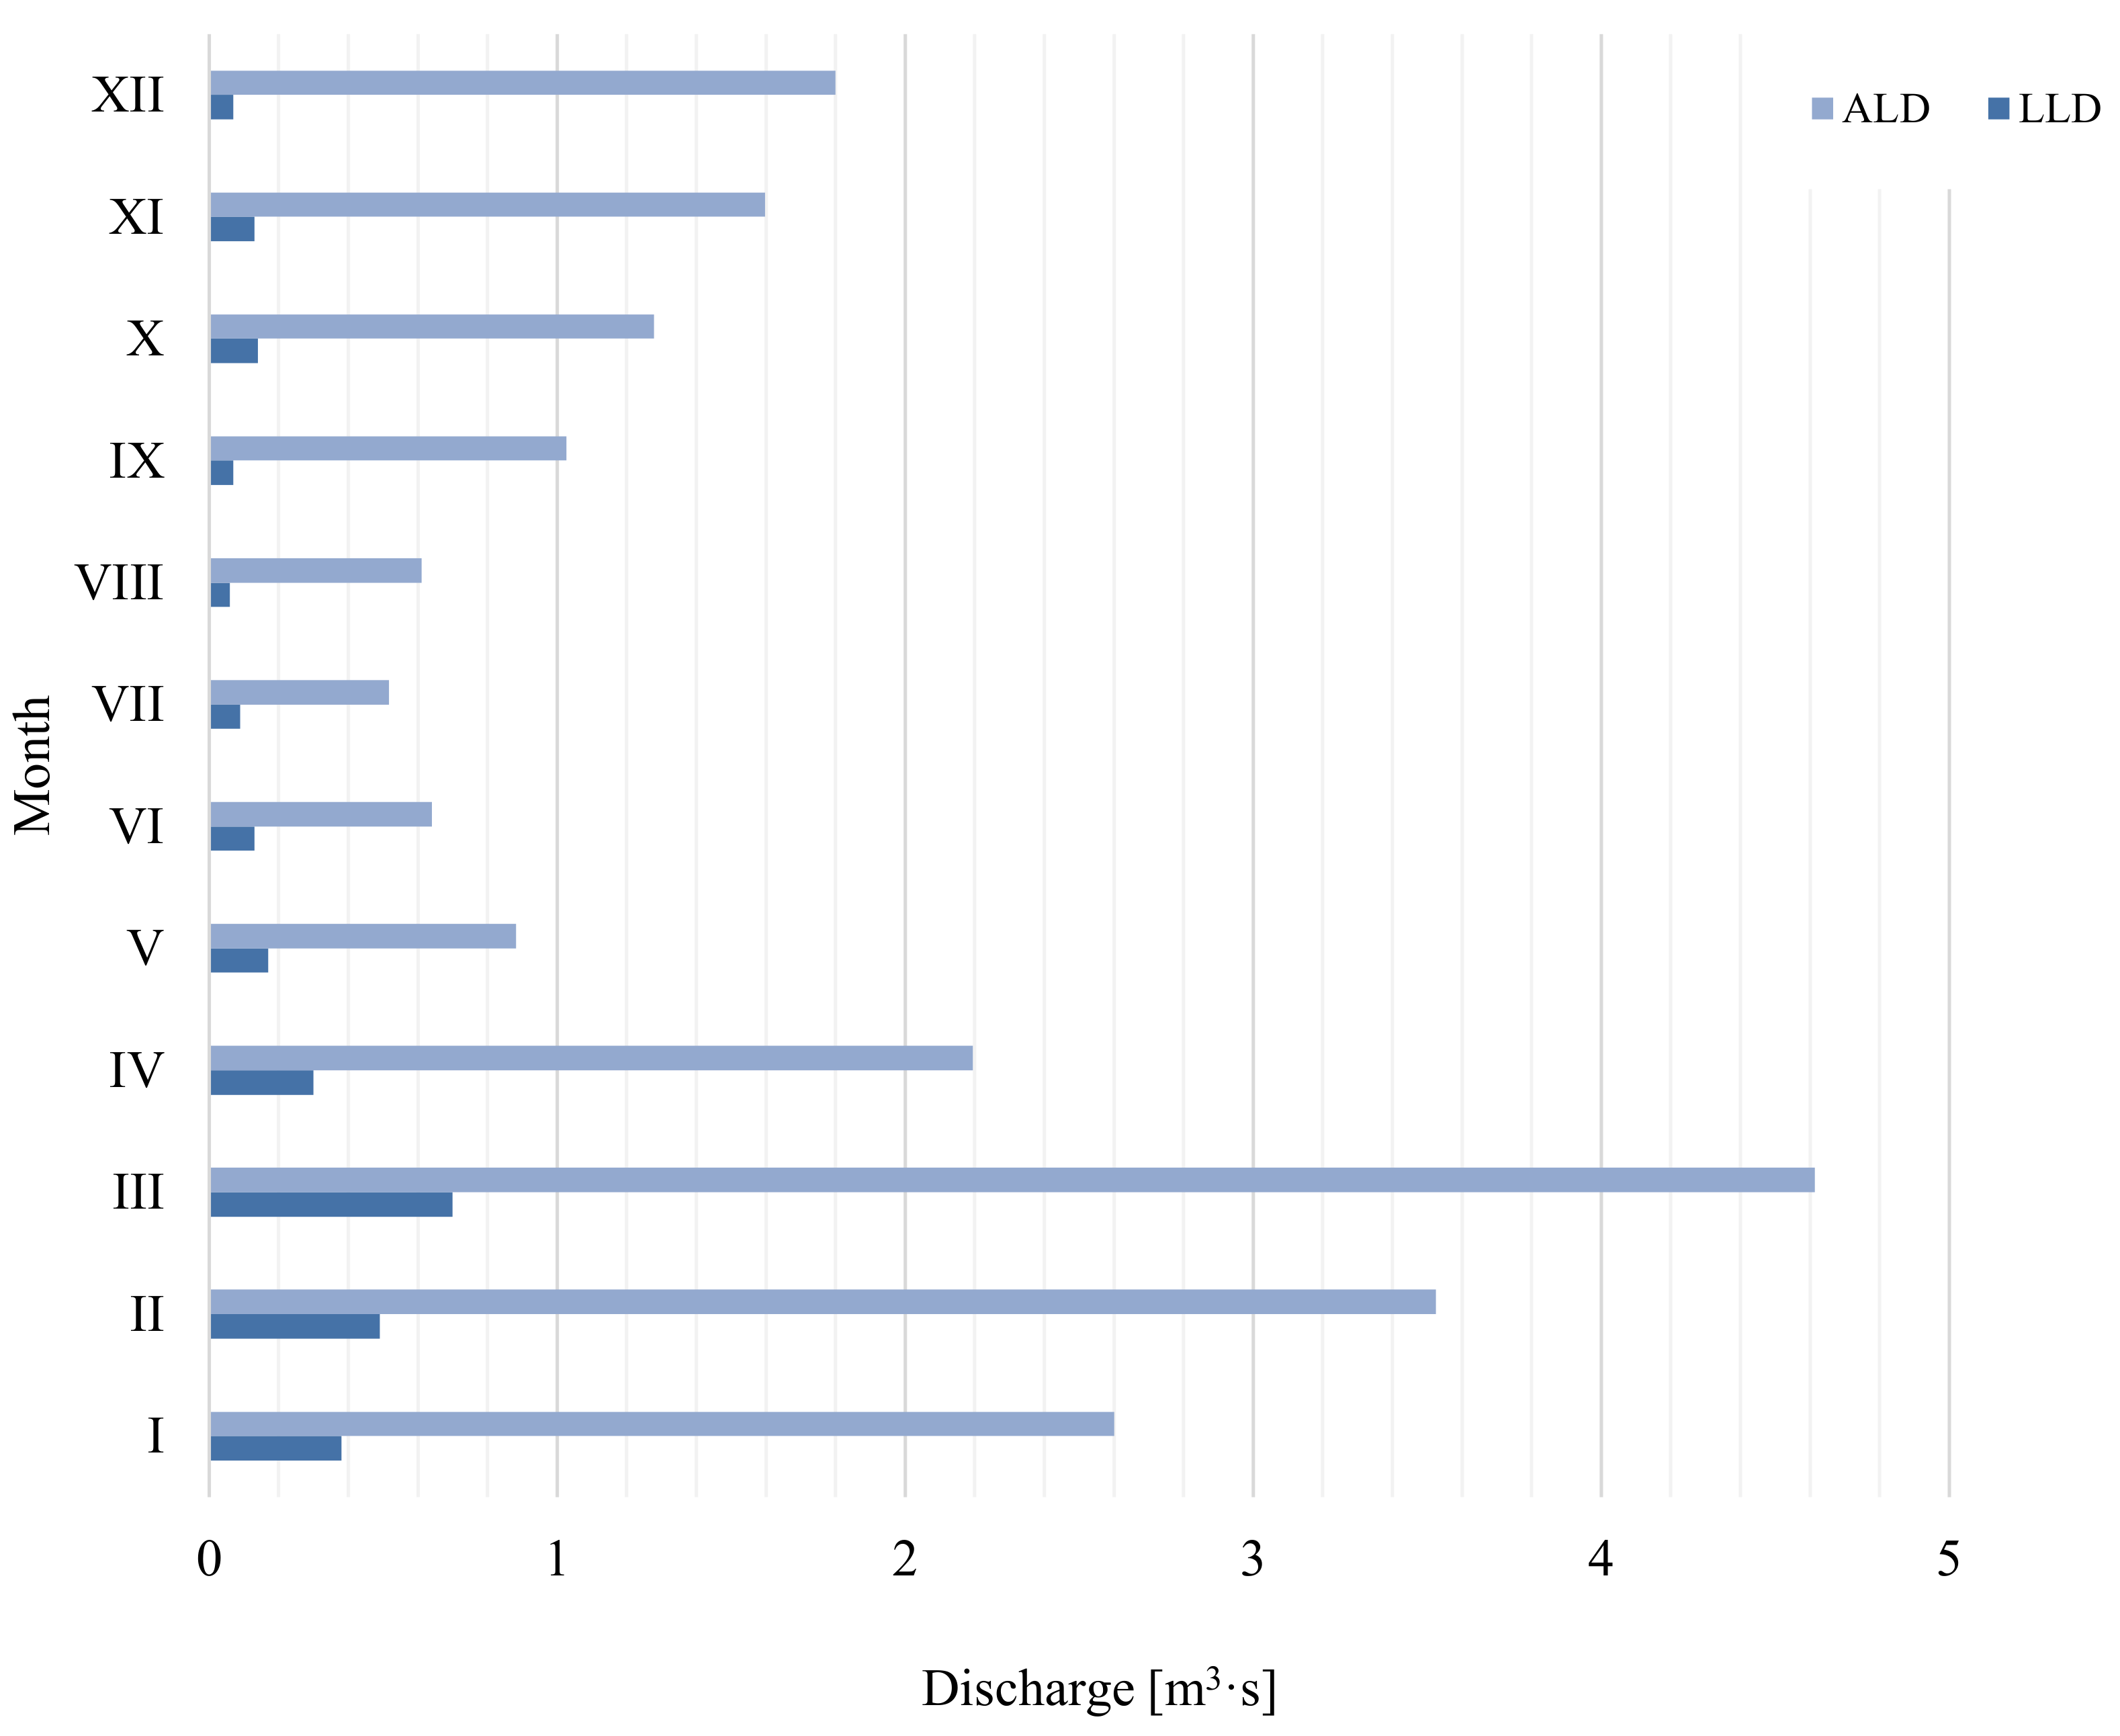
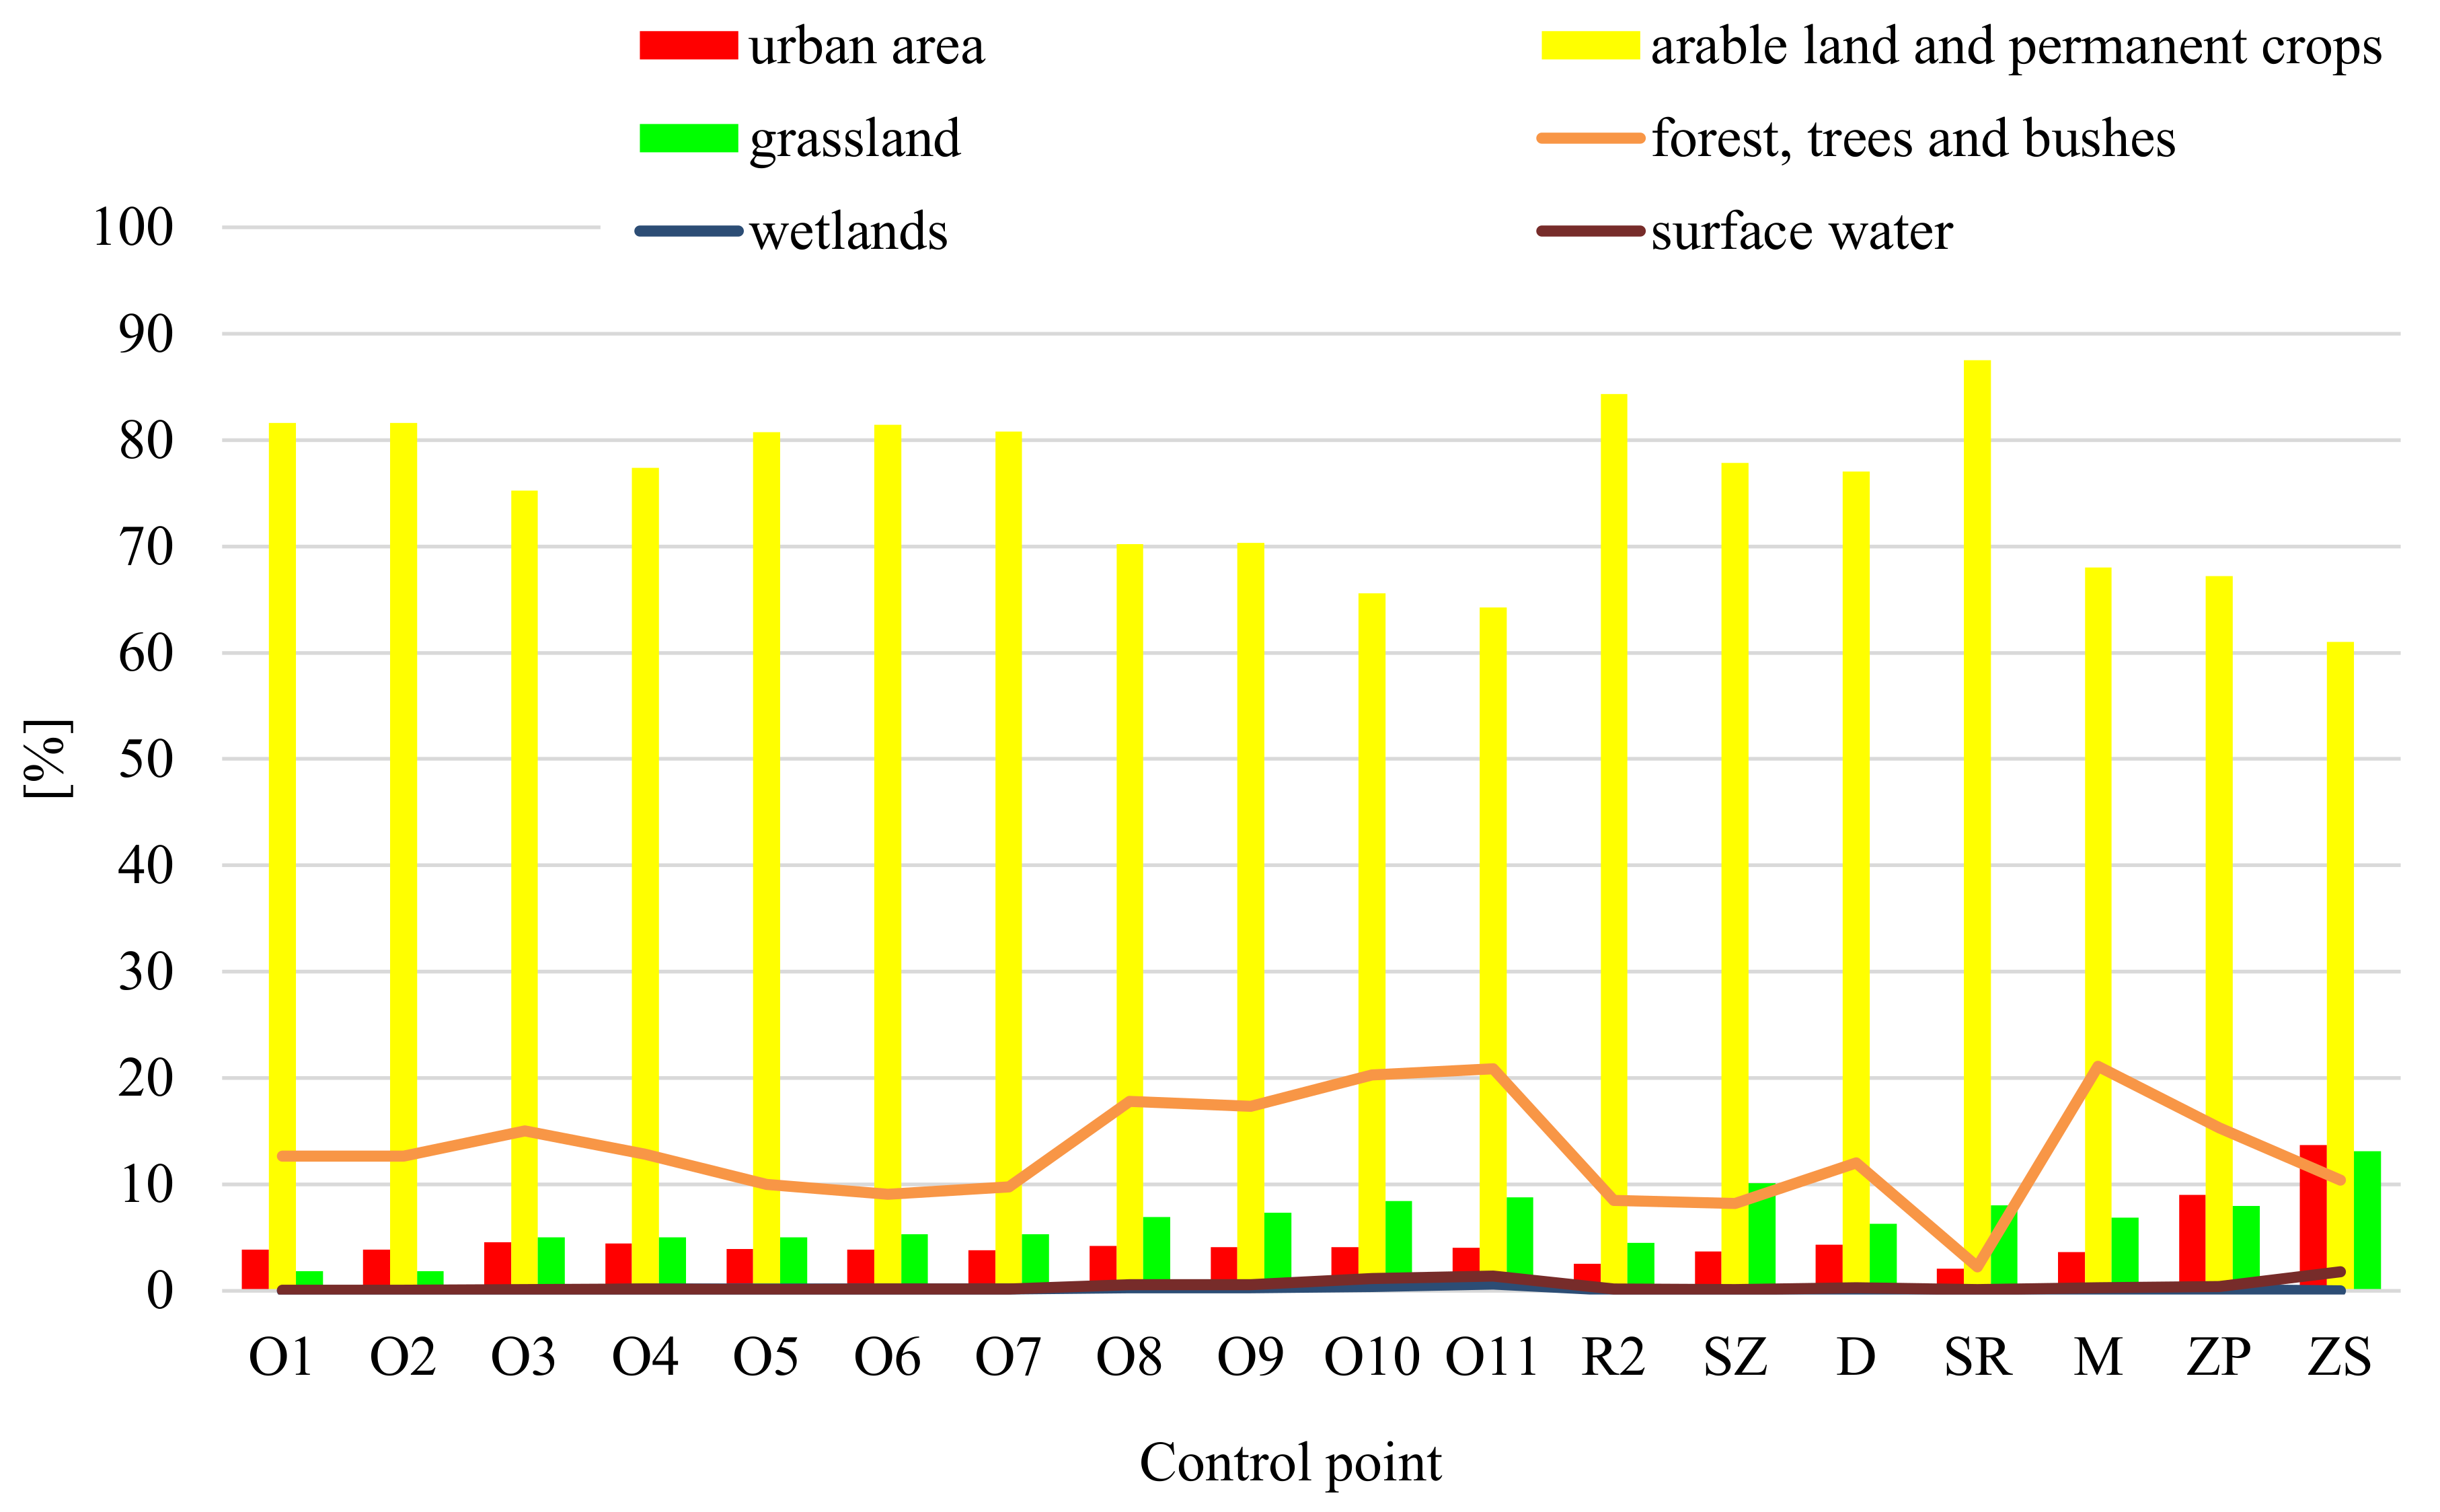
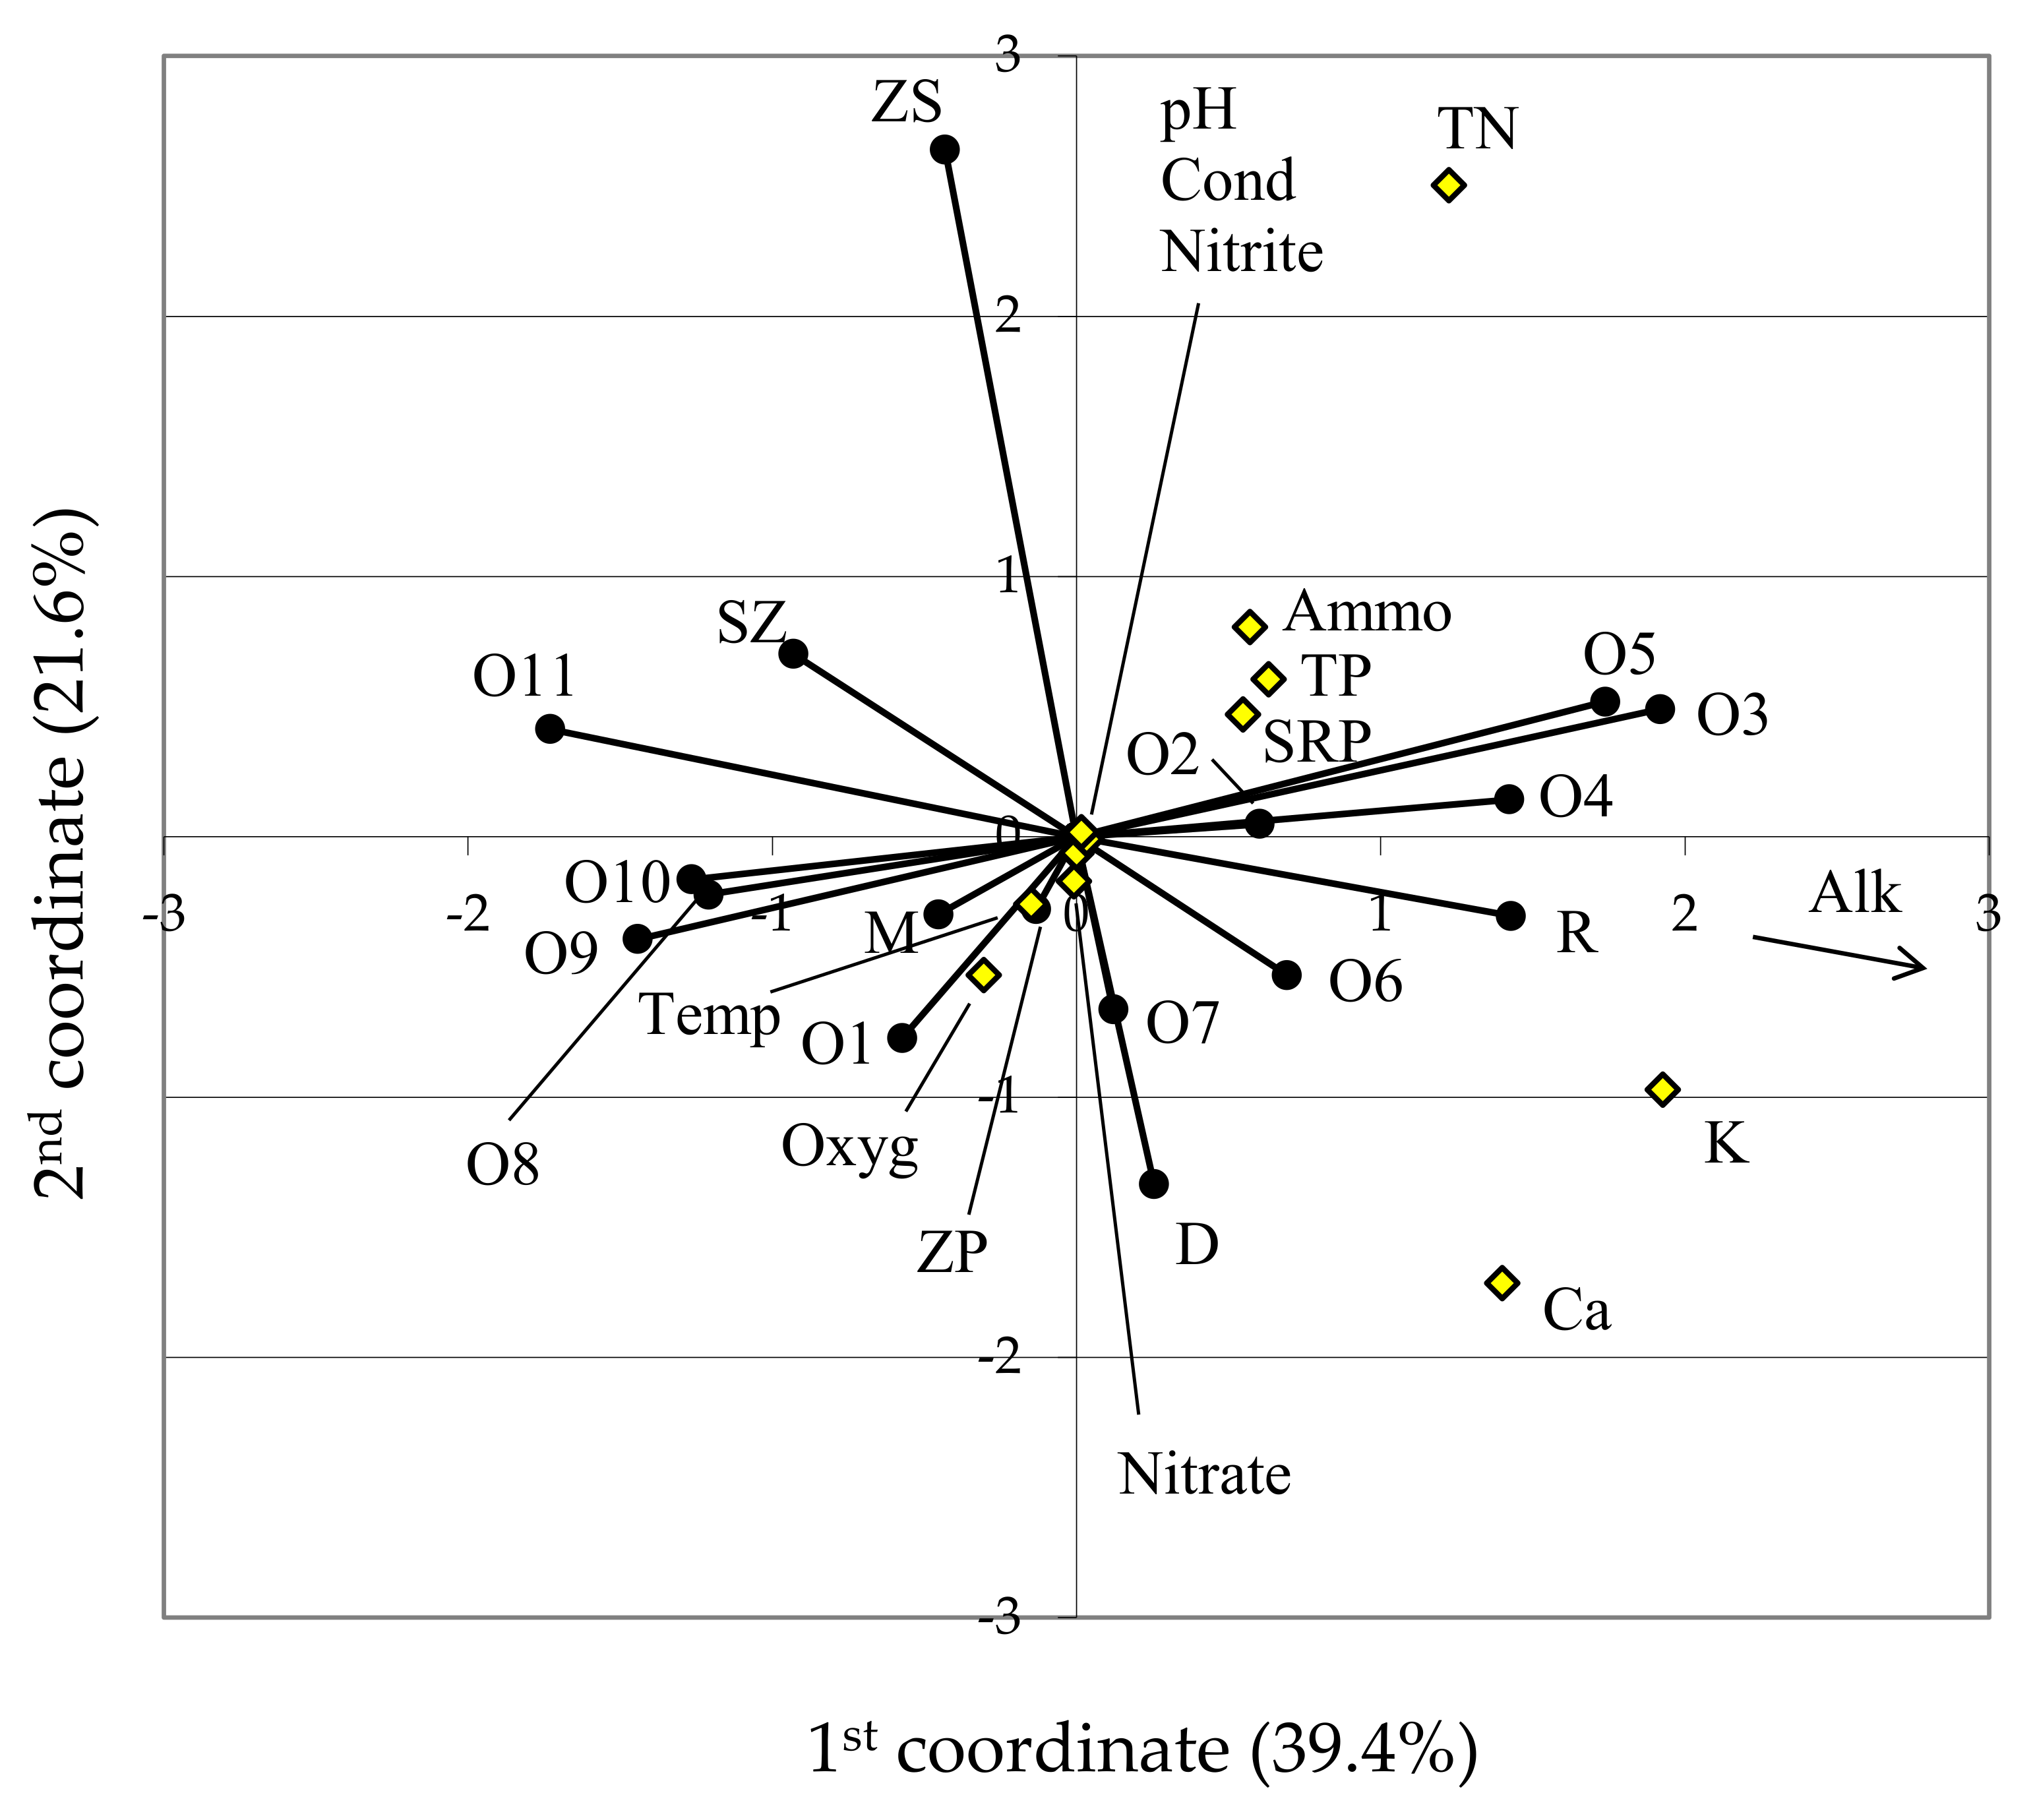
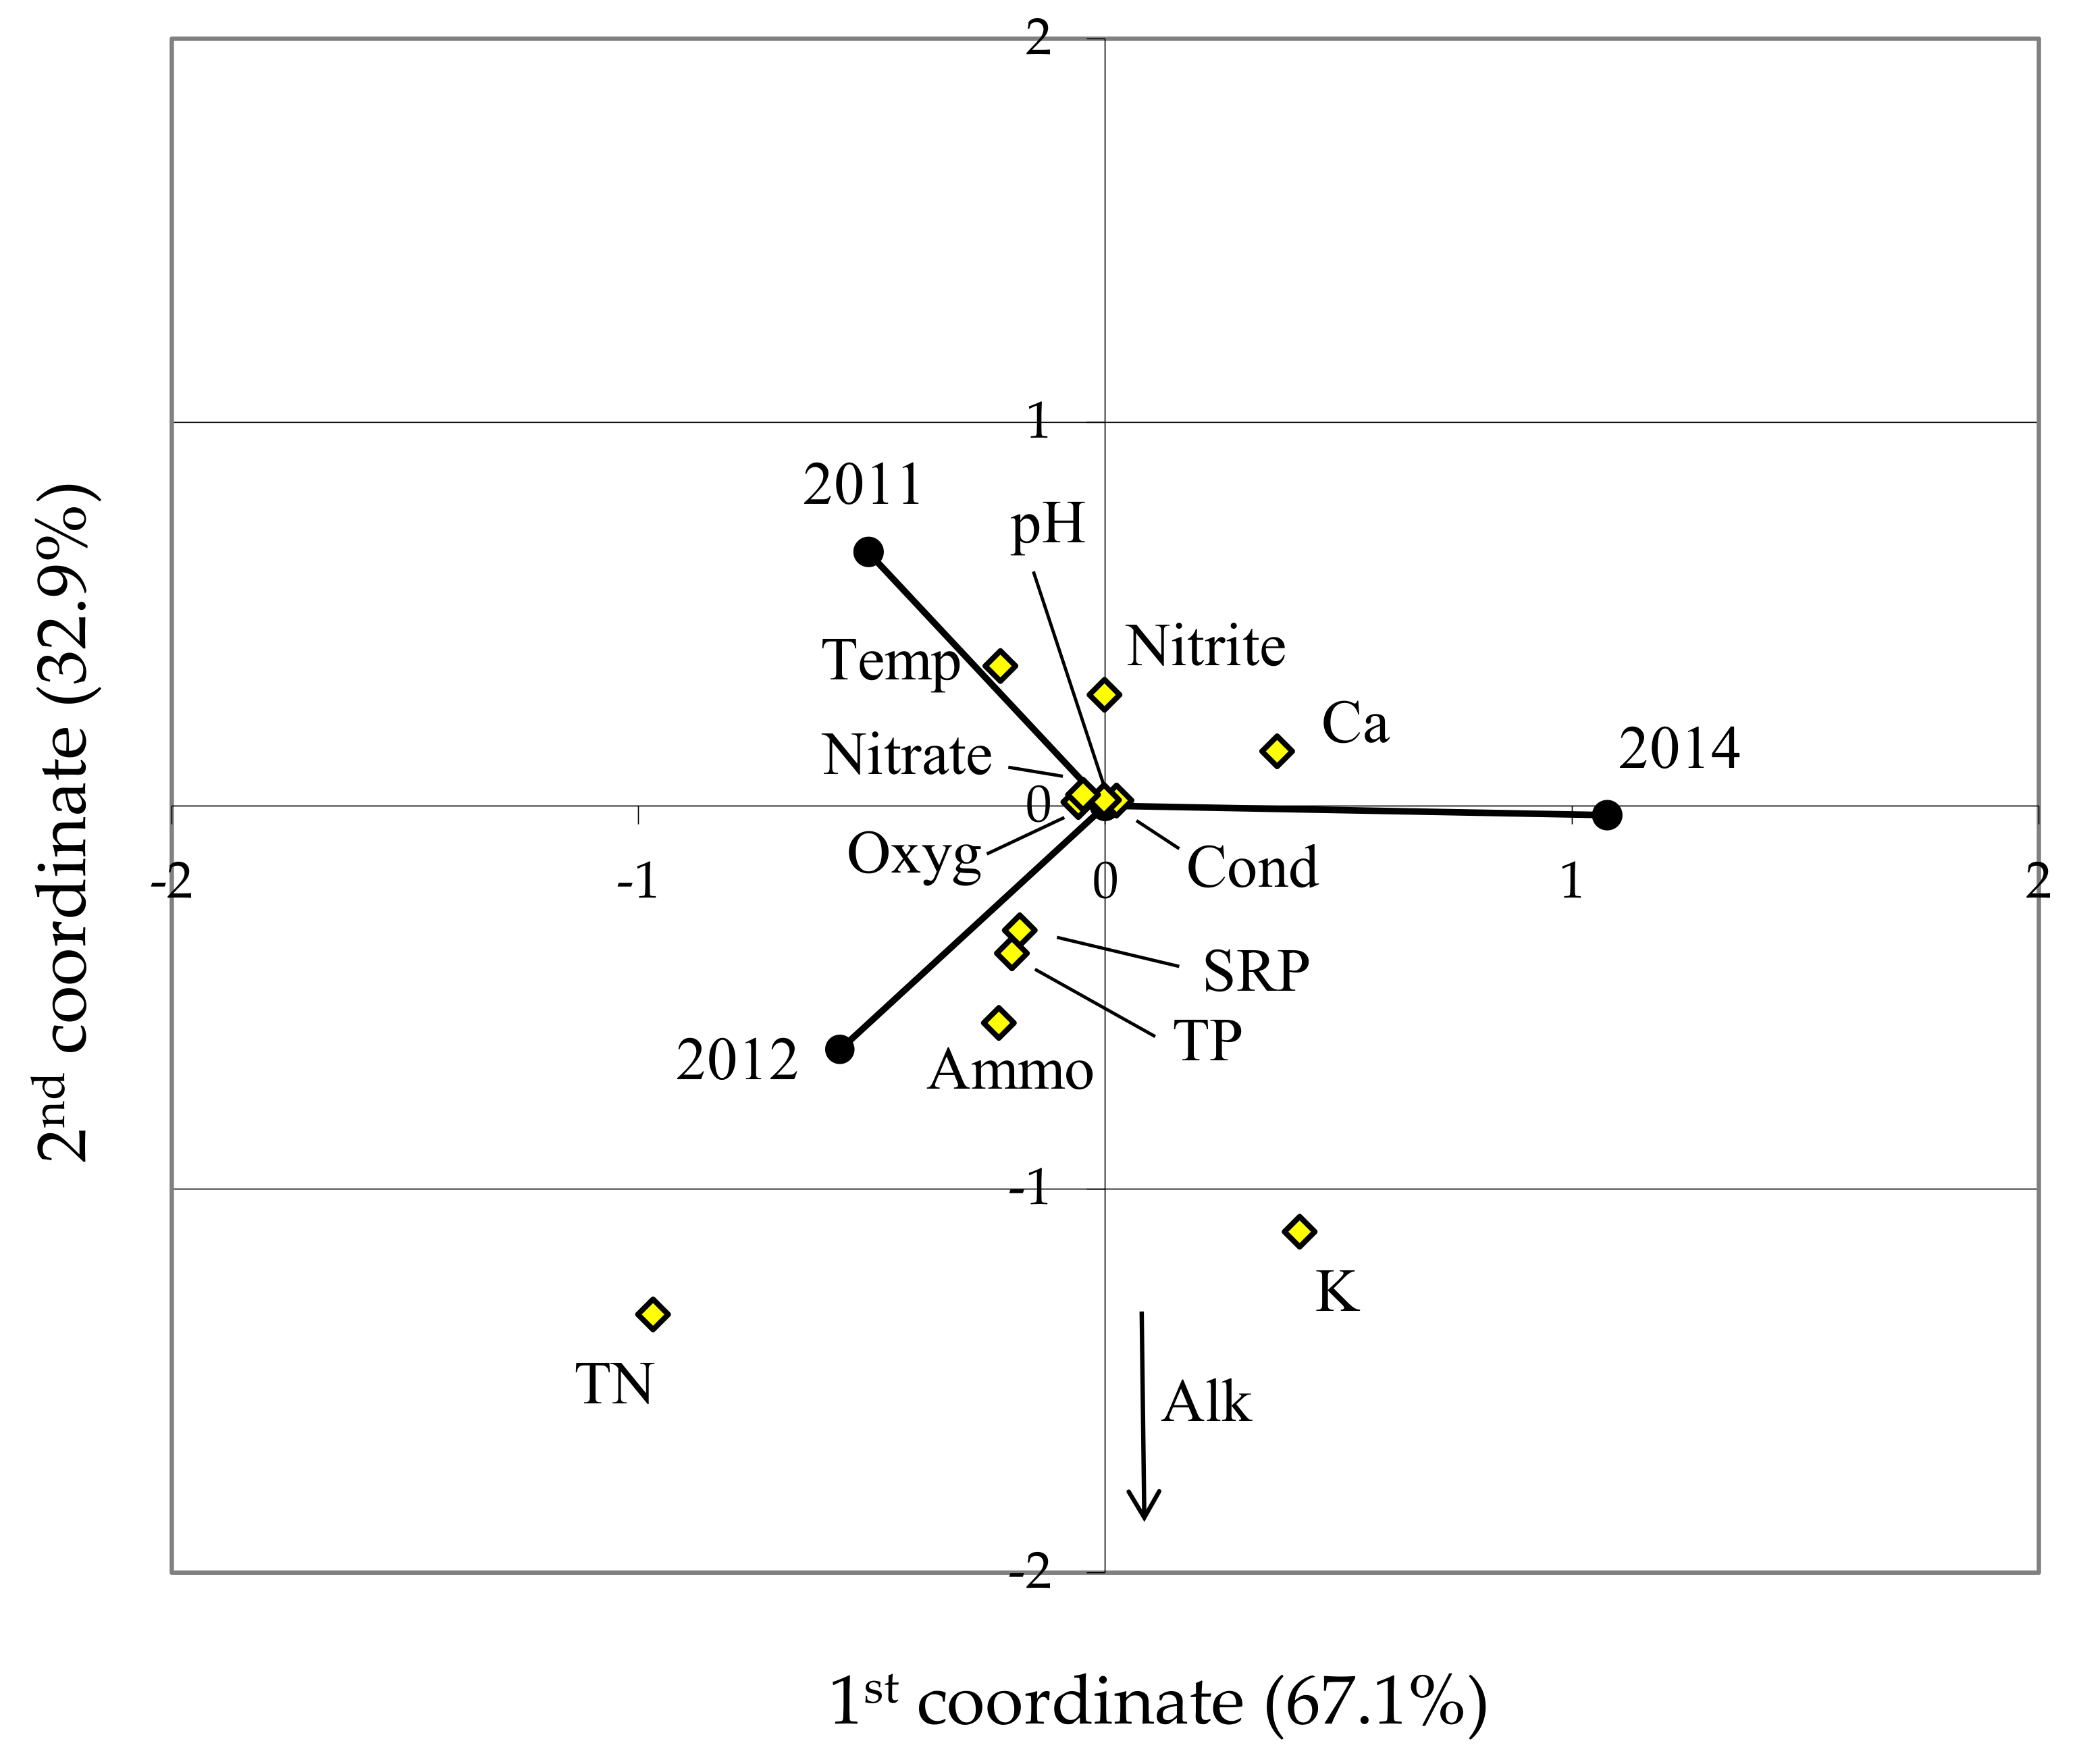
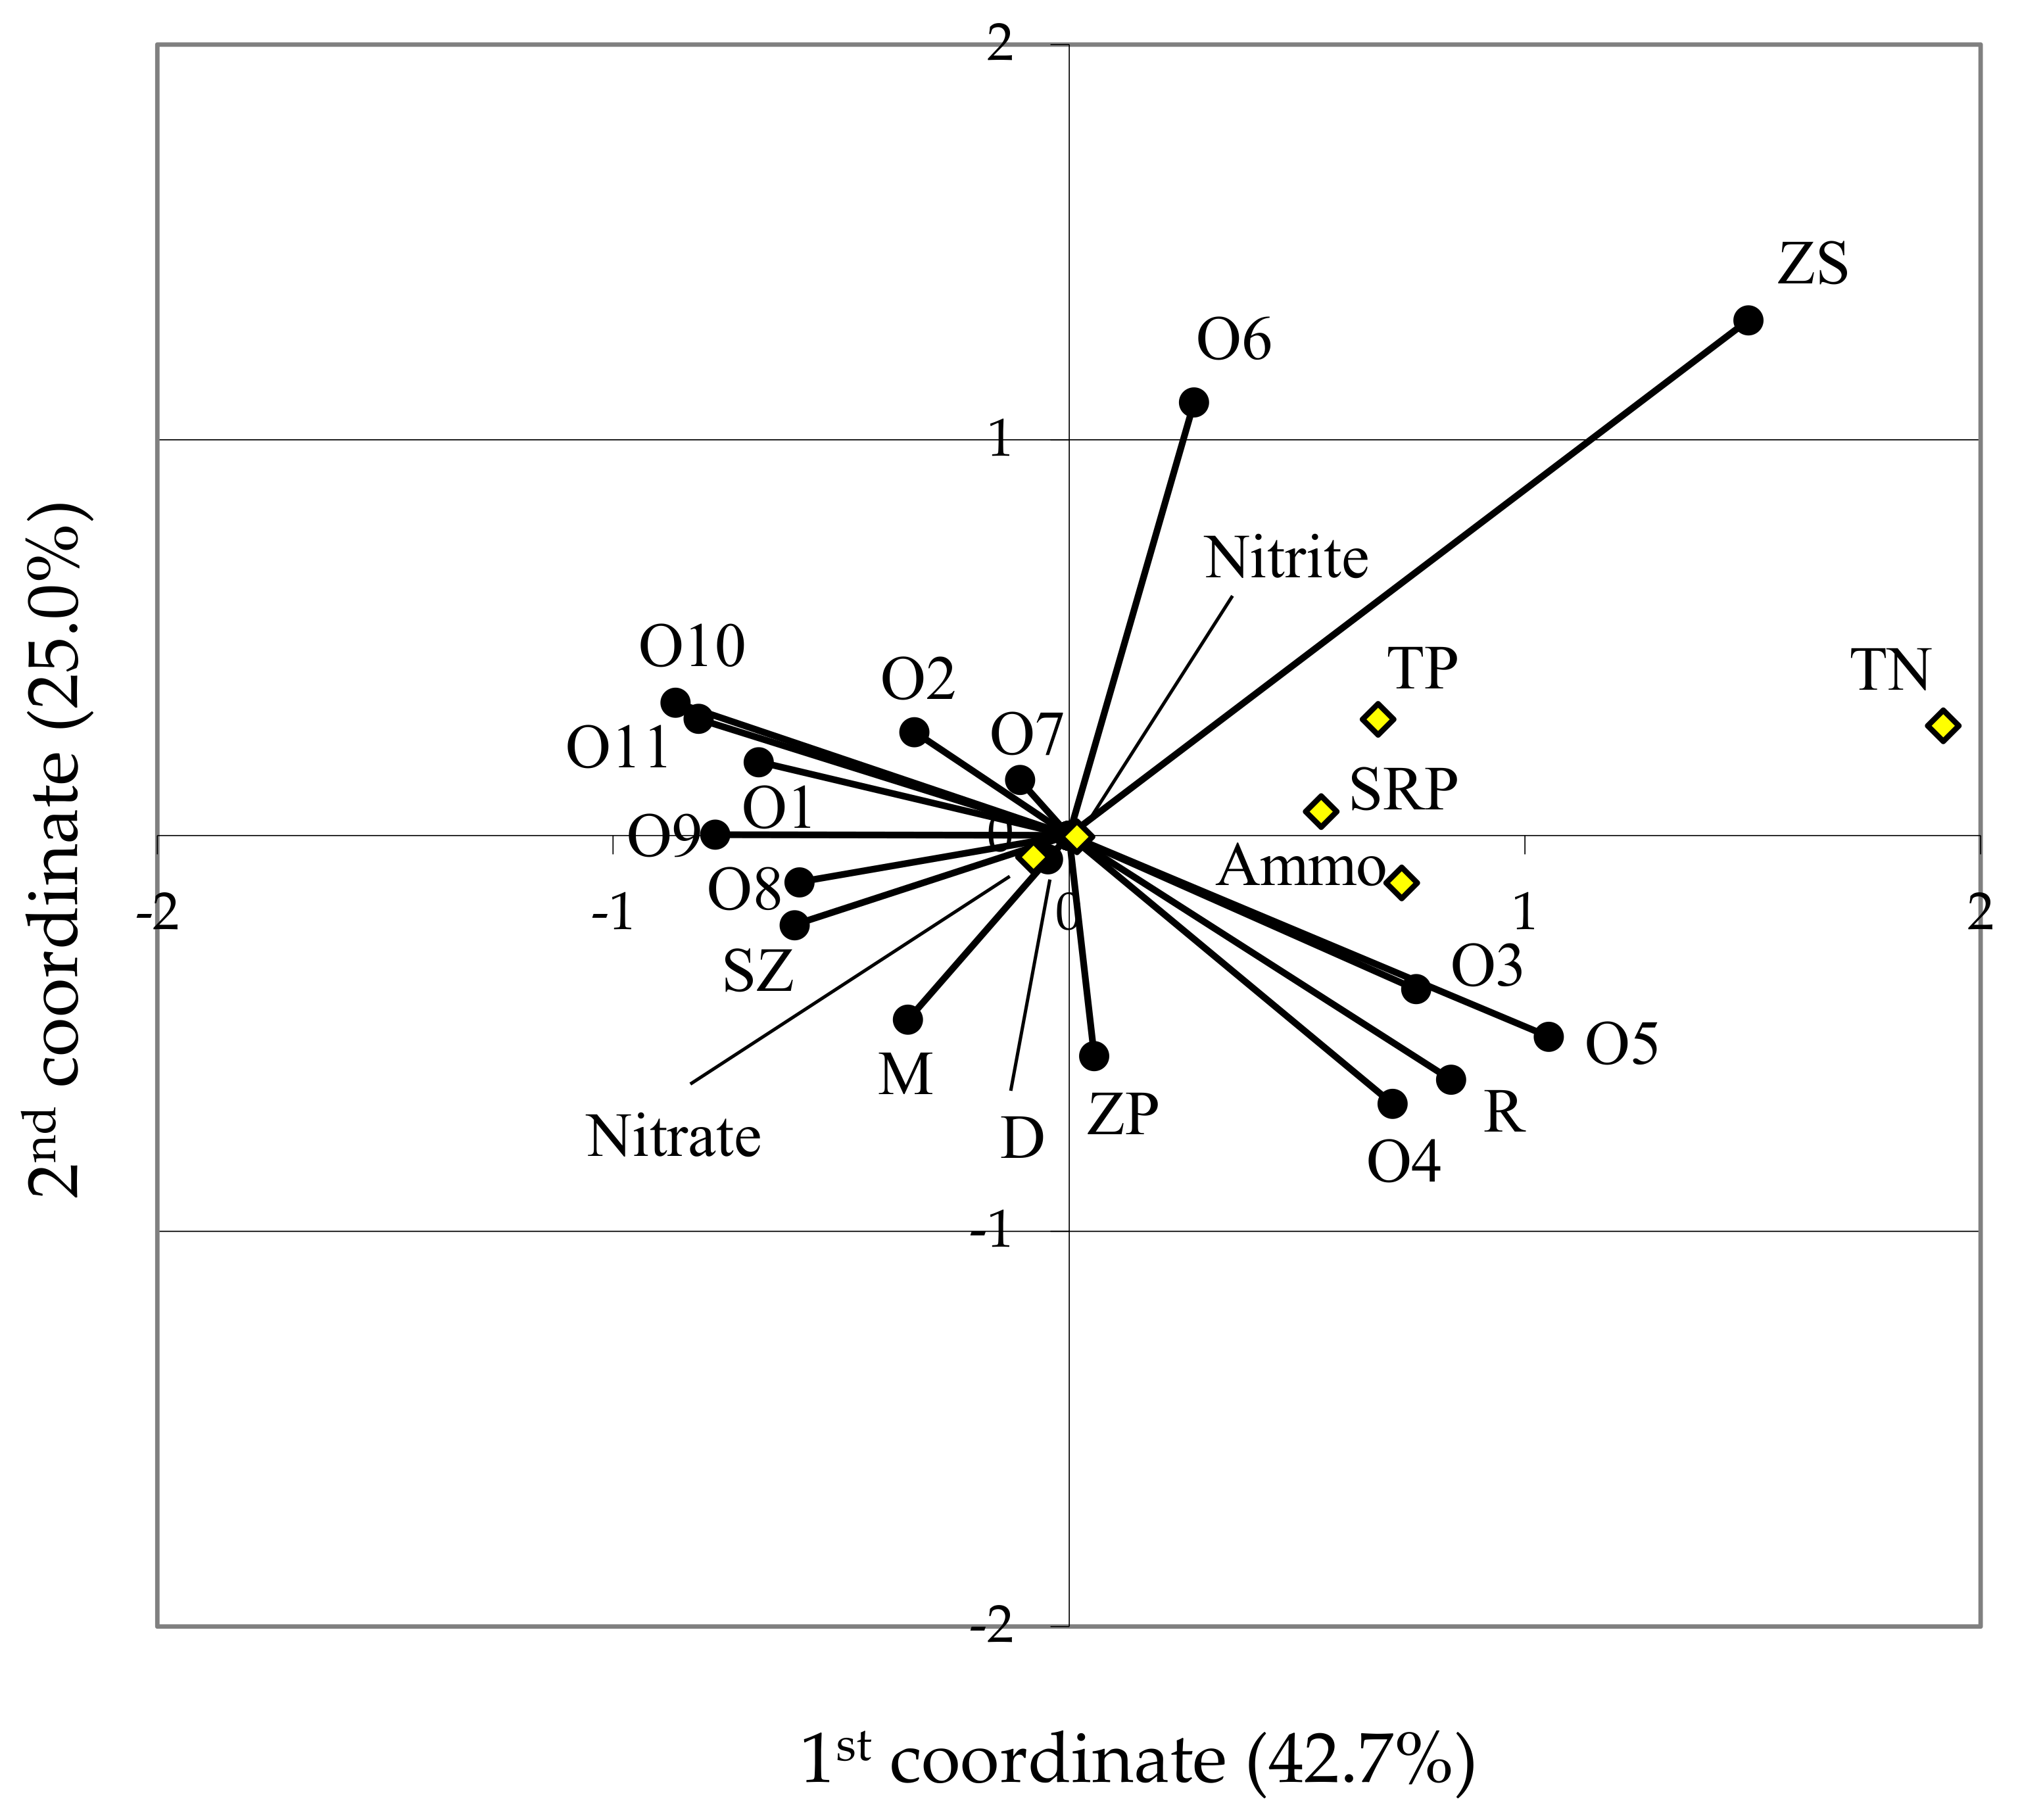
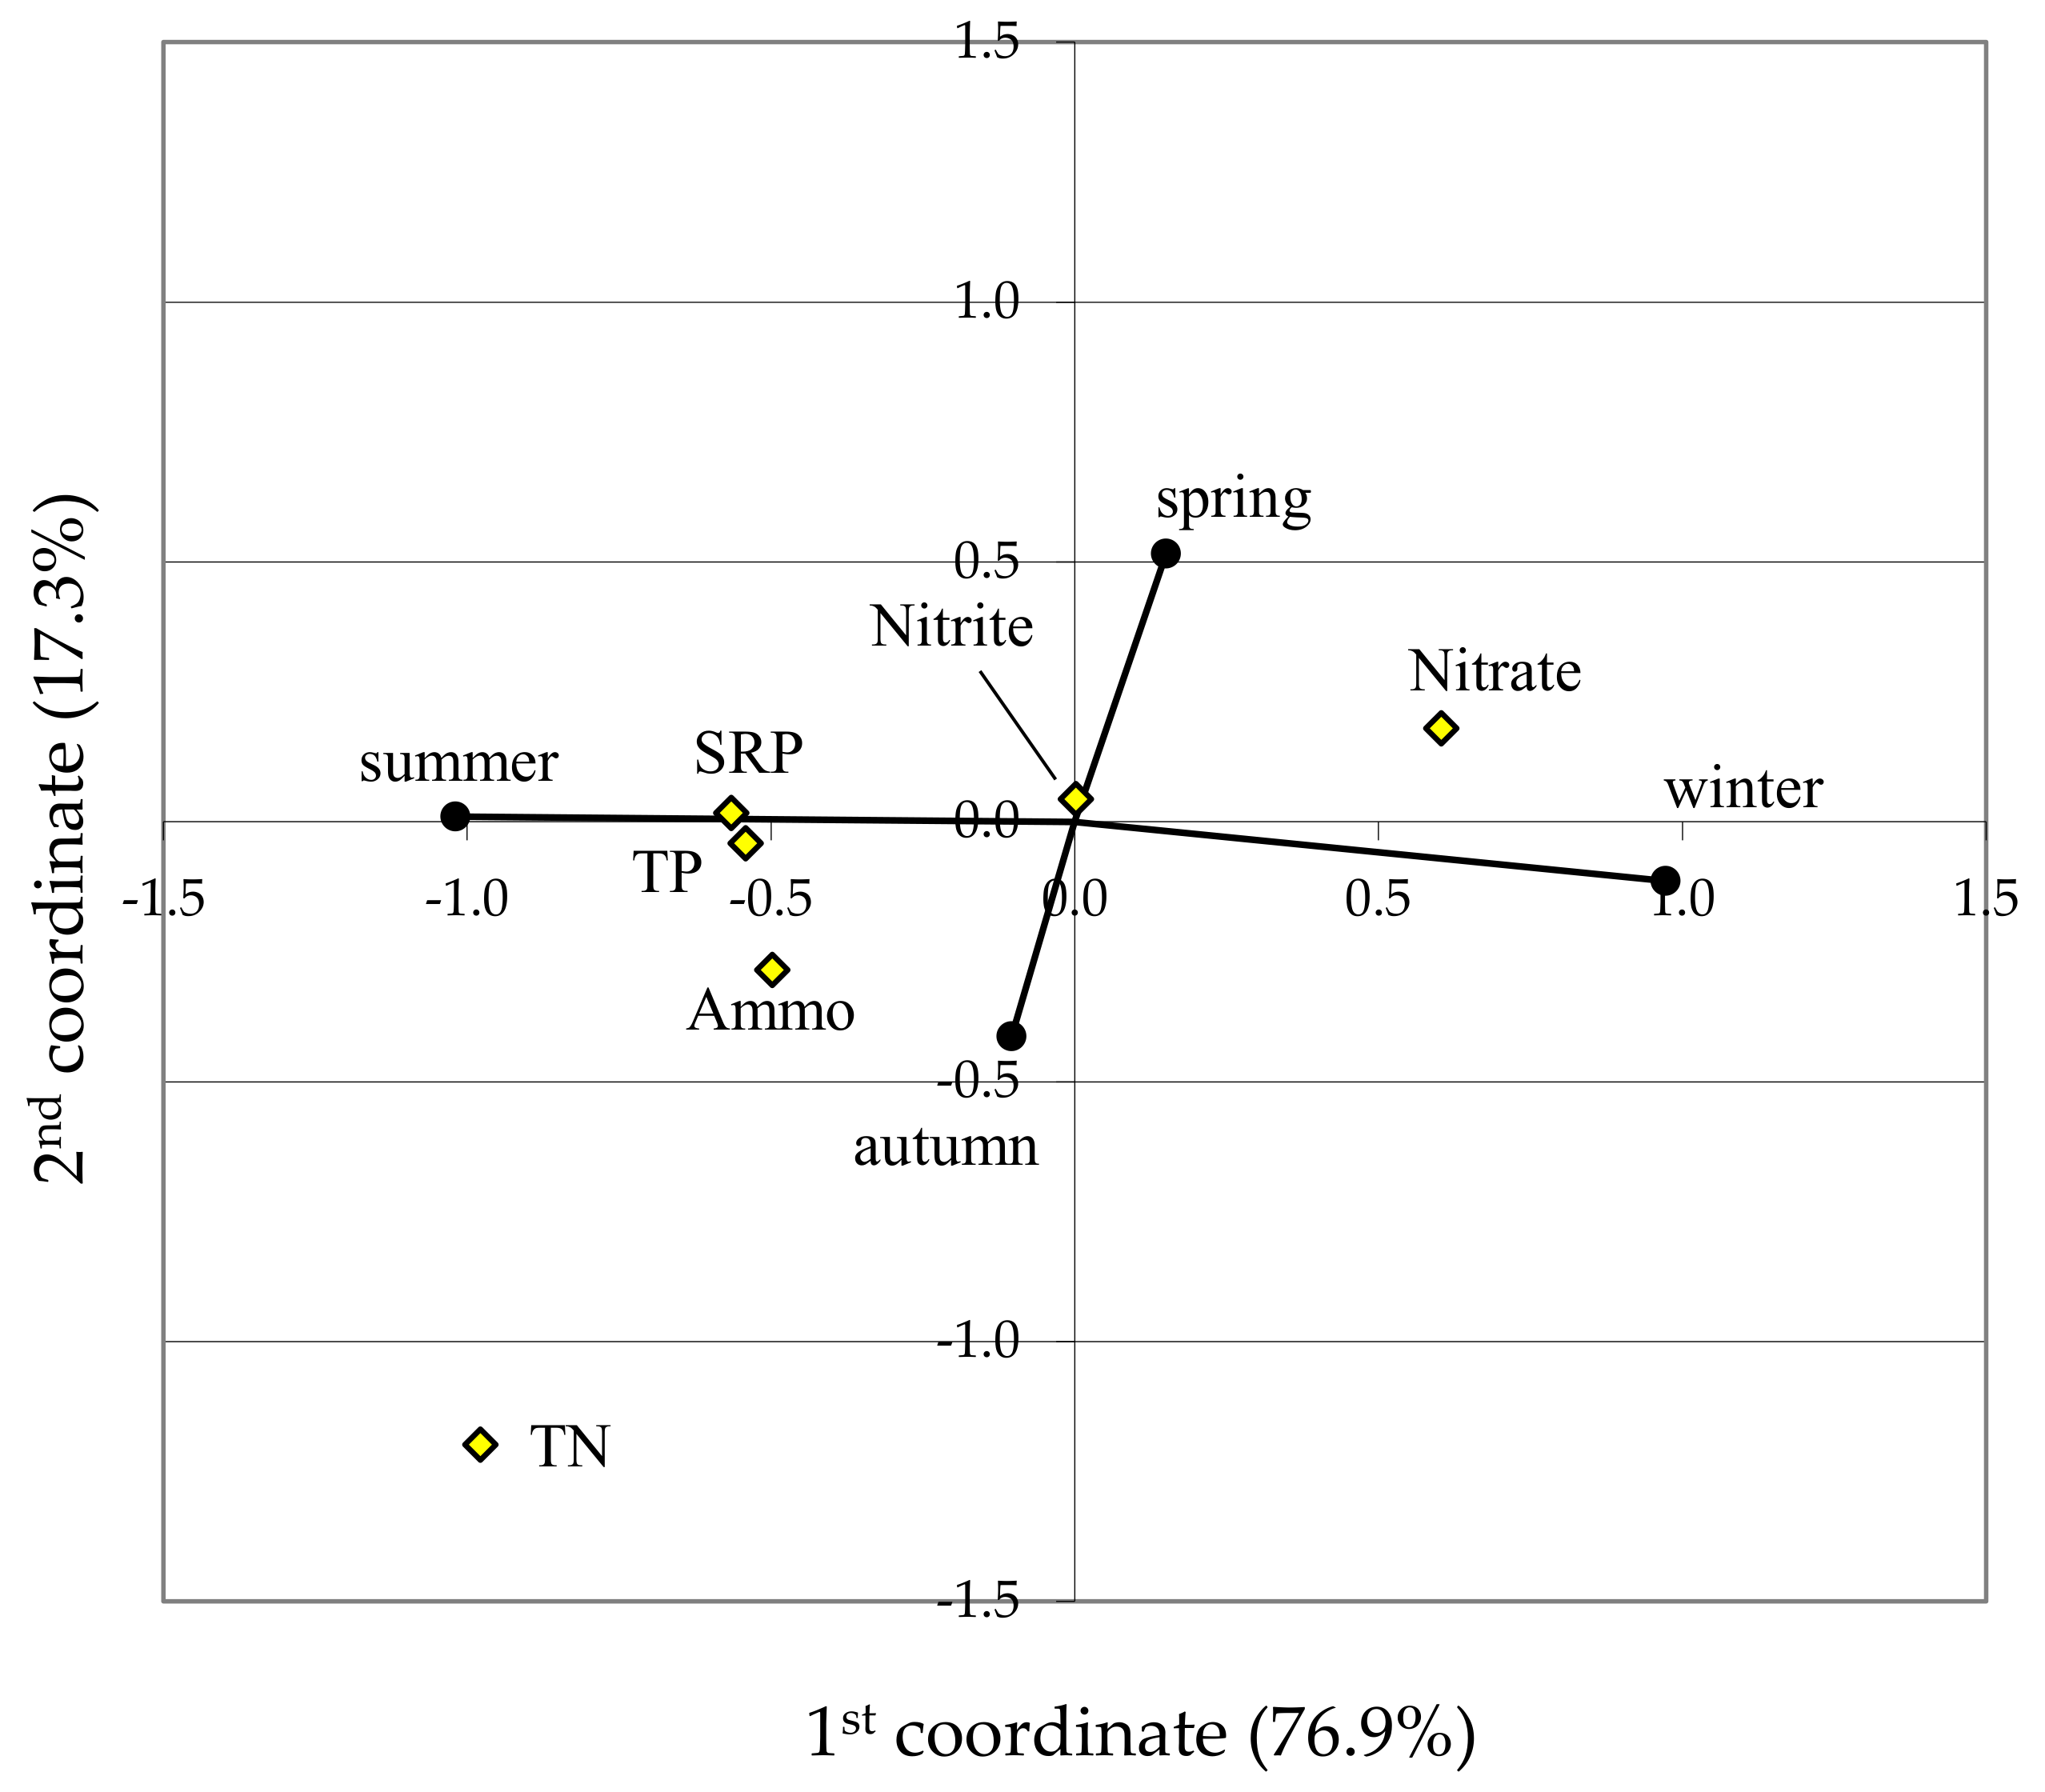
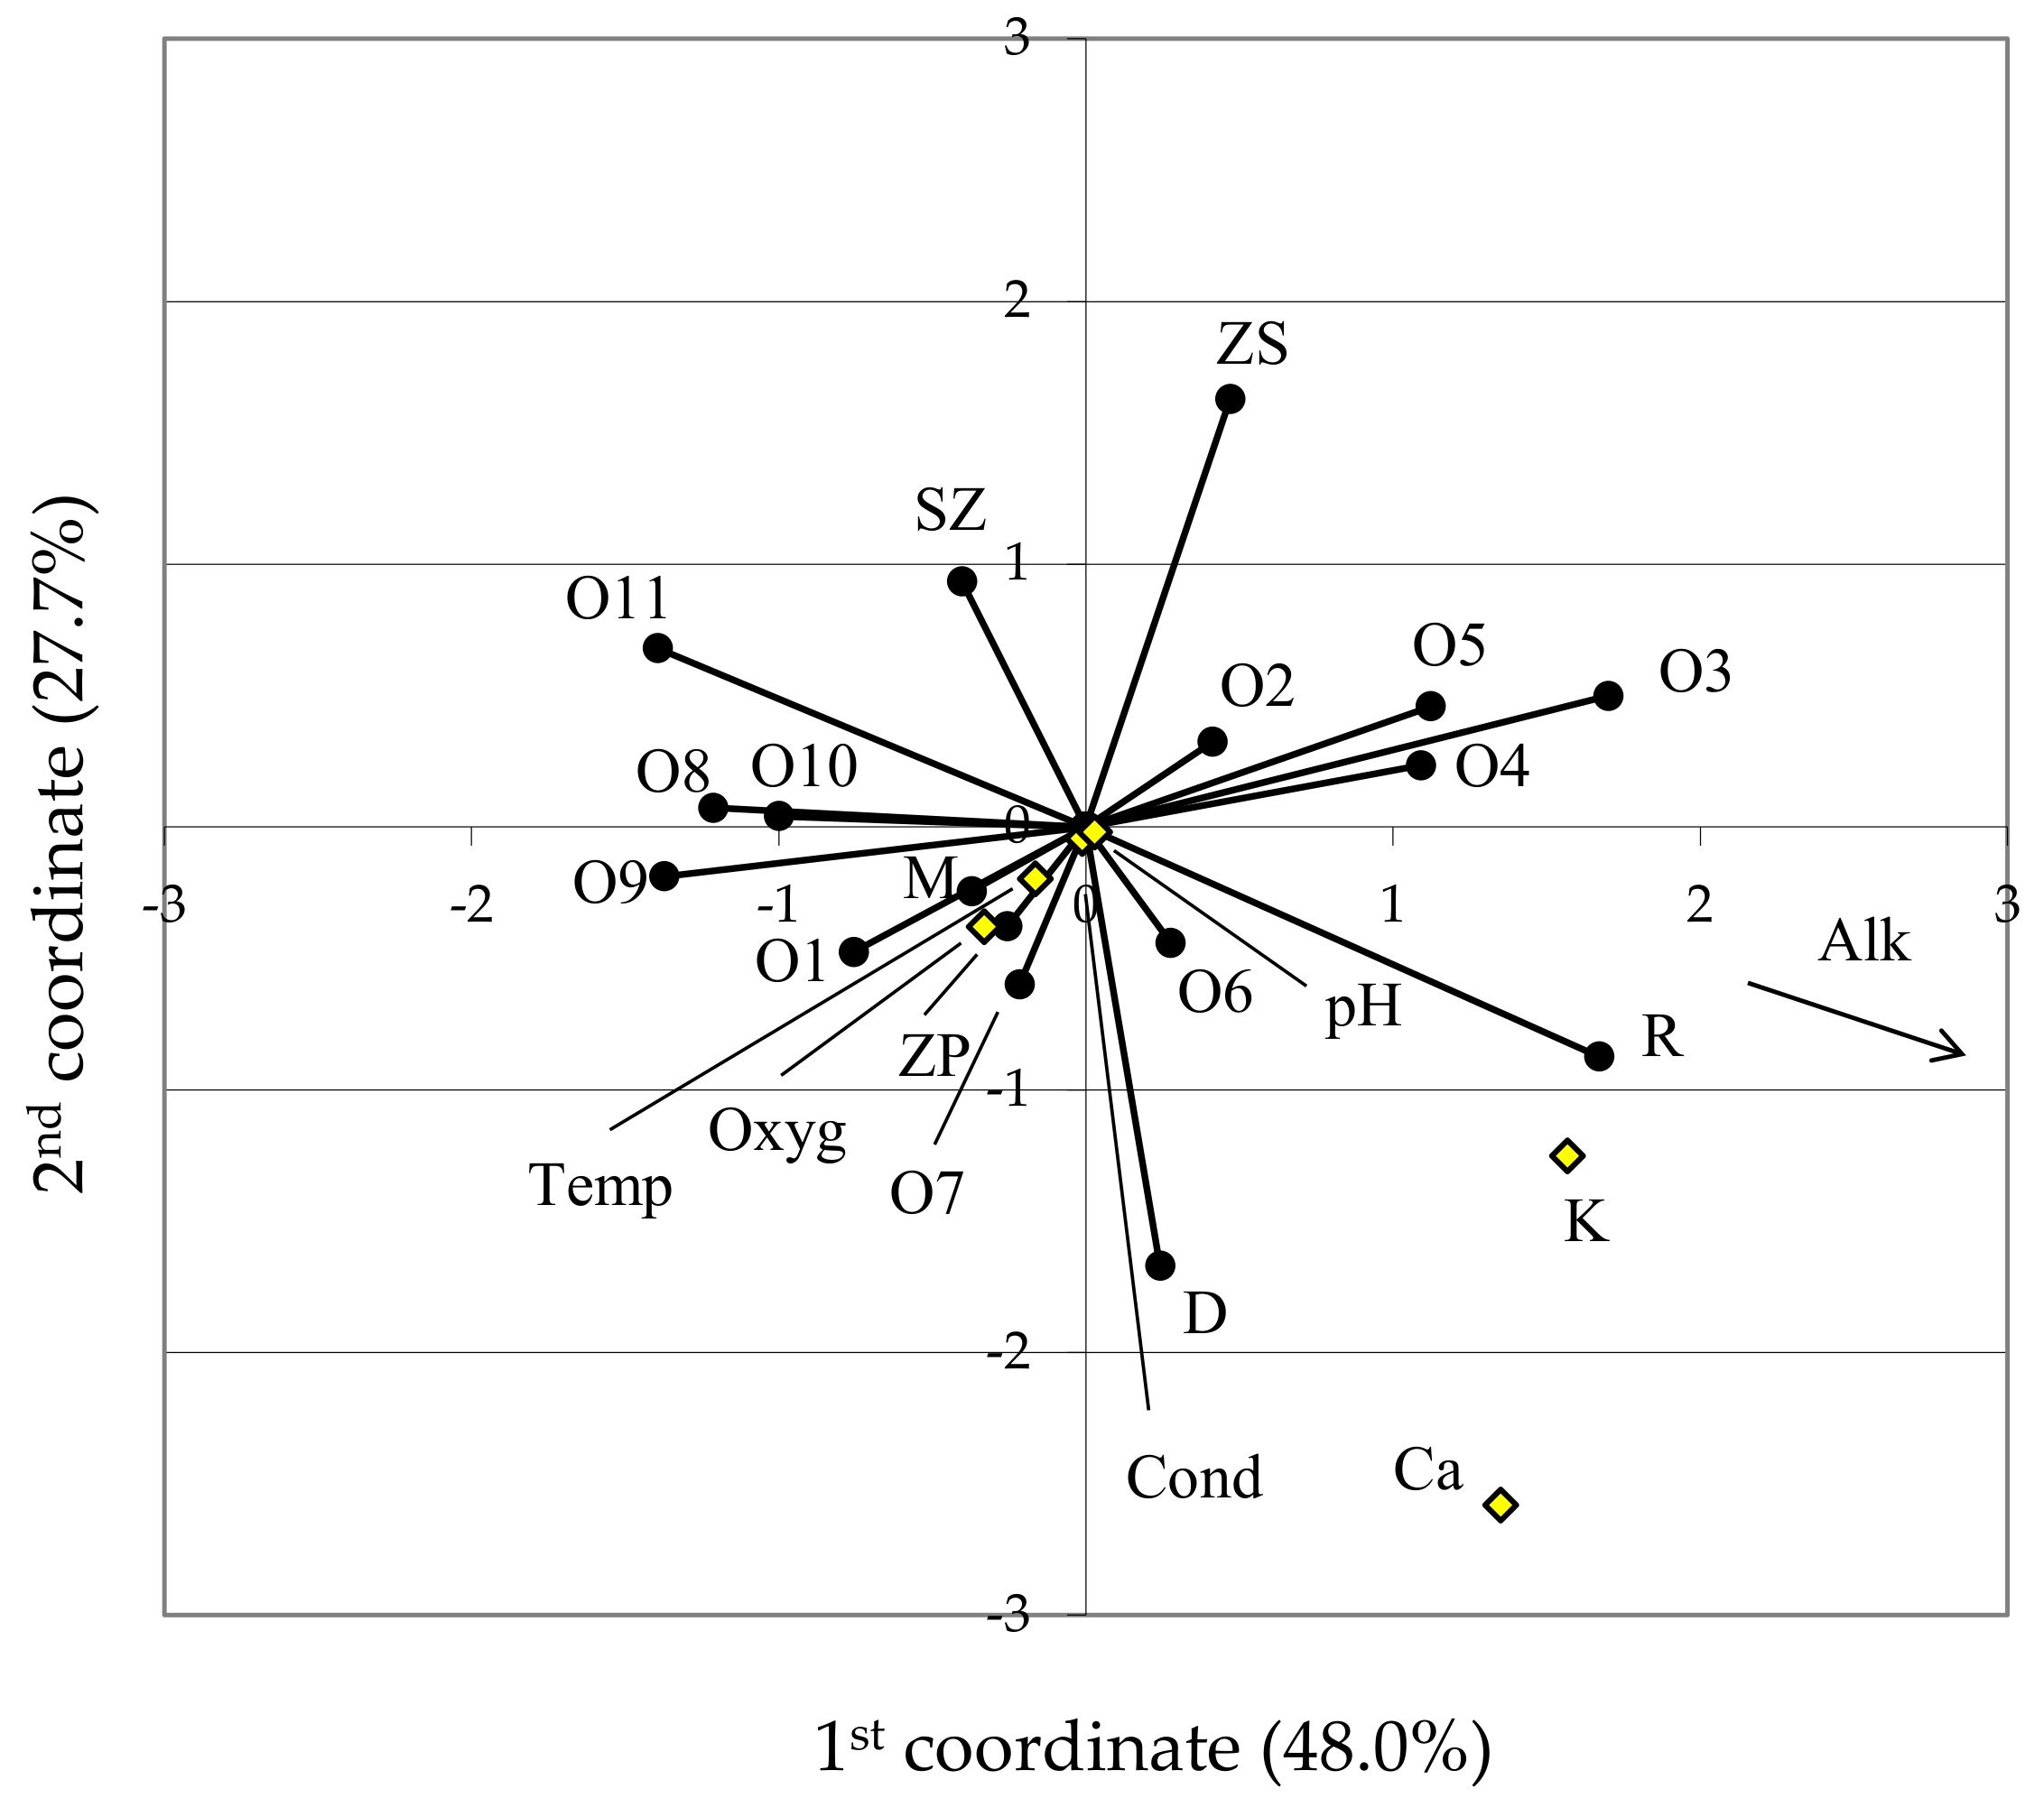
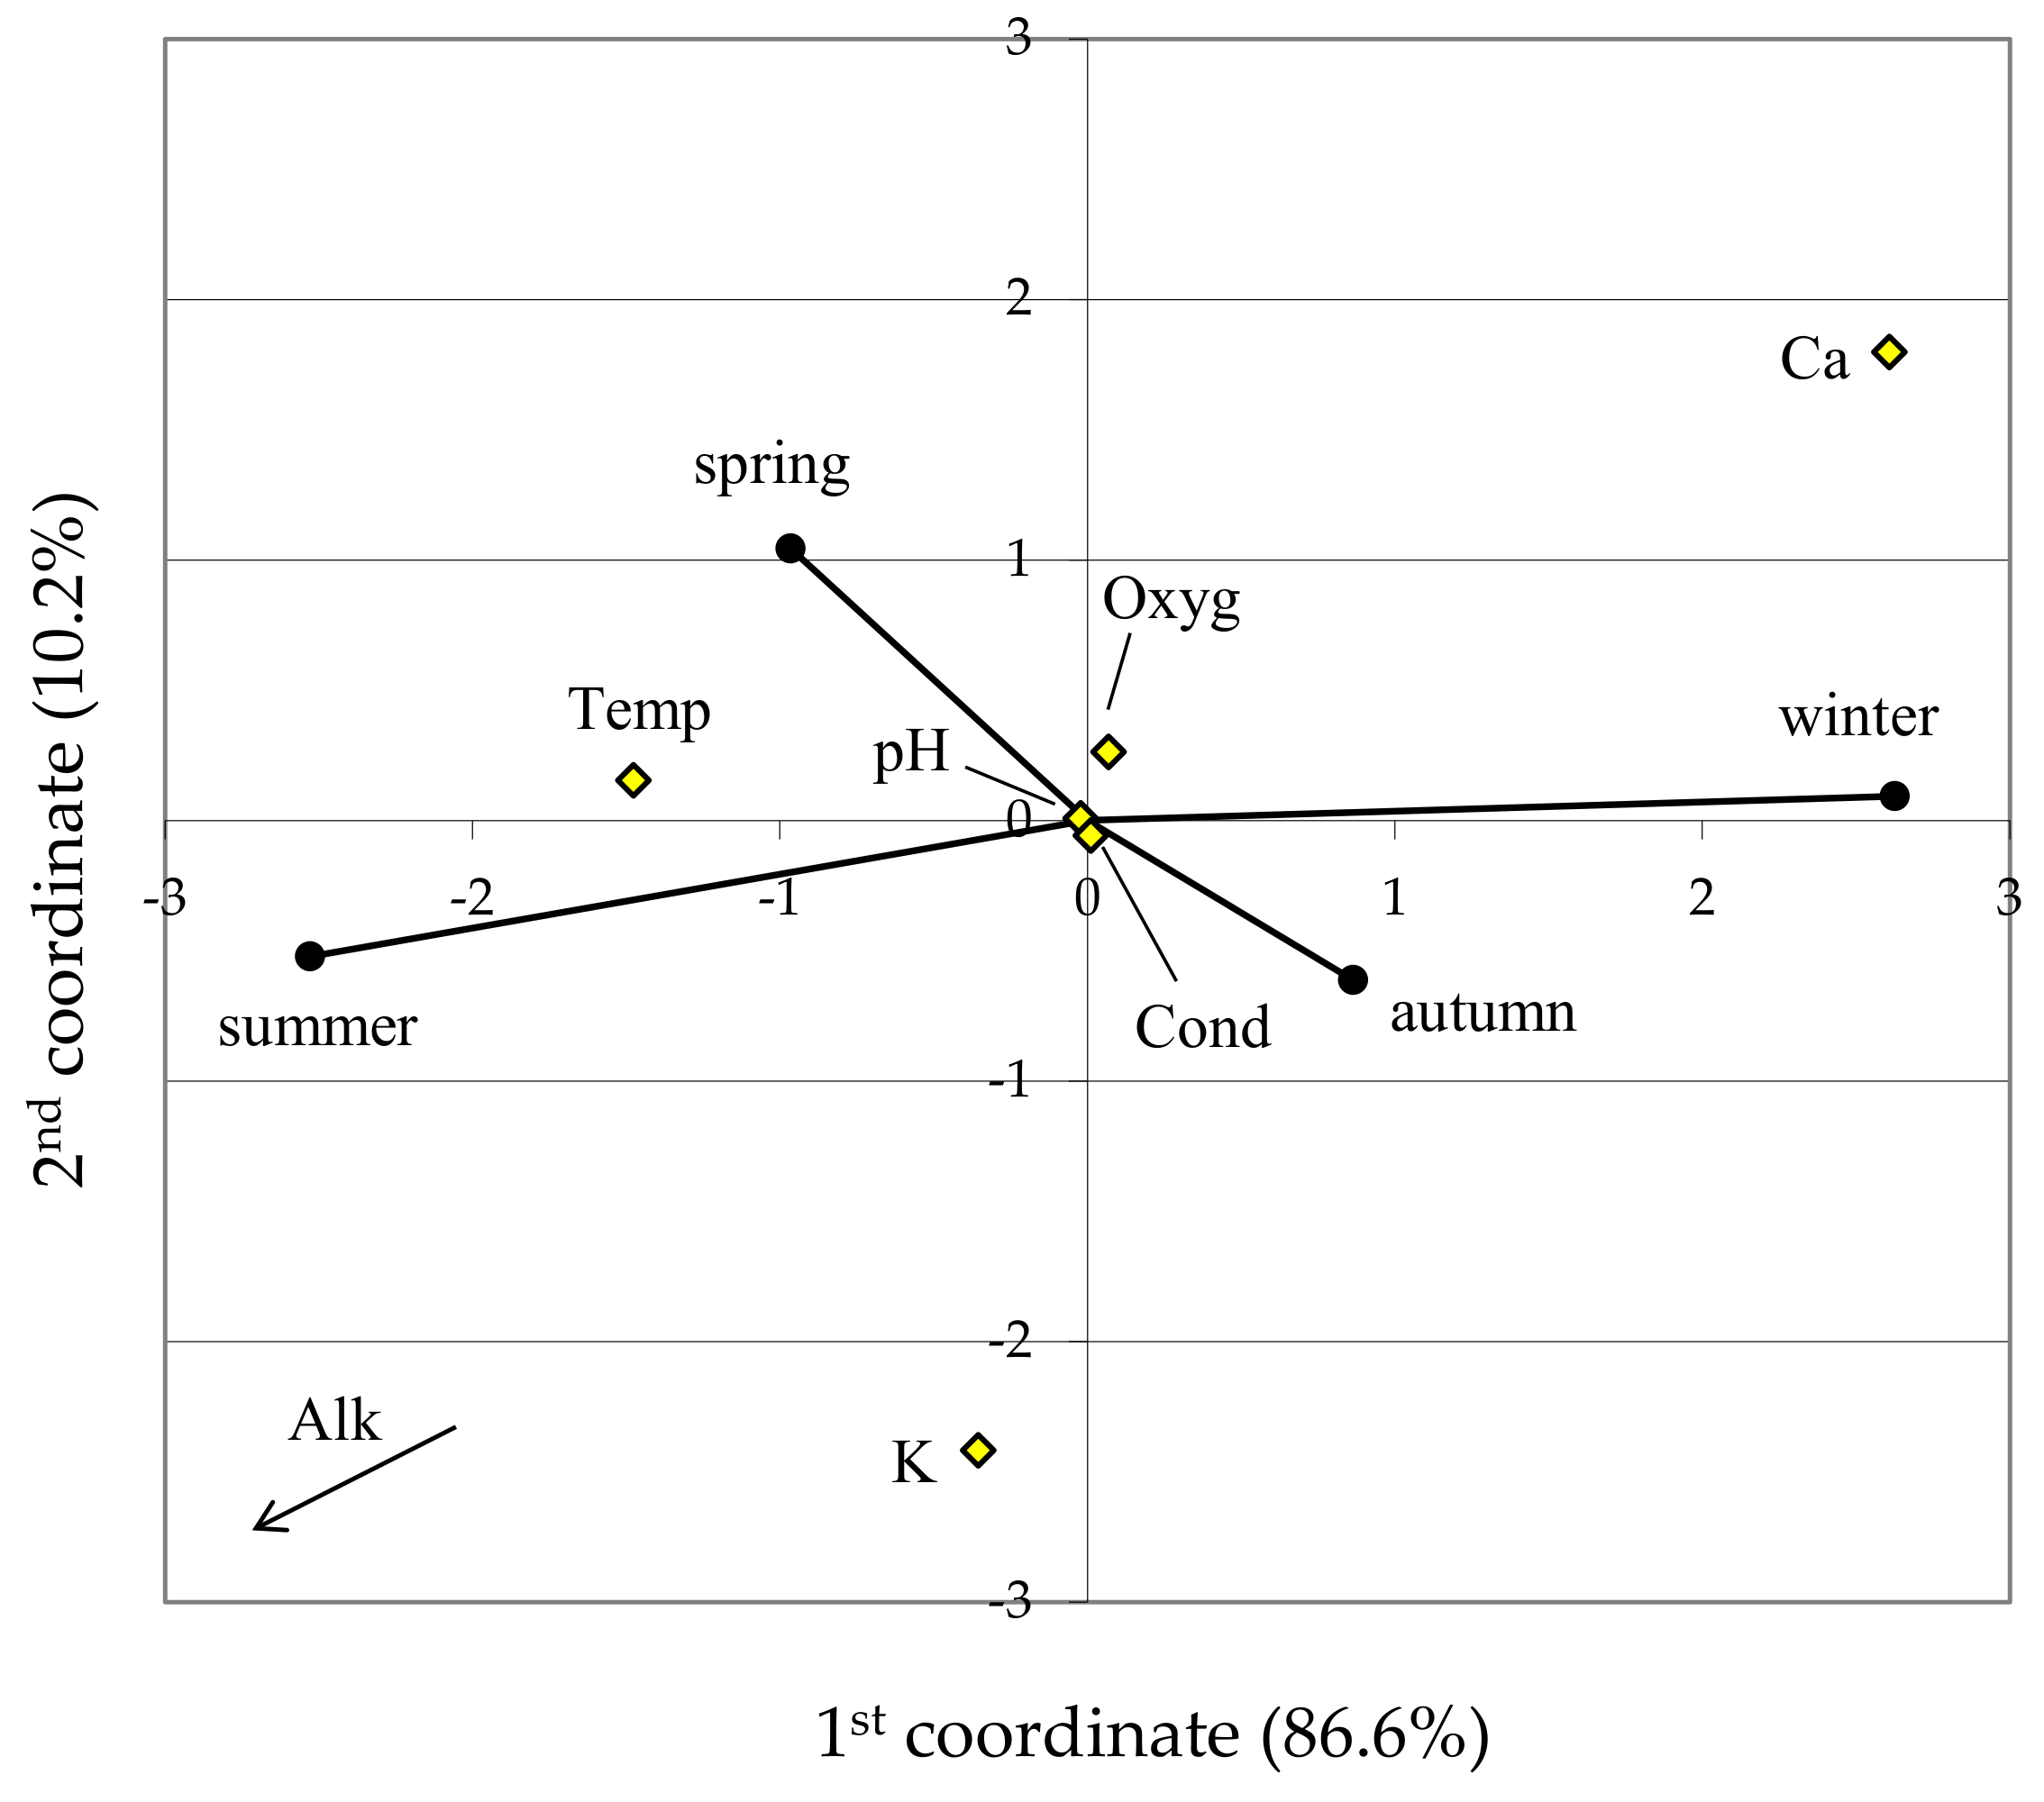
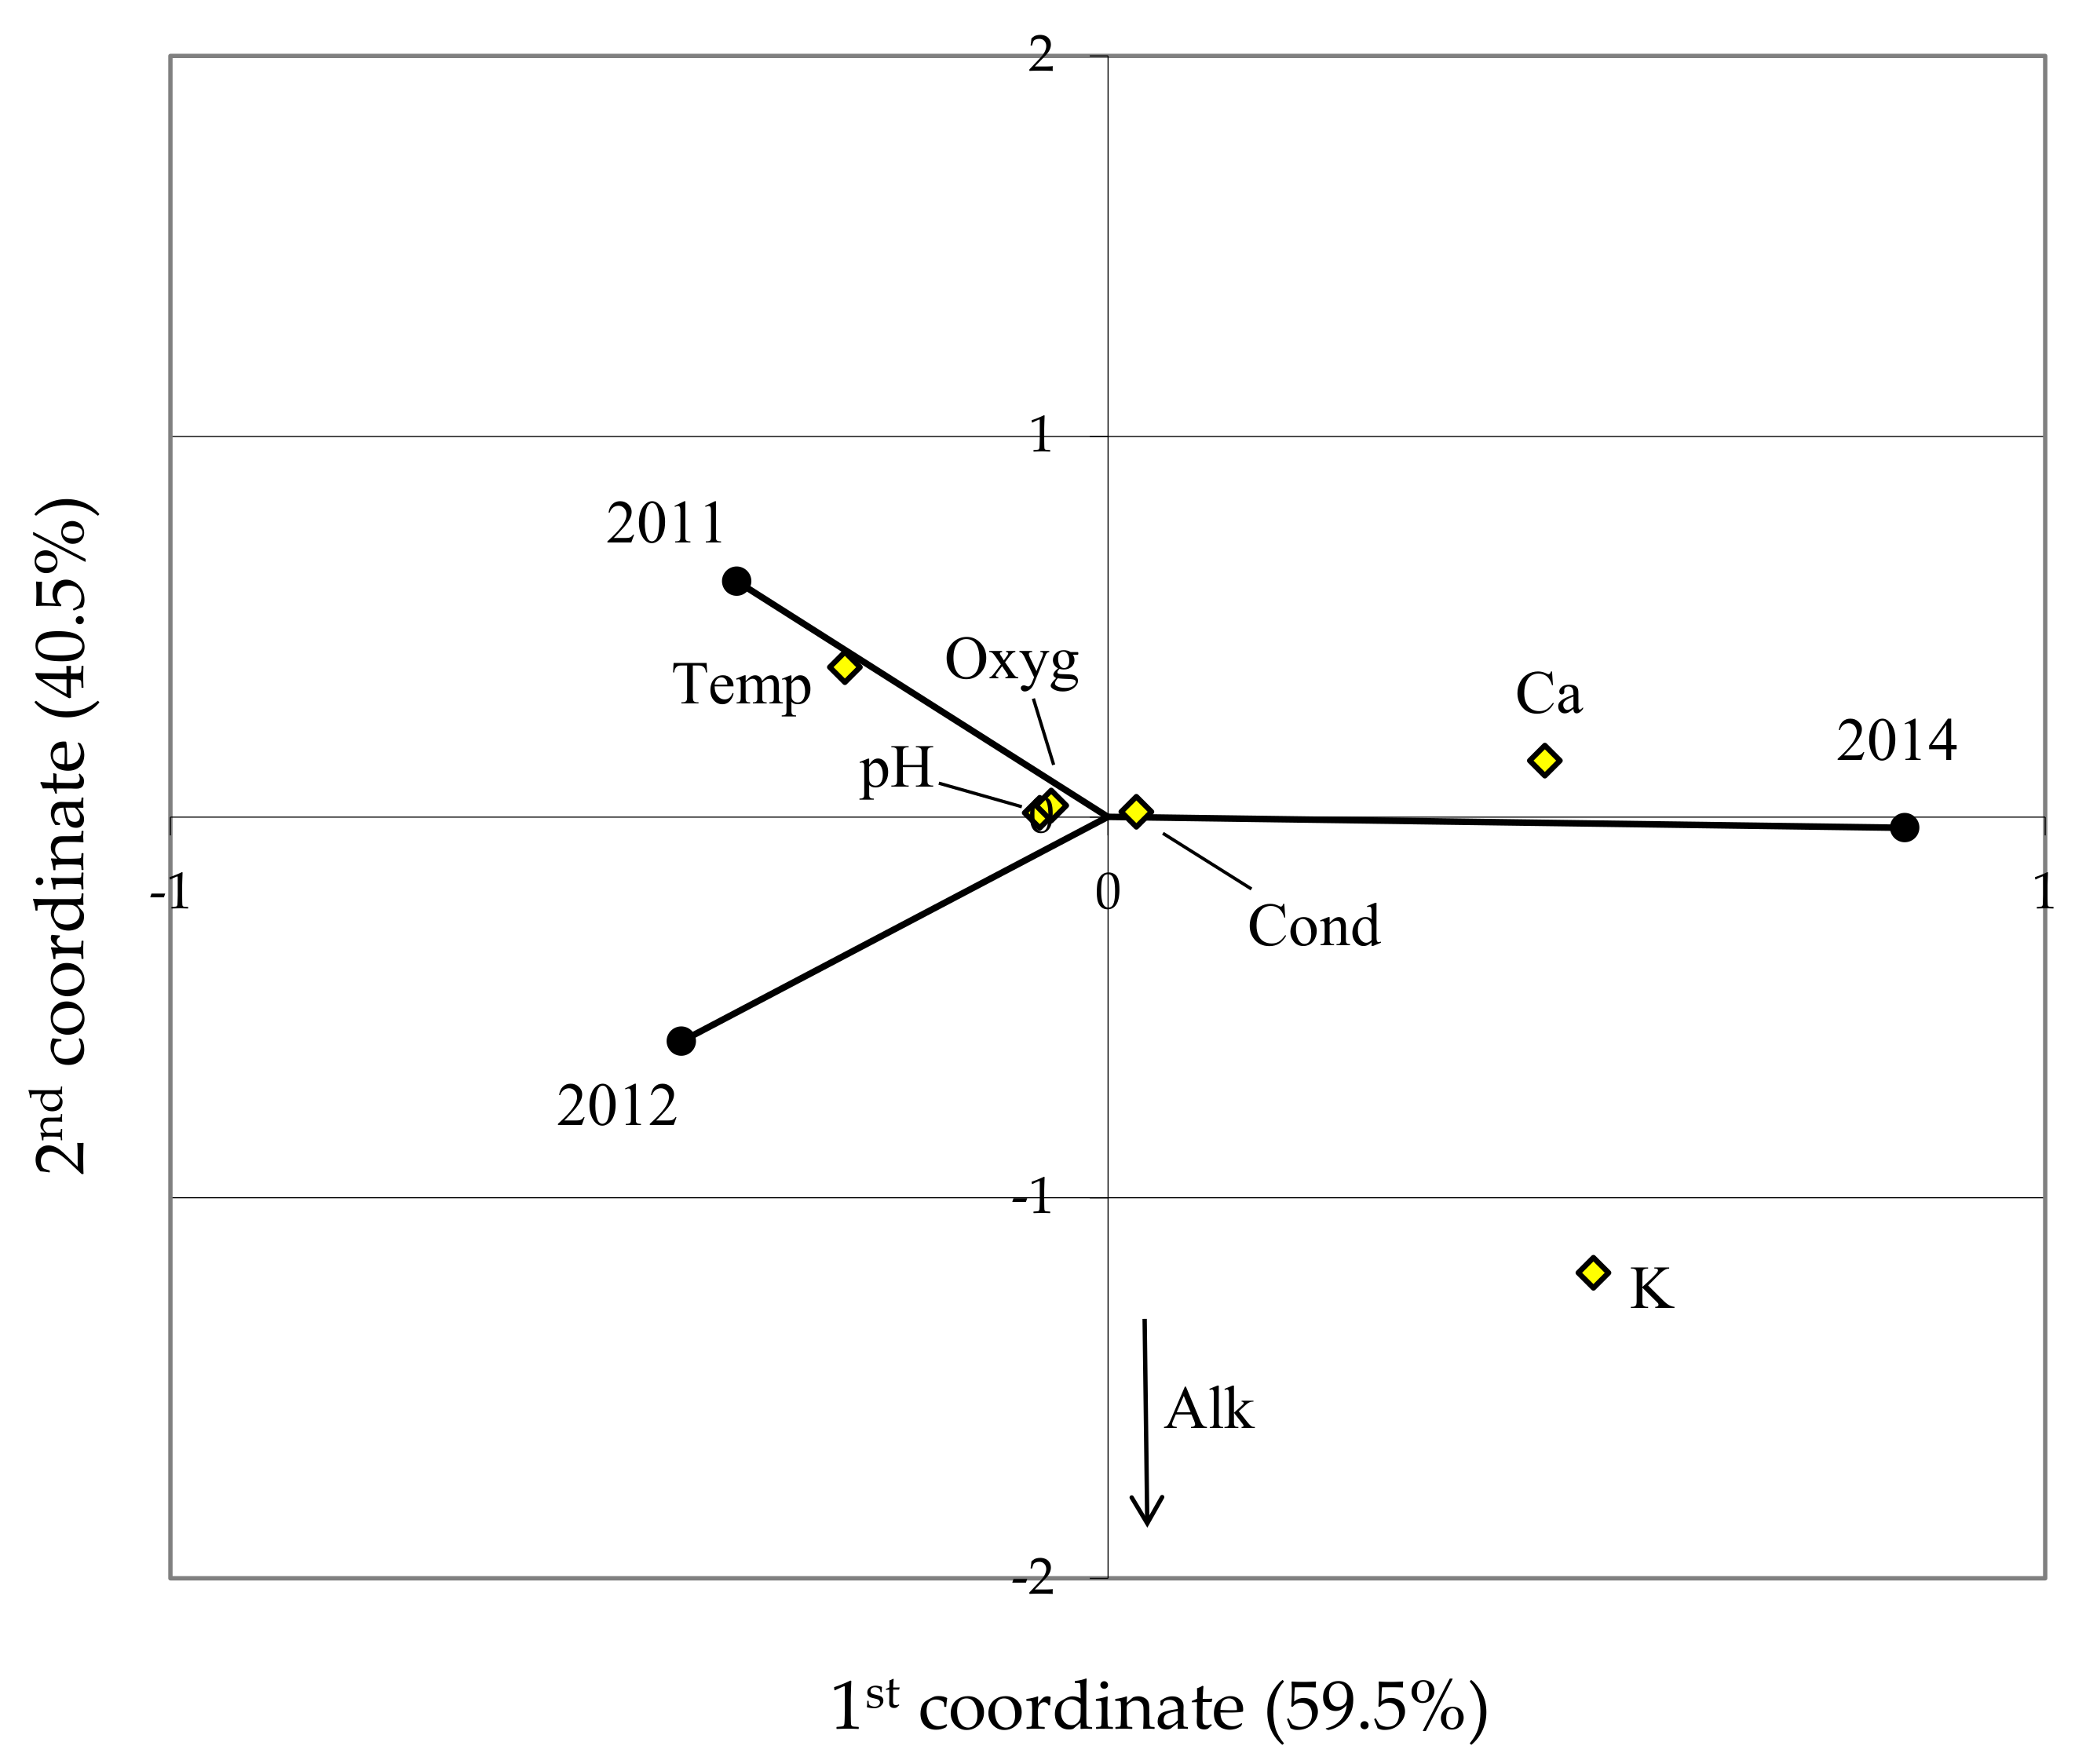
Table 1.
List of control sites.
| River Code | River Name | Site Name | Latitude (N) | Longitude (E) |
|---|---|---|---|---|
| O1 | Orla | Koźminiec | 51°49′18.02″ | 17°36′02.28″ |
| O2 | Orla | Wyki | 51°49′34.17″ | 17°33′45.33″ |
| O3 | Orla | Staniew | 51°49′25.46″ | 17°24′37.17″ |
| O4 | Orla | Skałów | 51°48′19.05″ | 17°22′58.75″ |
| O5 | Orla | Unisław | 51°46′20.03″ | 17°21′55.04″ |
| O6 | Orla | Kuklinów | 51°44′11.55″ | 17°19′00.41″ |
| O7 | Orla | Baszków | 51°41′38.46″ | 17°15′40.90″ |
| O8 | Orla | Dubin | 51°37′23.46″ | 17°08′12.59″ |
| O9 | Orla | Sowy | 51°35′24.06″ | 17°02′30.13″ |
| O10 | Orla | Chodlewo | 51°32′37.77″ | 16°49′54.98″ |
| O11 | Orla | Wąsosz | 51°33′49.33″ | 16°41′34.36″ |
| R | Radęca | Wyganów | 51°43′57.41″ | 17°16′12.92″ |
| SZ | Szpatnica | Dębionka | 51°34′51.15″ | 16°59′23.71″ |
| D | Dąbrocznia | Stwolno | 51°36′05.41″ | 16°55′55.24″ |
| M | Masłówka | Żylice | 51°37′37.83″ | 16°47′50.18″ |
| ZP | Żydowski Potok | Baszków | 51°41′33.70″ | 17°15′49.71″ |
| ZS | Żylicka Struga | Żylice | 51°37′50.34″ | 16°49′35.25″ |
Table 2.
Summary of methods used to determine individual chemical parameters.
| No. | Parameter | Unit | Method | Source |
|---|---|---|---|---|
| 1 | Temperature | °C | in situ (Elmetron CC-401) | [30] |
| 2 | pH | - | potentiometry | [30]; (PN-C-04540-01:1990) |
| 3 | Conductivity (EC) | mS·cm−1 | Electrochemical resistance | [30]; (PN-EN 27888:1999) |
| 4 | Alkalinity | mg CaCO3·dm−3 | Potentiometric titration | [30]; (PN-EN ISO 9963-1:2001/Ap1:2004) |
| 5 | Dissolved oxygen (DO) | mg O2·dm−3 | sensor method | [30]; (PN-EN 25814:1999) |
| 6 | Nitrite nitrogen | mg N-NO2·dm−3 | colorimetry | [30]; (PN-EN 26777:1999) |
| 7 | Nitrate nitrogen | mg N-NO3·dm−3 | colorimetry | [30]; (PN-EN ISO 13395:2001) |
| 8 | Ammonium nitrogen | mg N-NH3·dm−3 | colorimetry | [30]; (PN-ISO 7150-1:2002) |
| 9 | Organic nitrogen | mg N-NH3·dm−3 | Kjeldahl method | [30]; (PN-ISO 7150-1:2002) |
| 10 | Total nitrogen (TN) | mg N·dm−3 | Total Kjeldahl nitrogen (Norg + N-NH4), nitrite nitrogen and nitrate nitrogen | [30]; (PB-23:2006 with the use of PN-C-04576-14:1973) |
| 11 | Phosphates (SRP) | mg PO4·dm−3 | colorimetry | [30]; (PN-EN ISO 6878:2006) |
| 12 | Total phosphorus (TP) | mg P·dm−3 | colorimetry | [30]; (PN-EN ISO 15681-2: 2006) |
| 13 | Potassium | mg K·dm−3 | flame photometry | [31] |
| 14 | Calcium | mg Ca·dm−3 | Complexometric titration | [32] |
Table 3.
Area of livestock buildings and their share in the buffer area.
| River Code | 1 km Buffer | 3 km Buffer | ||
|---|---|---|---|---|
| Area of Buildings [m2] | Share in the Buffer [%] | Area of Buildings [m2] | Share in the Buffer [%] | |
| ZS | 58,801 | 1.87 | 69,193 | 0.24 |
| ZP | 0 | 0.00 | 10,535 | 0.04 |
| SZ | 0 | 0.00 | 37,444 | 0.13 |
| R | 2631 | 0.08 | 11,715 | 0.04 |
| O9 | 0 | 0.00 | 2786 | 0.01 |
| O8 | 3490 | 0.11 | 4399 | 0.02 |
| O7 | 0 | 0.00 | 9310 | 0.03 |
| O6 | 8825 | 0.28 | 19,849 | 0.07 |
| O5 | 0 | 0.00 | 8770 | 0.03 |
| O4 | 552 | 0.02 | 2231 | 0.01 |
| O3 | 3336 | 0.11 | 6652 | 0.02 |
| O2 | 262 | 0.01 | 4403 | 0.02 |
| O11 | 0 | 0.00 | 5751 | 0.02 |
| O10 | 0 | 0.00 | 111 | 0.00 |
| O1 | 366 | 0.01 | 3787 | 0.01 |
| M | 0 | 0.00 | 58,801 | 0.21 |
| D | 0 | 0.00 | 36,064 | 0.13 |
Table 4.
Differences in physicochemical parameters between the mean value at individual monitoring points and the general mean.
Table 4.
Differences in physicochemical parameters between the mean value at individual monitoring points and the general mean.
| Point | pH | Temp | EC | Alk | SRP | TP | Nitrite | Nitrate | Ammo | TN | K | Ca | DO |
|---|---|---|---|---|---|---|---|---|---|---|---|---|---|
| O1 | 0.088 | 0.638 | −0.014 | −8.06 | −1.091 | −1.342 | −0.074 | 1.800 | −2.804 | −4.788 | −5.544 | 9.106 | 1.356 |
| O2 | 0.162 | −1.608 | −0.071 | 44.08 | −0.232 | −0.240 | −0.042 | 1.434 | −1.933 | −2.498 | −4.390 | 11.710 | −0.862 |
| O3 | −0.132 | −0.431 | 0.128 | 59.65 | 1.216 | 1.395 | 0.106 | −0.846 | 1.949 | 2.537 | 10.956 | −8.742 | −2.420 |
| O4 | −0.064 | −0.316 | 0.092 | 51.74 | 2.782 | 2.682 | −0.018 | −0.404 | 2.817 | 4.289 | 6.284 | −6.906 | −1.312 |
| O5 | 0.043 | −0.893 | 0.060 | 36.74 | 2.354 | 2.135 | 0.139 | 0.087 | 0.747 | 0.638 | 5.492 | −3.610 | −1.715 |
| O6 | 0.110 | −0.153 | 0.010 | 15.69 | 1.547 | 4.050 | −0.048 | −0.382 | −1.704 | −4.223 | 5.240 | −5.199 | 0.517 |
| R | 0.035 | −0.944 | 0.191 | 129.03 | 2.732 | 2.763 | 0.040 | −0.017 | 7.332 | 18.187 | 10.731 | 16.740 | −0.654 |
| ZP | 0.093 | 1.093 | 0.143 | 0.03 | −0.633 | −1.510 | 0.071 | 0.496 | 0.501 | 0.788 | −1.708 | 6.011 | 0.709 |
| O7 | 0.075 | 0.764 | 0.001 | 7.57 | −0.209 | −0.224 | −0.016 | −0.075 | −2.350 | −6.157 | 1.073 | 2.865 | 1.008 |
| O8 | 0.034 | 1.024 | −0.140 | −80.07 | −2.150 | −2.756 | −0.019 | 0.071 | −2.299 | −6.442 | −4.529 | −14.224 | 1.343 |
| O9 | 0.191 | 1.024 | −0.148 | −74.79 | −2.465 | −3.032 | −0.062 | −0.443 | −2.555 | −7.386 | −5.756 | −13.177 | 1.989 |
| SZ | −0.198 | −0.598 | −0.120 | −49.51 | −1.918 | −2.377 | −0.055 | −0.346 | −0.359 | −2.363 | −5.579 | −2.697 | −0.986 |
| D | 0.123 | 1.429 | 0.142 | 38.75 | −0.890 | −0.821 | 0.046 | 0.040 | −0.363 | −1.504 | 9.286 | 22.636 | 1.486 |
| M | −0.127 | −0.832 | 0.049 | −4.38 | −0.494 | −1.241 | −0.065 | 0.496 | −0.579 | −2.571 | −3.794 | 18.931 | 0.410 |
| O10 | 0.013 | 0.706 | −0.070 | −83.89 | −2.352 | −2.818 | −0.085 | −0.469 | −2.745 | −6.258 | −1.314 | −17.534 | 1.246 |
| O11 | 0.029 | 0.318 | −0.261 | −99.31 | −2.465 | −2.763 | −0.062 | −0.271 | −2.634 | −6.243 | −8.908 | −16.836 | 0.747 |
| ZS | −0.477 | −1.222 | 0.009 | 16.74 | 4.270 | 6.100 | 0.144 | −1.171 | 6.979 | 23.995 | −7.540 | 0.925 | −2.864 |
| mean | 7.614 | 13.11 | 0.932 | 309.10 | 3.056 | 4.200 | 0.176 | 3.679 | 3.291 | 14.30 | 20.883 | 120.980 | 4.600 |
Publisher’s Note: MDPI stays neutral with regard to jurisdictional claims in published maps and institutional affiliations. |
© 2022 by the authors. Licensee MDPI, Basel, Switzerland. This article is an open access article distributed under the terms and conditions of the Creative Commons Attribution (CC BY) license (https://creativecommons.org/licenses/by/4.0/).
Share and Cite
MDPI and ACS Style
Kupiec, J.M.; Staniszewski, R.; Kayzer, D. Assessment of Water Quality Indicators in the Orla River Nitrate Vulnerable Zone in the Context of New Threats in Poland. Water 2022, 14, 2287. https://doi.org/10.3390/w14152287
AMA Style
Kupiec JM, Staniszewski R, Kayzer D. Assessment of Water Quality Indicators in the Orla River Nitrate Vulnerable Zone in the Context of New Threats in Poland. Water. 2022; 14(15):2287. https://doi.org/10.3390/w14152287
Chicago/Turabian StyleKupiec, Jerzy Mirosław, Ryszard Staniszewski, and Dariusz Kayzer. 2022. "Assessment of Water Quality Indicators in the Orla River Nitrate Vulnerable Zone in the Context of New Threats in Poland" Water 14, no. 15: 2287. https://doi.org/10.3390/w14152287
Note that from the first issue of 2016, this journal uses article numbers instead of page numbers. See further details here.