Article

Monitoring Duckweeds (Lemna minor) in Small Rivers Using Sentinel-2 Satellite Imagery: Application of Vegetation and Water Indices to the Lis River (Portugal)

by
Romeu Gerardo
1,2 and
Isabel P. de Lima
1,2,*
1
University of Coimbra, Faculty of Sciences and Technology, Department of Civil Engineering, Rua Luís Reis Santos, 3030-788 Coimbra, Portugal
2
MARE—Marine and Environmental Sciences Centre/ARNET—Aquatic Research Network, University of Coimbra, 3030-788 Coimbra, Portugal
*
Author to whom correspondence should be addressed.
Water 2022, 14(15), 2284; https://doi.org/10.3390/w14152284
Submission received: 14 June 2022 / Revised: 10 July 2022 / Accepted: 19 July 2022 / Published: 22 July 2022
(This article belongs to the Special Issue Application of Remote Sensing Technology to Water-Related Ecosystems)

Abstract

:
Duckweed species, particularly Lemna minor, are widely found in freshwaters all over the world. This macrophyte provides multiple ecosystems’ functions and services, but its excessive proliferation can have negative environmental impacts (including ecological and socio-economic impacts). This work explores the use of remote sensing tools for mapping the dynamics of Lemna minor in open watercourses, which could contribute to identifying suitable monitoring programs and integrated management practices. The study focuses on a selected section of the Lis River (Portugal), a small river that is often affected by water pollution. The study approach uses spatiotemporal multispectral data from the Sentinel-2 satellite and from 2021 and investigates the potential of remote sensing-based vegetation and water indices (Normalized Difference Vegetation Index (NDVI), Green Normalized Difference Vegetation Index (GNDVI), Normalized Difference Aquatic Vegetation Index (NDAVI), Green Red Vegetation Index (GRVI), Normalized Difference Water Index (NDWI)) for detecting duckweeds’ infestation and its severity. The NDAVI was identified as the vegetation index (VI) that better depicted the presence of duckweeds in the surface of the water course; however, results obtained for the other VIs are also encouraging, with NDVI showing a response that is very similar to NDAVI. Results are promising regarding the ability of remote sensing products to provide insight into the behavior of Lemna minor and to identify problematic sections along small watercourses.

1. Introduction

The sustainability of freshwater ecosystems often constitutes a major concern and requires suitable water management and ecosystems’ protection measures and practices, and adaptive processes, in particular those freshwater ecosystems that are facing increasing pressures [1]. The presence of macrophytes in freshwater ecosystems may affect their biological, chemical, and physical components and offer multiple ecosystems’ functions. Examples of this are water quality improvement (owing to their large capacity to absorb harmful substances and pollutants, e.g., nitrogen and phosphorus), inhibition of eutrophication, turbidity reduction, streambeds’ stabilization, and habitat establishment [2,3,4,5,6,7,8,9,10]. Moreover, they could constitute indicators of the trophic status of a water body [11]. Thus, as an integral part of freshwater ecosystems, macrophytes have an important role in their sustainability.
However, many macrophyte communities are characterized by very high growth rates and rapid biomass accumulation, which could be hazardous for the ecosystem. In particular, the excessive proliferation of macrophytes in seasonal sensitive ecosystems can have negative impacts on the hydro systems’ functioning and lead to modifications in the biotic interactions and disruption of the community assembly [12,13]. Such negative impacts typically include, e.g., a reduction of flow velocity and an increase of sedimentation, attenuation of light entering the water body caused by the massive coverage of the water surface by the aquatic plant, and anoxia [10,14,15,16,17].
The growth habitat of aquatic vegetation (AV) is used to classify AV as [18]: (i) emergent vegetation (its roots grow underwater but leaves and stems emerge out of water), (ii) floating vegetation (its leaves float just above the water surface), and (iii) submerged vegetation (it lives entirely below the water surface). The spatial and temporal distribution patterns of AV are influenced by interactions between many environmental factors (hydrology and hydraulics, water temperature, light, nutrients, substrate, grazing) and are often not well-known. Thus, sustainable water management and ecosystems’ protection and restauration need to be supported by data on freshwater vegetation status, for example, through relevant mapping. Thus, spatial information on, e.g., species composition, plant height, biomass, colonization depth, and coverage (i.e., percentage of the water surface occupied by vegetation), are usually targeted by monitoring programs (see, e.g., [19,20]). However, conventional field surveys of macrophyte communities are commonly hindered by limited accessibility to the infested sites [21]; moreover, when focusing on large areas, the approach is time-consuming and costly, which additionally hampers the sampling frequency. Hence, remote sensing (RS) is perceived as a valuable tool for assessing macrophyte stands and associated biophysical and ecological parameters, because this technology offers the possibility of broad spatial coverage and frequent data acquisition. These are among the main advantages of innovative RS-based approaches to monitor AV.
RS is thus identified as a powerful and effective way to monitor vegetation status, growth, and bio-physical parameters, which could complement in situ environmental measurements [22,23] and produce useful data for multi-temporal studies and for reconstructing historical time series in a cost-effective way [24,25]. RS has been widely used in vegetation monitoring in the last decades [26,27,28,29], but most of the research has focused on terrestrial vegetation. A few earlier studies dedicated to AV and freshwater ecosystems, e.g., [22,30,31], suggest that AV is not as easily detectable as terrestrial vegetation. It is expected that this limitation is likely related, at least partly, to the experimental protocols selected. RS applications for mapping and studying vegetation status and its dynamics frequently use approaches based on vegetation indices (VIs), which is justified by their flexibility, easiness of use, and the RS cross-platform consistency. The convenience and advantages of spectral VIs in large-scale mapping of dynamic phenomena have long been demonstrated in terrestrial environments, e.g., [32,33,34], and nonetheless, aquatic environments, e.g., [35,36,37]. However, one expects that further research in this field is able to shed light on the suitability of different RS-based methodological approaches and improve the application of RS products over a range of scales and for the particular conditions of freshwater environments.
This work focuses on studying the presence of the aquatic vegetation Lemna minor found in the water surface of the Lis River (Portugal), which is a small river that faces pollution problems. It aims at: (i) better understanding this particular type of infestation and (ii) exploring the use of RS products for this purpose. Sentinel-2 satellite multi-spectral data, with a spatial resolution of 10 m, are used to study the presence of AV in 2021, supported by the calculation of several multispectral-based vegetation and water indices. The performance of different VIs in mapping Lemna minor is appraised, aiming at evaluating and developing tools that could contribute to improving the understanding of the freshwater environment and identifying appropriate environmental operational management measures.

2. Materials and Methods
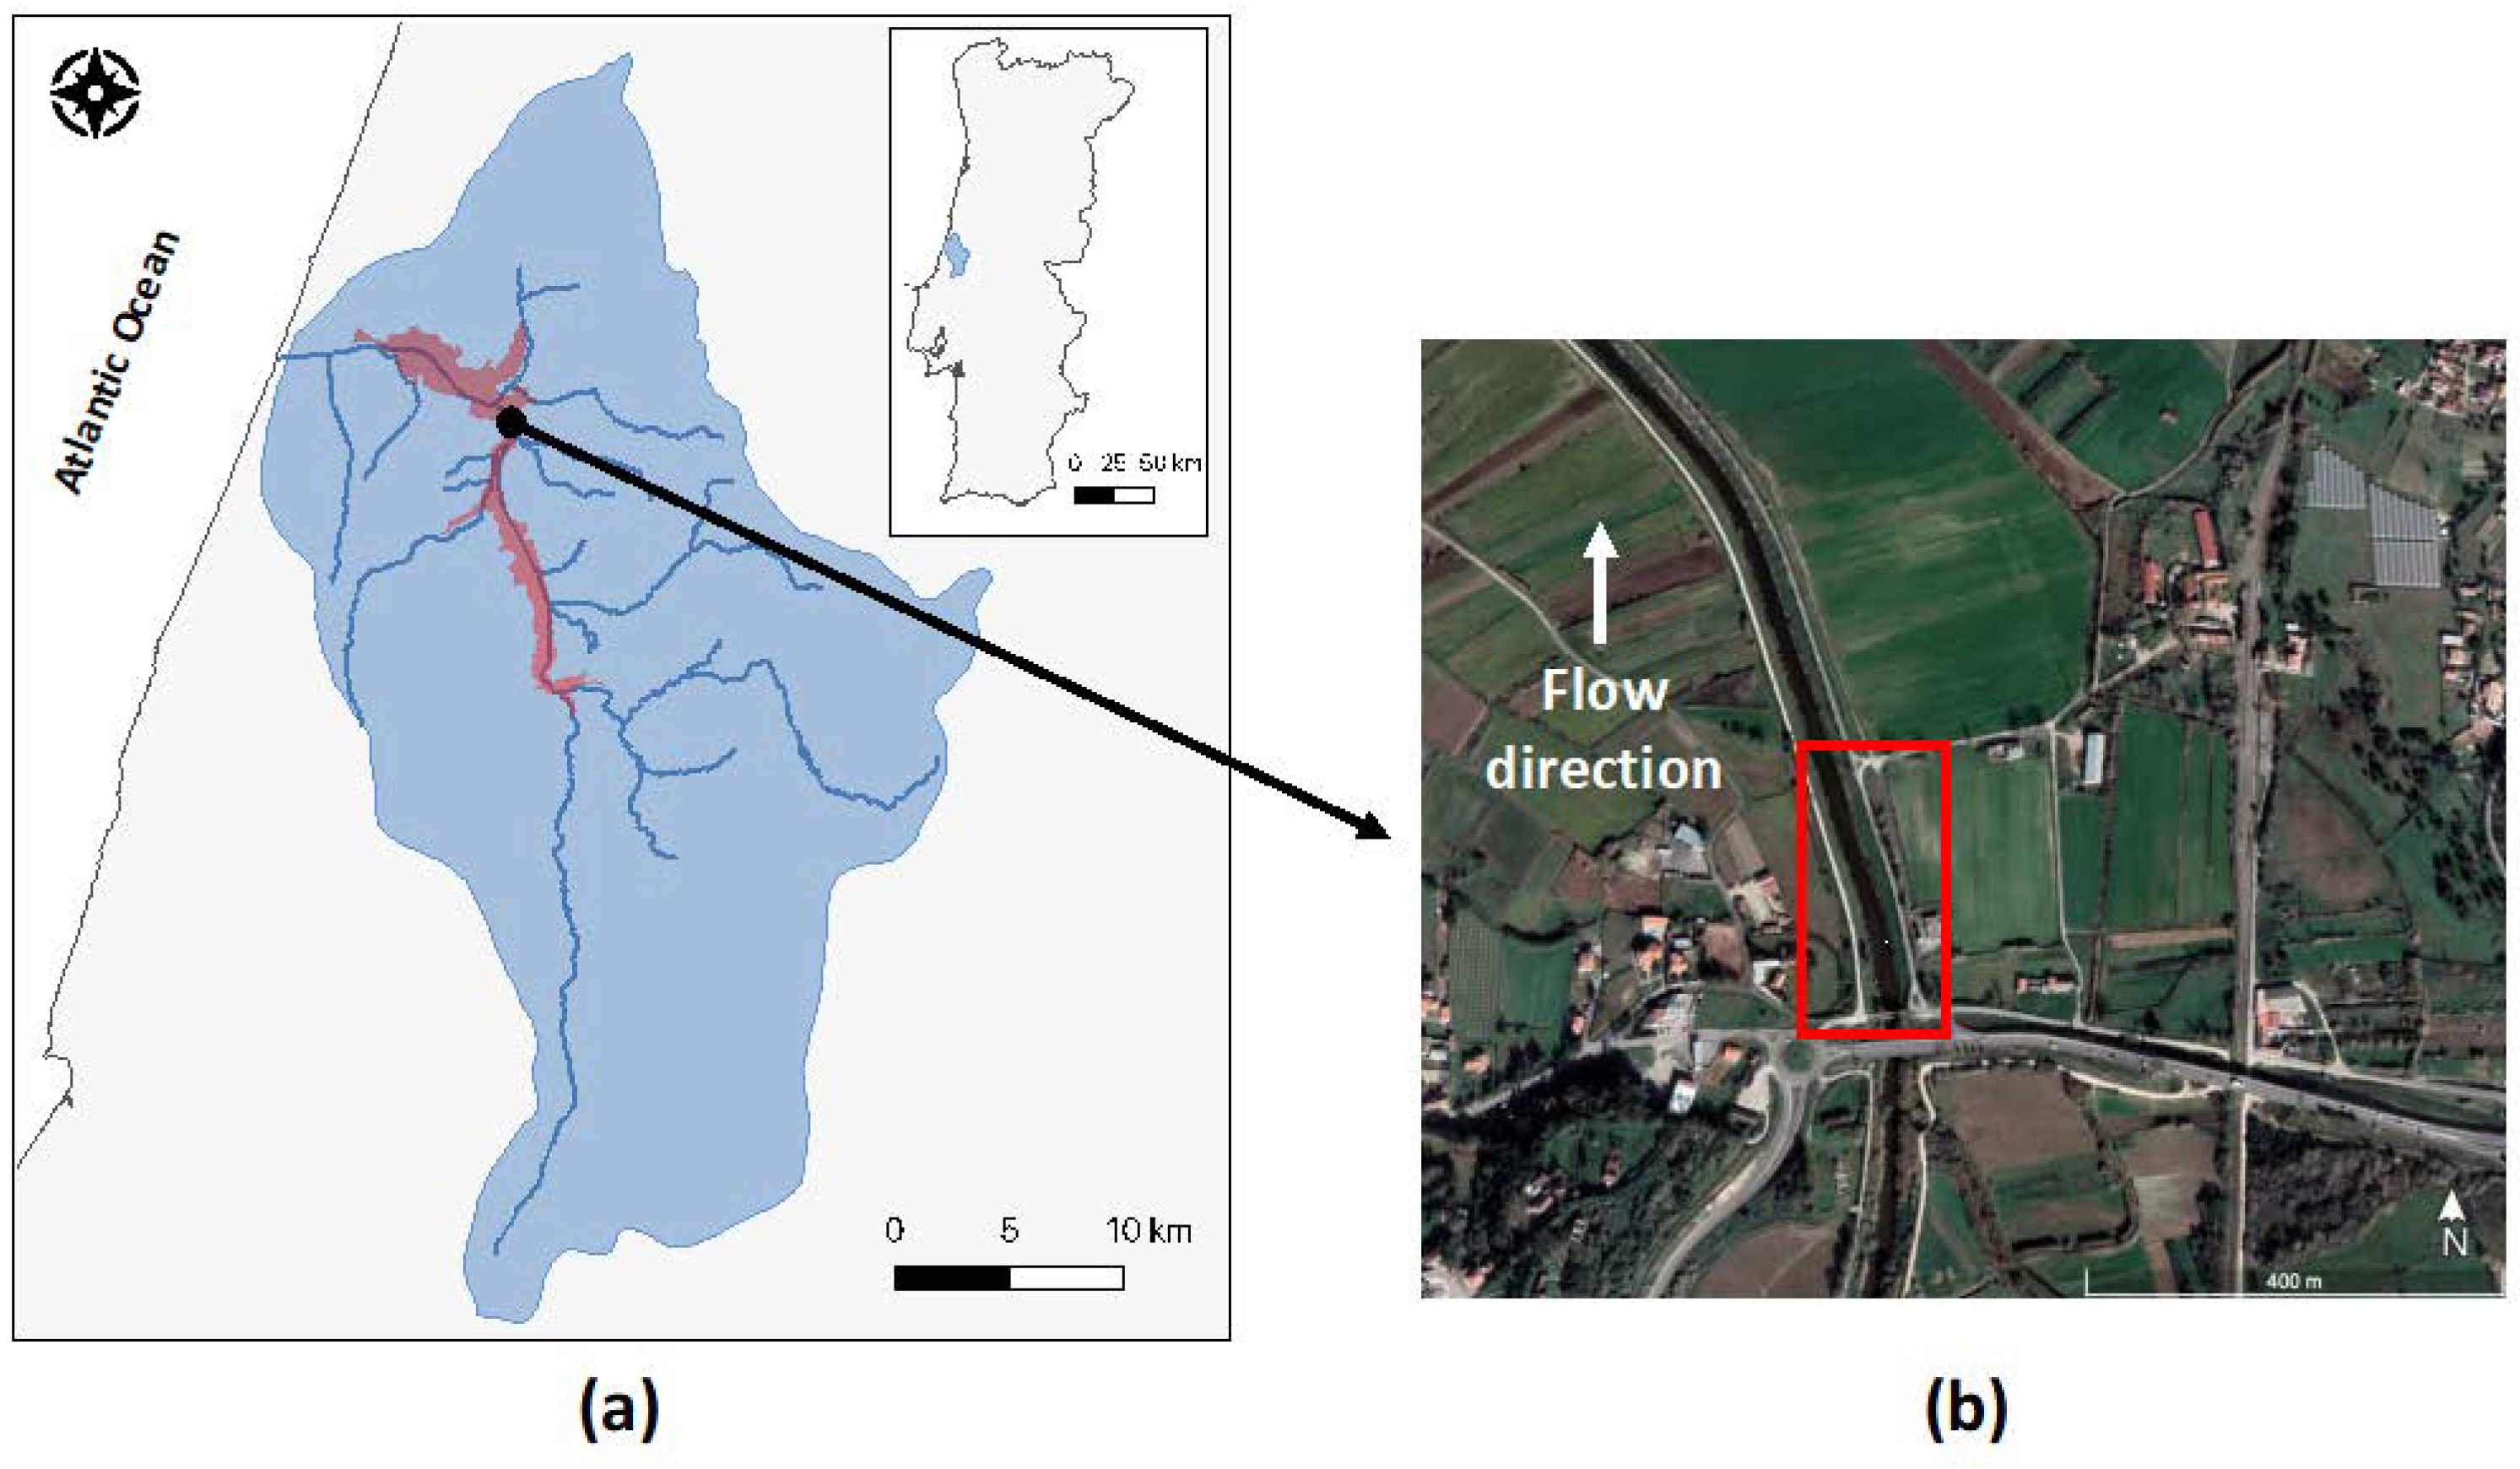
2.1. Study Site

The Lis River is located in the center region of Portugal (Figure 1a) and flows into the Atlantic Ocean north of beach Praia da Vieira, near Vieira de Leiria. It is about 40 km-long and drains a catchment area of approximately 850 km2. The main Lis River’s tributaries are, on the right bank, Ribeira da Caranguejeira, Ribeira dos Milagres, and Rio de Fora, and on the left bank, the Lena River and Ribeira do Rio Seco. The valleys of the main watercourses, the Lis and Lena Rivers, which run in the south–north direction, are flat and wide, typical of alluvial plains. On average, the Lis River has a gentle longitudinal slope. Relief, geology, and climate are rather homogeneous throughout the catchment, which has a slightly rugged topography, gently sloping westward. Around 2/3 of the catchment is below 200 m a.s.l., mean altitude is 142 m, and about 90% of the area has slopes that do not exceed 15%.
The Lis catchment could be subdivided into two main hydro-morphological units: (a) an upper section: it includes the Lis River and Lena River sub-basins, upstream of the city of Leiria, which is the main urban area in the catchment, and (b) a lower section: it includes the sub-basin located between the city of Leiria and the Atlantic coast; upstream, it develops over sandstones, marly limestone, and marls that have a low permeability, and downstream, the area has gentle slopes and extends over sand and gravel that have a high permeability. The absence of water filtering by sand or other sediments constitutes a problem for the quality of the river water when there is water contamination in the upper section of the basin and the upstream zone of the lower section. It determines that the contaminated water arrives fast to the riverbed, flowing through limestone [38].
According to the Köppen–Geiger climate classification, in the study area, the climate is Csb, characterized by dry temperate and mild summers, and wet winters of mild temperatures. Mean annual precipitation in the Lis catchment is around 855 mm [39]. Precipitation is concentrated mainly from October to March, and mean values decrease from the headwaters of the catchment towards the coastal region. The flow regime in the Lis River and its tributaries shows wide variability throughout the hydrological year; downstream, the Lis River exhibits a mean annual discharge of approximately 2.7 m3/s [39].
Among others, the following problems related to the quality of the Lis water are identified: (i) This catchment lies in a calcareous region, which favors water infiltration and poor filtration of the water before it meets back surface waters. (ii) The scattered population found in the vicinity of the Lis River is only partly served by Wastewater Treatment Plants; thus, untreated domestic wastewaters reach the Lis River and its tributaries, contaminating the watercourses. (iii) The river is highly impacted by anthropic activities, such as agriculture, industry (e.g., tannery, mineral mining), and livestock production, mainly piggeries [38,40]. Law enforcement often fails to stop illegal discharges of polluted waters into surface waters and groundwater. Main problems are already found near the source of the river, which are aggravated as the river crosses urban areas and, in the more downstream section, the Lis Valley Irrigation District (LVID) (Figure 1a), where agricultural activities are more intensely carried out.
LVID is a state initiative, serving an agricultural area of about 2130 ha, of which about 1490 ha are irrigated, and where hydraulic infrastructures date back from 1957. LVID is very important for the local socio-economy and is managed by a local Water Users’ Association (WUA), the Associação de Regantes e Beneficiários do Vale do Lis. The dominant LVID soils are modern alluvial soils of high agricultural value, that in some areas are poorly drained. Salinization problems are frequent in the area, particularly in the low-laying agricultural fields. Main crops are forage corn, forage grass, horticultural, orchards, and rice. Water irrigation sources are the Lis River and its tributaries, but there are no surface water storage reservoirs. The open-channel conveyance irrigation network is fed by pumping from the river and drainage ditches; for this purpose, several small weirs are installed in the watercourses.
In the absence of flow regulation or storage infrastructures, the river flow discharge available to the LVID is very variable over time, depending directly on precipitation. It is normal that the water supply is scarce during the summer season, due to quantitative and qualitative issues. On the other hand, flow discharges are often torrential in the winter/wet season, often leading to inundations. The flood protection works that are found in the Lis River, particularly when it runs through the LVID, are often not enough to face high discharges.
Partly caused by the poor quality of the Lis River and its tributaries, proliferation of invasive aquatic plants was witnessed in the last years in several parts of the Lis catchment, which is introducing additional obstacles into water management and operation of hydraulic infrastructures. Moreover, some exotic species contributed to the degradation of the ecological status of several water bodies in this catchment [38]. The intensity of the problem is found to be increasing over time, based on casuistic observations of the watercourses, namely by the local population and the WUA, and reported in local media, e.g., [41]; however, the lack of a monitoring program does not allow to assess the severity of the problem or the dynamic behavior of the invasive species. According to projected climate scenarios, mean annual precipitation will decrease in the region and mean temperatures will increase [38,42], which creates even more favorable conditions for the proliferation of invasive AV, and increasing concerns.
For this study, which deals with the presence of duckweeds in the Lis River, a section of the river inserted in the LVID (Figure 1b) was selected. The site is located approximately 15 km north (and downstream) of the city of Leiria. The study spans a four-month period in 2021, from the beginning of June to the beginning of October, which coincides roughly with the typical warmest and driest months. For 2021, the temperature and precipitation data observed at the Leiria weather station are presented in Table 1.

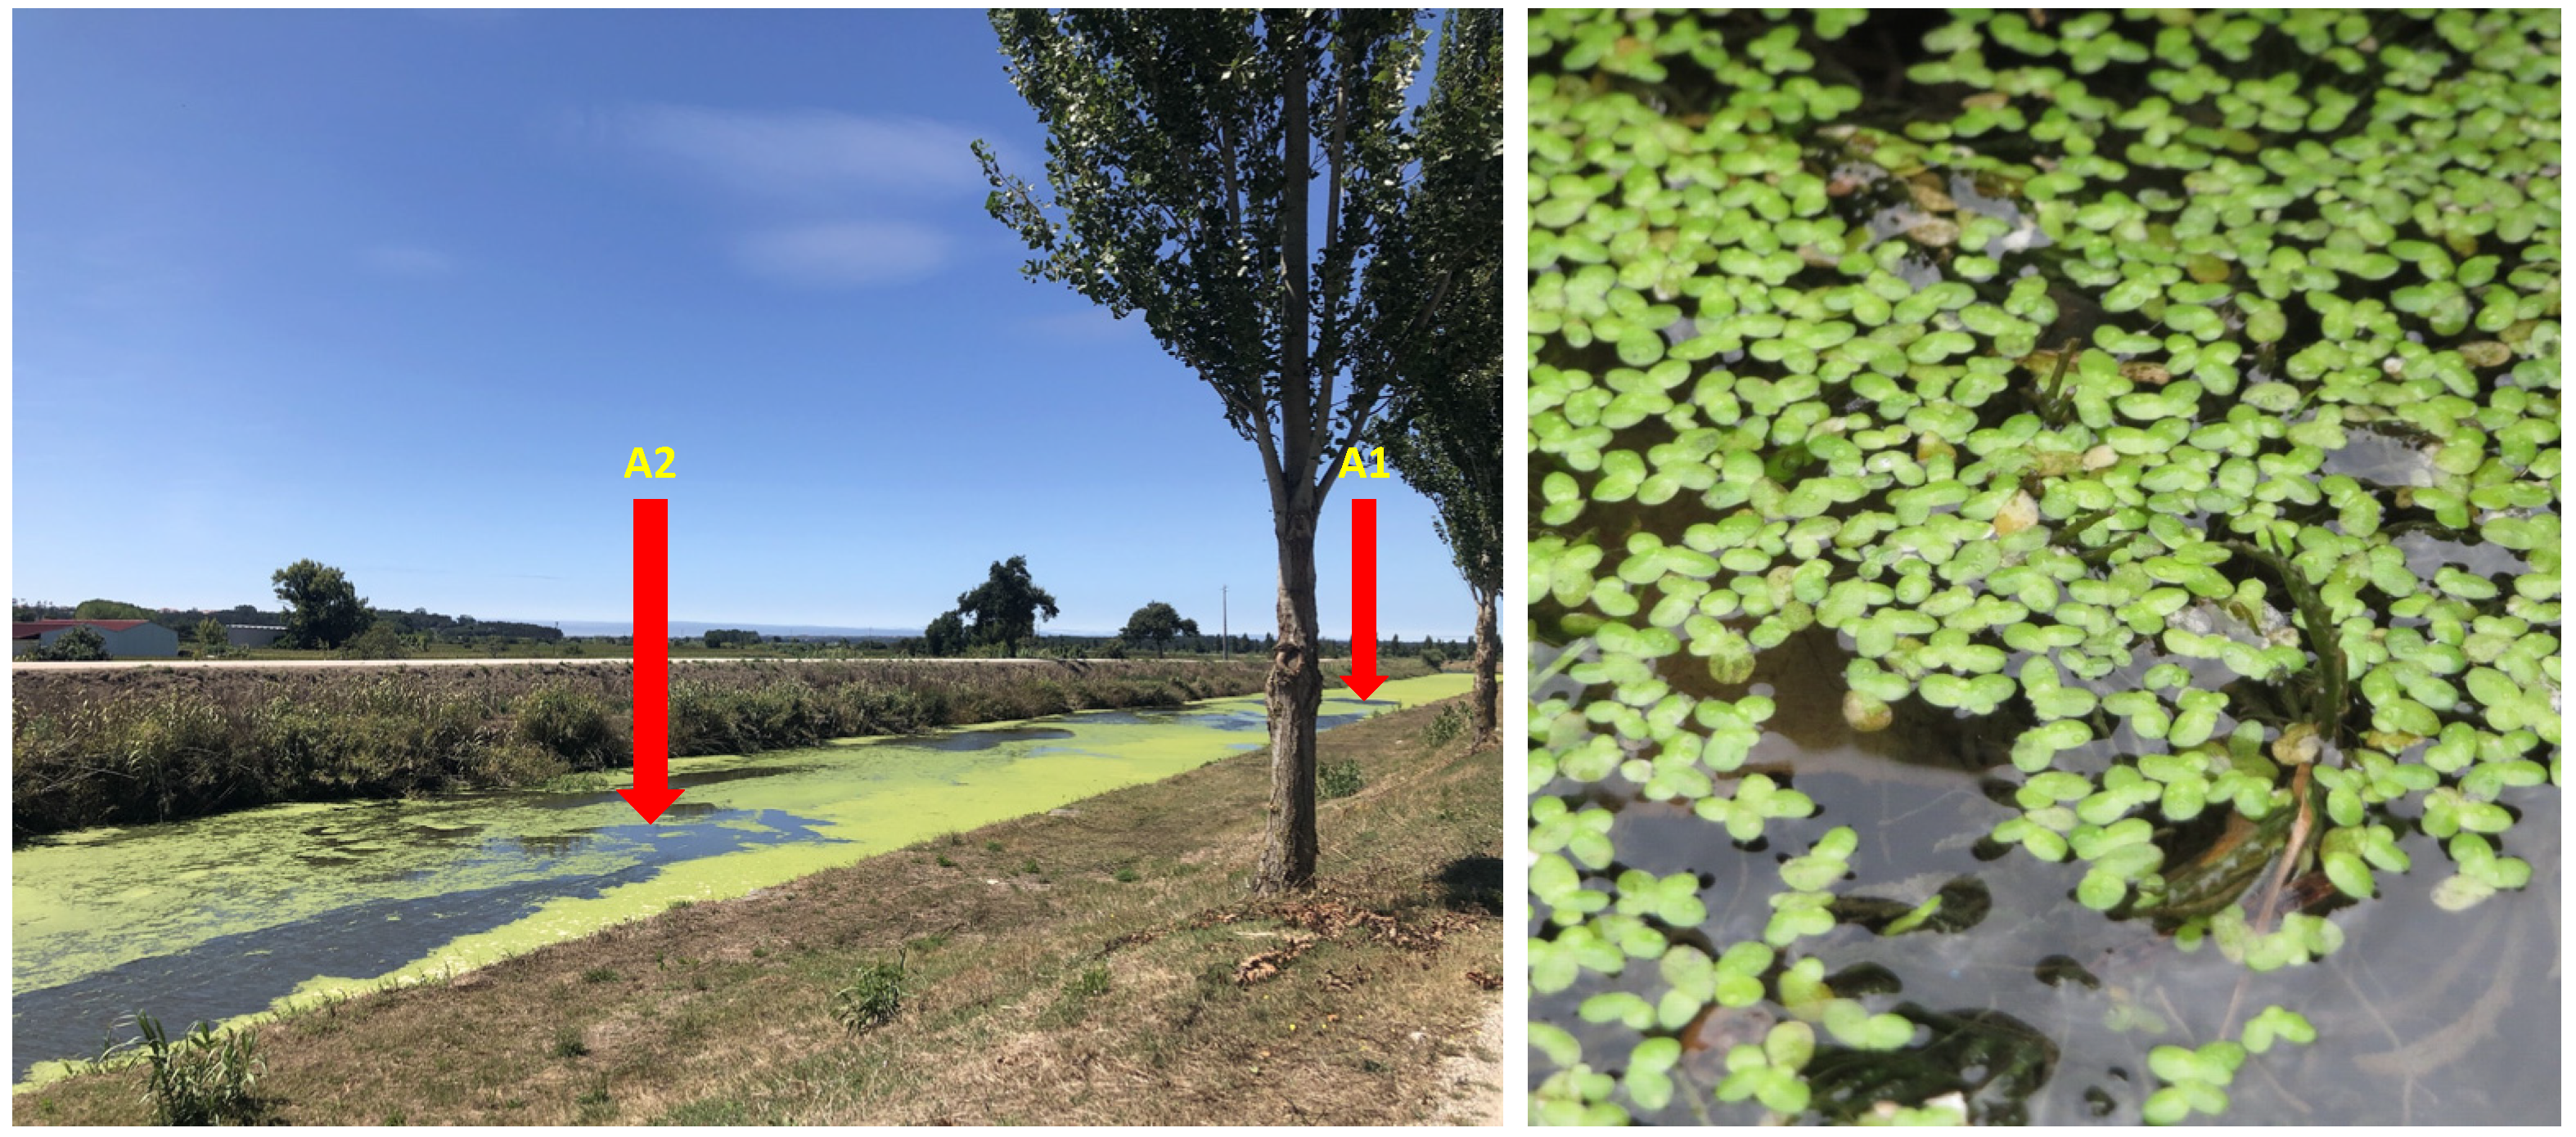
2.2. The Study Focus

Duckweed is a group of free-floating freshwater plants belonging to the family of Lemnaceae, which are monocotyledonous macrophytes [44,45]. The family consists of 5 genera (Spirodela, Landoltia, Lemna, Wolffia, and Wolffiella) and 37 species have been identified [46,47]. Lemna minor (L. minor, of the genus Lemna) is the most widely spread duckweed species found in freshwaters all over the world, consisting of three or four leaf-like bodies called fronds (Figure 2, right) and a single root for stabilization [48].
Lemna minor is one of the invasive aquatic plants that infest the Lis River and particularly affects the selected study area. This macrophyte is found to cover the water surface more prominently during summer, forming a green “carpet”, which is partly caused by the high temperatures (see, e.g., Table 1) and the river’s low-velocity flow conditions, and likely by a decrease in the quality of the water. Figure 2 illustrates the on-site infestation in 2021: the picture is from 5 August and the plant is at the adult stage.
During summer, the hydraulic regime (low discharges, low flow velocities) is a consequence of scarce rains. However, during the irrigation season, the selected section of the river (Figure 1b and Figure 2) is also influenced by the backwater inundation area caused by an inflatable weir located downstream of the identified river section, which is used to allow pumping water from the river to feed the irrigation network of the LVID. This further controls the hydraulic conditions in this section of the river, and results in very low flow velocities, which are nevertheless disturbed from time to time by direct runoff and water abstraction by existing irrigation pumping stations.
Figure 3 shows that the invasive weeds’ coverage of the water surface changes over time, at the seasonal scale, across the selected section of the Lis River. The images in Figure 3 (from left to right, respectively) are from Sentinel-2, for 26 July, 15 August, and 21 September 2021. Seasonal growth and infestations of duckweeds are observed yearly.
Due to the variability in the river flow regime and the floating nature of the aquatic invasive plant, there are often dislocations of the plant over the water surface that change the spatial distribution of the weed at the smaller scales (i.e., of a few m2); however, that is not expected to affect, overall, the presence of the weed at larger scales (e.g., the scale of the selected section of the river).
The Lemna minor observation protocol adopted focused on three areas of 100 m2 each (Figure 4: A1, A2, A3), which were identified along the selected section of the Lis River marked in Figure 1b (39°51′12.84″ N; 8°51′9.02″ W). These areas are located in the middle of the river and coincide with pixels from the Sentinel-2 imagery.
Scouting over the study site confirmed that only this invasive species was found on the surface of the water in the sample areas, during the period investigated in this work (6 June–6 October 2021). The special attention dedicated to select sample areas that contained only duckweeds aimed at avoiding studying areas where duckweeds were mixed with other plants, which often occurs near the riverbanks. The selection of these areas provides the basis, in this study, for comparing the response of several RS-based indices, which is important for identifying the indices that are more suitable to capture the presence of this macrophyte.

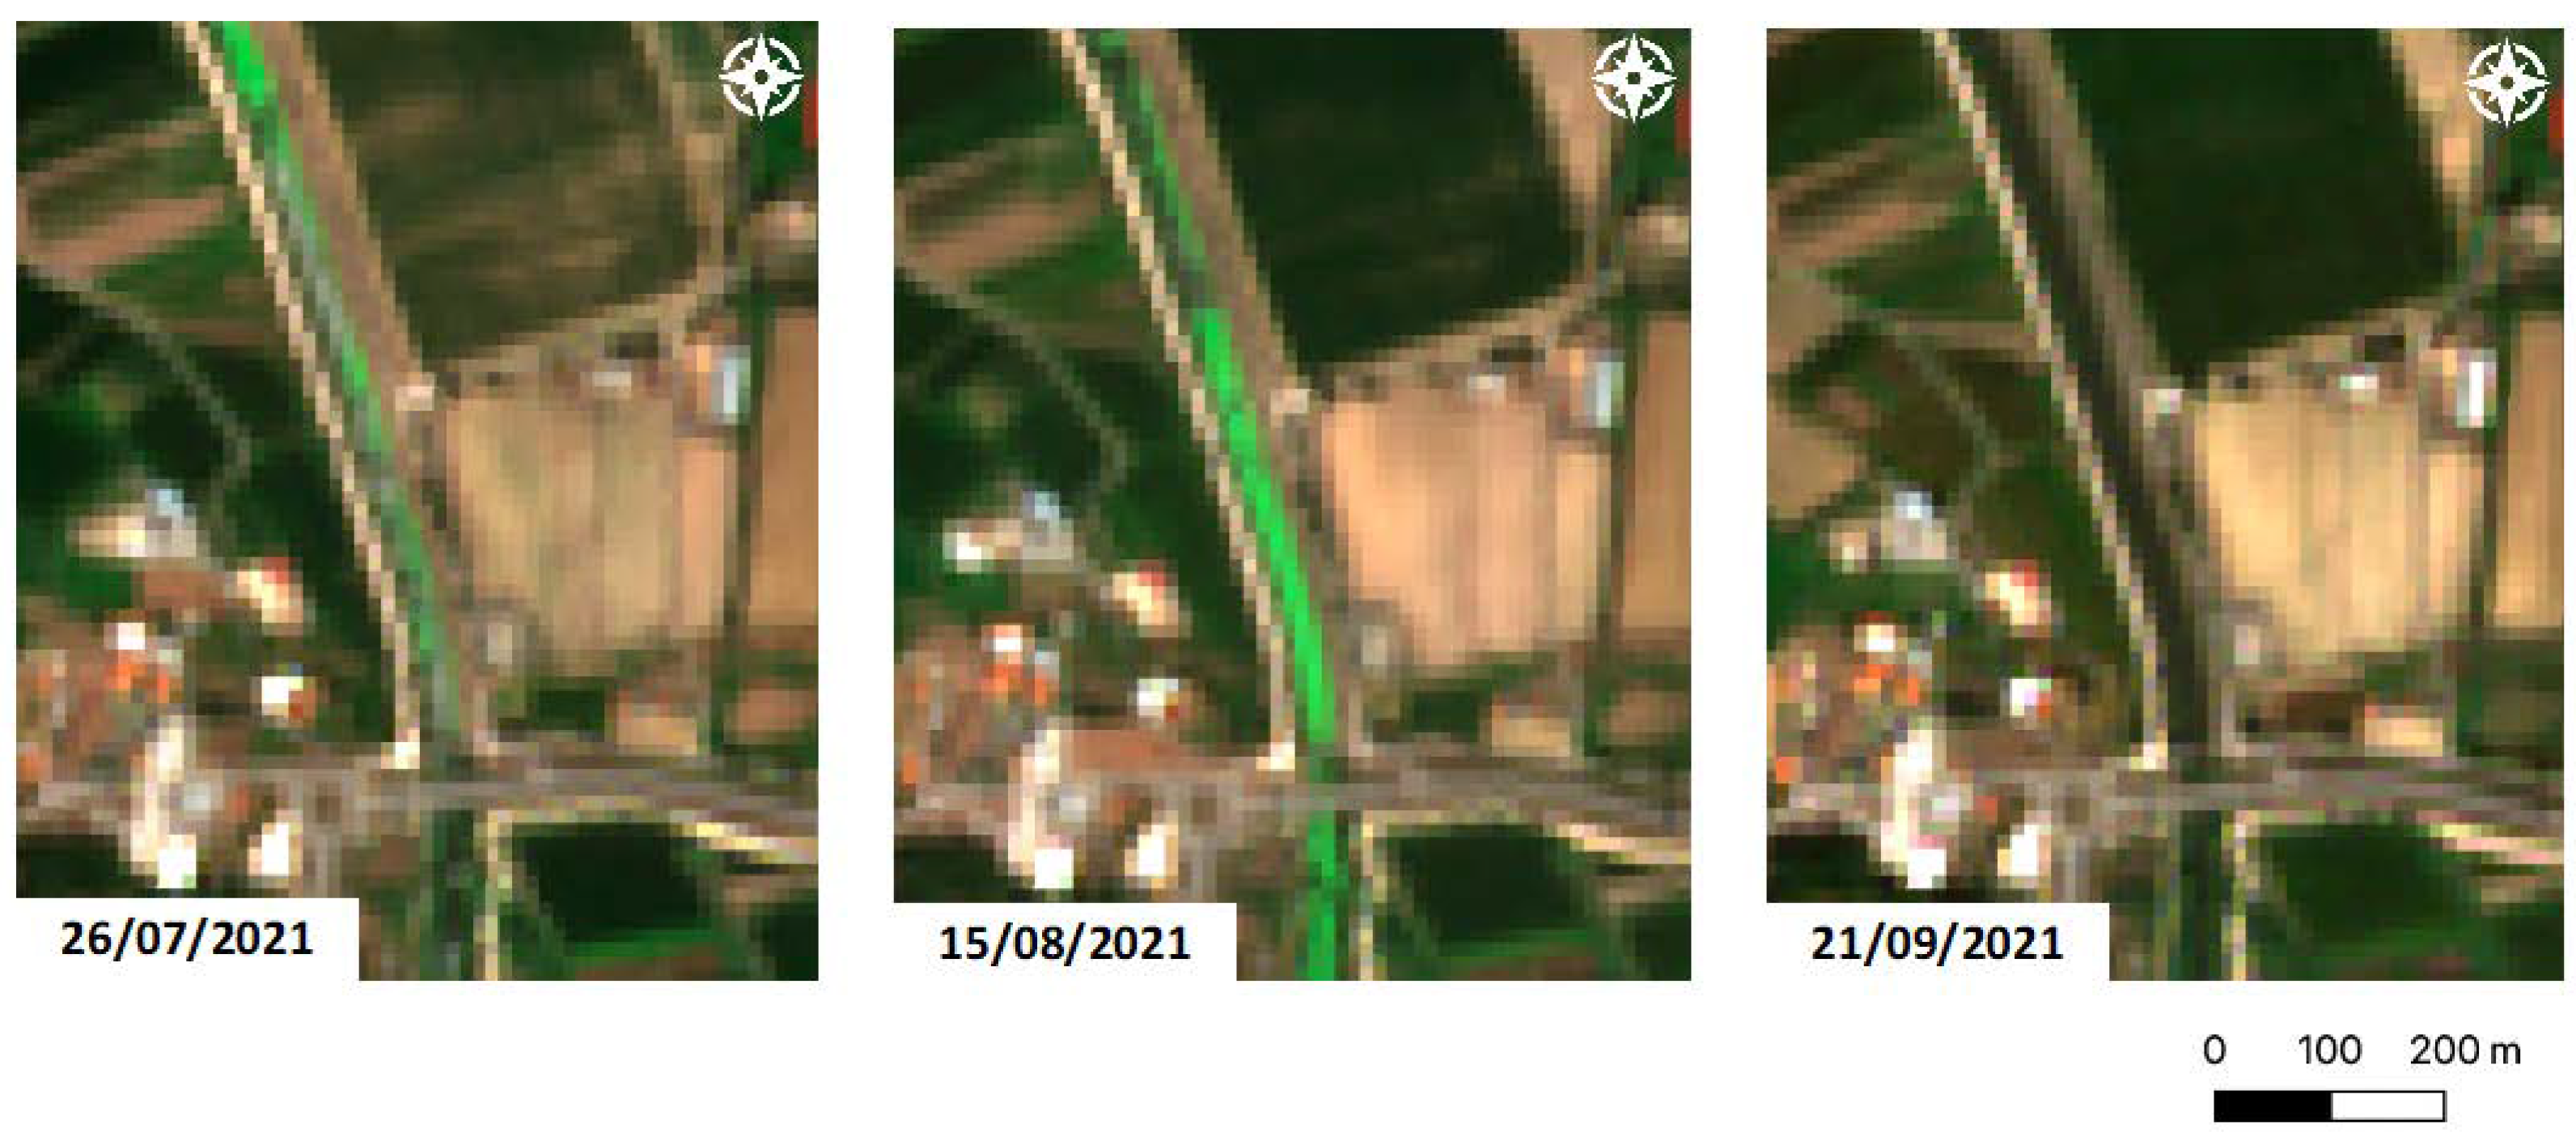
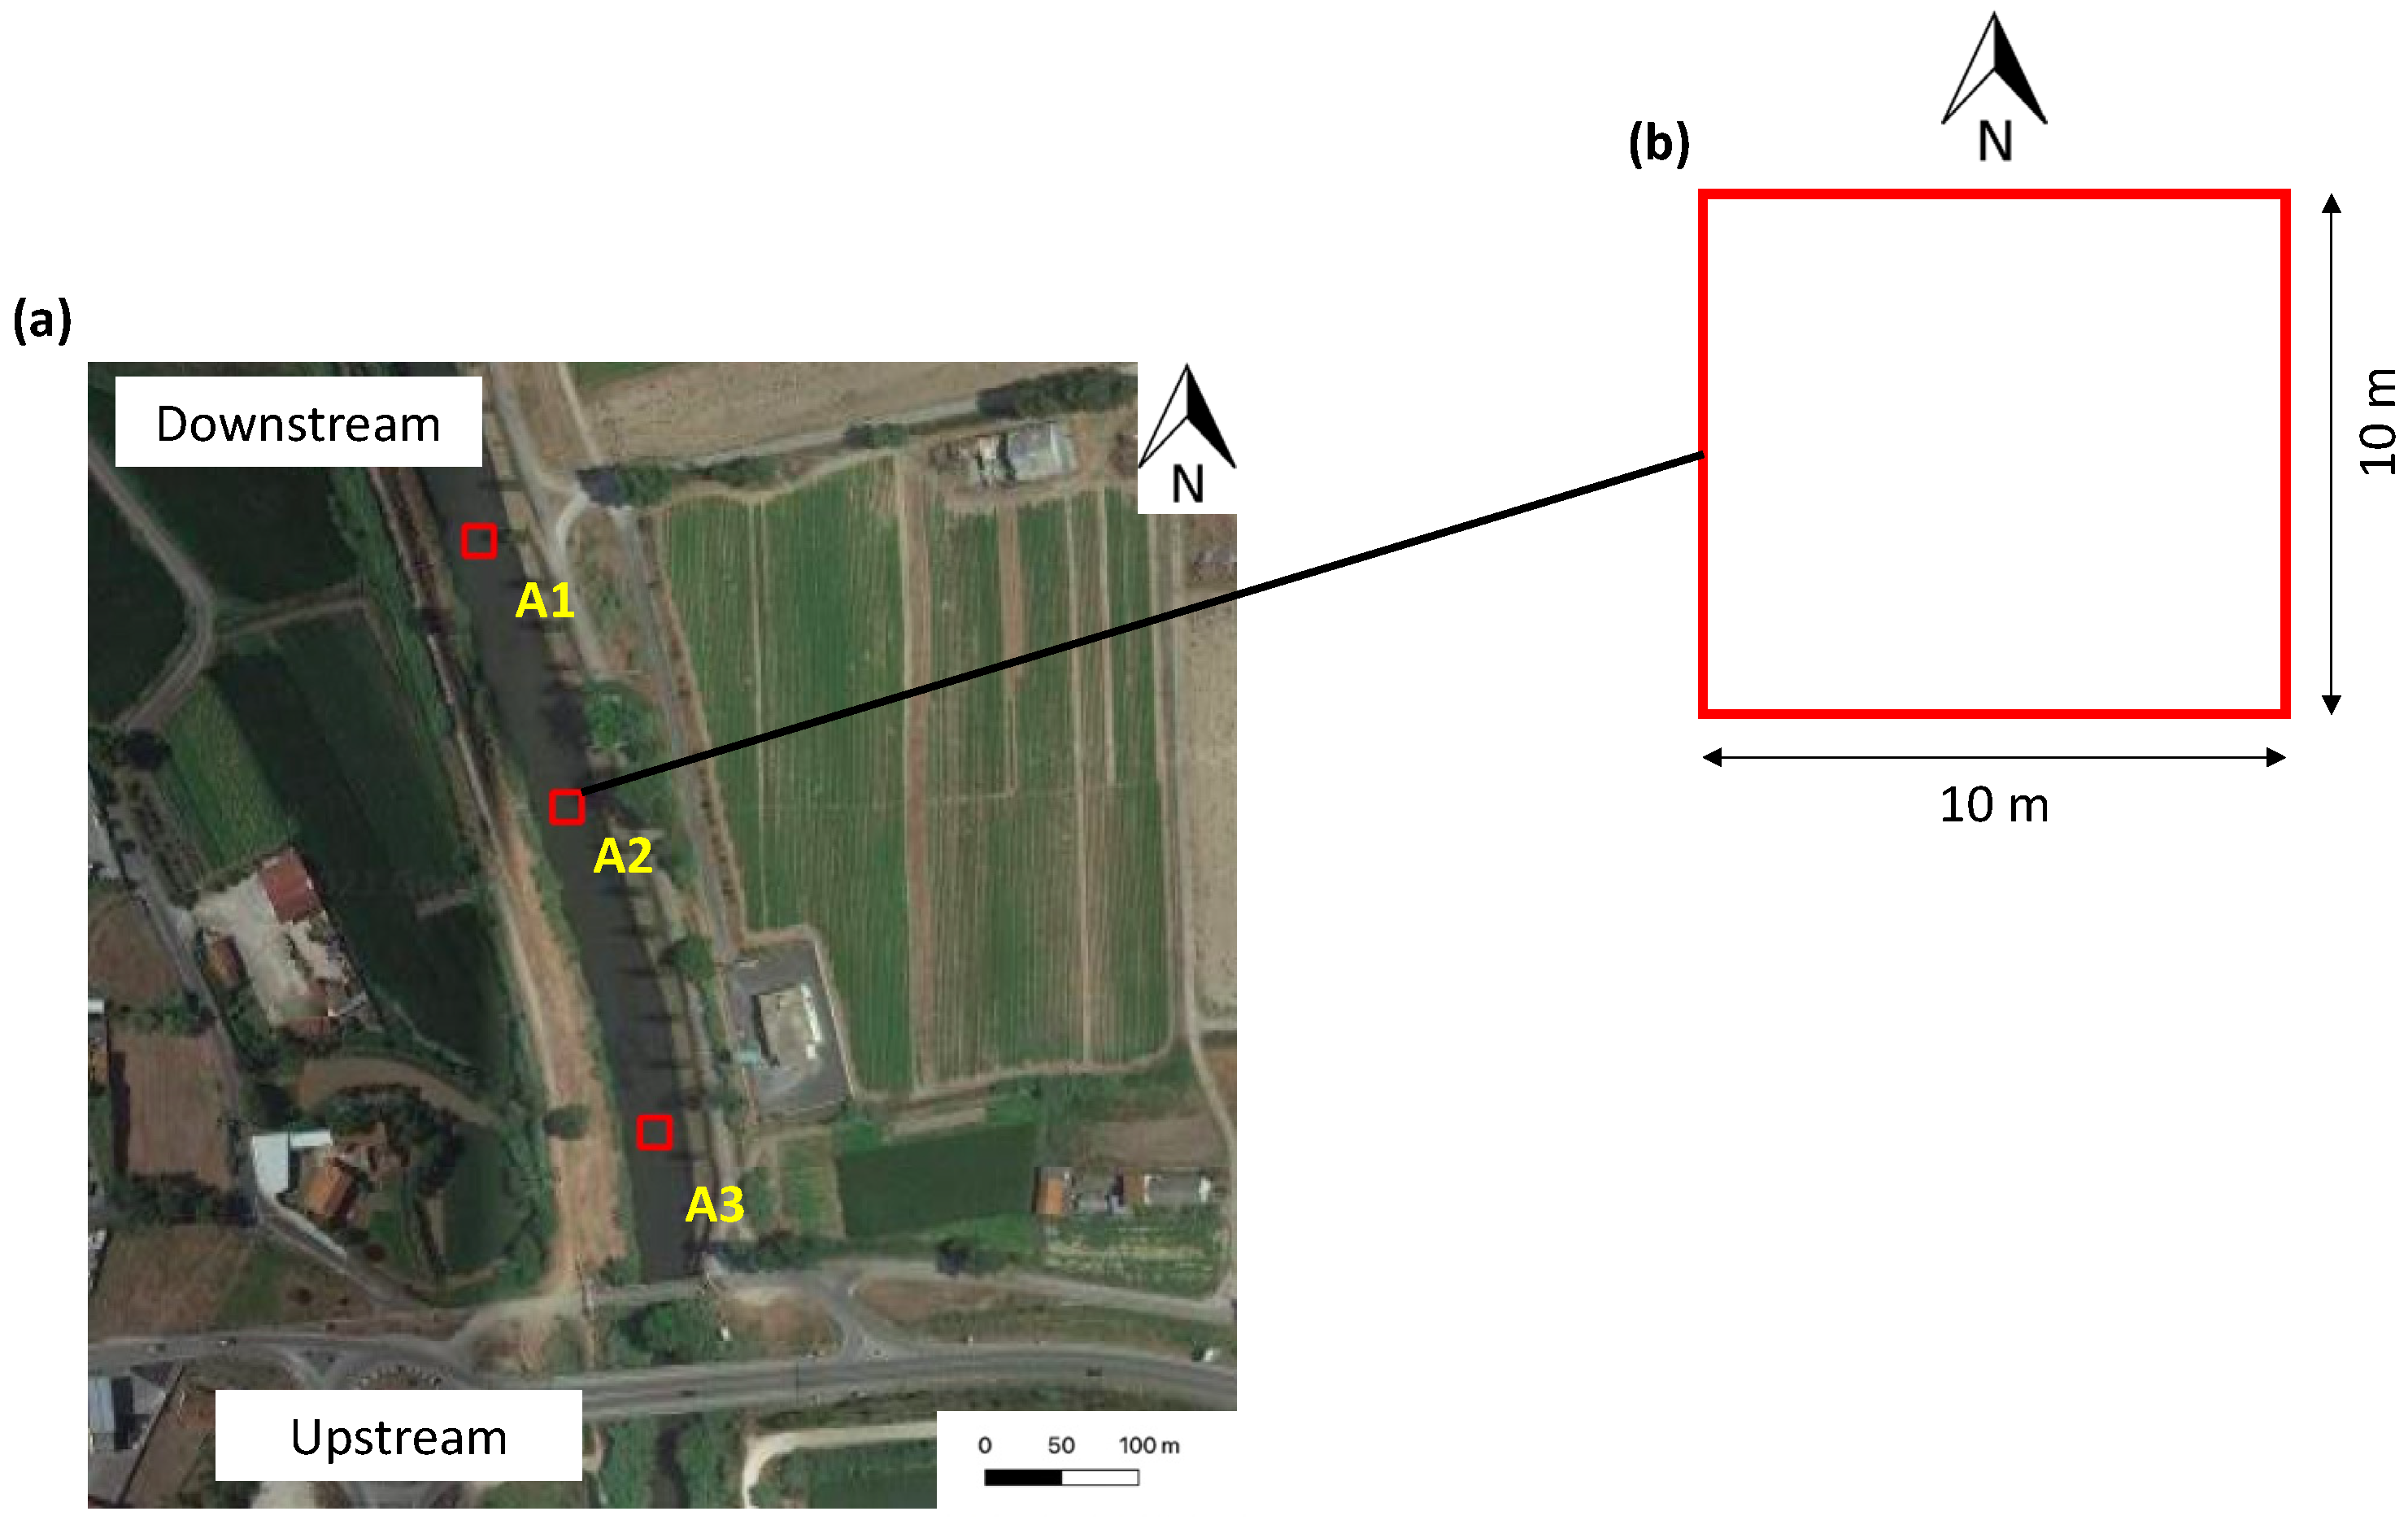
2.3. Data Collection and Pre-Processing

Sentinel-2 data were acquired from the Copernicus Open Access Hub European Space Agencies (ESA SciHub) [49]. Sentinel-2 was launched on 23 June 2015 by the European Space Agency (ESA), and is a high-resolution, multispectral imaging mission. It includes two twin satellites (Sentinel-2A and Sentinel-2B) that fly in the same orbit (a sun-synchronous orbit at a mean altitude of 786 km) but offset 180 degrees to give a revisit frequency of 5 days at the Equator. The Sentinel-2 instruments sense a 290 km-wide swath and 13 spectral bands, although at different spatial resolutions: four bands at 10 m spatial resolution, six bands at 20 m, and three bands at 60 m [50]. The spectral separation of each band into individual wavelengths is accomplished by stripe filters mounted on top of the satellite sensors.
Level-2A and Level-2B images (orthoimages in UTM/WGS84 projection) from Sentinel-2, already atmospheric-corrected, were selected for this study. Images with cloud cover less than 5% obtained during the period between 6 June and 6 October 2021 were retained (10 images). Data were available at 10 m full spatial resolution. The corresponding multispectral wavelength bands used in this work to calculate vegetation and water indices are presented in Table 2, together with some of their attributes. Light waves with short wavelengths carry more energy than ones with long wavelengths.

2.4. Vegetation and Water Indices

The different vegetation reflectance bands’ data that are obtained from RS platforms, especially those that rely on the Red, Green, Blue, and Near Infrared (NIR) wavelength bands, can be used to calculate indices that are effective in assessing different attributes of plants at the image’s pixel scale, which are determined by the characteristics of reflectance. In the blue and the red regions of the visible spectrum, vegetation reflectance is low; however, it peaks locally in the green region, and in the NIR range, vegetation reflectance attains the highest values. When these bands are combined algebraically to calculate vegetation indices, the type of combination adopted allows different spectral signatures to be enhanced for different vegetation properties. The general premise is that if there is much more reflected radiation in NIR wavelengths than in visible wavelengths, then the vegetation is likely to be dense. However, as discussed in [51], leaf reflectance is influenced by different parameters: (i) the leaf pigment content, (ii) the leaf tissue structure (size of aerial interspaces between cells, which influence leaf optical properties), and (iii) the structure of the leaf surface (e.g., waxes and hairs).
In this work, five vegetation and water indices were examined for assessing the potential in these indices for investigating the presence of duckweeds in the water surface of the Lis River and their spatiotemporal vegetation dynamics: NDVI (Normalized Difference Vegetation Index), GNDVI (Green Normalized Difference Vegetation Index), NDAVI (Normalized Difference Aquatic Vegetation Index), GRVI (Green Red Vegetation Index), and NDWI (Normalized Difference Water Index). Each index has unique features that make it useful for identifying the existence of vegetation (likely, in this case, in the river water surface) and water bodies/surfaces, such as NDWI in the latter case. These normalized indices are defined in Table 3 and take values in the interval [−1.0, +1.0]. The selected indices are briefly revisited below.
NDVI: NDVI is a well-known and widely used vegetation index developed in [52]. It is based on two findings: (i) the chlorophyll pigment in plant leaves markedly absorbs visible light for use in photosynthesis, namely in the red spectral band, and (ii) the cell structure of the leaves strongly reflects NIR light, which means high reflectance in the NIR band. Thus, the more leaves a plant has, the more these wavelengths of light are affected, respectively: in the red region of the spectrum, high photosynthetic activity leads to lower values of reflectance coefficients and to high coefficients in the NIR region of the spectrum. Thus, the ratios involving these indicators (Table 2) allow to distinguish between vegetation and other natural objects or surfaces. For example, free-standing water (e.g., rivers), which has a relatively low reflectance in both spectral bands, typically leads to very low positive or even slightly negative NDVI values. Overall, NDVI has proven effective in identifying biophysical parameters of dense and multi-layered canopies and it is used to detect vegetation in different environments [53,54,55,56]. NDVI has also been used to detect aquatic plants [27,57,58,59,60,61].
GNDVI: GNDVI is a modification of NDVI by replacing the red band with the green band in the equation of NDVI (Table 3). GNDVI has been considered more useful for assessing leaf chlorophyll variability when the leaf area index is moderately high [62]. This index has also been used to detect aquatic plants [59,63,64].
NDAVI: NDAVI exploits the visible shortwave range commonly defined as the blue natural color range and the NIR range. NDAVI is an adaptation of NDVI specifically tailored for AV, where the vegetation background is normally composed of water rather than soil [65,66]. Alongside other VIs, NDAVI has been used, e.g., in [65] for monitoring the ecological status of common reed beds, in [66] for identifying floating AV, and in [67] for retrieving the leaf area index (LAI).
GRVI: Motohka et al. [68] evaluated the use of the GRVI as a phenological indicator. They have concluded that the GRVI can differentiate between green vegetation (GRVI > 0), water and snow (GRVI around 0), and soils (GRVI < 0). Furthermore, they have demonstrated that the GRVI (unlike the NDVI) is sensitive to leaf color change (leaf greening and autumn coloring). Rotta et al. [69] used this VI to monitor macrophytes’ infestation, especially submerged ones.
NDWI: Since, in comparative terms, water has the strongest absorption while vegetation has the strongest reflectivity at NIR wavelengths, McFeeters (1996) [70] proposed the well-known water index NDWI to detect surface waters in wetland environments and to allow for the measurement of surface water extent. NDWI uses the green and the NIR spectral wavelength bands: it maximizes the reflectance of a water body in the green band while minimizing that in the NIR band. As a result, water features enhance NDWI positive values, whereas a common assumption is that null or negative NDWI values indicate non-water surfaces (e.g., they might reveal the presence of vegetation and soil). NDWI has been found able to identify water-pixels quite accurately, and because it varies almost linearly with liquid water thickness, it is also a relevant proxy for changes in the extent of open surface water [60,70,71,72,73,74,75].
For data analysis, the Raster Calculator Tool in QGIS v3.6 was applied to orthoimages of each spectral wavelength band, as shown in Table 3. Data were inspected for the period 6 June–6 October 2021.
Table 3. Sentinel-2 (S2) spectral bands and definition of vegetation and water indices.
IndexAbbreviationFormulaFormula Using S2 BandsReferences
Normalized Difference
Vegetation Index
NDVI N I R R e d N I R + R e d B a n d 8 B a n d 4 B a n d 8 + B a n d 4 [52]
Green Normalized
Difference Vegetation Index
GNDVI N I R G r e e n N I R + G r e e n B a n d 8 B a n d 3 B a n d 8 + B a n d 3 [62]
Normalized Difference Aquatic Vegetation IndexNDAVI N I R B l u e N I R + B l u e B a n d 8 B a n d 2 B a n d 8 + B a n d 2 [65]
Green Red Vegetation IndexGRVI G r e e n R e d G r e e n + R e d B a n d 3 B a n d 4 B a n d 3 + B a n d 4 [68]
Normalized Difference
Water Index
NDWI G r e e n N I R G r e e n + N I R B a n d 3 B a n d 8 B a n d 3 + B a n d 8 [70]

3. Results and Discussion

Maps for the four Vis (NDVI, GNDVI, NDAVI, and GRVI), for a selected section of Lis River, are shown in Figure 5, for 26 July, 15 August, and 21 September 2021. Results indicate that duckweeds drastically proliferated during the period investigated, and that it very much affected the selected river section over several months. All indices show signal variations over time. Portugal usually registers hot summer days in July, August, and the beginning of September, and the high temperatures typically reached during this period (for 2021, see Table 1) contribute to the proliferation of the plant. In 2021, duckweeds found in the Lis River followed this general trend, leading to vegetation indices that were highest in this season.
The VIs’ temporal variation trend is best observed in Figure 6a–d, which shows data for each of the three sample areas (A1, A2, A3) studied on the river water surface. Each vegetation index profile displays, overall, the same temporal trend. All VIs’ values were lowest on 6 June (the beginning of the study period) for all observed areas, and the indices showed an increase at the end of spring, which developed faster by the end of July. VIs reached peak values in mid-summer, which were maintained for a few weeks, but the corresponding highest values were registered on different dates: on 25 June for areas A2 and A3, and on August 25 and 30, for area A1. Around mid-September, the VIs’ values decreased markedly (corresponding to a reduction in the presence of duckweeds), which could be associated with rain events (Table 1) that were recorded in the region (and subsequent increase in the river discharge and flow velocity) and partly explained by the temperature decrease in the fall (Table 1), among other factors. The relatively lower magnitude of the VIs found in June was observed again on 6 October. The case-to-case variations, as one would expect, could be mainly due to the floating nature of the aquatic weed, variations in flow conditions (see Section 2.2), and the scale of observation.
Analysis of the water index NDWI (Figure 6e) also shows that during mid-summer the selected study site witnessed the domination of the water body by the invasive aquatic plant: the NDWI negative values suggest the absence of water surface in the observed areas, with the NDWI attaining negative values of −0.46. Note that the temporal variation found in this water index is (qualitatively) a mirror-image of the variation found, overall, for the VIs (Figure 6a–d). NDWI reveals differences found in the vegetation and water reflectance of visible and NIR wavelengths bands (note that the definitions of NDWI and GNDVI are reversed, see Table 3). Its definition forces the suppression of the signal for vegetation and the enhancement of the signal for open water features, which results in positive NDWI values for water features and zero or negative NDWI values for vegetation. However, as discussed by McFeeters (2013) [71], there are a number of factors that could affect pixel NDWI values, namely shadowing effects that could cause low NDWI values for water surfaces. Overall, for the observed areas, the sudden drop to negative and low NDWI values (Figure 6e) and the period when such negative values were maintained correspond to the periods when, respectively, other VIs’ values increased and held large values. Results reveal that sample area A2 was, overall, more infested than the other two sample areas, A1 and A3, but that all areas were infested with duckweeds (Figure 6).
On another scale of variability, it would be crucial to assess the nutrients’ level in the water, for full understanding of the Lemna minor infestation spatiotemporal variability found along the river course, mainly in the downstream sector of the basin. Regretfully, there are many complaints of illegal, highly polluted discharges in the river, particularly in some of its tributaries, and such discharges would favor the proliferation of macrophytes, but their impact on Lemna minor infestations has not been established yet.
Analysis of a sample consisting of data collected for the three observed areas (A1, A2, and A3) shows the different positive relationships between NDAVI and the other VIs (NDVI, GRVI, GNDVI) (see Figure 7). The relationship/correlation between the indices highlights how indices dedicated to terrestrial vegetation respond to aquatic vegetation in water surfaces, based on the signal captured by NDAVI. Overall, results indicate that indices correlate to a high level, with R2 values in the range of 0.89–0.94 (0.89, 0.91, and 0.94, for the relationship between NDAVI and, respectively, NDVI, GNDVI, and GRVI). Results also show that the duckweeds’ signal captured by NDAVI (i.e., revealed by the index magnitude) is greater than for the other indices investigated, with NDVI revealing the greatest similarity to NDAVI and GRVI the lowest, although GRVI is the index that best correlated with NDAVI. Figure 7 also highlights that, in absolute terms, the difference between the indices, for a given condition of the observed surface, depends on the magnitude of the VIs.
Overall, results suggest that NDAVI and NDVI are more effective than the other selected VIs for detecting duckweeds in small rivers. Among the four RS-based VIs, these two indices attained the largest values (respectively, 0.72 and 0.69) during the period when the duckweed infestation was more marked. They also show the widest value ranges, in relation to the GNDVI and GRVI (Figure 7), which suggests that NDAVI and NDVI are more sensitive to changes at the pixel scale, expectedly attributable to the presence of duckweeds. Thus, NDVI was capable to detect duckweeds in an aquatic environment, reaching values that are similar to the NDAVI values, which is a well-known AV index. On the other hand, GNDVI and GRVI seem to be less reactive to the presence of duckweeds in the sample areas. These indices show narrower value ranges as well as the lowest maximum values among the selected VIs (respectively, 0.46 and 0.35). This behavior could be explained by the smaller ability revealed by GNDVI and GRVI in detecting duckweeds, although these VIs likely have more capacity than others to identify terrestrial chlorophyll content [76,77]. Nonetheless, due to the structure of this macrophyte, pixel areas mix vegetation and vegetation-free water surfaces, which is expected to be signaled differently by the applied VIs. The detailed analysis of this issue requires data that are not available for this study.
Overall, results suggest that the VIs explored could be applied to detect AV in small rivers. Hopefully, this study contributes to the understanding in the field, in that it adds the following to existing studies [59,64,78], among others: (i) a larger set of RS-based indices is analyzed and the indices are compared, and (ii) the RS products are applied to investigate the presence of duckweeds in an open watercourse (in contrast with other studies dedicated to water reservoirs).
For the same observed areas and available RS imagery data, Figure 8 shows strong and significant negative correlations of NDWI with all the VIs investigated, which were already suggested in Figure 6. The coefficients of determination (R2) of the linear regressions fit to the indices’ data (Figure 8) show that the strongest relation is between NDWI and GNDVI (R2 = 0.997), as expected (Table 3), followed by NDAVI (R2 = 0.962). However, it is R2 ≥ 0.945 for all cases. As expected, results show that the highest values of NDWI reveal a low presence of the weed in the river water surface, whereas the lowest NDWI values (minimum was −0.46) correspond to the worse stages of infestation. Moreover, the highest NDWI attained in all sample areas was 0.03, suggesting that the presence of duckweeds in those areas persisted throughout the study period, which is pictured by the RS data.
Recent works, e.g., [73], have rated NDWI as one of the best indices for distinguishing between water surfaces and aquatic weeds, and results of this study indicate that this claim is pertinent. Overall, such a latent ability of vegetation and water indices is crucial for the increased understanding of the dynamics of duckweeds (Lemna minor) in aquatic environments.

4. Conclusions

This study explores the potential of RS tools for appraising the presence of aquatic invasive weeds in small open watercourses. In particular, the study focuses on the presence of duckweeds (Lemna minor) in the Lis River (Portugal) and compares several vegetation and water indices calculated from multi-temporal, multispectral Sentinel-2 satellite data. It aims at contributing to identify the most suitable RS products to depict the signal of this invasive plant and conditions that are investigated: some indices could be more apt than others on a case-to-case basis.
It is expected that results from this study are found helpful in further deepening research on this topic and in promoting useful tools for supporting operational environmental management measures to be applied in small watercourses affected by aquatic weeds’ infestations. Particularly, to the best of our knowledge, there are as yet no such studies reported for the specific environmental conditions found in the Lis catchment (Portugal).
The following findings of this study are highlighted:
  • Similar to the investigation of the presence of macrophytes in large water bodies (e.g., water storage reservoirs), it is also possible to use RS satellite data to study small watercourses, when spatial data of sufficient resolution are available. However, pixels’ data that avoid signal interferences by border effects are needed to reduce the uncertainty in invasive weeds’ assessments.
  • The floating nature of the Lemna minor and the dislocation paths that the plant undergoes over the surface of the water body, which are influenced by different controls (rain, flow discharges, flow velocity), demand that observational sampling covers a sufficiently large section of the river, since analysis of small sample areas might lead to high uncertainty in the results.
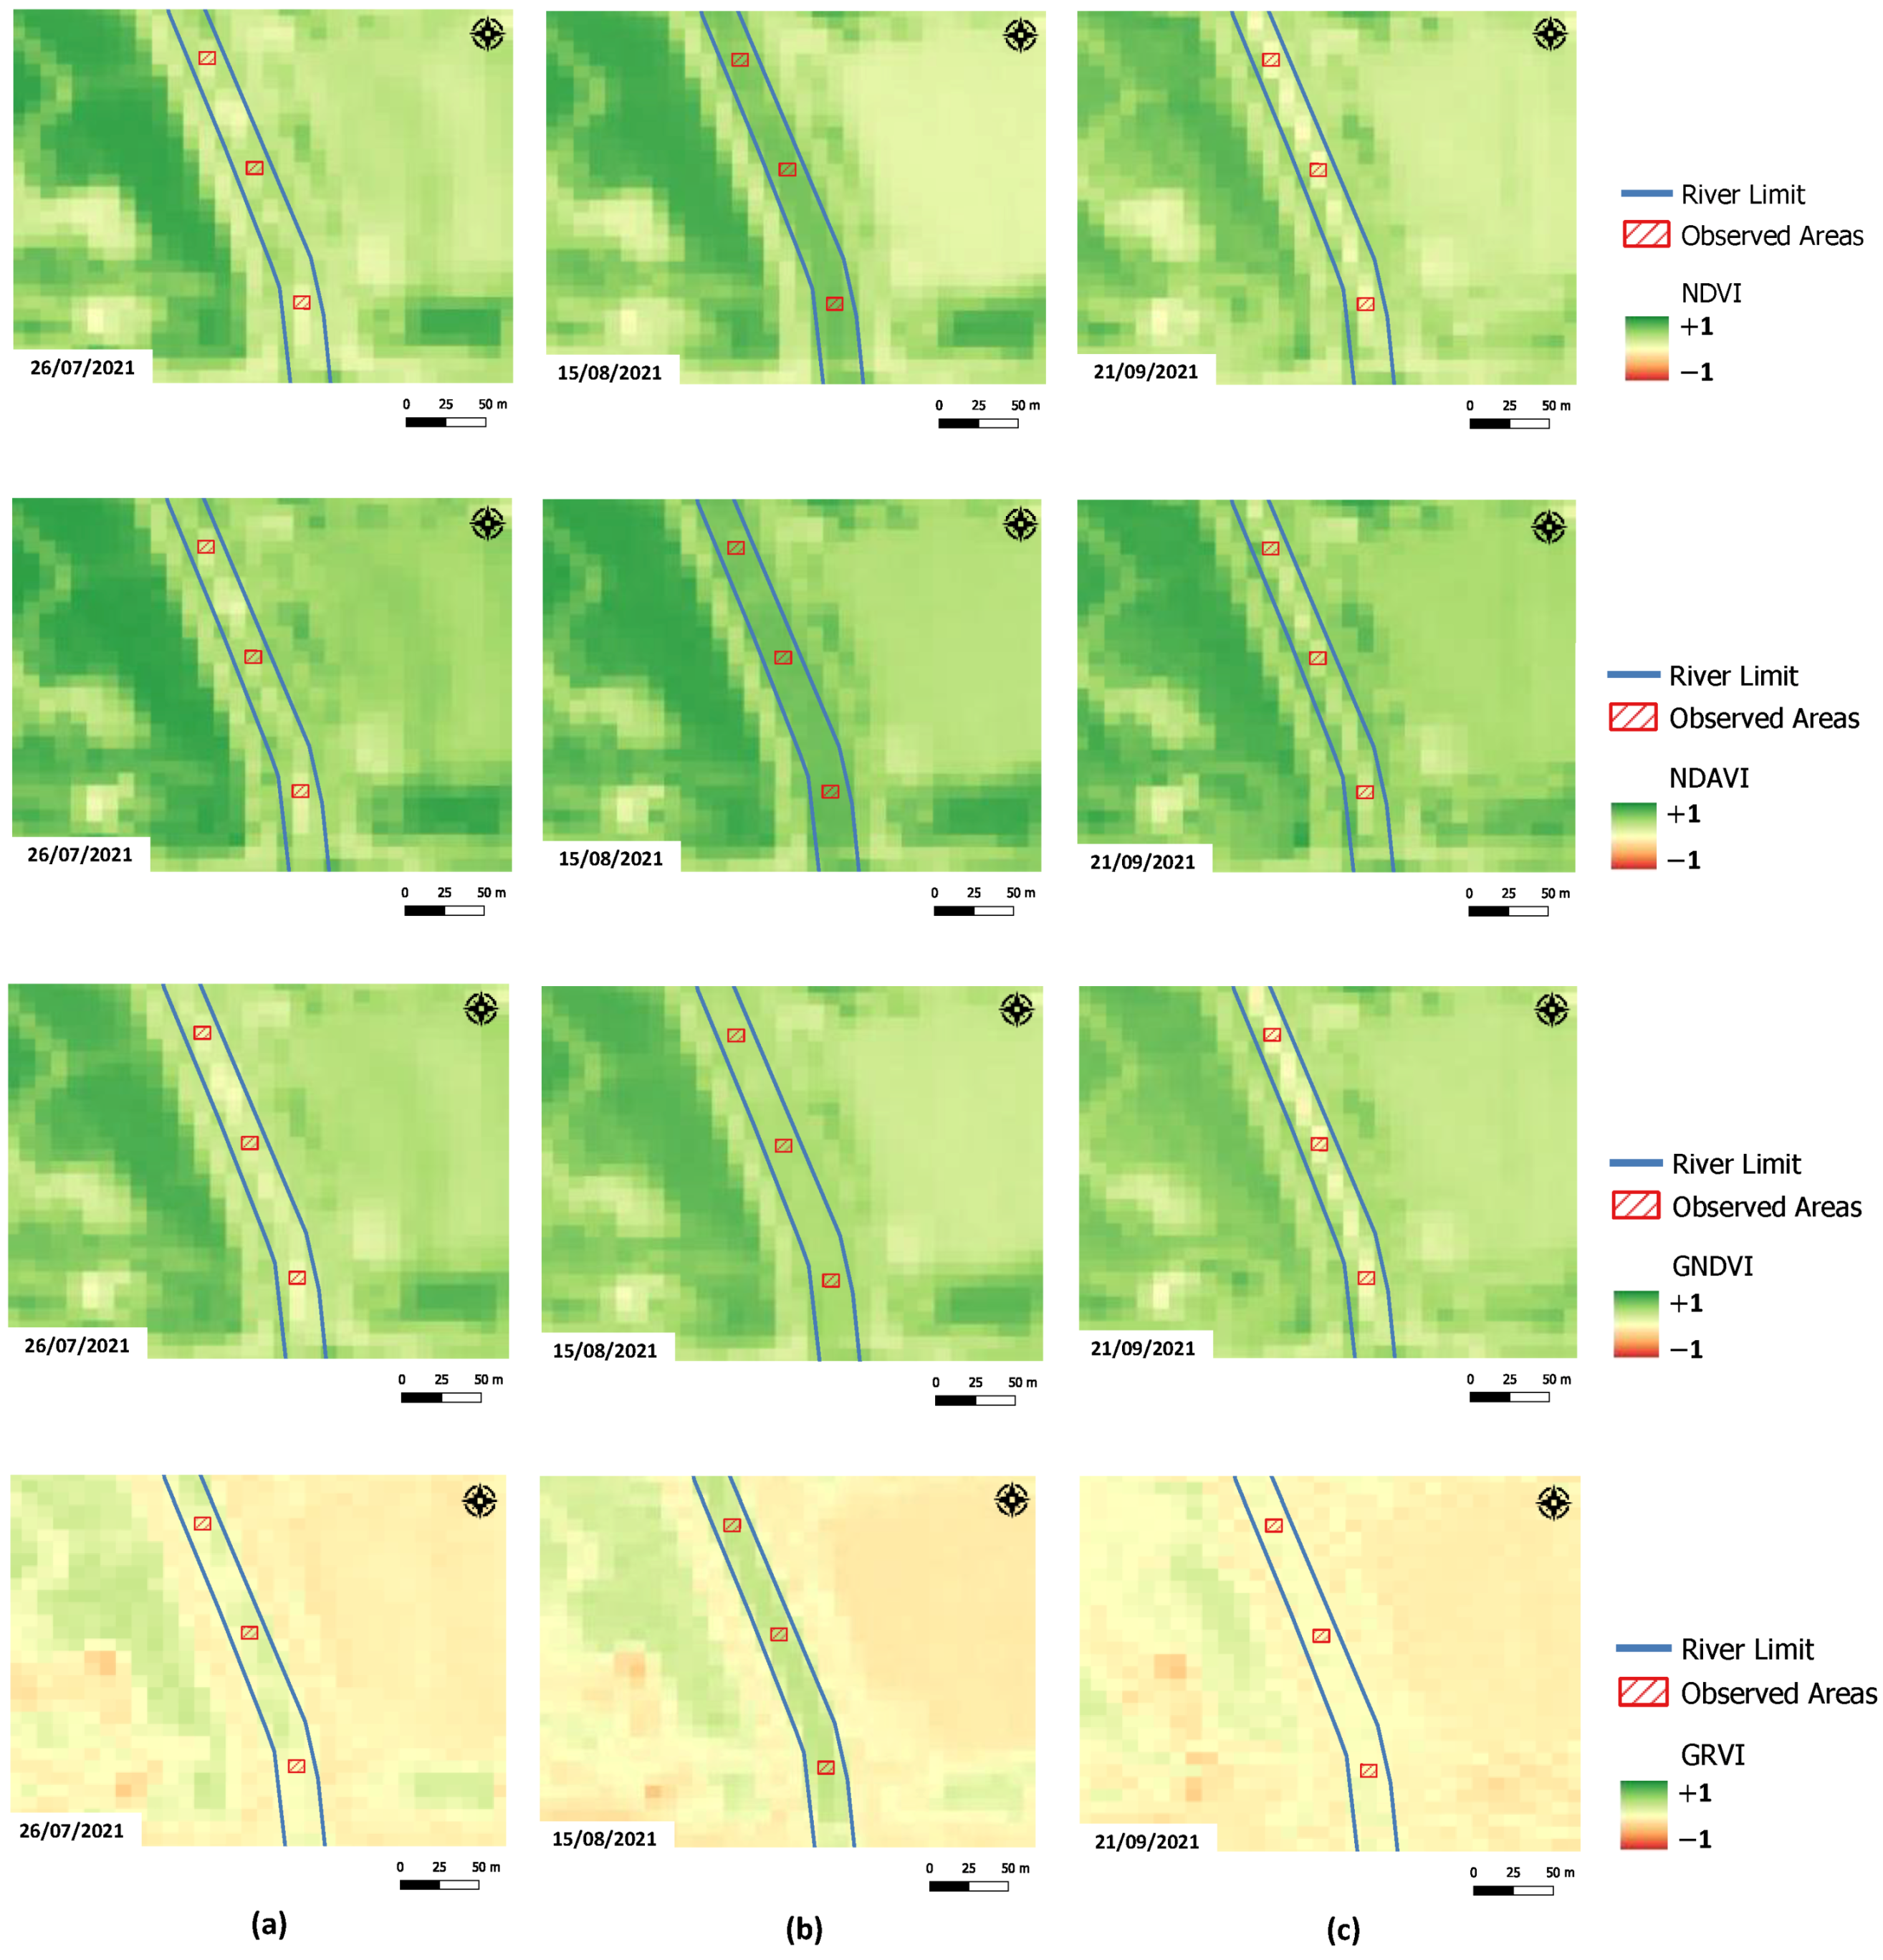
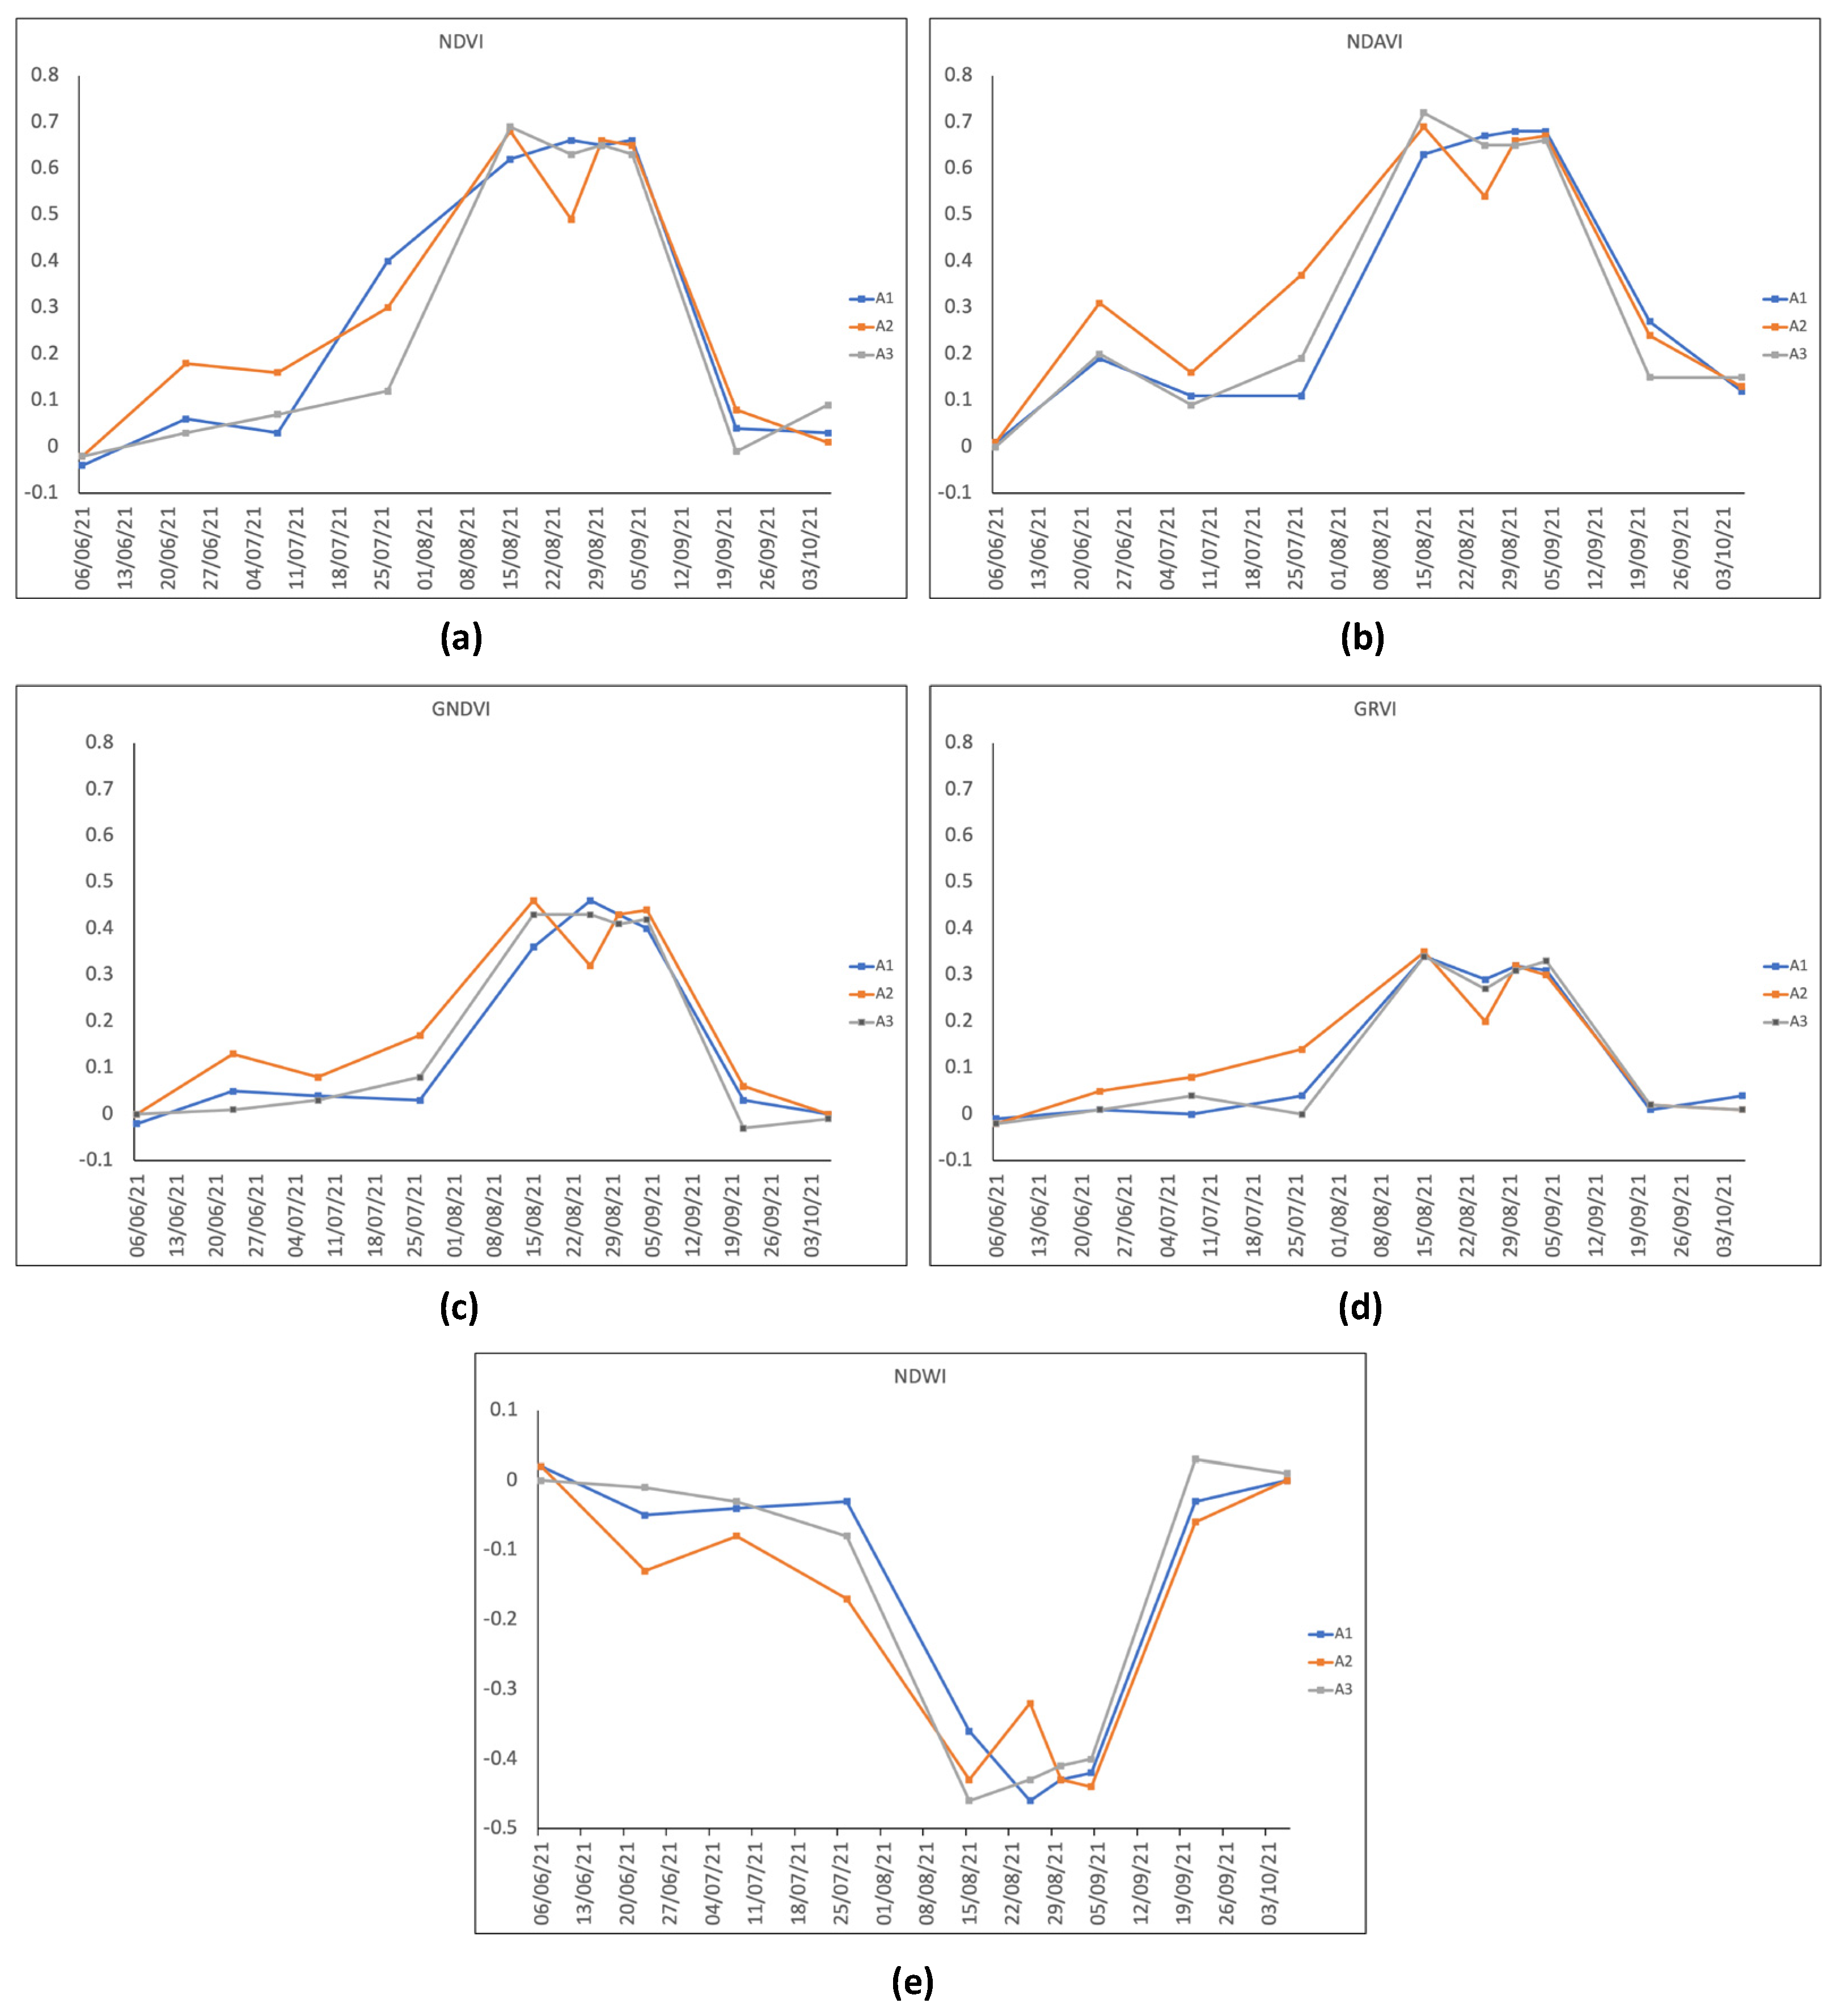
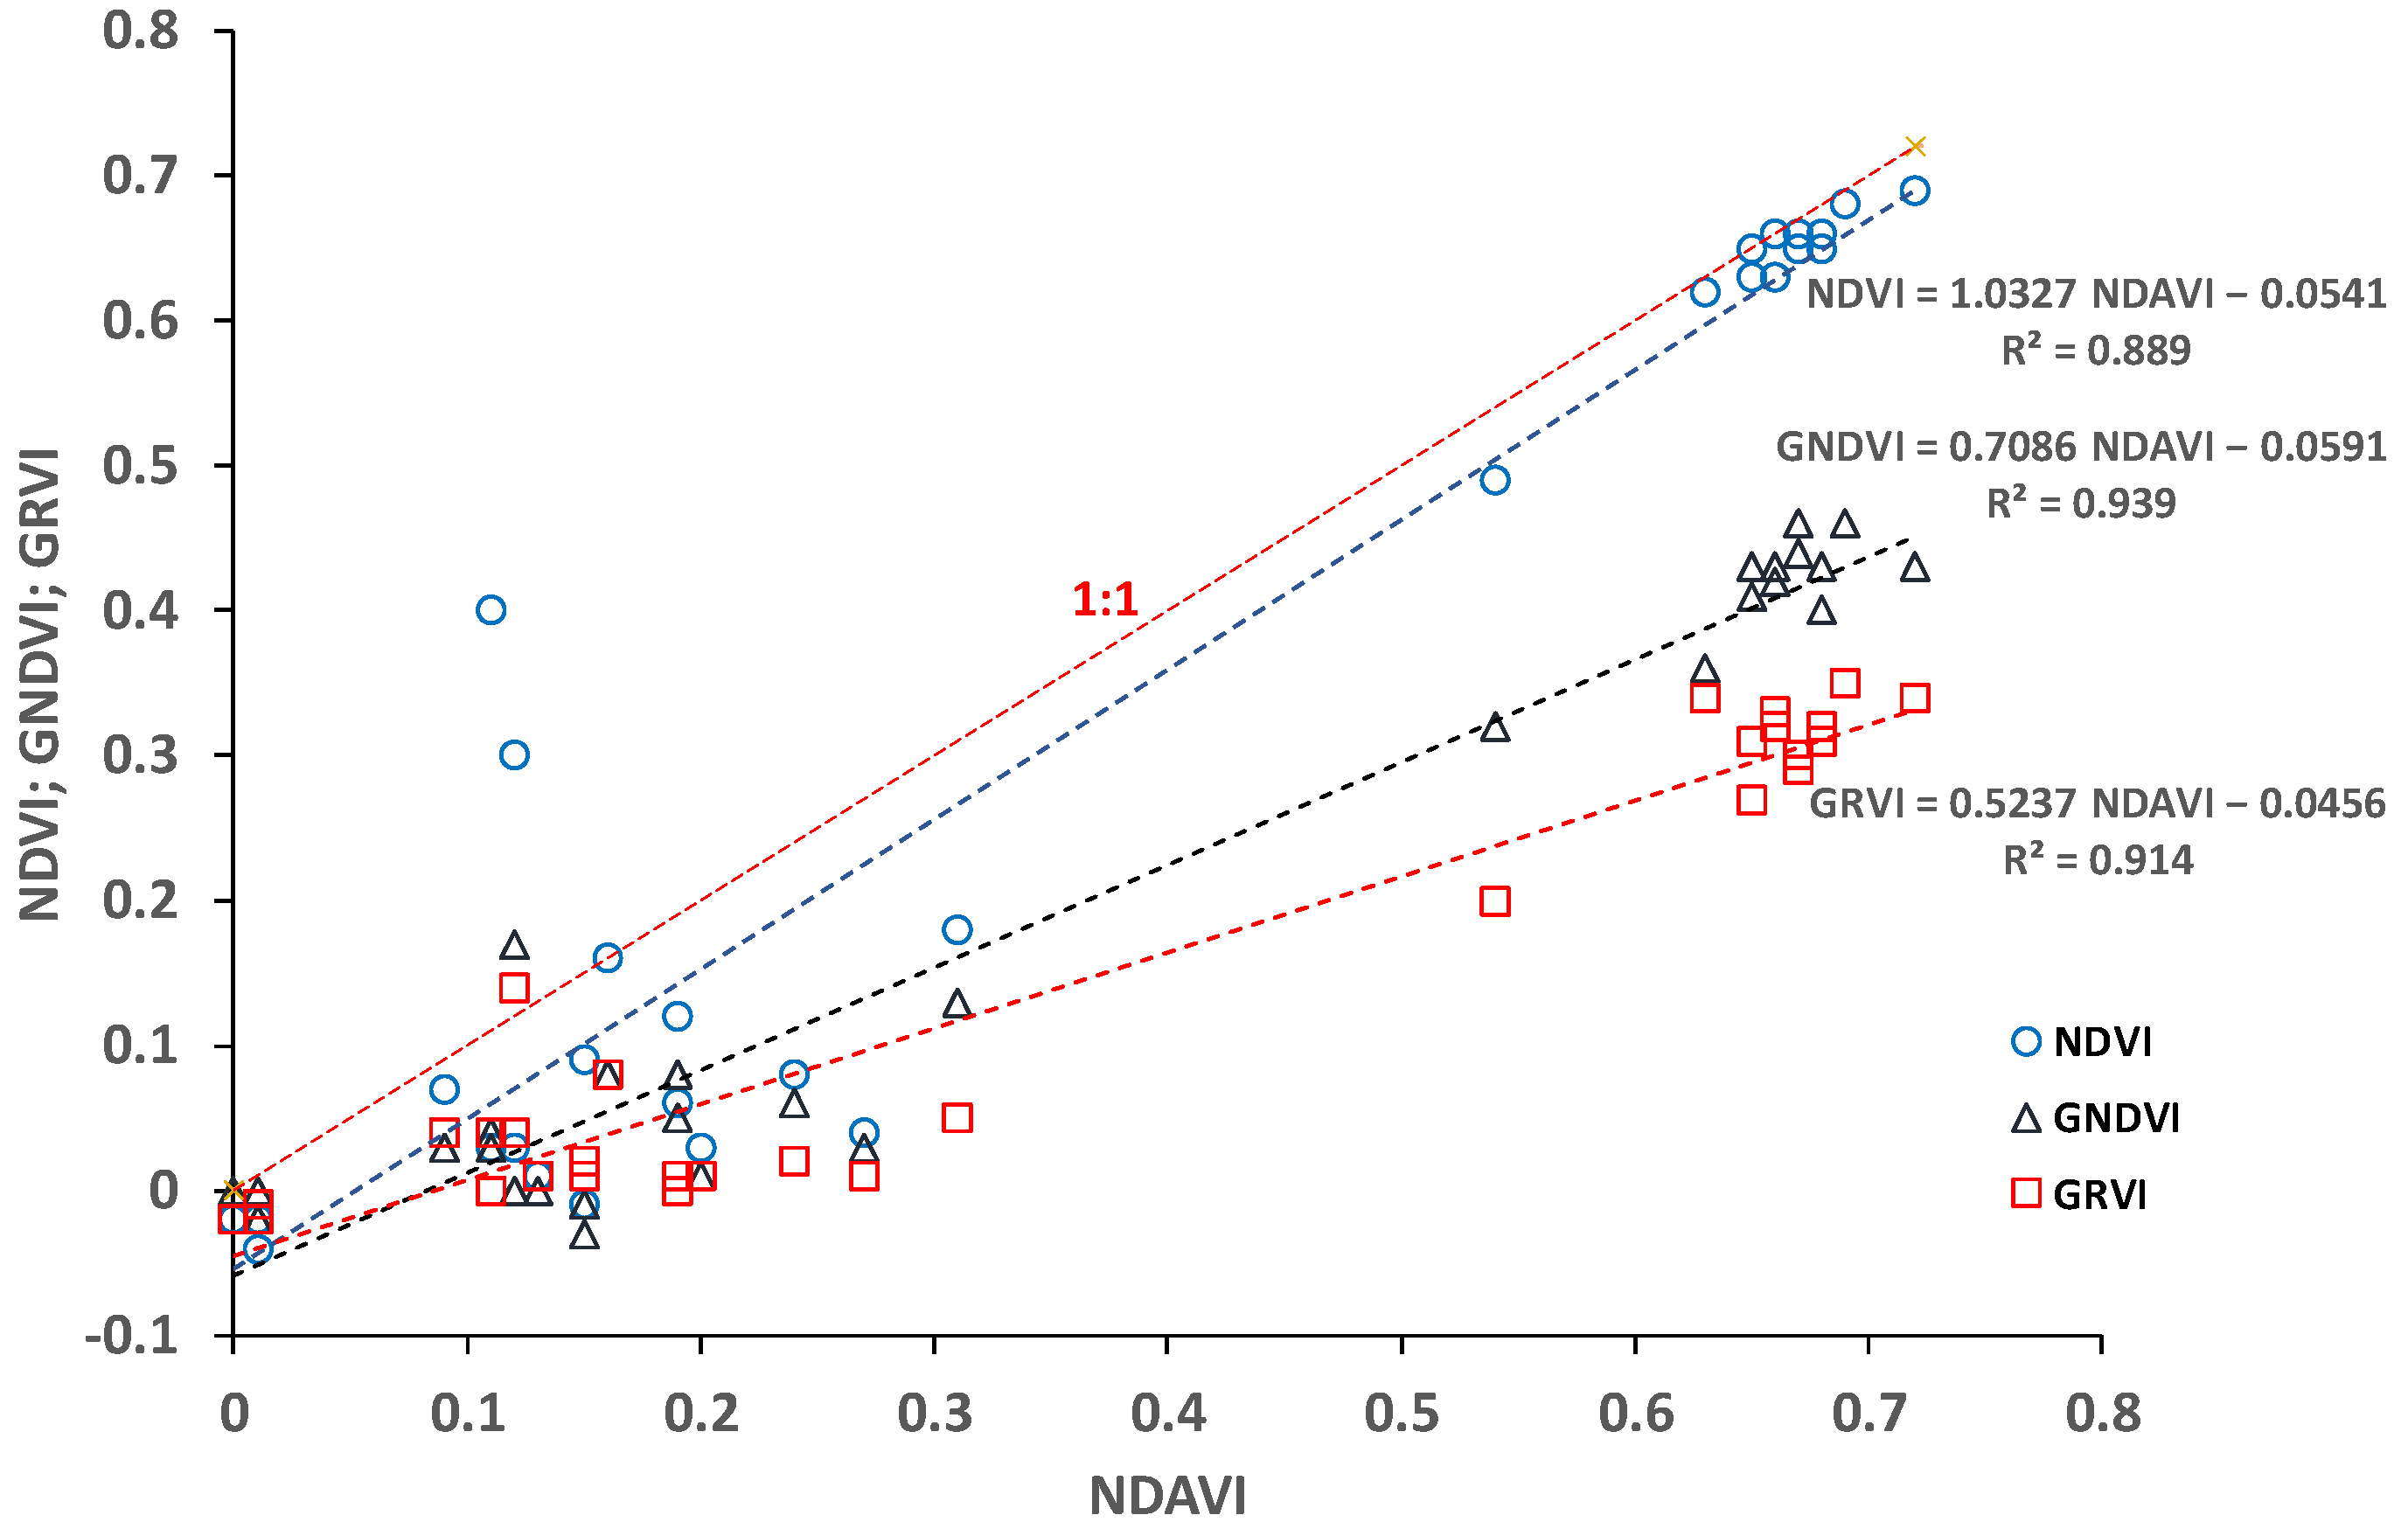
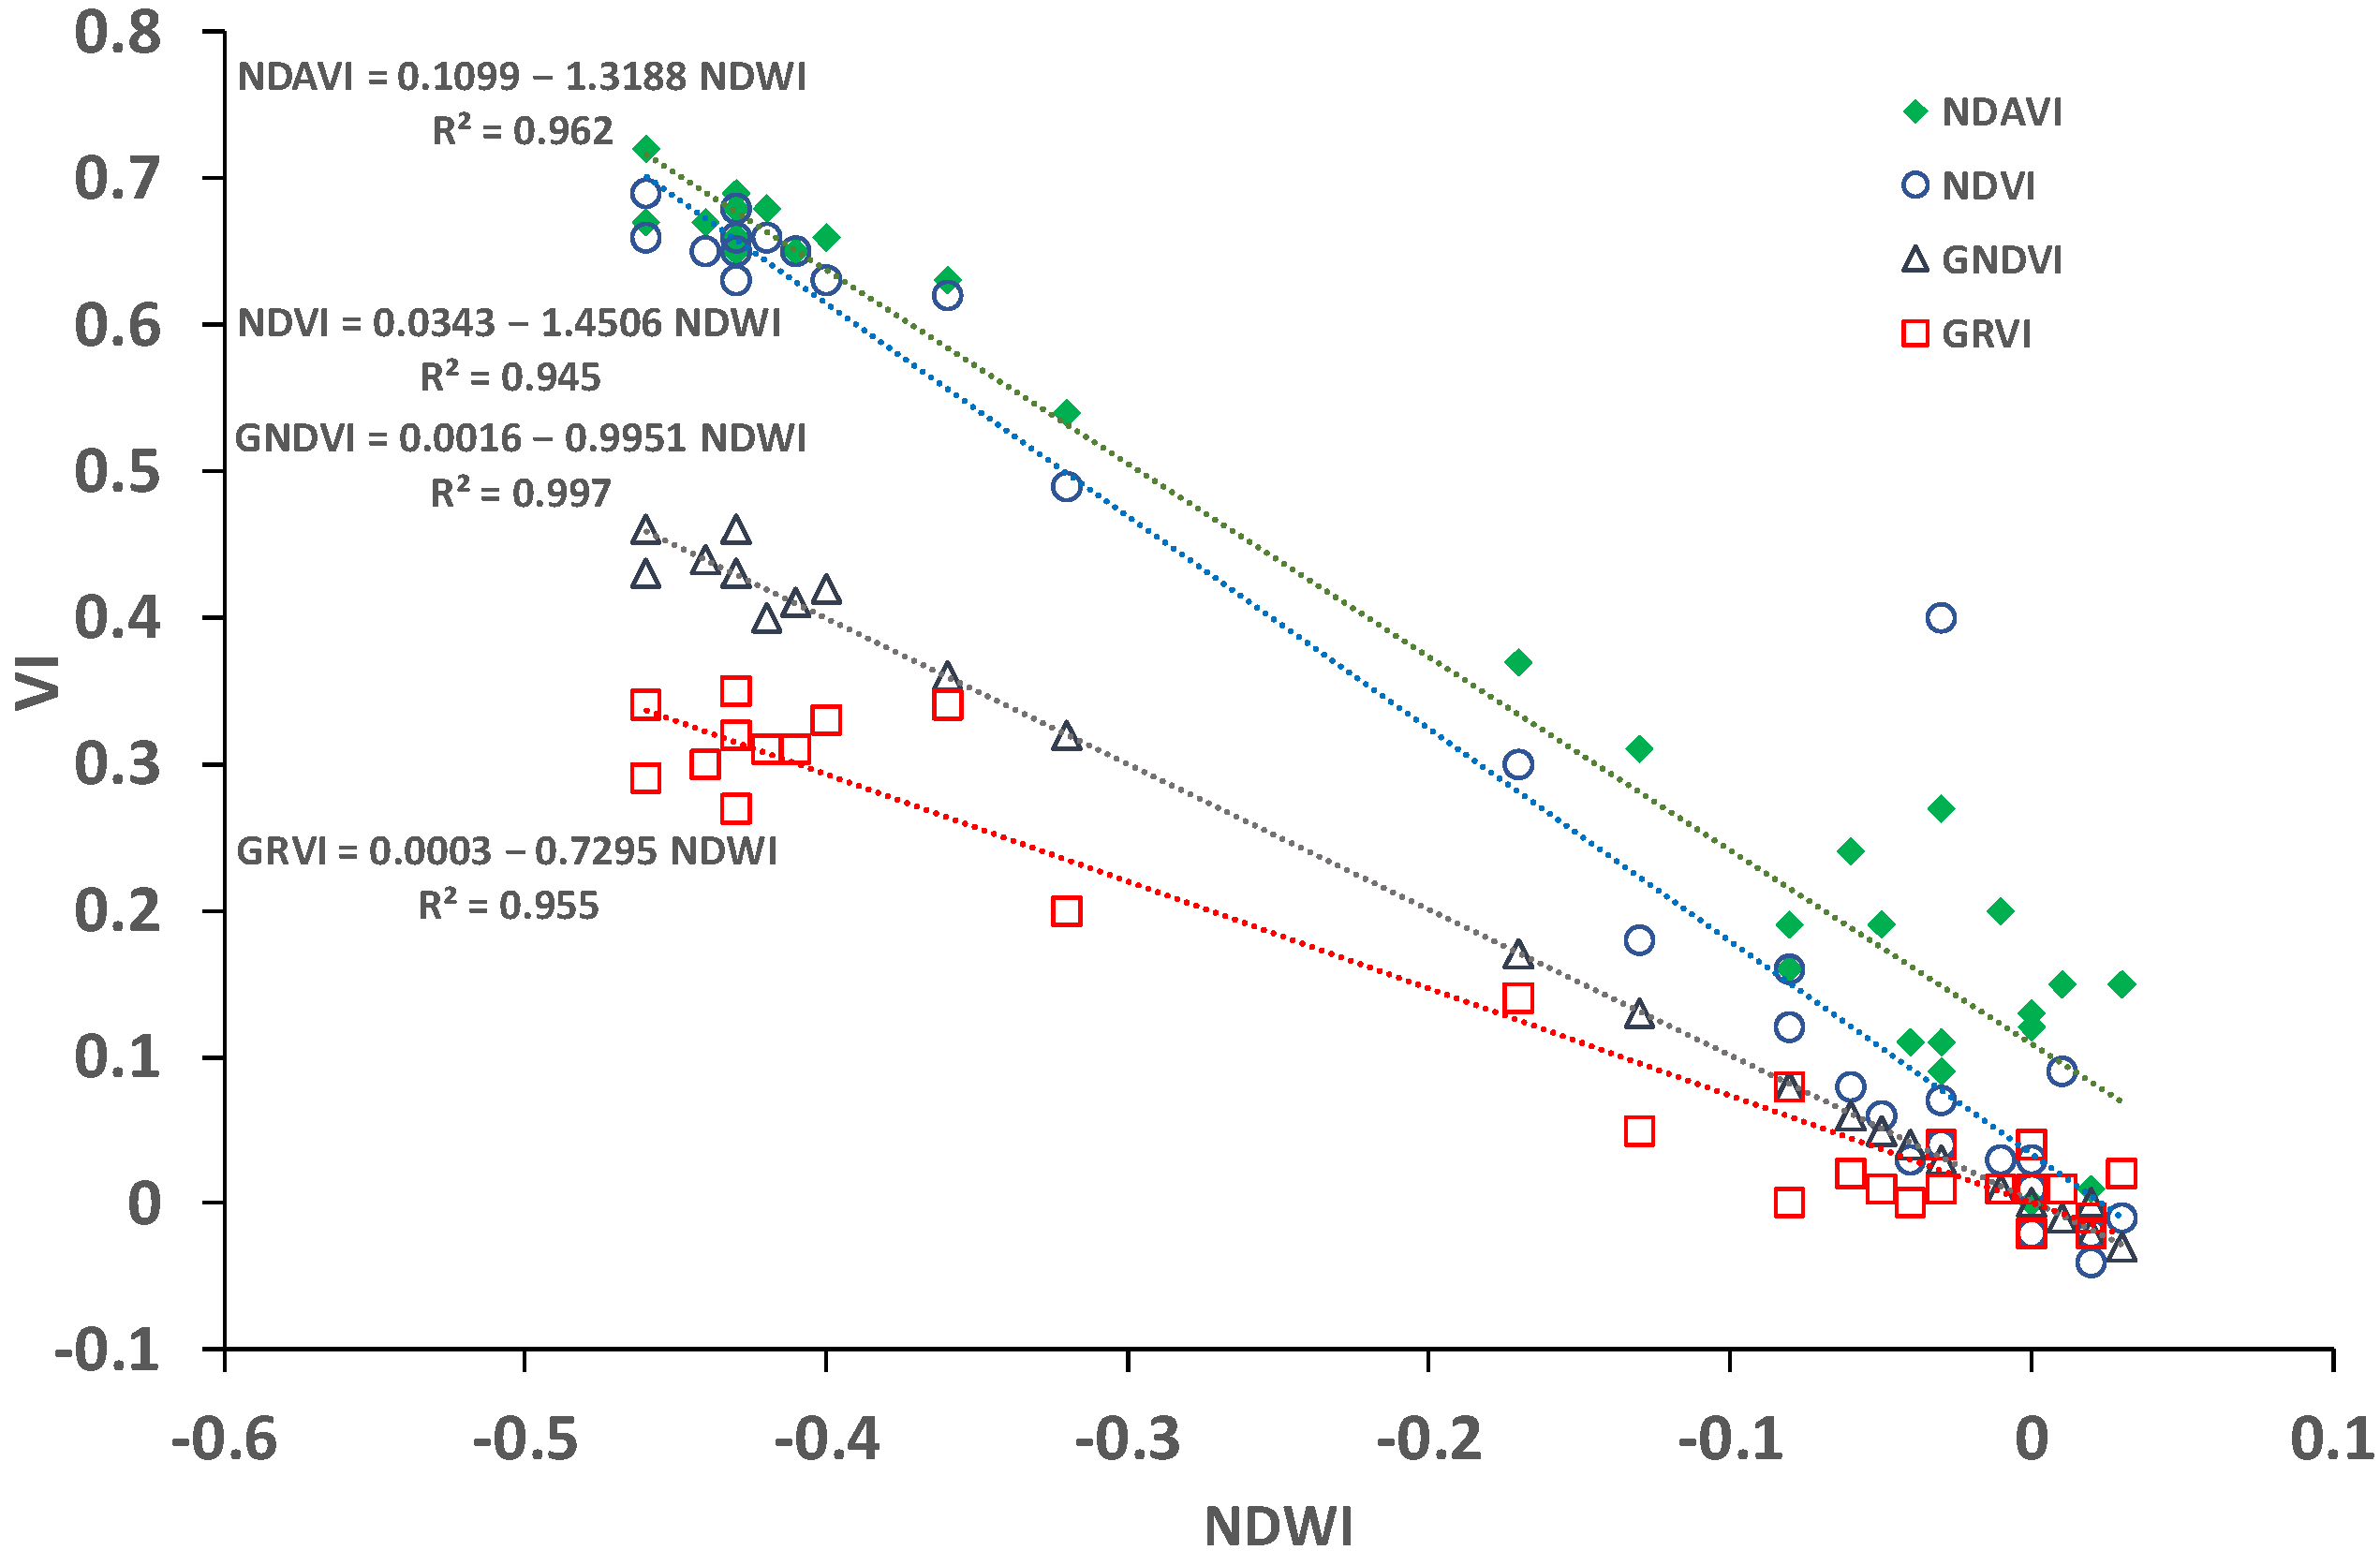
  • Among the different vegetation indices explored, NDAVI was identified as the VI that better depicted the presence of duckweeds in the surface of the watercourse for the conditions investigated in this study. However, results obtained for the other VIs are also encouraging, with NDVI showing a response that is very similar to NDAVI. Nonetheless, GNDVI and GRVI also follow the behavior of the other indices, although revealing values over a narrower range, particularly GRVI.
  • NDWI was found pertinent to complement vegetation indices in detecting the coverage of the water surface by duckweeds.
  • The multi-temporal character of Sentinel-2 data, and their areal coverage, proved to be of value in macrophytes’ monitoring programs.
  • The full understanding of the spatiotemporal behavior of duckweeds requires additional assessments of water quality (including nutrients’ content) and the hydraulics of the flow.
All these issues highlight the importance of ground truth measurements: their availability would make it possible to further improve RS data analysis. More complete measurement campaigns, including field surveys using a high-resolution multispectral drone sensor, are planned in small watercourses, in future work, namely in the Lis River.

Author Contributions

R.G. and I.P.d.L. equally contributed to the study conception and design, material preparation, data collection, data analysis, and writing of the manuscript. All authors have read and agreed to the published version of the manuscript.

Funding

The research presented here was partly supported by the European Agricultural Fund for Rural Development (FEADER), grant PDR2020-1.0.1-FEADER-030913 (project Grupo Operacional para a Gestão da Água no Vale do Lis), through the Acordo de Parceria Portugal 2020, Programa PDR2020, Medida Inovação, Submedida/Ação Inovação, Intervenção Grupos Operacionais, and Fundação para a Ciência e a Tecnologia (FCT), grant PRIMA/0006/2018 (project MEDWATERICE: Towards a sustainable water use in Mediterranean rice-based agro-ecosystems), with the support of PRIMA Programme (PRIMA-Section-2018; Topic: 1.1.3: Irrigation technologies and practices).

Data Availability Statement

The Sentinel-2 data are available via the Copernicus Open Access Hub (https://scihub.copernicus.eu/, accessed on 6 November 2021).

Conflicts of Interest

The authors declare no conflict of interest.

References

  1. Bogardi, J.J.; Leentvaar, J.; Sebesvári, Z. Biologia Futura: Integrating freshwater ecosystem health in water resources management. Biol. Futur. 2020, 71, 337–358. [Google Scholar] [CrossRef] [PubMed]
  2. Carpenter, S.R.; Lodge, D.M. Effects of submersed macrophytes on ecosystem processes. Aquat. Bot. 1986, 26, 341–370. [Google Scholar] [CrossRef]
  3. Onaindia, M.; Bikuña, B.G.; Benito, I. Aquatic plants in relation to environmental factors in Northern Spain. Environ. Manag. Today 1996, 47, 123–137. [Google Scholar] [CrossRef]
  4. Jeppesen, E.; Søndergaard, M.; Søndergaard, M.; Christoffersen, K. The Structuring Role of Submerged Macrophytes in Lakes; Springer: New York, NY, USA, 1998; ISBN 9781461206958. [Google Scholar]
  5. Scheffer, M. The effect of aquatic vegetation on turbidity; how important are the filter feeders? Hydrobiologia 1999, 408, 307–316. [Google Scholar] [CrossRef]
  6. Engelhardt, K.A.; Ritchie, M.E. Effects of macrophyte species richness on wetland ecosystem functioning and services. Nature 2001, 411, 687–689. [Google Scholar] [CrossRef]
  7. Dhote, S.; Dixit, S. Water quality improvement through macrophytes: A case study. Asian J. Exp. Sci. 2007, 21, 427–430. [Google Scholar]
  8. Thomaz, S.M.; Cunha, E.R.D. The role of macrophytes in habitat structuring in aquatic ecosystems: Methods of measurement, causes and consequences on animal assemblages’ composition and biodiversity. Acta Limnol. Bras. 2010, 22, 218–236. [Google Scholar] [CrossRef]
  9. Bornette, G.; Puijalon, S. Response of aquatic plants to abiotic factors: A review. Aquat. Sci. 2011, 73, 1–14. [Google Scholar] [CrossRef]
  10. Espel, D.; Courty, S.; Auda, Y.; Sheeren, D.; Elger, A. Submerged macrophyte assessment in rivers: An automatic mapping method using Pléiades imagery. Water Res. 2020, 186, 116353. [Google Scholar] [CrossRef]
  11. Schneider, S. Macrophyte trophic indicator values from a European perspective. Limnologica 2007, 37, 281–289. [Google Scholar] [CrossRef] [Green Version]
  12. Nichols, S.A. The interaction between biology and the management of aquatic macrophytes. Aquat. Bot. 1991, 41, 225–252. [Google Scholar] [CrossRef]
  13. Santos, M.J.; Anderson, L.W.; Ustin, S.L. Effects of invasive species on plant communities: An example using submersed aquatic plants at the regional scale. Biol. Invasions 2011, 13, 443–457. [Google Scholar] [CrossRef] [Green Version]
  14. Madsen, J.D.; Chambers, P.A.; James, W.F.; Koch, E.W.; Westlake, D.F. The interaction between water movement, sediment dynamics and submersed macrophytes. Hydrobiologia 2001, 444, 71–84. [Google Scholar] [CrossRef]
  15. Hussner, A.; Stiers, I.; Verhofstad, M.J.J.M.; Bakker, E.S.; Grutters, B.M.C.; Haury, J.; van Valkenburg, J.L.C.H.; Brundu, G.; Newman, J.; Clayton, J.S.; et al. Management and control methods of invasive alien freshwater aquatic plants: A review. Aquat. Bot. 2017, 136, 112–137. [Google Scholar] [CrossRef]
  16. Kagami, M.; Nishihiro, J.; Yoshida, T. Ecological and limnological bases for management of overgrown macrophytes: Introduction to a special feature. Limnology 2019, 20, 1–2. [Google Scholar] [CrossRef] [Green Version]
  17. Bytyqi, P.; Czikkely, M.; Shala-Abazi, A.; Fetoshi, O.; Ismaili, M.; Hyseni-Spahiu, M.; Ymeri, P.; Kabashi-Kastrati, E.; Millaku, F. Macrophytes as biological indicators of organic pollution in the Lepenci River Basin in Kosovo. J. Freshw. Ecol. 2020, 35, 105–121. [Google Scholar] [CrossRef] [Green Version]
  18. Cook, C.D.K. Aquatic Plant Book; SPB Academic Publishing: Amsterdam, The Netherlands, 1996; ISBN 9789051031324. [Google Scholar]
  19. Johnson, J.A.; Newman, R.M. A comparison of two methods for sampling biomass of aquatic plants. J. Aquat. Plant Manag. 2011, 49, 1–8. [Google Scholar]
  20. Stocks, J.R.; Rodgers, M.P.; Pera, J.B.; Gilligan, D.M. Monitoring aquatic plants: An evaluation of hydroacoustic, on-site digitising and airborne remote sensing techniques. Knowl. Manag. Aquat. Ecosyst. 2019, 420, 27. [Google Scholar] [CrossRef] [Green Version]
  21. Vis, C.; Hudon, C.; Carignan, R. An evaluation of approaches used to determine the distribution and biomass of emergent and submerged aquatic macrophytes over large spatial scales. Aquat. Bot. 2003, 77, 187–201. [Google Scholar] [CrossRef]
  22. Hunter, P.D.; Gilvear, D.J.; Tyler, A.N.; Willby, N.J.; Kelly, A. Mapping macrophytic vegetation in shallow lakes using the Compact Airbone Spectrographic Imager (CASI). Aquat. Conserv. 2010, 20, 717–727. [Google Scholar] [CrossRef]
  23. Jiang, J.H.; Su, H.; Zhai, C.; Perun, V.; Del Genio, A.D.; Nazarenko, L.S.; Donner, L.J.; Horowitz, L.W.; Seman, C.J.; Cole, J.; et al. Evaluation of cloud and water vapor simulations in CMIP5 climate models using NASA "A-Train" satellite observations. J. Geophys. Res. 2012, 117, D14105. [Google Scholar] [CrossRef] [Green Version]
  24. Coppin, P.R.; Bauer, M.E. Processing of multitemporal Landsat TM imagery to optimize extraction of forest cover change features. IEEE Trans. Geosci. Remote Sens. 1994, 32, 918–927. [Google Scholar] [CrossRef] [Green Version]
  25. Munyati, C. Wetland change detection on the Kafue Flats, Zambia, by classification of a multitemporal remote sensing image dataset. Int. J. Remote Sens. 2000, 21, 1787–1806. [Google Scholar] [CrossRef]
  26. Gilmer, D.S.; Work, E.A., Jr.; Colwell, J.E.; Rebel, D.L. Enumeration of prairie wetlands with Landsat and aircraft data. Photogramm. Eng. Remote Sens. 1980, 46, 631–634. [Google Scholar]
  27. Peñuelas, J.; Gamon, J.A.; Griffin, K.L.; Field, C.B. Assessing community type, plant biomass, pigment composition, and photosynthetic efficiency of aquatic vegetation from spectral reflectance. Remote Sens. Environ. 1993, 46, 110–118. [Google Scholar] [CrossRef]
  28. Tilley, D.R.; Ahmed, M.; Son, J.H.; Badrinarayanan, H. Hyperspectral reflectance of emergent macrophytes as an indicator of water column ammonia in an oligohaline, subtropical marsh. Eco. Eng. 2003, 21, 153–163. [Google Scholar] [CrossRef]
  29. Xie, Y.; Sha, Z.; Yu, M. Remote sensing imagery in vegetation mapping: A review. J. Plant Ecol. 2008, 1, 9–23. [Google Scholar] [CrossRef]
  30. Gilmore, M.S.; Wilson, E.H.; Barrett, N.; Civco, D.L.; Prisloe, S.; Hurd, J.D.; Chadwick, C. Integrating multi-temporal spectral and structural information to map wetland vegetation in a lower Connecticut River tidal marsh. Remote Sens. Environ. 2008, 112, 4048–4060. [Google Scholar] [CrossRef]
  31. Silva, T.S.F.; Costa, M.P.F.; Melack, J.M.; Novo, E.M.L.M. Remote sensing of aquatic vegetation: Theory and applications. Environ. Monit. Assess 2008, 140, 131–145. [Google Scholar] [CrossRef]
  32. Huete, A.R.; Justice, C.; Liu, H. Development of vegetation and soil indices for MODIS-EOS. Remote Sens. Environ. 1994, 49, 224–234. [Google Scholar] [CrossRef]
  33. Lunetta, R.S.; Knight, J.F.; Ediriwickrema, J.; Lyon, J.G.; Worthy, L.D. Land-cover change detection using multi-temporal MODIS NDVI data. Remote Sens. Environ. 2006, 105, 142–154. [Google Scholar] [CrossRef]
  34. Wardlow, B.D.; Egbert, S.L. Large-area crop mapping using time-series MODIS 250 m NDVI data: An assessment for the US Central Great Plains. Remote Sens. Environ. 2008, 112, 1096–1116. [Google Scholar] [CrossRef]
  35. Hu, C. A novel ocean color index to detect floating algae in the global oceans. Remote Sens. Environ. 2009, 113, 2118–2129. [Google Scholar] [CrossRef]
  36. Hu, C.; Li, D.; Chen, C.; Ge, J.; Muller-Karger, F.E.; Liu, J.; Yu, F.; He, M.X. On the recurrent Ulva prolifera blooms in the Yellow Sea and East China Sea. J. Geophys. Res. 2010, 115, C05017. [Google Scholar] [CrossRef] [Green Version]
  37. Villa, P.; Duan, H.; Loiselle, S.A. Using remote sensing to assess the impact of human activities on water quality: Case study of Lake Taihu. China. In Advances in Watershed Science and Assessment, The Handbook of Environmental Chemistry; Younos, T., Parece, T.E., Eds.; Springer International Publishing: Cham, Switzerland, 2015; pp. 85–110. [Google Scholar] [CrossRef]
  38. APA—Agência Portuguesa do Ambiente. Planos de Gestão de Região Hidrográfica 2016–2021—Região Hidrográfica do Vouga, Mondego e Lis, Parte 2—Caracterização e Diagnóstico; Agência Portuguesa do Ambiente: Lisboa, Portugal, 2015. [Google Scholar]
  39. SNIRH. Serviço Nacional de Informação de Recursos Hídricos. 2021. Available online: http://snirh.pt/ (accessed on 1 July 2022).
  40. Paíga, P.; Santos, L.H.M.L.M.; Ramos., S.; Jorge, S.; Silva, J.G.; Delerue-Matos, C. Presence of pharmaceuticals in the Lis River (Portugal): Sources, fate and seasonal variation. Sci. Total Environ. 2016, 573, 164–177. [Google Scholar] [CrossRef]
  41. Silva, M.A. Plantas Infestantes Estão a Invadir rio Lis e Valas Envolventes. Available online: https://www.jornaldeleiria.pt/noticia/plantas-infestantes-estao-a-invadir-rio-lis-e-valas-envolventes-4977 (accessed on 21 November 2021).
  42. Figueiredo, A.; Alves, C.; Patriarca, J.; Cardoso, A.S.; Castro, P.; Loureiro, J. Would rainfed agriculture be the right option under climate change scenarios? A case study from Centro Region of Portugal. In Theory and Practice of Climate Adaptation. Climate Change Management; Alves, F., Leal Filho, W., Azeiteiro, U., Eds.; Springer: Cham, Switzerland, 2018. [Google Scholar] [CrossRef]
  43. IPMA. Boletins Climatológicos. 2021. Available online: https://www.ipma.pt/pt/publicacoes/boletins.jsp?cmbDep=cli&cmbTema=pcl&cmbAno=2021&idDep=cli&idTema=pcl&curAno=2021 (accessed on 1 July 2022).
  44. Khellaf, N.; Zerdaoui, M. Growth, photosynthesis and respiratory response to copper in Lemna minor: A potential use of duckweed in biomonitoring. Iran J. Environ. Health Sci. Eng. 2010, 7, 299–306. [Google Scholar]
  45. Iqbal, J.; Javed, A.; Baig, M.A. Growth and nutrient removal efficiency of duckweed (Lemna minor) from synthetic and dumpsite leachate under artificial and natural conditions. PLoS ONE 2019, 14, e0221755. [Google Scholar] [CrossRef]
  46. Appenroth, K.J.; Borisjuk, N.; Lam, E. Telling duckweed apart: Genotyping technologies for the Lemnaceae. Chin. J. Appl. Environ. Biol. 2013, 19, 1–10. [Google Scholar] [CrossRef]
  47. Van Hoeck, A.; Horemans, N.; Monsieurs, P.; Cao, H.X.; Vandenhove, H.; Blust, R. The first draft genome of the aquatic model plant Lemna minor opens the route for future stress physiology research and biotechnological applications. Biotechnol. Biofuels 2015, 8, 118. [Google Scholar] [CrossRef] [Green Version]
  48. Landolt, E. Lemnaceae. In The Families and Genera of Vascular Plants, Volume IV. Flowering Plants—Monocotyledons; Kubitzki, K., Ed.; Springer Berlin: Heidelberg, Germany, 1998; pp. 264–270. [Google Scholar]
  49. European Space Agency (ESA). Scihub. 2021. Available online: https://scihub.copernicus.eu/dhus/#/home (accessed on 22 November 2021).
  50. Sentinel-2 User Handbook. ESA Standard Document. Issue 1, Rev 2. 24 July 2015. Available online: https://sentinels.copernicus.eu/documents/247904/685211/Sentinel-2_User_Handbook.pdf/8869acdf-fd84-43ec-ae8c-3e80a436a16c?t=1438278087000 (accessed on 22 November 2021).
  51. Buschmann, C.; Lenk, S.; Lichtenthaler, H.K. Reflectance spectra and images of green leaves with different tissue structure and chlorophyll content. Isr. J. Plant Sci. 2012, 60, 49–64. [Google Scholar] [CrossRef]
  52. Rouse, J.W., Jr.; Haas, R.H.; Schell, J.A.; Deering, D.W.; Harlan, J.C. Monitoring the Vernal Advancement and Retrogradation (Green Wave Effect) of Natural Vegetation; NASA/GSFCT Type III Final Report1; Remote Sensing Center, Texas A&M University: College Station, TX, USA, 1974. [Google Scholar]
  53. Lillesaeter, O. Spectral reflectance of partly transmitting leaves—Laboratory measurements and mathematical-modeling. Remote Sens. Environ. 1982, 12, 247–254. [Google Scholar] [CrossRef]
  54. Baret, F.; Guyot, G. Potentials and limits of vegetation indexes for LAI and APAR assessment. Remote Sens. Environ. 1991, 35, 161–173. [Google Scholar] [CrossRef]
  55. Viso-Vázquez, M.; Acuña-Alonso, C.; Rodríguez, J.L.; Álvarez, X. Remote detection of cyanobacterial blooms and chlorophyll-a analysis in a eutrophic reservoir using Sentinel-2. Sustainability 2021, 13, 8570. [Google Scholar] [CrossRef]
  56. De Lima, I.P.; Jorge, R.G.; de Lima, J.L.M.P. Remote sensing monitoring of rice fields: Towards assessing water saving irrigation management practices. Front. Remote Sens. 2021, 2, 762093. [Google Scholar] [CrossRef]
  57. Ma, R.; Duan, H.; Gu, X.; Zhang, S. Detecting aquatic vegetation changes in Taihu Lake, China using multi-temporal satellite imagery. Sensors 2008, 8, 3988–4005. [Google Scholar] [CrossRef] [Green Version]
  58. Cheruiyot, E.K.; Mito, C.; Menenti, M.; Gorte, B.; Koenders, R.; Akdim, N. Evaluating MERIS-based aquatic vegetation mapping in Lake Victoria. Remote Sens. 2014, 6, 7762–7782. [Google Scholar] [CrossRef] [Green Version]
  59. Song, B.; Park, K. Detection of aquatic plants using multispectral UAV imagery and vegetation index. Remote Sens. 2020, 12, 387. [Google Scholar] [CrossRef] [Green Version]
  60. Gerardo, R.; de Lima, I.P. Assessing the potential of Sentinel-2 data for tracking invasive water hyacinth in a river branch. J. Appl. Remote Sens. 2022, 16, 014511. [Google Scholar] [CrossRef]
  61. Liang, S.; Gong, Z.; Wang, Y.; Zhao, J.; Zhao, W. Accurate monitoring of submerged aquatic vegetation in a macrophytic lake using time-series Sentinel-2 images. Remote Sens. 2022, 14, 640. [Google Scholar] [CrossRef]
  62. Gitelson, A.A.; Merzlyak, M.N. Signature analysis of leaf reflectance spectra: Algorithm development for remote sensing of chlorophyll. J. Plant Physiol. 1996, 148, 494–500. [Google Scholar] [CrossRef]
  63. Rodríguez-López, L.; Duran-Llacer, I.; González-Rodríguez, L.; Abarca-del-Rio, R.; Cárdenas, R.; Parra, O.; Martínez-Retureta, R.; Urrutia, R. Spectral analysis using LANDSAT images to monitor the chlorophyll-a concentration in Lake Laja in Chile. Ecol. Inform. 2020, 60, 101183. [Google Scholar] [CrossRef]
  64. Kim, E.J.; Nam, S.H.; Koo, J.W.; Hwang, T.M. Hybrid approach of Unmanned Aerial Vehicle and Unmanned Surface Vehicle for assessment of chlorophyll-a imagery using spectral indices in Stream, South Korea. Water 2021, 13, 1930. [Google Scholar] [CrossRef]
  65. Villa, P.; Laini, A.; Bresciani, M.; Bolpagni, R. A remote sensing approach to monitor the conservation status of lacustrine Phragmites australis beds. Wetl. Ecol. Manag. 2013, 21, 399–416. [Google Scholar] [CrossRef]
  66. Villa, P.; Bresciani, M.; Braga, F.; Bolpagni, R. Comparative assessment of broad-band vegetation indices over aquatic vegetation. IEEE J. Sel. Top. Appl. Earth Obs. Remote Sens. 2014, 7, 3117–3127. [Google Scholar] [CrossRef]
  67. Zhou, G.; Ma, Z.; Sathyendranath, S.; Platt, T.; Jiang, C.; Sun, K. Canopy reflectance modeling of aquatic vegetation for algorithm development: Global sensitivity analysis. Remote Sens. 2018, 10, 837. [Google Scholar] [CrossRef] [Green Version]
  68. Motohka, T.; Nasahara, K.N.; Oguma, H.; Tsuchida, S. Applicability of Green-Red Vegetation Index for remote sensing of vegetation phenology. Remote Sens. 2010, 2, 2369–2387. [Google Scholar] [CrossRef] [Green Version]
  69. Rotta, L.H.S.; Mishra, D.R.; Watanabe, F.S.; Rodrigues, T.W.; Alcântara, E.H.; Imai, N.N. Analyzing the feasibility of a space-borne sensor (SPOT-6) to estimate the height of submerged aquatic vegetation (SAV) in inland waters. ISPRS J. Photogramm. Remote Sens. 2018, 144, 341–356. [Google Scholar] [CrossRef] [Green Version]
  70. McFeeters, S.K. The use of the Normalized Difference Water Index (NDWI) in the delineation of open water features. Int. J. Remote Sens. 1996, 17, 1425–1432. [Google Scholar] [CrossRef]
  71. McFeeters, S.K. Using the Normalized Difference Water Index (NDWI) within a Geographic Information System to detect swimming pools for mosquito abatement: A practical approach. Remote Sens. 2013, 5, 3544–3561. [Google Scholar] [CrossRef] [Green Version]
  72. Fisher, A.; Flood, N.; Danaher, T. Comparing Landsat Water Index methods for automated water classification in Eastern Australia. Remote Sens. Environ. 2016, 175, 167–182. [Google Scholar] [CrossRef]
  73. Brinkhoff, J.; Hornbuckle, J.; Barton, J.L. Assessment of aquatic weed in irrigation channels using UAV and satellite imagery. Water 2018, 10, 1497. [Google Scholar] [CrossRef] [Green Version]
  74. Pal, S.; Paul, S. Assessing wetland habitat vulnerability in moribund Ganges delta using bivariate models and machine learning algorithms. Ecol. Indic. 2020, 119, 106866. [Google Scholar] [CrossRef]
  75. Chauhan, K.; Patel, J.; Shukla, S.H.; Kalubarme, M.H. Monitoring water spread and aquatic vegetation using Spectral Indices in Nalsarovar, Gujarat State-India. Int. J. Environ. Geoinform. 2021, 8, 49–56. [Google Scholar] [CrossRef]
  76. Chen, A.; Orlov-Levin, V.; Elharar, O.; Meron, M. Comparing satellite and high-resolution visible and thermal aerial imaging of field crops for precision irrigation management and plant biomass forecast. In Precision Agriculture’19; Wageningen Academic Publishers: Wageningen, The Netherlands, 2019; pp. 37–44. [Google Scholar] [CrossRef]
  77. Ghosh, A.; Nanda, M.K.; Sarkar, D.; Sarkar, S.; Brahmachari, K.; Ray, K. Application of multi-dated sentinel-2 imageries to assess the cropping system in Gosaba Island of Indian Sundarbans. J. Indian Soc. Coast. Agric. Res. 2019, 37, 32–44. [Google Scholar]
  78. Cho, H.J.; Kirui, P.; Natarajan, H. Test of multi-spectral vegetation index for floating and canopy-forming submerged vegetation. Int. J. Environ. Res. Public Health 2008, 5, 477–483. [Google Scholar] [CrossRef] [PubMed] [Green Version]
Figure 1. Study area: (a) Location of the Lis River basin, in the center of Portugal: the shaded red area identifies the Lis Valley Irrigation District (LVID). (b) Zoom in of the study site, focusing on a selected section of the Lis River (adapted from Google Earth 2021).
Water 14 02284 g001
Figure 2. View of Lis River (left panel) illustrating the presence of Lemna minor at the adult stage in the study area (5 August 2021). This section of the river shows a composite cross-section, and the water surface width is approximately 25 m. The red arrows give the approximate location of the center of the observed areas A1 and A2 (see the text for details). A zoom view of the aquatic weed is shown on the right panel.
Water 14 02284 g002
Figure 3. Illustration of the temporal (seasonal) variation in the presence of invasive aquatic plants (Lemna minor) in a section of the Lis River, Portugal (Figure 1b and Figure 2). Images are from the Sentinel-2 satellite (10 m spatial resolution).
Water 14 02284 g003
Figure 4. Observing the invasive aquatic plant Lemna minor in a section of the Lis River, near Monte Real (Portugal): (a) Location of the three sample areas (red squares: A1, A2, A3; markers are not to scale) on the river water surface. (b) Diagram of a typical quadrangular sample area, of 100 m2.
Water 14 02284 g004
Figure 5. Maps illustrating the spatial distribution of the presence of invasive aquatic plants (Lemna minor) in a section of the Lis River (Figure 1, Figure 2 and Figure 3), for VIs NDVI, NDAVI, GNDVI, and GRVI. The data are from Sentinel-2 imagery (10 m spatial resolution), for 2021: (a) 26 July; (b) 15 August; (c) 21 September. The maps apply a red-yellow-green palette to the VIs’ imagery: green signals healthy vegetation and red signals areas lacking vegetation.
Water 14 02284 g005
Figure 6. Temporal variation in Sentinel-2-based vegetation and water indices calculated for the three sample areas, A1, A2, and A3 (Figure 4a), defined on the water surface of a section of the Lis River infested with duckweeds, over a period of four months (6 June–6 October 2021): (a) NDVI, (b) NDAVI, (c) GNDVI, (d) GRVI, and (e) NDWI.
Water 14 02284 g006
Figure 7. Relationship between NDAVI and each of the vegetation indices NDVI, GNDVI, and GRVI. The data are for three pixel-size sample areas, A1, A2, and A3 (Figure 4a), identified in a section of the Lis River infested with duckweeds, and for the period 6 June to 6 October 2021. The linear regression equations and coefficients of determination are provided. Line 1:1 is shown.
Water 14 02284 g007
Figure 8. Relationship between the NDWI and NDAVI, NDVI, GNDVI, and GRVI. The indices were calculated from Sentinel-2 data at 10 m spatial resolution, for the period 6 June–6 October 2021, for assessing the presence of duckweeds in a section of the Lis River (Portugal). The sample includes data from three observed areas defined on the river water surface (Figure 4a).
Water 14 02284 g008
Table 1. Precipitation and temperature (T) data observed at Leiria weather station during the study period, in 2021. Last column indicates the date of occurrence of the maximum daily precipitation in a given month [43].
Month
(2021)
Mean Tmin
(°C)
Mean Tmax
(°C)
Absolute Tmin (°C)Absolute Tmax
(°C)
Precipitation
(mm)
Maximum Daily Prec.
(mm)
Date
June13.223.08.031.935.58.812
July14.624.610.537.04.81.73
August14.425.89.533.03.32.22
September14.626.29.335.488.230.714
October11.424.25.530.095.835.930
Table 2. Features of the Sentinel-2 images used in this study.
Band IDBandWavelength Center (nm)Band Width
(nm)
Spatial Resolution (m)
B2Blue4906510
B3Green5603510
B4Red6653010
B8Near Infrared84311510
Publisher’s Note: MDPI stays neutral with regard to jurisdictional claims in published maps and institutional affiliations.

