
Prospective Water Balance Scenarios (2015–2035) for the Management of São Francisco River Basin, Eastern Brazil

 ,
,  and
and
Abstract
:
1. Introduction
- (i)
- Model surface water and groundwater availability in the São Francisco Basin, based on monitoring data;
- (ii)
- Develop the São Francisco River Basin’s surface water and groundwater balances for 2010 and in projections for 2025 and 2035, assuming three economic scenarios for water demand (a pessimistic, an optimistic and an equilibrated), developed as described by Bettencourt et al. [28];
- (iii)
- Identify sub-basins that are (and will be) most affected by water scarcity for each water use;
- (iv)
- Present guidelines for sustainable management of the basin water resources.
2. Materials and Methods
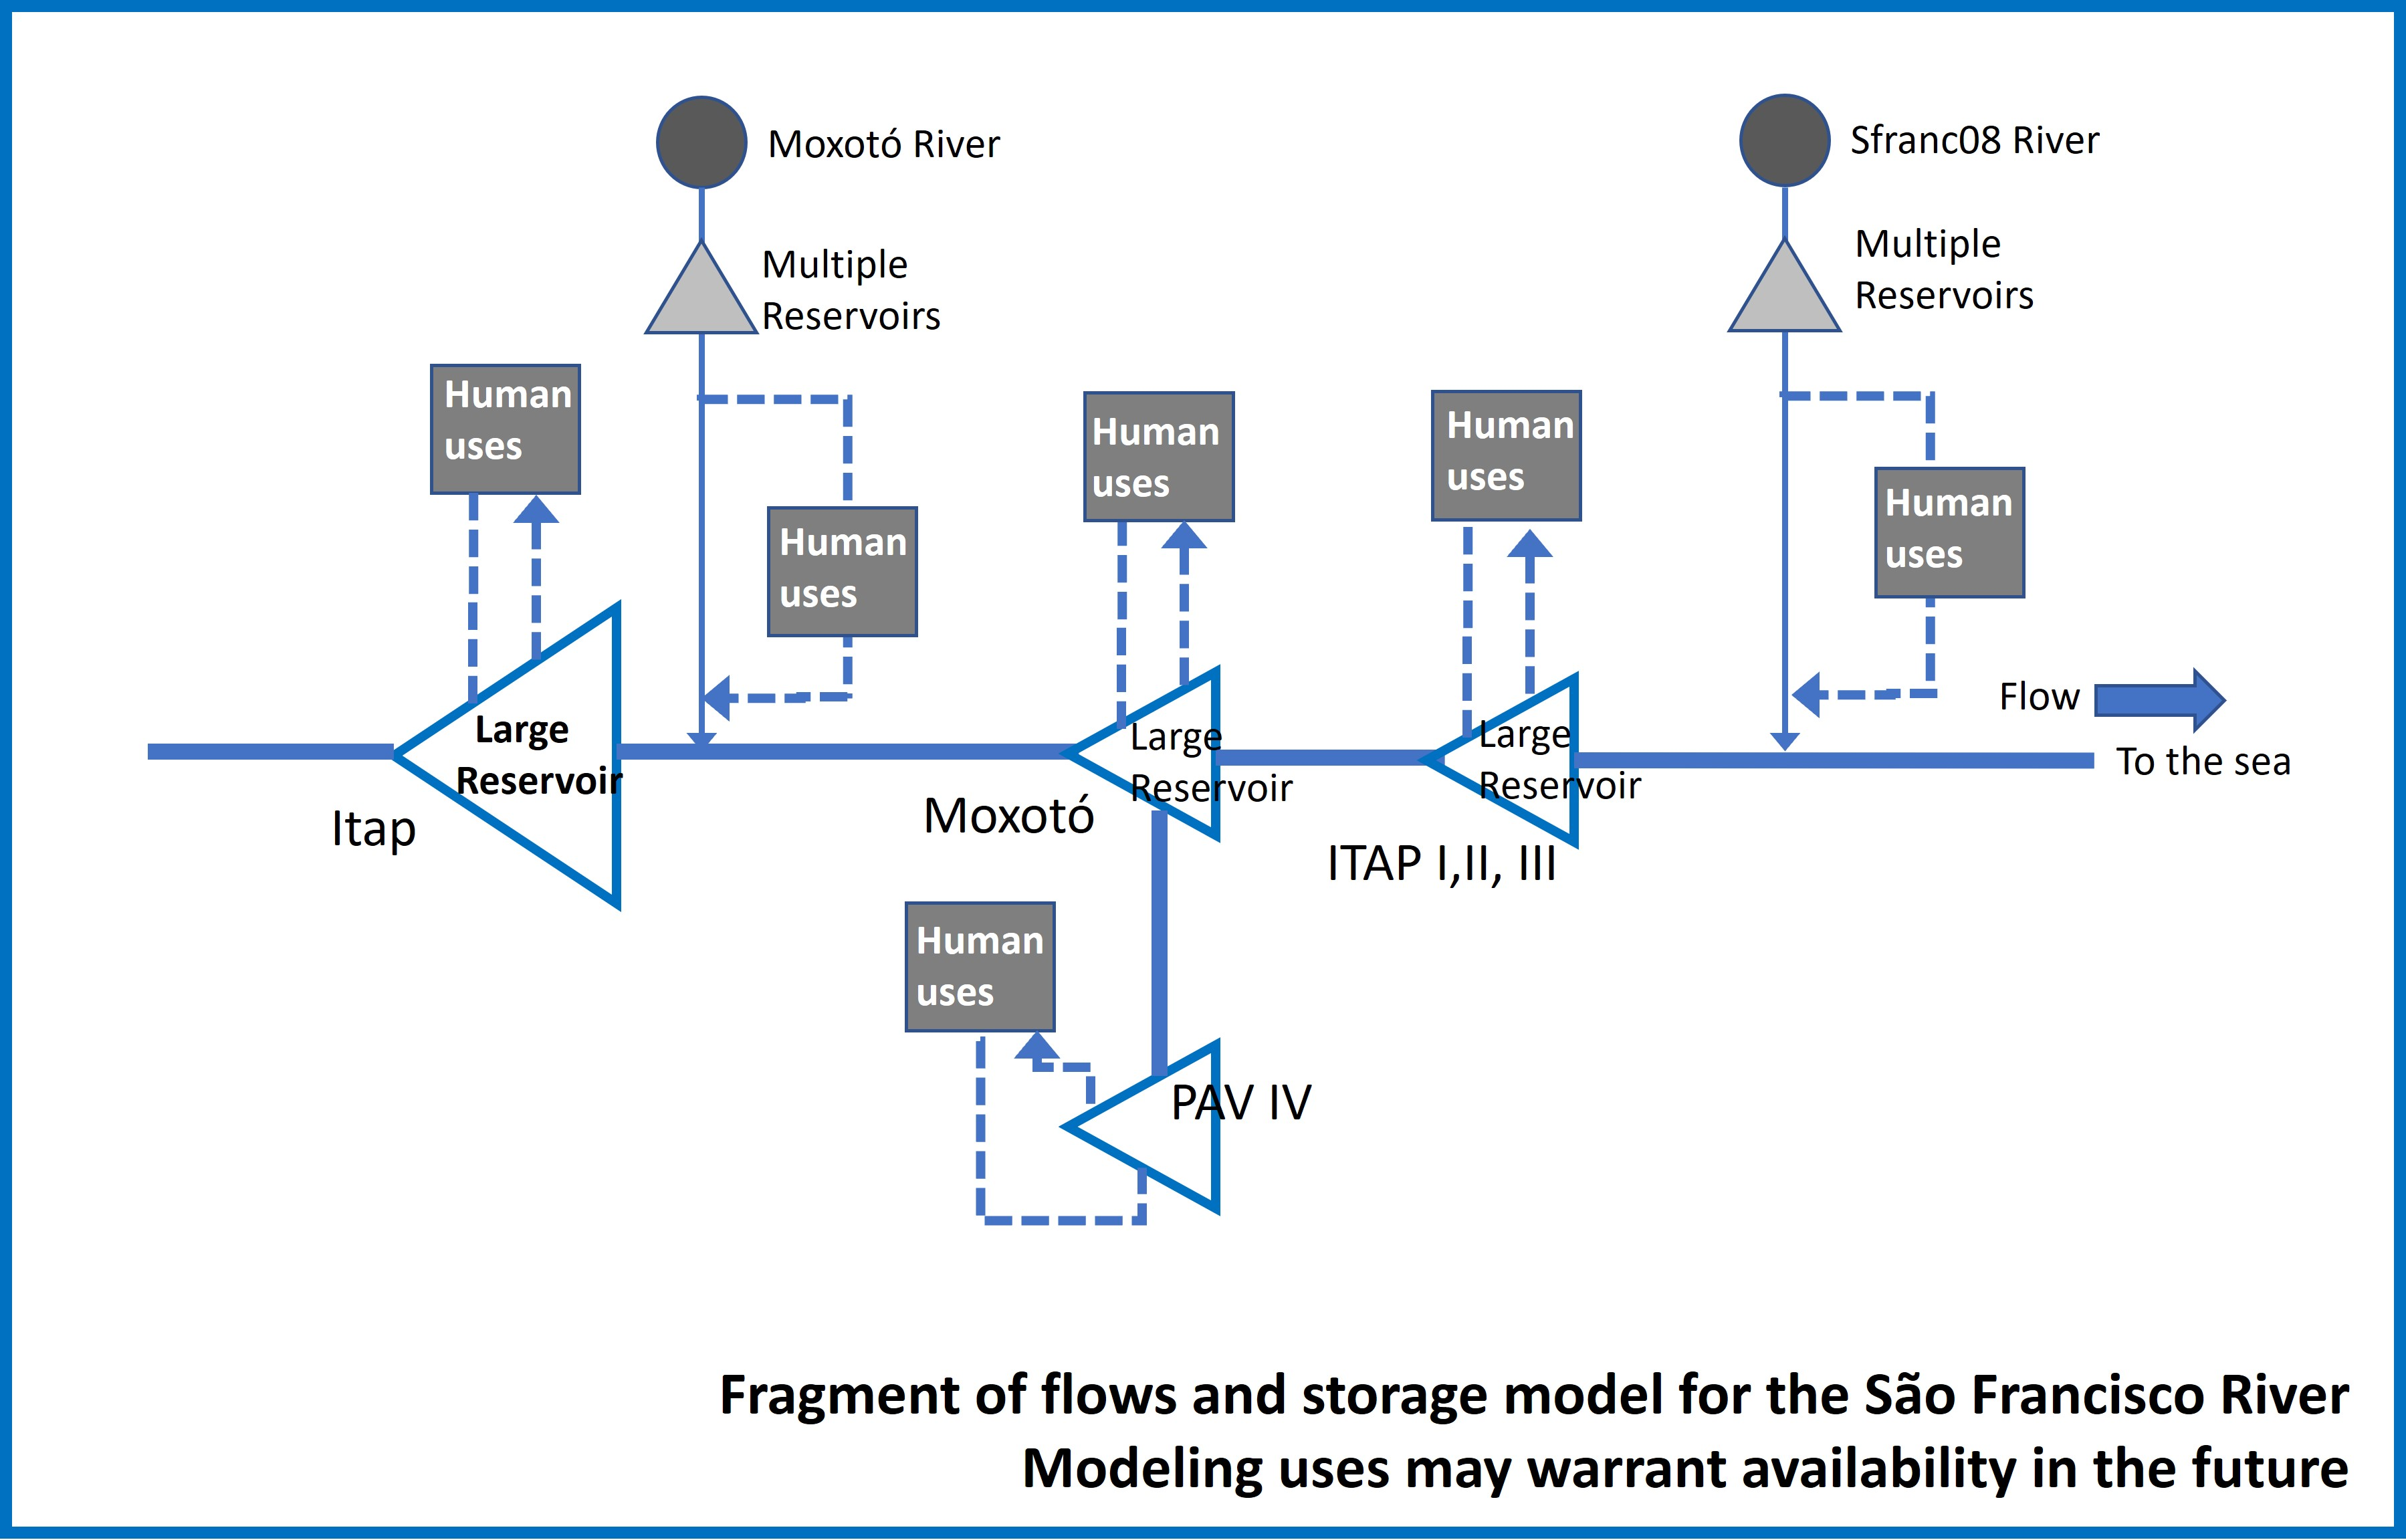
2.1. Study Area

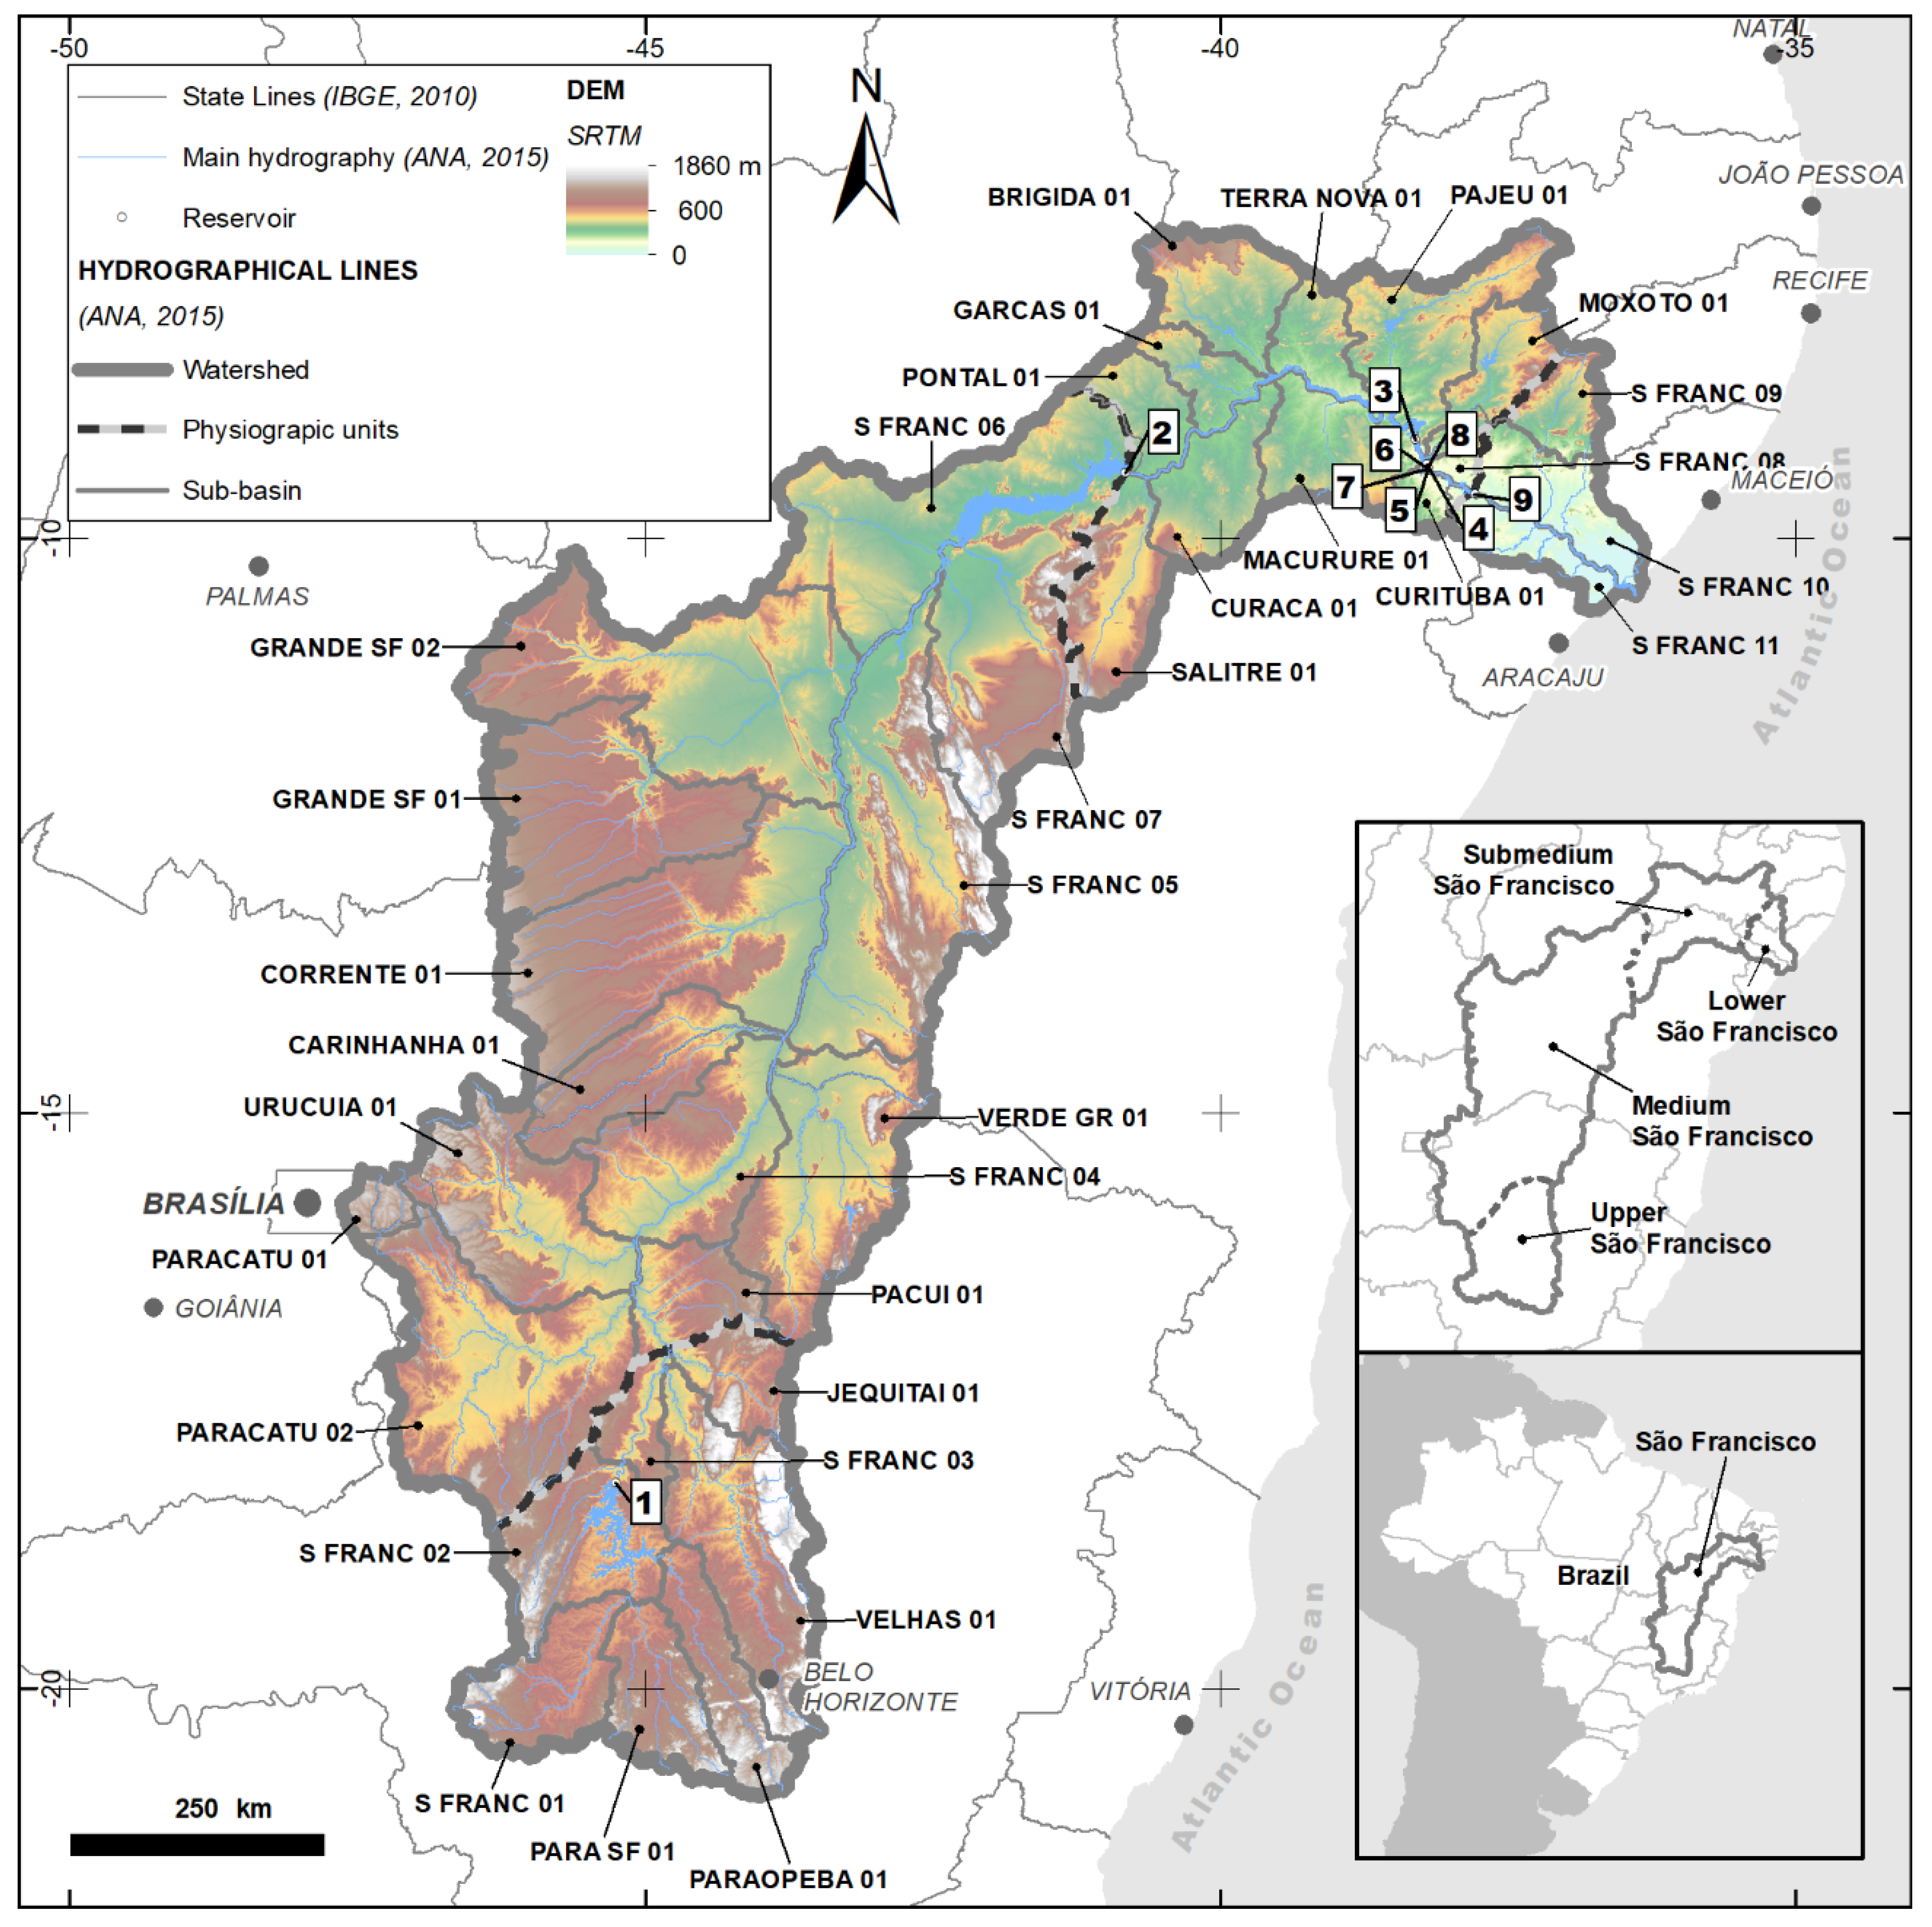
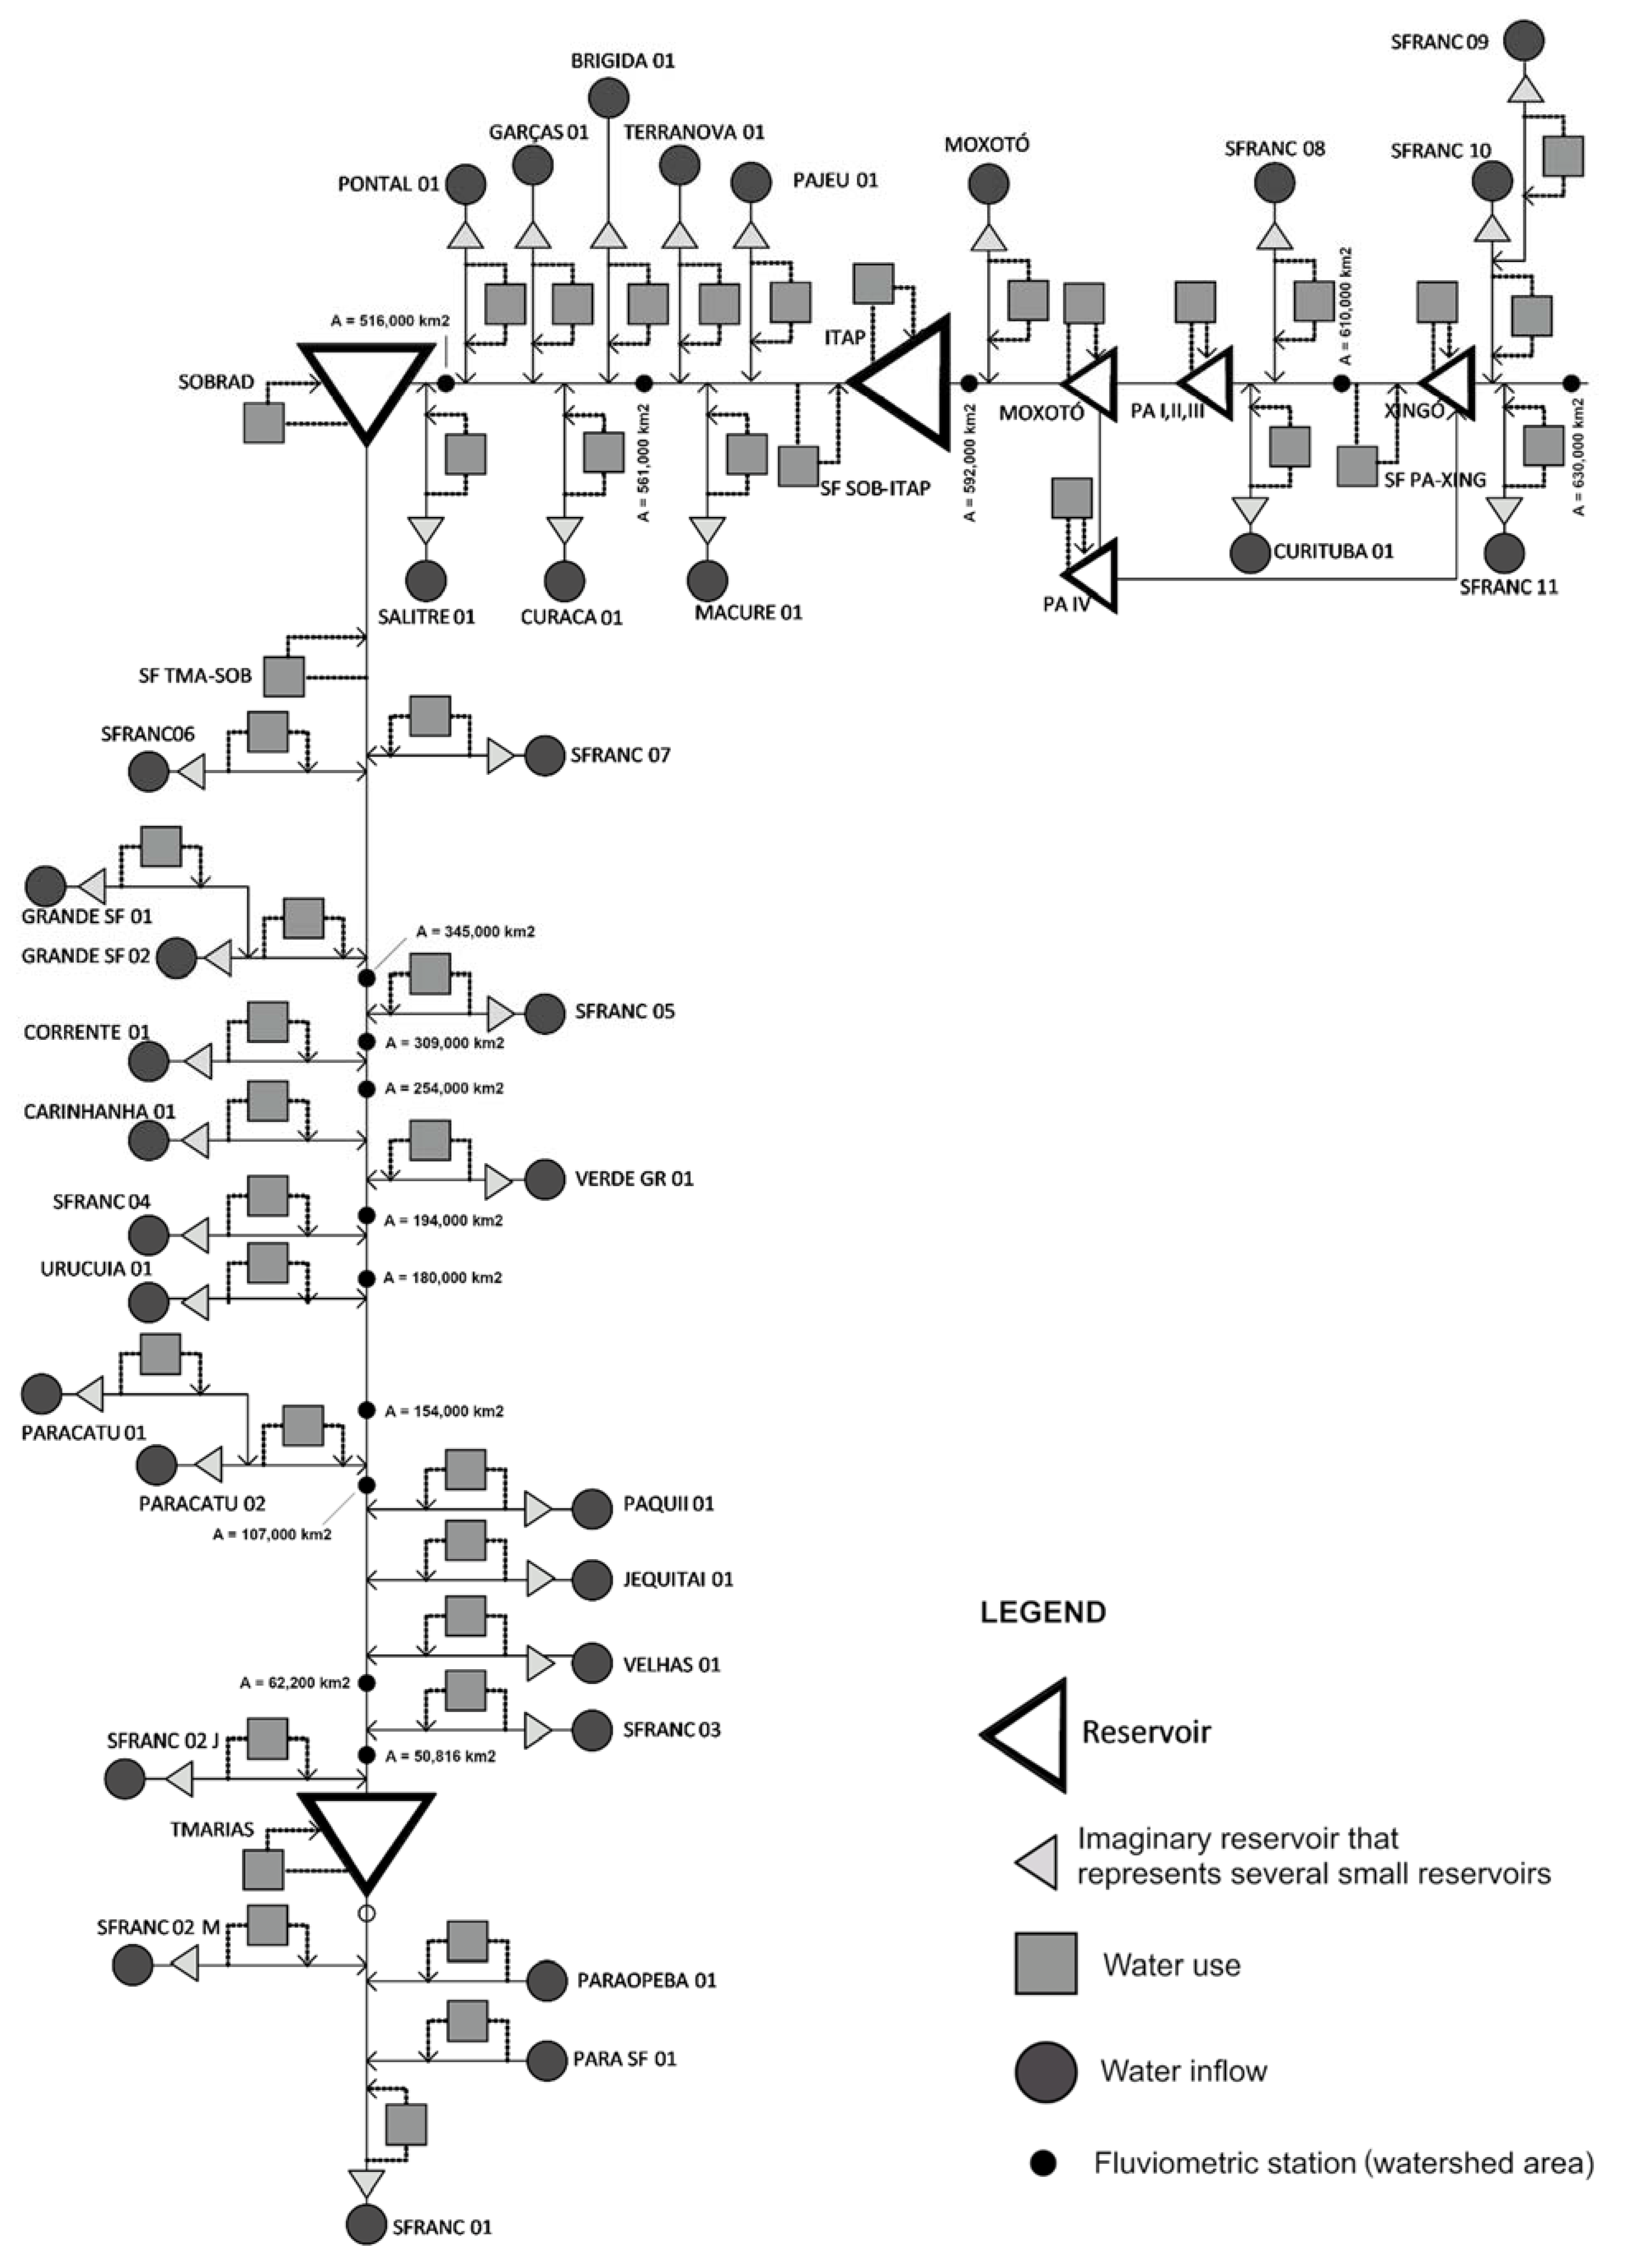
2.2. Water Availability

2.3. Water Demands
- From Upper and Medium São Francisco, within 5 km from the main channel;
- From Sub-medium and Lower São Francisco, within 10 km from the main channel.
- Water diversion of the São Francisco River Integration Project (PISF), a recently constructed system diverting water to the semi-arid Northeast Region of Brazil;
- Water diversion for supplying the metropolitan region of Aracaju by the Sergipe Sanitation Company (DESO);
- Large irrigation projects.
2.4. Surface Water Balance
- RLB, Reliability (as described by Hashimoto et al. [55]), percentage of the time period in which demands are satisfied, which is calculated from the frequency of availability below demand (ABD, %), which is the proportion of months in the year where demand is not fully fulfilled by availability; thus, RLB = 100 − ABD;
- VBL, Vulnerability, likely magnitude of a failure, if one occurs [55], given by the ratio between the average flow supplied when failures occur and the required average demand.
2.5. Groundwater Balance
- Ratio below 10%: Excellent;
- Ratio between 10% and 40%: Comfortable, requiring management to solve local supply problems;
- Ratio between 40% and 60%: Concerning, requiring management activity;
- Ratio between 60% and 100%: Critical, requiring intense management activity;
- Ratio above 100%: Very critical.
3. Results
3.1. Surface Water Resources
3.2. Groundwater Resources
4. Discussion
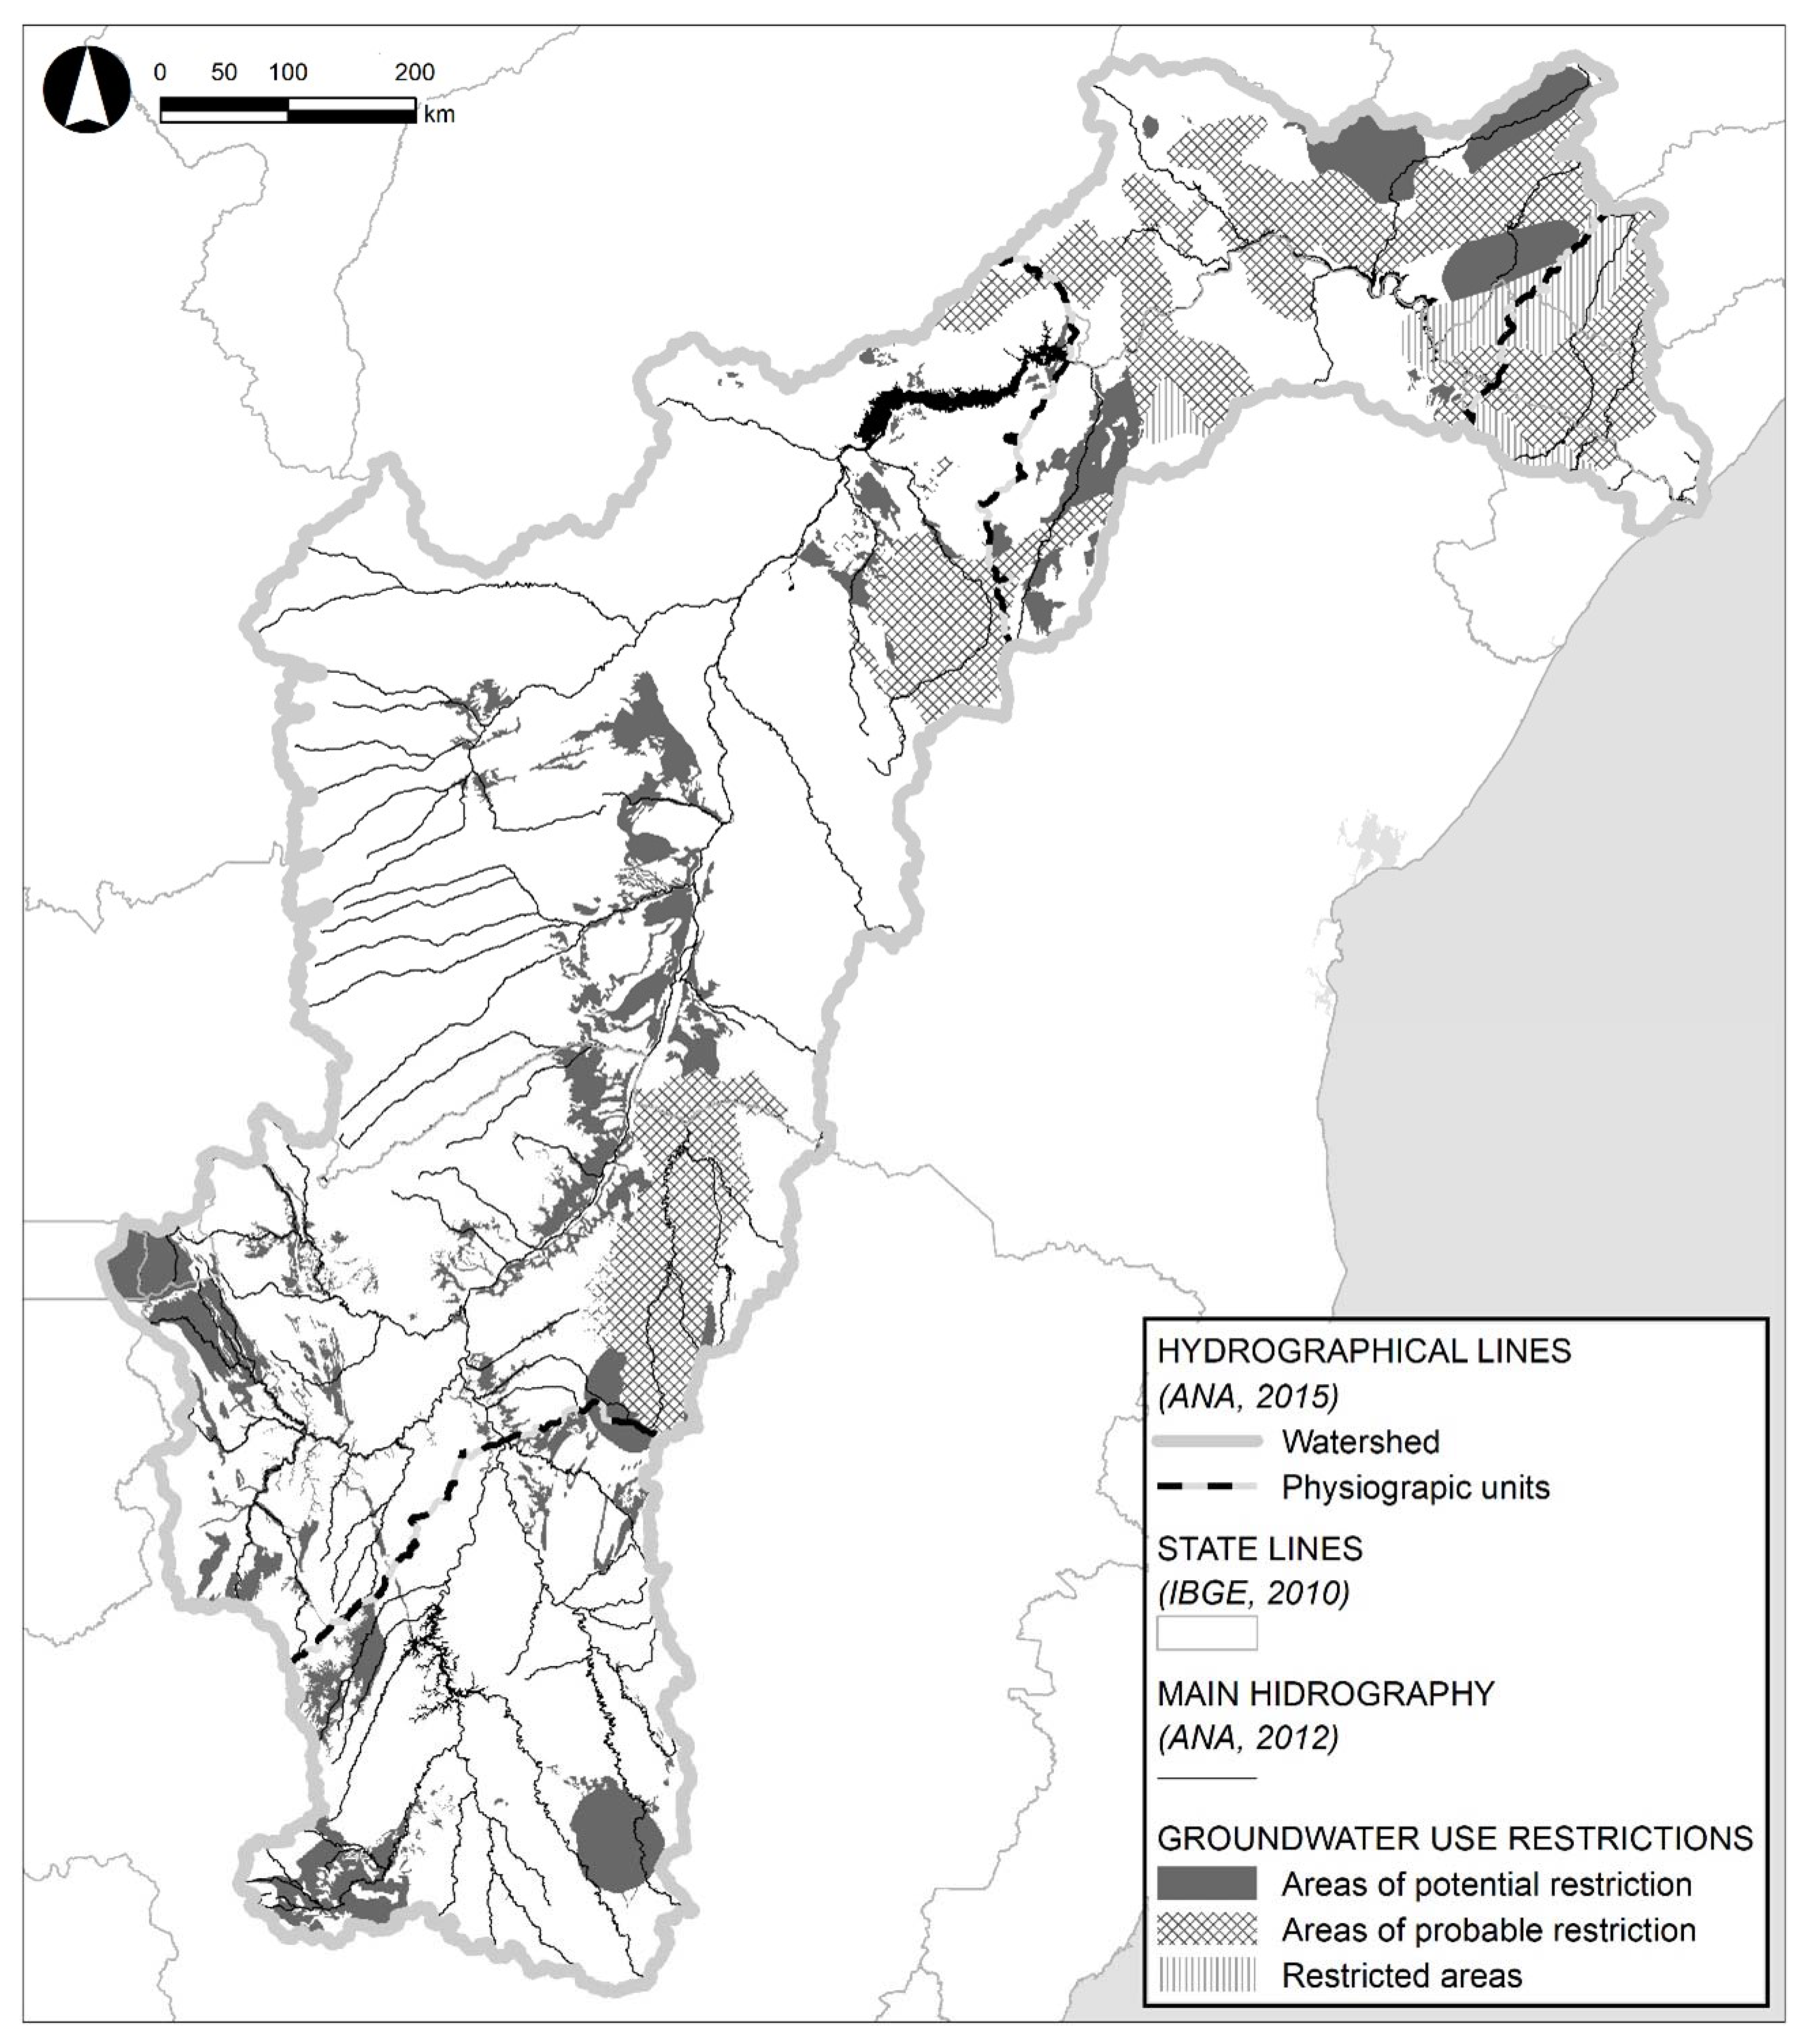
- Areas of potential use restriction—11% of the hydrographic basin, these areas include aquifers that may not have sufficient availability to satisfy demanded projections, together with areas with a high density of wells (such as the Verde Grande basin), highly vulnerable to pollution;
- Areas of probable use restriction—14% of the basin are areas where there is evidence of poor groundwater quality for human consumption, as groundwater of Salitre aquifer [62] and the Bambuí aquifer [29,63,64], where the literature refers to the occurrence of overexploitation situations. These areas occur mainly in the Sub-medium and in Low São Francisco, in the semiarid region;
- Restricted areas—2% of the basin area does not present drinking quality.
5. Conclusions
Supplementary Materials
Author Contributions
Funding
Data Availability Statement
Acknowledgments
Conflicts of Interest
References
- Oki, T.; Valeo, C.; Heal, K. (Eds.) Hydrology 2020: An Integrating Science to Meet World Water Challenges; International Association of Hydrological Sciences Press: Wallingford, UK, 2006; Volume 300, p. 190. [Google Scholar]
- Postel, S. Last Oasis: Facing Water Scarcity, 2nd ed.; W.W. Norton: New York, NY, USA, 1997. [Google Scholar]
- Vogel, R.M. Hydromorphology. J. Water Resour. Plan. Manag. 2011, 137, 147–149. [Google Scholar] [CrossRef]
- Srinivasan, V.; Lambin, E.F.; Gorelick, S.M.; Thompson, B.H.; Rozelle, S. The nature and causes of the global water crisis: Syndromes from a meta-analysis of coupled human-water studies. Water Resour. Res. 2012, 48, W10516. [Google Scholar] [CrossRef]
- Sivapalan, M.; Savenije, H.H.G.; Blöschl, G. Socio-hydrology: A new science of people and water. Hydrol. Process. 2012, 26, 1270–1276. [Google Scholar] [CrossRef]
- Montanari, A.; Young, G.; Savenije, H.H.G.; Hughes, D.; Wagener, T.; Ren, L.L.; Koutsoyiannis, D.; Cudennec, C.; Toth, E.; Grimaldi, S.; et al. Panta Rhei—Everything flows: Change in hydrology and society—The IAHS scientific decade 2013–2022. Hydrol. Sci. J. 2013, 58, 1256–1275. [Google Scholar] [CrossRef]
- Yang, Y.C.E.; Brown, C.; Yu, W.; Wescoat, J.; Ringler, C. Water governance and adaptation to climate change in the Indus river basin. J. Hydrol. 2014, 519, 2527–2537. [Google Scholar] [CrossRef] [Green Version]
- Peleg, N.; Morin, E.; Gvirtzman, H.; Enzel, Y. Rainfall, spring discharge and past human occupancy in the eastern mediterranean. Clim. Chang. 2012, 112, 769–789. [Google Scholar] [CrossRef]
- Mitchell, N.; Kumarasamy, K.; Cho, S.J.; Belmont, P.; Dalzell, B.; Gran, K. Reducing high flows and sediment loading through increased water storage in an agricultural watershed of the upper midwest, USA. Water 2018, 10, 1053. [Google Scholar] [CrossRef] [Green Version]
- Araujo, P.C.; Avelar, A.D. A multiscale approach to land use change in Tijuca forest, Rio de Janeiro. Cad. Geogr. 2018, 37, 71–79. [Google Scholar] [CrossRef]
- Silalertruksa, T.; Gheewala, S.H. Land-water-energy nexus of sugarcane production in Thailand. J. Clean. Prod. 2018, 182, 521–528. [Google Scholar] [CrossRef]
- Stenzel, F.; Gerten, D.; Werner, C.; Jagermeyr, J. Freshwater requirements of large-scale bioenergy plantations for limiting global warming to 1.5 degrees C. Environ. Res. Lett. 2019, 14, 13. [Google Scholar] [CrossRef]
- Bettencourt, P.; Fulgêncio, C.; Grade, M.; Wasserman, J.C. A comparison between the european and the brazilian models for management and diagnosis of watersheds. Water Policy 2021, 23, 58–76. [Google Scholar] [CrossRef]
- Bhave, A.G.; Conway, D.; Dessai, S.; Stainforth, D.A. Water resource planning under future climate and socioeconomic uncertainty in the Cauvery river basin in Karnataka, India. Water Resour. Res. 2018, 54, 708–728. [Google Scholar] [CrossRef] [PubMed]
- Fabre, J.; Ruelland, D.; Dezetter, A.; Grouillet, B. Simulating past changes in the balance between water demand and availability and assessing their main drivers at the river basin scale. Hydrol. Earth Syst. Sci. 2015, 19, 1263–1285. [Google Scholar] [CrossRef] [Green Version]
- Safavi, H.R.; Golmohammadi, M.H.; Sandoval-Solis, S. Expert knowledge based modeling for integrated water resources planning and management in the Zayandehrud river Basin. J. Hydrol. 2015, 528, 773–789. [Google Scholar] [CrossRef]
- Koch, H.; Liersch, S.; de Azevedo, J.R.G.; Silva, A.L.C.; Hattermann, F.F. Assessment of observed and simulated low flow indices for a highly managed river basin. Hydrol. Res. 2018, 49, 1831–1846. [Google Scholar] [CrossRef]
- Lee, H.; Chan, Z.; Graylee, K.; Kajenthira, A.; Martinez, D.; Roman, A. Challenge and response in the Sao Francisco river basin. Water Policy 2014, 16, 153–200. [Google Scholar] [CrossRef]
- da Silva, M.V.; Silveira, C.D.; Costa, J.M.; Martins, E.S.; Vasconcelos Júnior, F.D. Projection of climate change and consumptive demands projections impacts on hydropower generation in the São Francisco river basin, Brazil. Water 2021, 13, 332. [Google Scholar] [CrossRef]
- Teixeira, A.L.d.F.; Bhaduri, A.; Bunn, S.E.; Ayrimoraes, S.R. Operationalizing water security concept in water investment planning: Case Study of São Francisco river basin. Water 2021, 13, 3658. [Google Scholar] [CrossRef]
- da Silva, G.N.S.; de Moraes, M.M.G.A. Economic water management decisions: Trade-offs between conflicting objectives in the sub-middle region of the Sao Francisco watershed. Reg. Environ. Chang. 2018, 18, 1957–1967. [Google Scholar] [CrossRef]
- Paredes-Trejo, F.; Barbosa, H.A.; Giovannettone, J.; Kumar, T.V.L.; Thakur, M.K.; Buriti, C.d.O.; Uzcátegui-Briceño, C. Drought assessment in the São Francisco river basin using satellite-based and ground-based indices. Remote Sens. 2021, 13, 3921. [Google Scholar] [CrossRef]
- Lucas, M.C.; Kublik, N.; Rodrigues, D.B.B.; Meira Neto, A.A.; Almagro, A.; Melo, D.d.C.D.; Zipper, S.C.; Oliveira, P.T.S. Significant baseflow reduction in the Sao Francisco river basin. Water 2021, 13, 2. [Google Scholar] [CrossRef]
- Ferrarini, A.d.S.F.; Ferreira Filho, J.B.d.S.; Cuadra, S.V.; Victoria, D.d.C. Water demand prospects for irrigation in the São Francisco river: Brazilian public policy. Water Policy 2020, 22, 449–467. [Google Scholar] [CrossRef] [Green Version]
- Roman, P. The São Francisco interbasin water transfer in Brazil: Tribulations of a megaproject through constraints and controversy. Water Altern. 2017, 10, 395–419. [Google Scholar]
- Souza da Silva, G.N.; Alcoforado de Moraes, M.M.G. Decision support for the (inter-)basin management of water resources using integrated hydro-economic modeling. Hydrology 2021, 8, 42. [Google Scholar] [CrossRef]
- Carneiro, A.C.G.; de Araujo, I.T., Jr.; de Alcoforado, M. Regional input-output matrix for sub-middle hydrographic region of the São Francisco river basin in Brazil. In Proceedings of the 25th International Input-Output Conference & 7th Edition of the International School of I-O Analysis, Atlantic City, NJ, USA, 19–23 June 2017; p. 154. [Google Scholar]
- Bettencourt, P.; Fernandes, P.A.; Fulgêncio, C.; Canas, Â.; Wasserman, J.C. Water management in the São Francisco river basin; sustainably challenges. Sustain. Water Resour. Manag. 2022, submited. [Google Scholar]
- Matos, B.A.; Zoby, J.L.G. Projeto de Gerenciamento Integrado das Atividades Desenvolvidas em Terra na Bacia do São Francisco. Subprojeto 4.5C–Plano Decenal de Recursos Hídricos da Bacia Hidrográfica do Rio São Francisco -PBHSF (2004–2013). Estudo Técnico de Apoio ao PBHSF–Disponibilidade Hídrica Quantitativa e Usos Consuntivos.; ANA/GEF/PNUMA/OEA; Superintendência de Planejamento de Recursos Hídricos: Brasília, Brazil, 2004; p. 63. [Google Scholar]
- Cirilo, J.A. Políticas públicas de recursos hídricos para o semi-árido. Estud. Avançados 2008, 22, 61–82. [Google Scholar] [CrossRef] [Green Version]
- Dias Gonçalves, R.; Engelbrecht, B.; Chang, H. Evolução da contribuição do Sistema Aquífero Urucuia para o Rio São Francisco, Brazil. Águas Subterrâneas 2018, 32, 1. [Google Scholar] [CrossRef] [Green Version]
- Souza, M.D.C.F.B.; Oliveira, S.M.A.C.; Paixão, M.M.D.O.M.; Haussmann, M.G. Aspectos Hidrodinâmicos e Qualidade das Águas Subterrâneas do Aquífero Bambuí no Norte de Minas Gerais. Braz. J. Water Resour. 2014, 19, 119–129. [Google Scholar] [CrossRef]
- Freitas, M.; Lopes, A.; Pante, A.; Mitre, L. Ana/Gef/Pnuma/Oea (2004)-Projeto De Gerenciamento Integrado Das Atividades Desenvolvidas Em Terra Na Bacia Do São Francisco-Subprojeto 4.5c–Plano Decenal De Recursos Hídricos Da Bacia Hidrográfica Do Rio São Francisco-Pbhsf (2004–2013)-Estudo Técnico De Apoio Ao Pbhsf–No. 16; Alocação De Água: Federal, Brazil, 2004. [Google Scholar] [CrossRef]
- Arnold, J.G.; Fohrer, N. SWAT2000: Current capabilities and research opportunities in applied watershed modelling. Hydrol. Process. 2005, 19, 563–572. [Google Scholar] [CrossRef]
- WMO—World Meteorological Organization. Guide to Meteorological Instruments and Methods of Observation, 15th ed.; World Meteorological Organization: Geneva, Switzerland, 1983; Volume 8, p. 160. [Google Scholar]
- Nachtergaele, F.; Petri, M. Mapping Land Use Systems at Global and Regional Scales for Land Degradation; Food and Agriculture Organization of the United Nations: Rome, Italy, 2011; p. 84. [Google Scholar]
- CBHSF-Comitê de Bacia Hidrográfica do São Francisco. Plano de Recursos Hídricos da Bacia Hidrográfica do Rio São Francisco 2016–2025: Diagnóstico Consolidadeo da Bacia Hidrográfica do Rio São Francisco, Relatório de diagnóstico; Comitê da Bacia Hidrográfica do rio São Francisco: Belo Horionte, Brazil, 2015; p. 120. [Google Scholar]
- Zoby, L.G.; Antunes Matos, B.; Lotufo Conejo, J.G. Disponibilidade de Águas Subterrâneas na Bacia do Rio São Francisco. In Proceedings of the XII Congresso Brasileiro de Águas Subterrâneas, São Paulo, Brazil, 20 September 2004. [Google Scholar]
- Campos, J.C.V.; Oliveira, L.T.; de Luz, L.D.; Leal, L.R.B.; de Luz, J.A.G.; de Lima, O.A.L. Avaliação da Recarga do Aquífero Urucuia na Região de Jaborandi-Oeste da Bahia. In Proceedings of the XIV Congresso Brasileiro de Águas Subterrâneas, Curitiba, Brazil, 7–10 November 2006; pp. 1–8. [Google Scholar]
- Gaspar, M.; Campos, J. O Sistema Aquífero Urucuia. Rev. Bras. Geociências 2007, 37, 216–226. [Google Scholar] [CrossRef] [Green Version]
- Gaspar, M.T.P.; Campos, J.E.G.; de Moraes, R.A.V. Determinação das espessuras do Sistema Aquífero Urucuia a partir de estudo geofísico. Rev. Bras. Geociências 2012, 42, 154–166. [Google Scholar] [CrossRef]
- Gaspar, M. Sistema Aquífero Urucuia: Caracterização Regional e Propostas de Gestão. Ph.D. Thesis, Universidade de Brasília, Brasília, DF, Brazil, 2006. [Google Scholar]
- Matos, B.A.; Zoby, J.L.G. Estudo Técnico de Apoio ao PBHSF–Disponibilidade Hídrica Quantitativa e Usos Consuntivos. Projeto de Gerenciamento Integrado das Atividades Desenvolvidas em Terra na Bacia do São Francisco. Subprojeto 4.5C; ANA/GEF/PNUMA/OEA; Superintendência de Planejamento de Recursos Hídricos: Brasília, Brazil, 2004. [Google Scholar]
- Villar, P.; Mourão, M. Projeto Rede Integrada de Monitoramento das Águas Subterrênas: Relatório diagnóstico Sistema Aquífero Urucuia. Bacia Sedimentar Sanfransciscana; CPRM-Serviço Geológico do Brasil: Belo Horizonte, Brazil, 2012; p. 43. [Google Scholar]
- ANA (Brazilian Water Agency). Rede Hidrometeorológica Nacional. HIDROWEB v3.2.6. Sistema Nacional de Informações sobre Recursos Hídricos (SNIRH). Available online: http://www.snirh.gov.br/hidroweb/mapa> (accessed on 15 March 2018).
- ANA (Brazilian Water Agency). Nota Técnica-Documento base para subsidiar a revisão do Plano Decenal de recursos Hídricos da Bacia Hidrográfica do Rio São Francisco 2004–2013. In 033/2013; ANA/SPR, Ed.; ANA: Belo Horizonte, Brazil, 2013; Volume 33. [Google Scholar]
- CBHSF—Comitê da Bacia Hidrográfica do Rio São Francisco. Plano de Recursos Hídricos da Bacia Hidrográfica do Rio São Francisco 2016–2025: Compatibilização do Balanço Hídrico com os Cenários Estudados da Bacia Hidrográfica do Rio São Francisco; Comitê da Bacia Hidrográfica do rio São Francisco: Belo Horizonte, Brazil, 2016; p. 102. [Google Scholar]
- CPRM-Brazilian Geological Service. SIAGAS, Sistema de Informações de Águas Subterrâneas. Available online: http://siagasweb.cprm.gov.br/layout/ (accessed on 20 August 2018).
- Porto, R.L.L.; Mello, A.V., Jr.; Roberto, A.N.; Palos, J.C. Acquanet: Arquitetura, Estratégias e Ferramentas. 2005. Available online: https://repositorio.usp.br/item/001479668 (accessed on 23 May 2022).
- COBRAPE. Plano Diretor de Aproveitamento de Recursos Hídricos para a Macrometrópole Paulista, no Estado de São Paulo-Relatório Final; Departamento de Águas e Energia Elétrica: São Paulo, Brazil, 2013; p. 207. [Google Scholar]
- COBRAPE. Plano de Bacia do Rio Tibaji. Produto 03: Cenários alternativos; Instituto das Águas do Paraná; Governo do Estado do Paraná: Curitiba, Brazil, 2013; p. 12. [Google Scholar]
- Escola de Administração de Empresas de São Paulo; Centro de Estudos em Sustentabilidade. Análise Custo-Benefício de Medidas de Adaptação à Mudança do Clima Na Bacia Hidrográfica dos Rios Piancó-Piranhas-Açu; ANA-Waters National Agency; FGVces: Brasília, Brazil, 2018; p. 134. [Google Scholar]
- ANA (Brazilian Water Agency). Reservatórios do Semiárido Brasileiro: Hidrologia, Balanço e Operação-Relatório Síntese; Superintendência de Planejamento de Recursos Hídricos-SPR: Brasília, Brazil, 2017; p. 88. [Google Scholar]
- Governo do Estado de Rondônia; MMA; RHA Engenharia e Consultoria. Plano Estadual de Recursos Hídricos do Estado de Rondônia; Governo do Estado de Rondônia: Curitiba, Brazil, 2018; p. 211. [Google Scholar]
- Hashimoto, T.; Stedinger, J.R.; Loucks, D.P. Reliability, resiliency, and vulnerability criteria for water resource system performance evaluation. Water Resour. Res. 1982, 18, 14–20. [Google Scholar] [CrossRef] [Green Version]
- ANA (Brazilian Water Agency). Disponibilidade e Demandasde Recursos Hídricos No Brasil; MMA/NA: Brasília, Brazil, 2005; p. 123. [Google Scholar]
- Ramina, R.H. Consultoria E Assessoria Presencial Especializada Para Estudo das Vazões Reduzidas Em Caráter Emergencial No Rio São Francisco a Partir Da Uhe Sobradinho E Proposição De Alternativas Que Garantam O Uso Múltiplo Das Águas–Concepção De Uma Estratégia Robusta Para a Gestão Dos Usos Múltiplos Das Águas Na Bacia Hidrográfica Do Rio São Francisco–a Estratégia Robusta; Comitê de Bacia Hidrográfica do Rio São Francisco; AGB-Peixe Vivo: Belo Horizonte, Brazil, 2015; p. 49. [Google Scholar]
- Ramina, R.H. Consultoria E Assessoria Presencial Especializada Para Estudo Das Vazões Reduzidas Em Caráter Emergencial No Rio São Francisco a Partir Da Uhe Sobradinho E Proposição De Alternativas Que Garantam O Uso Múltiplo Das Águas–Concepção De Uma Estratégia Robusta Para a Gestão Dos Usos Múltiplos Das Águas Na Bacia Hidrográfica Do Rio São Francisco–a Estratégia Robusta; Comitê de Bacia Hidrográfica do Rio São Francisco; AGB-Peixe Vivo: Belo Horizonte, Brazil, 2014; p. 53. [Google Scholar]
- Longhi, E.H.; Formiga, K.T.M. Metodologias para determinar vazão ecológica em rios. Braz. J. Environ. Sci. 2011, 20, 33–48. [Google Scholar]
- Galvão, J.; Bermann, C. Crise hídrica e energia: Conflitos no uso múltiplo das águas. Estudos Avançados 2015, 29, 43–68. [Google Scholar] [CrossRef]
- Gonçalves, R.D.; Engelbrecht, B.Z.; Chang, H.K. Evolução da contribuição do Sistema Aquífero Urucuia para o Rio São Francisco, Brasil. Águas Subterrâneas 2017, 32, 1–10. [Google Scholar] [CrossRef] [Green Version]
- Ramos, S.O.; Araújo, H.A.d.; Leal, L.R.B.; Luz, J.A.G.d.; Dutton, A.R. Variação temporal do nível freático do aqüífero cárstico de Irecê-Bahia: Contribuição para uso e gestão das águas subterrâneas no semi-árido. Revista Brasileira de Geociências 2007, 37, 227–233. [Google Scholar] [CrossRef] [Green Version]
- Santos, E.F.d.; Paixão, M.M.O.M.; da Silva, S.M. Hydrogeochemical aspects and water classes of the karst aquifer in Jaiba, varzelandia and verdelandia, São Paulo, Brasil. Revista Águas Subterrâneas 2010. Suplemento: Anais dos XVI Congresso Brasileiro de Àguas Subterrâneas e XVII Encontro Nacional de Perfuradores de Poços. Available online: https://aguassubterraneas.abas.org/asubterraneas/article/view/23136 (accessed on 23 May 2022).
- Atman, D.; Velásquez, L.N.M.; Fantinel, L.M. Controle Estrutural na Circulação e Composição das Águas no Sistema Aquífero Cárstico-Fissural do Grupo Bam Buí, Norte de Minas Gerais. Rev. Águas Subterrâneas 2011, 25, 74–90. [Google Scholar] [CrossRef] [Green Version]
- Alves da Silva Rosa, L.; Morais, M.; Saito, C.H. Water security and river basin revitalization of the São Francisco river basin: A symbiotic relationship. Water 2021, 13, 907. [Google Scholar] [CrossRef]
- de Araujo, S.S.; de Aguiar Netto, A.O. (Un) sustainability in the lower course of São Francisco River in the States Sergipe and Alagoas (Brazil). Agua Territ. 2018, 11, 88–95. [Google Scholar] [CrossRef]
- Coutinho, P.E.; Cataldi, M. Assessment of water availability in the period of 100 years at the head of the São Francisco river basin, based on climate change scenarios. Rev. Eng. Agric.-REVENG 2021, 29, 107–121. [Google Scholar] [CrossRef]


| Scenario Year | Surface Sources (m3 s−1) | Groundwater Sources (m3 s−1) | Total (m3 s−1) | ||||||
|---|---|---|---|---|---|---|---|---|---|
| A | B | C | A | B | C | A | B | C | |
| Current * | |||||||||
| Sub-basins | 276.4 | 32.9 | 309.3 | ||||||
| DESO water diversion | 2.7 | 0.0 | 2.7 | ||||||
| Large projects | 0.0 | 0.0 | 0.0 | ||||||
| Total | 279.1 | 32.9 | 312.0 | ||||||
| 2025 | |||||||||
| Sub-basins | 315.0 | 358.1 | 391.7 | 42.9 | 47.4 | 51.6 | 357.9 | 405.5 | 443.3 |
| Water diversion | 34.1 | 46.7 | 71.5 | 0.0 | 0.0 | 0.0 | 34.1 | 46.7 | 71.5 |
| Large projects | 64.7 | 129.2 | 260.8 | 2.0 | 3.8 | 10.5 | 66.6 | 133.1 | 271.2 |
| Total | 413.8 | 534.0 | 724.0 | 44.9 | 51.2 | 62.1 | 458.6 | 585.3 | 786.0 |
| 2035 | |||||||||
| Sub-basins | 379.9 | 473.7 | 577.6 | 52.9 | 64.4 | 76.7 | 432.7 | 538.1 | 654.3 |
| Water diversion | 39.5 | 66.0 | 147.8 | 0.0 | 0.0 | 0.0 | 39.5 | 66.0 | 147.8 |
| Large projects | 64.7 | 129.2 | 260.8 | 2.0 | 3.8 | 10.5 | 66.6 | 133.1 | 271.2 |
| Total | 484.1 | 668.9 | 986.2 | 54.9 | 68.2 | 87.2 | 538.8 | 737.2 | 1073.3 |
| Supply and Industry | RLB > 95 | 90 < RLB < 95 | 80 < RLB < 90 | 50 < RLB < 80 | RLB < 50 |
|---|---|---|---|---|---|
| VBL > 95 | Excellent | Comfortable | Comfortable | Worrisome | Worrisome |
| 90 < VBL < 95 | Comfortable | Worrisome | Worrisome | Critical | Very critical |
| 80 < VBL < 90 | Worrisome | Worrisome | Critical | Very critical | Very critical |
| 50 < VBL < 80 | Critical | Critical | Very critical | Very critical | Very critical |
| VBL < 50 | Very critical | Very critical | Very critical | Very critical | Very critical |
| Farming and Energy | RLB > 95 | 90 < RLB < 95 | 80 < RLB < 90 | 50 < RLB < 80 | RLB < 50 |
|---|---|---|---|---|---|
| VBL > 95 | Excellent | Excellent | Comfortable | Comfortable | Comfortable |
| 90 < VBL < 95 | Comfortable | Comfortable | Comfortable | Comfortable | Comfortable |
| 80 < VBL < 90 | Worrisome | Worrisome | Worrisome | Worrisome | Critical |
| 50 < VBL < 80 | Critical | Critical | Very critical | Very critical | Very critical |
| VBL < 50 | Very critical | Very critical | Very critical | Very critical | Very critical |
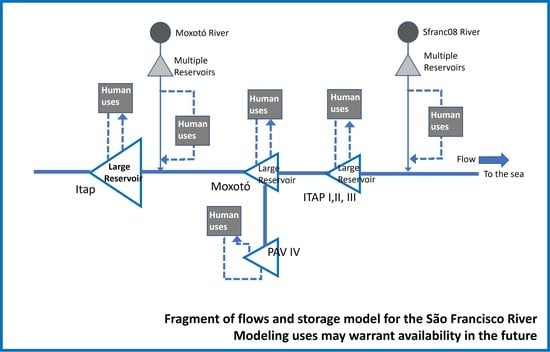
| Month | Três Marias (m3 s−1) | Sobradinho Itaparica Xingó (m3 s−1) | Moxotó Paulo Afonso I, II, III Paulo Afonso IV (m3 s−1) | ||||||
|---|---|---|---|---|---|---|---|---|---|
| HS1 | HS2 | HS3 | HS1 | HS2 | HS3 | HS1 | HS2 | HS3 | |
| Jan | 500 | 550 | 700 | 1400 | 1800 | 3200 | 700 | 900 | 1600 |
| Feb | 550 | 600 | 700 | 1450 | 1850 | 3300 | 725 | 925 | 1650 |
| Mar | 500 | 550 | 700 | 1350 | 1800 | 3200 | 675 | 900 | 1600 |
| Apr | 500 | 550 | 650 | 1300 | 1700 | 3000 | 650 | 850 | 1500 |
| May | 450 | 450 | 600 | 1150 | 1550 | 2700 | 575 | 775 | 1350 |
| Jun | 400 | 450 | 500 | 1000 | 1400 | 2400 | 500 | 700 | 1200 |
| Jul | 350 | 400 | 450 | 950 | 1300 | 2200 | 475 | 650 | 1100 |
| Aug | 350 | 400 | 500 | 950 | 1350 | 2300 | 475 | 675 | 1150 |
| Sep | 400 | 450 | 500 | 1000 | 1400 | 2400 | 500 | 700 | 1200 |
| Oct | 450 | 500 | 600 | 1200 | 1600 | 2800 | 600 | 800 | 1400 |
| Nov | 450 | 550 | 650 | 1300 | 1700 | 3000 | 650 | 850 | 1500 |
| Dec | 500 | 550 | 650 | 1350 | 1750 | 3100 | 675 | 875 | 1550 |
| Average | 450 | 500 | 600 | 1200 | 1600 | 2800 | 600 | 800 | 1400 |
| Sub-Basin | Qmed (m3 s−1) | Q95 (Daily Values) (m3 s−1) | Q95 (Monthly Values) (m3 s−1) | Storage Capacity. (Mm3) | Reg. Coef. (Years) | Q95 Reg. (Monthly Values) (m3 s−1) |
|---|---|---|---|---|---|---|
| S FRANC 01 | 228.3 | 53.5 | 65.2 | 0.0 | 0.0 | 65.2 |
| S FRANC 02 | 138.0 | 31.1 | 18.4 | 13.2 | 0.0 | 18.4 |
| VELHAS 01 | 321.9 | 61.8 | 69.0 | 251.8 | 0.0 | 80.0 |
| S FRANC 03 | 44.6 | 3.0 | 3.1 | 1.3 | 0.0 | 3.1 |
| JEQUITAI 01 | 63.9 | 4.4 | 4.5 | 786.0 | 0.0 | 30.0 |
| PARA SF 01 | 154.7 | 43.0 | 44.9 | 200.2 | 0.1 | 54.0 |
| PARAOPEBA 01 | 166.2 | 51.9 | 43.9 | 79.7 | 0.0 | 43.9 |
| GRANDE SF 01 | 143.4 | 93.0 | 91.7 | 18.2 | 0.0 | 91.7 |
| PARACATU 01 | 50.8 | 14.6 | 10.9 | 2.1 | 0.0 | 10.9 |
| S FRANC 06 | 6.4 | 0.2 | 0.5 | 11.0 | 0.0 | 1.4 |
| GRANDE SF 02 | 137.1 | 85.2 | 124.3 | 3.8 | 0.0 | 124.3 |
| CARINHANHA 01 | 146.5 | 85.4 | 86.7 | 0.0 | 0.0 | 86.7 |
| CORRENTE 01 | 221.8 | 136.1 | 140.0 | 0.1 | 0.0 | 140.0 |
| PACUI 01 | 47.7 | 9.7 | 10.2 | 0.0 | 0.0 | 10.2 |
| PARACATU 02 | 430.6 | 66.5 | 82.5 | 834.1 | 0.1 | 142.0 |
| URUCUIA 01 | 260.9 | 37.7 | 33.3 | 16.2 | 0.1 | 33.3 |
| VERDE GR 01 | 33.7 | 0.6 | 0.0 | 220.6 | 0.2 | 10.0 |
| S FRANC 04 | 39.0 | 10.6 | 12.0 | 0.3 | 0.0 | 12.0 |
| S FRANC 05 | 34.5 | 0.0 | 0.0 | 208.9 | 0.1 | 10.0 |
| S FRANC 07 | 7.0 | 0.2 | 0.5 | 160.5 | 1.0 | 4.0 |
| BRIGIDA 01 | 10.6 | 1.4 | 0.6 | 424.1 | 3.8 | 5.3 |
| CURACA 01 | 6.4 | 0.8 | 0.4 | 23.1 | 0.1 | 1.3 |
| CURITUBA 01 | 1.8 | 0.2 | 0.1 | 13.8 | 0.0 | 0.5 |
| GARÇAS 01 | 4.0 | 0.5 | 0.2 | 128.3 | 1.0 | 0.5 |
| MACURURE 01 | 6.6 | 0.9 | 0.4 | 5.7 | 0.0 | 0.7 |
| MOXOTO 01 | 7.7 | 1.0 | 0.4 | 541.2 | 5.6 | 4.5 |
| PAJEU 01 | 14.2 | 1.9 | 0.8 | 472.2 | 0.5 | 6.8 |
| PONTAL 01 | 4.1 | 0.5 | 0.2 | 30.8 | 0.2 | 1.2 |
| SALITRE 01 | 7.9 | 1.0 | 0.4 | 8.4 | 0.3 | 0.9 |
| TERRA NOVA 01 | 4.6 | 0.6 | 0.3 | 109.4 | 0.8 | 1.8 |
| S FRANC 08 | 1.1 | 0.1 | 0.1 | 5.1 | 0.0 | 0.2 |
| S FRANC 09 | 5.6 | 0.7 | 0.3 | 22.7 | 0.2 | 1.2 |
| S FRANC 10 | 11.4 | 1.5 | 0.6 | 212.2 | 0.5 | 4.2 |
| S FRANC 11 | 6.0 | 0.8 | 0.3 | 14.7 | 0.1 | 0.9 |
| Total | 2768.7 | 800.4 | 846.7 | 4819.4 | - | 997.3 |
| Sub-Basin | Balance Situation | ||||||
|---|---|---|---|---|---|---|---|
| Current | A2025 | B2025 | C2025 | A2035 | B2035 | C2035 | |
| S FRANC 02 | Excellent | Excellent | Excellent | Excellent | Excellent | Excellent | Excellent |
| VERDE GR 01 | Very Critical | Very Critical | Very Critical | Very Critical | Very Critical | Very Critical | Very Critical |
| S FRANC 05 | Very Critical | Very Critical | Very Critical | Very Critical | Very Critical | Very Critical | Very Critical |
| S FRANC 07 | Critical | Critical | Critical | Critical | Critical | Critical | Critical |
| S FRANC 06 | Very Critical | Very Critical | Very Critical | Very Critical | Very Critical | Very Critical | Very Critical |
| PONTAL 01 | Very Critical | Very Critical | Very Critical | Very Critical | Very Critical | Very Critical | Very Critical |
| GARÇAS 01 | Excellent | Excellent | Excellent | Excellent | Excellent | Excellent | Excellent |
| CURACA 01 | Critical | Critical | Critical | Critical | Critical | Critical | Critical |
| S FRANC 09 | Very Critical | Critical | Critical | Critical | Critical | Critical | Critical |
| S FRANC 10 | Critical | Critical | Critical | Critical | Critical | Very Critical | Very Critical |
| Sub-Basin | Balance Situation | ||||||
|---|---|---|---|---|---|---|---|
| Current | A2025 | B2025 | C2025 | A2035 | B2035 | C2035 | |
| S FRANC 02 | Excellent | Excellent | Excellent | Excellent | Excellent | Excellent | Excellent |
| VERDE GR 01 | Very Critical | Very Critical | Very Critical | Very Critical | Very Critical | Very Critical | Very Critical |
| S FRANC 05 | Very Critical | Very Critical | Very Critical | Very Critical | Very Critical | Very Critical | Very Critical |
| S FRANC 07 | Very Critical | Very Critical | Very Critical | Very Critical | Very Critical | Very Critical | Very Critical |
| S FRANC 06 | Very Critical | Very Critical | Very Critical | Very Critical | Very Critical | Very Critical | Very Critical |
| PONTAL 01 | Very Critical | Very Critical | Very Critical | Very Critical | Very Critical | Very Critical | Very Critical |
| GARÇAS 01 | Excellent | Excellent | Excellent | Excellent | Comfortable | Worrisome | Critical |
| CURACA 01 | Very Critical | Very Critical | Very Critical | Very Critical | Very Critical | Very Critical | Very Critical |
| S FRANC 09 | Very Critical | Very Critical | Very Critical | Very Critical | Very Critical | Very Critical | Very Critical |
| S FRANC 10 | Very Critical | Very Critical | Very Critical | Very Critical | Very Critical | Very Critical | Very Critical |
| Sub-Basin | Balance Situation | ||||||
|---|---|---|---|---|---|---|---|
| Current | A2025 | B2025 | C2025 | A2035 | B2035 | C2035 | |
| S FRANC 02 | Excellent | Excellent | Excellent | Excellent | Excellent | Excellent | Excellent |
| VERDE GR 01 | Very Critical | Very Critical | Very Critical | Very Critical | Very Critical | Very Critical | Very Critical |
| S FRANC 05 | Very Critical | Very Critical | Very Critical | Very Critical | Very Critical | Very Critical | Very Critical |
| S FRANC 07 | Very Critical | Worrisome | Very Critical | Very Critical | Worrisome | Worrisome | Very Critical |
| S FRANC 06 | Very Critical | Excellent | Comfortable | Comfortable | Worrisome | Excellent | Excellent |
| PONTAL 01 | Very Critical | Very Critical | Very Critical | Very Critical | Very Critical | Very Critical | Very Critical |
| GARÇAS 01 | Very Critical | Very Critical | Very Critical | Very Critical | Very Critical | Very Critical | Very Critical |
| CURACA 01 | Very Critical | Very Critical | Very Critical | Very Critical | Very Critical | Very Critical | Very Critical |
| S FRANC 09 | Very Critical | Very Critical | Very Critical | Very Critical | Very Critical | Very Critical | Very Critical |
| S FRANC 10 | Very Critical | Very Critical | Very Critical | Very Critical | Very Critical | Very Critical | Very Critical |
| Reservoir | Balance Situation | ||||||
|---|---|---|---|---|---|---|---|
| Current | A2025 | B2025 | C2025 | A2035 | B2035 | C2035 | |
| Três Marias | Very Critical | Very Critical | Very Critical | Very Critical | Very Critical | Very Critical | Very Critical |
| Sobradinho | Excellent | Excellent | Critical | Very Critical | Excellent | Very Critical | Very Critical |
| Itaparica | Excellent | Excellent | Very Critical | Very Critical | Excellent | Very Critical | Very Critical |
| Moxotó | Excellent | Excellent | Critical | Very Critical | Excellent | Very Critical | Very Critical |
| Paulo Afonso I, II, III | Excellent | Excellent | Excellent | Very Critical | Excellent | Very Critical | Very Critical |
| Paulo Afonso IV | Excellent | Excellent | Very Critical | Very Critical | Excellent | Very Critical | Very Critical |
| Xingó | Excellent | Excellent | Critical | Very Critical | Excellent | Very Critical | Very Critical |
| Diversion | Balance Situation | ||||||
|---|---|---|---|---|---|---|---|
| Current | A2025 | B2025 | C2025 | A2035 | B2035 | C2035 | |
| DESO | Excellent | Excellent | Excellent | Excellent | Excellent | Excellent | Excellent |
| PISF—East axis–urban supply | Excellent | Excellent | Excellent | Excellent | Excellent | Excellent | |
| PISF—East axis–additional flow | Excellent | Very Critical | Very Critical | Very Critical | Very Critical | Very Critical | |
| PISF—North axis–urban supply | Excellent | Excellent | Excellent | Excellent | Excellent | Excellent | |
| PISF—North axis–additional flow | Very Critical | Very Critical | Very Critical | Very Critical | Very Critical | Very Critical | |
| PISF—West axis | Excellent | ||||||
| Irrigation Projects | Balance Situation | ||||||
|---|---|---|---|---|---|---|---|
| Current | A2025 | B2025 | C2025 | A2035 | B2035 | C2035 | |
| Jequitaí | Very Critical | Very Critical | Very Critical | Very Critical | Very Critical | Very Critical | |
| Jaíba | Excellent | Excellent | Excellent | Excellent | Excellent | Excellent | |
| Baixio do Irecê | Excellent | Excellent | Excellent | Excellent | Excellent | Excellent | |
| Sertão Pernambucano | Excellent | Excellent | |||||
| Pontal | Excellent | Excellent | Excellent | Excellent | Excellent | Excellent | |
| Salitre | Excellent | Excellent | Excellent | Excellent | Excellent | Excellent | |
| Canal do Xingó | Excellent | Excellent | Excellent | Excellent | Excellent | Very Critical | |
| Sertão Alagoano | Excellent | Excellent | Excellent | Excellent | Excellent | Worrisome | |
| Jacaré-Curituba | Excellent | Excellent | Excellent | Excellent | Excellent | Critical | |
| Type | Aquifer | Area (km2) | Pmed (mm) | Recharge Rate | Recharge (m3 year−1) | Recharge (m3 s−1) | Exploitable Reserves (m3 s−1) * |
|---|---|---|---|---|---|---|---|
| Karst | Marancó complex, carbonate unit | 13 | 586 | 10.0% | 762,775 | 0.0242 | 0.005 |
| Santa Filomena complex, carbonate unit | 0,2 | 603 | 10.0% | 13,374 | 0.0004 | 0.0001 | |
| Barra Bonita formation, carbonate unit | 40 | 622 | 10.0% | 2,481,057 | 0.0787 | 0.016 | |
| Caatinga formation | 6030.8 | 672 | 10.0% | 415,600,813 | 13.1786 | 2.636 | |
| Gandarela formation | 74 | 1390 | 10.0% | 10,174,779 | 0.3226 | 0.065 | |
| Olhos D’água formation | 10 | 586 | 10.0% | 585,350 | 0.0186 | 0.004 | |
| Salitre formation | 14,950.9 | 692 | 10.0% | 1,024,552,124 | 32.4883 | 6.498 | |
| Santana formation | 788 | 675 | 10.0% | 50,846,017 | 1.6123 | 0.322 | |
| Bambuí group, carbonate unit | 30,426 | 1170 | 10.0% | 3,316,942,597 | 105.1796 | 21.036 | |
| Estância group, carbonate unit | 853 | 630 | 15.0% | 79,323,996 | 2.5153 | 0.503 | |
| Granular | Alluvial deposit | 18,283.4 | 943 | 23.5% | 4,045,838,163 | 128.2927 | 25.659 |
| Wind deposit | 8703 | 722 | 15.0% | 902,273,461 | 28.6109 | 5.722 | |
| Coastal deposit | 536 | 1004 | 20.0% | 107,231,678 | 3.4003 | 0.680 | |
| Alliance formation | 1358 | 723 | 3.0% | 30,039,981 | 0.9526 | 0.191 | |
| Barreiras formation | 2104 | 1017 | 25.0% | 519,337,692 | 16.4681 | 3.294 | |
| Brejo Santo formation | 90 | 667 | 5.0% | 2,998,051 | 0.0951 | 0.019 | |
| Cabeças formation | 232 | 691 | 3.0% | 4,807,729 | 0.1525 | 0.030 | |
| Candeias formation | 280 | 682 | 10.0% | 19,573,425 | 0.6207 | 0.124 | |
| Candeias Formation/Indiscriminate Islands Group | 1084 | 772 | 10.0% | 88,264,923 | 2.7989 | 0.560 | |
| Curituba formation | 59 | 827 | 1.0% | 413,113 | 0.0131 | 0.003 | |
| Formação Exu formation | 2796 | 753 | 3.0% | 54,279,959 | 1.7212 | 0.344 | |
| Granular | Inajá formation | 707 | 741 | 10.0% | 55,335,405 | 1.7547 | 0.351 |
| Marizal formation | 5704 | 662 | 10.0% | 367,100,493 | 11.6407 | 2.328 | |
| Mauriti formation | 832 | 713 | 5.0% | 33,807,892 | 1.0720 | 0.214 | |
| Missão Velha formation | 9 | 849 | 5.0% | 367,326 | 0.0116 | 0.002 | |
| Penedo formation | 126 | 1030 | 10.0% | 13,060,090 | 0.4141 | 0.083 | |
| Pimenteiras formation | 198 | 691 | 1.0% | 1,370,044 | 0.0434 | 0.009 | |
| Riachuelo formation | 18 | 1069 | 10.0% | 1,950,814 | 0.0619 | 0.012 | |
| Santa Brígida formation | 311 | 707 | 1.0% | 2,197,019 | 0.0697 | 0.014 | |
| São Sebastião formation | 355 | 733 | 15.0% | 44,809,239 | 1.4209 | 0.284 | |
| Sergi formation | 111 | 693 | 1.0% | 773,384 | 0.0245 | 0.005 | |
| Serraria formation | 57 | 971 | 10.0% | 5,742,482 | 0.1821 | 0.036 | |
| Tacaratu formation | 2998 | 755 | 15.0% | 346,861,903 | 10.9989 | 2.200 | |
| Brotas group | 6 | 707 | 1.0% | 41,540 | 0.0013 | 0.0003 | |
| Coruripe group | 268 | 1004 | 10.0% | 27,103,415 | 0.8594 | 0.172 | |
| Igreja Nova Group—Perucaba Indiscriminate | 230 | 971 | 10.0% | 22,112,657 | 0.7012 | 0.140 | |
| Areado group | 12,702 | 1313 | 20.0% | 3,469,706,742 | 110.0237 | 22.005 | |
| Ilhas group | 114 | 678 | 10.0% | 7,659,669 | 0.2429 | 0.049 | |
| Serra Grande group | 63.7 | 691 | 12.0% | 5,281,186 | 0.1675 | 0.033 | |
| Urucuia group | 101,766 | 1137 | 20.0% | 23,362,578,332 | 740.8225 | 148.164 | |
| Fractured | Undifferentiated Fractured Basement | 256,114 | 873 | 4.5% | 9,919,415,924 | 314.5426 | 62.909 |
| Bambuí group, land unit | 160,254 | 1130 | 4.5% | 8,998,559,696 | 285.3425 | 57.068 | |
| Mata do Corda group | 3693 | 1354 | 4.5% | 227,046,137 | 7.1996 | 1.440 | |
| Paranoá group, land unit | 872 | 1410 | 4.5% | 55,021,688 | 1.7447 | 0.349 | |
| Total | 636,218.4 | 57,644,244,131 | 1827.9 | 365.6 | |||
| Aquifer | Balance Situation | ||||||
|---|---|---|---|---|---|---|---|
| Current | A2025 | B2025 | C2025 | A2035 | B2035 | C2035 | |
| Marancó Complex, carbonate unit | Excellent | Excellent | Excellent | Excellent | Excellent | Excellent | Excellent |
| Santa Filomena Complex, carbonate unit | Excellent | Excellent | Excellent | Excellent | Excellent | Excellent | Excellent |
| Alluvial Deposit | Excellent | Excellent | Excellent | Excellent | Excellent | Excellent | Excellent |
| Wind Deposit | Excellent | Comfortable | Comfortable | Comfortable | Comfortable | Comfortable | Worrisome |
| Coastal Deposit | Excellent | Excellent | Excellent | Excellent | Excellent | Excellent | Comfortable |
| Undifferentiated Fractured Basement | Comfortable | Comfortable | Comfortable | Comfortable | Comfortable | Comfortable | Worrisome |
| Alliance Formation | Comfortable | Comfortable | Comfortable | Comfortable | Comfortable | Comfortable | Worrisome |
| Barra Bonita Formation, carbonate unit | Comfortable | Comfortable | Comfortable | Comfortable | Comfortable | Comfortable | Worrisome |
| Barreiras Formation | Excellent | Excellent | Excellent | Comfortable | Excellent | Excellent | Comfortable |
| Brejo Santo Formation | Very Critical | Very Critical | Very Critical | Very Critical | Very Critical | Very Critical | Very Critical |
| Caatinga Formation | Excellent | Excellent | Excellent | Excellent | Excellent | Excellent | Excellent |
| Head Formation | Excellent | Excellent | Comfortable | Excellent | Excellent | Excellent | Comfortable |
| Candeias Formation | Comfortable | Comfortable | Comfortable | Comfortable | Comfortable | Comfortable | Comfortable |
| Candeias Formation/ Indiscriminate Islands Group | Excellent | Excellent | Excellent | Excellent | Excellent | Excellent | Excellent |
| Curituba Formation | Very Critical | Very Critical | Very Critical | Very Critical | Very Critical | Very Critical | Very Critical |
| Exu Formation | Excellent | Excellent | Excellent | Excellent | Excellent | Excellent | Excellent |
| Gandarela Formation | Very Critical | Very Critical | Very Critical | Very Critical | Very Critical | Very Critical | Very Critical |
| Inajá Formation | Excellent | Excellent | Comfortable | Comfortable | Comfortable | Comfortable | Comfortable |
| Marizal Formation | Excellent | Excellent | Excellent | Excellent | Excellent | Excellent | Excellent |
| Mauriti Formation | Critical | Critical | Critical | Critical | Critical | Critical | Critical |
| Missão Velha Formation | Very Critical | Very Critical | Very Critical | Very Critical | Very Critical | Very Critical | Very Critical |
| Olhos Dágua Formation | Excellent | Excellent | Excellent | Excellent | Excellent | Excellent | Excellent |
| Penedo Formation | Comfortable | Comfortable | Worrisome | Worrisome | Comfortable | Comfortable | Worrisome |
| Pimenteiras Formation | Excellent | Excellent | Excellent | Excellent | Excellent | Excellent | Excellent |
| Riachuelo Formation | Excellent | Excellent | Excellent | Excellent | Excellent | Excellent | Excellent |
| Salitre Formation | Comfortable | Comfortable | Comfortable | Comfortable | Comfortable | Comfortable | Comfortable |
| Santa Brígida Formation | Very Critical | Very Critical | Very Critical | Very Critical | Very Critical | Very Critical | Very Critical |
| Santana Formation | Excellent | Excellent | Excellent | Excellent | Excellent | Excellent | Excellent |
| São Sebastião Formation | Excellent | Excellent | Excellent | Excellent | Excellent | Excellent | Excellent |
| Sergi Formation | Very Critical | Very Critical | Very Critical | Very Critical | Very Critical | Very Critical | Very Critical |
| Serraria Formation | Comfortable | Comfortable | Comfortable | Comfortable | Comfortable | Comfortable | Comfortable |
| Tacaratu Formation | Excellent | Excellent | Excellent | Excellent | Excellent | Excellent | Excellent |
| Areado Group | Excellent | Excellent | Excellent | Excellent | Excellent | Excellent | Excellent |
| Bambuí Group, carbonate unit | Comfortable | Comfortable | Comfortable | Worrisome | Comfortable | Comfortable | Worrisome |
| Bambuí Group, land unit | Comfortable | Comfortable | Comfortable | Worrisome | Comfortable | Comfortable | Worrisome |
| Brotas Group | Very Critical | Very Critical | Very Critical | Very Critical | Very Critical | Very Critical | Very Critical |
| Coruripe Group | Comfortable | Comfortable | Comfortable | Comfortable | Comfortable | Comfortable | Comfortable |
| Estância Group, carbonate unit | Excellent | Excellent | Excellent | Excellent | Excellent | Excellent | Excellent |
| Igreja Nova Group—Perucaba Indiscriminate | Excellent | Comfortable | Comfortable | Comfortable | Comfortable | Comfortable | Comfortable |
| Ilhas Group | Excellent | Excellent | Comfortable | Comfortable | Comfortable | Excellent | Comfortable |
| Mata do Corda Group | Comfortable | Comfortable | Comfortable | Comfortable | Comfortable | Comfortable | Worrisome |
| Paranoá Group, land unit | Comfortable | Very Critical | Very Critical | Very Critical | Very Critical | Very Critical | Very Critical |
| Serra Grande Group | Excellent | Excellent | Excellent | Excellent | Excellent | Excellent | Excellent |
| Urucuia Group | Excellent | Excellent | Excellent | Excellent | Excellent | Excellent | Excellent |
Publisher’s Note: MDPI stays neutral with regard to jurisdictional claims in published maps and institutional affiliations. |
© 2022 by the authors. Licensee MDPI, Basel, Switzerland. This article is an open access article distributed under the terms and conditions of the Creative Commons Attribution (CC BY) license (https://creativecommons.org/licenses/by/4.0/).
Share and Cite
Bettencourt, P.; de Oliveira, R.P.; Fulgêncio, C.; Canas, Â.; Wasserman, J.C. Prospective Water Balance Scenarios (2015–2035) for the Management of São Francisco River Basin, Eastern Brazil. Water 2022, 14, 2283. https://doi.org/10.3390/w14152283
Bettencourt P, de Oliveira RP, Fulgêncio C, Canas Â, Wasserman JC. Prospective Water Balance Scenarios (2015–2035) for the Management of São Francisco River Basin, Eastern Brazil. Water. 2022; 14(15):2283. https://doi.org/10.3390/w14152283
Chicago/Turabian StyleBettencourt, Pedro, Rodrigo Proença de Oliveira, Cláudia Fulgêncio, Ângela Canas, and Julio Cesar Wasserman. 2022. "Prospective Water Balance Scenarios (2015–2035) for the Management of São Francisco River Basin, Eastern Brazil" Water 14, no. 15: 2283. https://doi.org/10.3390/w14152283