
Fate of Soil Residual Fertilizer-15N as Affected by Different Drip Irrigation Regimes
by
Jingnan Chen
1,2, 
Qiu Jin
3,*,
Qinyuan Zhu
4,
Ying Xiao
5,
Jingwen Zhu
5,
Xiaohou Shao
1,2,
Maomao Hou
5,
Fenglin Zhong
5,
Chao Lin
6 and
Lin Zhu
4,* 1
College of Agricultural Science and Engineering, Hohai University, Nanjing 210000, China
2
College of Horticulture and Gardening, Fujian Agricultural Vocational and Technical College, Fuzhou 350000, China
3
Nanjing Hydraulic Research Institute, Nanjing 210000, China
4
Nanjing Institute of Environmental Sciences, Ministry of Ecological Environment, Nanjing 210000, China
5
College of Horticulture, Fujian Agriculture and Forestry University, Fuzhou 350000, China
6
Fujian Chengyu Municipal Engineering Co., Ltd., Fuzhou 350000, China
*
Authors to whom correspondence should be addressed.
Water 2022, 14(15), 2281; https://doi.org/10.3390/w14152281
Submission received: 3 June 2022
/
Revised: 30 June 2022
/
Accepted: 11 July 2022
/
Published: 22 July 2022
(This article belongs to the Special Issue Insight into Drip Irrigation)
Abstract
:Soil residual N is a potential factor threatening the environment, but it is also an N fertilizer resource. Few studies have evaluated the fate of soil residual N under agronomic practice. The objective of this study was to investigate the distribution of residual N and its possible influencing factors with different irrigation regimes. Under three N residual situations created by the previous season using the 15N labeled urea, we employed lettuce as the plant material and three lower limits of drip irrigation including 75% (DR1), 65% (DR2), and 55% (DR3) accounting for the field water capacity as experimental treatments. A furrow irrigation treatment (FI) with the same irrigation regime as DR2 was used as control. Results showed that 2.1–4.8% of the residual 15N from the previous season was absorbed by the succeeding lettuce, 78.0–84.4% was still remained in the 0–80 cm soil, and 10.9–20.0% was unaccounted for. After harvest of succeeding lettuces, the soil residual 15N mainly existed in the mineral form. Moreover, the lettuce reuse efficiency for15N was positively correlated with the total residual 15N amount (p < 0.01) and the mineral 15N amount (p < 0.01). The overall results indicated that an appropriate irrigation regime (DR2) was conducive to promoting absorption of residual N by succeeding crop.
1. Introduction
Nitrogen (N) is known as the “life element” that plays an important role in crop growth and yield formation [1]. N fertilizer is also the most common chemical fertilizer used to increase crop yield and farmers’ income in the world. N nutrient in the fertilizer is absorbed by crops through dissolving in irrigation water. Therefore, soil water has a variety of effects on the fate of fertilizer N.
A large number of studies show that irrigation water affects crop utilization, soil residue, and loss of fertilizer N [2,3,4,5]. Zhang Yan [6] found that appropriately increasing the lower limit (60% to 70%) of irrigation water could significantly improve the photosynthetic rate of crops, and thus improve the absorption and utilization of N by crops. Hou [7] quantitatively revealed that the total utilization efficiency of labeled 15N in the soil layer by two-season tomatoes was 21%–33%, and there was a close relationship between 15N utilization efficiency and irrigation quota under the same irrigation frequency. Shao [8] compared the difference of N form as well as N loss amount in the topsoil between controlled irrigation and traditional irrigation and showed that controlled irrigation could significantly increase the content of NH4+-N in topsoil and reduce the N loss through NO3−-N form by 13.2%. Yu [9] found that compared with traditional irrigation (furrow irrigation), water-saving irrigation (drip irrigation) possessed less irrigation intensity, which weakened the downward movement of water and could effectively reduce N leaching loss.
N fertilizer is more widely used in developing countries. In China, the annual application of chemical fertilizer reaches 60 million tons [10]. However, many studies show that the crop N use efficiency for chemical fertilizer in China is around only 35% [11,12]. A great amount of applied fertilizer N is lost through gaseous or deep leakage, or remains in the soil layer. The residual N in the soil remains effective and can be absorbed by subsequent crops [13]. However, at present, more studies investigated the use and fate of N in the current season as influenced by different agronomic measures [14,15,16]. Rarely does current research focus on the residual N in the soil, especially the interactive response between soil residual N and irrigation practice.
We assume that irrigation will affect the growth and development of crop roots and thus influence the plant uptake of soil residual N; additionally, it will affect the secondary distribution of residual fertilizer N in soil layer, and finally affect the fate of residual N. Since succulent stems of lettuce can absorb a great amount of irrigation water, lettuce is the water-sensitive crop that is suitable to evaluate the irrigation effects. Our previous study discussed the effect of different lower limits of drip irrigation on the fate of fertilizer N during the in-season cultivation of lettuce by using 15N labeling. In this study, lettuce was still selected as the experimental material. Under different N residue situations from the previous season, we employed the same drip irrigation treatments as that in the previous season, with furrow irrigation as the control. The objectives were (1) to evaluate the form of soil residual N under different lower limits of drip irrigation; (2) to compare the difference of the fate of residual N under different irrigation treatments; and (3) to investigate the interaction relationship between the re-use efficiency of soil residual N and the possible influencing factors.
2. Materials and Methods
2.1. Experimental Location
The experiment was carried out at Fruit Science Demonstration Base of the Old Liberated Area in Yunxiao County, Fujian Province, from January 16 to May 13 in 2021. The annual average temperature of Yunxiao County is around 21.3 °C. In the last ten years, the extreme maximum and minimum temperatures were 38.1 and −0.2 °C, respectively. The average annual precipitation is 1730.6 mm and the frost-free period is 347 days. The county processes a subtropical marine monsoon climate. The soil type in the experimental site is ferrallitic soil. The physical and chemical properties of the soil in the plough layer are as follows: pH of 5.9, available P of 12.2 mg kg−1, available K of 152.3 mg kg−1, available N of 90.2 mg kg−1, field water capacity of 29.8%, organic matter content of 3.45%, and bulk density of 1.26 g cm−3.
2.2. Field Arrangement
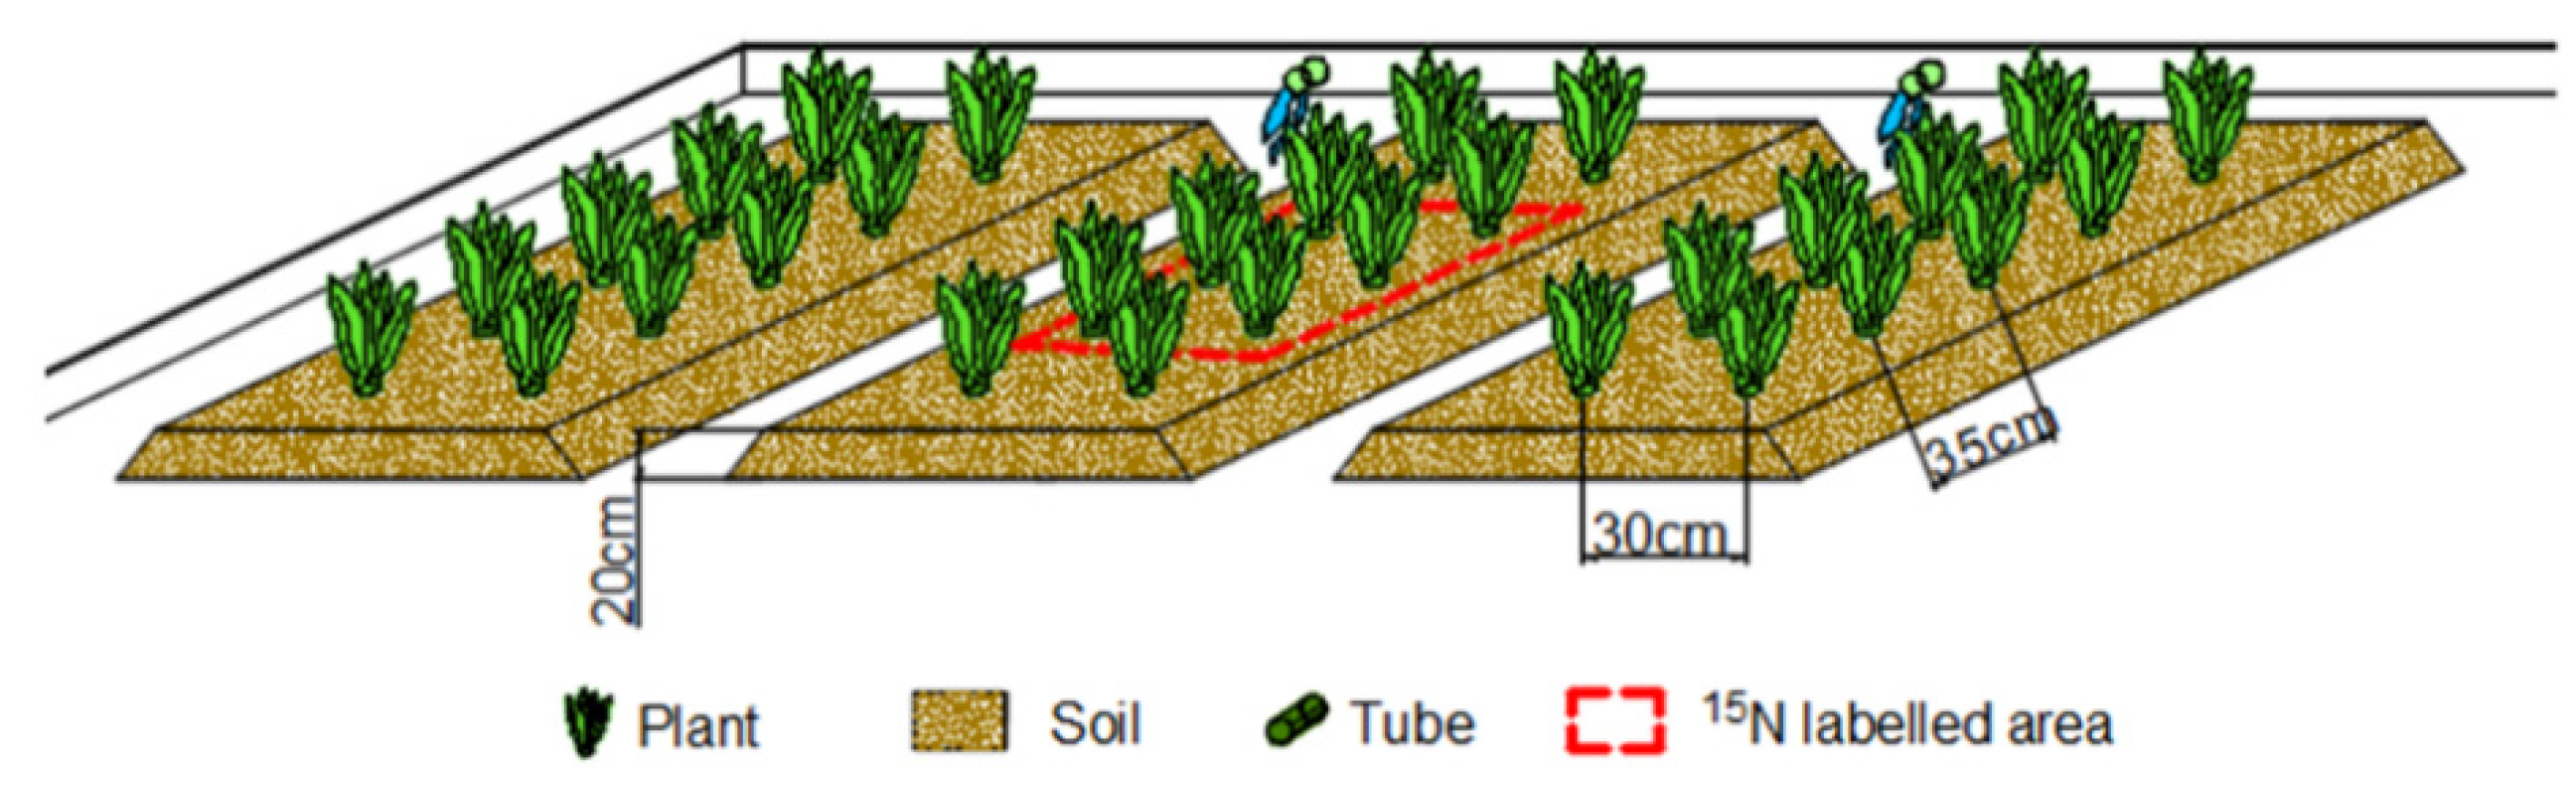
A field experiment was employed. The experimental area was divided into 12 blocks. Each treatment occupied 3 blocks, and the area of each block was 8 m × 4 m. Each block contained three ridges of lettuce, with a ridge height of 20 cm and width of 60 cm. A spacing of 20 cm was used to separate two adjacent ridges. The lettuces were cultivated with row-to-row spacing of 30 cm and plant-to-plant spacing of 35 cm. A micro area was established in the center of each block. Six lettuce plants were planted in the micro area and 15N labeled fertilizers were applied to them. The layout of one block and its micro area is shown in Figure 1 (the figure does not show all the lettuces). To prevent the lettuce outside the micro area from absorbing 15N, the micro area was protected by burying two impervious membranes (60 cm of both width and length) perpendicular to the ridge. At the same time, in order to prevent lateral water infiltration between blocks, two adjacent blocks were separated by 60 cm depth of impervious membrane.
2.3. Experimental Design of the Previous Season
2.3.1. Irrigation
The previous experiment was conducted from 15 September to 30 December in 2020. The variety of lettuce (Lactuca sativa var. angustana iris) “Feiqiao lettuce No. 1”, a water-sensitive crop, was used as the plant material. Transplanting was carried out when the lettuce seedlings were 25 days old and grew out 4–5 expanded leaves. From the rosette stage, three different lower limits of drip irrigation water were controlled, including 75% (DR1), 65% (DR2), and 55% (DR3) accounting for the field water capacity. The soil moisture content of the plough layer was measured every day. When the moisture content reached the lower limit, the irrigation was started. The irrigation was finished when reaching the upper limit of 95%. The furrow irrigation treatment (FI) with the same irrigation regime as DR2 was employed as the control treatment. Therefore, in total, there were four irrigation treatments. Each treatment was repeated three times. In the local practice, furrow irrigation was commonly adopted, and the water was supplied to 1/3 of the furrow height then naturally dried. For this experiment, the converted furrow irrigation quota according to the DR2 was in line with the local practice. The irrigation quota was calculated as
where, M represents irrigation quota (m3); S represents the irrigation area (m2); r is the bulk density of soil (kg m−3); h represents the planned depth of wetted soil (0.2 m); Q is the field water capacity (%); q1 is the upper limit of irrigation (95%), q2 is the lower limit of irrigation; and 0.95 is the irrigation coefficient.
2.3.2. Fertilization
The dose and method of fertilizer application in this study agreed with the local practice. The fertilization for each block was the same, with total fertilization amount of 675 kg ha−1 of common urea, 600 kg ha−1 of calcium superphosphate and 375 kg ha−1 of potassium sulfate. The calcium superphosphate was applied as the basal fertilizer. The urea, as well as the potassium sulfate, was applied according to 40% for basal fertilizer, 20% for the first topdressing, and 40% for the second topdressing. Basal fertilization, first topdressing, and second topdressing were conducted on 12 October, 28 October, and 22 November in 2020, respectively. The fertilizer was applied into the soil depth of 6 cm using the hole applicator. In the micro area, the 15N labeled urea (15NH2CO15NH2) with 15N abundance of 19.6% was employed as the N fertilizer. Except using the 15N labeled fertilizer, the variety and application method of other fertilizers, as well as the irrigation and field management in the micro area, were consistent with that in the block. During the early and late growth stage of lettuce, the heart rot and the downy mildew were prevented respectively using plant protection chemicals including propineb, imidacloprid, and putrescine, etc.
2.4. Experimental Design of Succeeding Season (This Study)
This study was conducted based on the 15N residual situations from the previous season. The succeeding lettuces were planted in situ in the previous cultivation area, and the lettuce variety was still the “Feiqiao lettuce No. 1”. The block arrangement, fertilization, and field management measures for lettuces were the same as those for the previous lettuces. The difference was that the N fertilizer in this study adopted the ordinary urea without the 15N marker (NH2CONH2). In this study, the same irrigation lower limits as the previous season were used to explore the effects of different irrigation treatments on the fate of residual N. Similarly, the irrigation treatments were carried out at the rosette stage and fleshy stem expansion stage for a total duration of 78 days (Figure 2).
The irrigation quota, irrigation interval, irrigation times, as well as the total irrigation amount for the treatments are shown in Table 1.
2.5. Plant and Soil Sampling
Soil and plant samples in the micro area were collected at the lettuce harvest stage on May 11. The soil sampling method was the five-point sampling method. The soil drill was used to collected samples in the soil depth of 10, 20, 30, 40, 50, 60, 70, and 80 cm, respectively. Three plants were randomly selected from each micro area. Each plant was divided into aboveground and underground parts.
- (1)
- Plant dry matter (kg ha−1): the plant samples were dried in the oven at 70 °C to constant weight and then weighed.
- (2)
- Plant total N (%): the total N was measured using the Kjeldahl method after digestion by H2SO4-H2O2 [7].
- (3)
- 15N atom percentage excess (%): the oven-dried plant samples or the naturally dried soil samples were ground and passed through the 0.15 mm sieve for measurement. The mineral N in the fresh soil samples was extracted with 2 M KCl, and the extraction solution was distilled with MgO and Devarda alloy simultaneously to obtain distillate. The 15N atom percentage excess in dry plant, dry soil, or distillate was determined using the isotope mass spectrometer (Finniga-Mat-251, Mass-Spectrometers, Finnigan, Germany).
2.6. Analytical Methods
- (1)
- Reuse efficiency of soil residual N by lettuce (15NUE, %) [17]:where, Ndff (kg ha−1) is the total 15N amount in lettuce plant, Cs (kg ha−1) is the total N in lettuce plant, Es (%) is the 15N atomic percentage excess in lettuce plant (%), Ef (%) is the 15N atom percentage excess in labeled N fertilizer, and Mf (kg ha−1) is the total amount of soil residual 15N.
- (2)
- Soil organic 15N (kg ha−1): the organic 15N is the amount of difference between the total 15N and the mineral 15N [18].
- (3)
- 15N recovery (kg ha−1): the 15N recovery is sum of the soil residual 15N in 0–80 cm layer and the plant absorbed15N [19].
- (4)
- 15N loss (kg ha−1): the 15N loss is the amount of difference between total soil residual 15N and 15N recovery [18].
Data were submitted to the SPSS 17.0 software for the statistical analysis, according to Duncan’s multiple range test.
3. Results
3.1. Residual Fertilizer N in Different Soil Layers from the Previous Season
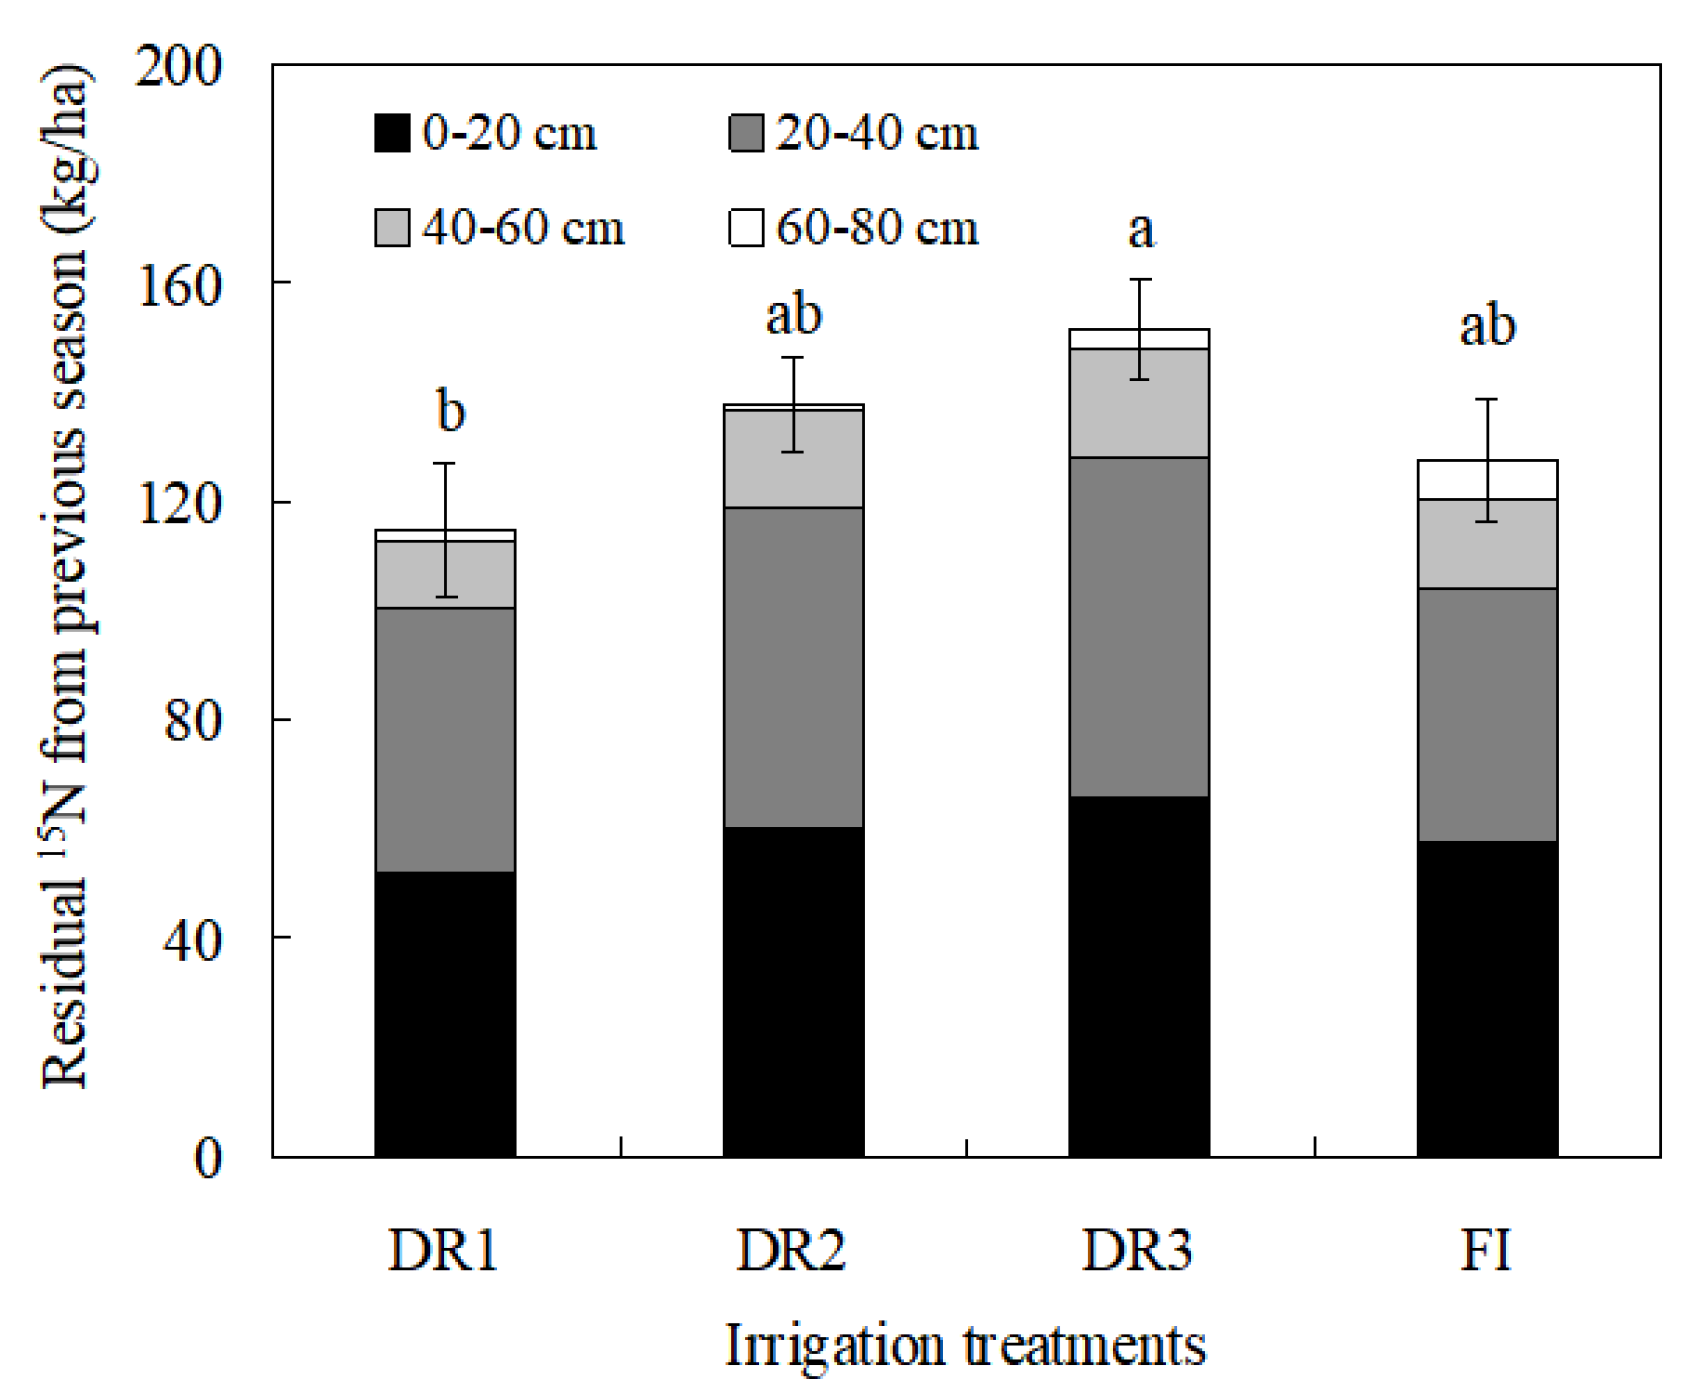
Among the four irrigation treatments, the amount of residual 15N in the soil from the previous season under DR3 was the highest, reaching 151.5 kg/ha (Figure 3); this indicated that nearly half of the applied 15N under DR3 remained in the soil. The 15N distribution in soil layers has obvious differences among the treatments. The residual 15N in 0–20 cm soil layer was the highest under DR3 treatment, reaching 65.4 kg/ha. However, residual 15N in 60–80 cm soil layer was the highest under FI, recorded as 7.1 kg/ha. This suggested that the irrigation regimes in the previous season have an important impact on the residual position of 15N. Among the drip irrigation treatments, DR2 promoted the second highest residual amount of 15N. The residual amount of 15N under DR1 was the lowest, 114.6 kg/ha, accounting for 36.9% of the total 15N application amount.
3.2. Crop Utilization for the Soil Residual Fertilizer N
Crop absorption for the residual 15N had statistical differences among the irrigation treatments (Figure 4). The absorption of 15N by the whole plant was the greatest under DR3, reaching 7.1 kg/ha, and there was no significant difference between DR3 and DR2 (6.7 kg/ha) on the whole plant 15N (p > 0.05). A similar regularity was detected on the 15N accumulation in the aboveground part of the lettuce. The aboveground plant 15N in the DR3 and DR2 lettuces was at a relatively higher level, reaching 4.6 and 4.2 kg/ha respectively, and no significant difference (p > 0.05) was found between them. The accumulated 15N in the underground part of the lettuce under DR2 (2.5 kg/ha) was the highest, which was significantly (p < 0.05) higher than other three treatments.
3.3. Distribution of Residual Fertilizer N in Different Soil Layers
After the cultivation of succeeding lettuces, 15N was mainly residual in the soil layer of 10–50 cm, and the residual amount in the 20 cm layer was the highest (Figure 5a). DR3 was the highest in the soil total 15N amount for all layers from 10 to 50 cm, and the soil total 15N amount in 20 cm and 30 cm layers under DR3 reached 30.8 and 26.5 kg/ha respectively. The distribution of soil total 15N under DR2 and FI was similar. For DR1, the 15N in 10 cm soil layer was relatively low, but there was an increasing trend from the depth of 10 to 40 cm.
The highest soil mineral 15N of 22.4 kg/ha in 10 cm layer was observed in DR2, but the difference of mineral 15N between DR2 and DR3 was not significant (p > 0.05) (Figure 5b). Mineral 15N amount in 10–40 cm soil layers was still at a higher level with DR2 and DR3 treatments. The difference of mineral 15N in 50 cm or below 50 cm layers was no longer obvious among the four treatments.
In general, after harvest of the succeeding lettuces, the residual 15N mainly existed in the mineral form. The proportion of soil organic 15N was less than 50% (Figure 5c). DR3 was the highest among the different irrigation treatments in the organic 15N (17.8 kg/ha) of the 10 cm soil layer. Similar regularity could also be found in 20, 30, or 40 cm soil layers. The organic 15N amount in 50 cm or below 50 cm soil layers was relatively low for all the treatments, which was 5.2–21.1% accounting for the total soil organic 15N. The amount of organic 15N in the 50 cm or below 50 cm soil layers treated by FI was at the highest level.
3.4. Balance of Soil Residual Fertilizer N
Table 2 shows the balance of 15N after harvest of succeeding lettuces. The total applied 15N for all the treatments was 310.5 kg/ha. After the cultivation of previous lettuces, the total residual 15N in soil among the treatments was obviously different. After the cultivation of succeeding lettuces, the residual 15N in the 0–80 cm soil accounted for 29.0–41.2% of the total applied 15N; 2.1–4.8% of the soil residual 15N from the previous season was absorbed by the succeeding lettuces, while 78.0–84.4% still remained in the 0–80 cm soil, and 10.9–20.0% was lost via pathways such as volatilization, deep seepage, or other unknown ways.
3.5. Correlation Analysis between 15NUE and Possible Influencing Factors
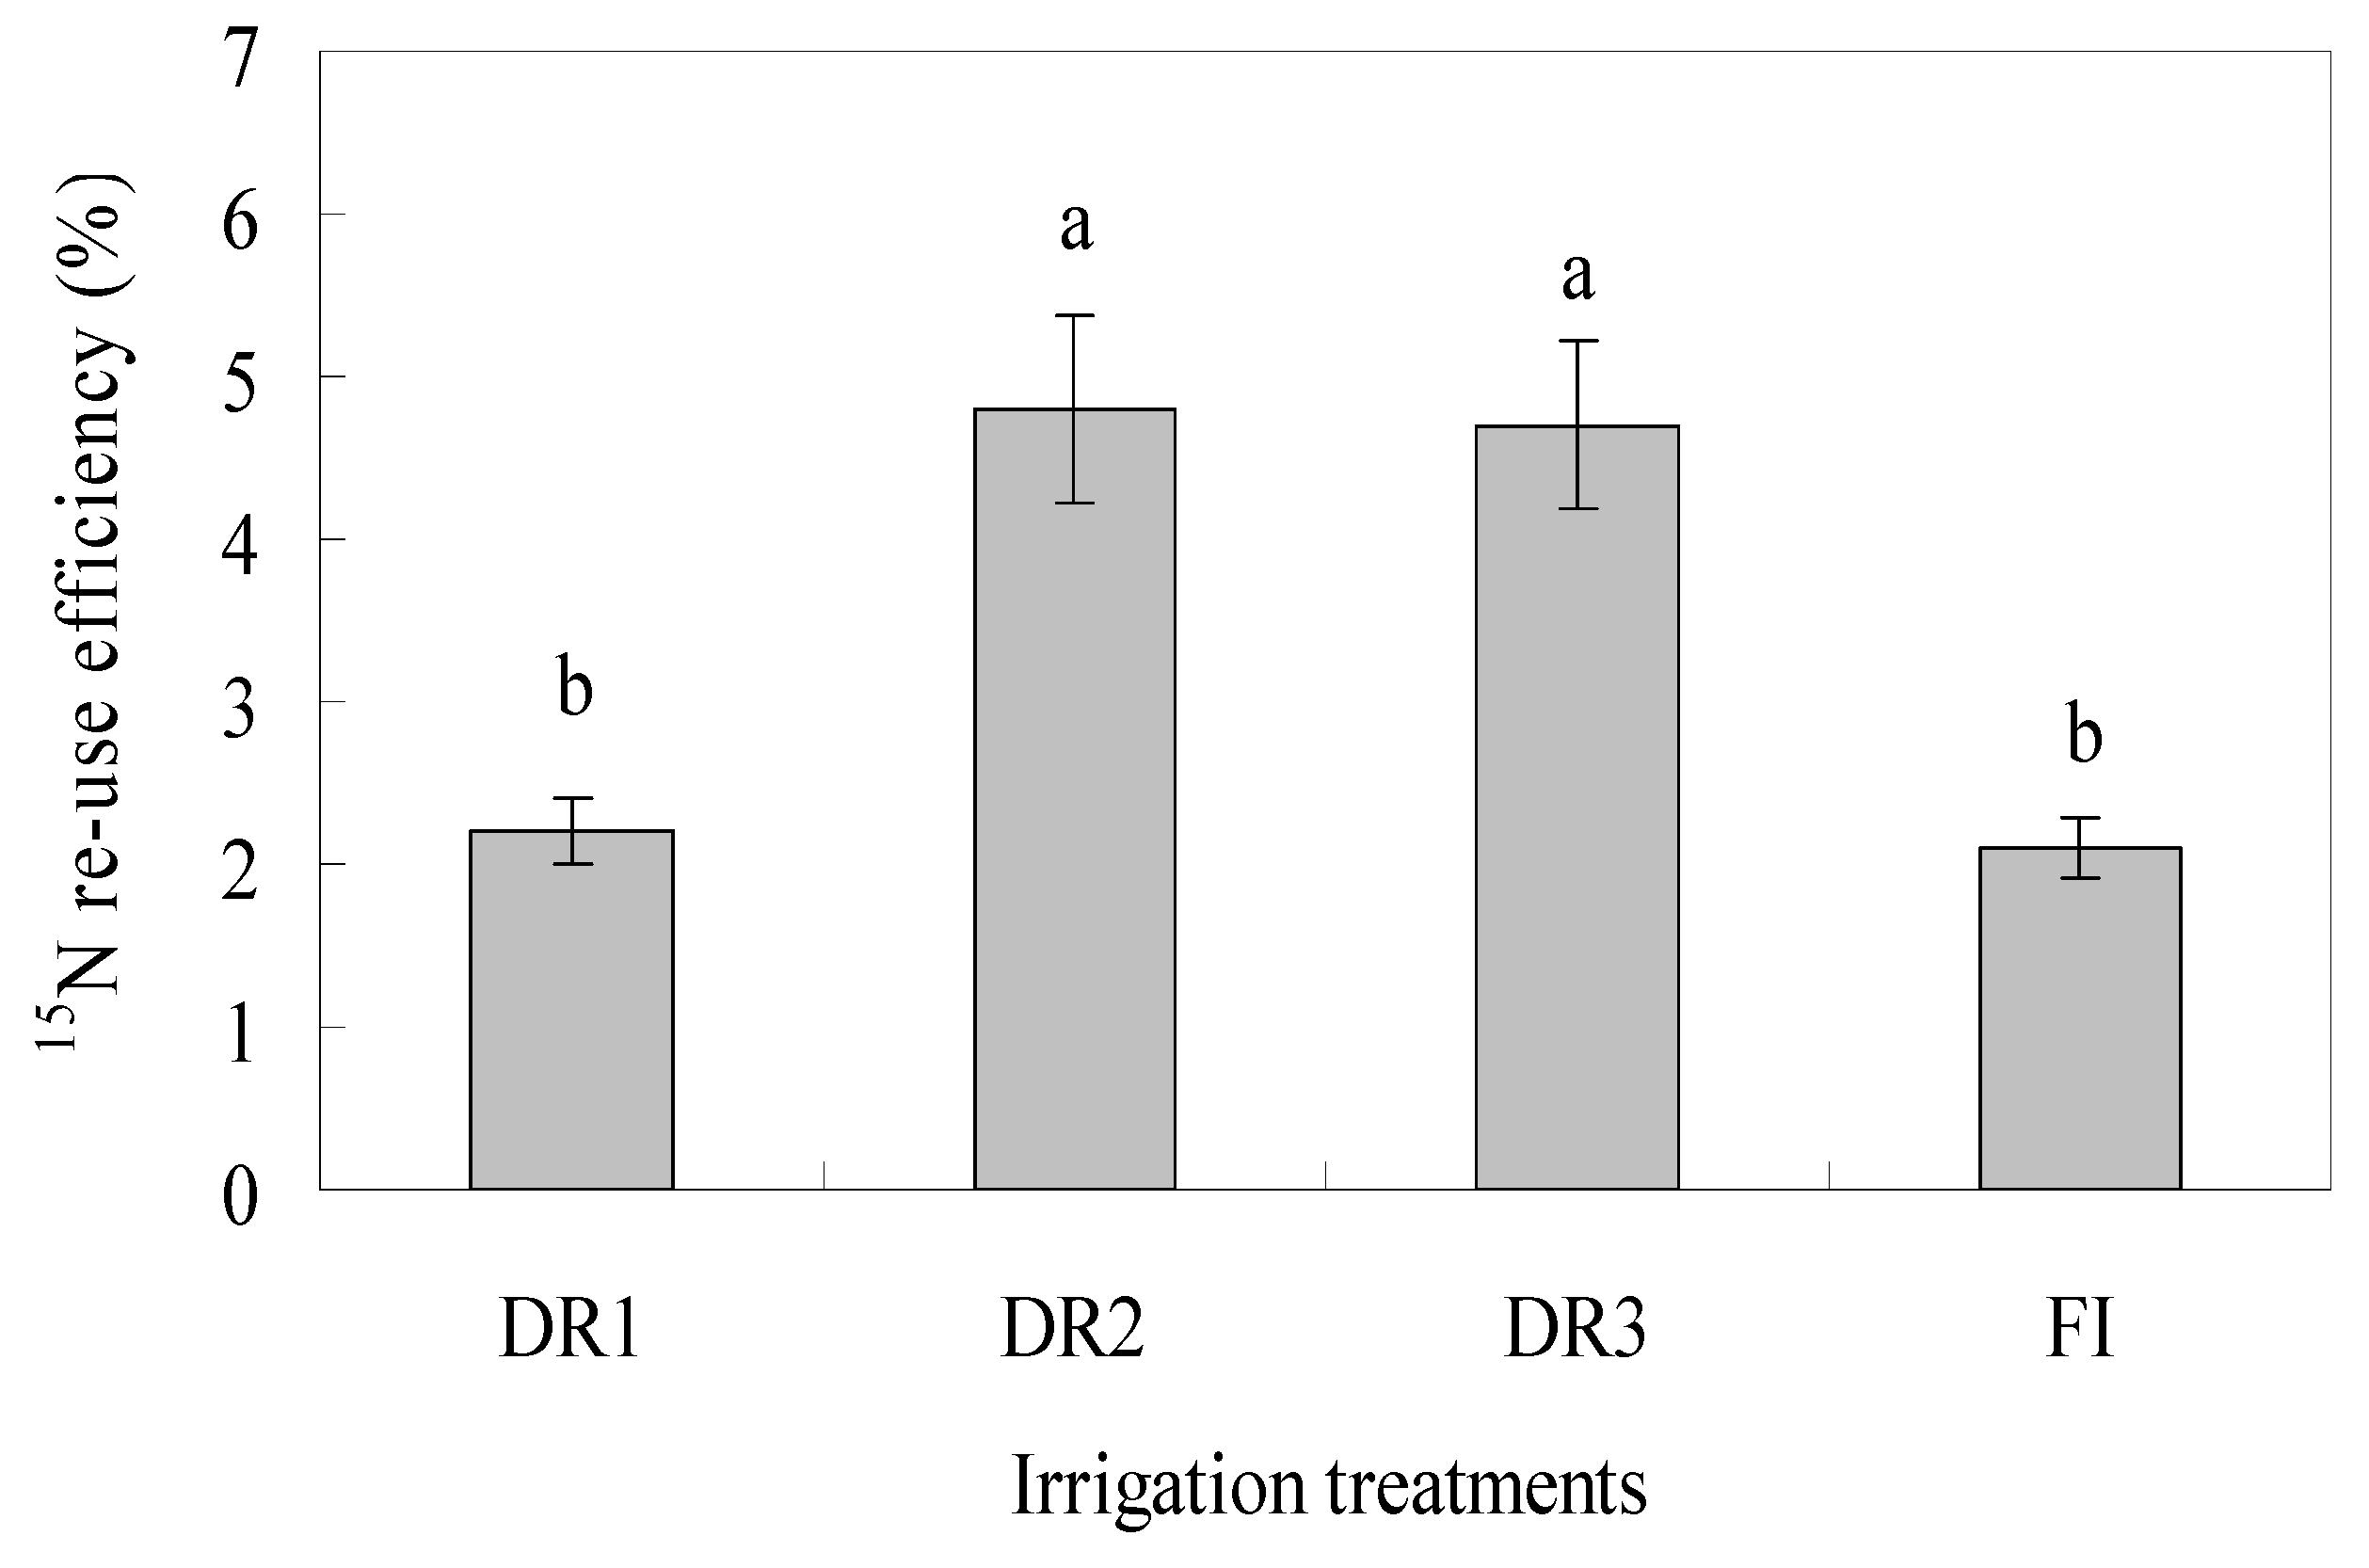
Lettuce 15NUE in the succeeding season for the treatments was 2.1–4.8% (Figure 6), which was approximately one-tenth of that in the previous season (32.6–39.4%). The 15NUE of the DR2 lettuces was the highest, reaching 4.8%, followed by DR3 (4.7%), and there was no significant (p < 0.05) difference of 15NUE between DR3 and DR2. DR1 was at the lowest level of 15NUE (2.2%) among the three drip irrigation treatments. The lettuce 15NUE under FI was 2.1%, which was not significantly (p > 0.05) different from that under DR1, but was significantly (p < 0.05) lower than under DR2 or DR3. It was found that although plant absorption for 15N under DR2 was lower compared to under DR3, DR2 obtained a slightly higher 15NUE than DR3.
The 15NUE of lettuce was positively correlated with the original 15N residual amount and the mineral 15N amount (p < 0.01), and the correlation coefficients were 0.771 and 0.943 respectively (Table 3). Moreover, the 15NUE of lettuce was also significantly correlated with irrigation parameters. The 15NUE was negatively correlated to the total irrigation amount or times (p < 0.05) but positively correlated with the irrigation quota (p < 0.05).
4. Discussion
Among the various varieties of N fertilizer, urea is a kind of neutral fertilizer which is easy to preserve and use. Urea is also the chemical fertilizer with the highest N content and to date, it has had little destructive effect on soil and is suitable for many crops. Therefore, urea is widely used all over the world. Urea needs to be dissolved in soil water to be absorbed by crops [20,21]. Therefore, using an appropriate amount of irrigation water to dissolve urea can promote the plant absorption for urea N, which is conducive to improving the N use efficiency. Moreover, it is a green resource reuse pathway that uses the subsequent crops to absorb the residual N in the previous soil.
The research by Xu Ru [22] showed that both irrigation methods (drip irrigation or sprinkler irrigation) and irrigation quota would affect the fate of urea N, and one important way for irrigation to affect the fate of urea N was to change the form of urea N in soil. In this study, the total soil residual 15N amount in shallow soil (10 cm) treated with DR2 was not the highest (Figure 3), but the mineral 15N amount was at the highest level (Figure 5b), indicating that irrigation regime has an important impact on the form of fertilizer 15N in soil, which is consistent with Xu Ru’s research conclusion. The soil residual 15N in this study mainly existed in the mineral form, which is in line with the results by Bhogal [23]. However, an early study showed that the residual N was mainly organic and only a small proportion was in the mineral form [24].
Looking from the fate of 15N after the cultivation of succeeding lettuces, 2.1–4.8% of the residual 15N was absorbed by the lettuces, 78.0–84.4% remained in 0–80 cm soil, and 10.9–20.0% was lost through gaseous state, deep seepage, or the other unknown ways. A study from Hou [19] showed that the average use efficiency of 15N applied to the first-season crop by the succeeding three season crops was 3.7–5.1%. Our research result on the crop reuse efficiency of residual 15N is consistent with that by Hou. However, it was worth noting that in Hou’s study, after the cultivation of four season crops, 54.2% of the applied 15N remained in the effective soil layer (0–60 cm depth) for being used by subsequent crops. However, in our study, the soil residual 15N in 0–80 cm soil was less than 41.2% just after two season cultivation of lettuces (Table 2). This difference might be caused by the different soil properties. Hou’s study was conducted in eastern China, where the soil type was yellow brown soil, whereas this study was in southern China, with a type of red soil. When there were differences in soil properties, the form of 15N in the soil would also be different. Even if the variety of the applied 15N was the same, there would be differences in the soil 15N availability (for crops) or the proportion of 15N loss driving by irrigation water, finally resulting in the difference of soil residual 15N amount. We detected a small amount of 15N below 80 cm, which may be related to the texture of the profile soil. Previous studies on nitrate N fertilizer showed that 15N originally labeled in 0–20 cm soil layer could be detected in 80–100 cm soil after one-season cultivation of crop [7,25].
The study by Zotarelli [26] showed that adequate water supply could benefit the development of crop roots, ensure the need of plant aboveground transpiration, promote the transportation of nutrients from the soil to the plant, and therefore improve the nutrient use efficiency. However, in this study, the highest total irrigation amount and irrigation frequency (DR1) did not obtain the highest 15NUE. This might because that the original soil residual 15N under DR1 was at a lower level among the three drip irrigation treatments (Figure 3), indicating that the supply of soil 15N itself has the key impact on plant 15NUE. The absorption of 15N by lettuce under DR3 also pointed to this inference. The absorption amount of residual 15N by the whole plant under DR3 was the greatest (Figure 4); one reason for this might be that irrigation affected the growth and development of crop roots which might have affected the plant absorption of 15N, while another reason might be that the total amount of original soil residual 15N from the previous season was highest under DR3, increasing the availability of soil residual 15N for the plants. When the lysimeter environment was controlled where the soil 15N could not migrate and lost laterally, Dong [27] observed 15N reuse efficiency of as high as 14%.
Among the various influencing factors of the crop fertilizer N use efficiency, water and N supply were considered to be the two key factors, and a coupling effect was detected between them [28]. The increase in N application could significantly promote the growth and development of crop roots, increase the rooting depth of crops, and expand the space for roots to absorb nutrients and water [29]. An appropriate irrigation regime was conducive to the enhancement of fertilizer N availability in soil [30]. Our study also proved that the crop utilization efficiency of soil residual N was closely related to the irrigation parameters and the N residual parameters (Table 3), especially related to the soil mineral 15N amount. For the drip irrigation treatments, the 15NUE of lettuce under DR3 was significantly higher than that under DR1, which might be due to the fact that the frequent irrigation under DR1 promoted the migration of 15N to the lower soil layer and caused a low amount of soil 15N in the root layer (Figure 5), thus decreasing 15N availability for crops. However, for DR3, although the amount of single irrigation was highest, the total irrigation amount was the lowest (Table 1), decreasing the proportion of 15N loss varying with irrigation; with addition of the greater residual amount of soil mineral 15N, higher 15NUE was obtained. In this study, the 15NUE under the drip irrigation treatments was generally higher compared with that under FI, which might be due to the uniform distribution of water and N in soil under drip irrigation improving the 15N absorption efficiency by plant roots [31].
In the past, when selecting a suitable irrigation regime, the indicators including crop yield, quality, and water-use efficiency were considered. An earlier study also took N use efficiency as an index to evaluate irrigation regimes [32]. However, few studies consider the crop use efficiency of the soil residual fertilizer N. This study explored the balance of the residual N from the first season under different irrigation regimes in the succeeding season. The result could be used to formulate an irrigation regime to improve the N-use efficiency by multiple seasons of crops. The loss of soil residual 15N in this study was calculated by the difference method, and the calculated 15N loss included the deep leakage, gaseous loss, and other unknown loss. Future research should be refined to determine the precise amount of gaseous 15N loss and its driving mechanism so as to provide a scientific basis for formulating the water-saving and emission-reducing irrigation regime. In addition, it is worth noting that the integration of water and fertilizer, that is, fertigation, has been an important agronomic practice for vegetable cultivation [33,34]. Drip-irrigation fertilization is conducive to the efficient absorption of fertilizer. Under the scientific amount of water and nutrient solution, the nitrogen use efficiency in the current season is higher, and the soil residual nitrogen may be less. This may be different from the results of this study, and it is worth further study.
5. Conclusions
Among the residual 15N from the previous season, 2.1–4.8% was absorbed by the succeeding lettuce, 78.0–84.4% remained in the 0–80 cm soil, and 10.9–20.0% was lost via gaseous emission, deep seepage, or other unknown ways. After the cultivation of succeeding lettuces, the soil residual 15N mainly existed in the mineral form. The re-use efficiencies of residual 15Nunder drip irrigation treatments were overall higher than under furrow irrigation treatment. The lettuce reuse efficiency of soil residual 15N was positively correlated with total residual 15N amount (p < 0.01) and the mineral 15N amount (p < 0.01), while negatively correlated with the total irrigation amount (p < 0.05) and irrigation times (p < 0.05). We concluded that the appropriate irrigation regime (DR2) was conducive to promoting the absorption of residual N by succeeding crop, but the crop re-use efficiency for residual N was more closely related to the initial N residue condition.
Author Contributions
Methodology, M.H., X.S., F.Z.; software, J.Z., C.L.; validation, Y.X.; formal analsis, Q.J., Q.Z., M.H.; resources, M.H., F.Z., L.Z.; data curation, J.C., Q.Z.; writing—original draft preparation, J.C.; writing—review and editing, J.C., Q.J., J.Z., F.Z.; visualization, L.Z.; project administration, Q.Z., C.L.; funding acquisition, Q.J., X.S., L.Z. All authors have read and agreed to the published version of the manuscript.
Funding
Jiangsu coastal group unveiled project “Efficient Salt Reduction Technology for Optimal Management of Irrigation and Drainage of Saline Alkali Cultivated Land”(2022YHTDJB02-1), the cross fusion project “Green Civil Engineering and Water Conservancy” (000-71202103D), “Smart Agriculture” (000-71202103B) of Fujian Agriculture and Forestry University, Young and middle-aged Project of Education Department of Fujian Province (JAT210784).
Conflicts of Interest
The authors declare no conflict of interest.
References
- Ladha, J.K.; Peoples, M.B.; Reddy, P.M.; Biswas, J.C.; Bennett, A.; Jat, M.L.; Krupnik, T.J. Biological nitrogen fixation and prospects for ecological intensification in cereal-based cropping systems. Field Crops Res. 2022, 283, 108541. [Google Scholar] [CrossRef] [PubMed]
- Hou, X.; Fan, J.; Hu, W.; Zhang, F.; Yan, F.; Xiao, C.; Li, Y.; Cheng, H. Optimal irrigation amount and nitrogen rate improved seed cotton yield while maintaining fiber quality of drip-fertigated cotton in northwest China. Ind. Crops Prod. 2021, 170, 113710. [Google Scholar] [CrossRef]
- Li, Y.; Huang, G.; Chen, Z.; Xiong, Y.; Huang, Q.; Xu, X.; Huo, Z. Effects of irrigation and fertilization on grain yield, water and nitrogen dynamics and their use efficiency of spring wheat farmland in an arid agricultural watershed of Northwest China. Agric. Water Manag. 2022, 260, 107277. [Google Scholar] [CrossRef]
- Ma, L.; Zhang, X.; Lei, Q.; Liu, F. Effects of drip irrigation nitrogen coupling on dry matter accumulation and yield of Summer Maize in arid areas of China. Field Crops Res. 2021, 274, 108321. [Google Scholar] [CrossRef]
- Zamljen, T.; Lojen, S.; Slatnar, A.; Zupanc, V. Effect of deficit irrigation on nitrogen accumulation and capsaicinoid content in Capsicum plants using the isotope 15N. Agric. Water Manag. 2022, 260, 107304. [Google Scholar] [CrossRef]
- Zhang, Y.; Zhang, F. The effect of irrigation and fertilization on growth and quality of tomato under fertigation in greenhouse. Agric. Res. Arid Areas 2014, 32, 206–212. [Google Scholar]
- Hou, M.; Jin, Q.; Lu, X.; Li, J.; Zhong, H.; Gao, Y. Growth, Water Use, and Nitrate-N-15 Uptake of Greenhouse Tomato as Influenced by Different Irrigation Patterns, N-15 Labeled Depths, and Transplant Times. Front. Plant Sci. 2017, 8, 666. [Google Scholar] [CrossRef]
- Shao, G.-C.; Wang, M.-H.; Yu, S.-E.; Liu, N.; Xiao, M.-H.; Yuan, M. Potential of Controlled Irrigation and Drainage for Reducing Nitrogen Emission from Rice Paddies in Southern China. J. Chem. 2015, 2015, 913470. [Google Scholar] [CrossRef] [Green Version]
- Yu, G.; Wu, H. Study on nitrogen migration in purple soil and nitrogen uptake by rice. Plant Nutr. 1999, 5, 316–320. [Google Scholar]
- Yu, Y. Characteristics of N2O emissions and nitrogen leaching from upland soils under drip or furrow irrigation. China Environ. Sci. 2021, 41, 813–825. [Google Scholar]
- Liu, Z.; Xu, Y. The effect of cultivation and fertilization mode on the growth and nitrogen utilization rate of Dryland Maize in North China. Jiangsu Agric. Sci. 2019, 47, 50–54. [Google Scholar]
- Yu, L.; Pu, B. Influence of “Lose-control” of Fertilizer on Nitrogen Agronomic Utilized efficiency of Crop. Bull. Anhui Agron. 2007, 13, 25–26. [Google Scholar]
- Zhao, W.; Liang, B.; Yang, X.; Zhou, J. Fate of residual N-15-labeled fertilizer in dryland farming systems on soils of contrasting fertility. Soil Sci. Plant Nutr. 2015, 61, 846–855. [Google Scholar] [CrossRef] [Green Version]
- Huang, Z.; Zhang, J.; Ren, D.; Hu, J.; Xia, G.; Pan, B. Modeling and assessing water and nitrogen use and crop growth of peanut in semi-arid areas of Northeast China. Agric. Water Manag. 2022, 267, 107621. [Google Scholar] [CrossRef]
- Jiang, J.; Li, J.; Wang, Z.; Wu, X.; Lai, C.; Chen, X. Effects of different cropping systems on ammonia nitrogen load in a typical agricultural watershed of South China. J. Contam. Hydrol. 2022, 246, 103963. [Google Scholar] [CrossRef]
- Ye, T.; Ma, J.; Zhang, P.; Shan, S.; Liu, L.; Tang, L.; Cao, W.; Liu, B.; Zhu, Y. Interaction effects of irrigation and nitrogen on the coordination between crop water productivity and nitrogen use efficiency in wheat production on the North China Plain. Agric. Water Manag. 2022, 271, 107787. [Google Scholar] [CrossRef]
- Liang, B.; Yang, X.; Murphy, D.V.; He, X.; Zhou, J. Fate of (15) N-labeled fertilizer in soils under dryland agriculture after 19 years of different fertilizations. Biol. Fertil. Soils 2013, 49, 977–986. [Google Scholar] [CrossRef]
- Liang, B.; Zhao, W.; Yang, X.; Zhou, J. Fate of nitrogen-15 as influenced by soil and nutrient management history in a 19-year wheat-maize experiment. Field Crops Res. 2013, 144, 126–134. [Google Scholar] [CrossRef]
- Hou, M.; Shao, X.; Jin, Q.; Gao, X. A N-15 tracing technique-based analysis of the fate of fertilizer N: A 4-year case study in eastern China. Arch. Agron. Soil Sci. 2017, 63, 74–83. [Google Scholar] [CrossRef]
- Aluoch, S.O.; Li, Z.; Li, X.; Hu, C.; Mburu, D.M.; Yang, J.; Xu, Q.; Yang, Y.; Su, H. Effect of mineral N fertilizer and organic input on maize yield and soil water content for assessing optimal N and irrigation rates in Central Kenya. Field Crops Res. 2022, 277, 108420. [Google Scholar] [CrossRef]
- Sun, G.; Hu, T.; Liu, X.; Peng, Y.; Leng, X.; Li, Y.; Yang, Q. Optimizing irrigation and fertilization at various growth stages to improve mango yield, fruit quality and water-fertilizer use efficiency in xerothermic regions. Agric. Water Manag. 2022, 260, 107296. [Google Scholar] [CrossRef]
- Xu, R.; Chen, J.; Lin, Z.; Chen, X.; Hou, M.; Shen, S.; Jin, Q.; Zhong, F. Fate of urea-N-15 as influenced by different irrigation modes. RSC Adv. 2020, 10, 11317–11324. [Google Scholar]
- Bhogal, A.; Rochford, A.D.; Sylvester-Bradley, R. Net changes in soil and crop nitrogen in relation to the performance of winter wheat given wide-ranging annual nitrogen applications at Ropsley, UK. J. Agric. Sci. 2000, 135, 139–149. [Google Scholar] [CrossRef]
- Macdonald, A.J.; Poulton, P.R.; Powlson, D.S.; Jenkinson, D.S. Effects of season, soil type and cropping on recoveries, residues and losses of 15 N-labelled fertilizer applied to arable crops in spring. J. Agric. Sci. 1997, 129, 125–154. [Google Scholar] [CrossRef]
- Hou, M.; Zhong, F.; Jin, Q.; Liu, E.; Feng, J.; Wang, T.; Gao, Y. Fate of nitrogen-15 in the subsequent growing season of greenhouse tomato plants (Lycopersicon esculentum Mill) as influenced by alternate partial root-zone irrigation. RSC Adv. 2017, 7, 34392–34400. [Google Scholar] [CrossRef] [Green Version]
- Zotarelli, L.; Dukes, M.D.; Scholberg, J.M.S.; Munoz-Carpena, R.; Icerman, J. Tomato nitrogen accumulation and fertilizer use efficiency on a sandy soil, as affected by Nitrogen rate and irrigation scheduling. Agric. Water Manag. 2009, 96, 1247–1258. [Google Scholar] [CrossRef]
- Dong, X.; Liu, X.; Ren, C.; Ji, Y.; Ju, X.; Zhang, L. Fate and Residual Effect of Fertilizer Nitrogen under Winter Wheat-Summer Maize Rotation in North China Plain in Meadow Cinnamon Soils. Sci. Agric. Sin. 2012, 45, 2209–2216. [Google Scholar]
- Ma, H.; Yang, T.; Niu, X.; Hou, Z.; Ma, X. Sound Water and Nitrogen Management Decreases Nitrogen Losses from a Drip-Fertigated Cotton Field in Northwestern China. Sustainability 2021, 13, 1002. [Google Scholar] [CrossRef]
- Wang, J.; Baerenklau, K.A. Crop response functions integrating water, nitrogen, and salinity. Agric. Water Manag. 2014, 139, 17–30. [Google Scholar] [CrossRef] [Green Version]
- Zhang, Y.-J.; Xu, J.-N.; Cheng, Y.-D.; Wang, C.; Liu, G.-S.; Yang, J.-C. The effects of water and nitrogen on the roots and yield of upland and paddy rice. J. Integr. Agric. 2020, 19, 1363–1374. [Google Scholar] [CrossRef]
- Sun, Z. Effects of Different Nitrogen Application Levels and Irrigation Methods on Nitrogen Leaching and N2O Emission from Rice Fields. Ph.D. Thesis, Nanjing Agricultural University, Nanjing, China, 2014. [Google Scholar]
- Jianwen, Y. 15N tracing technique based evaluation of entropy weight coefficients of water and nitrogen couplingschemes for flue-cured tobacco. J. Northwest A. F. Univ. (Nat. Sci. Ed.) 2014, 42, 25–31. [Google Scholar]
- Nayebloie, F.; Kouchakzadeh, M.; Ebrahimi, K.; Homaee, M.; Abbasi, F. Improving fertigation efficiency by numerical modelling in a lettuce subsurface drip irrigation farm. Agric. Water Manag. 2022, 270, 107721. [Google Scholar] [CrossRef]
- Abubakar, S.A.; Hamani, A.K.M.; Chen, J.; Sun, W.; Wang, G.; Gao, Y.; Duan, A. Optimizing N-fertigation scheduling maintains yield and mitigates global warming potential of winter wheat field in North China Plain. J. Clean. Prod. 2022, 357, 131906. [Google Scholar] [CrossRef]
Figure 1.
The experimental block and the layout of the micro area.

Figure 2.
The division of growth stage for the lettuce (☆ indicates that at this stage, the lettuces were treated with different lower limits of drip irrigation).
Figure 2.
The division of growth stage for the lettuce (☆ indicates that at this stage, the lettuces were treated with different lower limits of drip irrigation).

Figure 3.
The amount of soil residual 15N from the previous season and its distribution in different soil layers (DR1, DR2, and DR3 mean the lower irrigation limits of 75%, 65%, and 55% accounting for the field capacity, separately. FI represents furrow irrigation treatment using the same irrigation regime as DR2. The data in the Figure are mean ± SD. The different letters (a, b) indicate significant differences at the level of 0.05 according to Duncan’s multiple range test).

Figure 4.
The plant absorbed 15N and its distribution in different lettuce organs (DR1, DR2, and DR3 mean the lower irrigation limits of 75%, 65%, and 55% accounting for the field capacity, separately. FI represents furrow irrigation treatment using the same irrigation regime as DR2. The data in the Figure are mean ± SD. The different letters (a, b) indicate significant differences at the level of 0.05 according to Duncan’s multiple range test).

Figure 5.
The distribution of total 15N (a), mineral 15N (b) and organic 15N (c) in soil profile after harvest of the succeeding lettuces under different irrigation treatments (DR1, DR2, and DR3 mean the lower irrigation limits of 75%, 65%, and 55% accounting for the field capacity, separately. FI represents furrow irrigation treatment using the same irrigation regime as DR2. The data in the Figure are mean ± SD).

Figure 6.
The lettuce-use efficiency for soil residual 15N under different irrigation treatments (DR1, DR2, and DR3 mean the lower irrigation limits of 75%, 65%, and 55% accounting for the field capacity, separately. FI represents furrow irrigation treatment using the same irrigation regime as DR2. The data in the Figure are mean ± SD. The different letters (a, b) indicate significant differences at the level of 0.05 according to Duncan’s multiple range test).


Table 1.
The irrigation regime.
| Treatment | Rosette Stage to Fleshy Stem Expansion Stage | The Irrigation Amount during Whole Growth Period (mm) | |||
|---|---|---|---|---|---|
| Irrigation Times | Irrigation Interval (d) | Irrigation Quota (mm) | Irrigation Amount (mm) | ||
| DR1 | 7 | 11.1 | 15.8 | 110.6 | 275.7 |
| DR2 | 4 | 19.5 | 23.7 | 94.8 | 259.9 |
| DR3 | 2 | 39.0 | 31.6 | 63.2 | 228.3 |
| FI | 4 | 19.5 | 23.7 | 94.8 | 259.9 |
Table 2.
The fate and balance of 15N under different irrigation modes.
| Treatment | Applied 15N (kg/ha) | Total 15N Residual (kg/ha) | 15N Recovery (kg/ha) | 15N Loss (kg/ha) | |
|---|---|---|---|---|---|
| Soil Residual | Plant Absorption | ||||
| DR1 | 310.5 | 114.6 ± 15.06 b | 90.1 ± 10.9 c | 2.6 ± 0.56 b | 21.9 ± 3.6 ab |
| DR2 | 310.5 | 137.8 ± 10.71 ab | 111.5 ± 8.26 ab | 6.7 ± 1.3 a | 19.6 ± 1.15 bc |
| DR3 | 310.5 | 151.5 ± 11.18 a | 127.9 ± 7.52 a | 7.1 ± 1.31 a | 16.5 ± 2.35 c |
| FI | 310.5 | 127.5 ± 13.66 ab | 99.4 ± 10.41 bc | 2.7 ± 0.5 b | 25.5 ± 2.8 a |
Note: DR1, DR2, and DR3 mean lower irrigation limits of 75%, 65%, and 55% accounting for the field capacity, separately. FI represents furrow irrigation treatment using the same irrigation regime as DR2. The data in the Table are mean ± SD. Different letters (a, b, c) indicate significant differences at the level of 0.05 according to Duncan’s multiple range test.
Table 3.
Interaction relationship between the plant 15N use efficiency and the possible influencing factors.
Table 3.
Interaction relationship between the plant 15N use efficiency and the possible influencing factors.
| Plant 15N Use Efficiency | Total Soil residual 15N | Soil Organic 15N Amount | Soil Mineral 15N Amount | Total Irrigation Amount | Irrigation Quota | Irrigation Times | |
|---|---|---|---|---|---|---|---|
| Plant 15N use efficiency | 1 | 0.771 ** | 0.283 | 0.943 ** | −0.630 * | 0.647 * | −0.640 * |
| Total soil residual 15N | 1 | 0.603 * | 0.726 ** | −0.746 ** | 0.764 ** | −0.754 ** | |
| Soil organic 15N amount | 1 | 0.454 | −0.889 ** | 0.906 ** | −0.894 ** | ||
| Soil mineral 15N amount | 1 | −0.793 ** | 0.780 ** | −0.751 ** | |||
| Total irrigation amount | 1 | −0.973 ** | 0.932 ** | ||||
| Irrigation quota | 1 | −0.990 ** | |||||
| Irrigation times | 1 |
Note: ** and * in the table indicate significant correlation at the levels of 0.01 and 0.05, respectively.
Publisher’s Note: MDPI stays neutral with regard to jurisdictional claims in published maps and institutional affiliations. |
© 2022 by the authors. Licensee MDPI, Basel, Switzerland. This article is an open access article distributed under the terms and conditions of the Creative Commons Attribution (CC BY) license (https://creativecommons.org/licenses/by/4.0/).
Share and Cite
MDPI and ACS Style
Chen, J.; Jin, Q.; Zhu, Q.; Xiao, Y.; Zhu, J.; Shao, X.; Hou, M.; Zhong, F.; Lin, C.; Zhu, L. Fate of Soil Residual Fertilizer-15N as Affected by Different Drip Irrigation Regimes. Water 2022, 14, 2281. https://doi.org/10.3390/w14152281
AMA Style
Chen J, Jin Q, Zhu Q, Xiao Y, Zhu J, Shao X, Hou M, Zhong F, Lin C, Zhu L. Fate of Soil Residual Fertilizer-15N as Affected by Different Drip Irrigation Regimes. Water. 2022; 14(15):2281. https://doi.org/10.3390/w14152281
Chicago/Turabian StyleChen, Jingnan, Qiu Jin, Qinyuan Zhu, Ying Xiao, Jingwen Zhu, Xiaohou Shao, Maomao Hou, Fenglin Zhong, Chao Lin, and Lin Zhu. 2022. "Fate of Soil Residual Fertilizer-15N as Affected by Different Drip Irrigation Regimes" Water 14, no. 15: 2281. https://doi.org/10.3390/w14152281
Note that from the first issue of 2016, this journal uses article numbers instead of page numbers. See further details here.