
A Comprehensive Approach for Floodplain Mapping through Identification of Hazard Using Publicly Available Data Sets over Canada


1
Department of Water Resources Development and Management, Indian Institute of Technology Roorkee, Roorkee 247 667, India
2
Department of Civil and Environmental Engineering, Western University, London, ON N6A 3K7, Canada
*
Author to whom correspondence should be addressed.
Water 2022, 14(14), 2280; https://doi.org/10.3390/w14142280
Submission received: 19 June 2022
/
Revised: 14 July 2022
/
Accepted: 16 July 2022
/
Published: 21 July 2022
(This article belongs to the Special Issue Lowering Risk by Increasing Resilience: Selected Papers from 8th International Conference on Flood Management (ICFM 8))
Abstract
:Quantifying flood inundation and hazards over large regions is paramount for gaining critical information on flood risk over the vulnerable population and environment. Readily available global data and enhancement in computational simulations have made it easier to simulate flooding at a large scale. This study explores the usability of publicly available datasets in flood inundation and hazard mapping, and ensures the flood-related information reaches the end-users efficiently. Runoff from the North American Regional Reanalysis and other relevant inputs are fed to the CaMa-Flood model to generate flooding patterns for 1 in 100 and 1 in 200-year return period events over Canada. The simulated floodplain maps are overlaid on the property footprints of 34 cities (falling within the top 100 populated cities of Canada) to determine the degree of exposure during 1991, 2001 and 2011. Lastly, Flood Map Viewer—a web-based public tool, is developed to disseminate extensive flood-related information. The development of the tool is motivated by the commitment of the Canadian government to contribute $63 M over the next three years for the development of flood maps, especially in high-flood risk areas. The results from the study indicate that around 80 percent of inundated spots belong to high and very-high hazard classes in a 200-year event, which is roughly 4 percent more than observed during the 100-year event. We notice an increase in the properties exposed to flooding during the last three decades, with a signature rise in Toronto, Montreal and Edmonton. The flood-related information derived from the study can be used along with vulnerability and exposure components to quantify flood risk. This will help develop appropriate pathways for resilience building for long-term sustainable benefits.
1. Introduction
In the last few decades, flood events have increased manifold leading to widespread human, environmental and economic losses [1,2,3]. Between 1980 and 2018, about 5997 extreme flood events resulted in 223,482 deaths and a mammoth economic loss exceeding $1 trillion [4]. A recent report by UNISDR (2015) [5] stated that flood-prone areas around the world house around 800 million residents, of which roughly one-tenth are exposed to floods annually. Apart from that, numerous scientific research signifies that the looming disaster situation is expected to become more severe in the future periods due to alterations in climatic patterns and socio-economic dynamics [6,7,8,9]. In a recent study, Dottori et al. (2018) [10] reported that with a rise in temperature up to 1.5 °C, human losses due to flooding on the global scale could rise to as high as 70–83%, including direct flood damages up to 160–240%. Under such circumstances, there is a dire need to map and quantify the flood losses to ensure optimum protection of the communities and assets.
Floodplain mapping provides qualitative (degree/severity of flood hazard) and quantitative (inundation extent, duration of flooding, inundation depth, etc.) information on flooding and is considered a viable option for minimizing flood risk. Most of the research on floodplain mapping has been demonstrated at small scales, i.e., local and regional. Considering the widespread damage, there was a growing need to extend this to larger scales at the country, region and global levels. However, there were two significant challenges: (i) substantial computational efforts and (ii) public availability of global data sets. During the last decade, considerable progress has been made in tackling these two issues. Recently, the scientific research community introduced a suite of global flood inundation models [11,12]. These sophisticated tools are designed to quantify the flood inundation dynamics using state-of-the-art algorithms over large regions. The flood hazard information is derived from the inundation parameters through suitable approaches [1,13,14]. A list of the widely used global flood models is presented in Table 1. Recently, Gaur et al. (2018, 2019) [15,16] employed CaMa-Flood to determine the timing of floods and changes in their magnitudes across Canada from 2016 to 2100. In another research, Lim et al. (2018) [17] utilized runoff observations of 11 GCMs belonging to the CMIP5 consortium as inputs to the CaMaFlood model to generate global river water depths; however, at a coarser resolution of 0.25° × 0.25°. Earlier, Winsemius et al. (2013) [18] developed a detailed framework in the GLOFRIS model to determine flood hazards while utilizing climate-related datasets. In the future, the framework may be viewed as a multi-model approach, enabling a particular component in the cascade to be used with another element. The flood hazard estimates from Winsemius et al. (2013) [18] were later downscaled to resolutions of 1 km × 1 km by Ward et al. (2013) [19], in order to account for the risk assessment.
On the other side, the ready availability of public data sets such as Shuttle Radar Topography Mission (SRTM) DEM, MERIT DEM [20]; hydrologic and meteorological data from reanalysis products [21,22]; GCMs [23,24]; and tide data from global tide elevation [25] have made it easier to develop comprehensive flood model set-ups to derive hazard values. Weather forecasting models use two-dimensional gridded data sets to generate the reanalysis datasets [26]. They serve as an alternative for those regions where station-level observations are scant or sparsely available. Although most studies have utilized runoff outputs from GCMs, there is a need to understand whether reanalysis observations that fuse the station level and satellite observations can also be considered efficient hydraulic inputs to these sophisticated models. Gründemann et al. (2018) [27] used the global Water Resources Reanalysis (WRR) dataset for characterizing floods over the Limpopo River basin in Southern Africa. The authors reported that the models are competent in capturing flood events over stations with a large upstream catchment area. To explore the efficacy of reanalysis products in reconstructing hydro-meteorological hazardous events at the regional scale, Senatore et al. (2020) [28] performed dynamical downscaling of two global reanalyses: ERA-Interim and ERA5 and used them in WRF-Hydro modeling system. Although the study reconstructed three heavy precipitation events, the impact at the inundation scale was not looked into further.
Among all the known natural disasters in Canada, floods are the most severe, as they constitute the highest costs for recovery [29]. Between 1970 and 2015, the total number of flood events increased significantly [30]. Therefore, identifying and quantifying flood risks is indispensable to developing robust adaptation measures and resilience mechanisms. Although past studies have attempted to derive floodplain information for the entire globe, high-resolution flood inundation and hazard information for Canada has not been deeply examined. Exhaustive information on flood hazards will help identify the severely affected regions, and together with vulnerability and exposure components, can determine the degree of flood risk. Being the second-largest country in the world, research and development on various domains of flood management are carried out at the level of each province. Because of this, a unified methodology that is nationally accepted has not been identified so far. Under these situations, it is crucial that a nationwide floodplain mapping be carried out to disseminate the information to various end-users. Recently, a Federal Floodplain Mapping Guidelines Series was launched by Public Safety Canada, which covers all components of the flood mitigation process. The extensive framework consists of four main blocks, namely: (i) Flood Hazard Identification and Priority Setting; (ii) Hydrologic and Hydraulic Procedures for Flood Hazard Delineation; (iii) Geomatics Guidelines for Floodplain mapping; and (iv) Risk-based Land-use Guide. For a holistic approach to flood management, developing a suitable information system that can provide precious flood-related information to various end-users is essential.
Based on the extensive literature review, it is now well established that quantifying flood inundation dynamics over large scales has become easier, with the increasing availability of public datasets and global flood models. However, the usability of public data sets (model inputs) freely available to the research community has not been deeply examined. Information on flood hazards, an essential component of flood risk, has not been extensively derived by past research. Most of them have either derived the overland inundation extent and depths or demonstrated how changes in river channel depths have led to riverine inundation. The exposure of properties to concurrent flooding over Canada has not been studied in detail on such a large scale. In a country like Canada, where several cities have been witnessing a significant increase in settlements and considerable investment is provided towards flood management activities, it is vital to know the degree of exposure of properties. The present study evokes the usability of publicly available datasets for carrying our floodplain mapping and deriving flood hazards at the inundation scale over Canada. With the inundation information, it also attempts to determine the exposure of properties at a decadal time scale. Lastly, it reports on developing a web-based flood information system to efficiently disseminate flood-related information to various end-users. The development of this platform is welcoming to the fact that it witnessed around 100,000 investigations and more than 11 million visitors from around the globe within a month of its release. The following section provides details of multiple datasets and the flood model used to simulate flooding patterns for different scenarios. This section also elaborates on the derivation of flood hazards from inundation values. It is followed by details on quantifying property exposure due to concurrent flooding over the last three decades. The last portion describes the development of a web-based flood information tool. Section 3 provides the results and discussions on inundation mapping, hazard modeling, validation of floodplain maps, and degree of property exposure. The last section gathers the conclusions and future perspectives of the study.
2. Materials and Methods
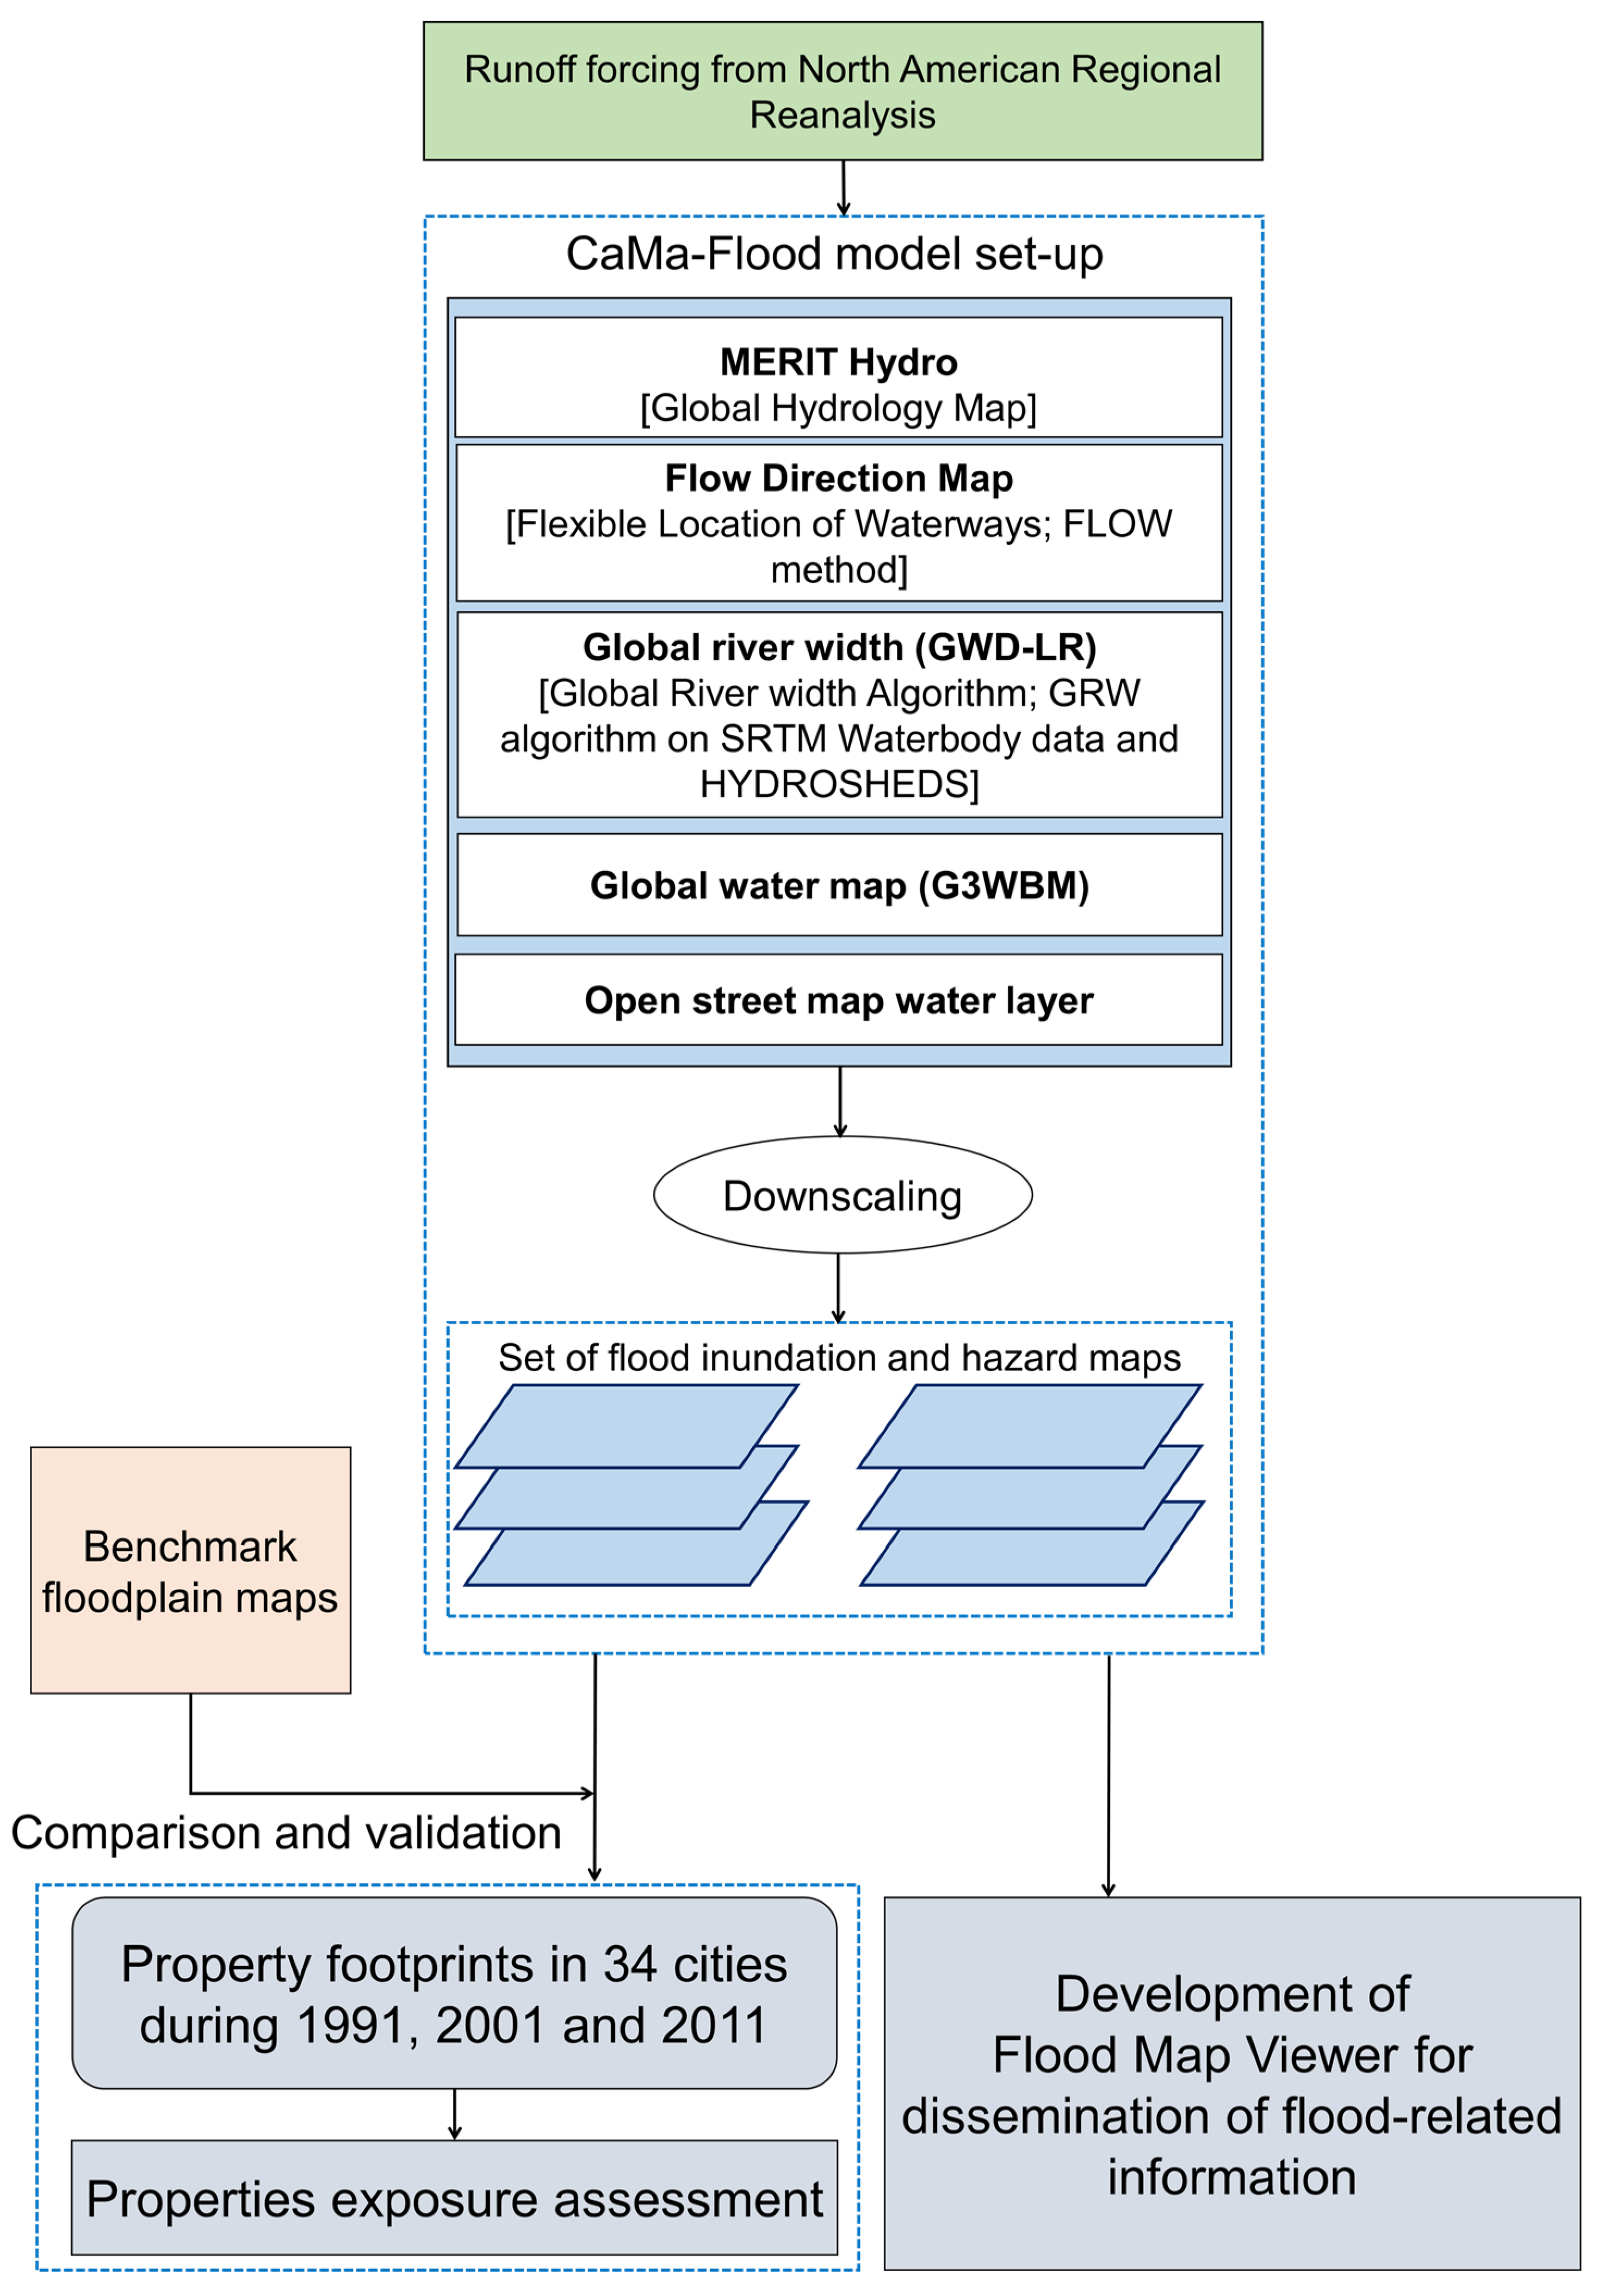
The proposed framework for capturing hazards through floodplain mapping and disseminating flood-related information through a web-based information system is represented in Figure 1. The framework is demonstrated over the entire of Canada, where floods are known to be the costliest and most frequently occurring among all known natural hazards. On average, around 75% of the budget from the Federal Disaster Financial Assistance Arrangements (DFAA) is utilized for bearing damages from nationwide flooding in Canada. With significant climate change impacts and changing socio-economic dynamics, flood events have escalated in the last century, and mainly severe ones have become quite common [15,31]. Under such situations, it is estimated that around $673 million, i.e., about 75% of the total DFAA, will be necessary to meet the future flood losses in Canada [32].
The extensive framework comprises four major blocks, namely: (i) Selection of readily available runoff observations; (ii) Generation of flood inundation and hazard information through the CaMa-Flood model; (iii) Quantification of decadal property exposure due to flood inundation; and (iv) Development of the Flood Map Viewer. A detailed explanation of each block is provided in the following sections.
2.1. North American Regional Reanalysis (NARR)
The NARR is a readily available product containing high-resolution estimates of various atmospheric and land surface hydrologic variables for the North American region [33]. The detailed hydro-meteorological information embedded in NARR was derived while improving NCEP-NCAR reanalysis datasets [34]. The present work uses the 3-hr runoff data from 1979 to the present with a surface resolution of 0.3° × 0.3° as input forcing to the flood model.
2.2. Catchment-Based Macro-Scale Floodplain (CaMA-Flood) Model
The CaMa-Flood model is a well-known software used to simulate the hydrodynamics of flood waters over large regions [35]. The CaMa-Flood (version v3.6.2) considers the discretized version of river networks as hydrological units, otherwise referred to as unit catchments. The water storage within each unit catchment decides the water levels and inundation extent. This is ensured by considering the sub-grid topographic parameters of overland bathymetry and channel. For the river network map, CaMa-Flood utilizes a grid-based hybrid river network. This arrangement connects one grid to the adjoining unit catchment, resulting in a realistic sub-grid topography parameterization. The local inertial equation calculates the channel discharge and velocity [36]. On the other hand, water storage is decided by the water-balance equation.
The provision of explicit representation of flood-related outputs (water level and flooded area) is considered one of the main advantages of the CaMa-Flood model among all the other models in practice. Being a 2D model, the results derived from CaMa-Flood can be compared and validated at the 1D, i.e., river channel, and 2D, i.e., overland inundation level. Compared to the other existing models, CaMa-Flood provides high numerical efficiency for simulating inundation dynamics over large watersheds. The overland inundation is determined through a robust diagnostic scheme at the unit-catchment scale. The local inertial equation and the adaptive time step scheme optimize the computation of channel discharge and water storage [25,36].
Components of the CaMa-Flood Model
The CaMa-Flood requires a suite of geomorphological and spatial inputs for set-up, which are described in detail in the following sections.
(i) Flow Direction Map: The river network map is derived by employing the Flexible Location of Waterways (FLOW) technique [37]. This method is also utilized to generate the sub-grid-scale topographic parameters such as the length of the channel and its level, elevation of the floodplain and unit-catchment area.
(ii) Global River Width (GWD-LR): The Global Width Database for Large Rivers (GWD-LR) was developed by Yamazaki et al. (2014) [38] by utilizing the SRTM water body mask and flow direction map. This data provides the river widths from bank to bank and effective levels. It has been observed that the effective river width in this dataset is comparatively narrower when compared to a few other existing sources. However, the relative difference does not exceed 20%. Moreover, as the river widths are derived from a reliable flow direction map, the applicability of GWD-LR for large-scale inundation modeling is expected to contain few error percentages.
(iii) Global Water Map: The Global Water Body Map (G3WBM) was introduced by Yamazaki et al. (2015) [39] by implementing an automated algorithm over a set of Landsat images from the Global Land Survey (GLS) database at various temporal scales. They considered around 33,890 scenes from four GLS epochs to create a noise-free water body map. The G3WBM is also free from ice/snow gaps and cloud covers. The water body frequency was identified by overlapping multi-temporal Landsat images to distinguish the permanent water bodies from the temporary ones. It has also been observed that the G3WBM efficiently separates river channels and adjoining floodplains more precisely than other competitive datasets.
(iv) OSM Water Layer: Yamazaki et al. (2019) [40] introduced OSM Water Layer, a global surface water data by extracting water masks from the OSM. The OSM Water Layer is available freely in both PBF and GeoTiff formats. The raster version of the map has four categories, i.e., Major rivers, large rivers and lakes, minor streams, and canals.
2.3. Methodology of Floodplain Mapping
The NARR runoff dataset is downloaded and aggregated on a daily time scale. The runoff estimates within each grid for 100 and 200-year events are generated through extreme value analysis using Generalized Extreme Value (GEV) distribution. This distribution has an upper bound and a flexible tail, and is mathematically represented as
where , , and are the location, scale and shape parameters, respectively.
The 100 and 200-year runoff calculated at every grid is considered input to the CaMa-Flood to generate flood inundation parameters, namely inundation depth and extent. Later an efficient downscaling procedure is implemented over the coarse maps to create high-resolution maps at a resolution of 1 km. The floodplain maps for a few regions are extracted and compared with the existing regional maps of flood-prone areas.
2.4. Determination of Flood Hazard
The range of inundation depths derived through flood inundation modeling is utilized to derive flood hazard values. The discretization of hazard values is governed based on the damage to physical assets and human beings [14]. Assuming ‘(ɗn)’ is the depth of inundation associated with each pth grid in the considered domain, the value of flood hazard Ȟ depends upon ɗn ∈ D ∀ p ∈ P. Here, D denotes the set of all flood depths. The flood hazard Ȟ may be expressed as f(D) as described below
where R+ represents the set of positive real numbers, while ‘p’ denotes the total grid cells.
ζ: D → Ȟ ∈ R+ such that
ծ =ζ ((ɗ1),…, (ɗn)); ծ ∈ Ȟ; p ∈ P and (ɗ1), …, (ɗn) ∈ D
ծ =ζ ((ɗ1),…, (ɗn)); ծ ∈ Ȟ; p ∈ P and (ɗ1), …, (ɗn) ∈ D
Based on the hazard estimates, the values of ζ ((ɗ1),…, (ɗn)) are discretized into five classes, as described in Equations (4) and (5)
where ɗ and represent the value of flood hazard and its index for the pth grid.
2.5. Quantification of Exposure of Properties Due to Flooding
The continuous 3-hr North American Regional Reanalysis (NARR) runoff values for 1991, 2001 and 2011 were considered as hydraulic inputs to the CaMa-Flood model set-up along with the other relevant geomorphological inputs. The simulated maximum flood depth map for the three-time periods is further utilized to quantify the degree of exposure of properties. The property footprints for 1991, 2001 and 2011 are obtained from the housing statistics, Statistics Canada (www.statcan.gc.ca, accessed on 16 June 2021). Based on data availability, 34 cities are considered that fall on Canada’s list of 100 most populous cities [16]. The footprints of the properties during 1991, 2001 and 2011 are overlaid on the maximum flood depth map simulated during the corresponding years to estimate the total number of properties exposed due to concurrent flooding.
2.6. Development of Flood Map Viewer
To disseminate flood-related information to various stakeholders and local communities in Canada, Flood Map Viewer (http://www.floodmapviewer.com/, accessed on 30 June 2021)—a web-based, freely accessible public tool, has been developed. The web-based tool considers entire Canada as the base map. It presents flood-related information for 100 and 200 years for various historical and climate change scenarios at a high resolution of 1 km × 1 km. Special attention is given to user-friendliness to ensure that the information can be understood by a non-technical end-user [35].
3. Results
3.1. Floodplain Maps Derived by Utilizing NARR
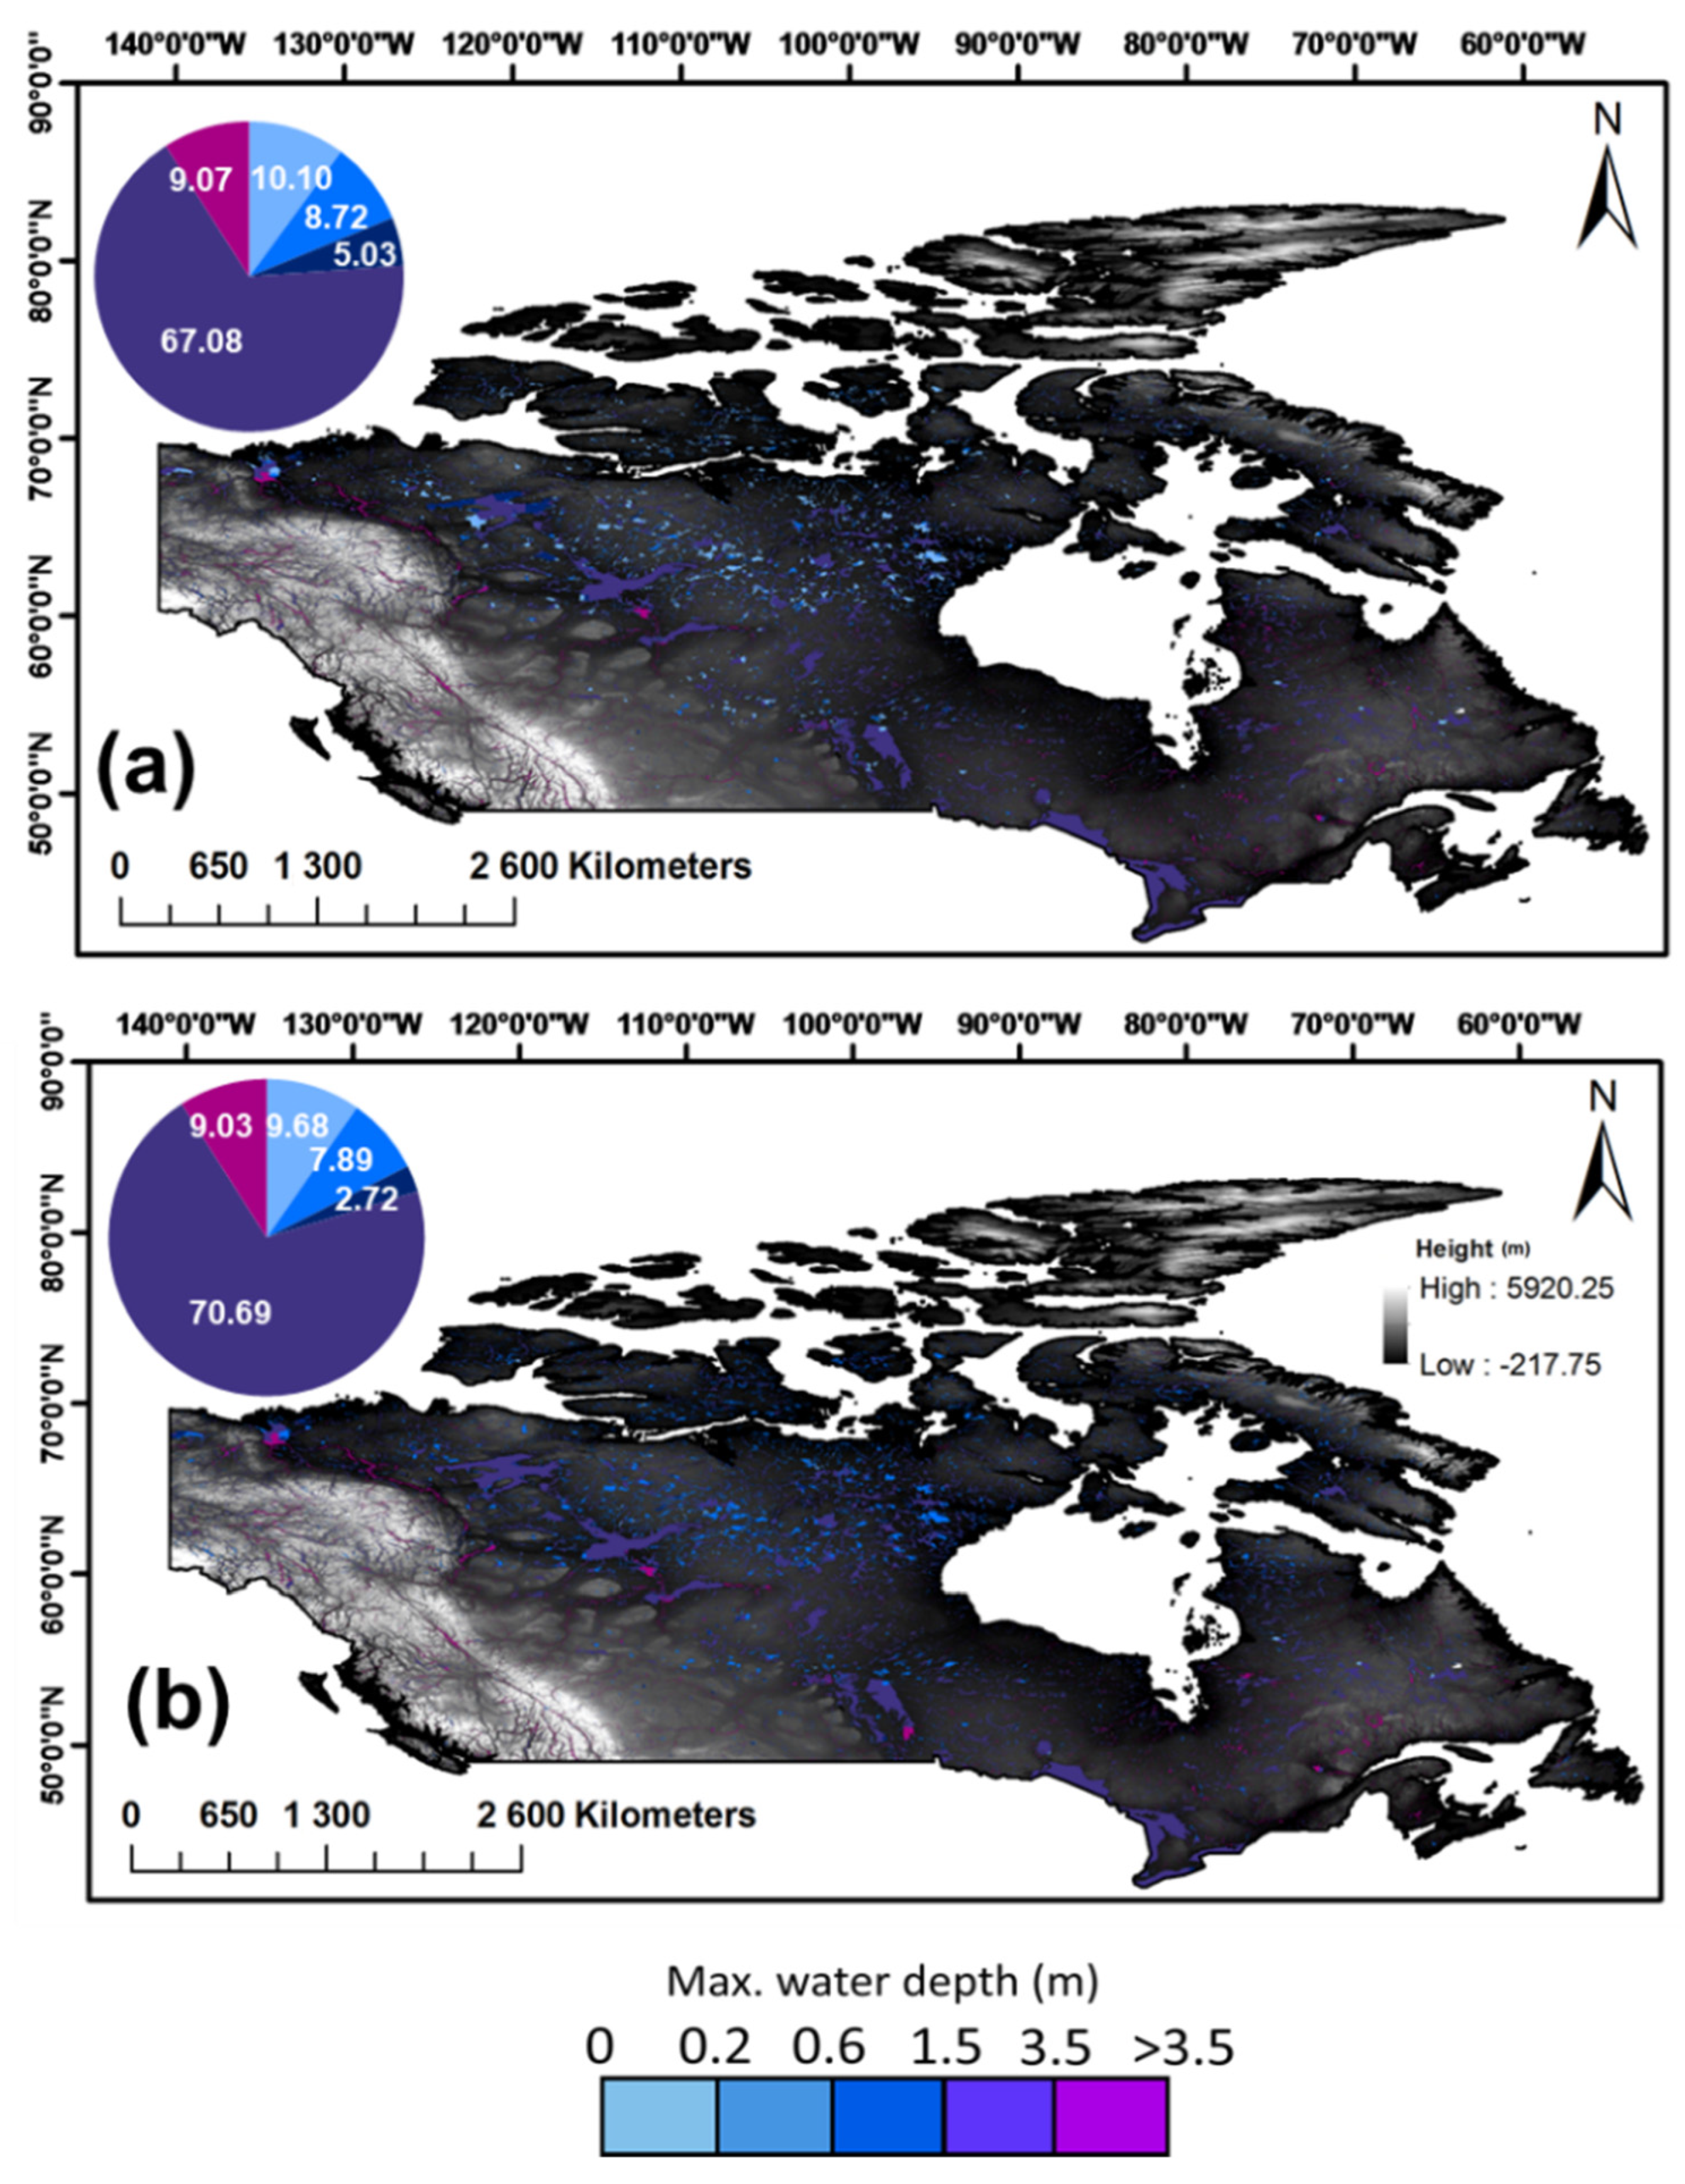
The 100-year and 200-year runoff are inputs to the CaMa-Flood model to generate Canada-wide floodplain maps. These high-resolution floodplain maps (resolution of 1 km × 1 km) are illustrated in Figure 2, overlaid on the MERIT DEM. The percentage of maximum water depth, an indicator of flood hazard, is presented in pie charts inside these maps. We notice that about 10.10 percent of inundated regions fall within the low-hazard category (depth below 0.2 m) during 100-year (Figure 2a) as compared to 9.68 percent for a 200-year flood event (Figure 2b). On the contrary, the cumulative percentage classes close to 80 percent for the latter, roughly 4 percent more than observed during the 100-year event. The remaining classes of flood hazards for 100-year and 200-year events constitute 8.72 and 7.89 percent (low hazard), 5.03, and 2.72 percent (medium hazard). Very-low and low flood hazard classes are mostly found over Canada’s north and central regions. The efficacy of representing extreme events by NARR over Canada is well documented in the recent literature [35,41]. The observations confirm the excellent performance of NARR as a suitable input parameter, as it can capture the high-and very-high hazard spots well. In a recent article, Essou et al. (2016) [42] highlight that NARR uses a 3D-VAR assimilation approach that provides high efficiency in representing extreme events such as floods.
3.2. Validation of Floodplain Maps with Benchmark Maps
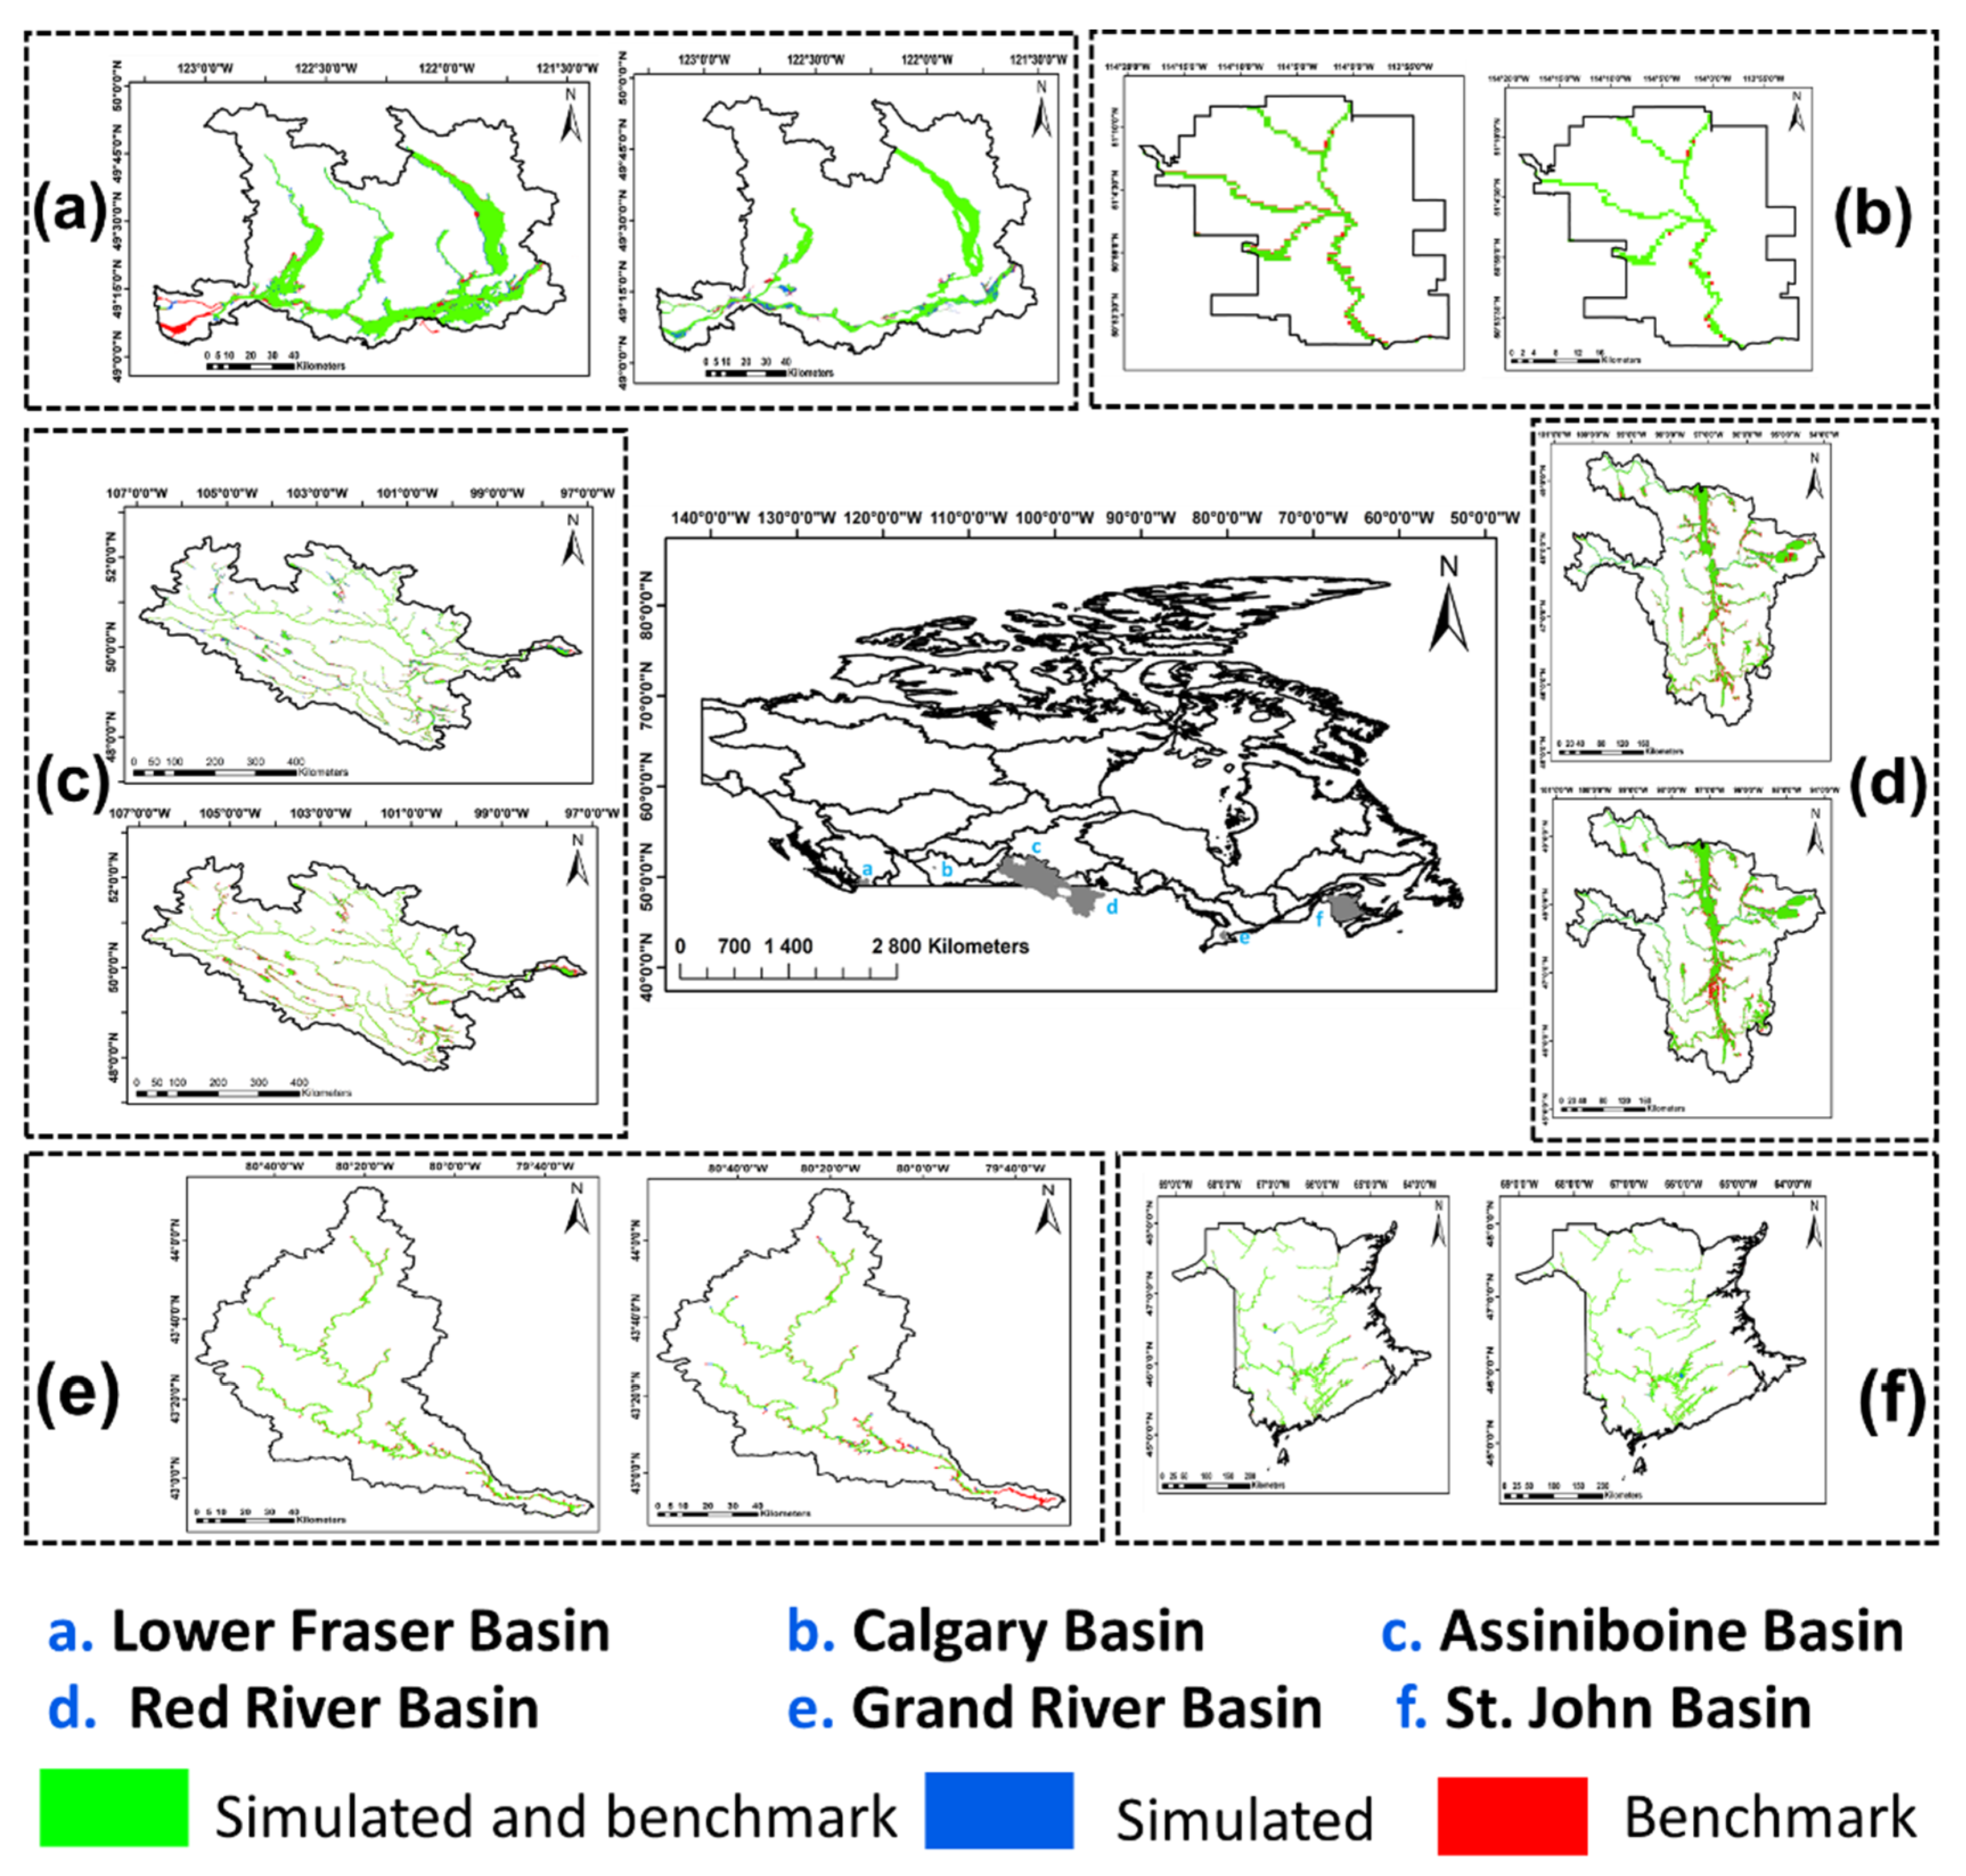
The 100-year and 200-year floodplain maps generated through computational modeling are compared with a few existing floodplain maps over six regions in Canada. The spatial flood-related information in these maps is obtained from the respective basins by considering precise and extensive input data sets such as high-resolution topography, river cross-section details, etc., while using a regional flood inundation model. As such, comparing simulated floodplain maps with the existing ones over the regions will ensure the performance of the flood model. Figure 3 compares simulated and existing floodplain maps over six areas: Lower Fraser River Basin, Grand River Basin, St. John Basin, Calgary basin, Assiniboine Basin and Red River basin. The enlarged version of the maps is provided in the Supplementary Document (Figures S1–S6). Overall, all the simulated maps perform well in representing the inundation dynamics over these regions.
While comparing the flood inundation over Fraser Basin (geographical extent ~ 11,134 km2) for 100 years and 200 years, we notice more than 3/4th of inundated spots in the existing floodplain maps comply with the simulated ones (Figure 3a). With a 200-year map, we see an underestimation of a few areas in the western coastal region, as highlighted by red-colored grids. This is because the flood model set-up considered in this study accounts for the riverine inundation. While demonstrating the comparison over Calgary Basin (geographical extent ~1345 km2), we notice a high similarity with the existing floodplain maps. Earlier, Sampson et al. (2015) [43] also noticed a similar behavior while comparing their simulated floodplain maps over Calgary. The authors used SRTM DEM to represent the topographical features in the flood model. The present study exhibits a higher degree of similarity with the benchmark floodplain map due to the consideration of MERIT DEM, in which significant noise corrections over SRTM DEM have been conducted.
Past research has confirmed a high degree of performance of MERIT DEM in floodplain mapping, synonymous with LiDAR DEMs over various case studies [44,45,46,47]. The Assiniboine Basin (geographical extent ~162,000 km2) is a large river basin consisting of Qu’Appelle, Souris, and Assiniboine sub-basins. This region’s past flood events in 2011 and 2014 incurred huge economic and physical losses. Blais et al. (2016) [48] regard the 2011 event as the most extreme event that Canada has witnessed. The NARR-derived floodplain maps for both scenarios match the benchmark floodplain inundated spots. A slight discrepancy is noticed over the northern and eastern parts. The possible reason for this observation is the rapid changes in the channel slope of the Assiniboine River at various chainages over the study region, which may not be precisely captured by the MERIT DEM [49]. The red river basin (geographical extent ~119,000 km2) resides beside the Assiniboine basin. As the red river flows northwards, it follows a meandering river course, which aggravates the chances of inundation near the floodplains during extreme weather events.
The flood event that occurred in 1997 over the Red river basin is often referred to as the “Flood of the Century” [50,51]. Through a visual comparison, it is clear that the simulated floodplain matches very closely with the existing flood inundated spots. The complete riverine inundation is adequately simulated over the study extent. A limited number of small stream networks are left behind. This is due to the inclusion of Global River Width data as an input, which cannot identify river widths of size less than 183 m. The Grand Basin (geographical extent ~6800 km2) in Southwest Ontario consists of three distinct landforms: plains in the northern and western parts, moraines in the eastern and central portions, and clay in the southern. This region’s major flood drivers are rapid snowmelt with concurrent rainfall and high surge. The simulated floodplain maps capture the inundated spots competitively. However, a slight underestimation is observed with the 200-year floodplain map over the basin’s lower stretch. The St. John Basin (geographical extent ~12,222 km2) is between Quebec and New Brunswick. The primary drivers of concurrent flooding occur from April to May from the runoff resulting from the melting snowpack. A major spring flooding was seen in 2008, when a relatively warmer climate resulted in a higher melting of snowpack. Although the St. John basin is a coastal region, the inundated spots over the southern stretches are simulated reasonably well by NARR (Figure 3f). A few areas of over-predicted and under-predicted grids are noticed, possibly due to noise in MERIT DEM elevation values.
3.3. Exposure of Property to Flooding at a Decadal Time Scale
The property footprints were overlaid on the floodplain maps simulated for 1991, 2001, and 2011 with the NARR dataset. As mentioned in Section 2.5 34 cities falling in Canada’s 100 most populous cities were collected based on data availability. The distribution of these cities over the provinces is as follows: two cities each in Alberta, Saskatchewan and New Brunswick; four cities in British Columbia; fifteen in Ontario; six in Quebec; and one in each in Manitoba, Nova Scotia, and Newfoundland and Labrador.
The number of properties exposed to concurrent floods in 1991, 2001 and 2011 is illustrated in Figure 4. Overall, there has been an increase in the number of properties exposed to flooding in the last three decades. Cities such as Vancouver, Victoria and Abbotsford-Mission in British Columbia showed more or less an increase in the properties exposed to flooding in 2001 and 2011. Edmonton recorded a steep rise of nearly four times in the number of properties exposed to floods in 2011 compared to 1991. Our results are supported by the recent findings by Chakraborty et al. (2021) [52]. They reported that British Columbia contains the second-highest percentage of the population exposed to flooding. Most cities in Ontario depict a rise in numbers, with the maximum being in Toronto (1997 in 1991, 2020 in 2001 and 2455 in 2011), followed by Hamilton 1224 in 1991, 1522 in 2001, and 1601 in 2011). A similar pattern is noticed in Quebec, where the number of properties exposed to flooding remained high (more than 2000) throughout the decades. The remaining cities in Quebec did not show a rapid change in the numbers over the years. Cities in New Brunswick indicate a sparse number of properties exposed to flooding, similar to Nova Scotia, Newfoundland and Labrador.
3.4. Flood Map Viewer
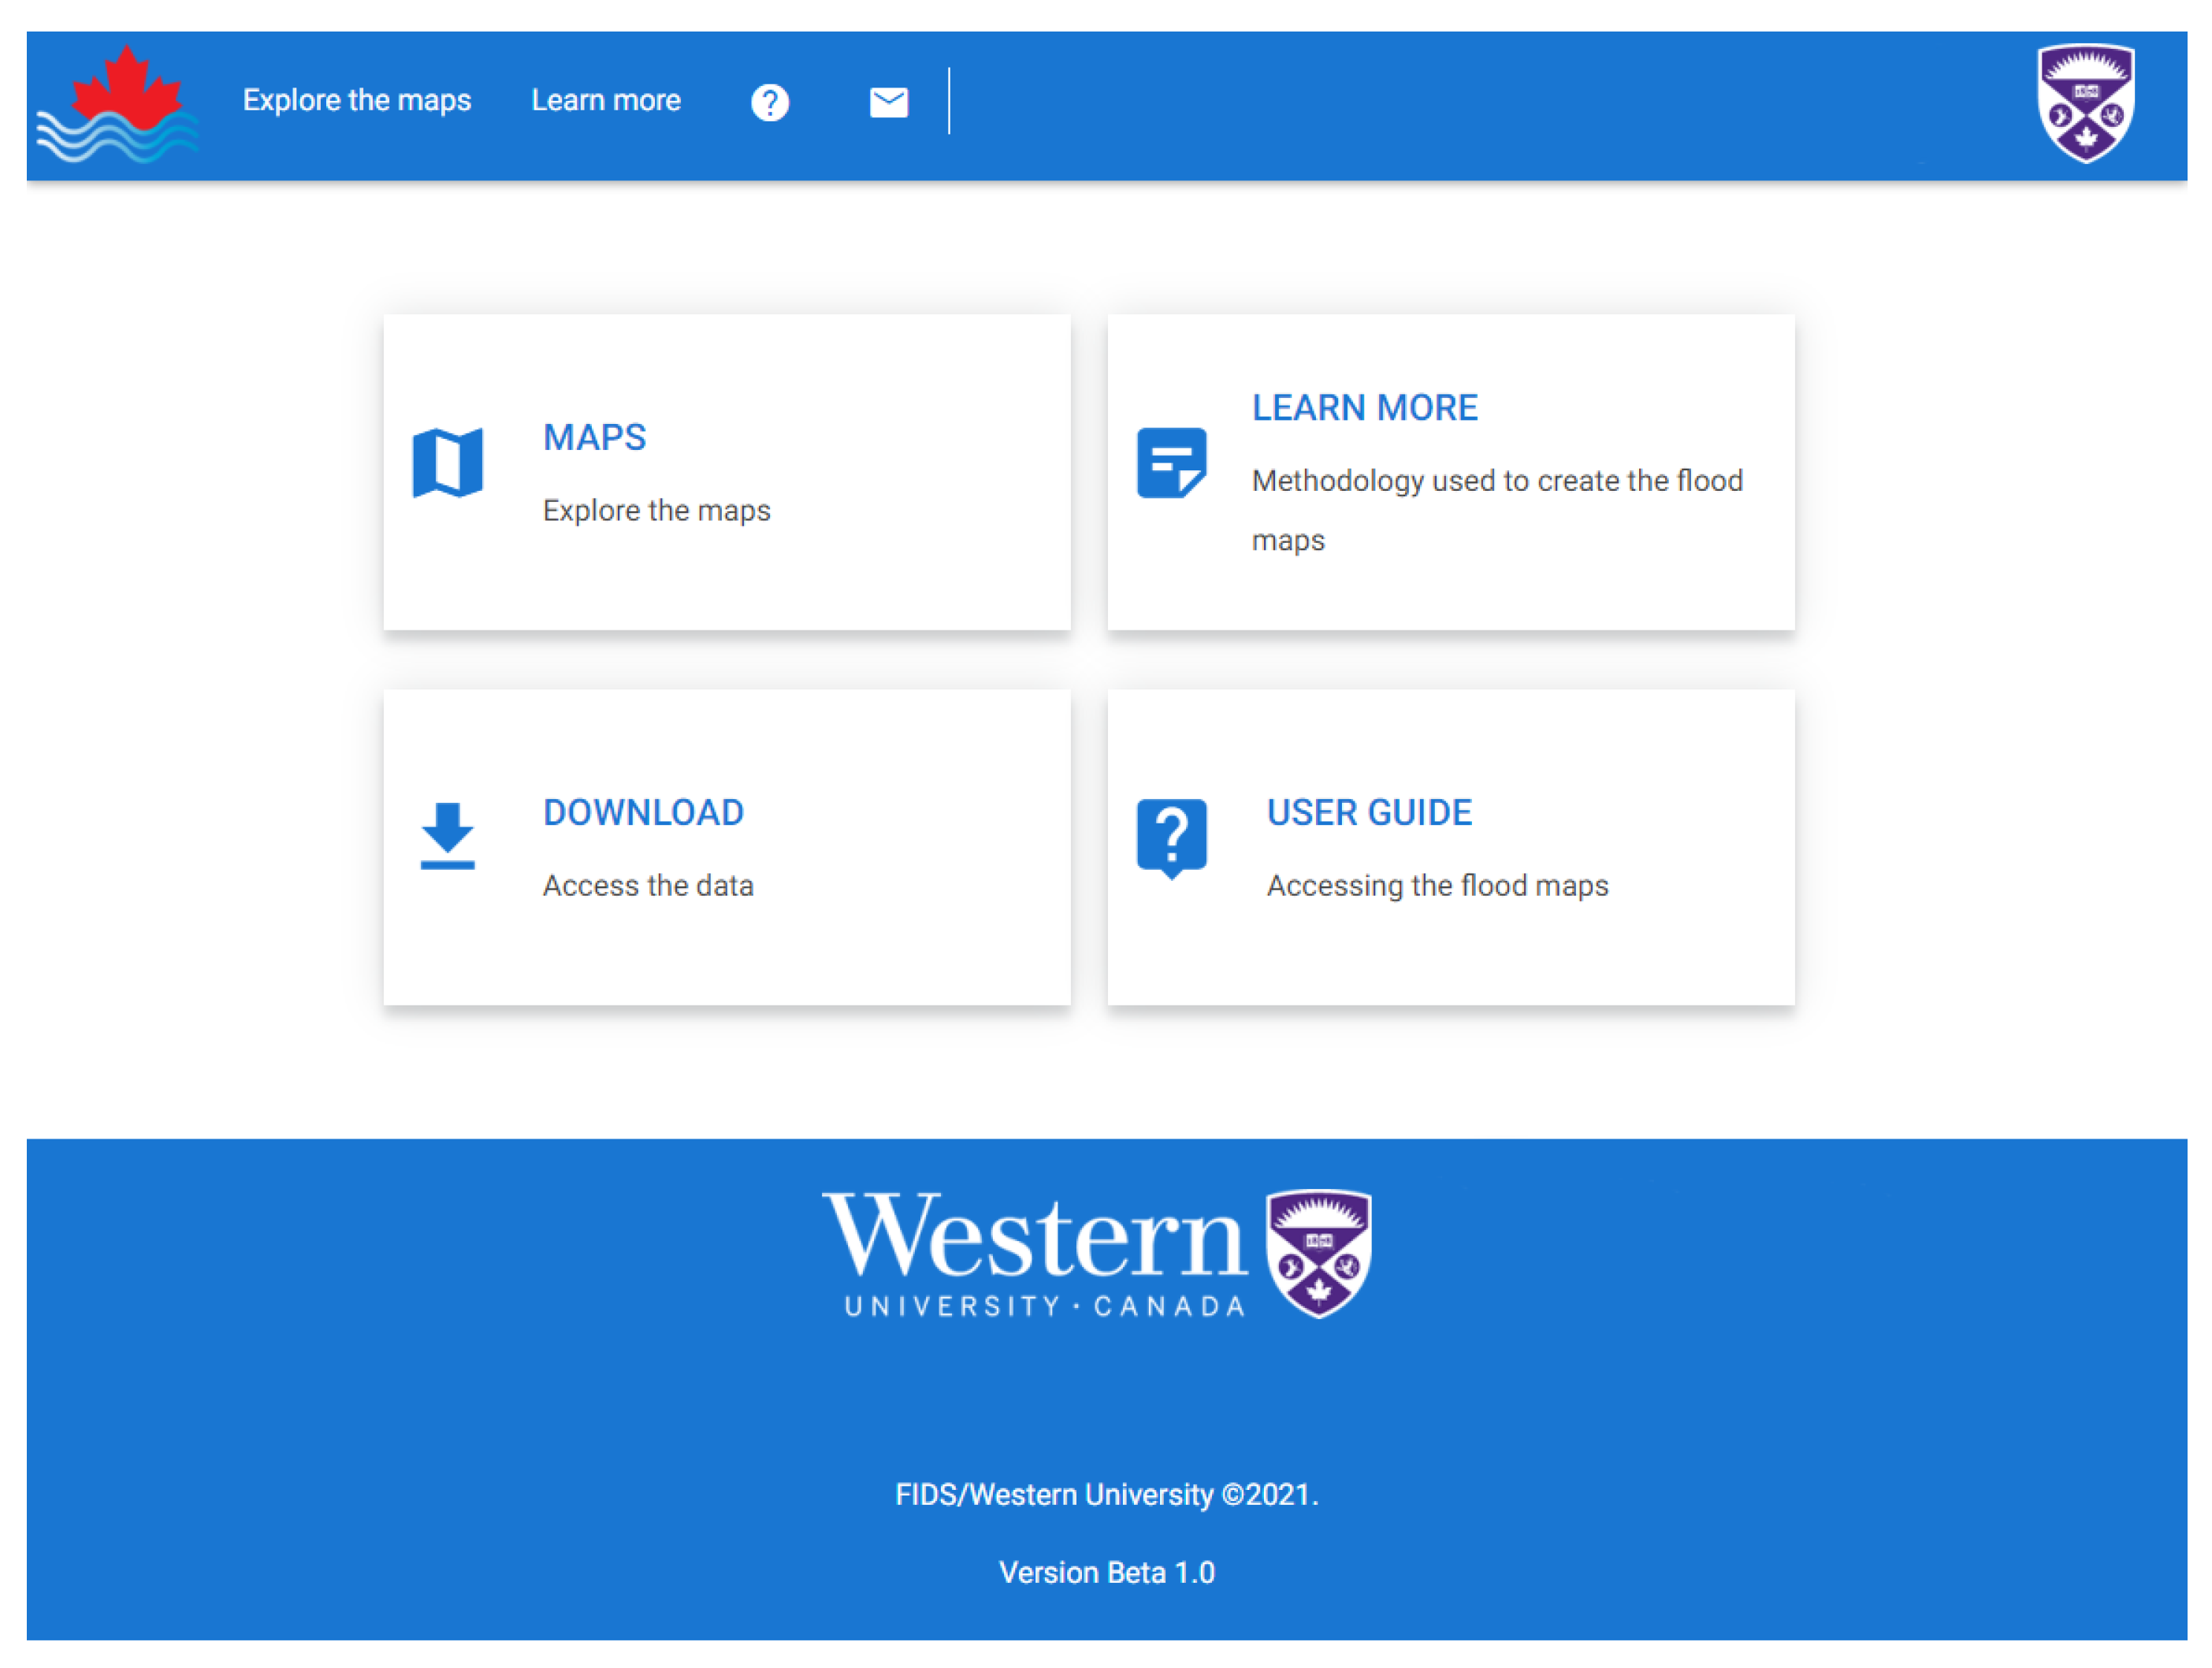
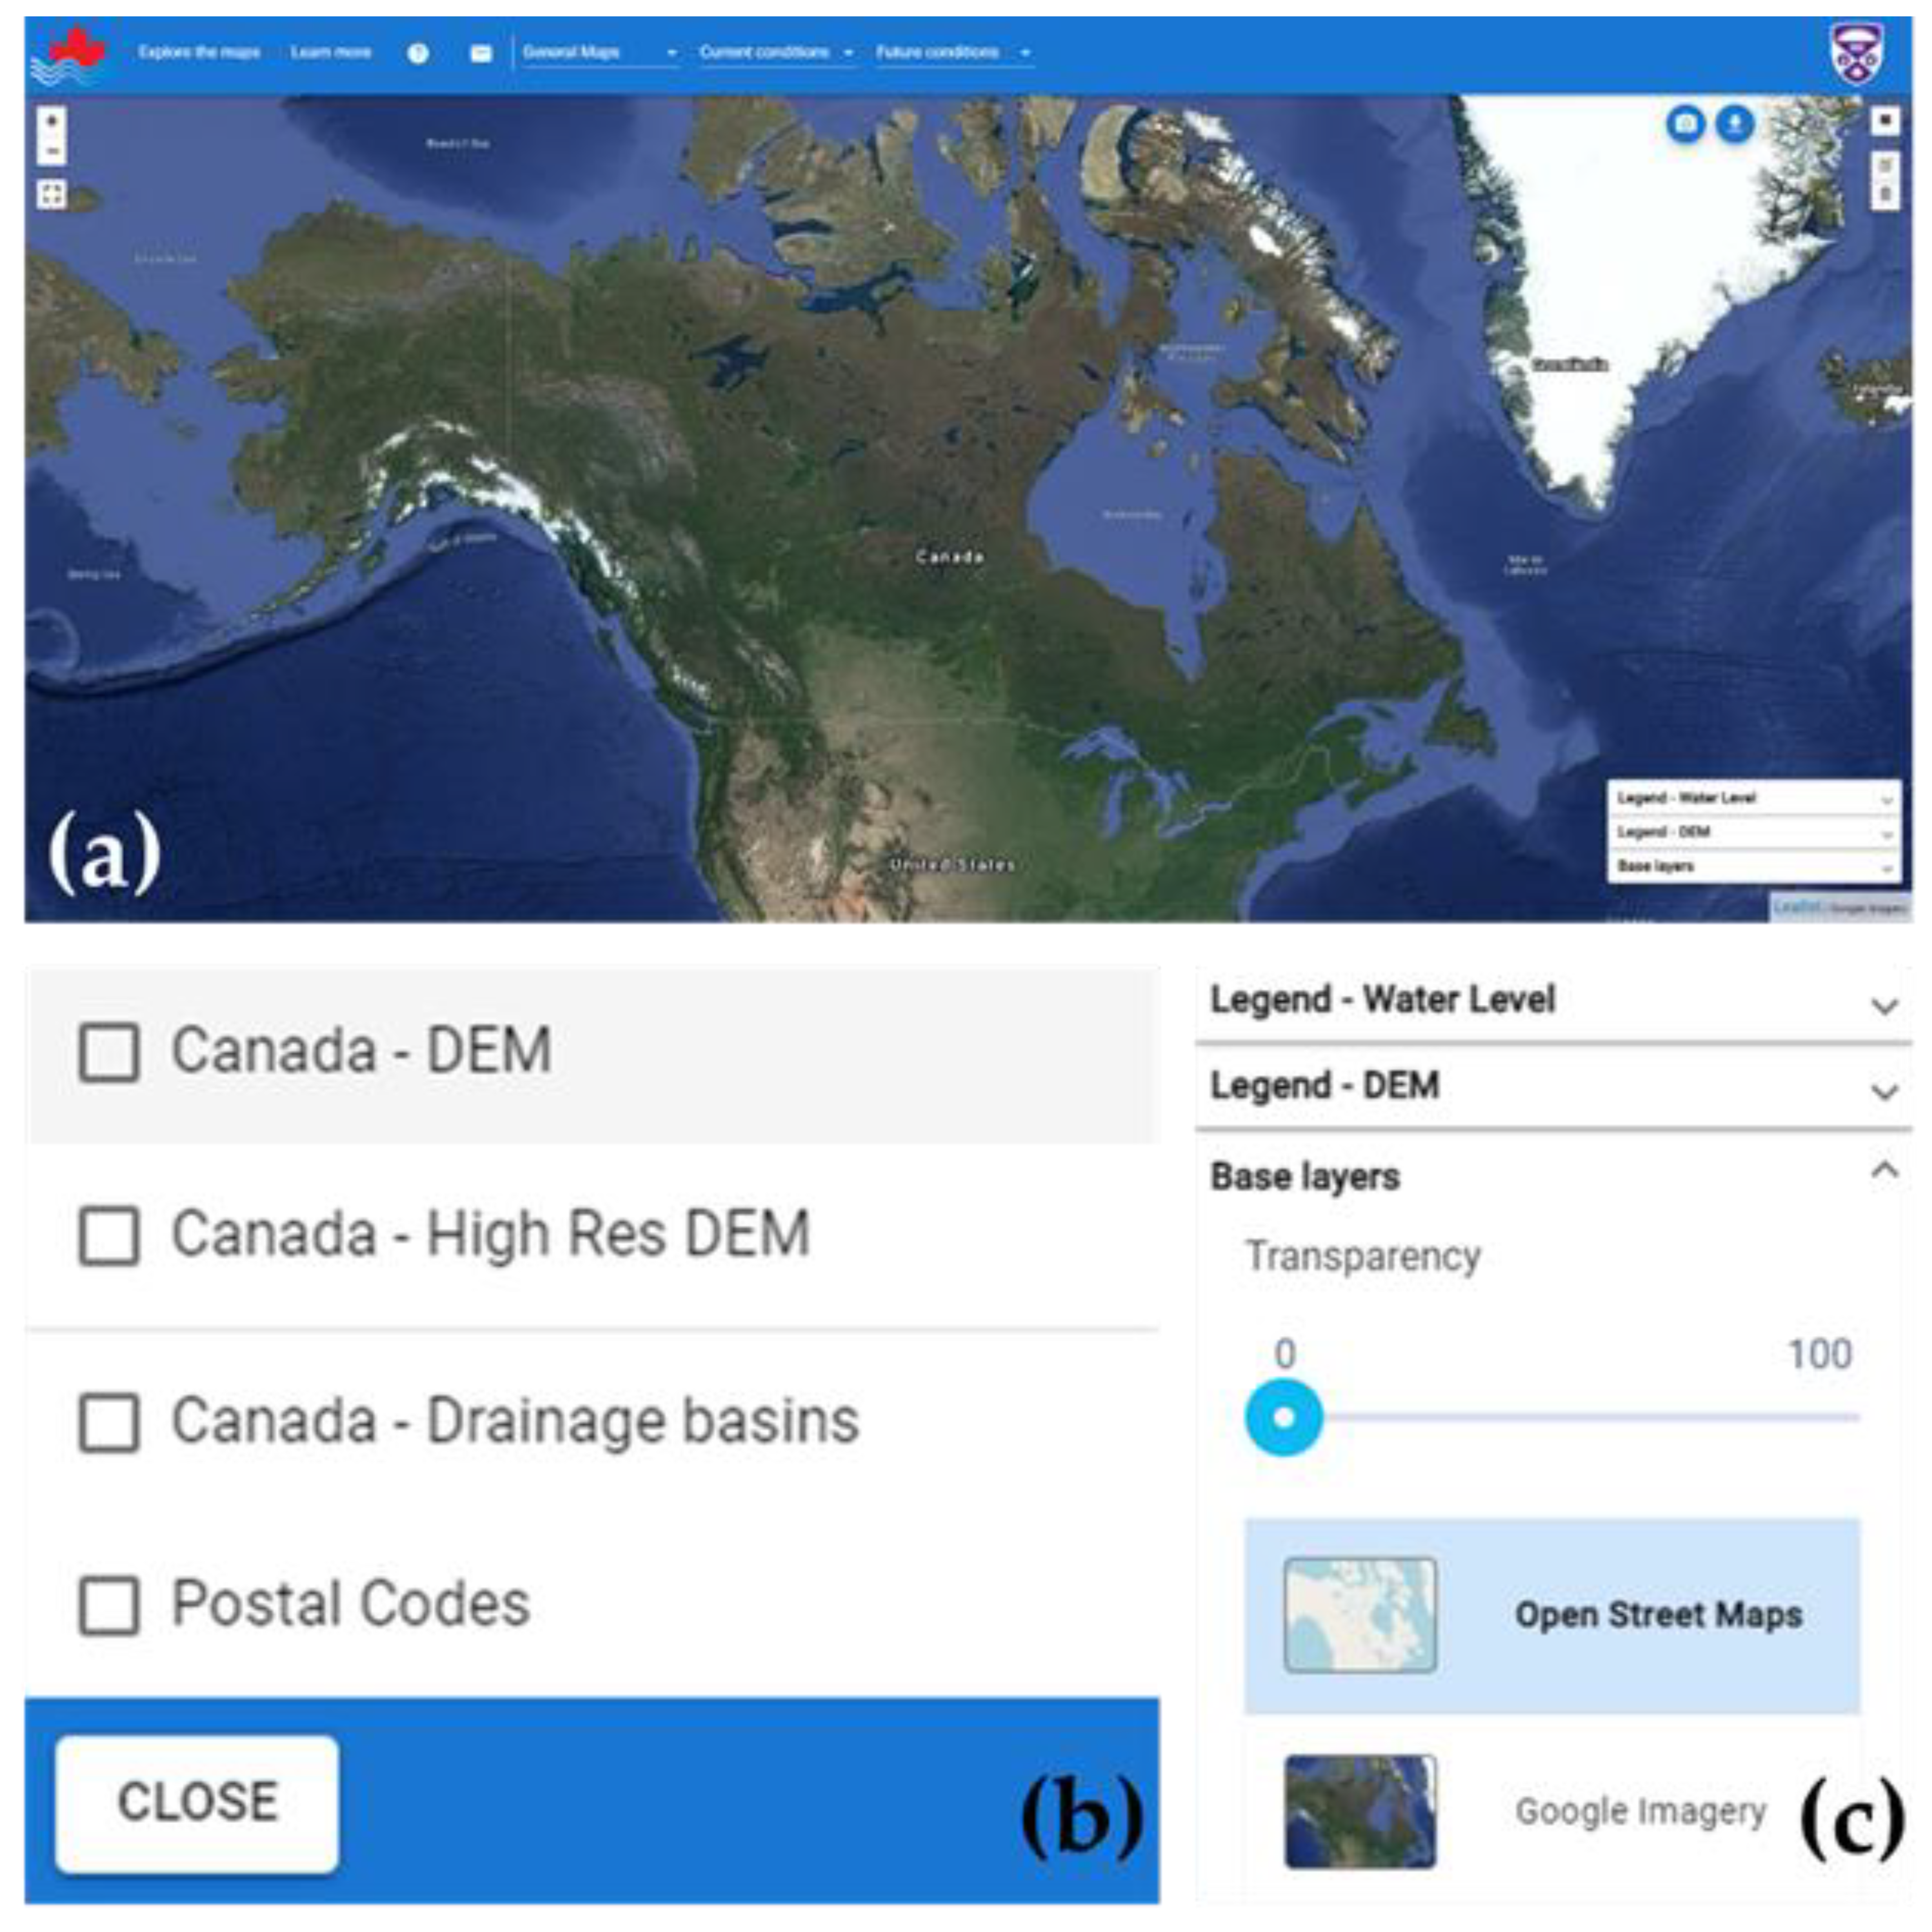
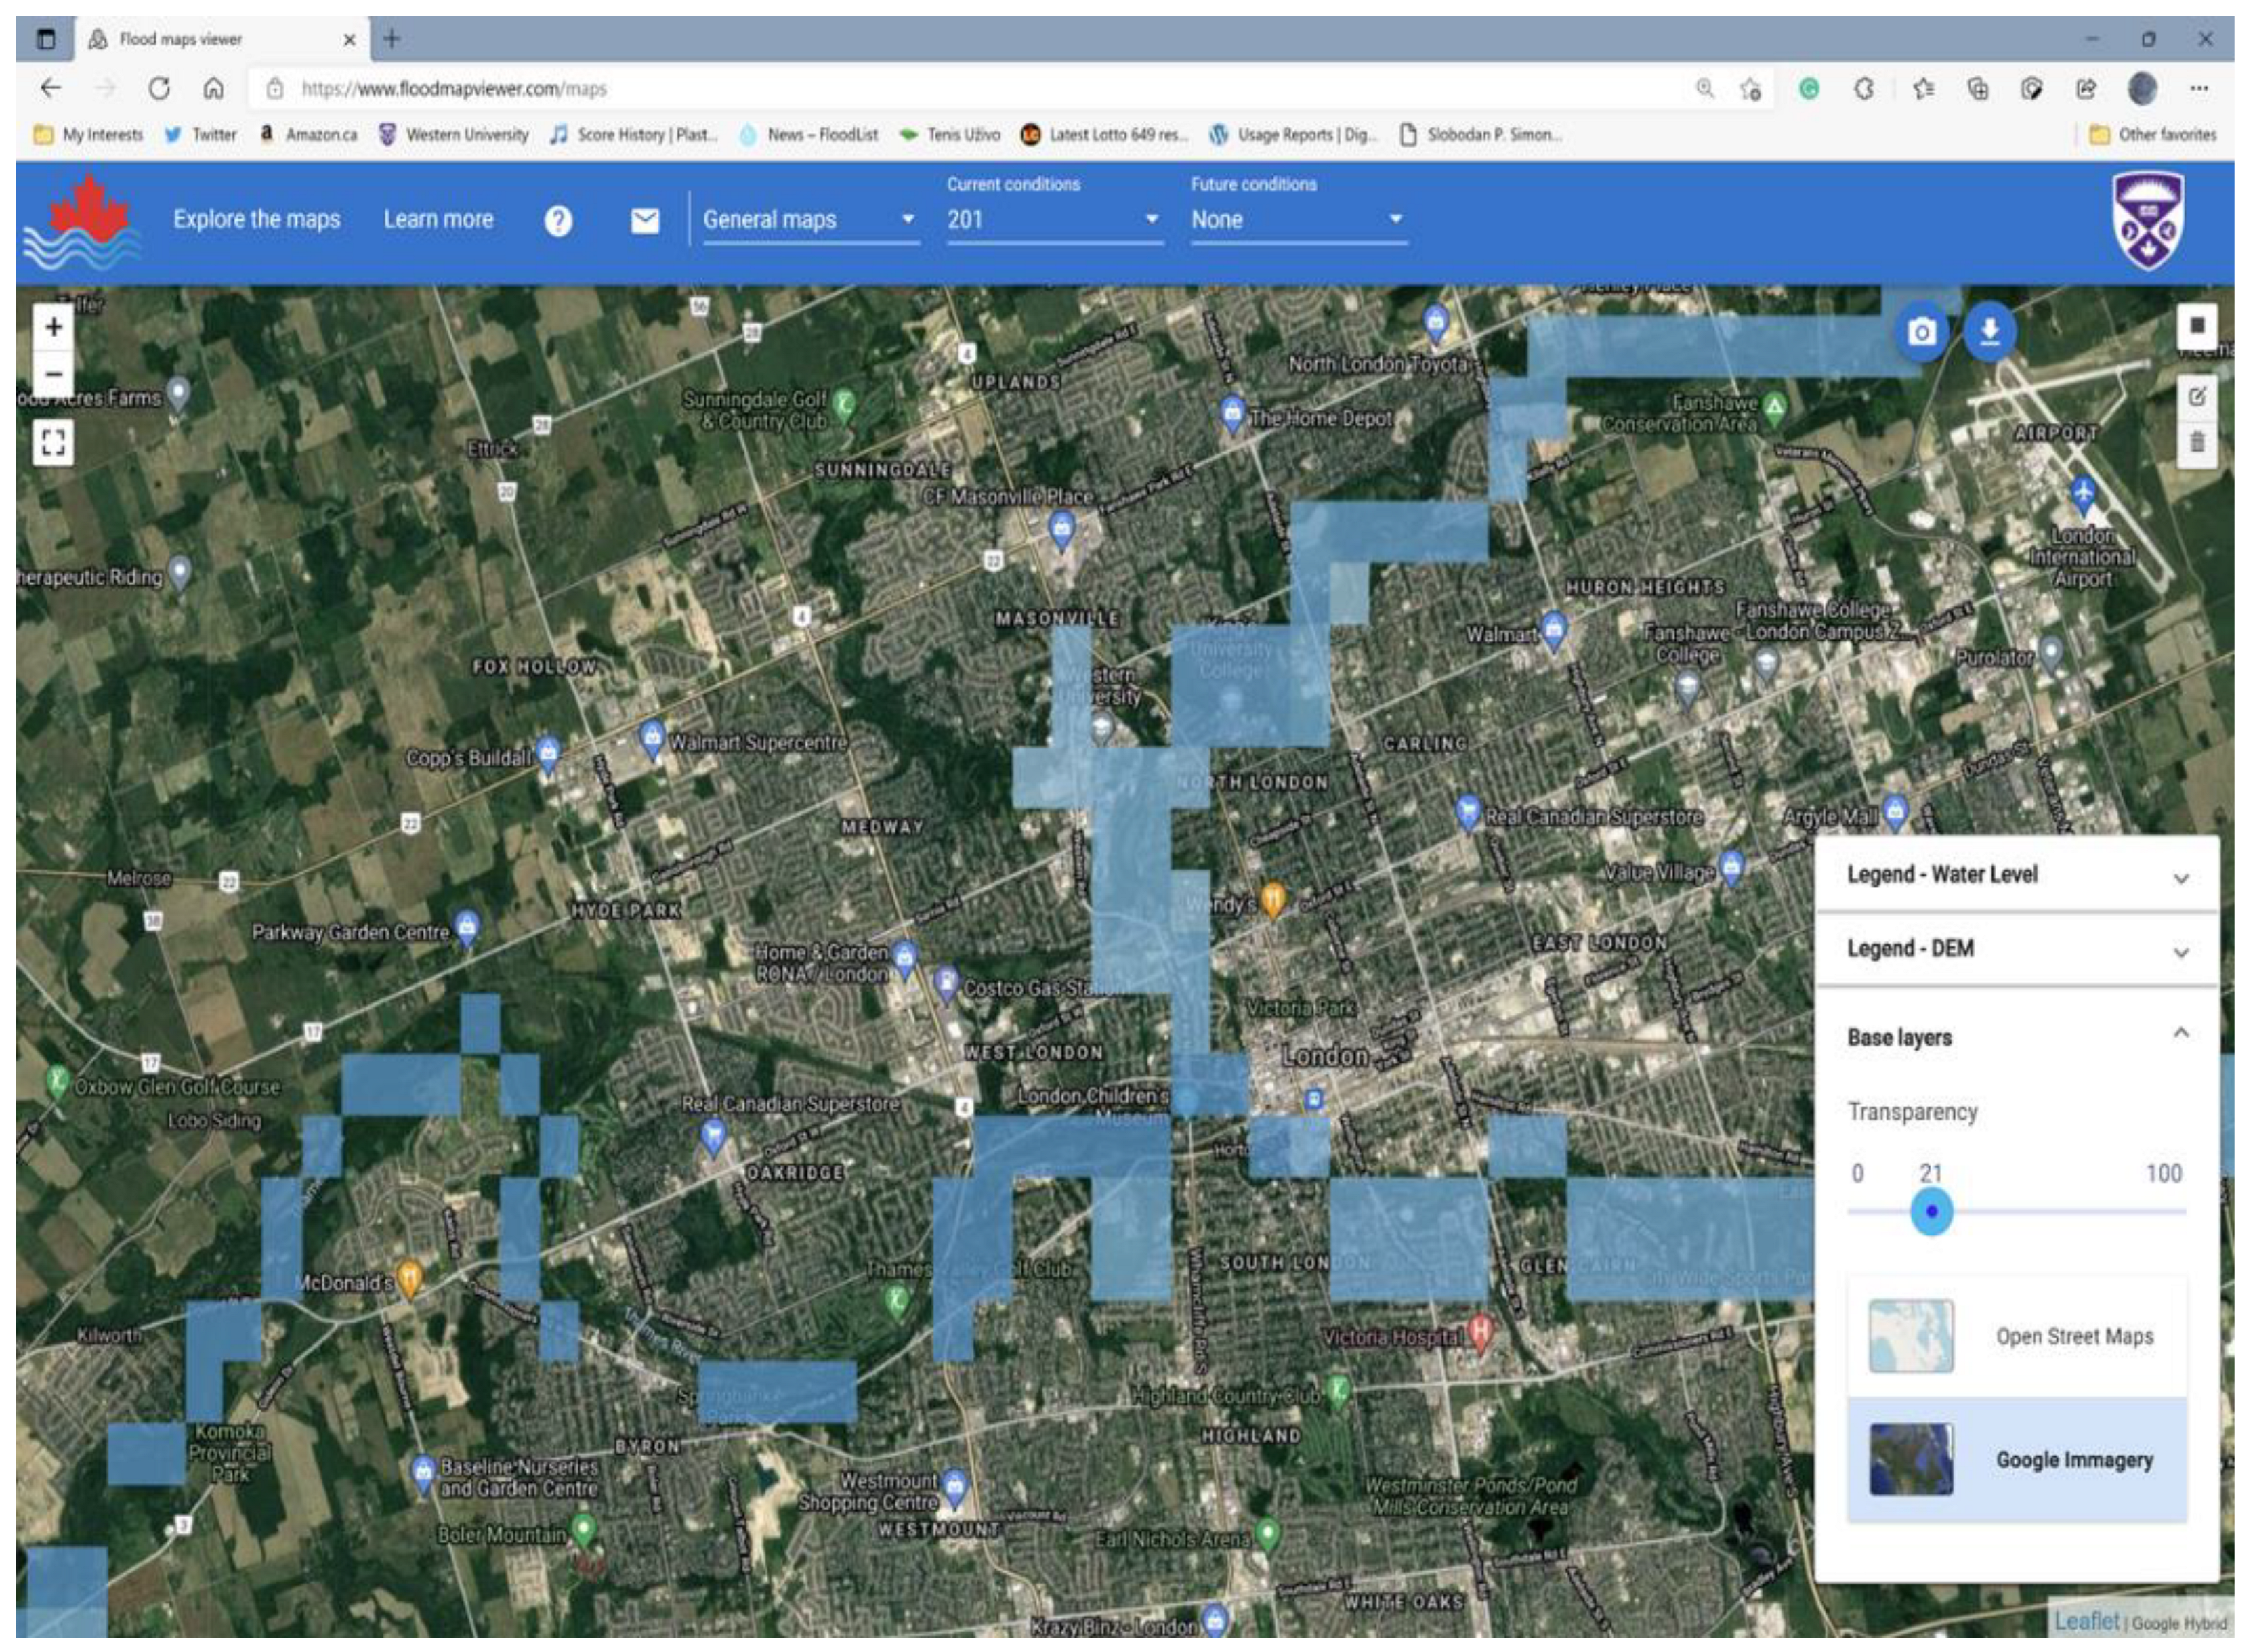
As highlighted in Section 2.6, Flood Map Viewer is a web-based tool developed to disseminate Canada-wide flood-related information. The tool aims to help raise awareness of the general public, professionals in the field and accountable agencies about the existing flood risk in Canada and its change under future climate conditions. The overlay of postal codes (available in the Flood Map Viewer) allows search for potential impacts up to the street and property level. Flood Map Viewer is efficient in terms of its spatial coverage, accessibility, ease of operation and visualization compared to similar web-based platforms, such as Albano et al. (2015) [53], Henriksen et al. (2018) [54], and Xu et al. 2020 [55]. Upon opening the website, the first page details various options, namely, Maps, Download, Learn More, and User Guide (Figure 5). The user can click on the ‘Maps’ option to explore the flood maps. At the top of this page, various possibilities for overlaying on the base map, such as Canada DEM, Drainage Basins and Postal Codes, are present (Figure 6a,b).
The second and third options provide details on the flood-related maps for the current and future conditions). Users have the flexibility to change the transparency and change the base map to an open-street map or Google Earth imagery as per their requirement (Figure 6c). The flood-related maps are available on the first page in the ‘Download’ option. After clicking on this option, a set of files ranging from flood maps to spatial boundaries are available for free download. The ‘Learn More’ option describes the entire methodology used for floodplain mapping. The last option, ‘User Guide’ provides a step-by-step guide for accessing the flood-related information on the website for any user. A representative flood plain map is illustrated in Figure 7.
4. Discussions
This study reports on using freely available public datasets for flood inundation and hazard modeling over large regions and further shows how it can be extended to exposure assessment. The study depicts an improvement in inundation modeling as far as the resolution of the flood maps is concerned. Previous studies such as Bernhofen et al. (2018) [11], Boulange et al. (2021) [12] and Winsemius et al. (2013) [18] simulated inundation statistics at a coarser resolution, which might not be adequate further for risk characterization, and precise flood management. It is customary to obtain inundation statistics comparatively at a lower resolution with global flood models than with regional or mesoscale flood models. The reason is that the hydrological, meteorological and spatial information required to run the global flood models are available at a coarser scale. Nevertheless, the primary goal is to identify flood hot spots over Canada that have been unaddressed. It would draw attention to detailed inundation modeling at the local/regional scale. At the same time, it also provides vital information on the severity of flood hazards over the inundated sites, which is paramount for multiple stakeholders, including the Federal Government, for quantifying flood risk and implementing structural and non-structural flood control measures for flood protection.
The maximum flood depth maps for 1991, 2001 and 2011 are later utilized to characterize the exposure of properties on a nationwide scale. Although many studies have described exposure to flooding at regional scales, the present study attempts to derive it at a country-wide scale over Canada that has witnessed a rise in population and flooding in tandem in recent times. A web-based information system–the Flood Map Viewer–is developed as the final outcome to ensure holistic flood management by disseminating flood-related data. The Flood Map Viewer indicates the inundated areas during 100-year and 200-year return period events. Users can utilize a suite of options to ease the visualization of flood maps. End-users can also download the flood-related information, thus removing the barrier to sharing information between the technical flood model experts and stakeholders.
5. Conclusions and Future Perspectives
With rising flood risk over several regions in the world, water experts are identifying the utility of floodplain mapping as a sustainable tool for long-term flood management and protection. Despite most studies focusing on small regions, the possibility of expanding floodplain mapping research to broader scales was not attempted until the last few years. This has been made possible with the ready availability of global datasets and state-of-the-art numerical models for replicating dynamics of flood wave propagation. The present study explores the usability of publicly available datasets in characterizing flood hazards over Canada, and its implications for property exposure. It also emphasizes the need to develop a web-based information system as an efficient medium of communicating flood-related information to various end-users. NARR and a few other relevant datasets are considered primary inputs to CaMa-Flood, an acclaimed global flood modeling software to generate 100-year and 200-year Canada-wide floodplain maps. The simulated maps are compared and validated with the existing ones over six different flood-prone regions, based on which they are utilized to quantify the degree of exposure of properties over the last three decades. The development of the Flood Map Viewer ensures various stakeholders can easily observe and use the high-resolution flood-related information for disaster mitigation, land-use planning and resilience development. Future studies may consider recent higher resolution DEM products such as ALOS-PALSAR to test the performance of CaMa-Flood model outputs. For a holistic identification of flood hazard spots over the coastal belt, future studies may couple the existing CaMa-Flood model set-up with an ocean circulation model such as the ADvanced CIRCulation model (ADCIRC). The flood hazard information derived from the coupled set-up can be used along with vulnerability and exposure components to estimate flood risk to communities and assets. Such exhaustive information on flood risk may be considered a precious cartographic product by the disaster management experts and city planners, which would further assist in selecting suitable flood control measures for upgraded environmental development and management.
Supplementary Materials
The following supporting information can be downloaded at: https://www.mdpi.com/article/10.3390/w14142280/s1, Figure S1: Comparison of simulated and benchmark floodplain maps derived for (a) 100 and (b) 200-yr return periods for Lower Fraser Basin. Figure S2: Comparison of simulated and benchmark floodplain maps derived for (a) 100 and (b) 200-yr return periods for Calgary Basin. Figure S3: Comparison of simulated and benchmark floodplain maps derived for (a) 100 and (b) 200-yr return periods for Assiniboine Basin. Figure S4: Comparison of simulated and benchmark floodplain maps derived for (a) 100 and (b) 200-yr return periods for Red River Basin. Figure S5: Comparison of simulated and benchmark floodplain maps derived for (a) 100 and (b) 200-yr return periods for Grand River Basin. Figure S6: Comparison of simulated and benchmark floodplain maps derived for (a) 100 and (b) 200-yr return periods for St. John Basin.
Author Contributions
M.P.M., conceptualization, methodology, software, data processing and original draft preparation; and S.P.S., supervision, methodology, results review, reviewing and editing the manuscript. All authors have read and agreed to the published version of the manuscript.
Funding
The authors are grateful to the Natural Sciences and Engineering Research Council of Canada (NSERC) (No. CRDPJ 472152-14) and the Institute for Catastrophic Loss Reduction (ICLR) for funding the research.
Institutional Review Board Statement
Not applicable.
Informed Consent Statement
Not applicable.
Data Availability Statement
The NARR runoff data is available for free download at https://psl.noaa.gov/, accessed on 23 January 2021. The CaMa-Flood model and its corresponding modules can be downloaded from http://hydro.iis.u-tokyo.ac.jp/~yamadai/cama-flood/, accessed on 20 January 2021. Other relevant river and topographic-related details are available on the same web address, and can be acquired from the developer upon reasonable request. The Canada-wide floodplain maps derived by utilizing NARR are available for visualization and free download at https://www.floodmapviewer.com/ accessed on 15 July 2022.
Acknowledgments
The authors thank Dai Yamazaki for providing CaMa-Flood version v4.01. The authors acknowledge SHARCNET (www.sharcnet.ca accessed on 15 July 2022) for delivering a high super-computing facility for extensive model simulations. The existing floodplain maps over the six basins were collected from the respective river basin organizations. The authors thank the Fraser Basin Council for providing 100-year and 200-year floodplain information over the Lower Fraser Basin. The authors acknowledge Stats Canada for providing details on the property-related information.
Conflicts of Interest
The authors declare no conflict of interest.
Glossary
| CaMA-Flood | Catchment-based Macro-scale Floodplain |
| D | Set of all flood depths |
| ɗn | Inundation depth for a particular grid |
| FLOW | The Flexible Location of Waterways technique |
| G3WBM | Global Water Body Map |
| GEV | Generalized Extreme Value |
| GWD-LR | Global River Width |
| Ȟ | Flood Hazard |
| MERIT DEM | Multi-Error-Removed Improved-Terrain DEM |
| NARR | North American Regional Reanalysis |
| OSM | Open Street Map |
| p | Total number of grid cells in the flood model domain |
References
- Winsemius, H.C.; Aerts, J.C.J.H.; Van Beek, L.P.H.; Bierkens, M.F.P.; Bouwman, A.; Jong-man, B.; Kwadijk, J.C.J.; Ligtvoet, W.; Lucas, P.L.; van Vuuren, D.P.; et al. Global drivers of future river flood risk. Nat. Clim. Chang. 2016, 6, 381–385. [Google Scholar] [CrossRef]
- Kinoshita, Y.; Tanoue, M.; Watanabe, S.; Hirabayashi, Y. Quantifying the effect of autonomous adaptation to global river flood projections: Application to future flood risk assessments. Environ. Res. Lett. 2018, 13, 014006. [Google Scholar] [CrossRef] [Green Version]
- Menéndez, P.; Losada, I.J.; Torres-Ortega, S.; Narayan, S.; Beck, M.W. The global flood protection benefits of mangroves. Sci. Rep. 2020, 10, 4404. [Google Scholar] [CrossRef]
- Munich, Re. NatCatSERVICE Database. Munich RE, Munich. 2018. Available online: https://www.munichre.com/en/solutions/for-industry-clients/natcatservice.html (accessed on 25 March 2022).
- UNISDR—The United Nations Office for Disaster Risk Reduction: The Human Cost of Weather-Related Disasters 1995–2015. 2015. Available online: https://www.unisdr.org/files/46796_cop21weatherdisastersreport2015.pdf (accessed on 22 March 2022).
- Willner, S.N.; Otto, C.; Levermann, A. Global economic response to river floods. Nat. Clim. Chang. 2018, 8, 594–598. [Google Scholar] [CrossRef]
- Wing, O.E.; Bates, P.D.; Smith, A.M.; Sampson, C.C.; Johnson, K.A.; Fargione, J.; Morefield, P. Estimates of present and future flood risk in the conterminous United States. Environ. Res. Lett. 2018, 13, 034023. [Google Scholar] [CrossRef]
- Vousdoukas, M.I.; Mentaschi, L.; Voukouvalas, E.; Bianchi, A.; Dottori, F.; Feyen, L. Climatic and socio-economic controls of future coastal flood risk in Europe. Nat. Clim. Chang. 2018, 8, 776–780. [Google Scholar] [CrossRef]
- Smith, A.; Bates, P.D.; Wing, O.; Sampson, C.; Quinn, N.; Neal, J. New estimates of flood exposure in developing countries using high-resolution population data. Nat. Commun. 2019, 10, 1814. [Google Scholar] [CrossRef] [Green Version]
- Dottori, F.; Szewczyk, W.; Ciscar, J.-C.; Zhao, F.; Alfieri, L.; Hirabayashi, Y.; Bianchi, A.; Mongelli, I.; Frieler, K.; Betts, R.A.; et al. Increased human and economic losses from river flooding with anthropogenic warming. Nat. Clim. Chang. 2018, 8, 781–786. [Google Scholar] [CrossRef]
- Bernhofen, M.V.; Whyman, C.; Trigg, M.A.; Sleigh, P.A.; Smith, A.M.; Sampson, C.C.; Yamazaki, D.; Ward, P.J.; Rudari, R.; Pappenberger, F.; et al. A first collective validation of global fluvial flood models for major floods in Nigeria and Mozambique. Environ. Res. Lett. 2018, 13, 104007. [Google Scholar] [CrossRef] [Green Version]
- Boulange, J.; Hanasaki, N.; Yamazaki, D.; Pokhrel, Y. Role of dams in reducing global flood exposure under climate change. Nat. Commun. 2021, 12, 417. [Google Scholar] [CrossRef]
- Alfieri, L.; Bisselink, B.; Dottori, F.; Naumann, G.; de Roo, A.; Salamon, P.; Wyser, K.; Feyen, L. Global projections of river flood risk in a warmer world. Earth’s Future 2017, 5, 171–182. [Google Scholar] [CrossRef]
- Mohanty, M.P.; Vittal, H.; Yadav, V.; Ghosh, S.; Rao, G.S.; Karmakar, S. A new bivariate risk classifier for flood management considering hazard and socio-economic dimensions. J. Environ. Manag. 2020, 255, 109733. [Google Scholar] [CrossRef] [PubMed]
- Gaur, A.; Gaur, A.; Simonovic, S.P. Future Changes in Flood Hazards across Canada under a Changing Climate. Water 2018, 10, 1441. [Google Scholar] [CrossRef] [Green Version]
- Gaur, A.; Gaur, A.; Yamazaki, D.; Simonovic, S.P. Flooding related consequences of climate change on Canadian cities and flow regulation infrastructure. Water 2019, 11, 63. [Google Scholar] [CrossRef] [Green Version]
- Lim, W.H.; Yamazaki, D.; Koirala, S.; Hirabayashi, Y.; Kanae, S.; Dadson, S.J.; Hall, W.H.; Sun, F. Long-term changes in global socio-economic benefits of flood defenses and residual risk based on CMIP5 climate models. Earth’s Future 2018, 6, 938–954. [Google Scholar] [CrossRef]
- Winsemius, H.C.; Van Beek, L.P.H.; Jongman, B.; Ward, P.J.; Bouwman, A. A framework for global river flood risk assessments. Hydrol. Earth Syst. Sci. 2013, 17, 1871–1892. [Google Scholar] [CrossRef] [Green Version]
- Ward, P.J.; Jongman, B.; Weiland, F.S.; Bouwman, A.; Van Beek, R.; Bierkens, M.F.P.; Ligtvoet, W.; Winsemius, H.C. Assessing flood risk at the global scale: Model set-up, results, and sensitivity. Environ. Res. Lett. 2013, 8, 044019. [Google Scholar] [CrossRef]
- Yamazaki, D.; Ikeshima, D.; Tawatari, R.; Yamaguchi, T.; O’Loughlin, F.; Neal, J.C.; Sampson, C.C.; Kanae, S.; Bates, P.D. A high-accuracy map of global terrain elevations. Geophys. Res. Lett. 2017, 44, 5844–5853. [Google Scholar] [CrossRef] [Green Version]
- Tarek, M.; Brissette, F.P.; Arsenault, R. Evaluation of the ERA5 reanalysis as a potential reference dataset for hydrological modelling over North America. Hydrol. Earth Syst. Sci. 2020, 24, 2527–2544. [Google Scholar] [CrossRef]
- Wang, N.; Liu, W.; Sun, F.; Yao, Z.; Wang, H.; Liu, W. Evaluating satellite-based and reanalysis precipitation datasets with gauge-observed data and hydrological modeling in the Xihe River Basin, China. Atmos. Res. 2020, 234, 104746. [Google Scholar] [CrossRef]
- Bermúdez, M.; Cea, L.; Van Uytven, E.; Willems, P.; Farfán, J.F.; Puertas, J. A robust method to update local river inundation maps using global climate model output and weather typing based statistical downscaling. Water Resour. Manag. 2020, 34, 4345–4362. [Google Scholar] [CrossRef]
- Toosi, A.S.; Doulabian, S.; Tousi, E.G.; Calbimonte, G.H.; Alaghmand, S. Large-scale flood hazard assessment under climate change: A case study. Ecol. Eng. 2020, 147, 105765. [Google Scholar] [CrossRef]
- Hunter, J.R.; Woodworth, P.L.; Wahl, T.; Nicholls, R.J. Using global tide gauge data to validate and improve the representation of extreme sea levels in flood impact studies. Glob. Planet. Chang. 2017, 156, 34–45. [Google Scholar] [CrossRef] [Green Version]
- Compo, G.P.; Whitaker, J.S.; Sardeshmukh, P.D.; Matsui, N.; Allan, R.J.; Yin, X.; Gleason, B.E.; Vose, R.S.; Rutledge, G.; Bessemoulin, P.; et al. The twentieth century reanalysis project. Q. J. R. Meteorol. Soc. 2011, 137, 1–28. [Google Scholar] [CrossRef]
- Gründemann, G.J.; Werner, M.; Veldkamp, T.I. The potential of global reanalysis datasets in identifying flood events in Southern Africa. Hydrol. Earth Syst. Sci. 2018, 22, 4667–4683. [Google Scholar] [CrossRef] [Green Version]
- Senatore, A.; Davolio, S.; Furnari, L.; Mendicino, G. Reconstructing flood events in Mediterranean coastal areas using different reanalyses and high-resolution meteorological models. J. Hydrometeorol. 2020, 21, 1865–1887. [Google Scholar] [CrossRef]
- NRCan (2018) Natural Resources Canada. Federal Floodplain Mapping Framework. Available online: https://geoscan.nrcan.gc.ca/starweb/geoscan/servlet.starweb?path=geoscan/fulle.web&search1=R=308128 (accessed on 7 June 2022).
- Public Safety Canada (2017) Floods. Available online: https://www.publicsafety.gc.ca/cnt/mrgnc-mngmnt/ntrlhzrds/fld-en.aspx> (accessed on 10 March 2022).
- Zadeh, S.M.; Burn, D.H.; O’Brien, N. Detection of trends in flood magnitude and frequency in Canada. J. Hydrol. Reg. Stud. 2020, 28, 100673. [Google Scholar] [CrossRef]
- Parliamentary Budget Officer of Canada. Estimate of the Average Annual Cost for Disaster Financial Assistance Arrangements Due to Weather Events. 2016. Available online: https://www.pbo-dpb.gc.ca/web/default/files/Documents/Reports/2016/DFAA/DFAA_EN.pdf (accessed on 3 June 2022).
- Mesinger, F.; DiMego, G.; Kalnay, E.; Mitchell, K.; Shafran, P.C.; Ebisuzaki, W.; Jovic, D.; Woollen, J.; Rogers, E.; Berbery, E.H.; et al. North American regional reanalysis. Bull. Am. Meteorol. Soc. 2006, 87, 343–360. [Google Scholar] [CrossRef] [Green Version]
- Ashtine, M.; Bello, R.; Higuchi, K. Assessment of wind energy potential over Ontario and Great Lakes using the NARR data: 1980–2012. Renew. Sustain. Energy Rev. 2016, 56, 272–282. [Google Scholar] [CrossRef]
- Mohanty, M.P.; Simonovic, S.P. Changes in floodplain regimes over Canada due to climate change impacts: Observations from CMIP6 models. Sci. Total Environ. 2021, 792, 148323. [Google Scholar] [CrossRef]
- Bates, P.D.; Horritt, M.S.; Fewtrell, T.J. A simple inertial formulation of the shallow water equations for efficient two-dimensional flood inundation modelling. J. Hydrol. 2010, 387, 33–45. [Google Scholar] [CrossRef]
- Yamazaki, D.; Oki, T.; Kanae, S. Deriving a global river network map and its subgrid topographic characteristics from a fine-resolution flow direction map. Hydrol. Earth Syst. Sci. 2009, 13, 2241. [Google Scholar] [CrossRef] [Green Version]
- Yamazaki, D.; O’Loughlin, F.; Trigg, M.A.; Miller, Z.F.; Pavelsky, T.M.; Bates, P.D. Development of the global width database for large rivers. Water Resour. Res. 2014, 50, 3467–3480. [Google Scholar] [CrossRef]
- Yamazaki, D.; Trigg, M.A.; Ikeshima, D. Development of a global ~90 m water body map using multi-temporal Landsat images. Remote Sens. Environ. 2015, 171, 337–351. [Google Scholar] [CrossRef]
- Yamazaki, D.; Ikeshima, D.; Sosa, J.; Bates, P.D.; Allen, G.H.; Pavelsky, T.M. MERIT Hydro: A high-resolution global hydrography map based on latest topography dataset. Water Resour. Res. 2019, 55, 5053–5073. [Google Scholar] [CrossRef] [Green Version]
- Kim, S.J.; Lee, M.; Choi, W.; Rasmussen, P.F. Utilizing North American Regional Reanalysis for climate change impact assessment on water resources in central Canada. In Proceedings of the 13th World Water Congress, Montpellier, France, 1–4 September 2008. [Google Scholar]
- Essou, G.R.; Sabarly, F.; Lucas-Picher, P.; Brissette, F.; Poulin, A. Can precipitation and temperature from meteorological reanalyses be used for hydrological modeling? J. Hydrometeorol. 2016, 17, 1929–1950. [Google Scholar] [CrossRef]
- Sampson, C.C.; Smith, A.M.; Bates, P.D.; Neal, J.C.; Alfieri, L.; Freer, J.E. A high-resolution global flood hazard model. Water Resour. Res. 2015, 51, 7358–7381. [Google Scholar] [CrossRef] [Green Version]
- Hawker, L.; Rougier, J.; Neal, J.; Bates, P.; Archer, L.; Yamazaki, D. Implications of simulating global digital elevation models for flood inundation studies. Water Resour. Res. 2018, 54, 7910–7928. [Google Scholar] [CrossRef] [Green Version]
- Liu, Y.; Bates, P.D.; Neal, J.C.; Yamazaki, D. Bare-Earth DEM Generation in Urban Areas for Flood Inundation Simulation Using Global Digital Elevation Models. Water Resour. Res. 2021, 57, e2020WR028516. [Google Scholar] [CrossRef]
- Hao, C.; Yunus, A.P.; Subramanian, S.S.; Avtar, R. Basin-wide flood depth and exposure mapping from SAR images and machine learning models. J. Environ. Manag. 2021, 297, 113367. [Google Scholar] [CrossRef]
- Kirezci, E.; Young, I.R.; Ranasinghe, R.; Muis, S.; Nicholls, R.J.; Lincke, D.; Hinkel, J. Projections of global-scale extreme sea levels and resulting episodic coastal flooding over the 21st century. Sci. Rep. 2020, 10, 11629. [Google Scholar] [CrossRef] [PubMed]
- Blais, E.-L.; Greshuk, J.; Stadnyk, T. The 2011 flood event in the Assiniboine River Basin: Causes, assessment and damages. Can. Water Resour. J. Rev. Can. Des Ressour. Hydr. 2016, 41, 74–84. [Google Scholar] [CrossRef]
- Tavares da Costa, R.; Mazzoli, P.; Bagli, S. Limitations posed by Free DEMs in watershed studies: The case of river Tanaro in Italy. Front. Earth Sci. 2019, 7, 141. [Google Scholar] [CrossRef] [Green Version]
- Rannie, W. The 1997 flood event in the Red River basin: Causes, assessment and damages. Can. Water Resour. J. Rev. Can. Des Ressour. Hydr. 2016, 41, 45–55. [Google Scholar] [CrossRef]
- Simonovic, S.P. Decision support system for flood management in the Red River Basin. Can. Water Resour. J. 1999, 24, 203–223. [Google Scholar] [CrossRef] [Green Version]
- Chakraborty, L.; Thistlethwaite, J.; Minano, A.; Henstra, D.; Scott, D. Leveraging Hazard, Exposure, and Social Vulnerability Data to Assess Flood Risk to Indigenous Communities in Canada. Int. J. Disaster Risk Sci. 2021, 12, 821–838. [Google Scholar] [CrossRef]
- Albano, R.; Sole, A.; Adamowski, J. READY: A web-based geographical information system for enhanced flood resilience through raising awareness in citizens. Nat. Hazards Earth Syst. Sci. 2015, 15, 1645–1658. [Google Scholar] [CrossRef] [Green Version]
- Xu, H.; Windsor, M.; Muste, M.; Demir, I. A web-based decision support system for collaborative mitigation of multiple water-related hazards using serious gaming. J. Environ. Manag. 2020, 255, 109887. [Google Scholar] [CrossRef]
- Henriksen, H.J.; Roberts, M.J.; van der Keur, P.; Harjanne, A.; Egilson, D.; Alfonso, L. Participatory early warning and monitoring systems: A Nordic framework for web-based flood risk management. Int. J. Disaster Risk Reduct. 2018, 31, 1295–1306. [Google Scholar] [CrossRef]
Figure 1.
A proposed framework of floodplain mapping.

Figure 2.
(a) 100-year and (b) 200-year floodplain maps derived by utilizing NARR. The inset pie-chart provides details on the percentage of area exposed to a particular degree of flood hazard.
Figure 2.
(a) 100-year and (b) 200-year floodplain maps derived by utilizing NARR. The inset pie-chart provides details on the percentage of area exposed to a particular degree of flood hazard.

Figure 3.
Comparison and validation of generated floodplain maps (both for 100 years and 200 years) against existing ones over six flood-prone regions of Canada, namely (a) Lower Fraser Basin, (b) Calgary Basin, (c) Assiniboine Basin, (d) Red River Basin, (e) Grand River Basin, and (f) St. John Basin. The enlarged version of the sub-maps is provided in the Supplementary Document (Figures S1–S6).

Figure 4.
Number of properties exposed to flooding in (a) 1991, (b) 2001 and (c) 2011.

Figure 5.
A screenshot of the first page of Flood Map Viewer.

Figure 6.
A screenshot of the “Maps” option in Flood Map Viewer. (a) depicts the main page showing the entire map of Canada, (b) represents the various options available for overlaying the DEM, drainage basins and postal codes over the floodplain maps, and (c) depicts the various options for enhancing visualization of the floodplain maps.

Figure 7.
A representative illustration of the Flood Map Viewer (https://www.floodmapviewer.com/, accessed on 30 June 2021).
Figure 7.
A representative illustration of the Flood Map Viewer (https://www.floodmapviewer.com/, accessed on 30 June 2021).


Table 1.
A list of widely used global flood models.
| Name of the Model | Source |
|---|---|
| CaMa-Flood; Catchment-Based Macro-scale Floodplain model | http://hydro.iis.u-tokyo.ac.jp/~yamadai/cama-flood/, accessed on 22 March 2021 |
| CIMA-UNEP; Centro Internazionale in Monitoraggio Ambientale and United Nations Environment Program model | https://www.preventionweb.net/organizations/8635, accessed on 10 April 2021 |
| GLOFRIS; Global Flood Risk (model | https://www.globalfloods.eu/, accessed on 15 August 2021 |
| JRC; Joint Research Centre model | https://ec.europa.eu/knowledge4policy/organisation/jrc-joint-research-centre_en, accessed on 16 September 2021 |
| Fathom Global model | https://www.fathom.global/, accessed on 18 April 2021 |
| LIS-FLOOD | http://www.bristol.ac.uk/geography/research/hydrology/models/lisflood/, accessed on 6 May 2021 |
Publisher’s Note: MDPI stays neutral with regard to jurisdictional claims in published maps and institutional affiliations. |
© 2022 by the authors. Licensee MDPI, Basel, Switzerland. This article is an open access article distributed under the terms and conditions of the Creative Commons Attribution (CC BY) license (https://creativecommons.org/licenses/by/4.0/).
Share and Cite
MDPI and ACS Style
Mohanty, M.P.; Simonovic, S.P. A Comprehensive Approach for Floodplain Mapping through Identification of Hazard Using Publicly Available Data Sets over Canada. Water 2022, 14, 2280. https://doi.org/10.3390/w14142280
AMA Style
Mohanty MP, Simonovic SP. A Comprehensive Approach for Floodplain Mapping through Identification of Hazard Using Publicly Available Data Sets over Canada. Water. 2022; 14(14):2280. https://doi.org/10.3390/w14142280
Chicago/Turabian StyleMohanty, Mohit Prakash, and Slobodan P. Simonovic. 2022. "A Comprehensive Approach for Floodplain Mapping through Identification of Hazard Using Publicly Available Data Sets over Canada" Water 14, no. 14: 2280. https://doi.org/10.3390/w14142280
Note that from the first issue of 2016, this journal uses article numbers instead of page numbers. See further details here.