
Nitrate Contamination in Groundwater: Evaluating the Effects of Demographic Aging and Depopulation in an Island with Intensive Citrus Cultivation

 , ,
, ,
Abstract
:1. Introduction
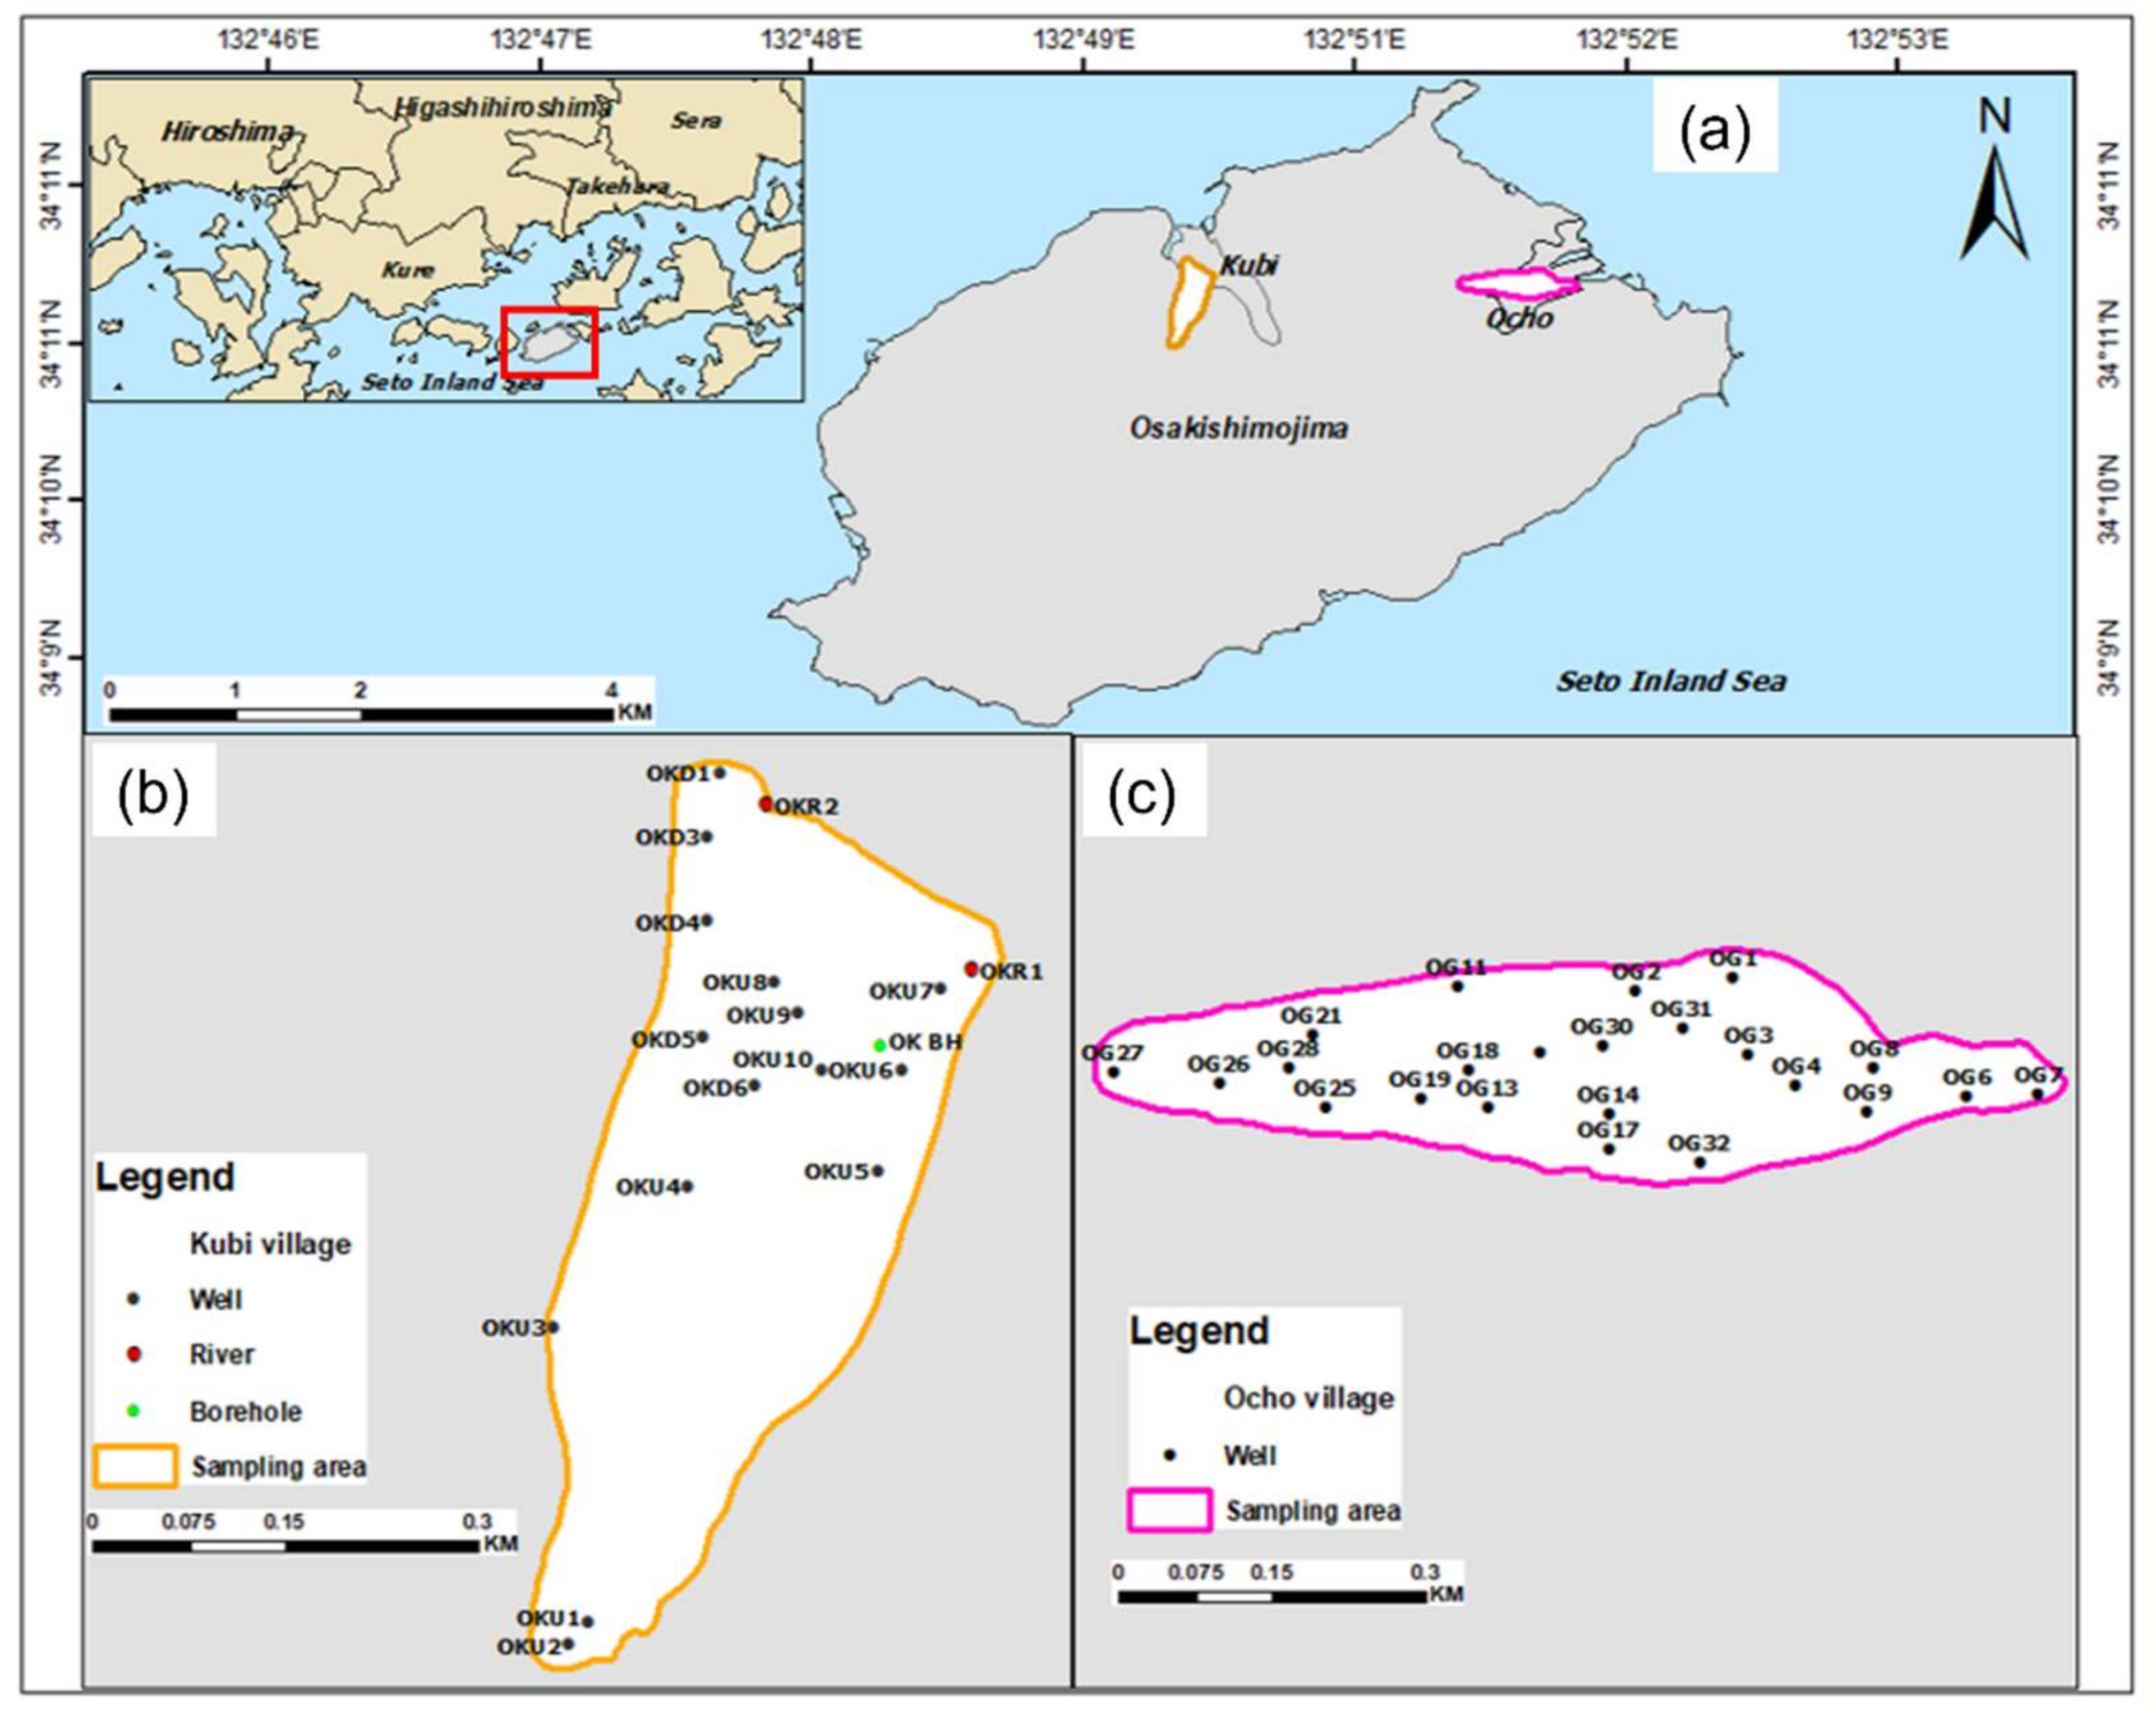
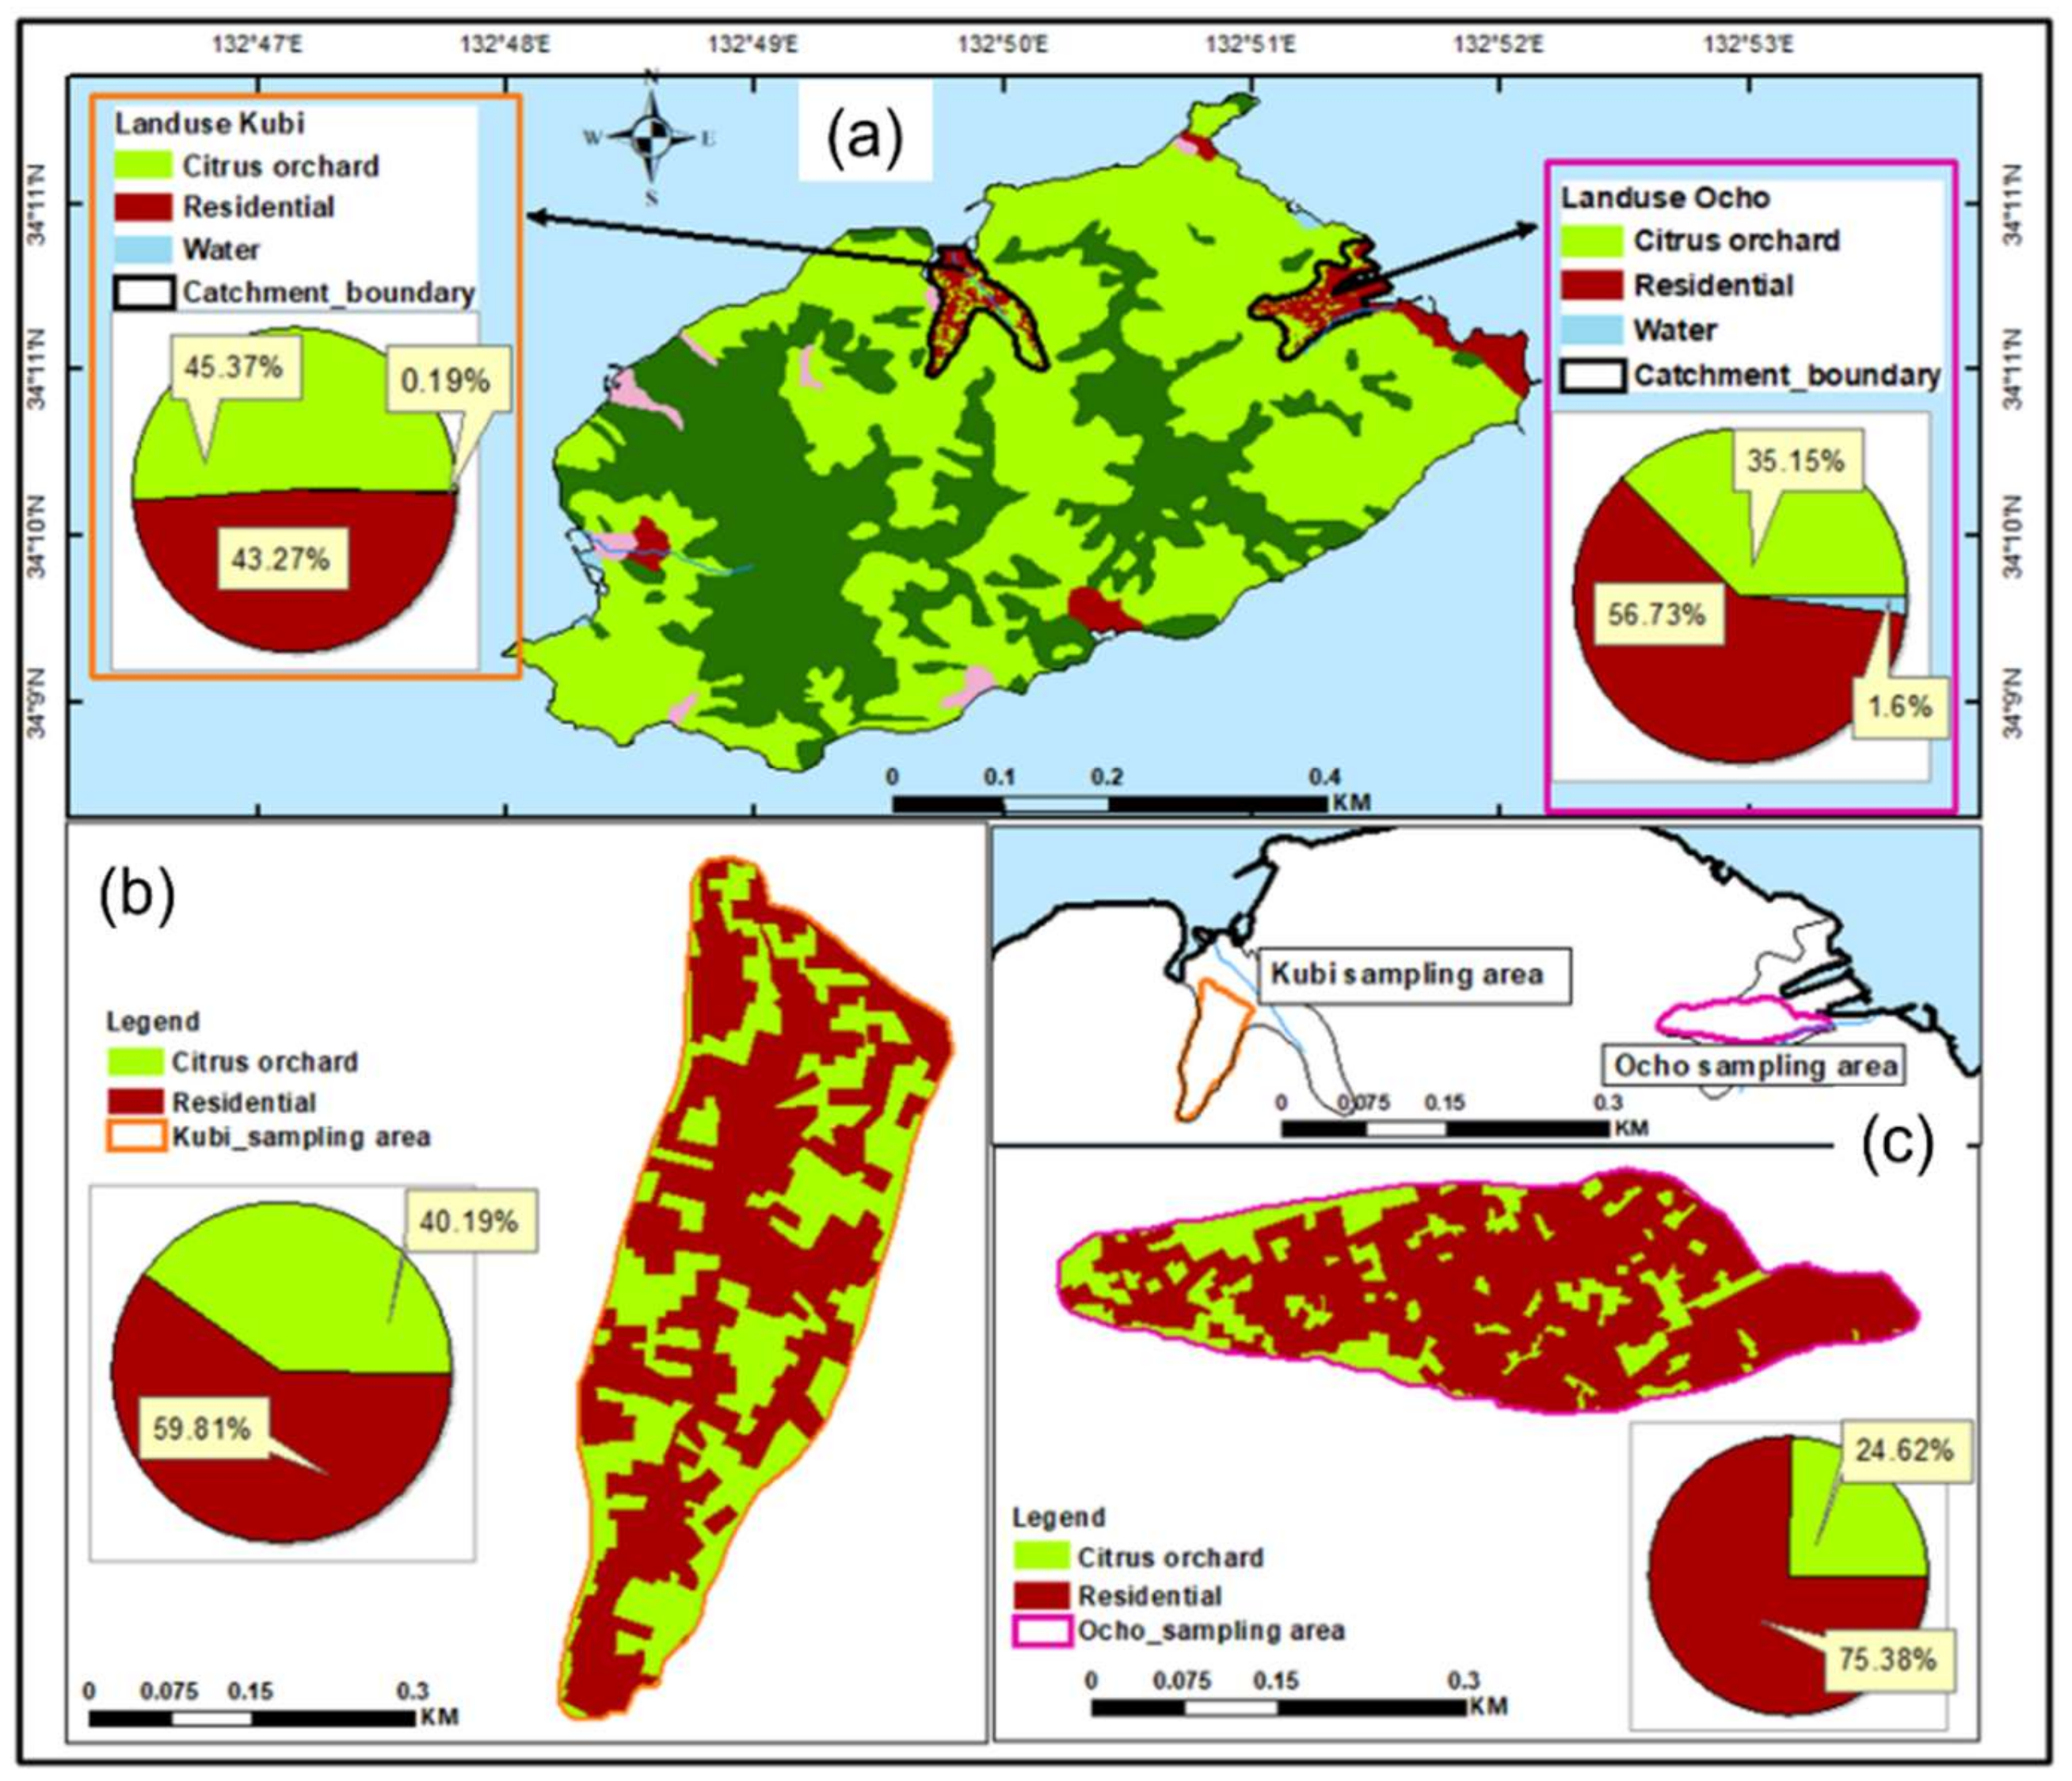
2. Description of Study Site
3. Materials and Method
3.1. Sample Collection
3.2. Source Apportionment Calculation
3.3. Statistical Method
4. Results and Discussion
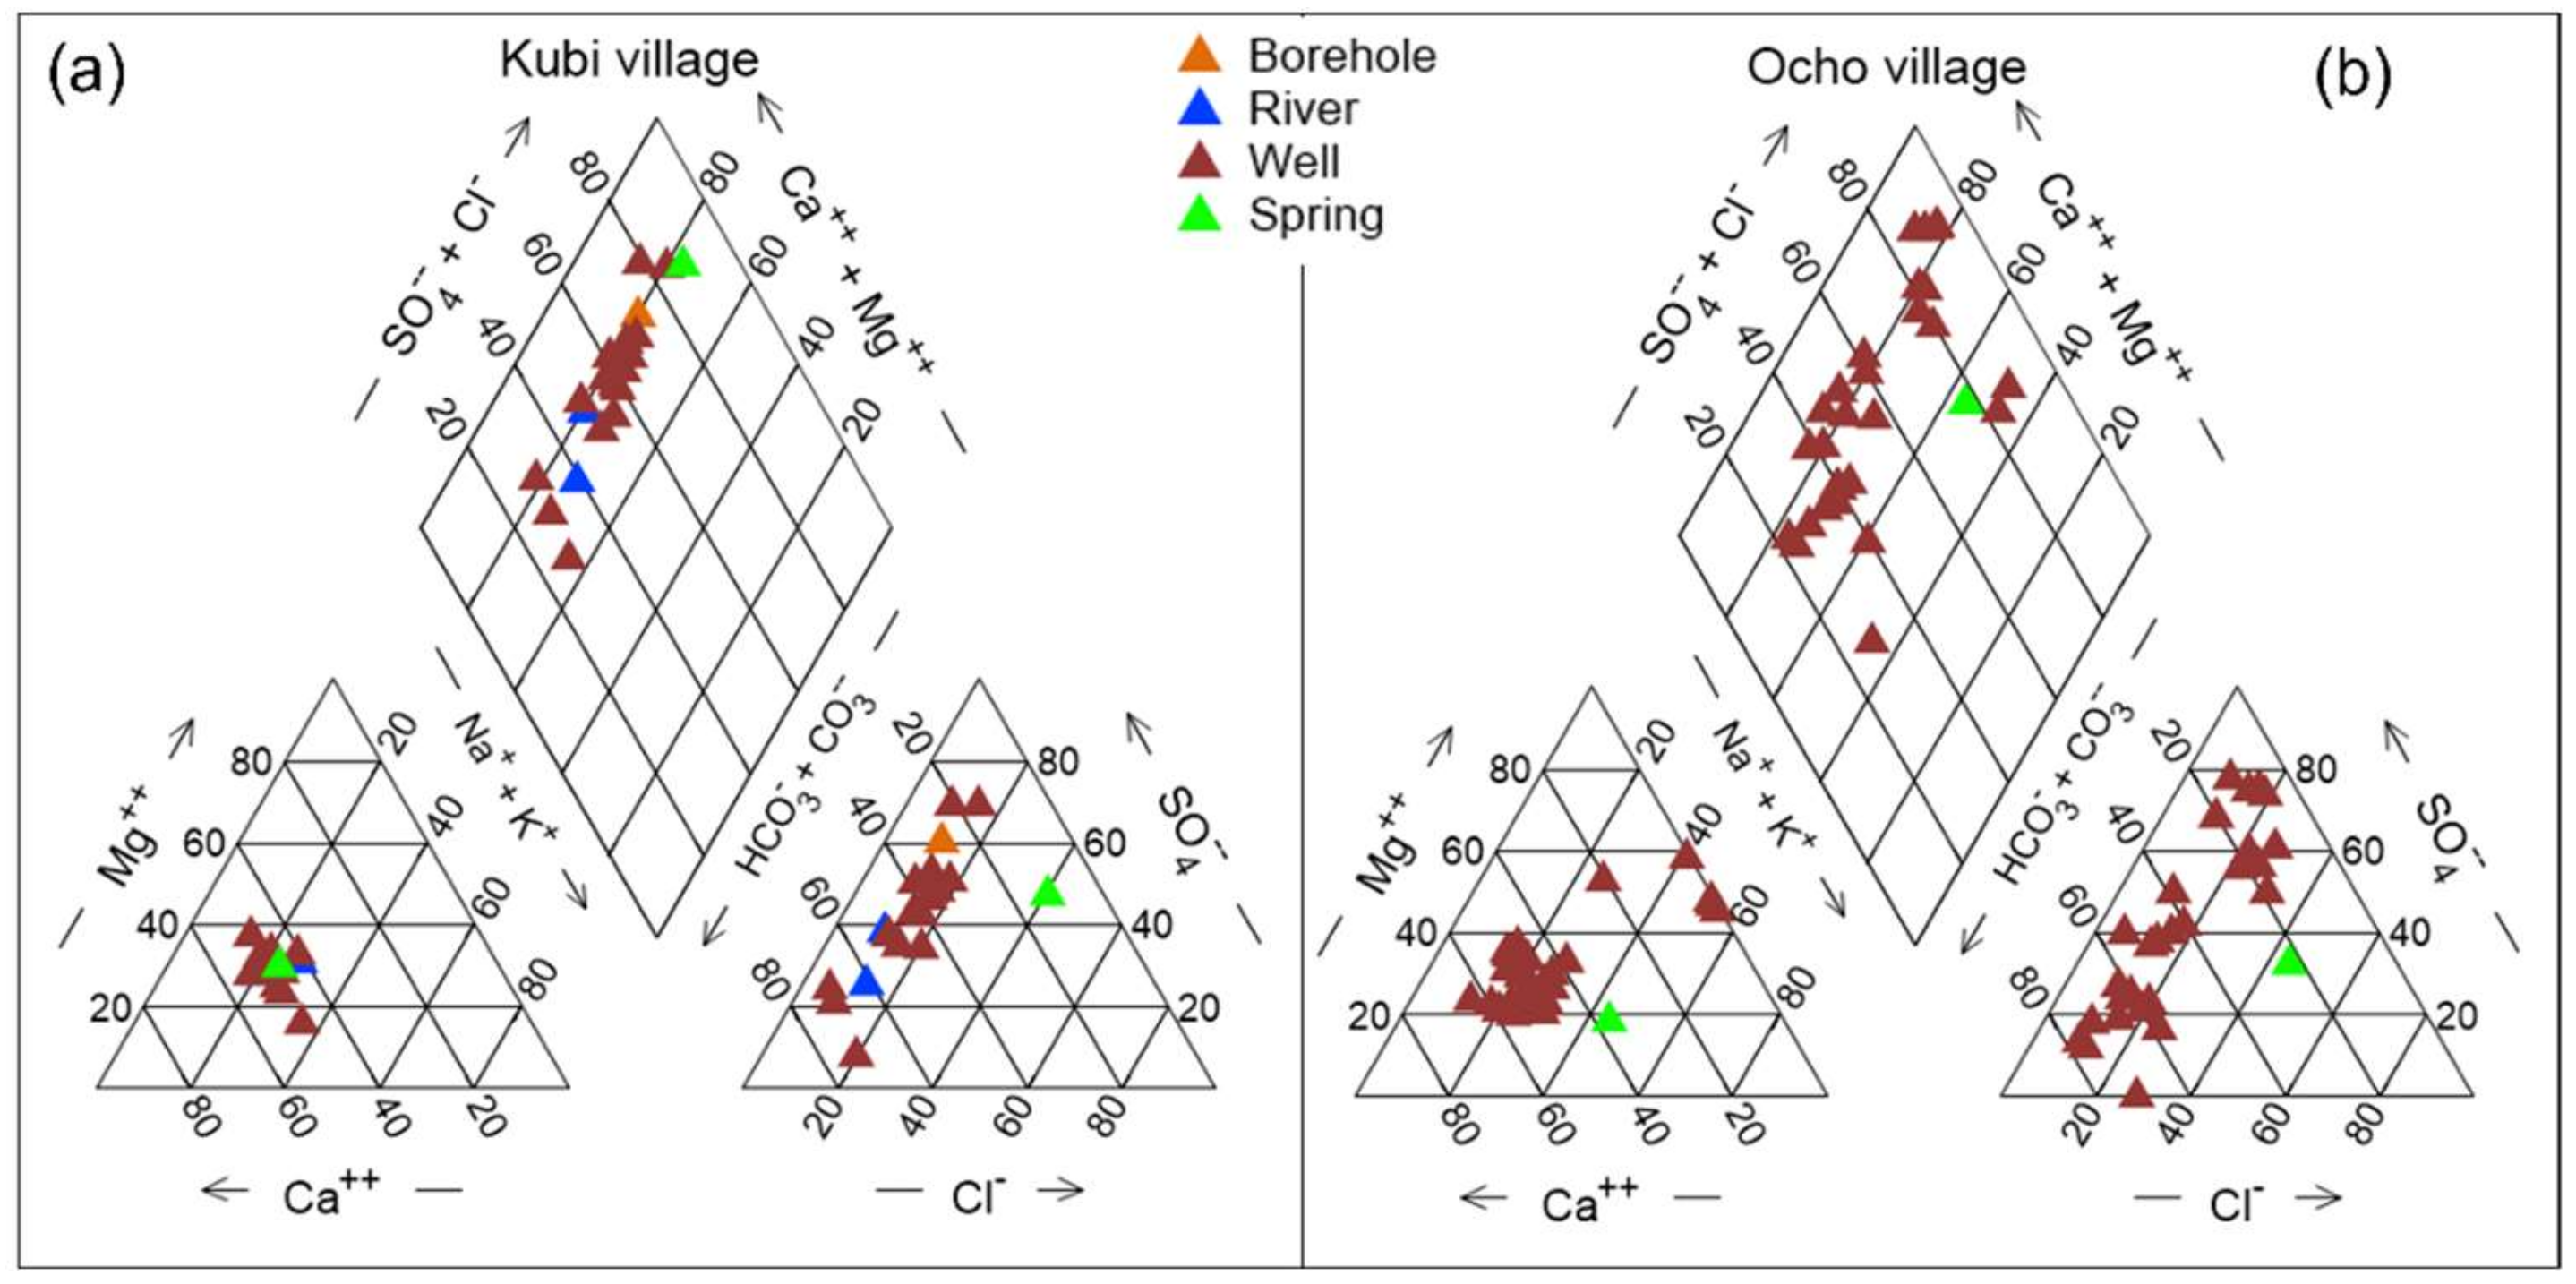
4.1. General Hydrochemistry
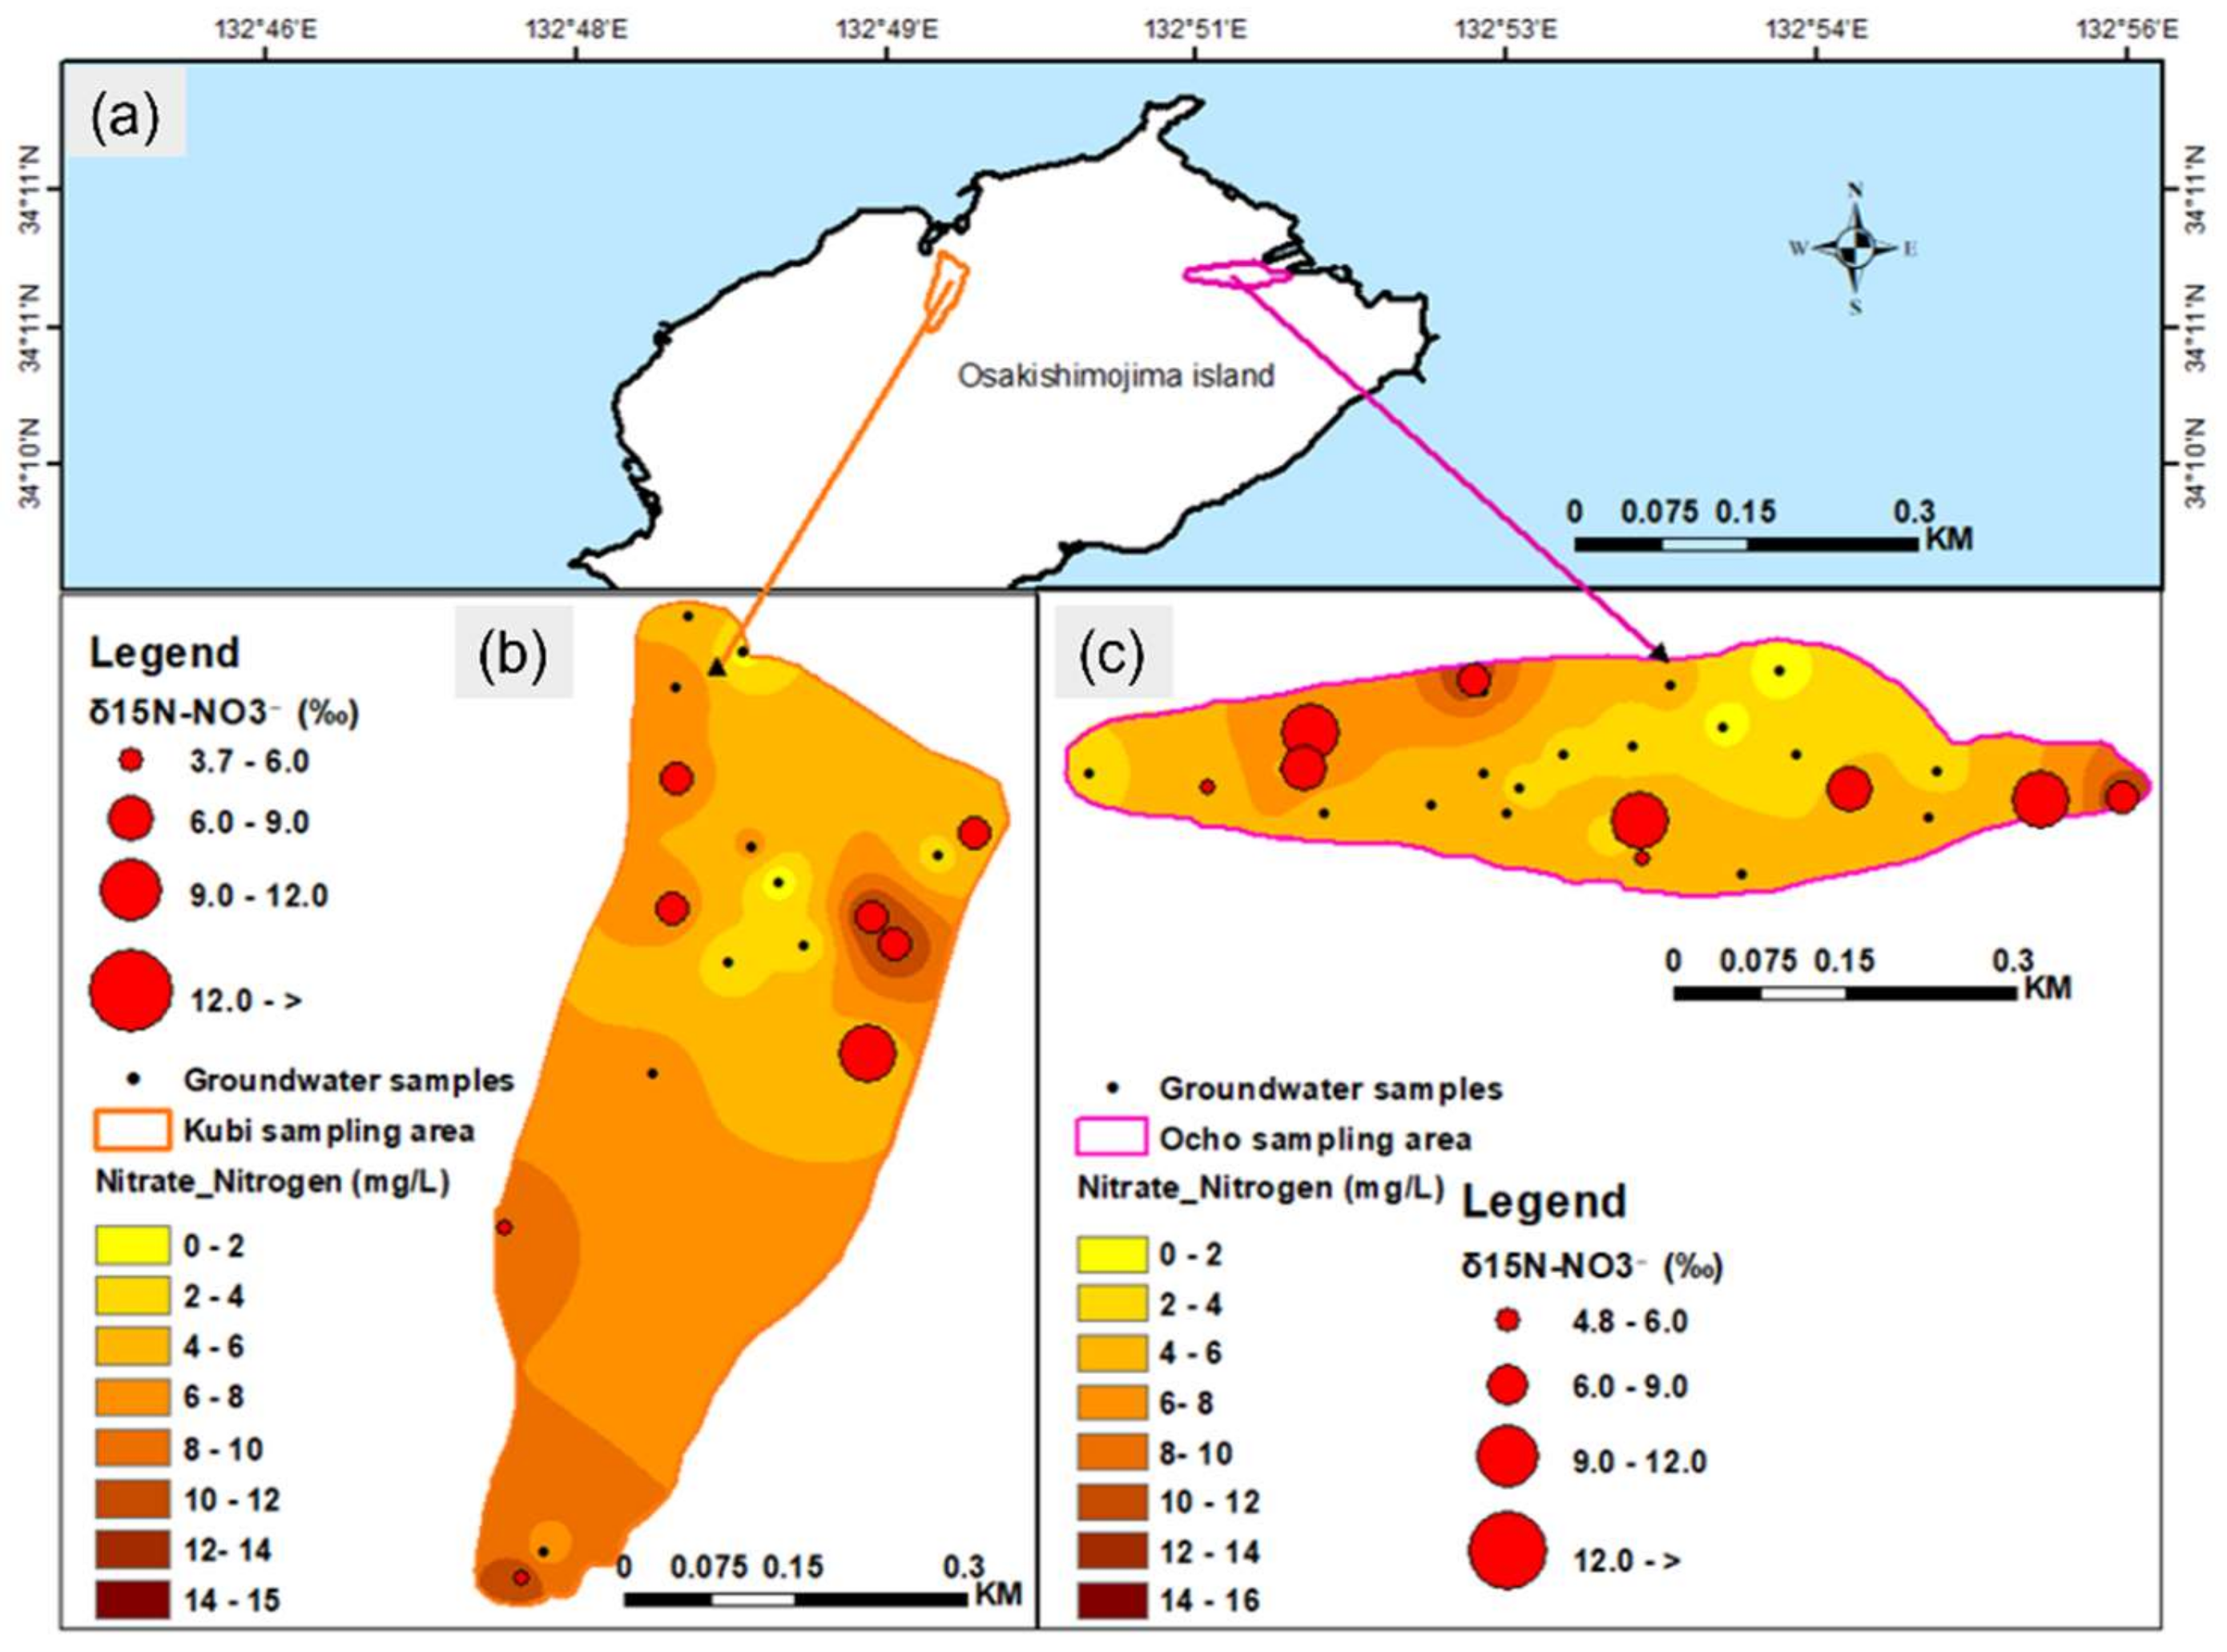
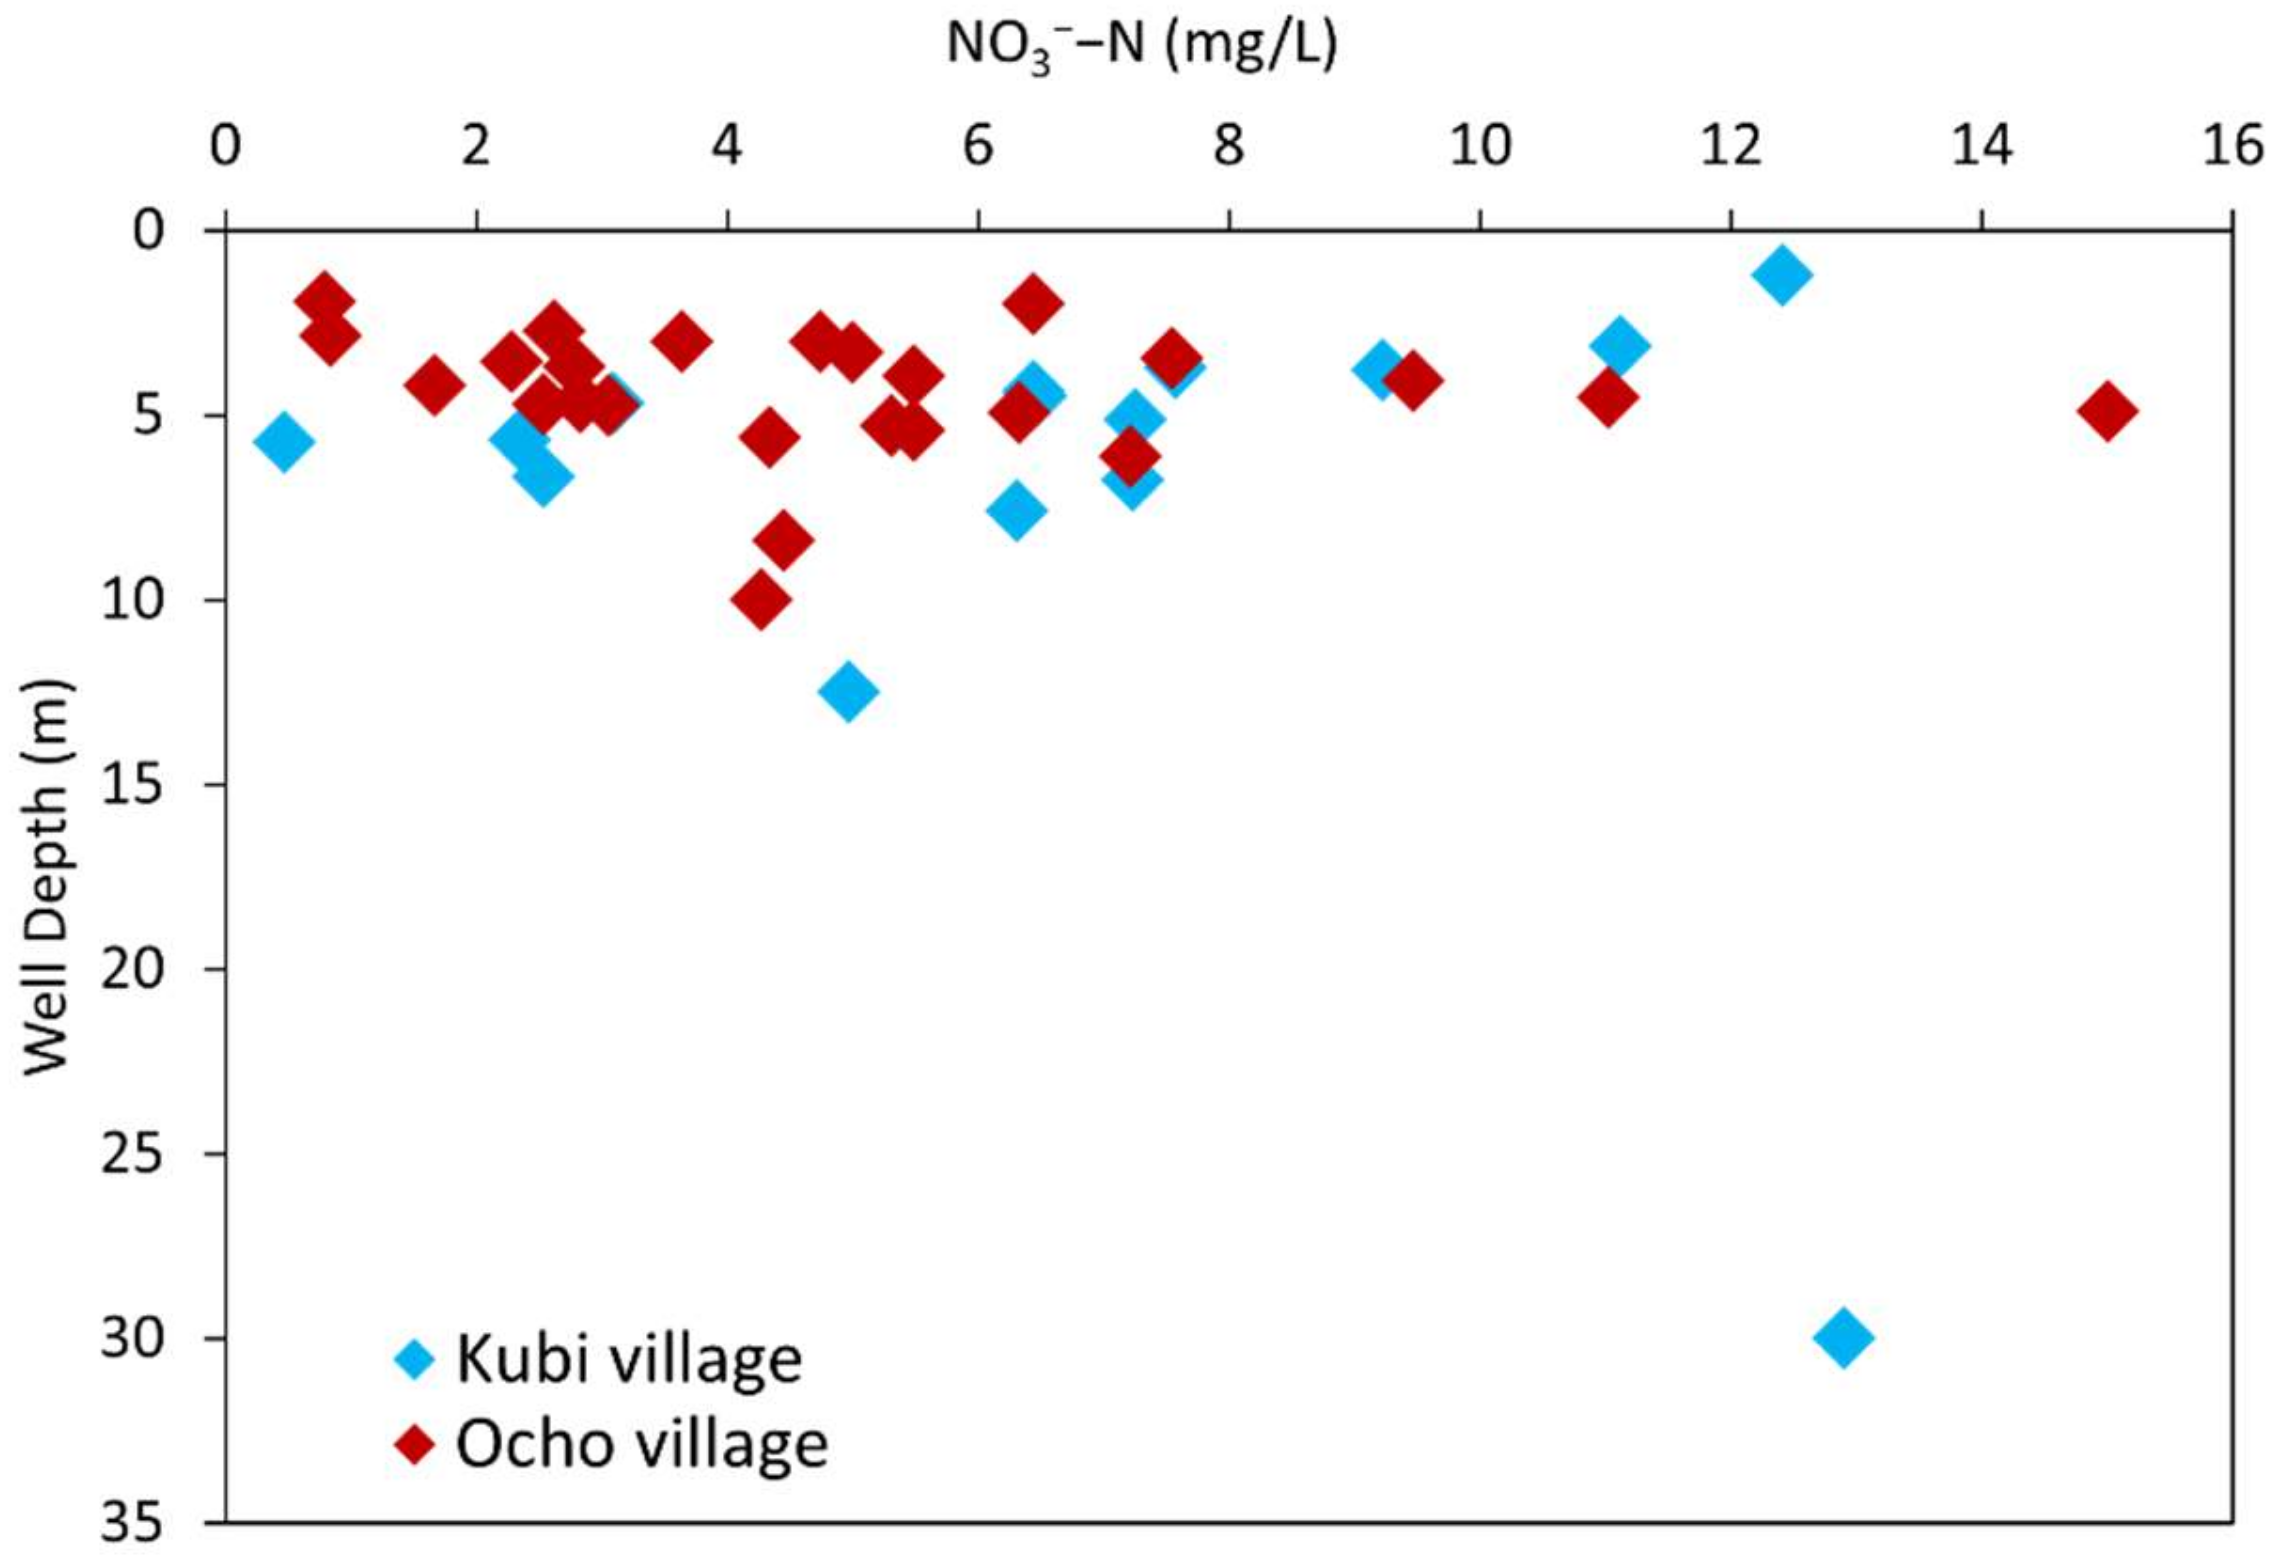
4.2. Spatial Variations in the NO3−−N Concentration
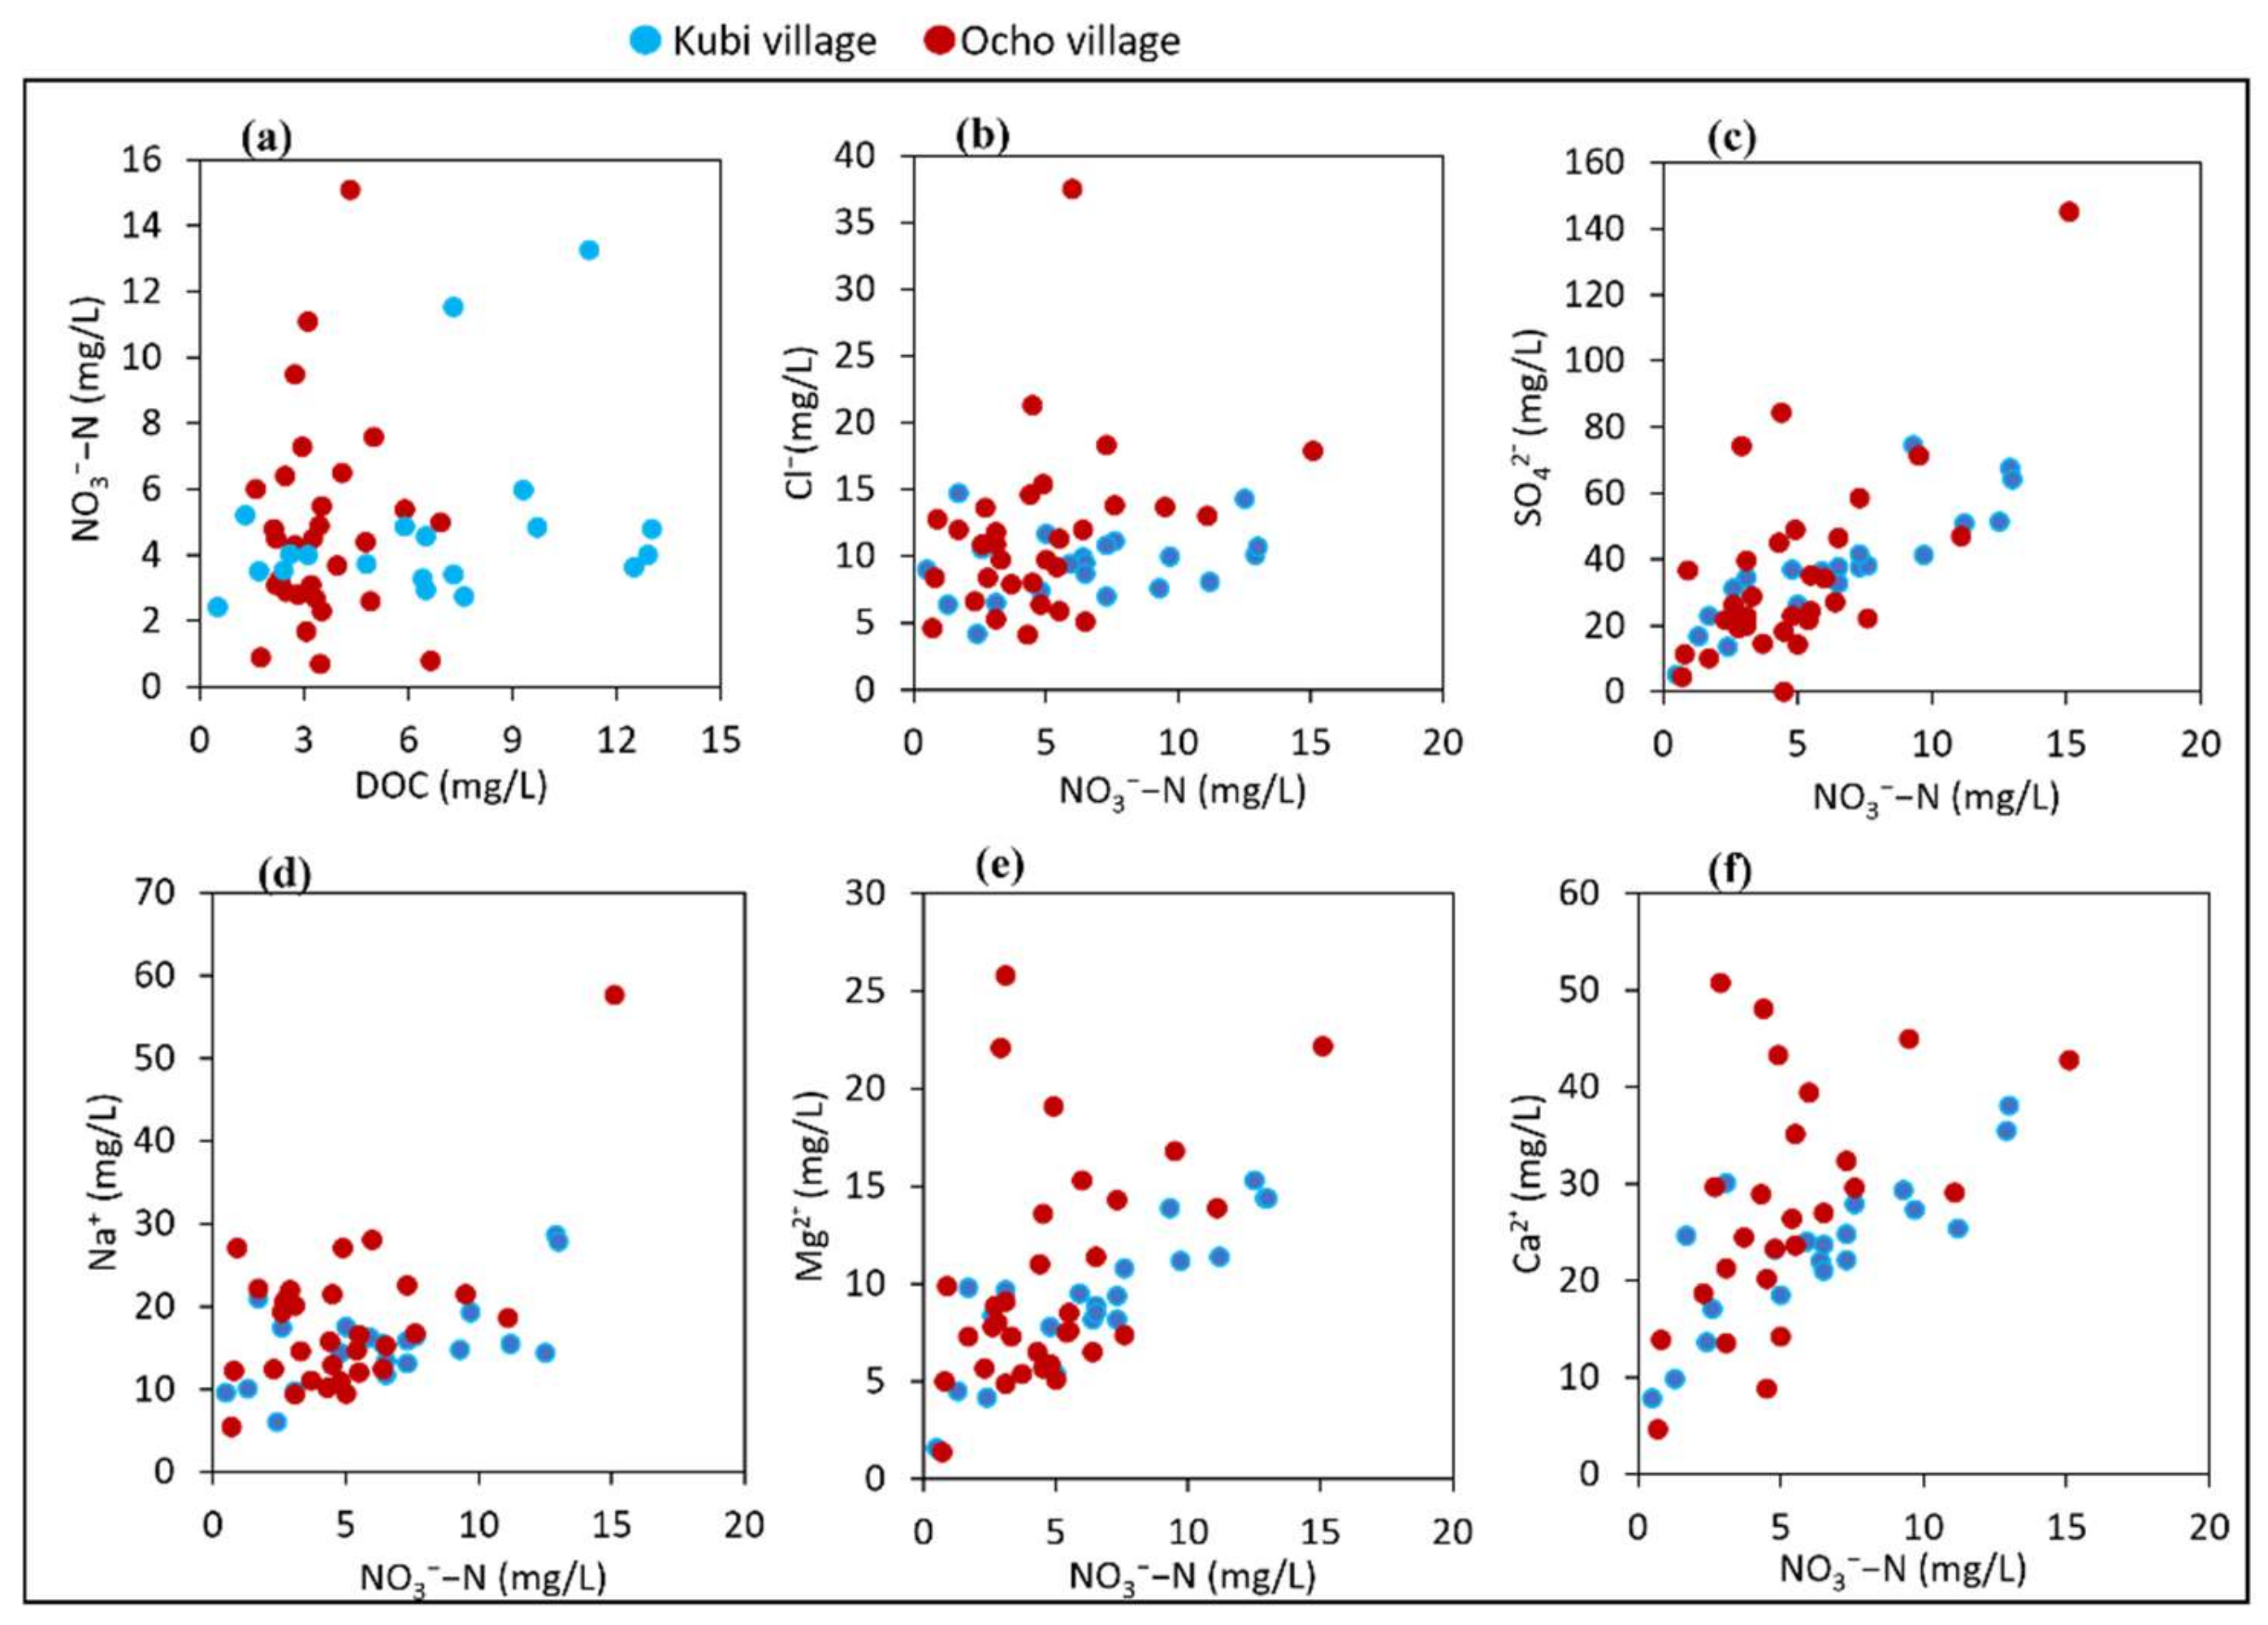
4.3. Relationship between NO3−−N and Water Chemical Parameters
4.4. Principal Component Analysis Results
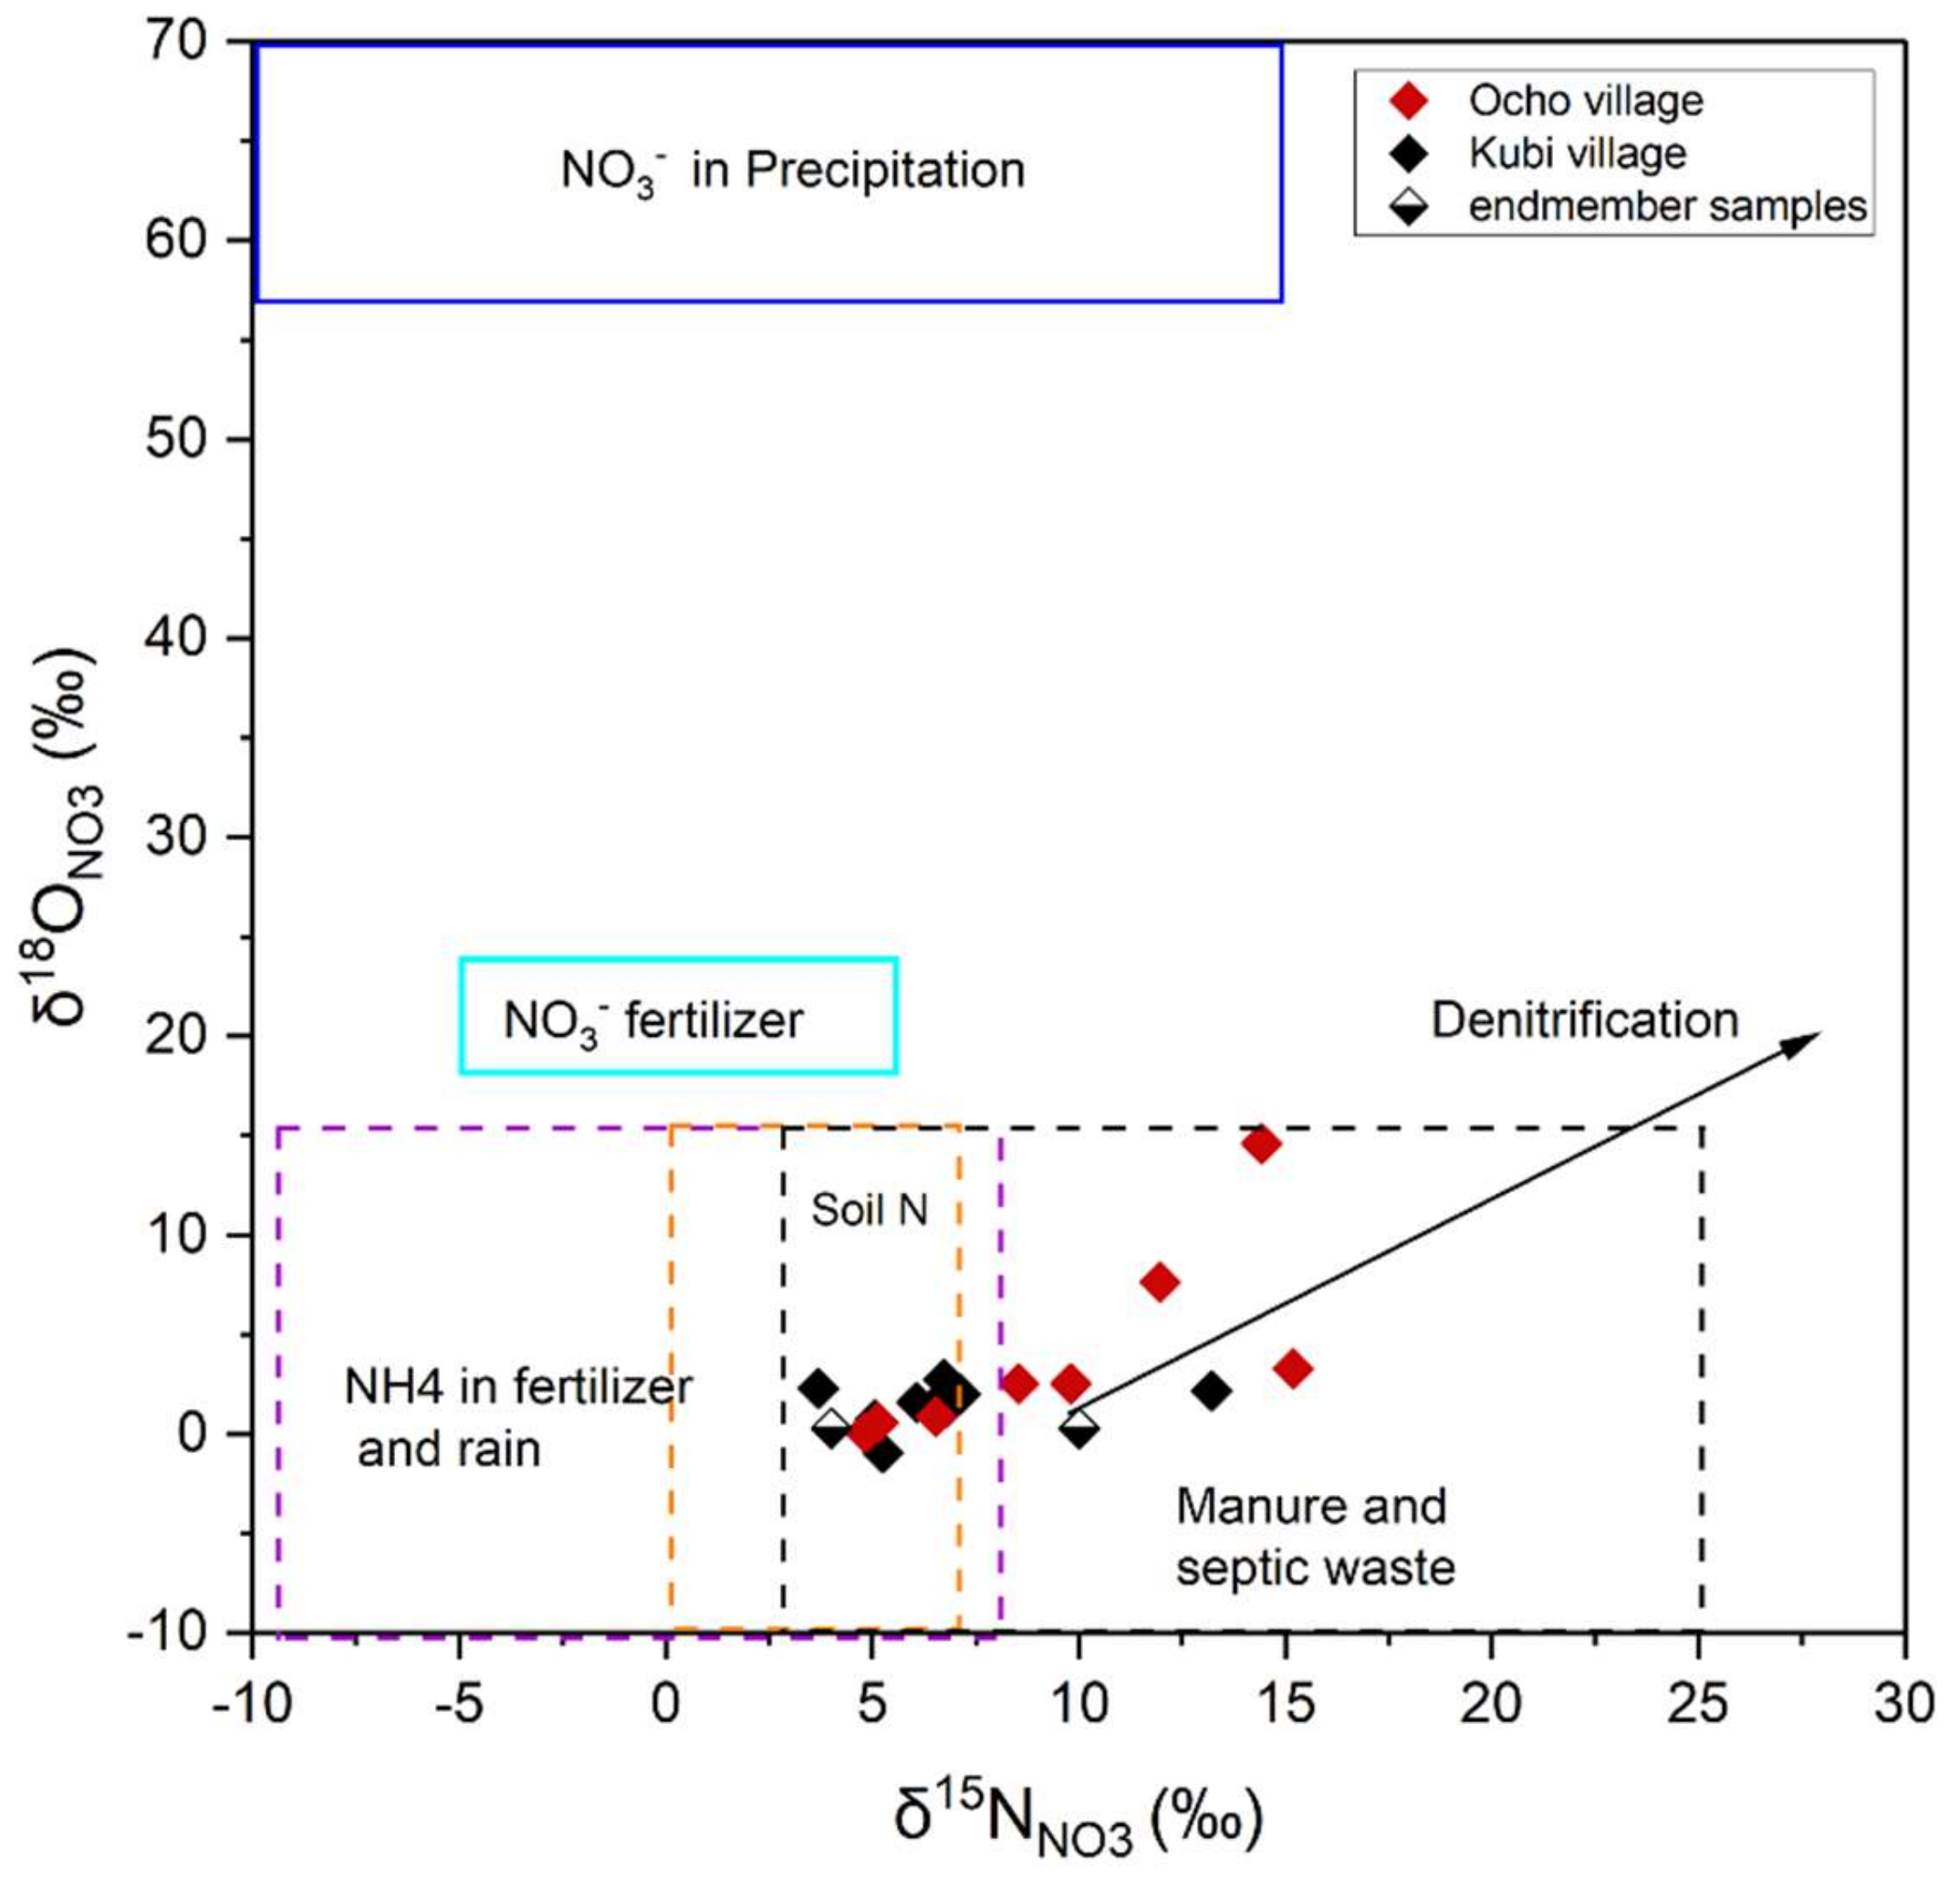
4.5. Distribution Characteristics of Stable Isotopes
4.6. Source Apportionment of NO3−
5. Conclusions
Supplementary Materials
Author Contributions
Funding
Institutional Review Board Statement
Informed Consent Statement
Data Availability Statement
Acknowledgments
Conflicts of Interest
References
- Hayashi, K.; Shibata, H.; Oita, A.; Nishina, K.; Ito, A.; Katagiri, K.; Shindo, J.; Winiwarter, W. Nitrogen budgets in Japan from 2000 to 2015: Decreasing trend of nitrogen loss to the environment and the challenge to further reduce nitrogen waste. Environ. Pollut. 2021, 286, 117559. [Google Scholar] [CrossRef] [PubMed]
- Norio Tase, N. Groundwater contamination in Japan. Environ. Geol. Water Sci. 1992, 20, 15–20. [Google Scholar] [CrossRef]
- Onodera, S. Subsurface pollution in Asian megacities. In Groundwater and Subsurface Environments: Human Impacts in Asian Coastal Cities; Springer: Berlin/Heidelberg, Germany, 2011; pp. 159–184. [Google Scholar] [CrossRef]
- Haque, S.J.; Onodera, S.; Shimizu, Y. An overview of the effects of urbanization on the quantity and quality of groundwater in South Asian megacities. Limnology 2013, 14, 135–145. [Google Scholar] [CrossRef]
- Agrawal, G.D.; Lunkad, S.K.; Malkhed, T. Diffuse agricultural nitrate pollution of groundwaters in India. Water Sci. Technol. 1999, 39, 67–75. [Google Scholar] [CrossRef]
- Nolan, B.; Stoner, J. Nutrients in groundwaters of the conterminous United States, 1992–1995. Environ. Sci. Technol. 2000, 34, 1156–1165. [Google Scholar] [CrossRef] [Green Version]
- Sacchi, E.; Acutis, M.; Bartoli, M.; Brenna, S.; Delconte, C.A.; Laini, A.; Pennisi, M. Origin and fate of nitrates in groundwater from the central Po plain: Insights from isotopic investigations. Appl. Geochem. 2013, 34, 164–180. [Google Scholar] [CrossRef]
- Mcclain, M.; Richey, J.; Pimentel, T. Groundwater nitrogen dynamics at the terrestrial-lotic interface of a small catchment in the Central Amazon Basin. Biogeochemistry 1994, 27, 113–127. [Google Scholar] [CrossRef]
- Kumazawa, K. Nitrogen fertilization and nitrate pollution in groundwater in Japan: Present status and measures for sustainable agriculture. Nutr. Cycl. Agroecosystems 2002, 63, 129–137. [Google Scholar] [CrossRef]
- Saito, M.; Onodera, S.; Okubo, K.; Takagi, S.; Maruyama, Y.; Jin, G.; Shimizu, Y. Effects of physical and morphometric factors on nutrient removal properties in agricultural ponds. Water Sci. Technol. 2015, 72, 2187–2193. [Google Scholar] [CrossRef] [Green Version]
- Kimbi, S.B.; Onodera, S.; Nozaki, S.; Tomozawa, Y.; Wang, K.; Rusydi, A.F.; Saito, M. Impact of citrus agriculture on the quality of water resource in as small steep Island, Seto Inland Sea, Japan. GEOMATE J. 2021, 20, 109–114. [Google Scholar] [CrossRef]
- Zhang, Y.; Li, F.; Zhang, Q.; Li, J.; Liu, Q. Tracing nitrate pollution sources and transformation in surface- and ground-waters using environmental isotopes. Sci. Total Environ. 2014, 490, 213–222. [Google Scholar] [CrossRef] [PubMed]
- Kendall, C. Tracing nitrogen sources and cycling in catchments. In Isotope Tracers in Catchment Hydrology; Kendall, C., McDonnell, J.J., Eds.; Elsevier Science: Amsterdam, The Netherlands, 1998; pp. 519–576. [Google Scholar]
- Bedard-Haughn, A.K.; van Groenigen, J.-W.; van Kessel, C. Tracing 15 N through landscapes: Potential uses and precautions. J. Hydrol. 2003, 272, 175–190. [Google Scholar] [CrossRef]
- Knapp, A.N.; Sigman, D.M.; Lipschultz, F.N. Isotopic composition of dissolved organic nitrogen and nitrate at the Bermuda Atlantic time-series study site. Glob. Biogeochem. Cycles 2005, 19, GB1018. [Google Scholar] [CrossRef]
- Chen, J.; Taniguchi, M.; Liu, G.; Miyaoka, K.; Onodera, S.; Tokunaga, T.; Fukushima, Y. Nitrate pollution of groundwater in the Yellow River delta, China. Hydrogeol. J. 2007, 15, 1605–1614. [Google Scholar] [CrossRef]
- Umezawa, Y.; Hosono, T.; Onodera, S.; Siringan, F.; Buapeng, S.; Delinom, R.; Yoshimizu, C.; Tayasu, I.; Nagata, T.; Taniguchi, M. Sources of nitrate and ammonium contamination in groundwater under developing Asian megacities. Sci. Total Environ. 2008, 404, 361–376. [Google Scholar] [CrossRef]
- Peralta, E.M.; Batucan, L.S.; De Jesus, I.B.B.; Triño, E.M.C.; Uehara, Y.; Ishida, T.; Kobayashi, Y.; Ko, C.Y.; Iwata, T.; Borja, A.S.; et al. Nutrient loadings and deforestation decrease benthic macroinvertebrate diversity in an urbanised tropical stream system. Limnologica 2020, 80, 125744. [Google Scholar] [CrossRef]
- Rusydi, A.F.; Onodera, S.; Saito, M.; Hyodo, F.; Maeda, M.; Sugiantiuyo, K.; Wibawa, S. Potential sources of ammonium-nitrogen in the coastal groundwater determined from a combined analysis of nitrogen isotope, biological and geological parameters, and land use. Water 2021, 13, 25. [Google Scholar] [CrossRef]
- Wang, K.; Onodera, S.; Saito, M. Evaluation of nitrogen loading in the last 80 years in an urbanized Asian coastal catchment through the reconstruction of severe contamination period. Environ. Res. Lett. 2022, 17, 014010. [Google Scholar] [CrossRef]
- Xue, D.M.; Botte, J.; Baets, B.D.; Accoe, F.; Nestler, A.; Taylor, P.; Cleemput, O.V.; Berglund, M.; Boeckx, P. Present limitations and future prospects of stable isotope methods for nitrate source identification in surface- and groundwater. Water Res. 2009, 43, 1159–1170. [Google Scholar] [CrossRef]
- Kou, X.; Ding, J.; Li, Y.; Li, Q.; Mao, L.; Xu, C.; Zheng, Q.; Zhuang, S. Tracing nitrate sources in the groundwater of an intensive agricultural region. Agric. Water Manag. 2021, 250, 106826. [Google Scholar] [CrossRef]
- Kohl, D.H.; Shearer, G.B.; Commoner, B. Fertilizer nitrogen: Contribution to nitrate in surface water in a Corn Belt Watershed. Science 1971, 174, 1331–1334. [Google Scholar] [CrossRef] [PubMed]
- Amberger, A.; Schmidt, H.L. Natürliche Isotopengehalte von Nitrat als Indikatoren für dessen Herkunft. Geochim. Cosmochim. Acta 1987, 51, 2699–2705. (In German) [Google Scholar] [CrossRef]
- Kendall, C.; Elliott, E.M.; Wankel, S.D. Tracing anthropogenic inputs of nitrogen to ecosystems. In Stable Isotopes in Ecology and Environmental Science; Michener, R.H., Lajtha, K., Eds.; Blackwell: Oxford, UK, 2008; pp. 375–449. [Google Scholar]
- Aravena, R.; Robertson, W. Use of multiple isotope tracers to evaluate denitrification in groundwater: Case study of nitrate from a large-flux septic system plume. Ground Water 1998, 36, 975–982. [Google Scholar] [CrossRef]
- Wu, D.D.; Jiang, Y.H.; Jia, J.Y.; Cai, H.S. Analyses of pollution source of nitrogen in groundwater with δ15N-NO3 and δ18O-NO3 in Changzhou. Hydrogeol. Eng. Geol. 2006, 3, 11–15. [Google Scholar]
- Chen, F.J.; Jia, G.D.; Chen, J.Y. Nitrate sources and watershed denitrification inferred from nitrate dual isotopes in the Beijiang River, south China. Biogeochemistry 2009, 94, 163–174. [Google Scholar] [CrossRef]
- Liu, T.; Wang, F.; Michalski, G.; Xia, X.H.; Liu, S.D. Using 15N, 17O, and 18O to determine nitrate sources in the Yellow River, China. Environ. Sci. Technol. 2013, 47, 13412–13421. [Google Scholar] [CrossRef]
- Meghdadi, A.; Javar, N. Quantification of spatial and seasonal variations in the proportional contribution of nitrate sources using a multi-isotope approach and Bayesian isotope mixing model. Environ. Pollut. 2018, 235, 207–222. [Google Scholar] [CrossRef]
- Ji, X.L.; Xie, R.T.; Hao, Y.; Lu, J. Quantitative identification of nitrate pollution sources and uncertainty analysis based on dual isotope approach in an agricultural water- shed. Environ. Pollut. 2017, 229, 586–594. [Google Scholar] [CrossRef]
- Parnell, A.C.; Inger, R.; Bearhop, S.; Jackson, A.L. Source partitioning using stable isotopes: Coping with too much variation. PLoS ONE 2010, 5, e9672. [Google Scholar] [CrossRef]
- Fadhullah, W.; Syahirah Yaccob, N.; Syakir, M.I.; Akmal, M.S.; Yue, F.-J.; Li, S.-L. Nitrate sources and processes in the surface water of a tropical reservoir by stable isotopes and mixing model. Sci. Total Environ. 2020, 700, 134517. [Google Scholar] [CrossRef]
- Fu, X.M.; Sun, Y.Y.; Su, J.; Zheng, M.X.; Xi, B.D.; Qian, G.R. Source of nitrate in groundwater based on hydrochemical and dual stable isotopes. China Environ. Sci. 2019, 39, 3951–3958. [Google Scholar]
- Yu, L.; Zheng, T.; Zheng, X.; Hao, Y.; Yuan, R. Nitrate source apportionment in groundwater using Bayesian isotope mixing model based on nitrogen isotope fractionation. Sci. Total Environ. 2020, 718, 137242. [Google Scholar] [CrossRef]
- Torres-Martínez, J.A.; Mora, A.; Knappett, P.S.K.; Ornelas-Soto, N.; Mahlknecht, J. Tracking nitrate and sulfate sources in groundwater of an urbanized valley using a multi-tracer approach combined with a Bayesian isotope mixing model. Water Res. 2020, 182, 115962. [Google Scholar] [CrossRef]
- WHO. Guidelines for Drinking-Water Quality: First Addendum to the Fourth Edition; WHO: Geneva, Switzerland, 2017. [Google Scholar]
- Kure City. Population Statistical Data (Basic Resident Register). 2021. (In Japanese). Available online: https://www.city.kure.lg.jp/soshiki/36/people.html (accessed on 10 May 2022).
- Japan Japan Agricultural Cooperatives (JA), Yutaka, Hiroshima, 2022. Yutaka Town Population Statistics (2005–2021) and Yutaka Town Farmer Age and Population Statistics (1970–2005) Unpublished Data in Japanese. Available online: https://www.city.kure.lg.jp/ (accessed on 10 May 2022).
- Ministry of Land, Infrastructure, Transport, and Tourism of Japan. 2021. Available online: https://nlftp.mlit.go.jp/ (accessed on 8 April 2022).
- McIlvin, M.R.; Altabet, M.A. Chemical conversion of nitrate and nitrite to nitrous oxide for nitrogen and oxygen isotopic analysis in freshwater and seawater. Anal. Chem. 2005, 77, 5589–5595. [Google Scholar] [CrossRef]
- Tu, Y.; Fang, Y.T.; Liu, D.W.; Pan, Y.P. Modifications to the azide method for nitrate isotope analysis. Rapid Commun. Mass Spectrom. 2016, 30, 1213–1222. [Google Scholar] [CrossRef]
- Jackson, A.L.; Inger, R.; Bearhop, S.; Parnell, A. Erroneous behaviour of MixSIR, a recently published Bayesian isotope mixing model: A discussion of Moore & Semmens (2008). Ecol. Lett. 2009, 12, E1–E5. [Google Scholar]
- Huang, G.; Liu, C.; Sun, J.; Zhang, M.; Jing, J.; Li, L. A regional scale investigation on factors controlling the groundwater chemistry of various aquifers in a rapidly urbanized area: A case study of the Pearl River Delta. Sci. Total Environ. 2018, 625, 510–518. [Google Scholar] [CrossRef]
- Zhang, F.; Huang, G.; Hou, Q.; Liu, C.; Zhang, Y.; Zhang, Q. Groundwater quality in the Pearl River Delta after the rapid expansion of industrialization and urbanization: Distributions, main impact indicators, and driving forces. J. Hydrol. 2019, 577, 124004. [Google Scholar] [CrossRef]
- Evangelou, V.P. Environmental Soil and Water Chemistry; Wiley: New York, NY, USA, 1998. [Google Scholar]
- Earle, S. Physical Geology, 2nd ed.; BC Open Textbook Project; BCcampus: Victoria, BC, USA, 2019; Available online: https://books.google.co.jp/books?id=lSwwywEACAAJ (accessed on 3 May 2022).
- Keesari, T.; Ramakumar, K.L.; Chidambaram, S.; Pethperumal, S.; Thilagavathi, R. Understanding the hydrochemical behavior of groundwater and its suitability for drinking and agricultural purposes in Pondicherry area, South India—A step towards sustainable development. Groundw. Sustain. Dev. 2016, 2, 143–153. [Google Scholar] [CrossRef]
- Piper, A.M. A graphic procedure in the geochemical interpretation of water analyses. Eos Trans. Am. Geophys. Union 1944, 25, 914–923. [Google Scholar] [CrossRef]
- Babiker, I.S.; Mohamed, M.A.A.; Terao, H.; Kato, K.; Ohta, K. Assessment of groundwater contamination by nitrate leaching from intensive vegetable cultivation using geographical information system. Environ. Int. 2004, 29, 1009–1017. [Google Scholar] [CrossRef]
- Lasagna, M.; de Luca, D.A. Evaluation of sources and fate of nitrates in the western Po plain groundwater (Italy) using nitrogen and boron isotopes. Environ. Sci. Pollut. Res. 2019, 26, 2089–2104. [Google Scholar] [CrossRef]
- Rivett, M.O.; Buss, S.R.; Morgan, P.; Smith, J.W.N.; Bemment, C.D. Nitrate attenuation in groundwater: A review of biogeochemical controlling processes. Water Res. 2008, 42, 4215–4232. [Google Scholar] [CrossRef]
- Korom, S.F. Natural denitrification in the saturated zone: A review. Water Resour. Res. 1992, 28, 1657–1668. [Google Scholar] [CrossRef]
- Cuoco, E.; Darrah, T.H.; Buono, G.; Verrengia, G.; de Francesco, S.; Eymold, W.K.; Tedesco, D. Inorganic contaminants from diffuse pollution in shallow groundwater of the Campanian plain (southern Italy). Implications for geochemical survey. Environ. Monit. Assess. 2015, 187, 46. [Google Scholar] [CrossRef]
- Rufino, F.; Busico, G.; Cuoco, E.; Darrah, T.H.; Tedesco, D. Evaluating the suitability of urban groundwater resources for drinking water and irrigation purposes: An integrated approach in the Agro-Aversano area of Southern Italy. Environ. Monit. Assess. 2019, 191, 768. [Google Scholar] [CrossRef]
- Nakagawa, K.; Amano, H.; Asakura, H.; Berndtsson, R. Spatial trends of nitrate pollution and groundwater chemistry in Shimabara City, Nagasaki Prefecture, Japan. Environ. Earth Sci. 2016, 75, 1–17. [Google Scholar] [CrossRef] [Green Version]
- Egbi, C.D.; Anornu, G.; Appiah-Adjei, E.K.; Ganyaglo, S.Y.; Dampare, S.B. Evaluation of water quality using hydrochemistry, stable isotopes, and water quality indices in the Lower Volta River Basin of Ghana. Environ. Dev. Sustain. 2019, 21, 3033–3063. [Google Scholar] [CrossRef]
- Yadav, R.K.; Goyal, B.; Sharma, R.K.; Dubey, S.K.; Minhas, P.S. Post-irrigation impact of domestic sewage effluent on composition of soils, crops and ground water—A case study. Environ. Int. 2002, 28, 481–486. [Google Scholar] [CrossRef]
- Soil Health, 2013. Leaching Characteristics of Organic Fertilizers. LebanonTurf Cumberland ST. Lebanon. Available online: https://www.lebanonturf.com/education-center/soil-health (accessed on 9 June 2022).
- Kure City Water Works and Sewerage Bureau, 2021. Business Plan 2020. Pages: 110, Japanese. Available online: https://www.city.kure.lg.jp/site/jougesui/about-jigyougaiyou.html (accessed on 10 May 2022).
- Morgan, T.K.; Kadyamakeni, M.D.; Zekri, M.; Schumann, W.A.; Vashisth, T.; Obreza, A.T.; Ferrarezi, S.R. 2021–2022 Florida Citrus Production Guide: Nutrition Management for Citrus Trees; UF/IFAS: Polk, FL, USA, 2020. [Google Scholar]
- Moe, K.; Yamakawa, T.; Thu, T.T.P.; Kajihara, Y. Effects of pretransplant basal and split applications of nitrogen on the growth and yield of Manawthukha rice. Commun. Soil Sci. Plant Analysis 2014, 45, 2833–2851. [Google Scholar] [CrossRef]
- Zhou, Z.J.; Shen, Y.Z.; Du, C.W.; Zhou, J.M.; Qin, Y.S.; Wu, Y.J. Economic and soil environmental benefits of using controlled-release bulk blending urea in the North China plain. Land Degrad. Dev. 2017, 28, 2370–2379. [Google Scholar] [CrossRef]


| Kubi Village | Ocho Village | |||||||||||||||||||||
|---|---|---|---|---|---|---|---|---|---|---|---|---|---|---|---|---|---|---|---|---|---|---|
| Spring (n = 1) | River (n = 2) | Wells (n = 17) | Borehole (n = 1) | Spring (n =2) | Wells (n = 30) | |||||||||||||||||
| Parameters | Min/Max | Min. | Max. | Ave. | Med. | SD | Min. | Max. | Ave. | Med. | SD | Min/Max | Min. | Max. | Ave. | Med. | SD | Min. | Max. | Ave. | Med. | SD |
| pH | 7.3 | 7.9 | 8.6 | 8.3 | 8.3 | 0.5 | NM | 7.4 | 6.8 | 6.7 | 0.4 | 7.5 | 7.5 | 7.5 | 7.5 | 7.5 | 0 | 6.2 | 8.5 | 6.8 | 6.7 | 0.5 |
| Temp | 19.1 | 23.7 | 24.7 | 24.2 | 24.2 | 0.8 | 18.1 | 26.7 | 21.2 | 20.7 | 2.4 | 19 | 17.6 | 23.6 | 20.6 | 20.6 | 4.3 | 19.2 | 28.3 | 22.3 | 22.3 | 1.7 |
| EC | 185.7 | 206 | 274 | 240 | 240 | 48.1 | 107 | 465 | 314.8 | 321 | 94.2 | 472 | 133 | 217 | 175 | 175 | 59.4 | 165 | 479 | 308.5 | 317.5 | 72.7 |
| TDS | 118.9 | 131.9 | 175.4 | 153.6 | 153.6 | 30.8 | 68.5 | 297.6 | 201.5 | 205.5 | 60.3 | 302.1 | 85.2 | 138.9 | 112 | 112 | 38.1 | 105.6 | 306.6 | 105.6 | 203.2 | 46.5 |
| DO | 9.2 | 8.3 | 9 | 8.7 | 8.7 | 0.5 | 1.1 | 8.7 | 5 | 4.7 | 2.1 | 6.1 | 7.7 | 9.5 | 8.6 | 8.6 | 1.3 | 0.8 | 9.1 | 3.5 | 3 | 2.3 |
| DOC | 3.6 | 3.8 | 5.3 | 4.6 | 4.6 | 1.1 | 2.5 | 13.3 | 5.1 | 4.1 | 3.1 | 4.1 | NM | 3.5 | 3.5 | 3.5 | 0 | NM | 7 | 3.3 | 3.2 | 1.4 |
| Cl− | 14.7 | 9.4 | 11.1 | 10.3 | 10.3 | 1.3 | 7.6 | 34 | 11.9 | 9.9 | 6.2 | 13.4 | 4.6 | 10.9 | 7.8 | 7.8 | 4.5 | 4.1 | 37.5 | 11.9 | 11.2 | 6.4 |
| SO42− | 22.9 | 30.5 | 50.4 | 40.5 | 40.5 | 14.1 | 22.1 | 75.3 | 44.4 | 38.8 | 16.6 | 80.7 | 4.5 | 22.9 | 13.7 | 13.7 | 13.1 | − | 145.1 | 37.7 | 27 | 28.2 |
| NO3− | 7.1 | 12.4 | 34.2 | 23.3 | 23.3 | 15.5 | 14.9 | 74.5 | 41.5 | 35.5 | 19.3 | 70.3 | 2.7 | 13.7 | 8.2 | 8.2 | 7.8 | 3.5 | 66.4 | 21.7 | 19.7 | 13.4 |
| NO3−−N | 1.7 | 2.9 | 7.8 | 5.4 | 5.4 | 3.5 | 3.4 | 16.9 | 9.5 | 8.1 | 4.4 | 15.9 | 0.7 | 3.1 | 1.9 | 1.9 | 1.7 | 0.8 | 15.1 | 5 | 4.5 | 3.1 |
| HCO3− | 7.2 | 50.6 | 61.2 | 55.9 | 55.9 | 7.5 | − | 121.6 | 48.6 | 45.3 | 24.5 | 39.1 | 4 | 9.3 | 6.7 | 6.7 | 3.8 | 4.5 | 150.2 | 64.2 | 69.7 | 45.4 |
| Na+ | 21 | 16.3 | 18.3 | 17.3 | 17.3 | 1.5 | 9.4 | 32.5 | 15.7 | 13.7 | 7 | 31.4 | − | 5.5 | 2.8 | 5.5 | 3.9 | 9.4 | 57.6 | 18.6 | 16.7 | 9.2 |
| K+ | 2.2 | 3.2 | 3.6 | 3.4 | 3.4 | 0.3 | 0.7 | 6.9 | 4.1 | 4.3 | 1.9 | 1 | 3.2 | 8.4 | 5.8 | 5.8 | 3.7 | 0.3 | 10.5 | 4.1 | 4 | 2.9 |
| Mg2+ | 9.8 | 8.2 | 10.7 | 9.5 | 9.5 | 1.8 | 7 | 17.8 | 11.5 | 11 | 3.2 | 17.8 | 1.4 | 25.8 | 13.6 | 13.6 | 17.3 | 4.9 | 22.2 | 10 | 7.9 | 5 |
| Ca2+ | 24.6 | 22.3 | 30 | 26.2 | 26.2 | 5.5 | 20.4 | 48.4 | 31.7 | 30.6 | 9.1 | 44.8 | − | 4.6 | 4.6 | 4.6 | 0 | − | 50.8 | 28.8 | 28 | 11.6 |
| PCs Kubi Village (21 Samples) | PCs Ocho Village (32 Samples) | ||||||
|---|---|---|---|---|---|---|---|
| Variables | PC1 | PC2 | PC3 | Variables | PC1 | PC2 | PC3 |
| pH | −0.098 | 0.396 | 0.663 | pH | −0.088 | −0.242 | 0.768 |
| TDS | 0.783 | −0.379 | 0.309 | TDS | 0.542 | 0.686 | 0.141 |
| DO | −0.209 | 0.766 | 0.105 | DO | 0.035 | −0.726 | 0.382 |
| NO3−−N | 0.903 | −0.05 | −0.119 | NO3−−N | 0.815 | 0.058 | −0.033 |
| Cl− | 0.407 | 0.398 | −0.528 | Cl− | 0.376 | 0.723 | 0.067 |
| SO42− | 0.914 | −0.018 | −0.001 | SO42− | 0.922 | 0.041 | −0.067 |
| HCO3− | −0.117 | −0.603 | 0.574 | HCO3− | −0.131 | 0.798 | −0.002 |
| Na+ | 0.823 | 0.394 | 0.117 | Na+ | 0.683 | 0.517 | −0.047 |
| K+ | −0.167 | −0.747 | −0.375 | K+ | −0.109 | −0.144 | −0.787 |
| Mg2+ | 0.917 | −0.099 | −0.13 | Mg2+ | 0.719 | 0.124 | 0.055 |
| Ca2+ | 0.673 | −0.051 | 0.29 | Ca2+ | 0.754 | −0.023 | 0.102 |
| Eigen value | 4.5 | 2.2 | 1.5 | 4.3 | 2 | 1.3 | |
| EV | 40.9 | 19.5 | 13 | 38.2 | 18 | 11.7 | |
| CV | 40.9 | 60.3 | 73.2 | 38.2 | 56.2 | 67.8 | |
| Source | δ15N (‰) | δ18O (‰) | ||
|---|---|---|---|---|
| Mean | SD | Mean | SD | |
| b Soil nitrogen (SN) | 4.4 | 0.7 | 2.85 | 0.2 |
| a Chemical fertilizer (CF) | 4 | 0.3 | 2.85 | 0.4 |
| a,b Chemical fertilizer_Soil nitrogen (CF_SN) | 4.2 | 0.5 | 2.9 | 0.3 |
| a Organic fertilizer (OF) | 10 | 0.3 | 2.85 | 0.4 |
| b Manure and sewage (M&S) | 19 | 0.3 | −12.51 | 0.4 |
| Social Information | Units | Kubi Village | Ocho Village | Key References |
|---|---|---|---|---|
| Population | 413 | 830 | [38] | |
| Average farmer age | years | 76 | 73 | [39] |
| Agricultural land | km2 | 0.6 | 1.6 | [40] |
| Sewage treatment coverage | % | 70 | 0 | [60] |
| Summary of NO3−−N concentration | Figure 4 | |||
| Average NO3−−N concentration | mg/L | 6.6 | 4.8 | |
| <5 | % | 33.3 | 62.5 | |
| 5–10 | % | 47.7 | 31.3 | |
| >10 | % | 19 | 6.2 | |
| Main NO3−−N contribution ratio | Figure 8 | |||
| Chemical fertilizer | % | 60.1 | 38.4 | |
| Organic fertilizer | % | 30.1 | 50.7 | |
| Manure and sewage | % | 9.8 | 10.9 |
Publisher’s Note: MDPI stays neutral with regard to jurisdictional claims in published maps and institutional affiliations. |
© 2022 by the authors. Licensee MDPI, Basel, Switzerland. This article is an open access article distributed under the terms and conditions of the Creative Commons Attribution (CC BY) license (https://creativecommons.org/licenses/by/4.0/).
Share and Cite
Kimbi, S.B.; Onodera, S.-I.; Ishida, T.; Saito, M.; Tamura, M.; Tomozawa, Y.; Nagasaka, I. Nitrate Contamination in Groundwater: Evaluating the Effects of Demographic Aging and Depopulation in an Island with Intensive Citrus Cultivation. Water 2022, 14, 2277. https://doi.org/10.3390/w14142277
Kimbi SB, Onodera S-I, Ishida T, Saito M, Tamura M, Tomozawa Y, Nagasaka I. Nitrate Contamination in Groundwater: Evaluating the Effects of Demographic Aging and Depopulation in an Island with Intensive Citrus Cultivation. Water. 2022; 14(14):2277. https://doi.org/10.3390/w14142277
Chicago/Turabian StyleKimbi, Sharon Bih, Shin-Ichi Onodera, Takuya Ishida, Mitsuyo Saito, Masayuki Tamura, Yusuke Tomozawa, and Itaru Nagasaka. 2022. "Nitrate Contamination in Groundwater: Evaluating the Effects of Demographic Aging and Depopulation in an Island with Intensive Citrus Cultivation" Water 14, no. 14: 2277. https://doi.org/10.3390/w14142277