
Depth-Dependent Concentrations of E. coli in Agricultural Irrigation Ponds


1
Oak Ridge Institute for Science and Education, Oak Ridge, TN 37830, USA
2
USDA-ARS Environmental Microbial and Food Safety Laboratory, Beltsville, MD 20705, USA
3
Department of Environmental Science and Technology, University of Maryland, College Park, MD 20742, USA
*
Author to whom correspondence should be addressed.
Water 2022, 14(14), 2276; https://doi.org/10.3390/w14142276
Submission received: 30 May 2022
/
Revised: 15 July 2022
/
Accepted: 19 July 2022
/
Published: 21 July 2022
(This article belongs to the Special Issue Research on Microbiological Water Quality)
Abstract
:Microbial water quality surveys of irrigation sources are conducted by measuring the concentrations of generic E. coli. The objective of this study was to evaluate the dependence of E. coli concentrations on the water sampling depth at different times of the day. Three irrigation ponds were sampled in Maryland eleven times during the growing seasons of 2019–2021. Water was collected in replicates at the surface (0 cm) and then in 50 cm depth intervals at 9:00, 12:00, and 15:00. Ponds 1 and 2 were sampled to 150 cm, whereas Pond 3 was only sampled to the 50 cm depth due to it having a shallower average depth. An analysis of variance test revealed that E. coli concentrations significantly differed by depth in only one pond (p > 0.05) but on multiple dates. Additionally, the sampling time of day was significant at only two of eleven of the observation dates across ponds; in those cases, the average concentrations across the pond increased in the order of 9:00 > 12:00 > 15:00. This study shows that E. coli concentrations measured in irrigation ponds may substantially differ depending on the sampling depth and time of day, and that these factors should be accounted for in the monitoring design.
1. Introduction
Concentrations of the fecal indicator bacterium (FIB) Escherichia coli (E. coli) are measured to assess the microbial quality of waters used for irrigation. In 2016, the Food and Drug Administration’s Produce Safety Rule (PSR) required that growers periodically sample their irrigation waters during the growing season to ensure adequate microbial water quality [1]. However, the PSR gave growers little information on where or when to sample.
FIB and pathogens in environmental waters exhibit large spatial variability, both laterally across a waterbody and with depth [2]. However, water samples to characterize the variability of microbial pathogens and FIB in agricultural ponds are commonly collected only from a single depth close to the surface (0 to 30 cm) [3,4,5]. Few studies have incorporated samples taken from a greater depth. In particular, [6,7] sampled irrigation ponds in Georgia, but only collected one or two samples from the surface or a depth of 50 cm per visit. Similarly, [8] sampled two ponds in Georgia, but included a 100 cm depth in addition to a surface sample.
Irrigation ponds are typically shallow water bodies. The Natural Resource Conservation Service (NRCS) recommends that manmade irrigation ponds should range between 5 to 14 ft (1.5 to 4.3 m) deep, with greater depths recommended for western states with dryer climates and less precipitation [9]. Nevertheless, nonuniformity across ponds in fecal microorganism concentrations or the levels of water quality parameters which describe their habitat may be expected at different depths in farm ponds.
During irrigation events, the largest volume of water is withdrawn from the pond interior and at depths far from the water surface (~0–20 cm). For that reason, concentrations of microorganisms measured in samples taken near the surface may not be representative of the greater volume of water used for irrigation, and sampling at depth may be required.
There is ample literature available regarding the concentrations of pathogens or fecal indicator organisms in wastewater or maturation ponds which are engineered to reduce fecal microbe populations via biophysical processes, lengthened holding times, and/or chemical treatments (this is well reviewed in the work of Dias et al., 2017 [10]). However, there are very few reports which have focused on ponds which directly provide irrigation water to crop fields. Substantial increases in indicator concentration with depth in non-tidal lakes or reservoirs can be expected due to the development of well-defined gradients in temperature, light, or dissolved oxygen [11,12]; however, whether this can be expected in relatively shallow irrigation ponds is not known, because sampling is most often performed only at the water surface.
The objectives of this study were to (1) examine vertical distributions in E. coli concentrations at different times of the day in three irrigation ponds and (2) relate E. coli concentrations to water quality measurements taken concurrently with sampling.
2. Materials and Methods
Water sampling was conducted at three agricultural irrigation ponds in Maryland between 2019 and 2021 (Supplementary Figure S1). Detailed descriptions of P1 and P2 can be found in [13]. In brief, P1 was an embankment pond in central Maryland, whereas P2 was an elongated excavated pond located on the Eastern Shore of Maryland. Both ponds had an area of about 4000 m2, an average interior depth of about 270 cm, and ephemeral inflows shown in Supplementary Figure S1.
Pond 3 was a retired irrigation pond located at the USDA’s Beltsville Agricultural Research Center (BARC) in Beltsville, MD, USA. This man-made pond had an area of 4383 m2. A 10 m grass buffer strip bordered the western bank of the pond, whereas the remainder was adjacent to a forested area. The surrounding fields received no nutrient amendments. The pond depth ranged from 30 cm to 130 cm, with an average depth of 90 cm.
At P1 and P2, samples were taken from the interior at 0 cm, 50 cm, 100 cm, and 150 cm depths, except on two dates when the 150 cm depth at P2 was not sampled. Samples were not collected from P3 at a depth greater than 50 cm due to depth restrictions. Samples were collected within 30 min around 9:00, 12:00, and 15:00 to assess the potential diurnal effects on E. coli concentrations. P1 was sampled twice over 2 years (6 September 2019 and 23 July 2020), P2 was sampled six times over 3 years (15 September 2019, 21 September 2019, 15 July 2020, 10 August 2020, 26 August 2020, and 15 July 2021), and P3 was sampled three times over 2 years (12 August 2020, 7 July 2021, and 13 August 2021).
All water samples were collected from a boat with a Sigma 900 MAX all-weather autosampler connected to an external battery (Hach, Loveland, CO, USA). A programmable peristaltic pump was fed from a vinyl tube with a strainer at the end which was lowered to depths specified by pre-measured markings. The strainer was attached to a YSI EXO2 (Yellow Springs Instruments, Yellow Springs, OH, USA) sensor guard such that the strainer openings were at the same level as the sensor tips. The vinyl tube was purged for 20 s with the water at a depth of interest prior to sampling. The autosampler pumped water into pre-labeled 500 mL plastic sampling containers which were kept on ice until the boat returned to shore. At that time, samples were immediately removed from the cooler and placed in the dark in an ice-filled cooler. Sample processing in the lab usually occurred within two hours after the 15:00 sample collection time. At the beginning and end of sample collection, the vinyl tubing was rinsed with tap water, then 70% ethanol, which was allowed to sit for several minutes, followed by a rinse with deionized water.
Water quality parameter values were measured using several different in situ and laboratory instruments. The YSI EXO2 sonde was used to measure the values of temperature (°C), specific conductance (SPC; µS cm−1), DO (mg L−1), pH, fluorescent dissolved organic matter (FDOM) (relative fluorescent units [RFUs]), chlorophyll-a (CHL; RFU), phycocyanin (PC; RFU), and turbidity (NTU). Photosynthetic active radiation (PAR; µmol m2 s−1) was measured with submersible sensors (Apogee Instruments, Logan, Utah). Concentrations of ammonia (NH3; mg L−1), nitrite (NO2; mg L−1), nitrate (NO3; mg L−1), and orthophosphate (OP; mg L−1) were analyzed with an AQ300 discrete nutrient analyzer (SEAL Analytical, Mequon, WI, USA). Total carbon (TC; mg L−1), total inorganic carbon (TIC; mg L−1), total organic carbon (TOC; mg L−1), and total nitrogen (TN; mg L−1) were measured with a Vario TOC cube (Elementar, Ronkonkoma, NY, USA).
E. coli enumeration was based on EPA method 1603 [14]. Briefly, 50 to 150 mL of pond water was filtered, depending on turbidity, through a 0.45 μm filter (EMD Millipore, Burlington, MA, USA) which was then aseptically transferred onto Petri dishes with modified mTEC media (BD Difco, Sparks, MD, USA). Agar plates with filters were then incubated at 22 °C for 2 h followed by incubation for 22 h at 45 °C. After incubation, purple colonies were counted as E. coli. All samples were filtered in duplicate, and counts were then averaged.
3. Data Analysis
Two-way analysis of variance (ANOVA) was performed to analyze the differences in mean concentrations of E. coli by time of day and depth layer, and to assess the interactions between the factors. Spearman correlation coefficients (rs) were computed for measurements of E. coli concentrations and water quality variables using point measurements at different times of the day and sampling depths. All statistical analysis was performed using the R programming language [15]. The statistical significance was assessed at the α = 0.05 level. Figures were created with Sigmaplot v13 (Systat Software, San Jose, CA, USA), and maps were made with QGIS v3.18.2
4. Results and Discussion
Figure 1, Figure 2 and Figure 3 show the E. coli concentration at each of the three times of day and at different sampling depths for Ponds P1, P2, and P3, respectively. The concentrations of E. coli in all three ponds were low, in accordance with what has been observed in previous studies at these locations [13,16,17], and were generally lower than 20 CFU 100 mL−1 on most sampling dates. The highest concentrations were recorded in P3 on 12 August 2020 (Figure 3 and Supplementary Tables S1–S3), which were several times higher than concentrations found at the other ponds throughout the experiment. Overall, the concentrations in the surface at all ponds in this study fell within the ranges reported by other researchers of irrigation ponds in the U.S. Mid-Atlantic [5,18] and Southeast [6,8]. Several other researchers have reported much higher average concentrations of E. coli measured in irrigation ponds. In those studies, the effects of recent precipitation were used as an explanation for this observation [4,19,20]. Very low concentrations reported in this study may be due to the intentional separation of sampling dates from dates of recent precipitation events because we were trying to characterize the conditions in which a need to irrigate would arise. An additional factor may be that there were no domestic animals present, or animal manures applied on the adjacent lands, which was verified with the farm owners and/or operators of the sites used in this study. Several studies have documented animal presence as a major factor for the deterioration of microbial water quality, especially after precipitation events [21,22,23,24].
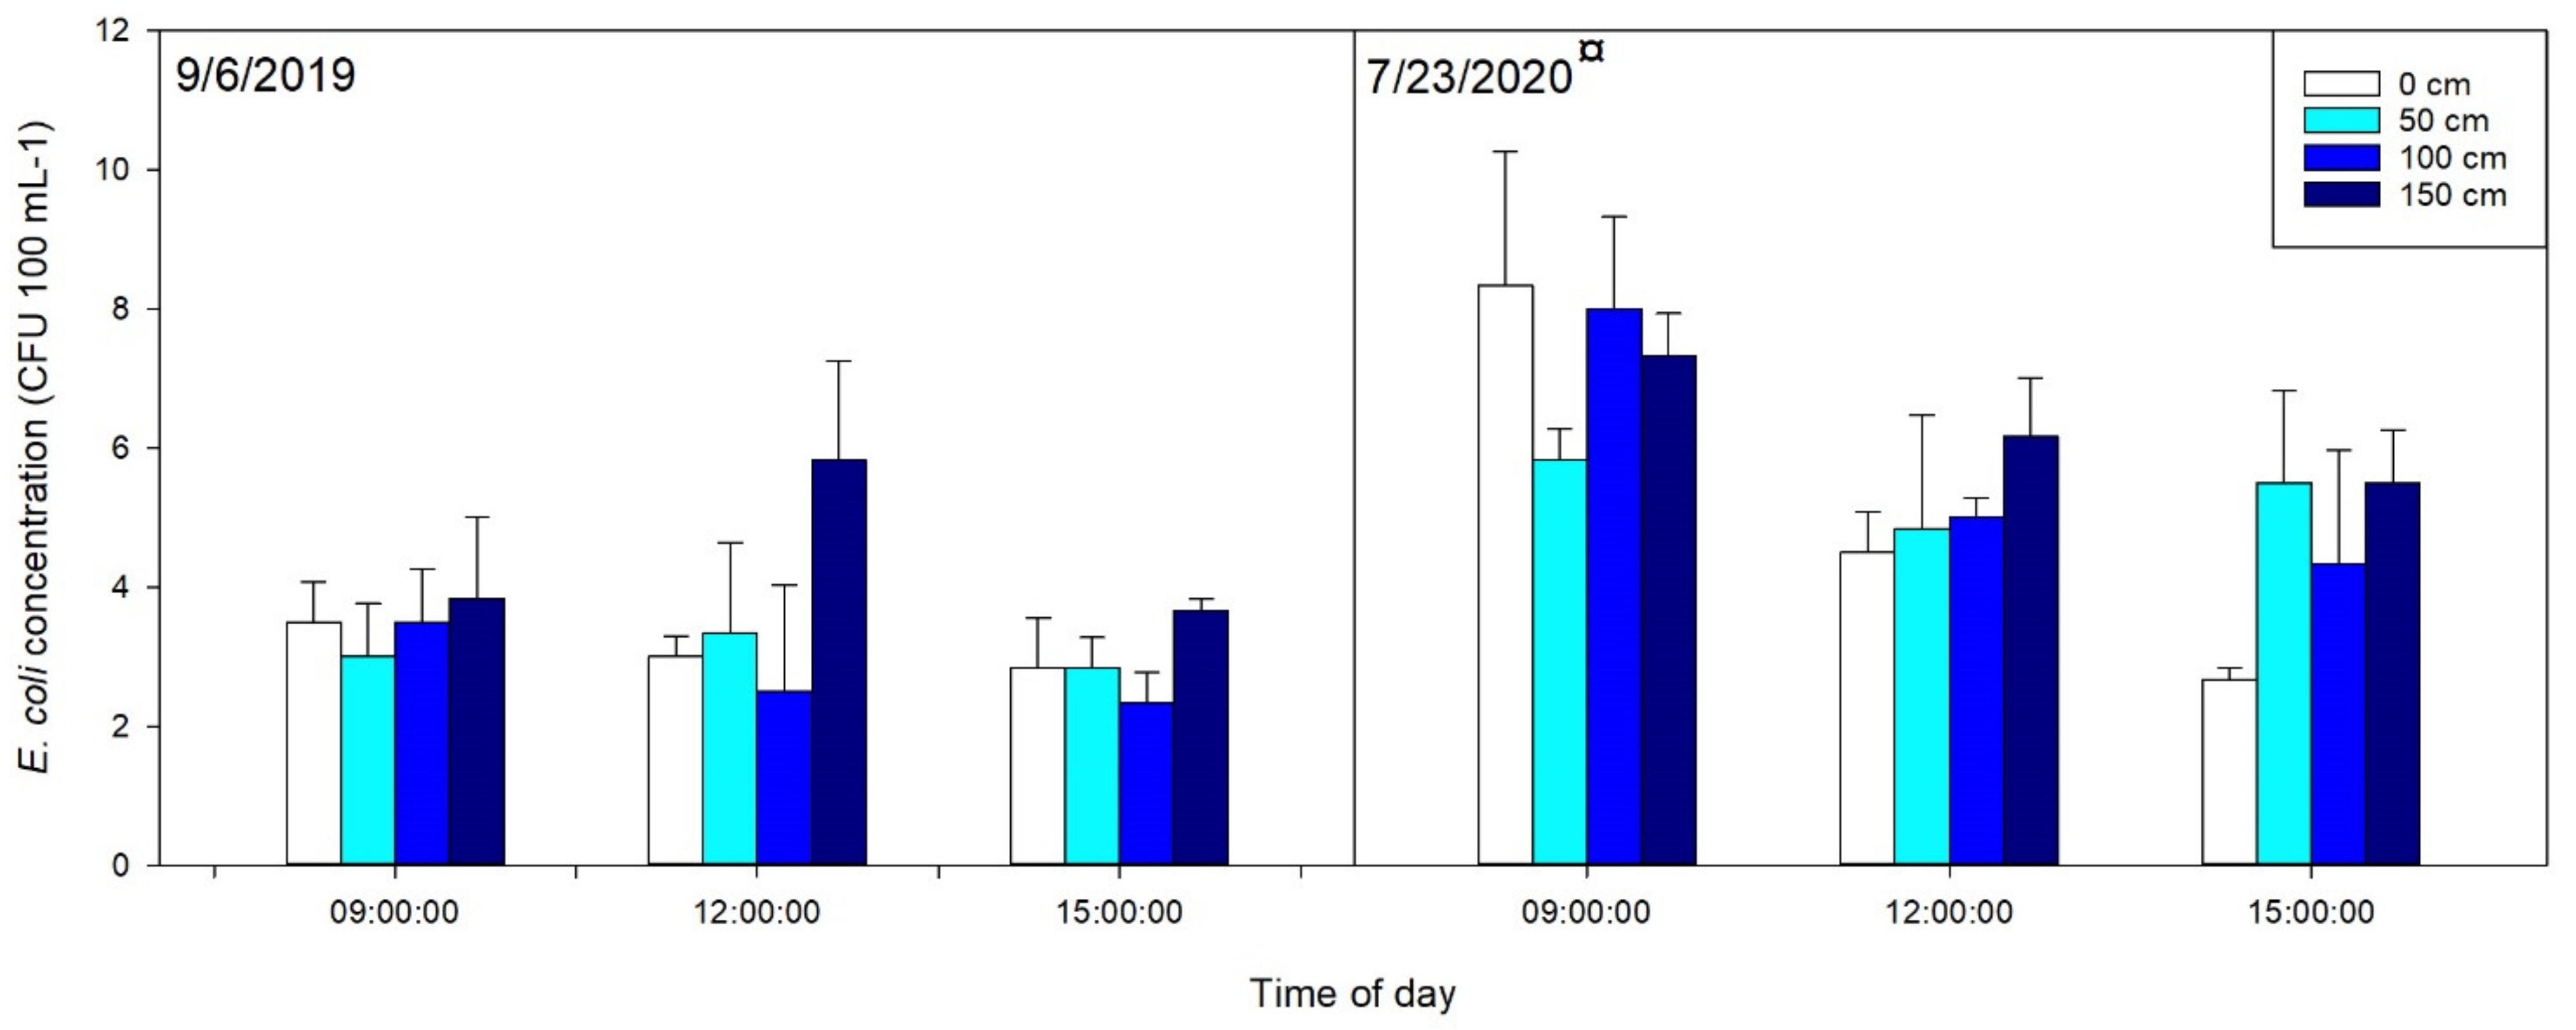
E. coli concentrations at different sampling depths in P1 were very similar (Figure 1). ANOVA testing confirmed that depth was not a significant factor for either sampling date (Table 1). The sampling time was found to be a significant factor on 23 July 2020, and a steady decrease in concentrations was observed from 9:00 to 15:00. Significant diurnal reductions in fecal microorganism concentrations have been reported in the Great Lakes [25,26], in streams [27,28,29], mangroves [30], coastal waters [31,32], and irrigation canals [33]. Common factors explaining observed diurnal trends are increases in solar radiation and temperature from morning to afternoon, which promote the inactivation of fecal microorganisms in water [33,34].
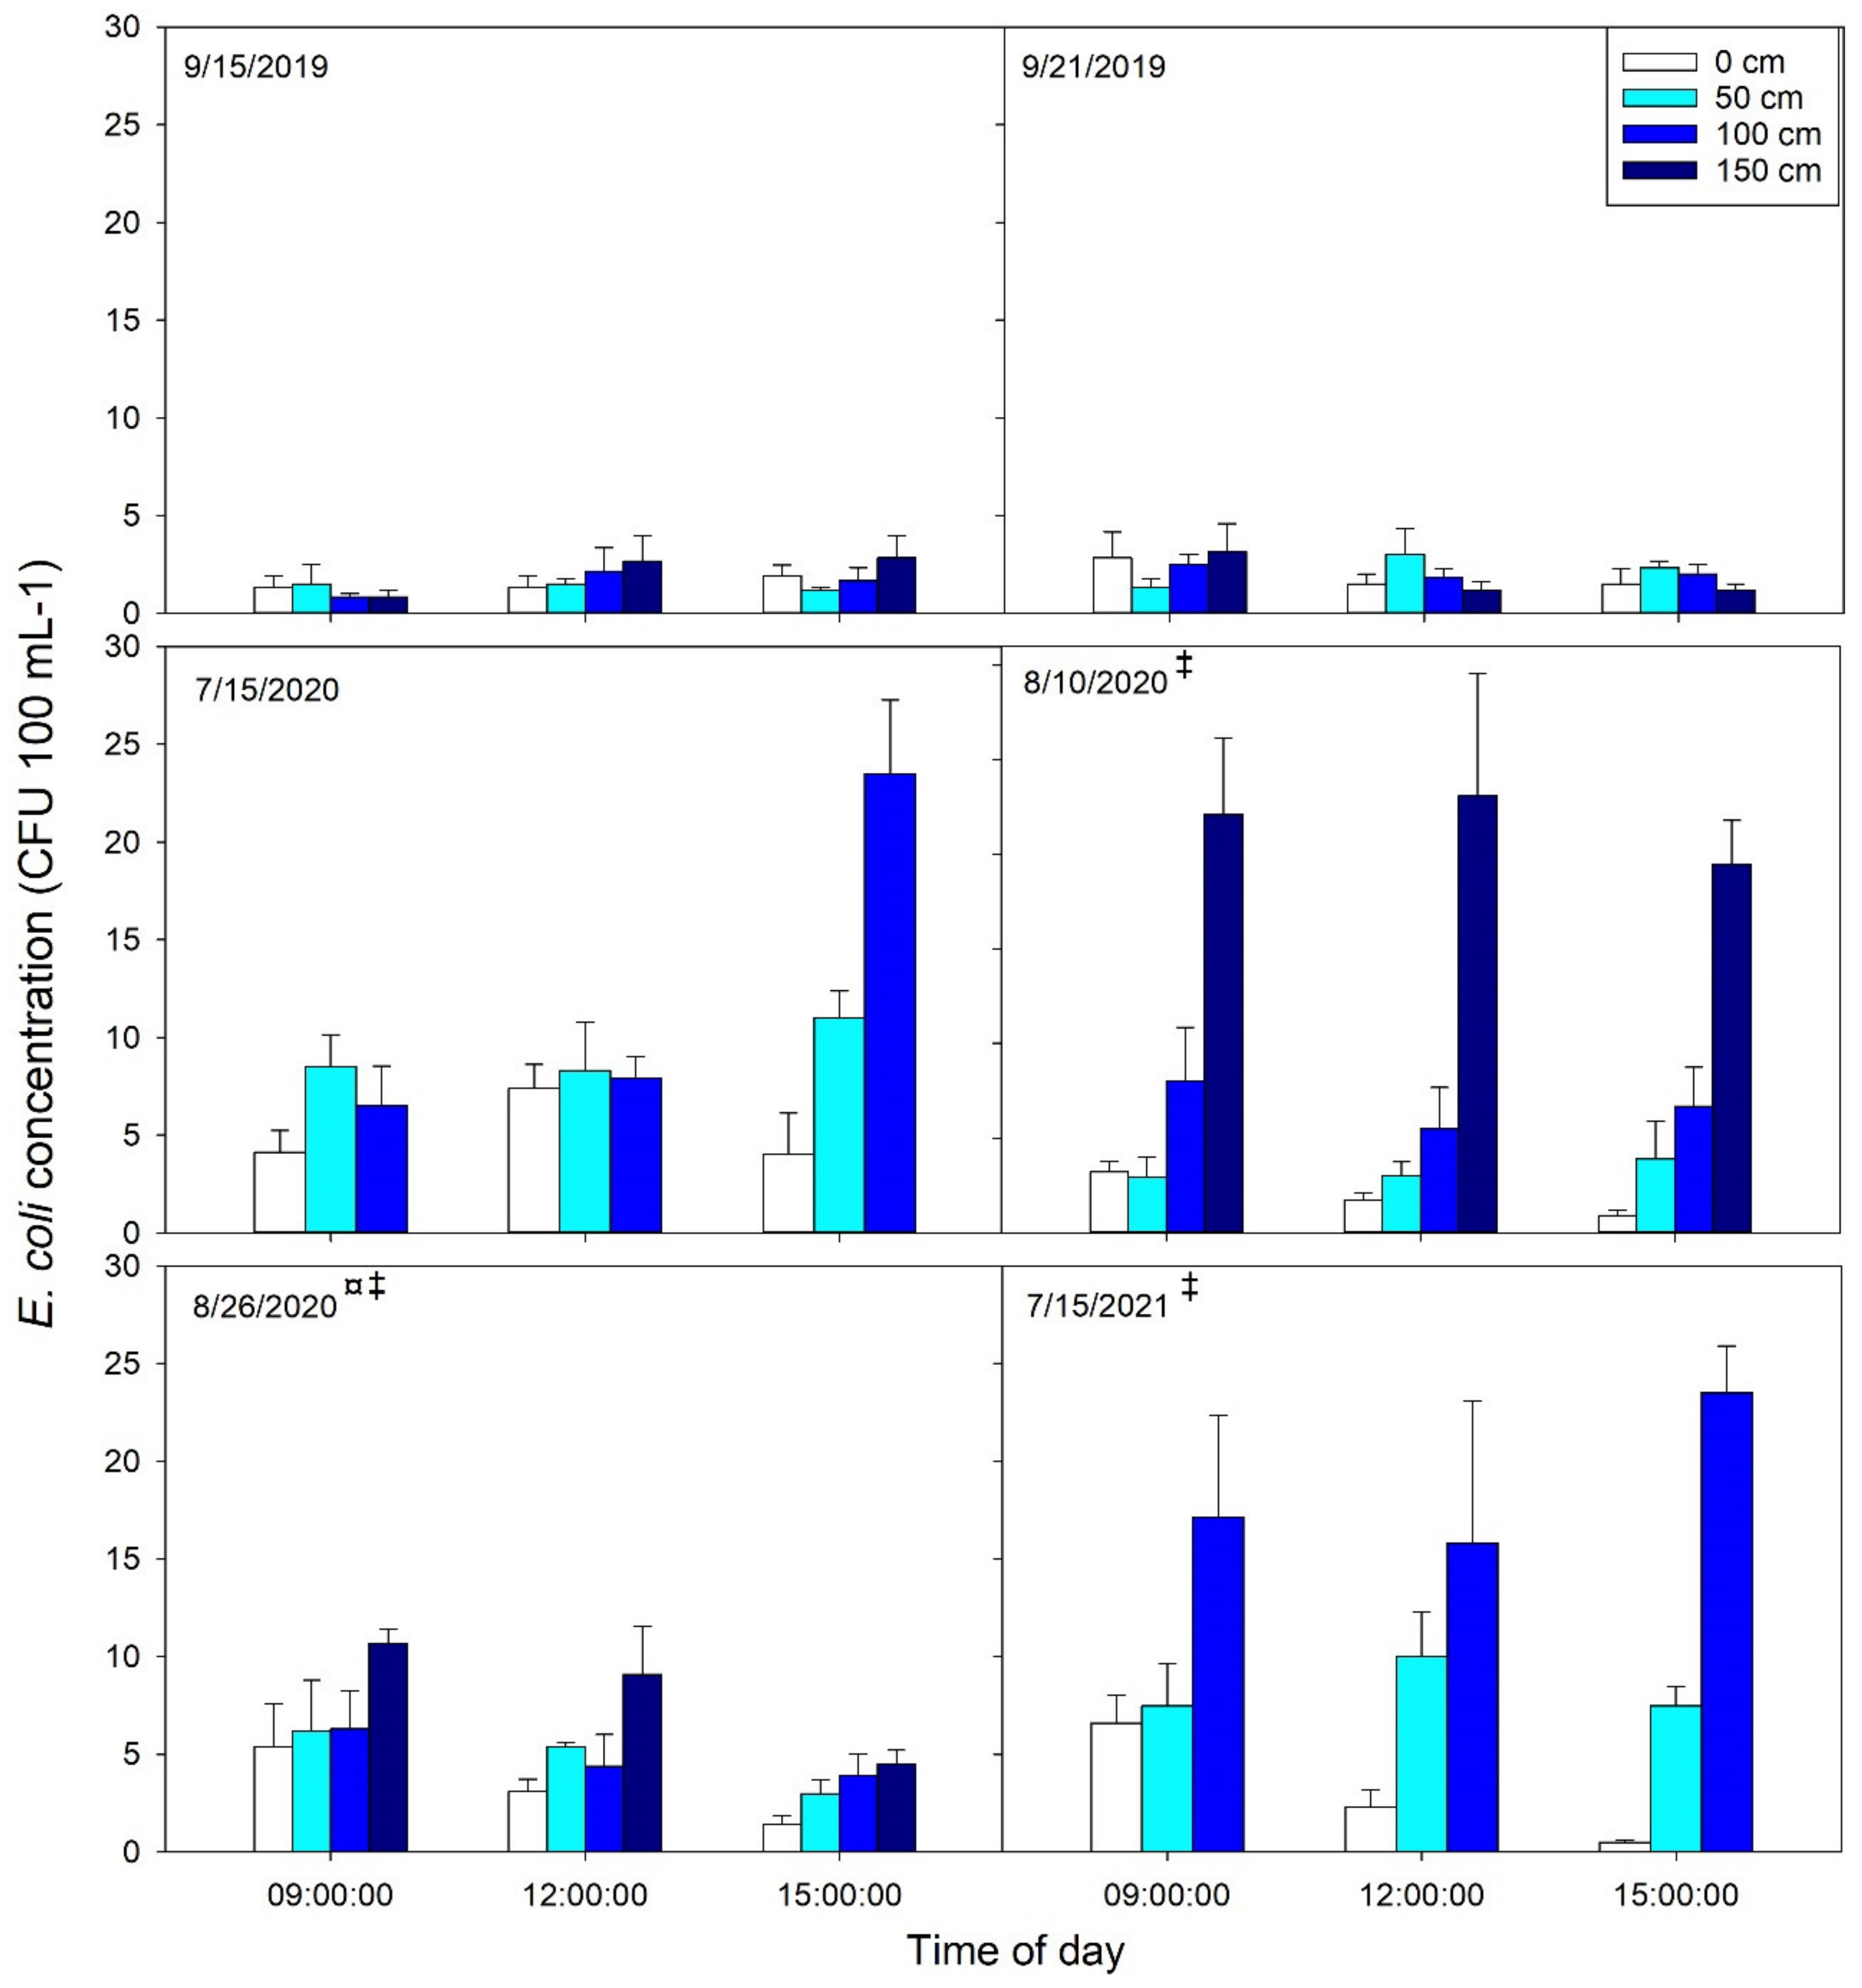
At P2 during the 2019 sampling dates, the concentrations of E. coli were near the detection limit (1 CFU 100 mL−1) (Figure 2). At this study site, only one date exhibited a significant temporal trend (26 August 2020) of a decrease in concentrations at each sampling time from 9:00 to 15:00. Depth was not a significant factor at P2 during the first three sampling dates, although on 15 July 2020, during the 15:00 sampling time, the concentration at the 100 cm depth was twice as high as the 50 cm depth and about six times as high as the surface water. On the 10 August 2020, 26 August 2020, and 15 July 2021 sampling dates at P2, the depth was a significant factor of variation, with E. coli concentrations increasing with sampling depth.
Information on differences in E. coli concentrations by depth in agricultural irrigation ponds is extremely scarce. In only two studies have authors taken samples from multiple depths; these studies were conducted in the same region of the United States. Antaki et al. [8] sampled two irrigation ponds in Southern Georgia and found conflicting results. In one pond, the levels of E. coli and Salmonella were roughly 31 and 4 times greater, respectively, at a 1 m depth compared with the surface water. At the second pond, E. coli and Salmonella were 0.5 and 6 times lower, respectively, at the surface depth than at the 1 m depth. In the second study, Lee et al. [7] sampled six irrigation ponds in Georgia and found nearly identical concentrations and prevalence of Salmonella spp. at the surface and 50 cm water sampling depth.
E. coli survival in water has been shown to be greater at depth than near the surface. For example, Jenkins et al. [35] studied E. coli O157:H7, commensal E. coli, and intestinal enterococci persistence in in situ microcosms placed in an irrigation pond. In their study, the time for a tenfold decrease in the concentrations of all the studied microorganisms was significantly greater at the 50 cm depth than the 5 cm depth, which the authors attributed primarily to higher solar radiation at the surface water depth. Similarly, Maiga et al. [36] studied E. coli and enterococci survival in microcosms built to simulate wastewater ponds and found no difference between bacterial persistence at the 10 cm and 90 cm depths in dark conditions. However, when the microcosms were exposed to sunlight, the inactivation at the 10 cm depth was significantly greater than at 90 cm. These findings agree with Mayo et al. [37], who showed that the tenfold decrease time in coliform concentrations in maturation pond water took 21, 90, and 150 h at depths of 0, 15, and 100 cm, respectively.
Concentrations of E. coli at larger depths may be related to the proximity to pond sediments. Sediments are reservoirs of fecal microorganisms in aquatic systems [38,39]. Additionally, the hyporheic exchange of fecal microorganisms has been demonstrated in streams [40,41]. However, so far, there are no reports quantifying this flux in pond waters. Determining the influence of E. coli cells originating from the sediment on the microbial quality of pond waters appears to be an interesting avenue for future research.
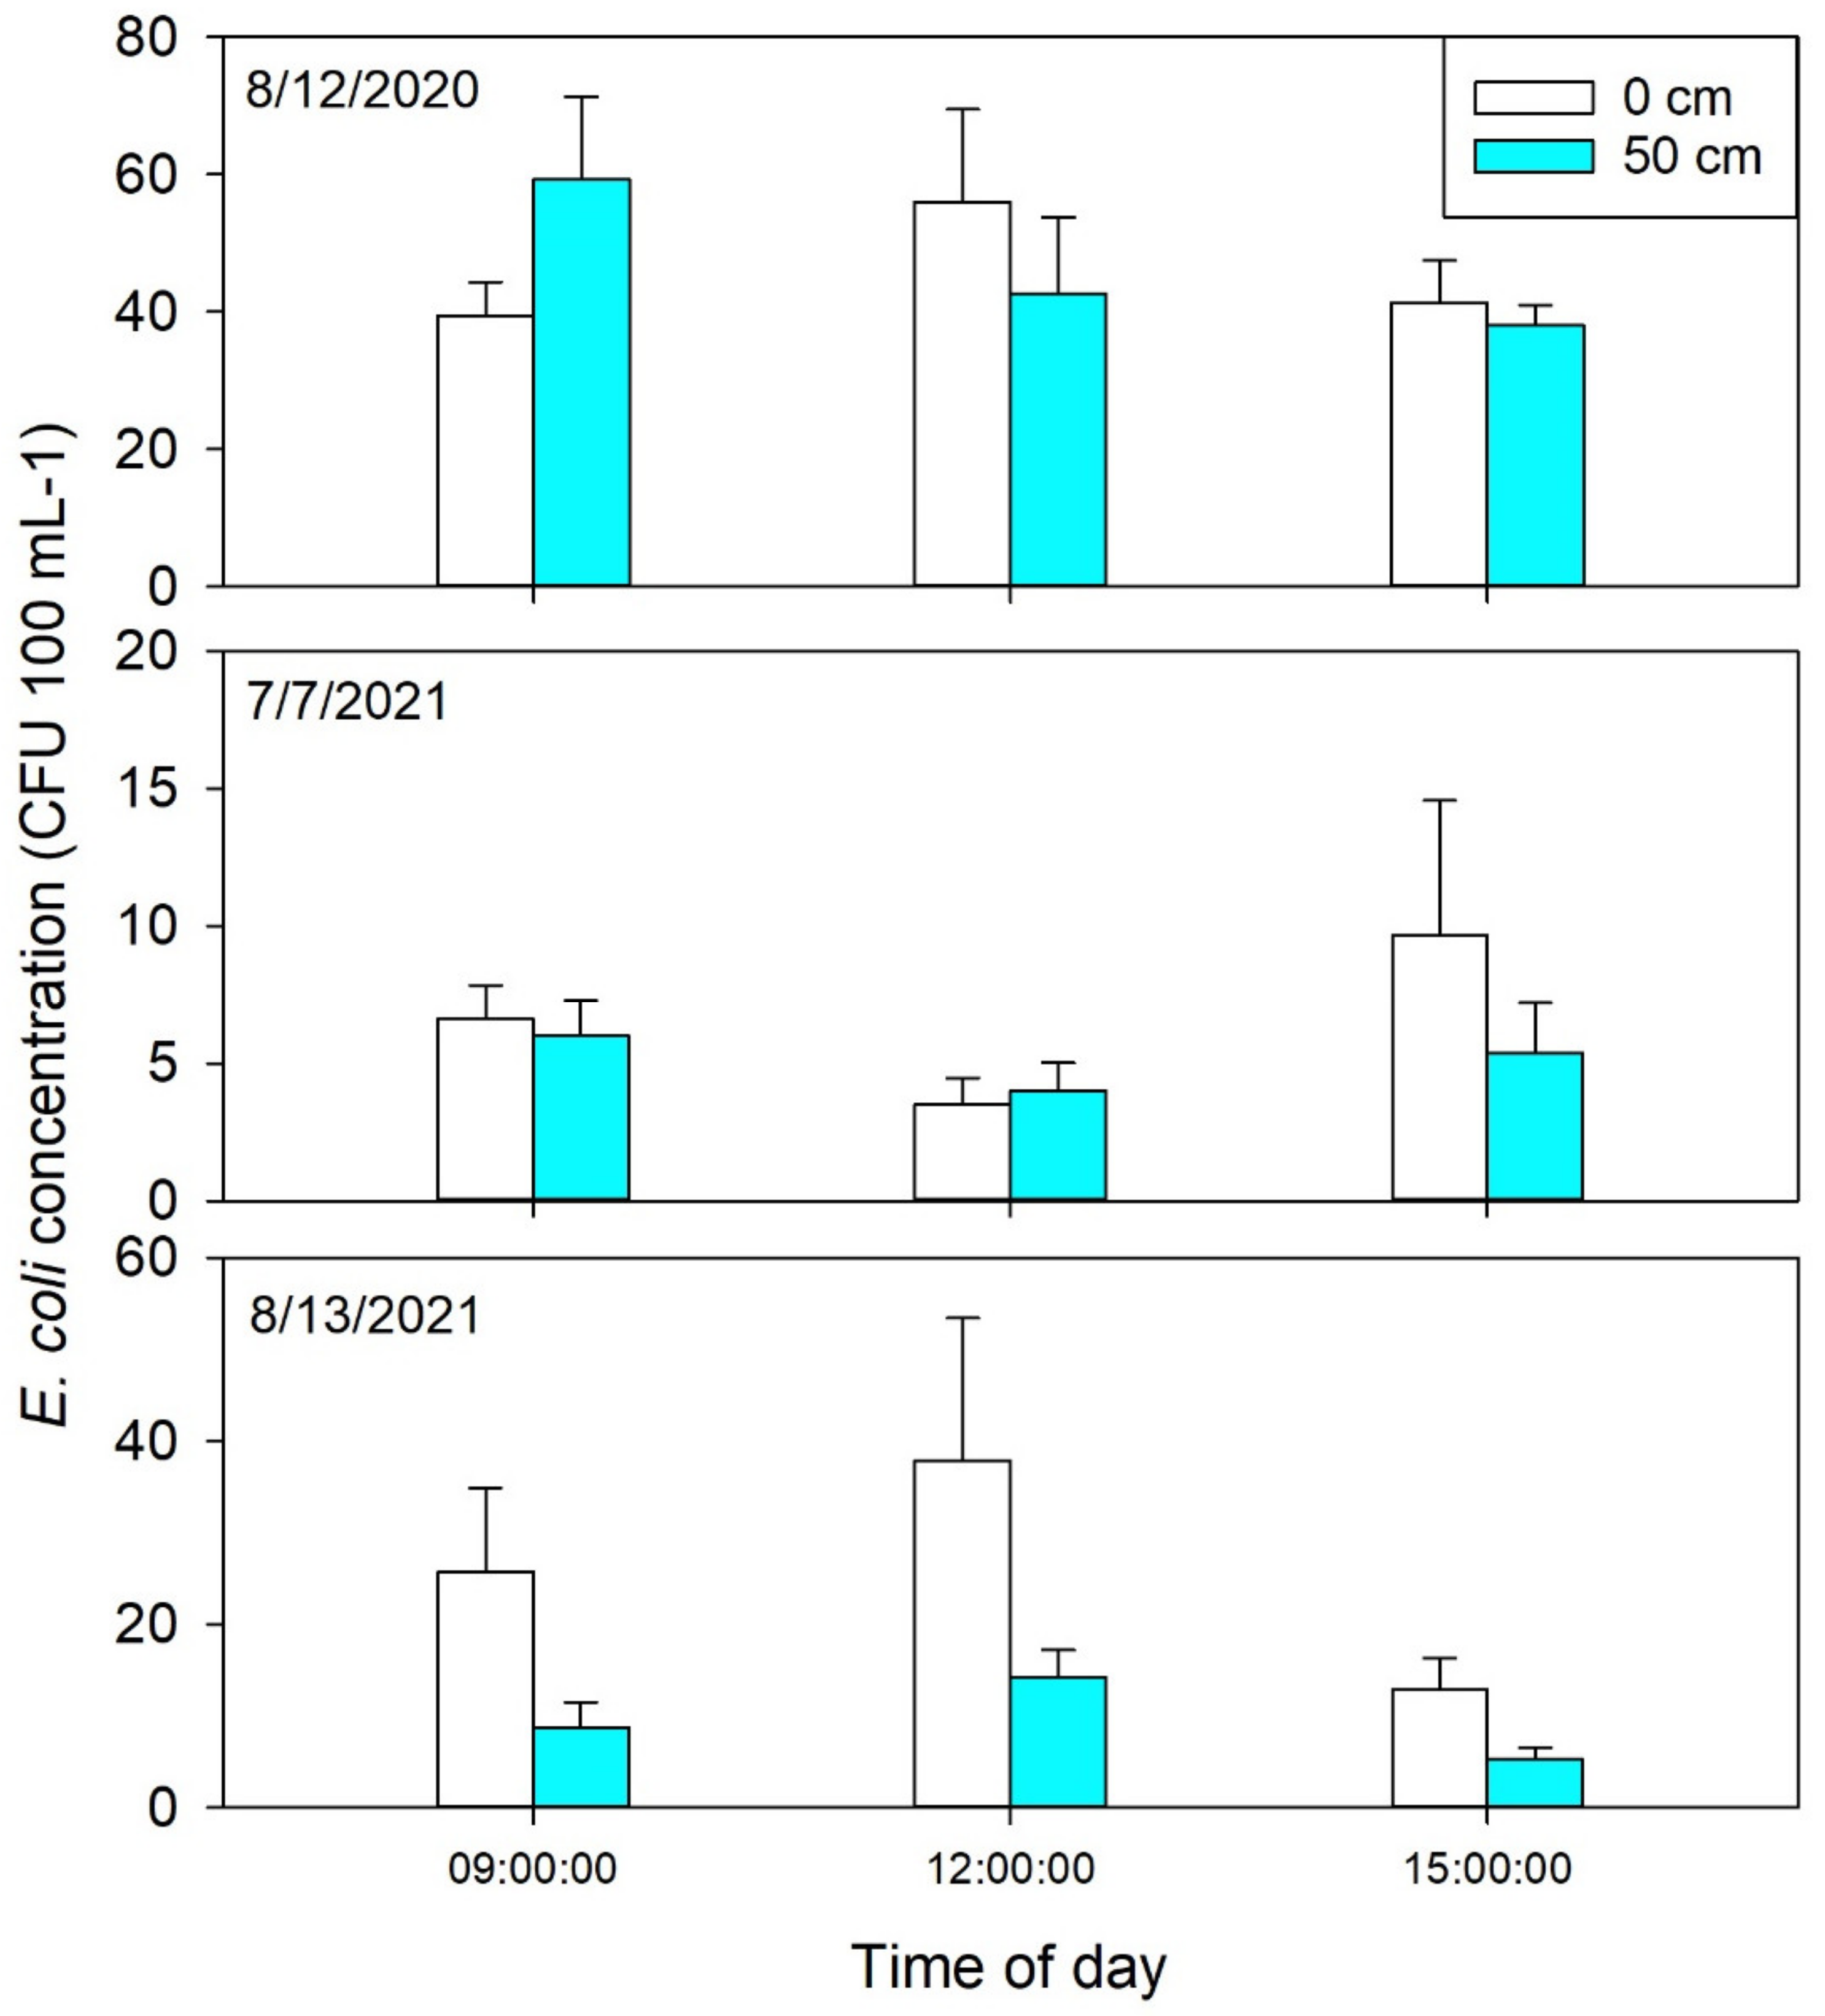
The P3 pond did not show significant differences by depth or time of day on any of the three sampling dates (Table 1). In most cases, concentrations were higher at the surface than at depth (Figure 3). He et al. [42] reported uniformly distributed E. coli and fecal coliform concentrations in pond water at depths up to 1.2 m and found higher concentrations at depths exceeding this value. The authors attributed this to thermal gradients, which may inhibit the vertical movement of water and establish the stratification of microorganism concentrations. The shallowness of this pond appears to have prevented gradient formation. Supplementary Tables S1–S3 show the water quality parameter values in all three ponds by date, time of day, and depth. Absent gradients in water quality parameter values may also have been the case in the studies by Antaki et al. [8] and Lee et al. [7], although it is also possible that these authors did not sample deep enough for E. coli concentrations to be affected by vertical gradients in parameters such as temperature, light penetration, or dissolved oxygen.
The strength and signs of correlation coefficients of E. coli concentrations and water quality parameters varied by parameter, pond, and date (Supplementary Figure S2). However, some water parameters showed consistency in the relationships with E. coli concentrations: pH, °C, PAR, and DO were negatively correlated with E. coli on 91%, 82%, 73%, and 73% of observation dates, respectively. TC, TOC, CHL, and PC were negatively correlated on 55% to 57% of observation dates. Conversely, NTU exhibited positive relationships with E. coli concentrations in 100% of sampling dates. Orthophosphate and NH3 (71% of cases), NO3 (60%), FDOM (73%), TIC (57%), and SPC (64%) were also shown to exhibit mostly positive relationships; however, it should be noted that percentages for some parameters are high because of the relatively few dates on which they were measured (e.g., NO3) (Supplementary Figure S2).
The strongest correlations were observed primarily on dates in which E. coli concentrations were found to significantly differ either by the time of day, depth, or both (Supplementary Figure S2). For example, in P1, on 23 July 2020, E. coli concentrations were found to significantly differ by time of day; on this date, 7 of the 16 water quality parameters were found to contain significant associations with E. coli. Similarly, in P2, the 10 August 2020, 26 August 2020, and 15 July 2021 dates were shown to contain significantly different concentrations of E. coli by depth; on these dates, 8, 7, and 15 parameters were significantly related to E. coli concentrations, respectively. Conversely, on dates not showing significant effects of time of day or depth, typically only three or fewer parameters were ever found to be significantly associated with the E. coli concentrations.
The results of studies focusing on wastewater, stabilization, or maturation ponds may apply to irrigation ponds whereby the factors that govern fecal microorganism concentrations are primarily pH, dissolved oxygen, temperature, and UV radiation levels [43,44,45]. However, as this study shows, the effect of these factors appears to be not only site-specific, but also date-specific, whereby both strong and weak correlations are observed at the same ponds but at different sampling dates. Concentrations of E. coli in the ponds on the first P1 and first three P2 sampling dates were possibly too low to demonstrate significant relationships with water quality parameters. On the other hand, in P3, which contained the highest concentrations, very few significant associations were found. This observation in P3 may be the result of an overall similarity of water quality parameters between the 0 and 50 cm sampling depths (Table S3), which held true for almost all parameters except for PC, CHL, and PAR, with the former two typically showing large increases with depth, and the latter showing large decreases. Altogether, these observations may support the supposition that if there are no substantial gradients in water quality parameters, then E. coli concentrations may also be expected not to show large differences by the time of day or by sampling depth.
More work is needed to relate changes in water quality parameters controlling the E. coli habitat in irrigation ponds. Additionally, it would be worthwhile to identify and sample irrigation ponds that contain higher E. coli concentrations than those utilized in this study to evaluate whether concentration gradients proportional to those observed in this study can be expected. The E. coli concentrations assessed in this study were below the FSMA PSR thresholds; therefore, it would also be interesting to see if higher concentrations in ponds by depth could affect regulatory compliance depending on where in the water column the sample is taken. Future work is needed to evaluate the effects of time of day and depth at a wider range of irrigation ponds in terms of depth and overall size in order to better generalize the results of this study.
Vertical gradients of E. coli concentrations in ponds have been shown to affect the temporal variation in water withdrawn for irrigation [46]. Gaining more information on vertical concentration gradients will improve our ability to forecast the microbial quality of water withdrawn for irrigation and perform effective monitoring exercises that best characterize the true risk of using an irrigation source. Ultimately, the authors agree with Enns et al. [47], who concluded that sampling at different times of the day and at different depths can significantly impact microbial monitoring results and may lead to differing management decisions.
5. Conclusions
This was the first study performed which examined E. coli concentrations in irrigation ponds at several depths and throughout multiple time points of a day. Overall, low concentrations of E. coli were observed in each of the ponds and absolute differences in concentrations between different times of day or by depth were not substantial. However, statistical testing revealed significant differences in both the sampling time of day and by depth at various observation dates: in Pond 2 three of the six sampling dates showed significant differences in E. coli concentrations by depth, whereas one of the six showed the time of day to be a significant factor. In several observation dates at Pond 2, the concentrations in the lowest layer were found to be several times higher than what was measured at the surface. In Ponds 1 and 3, significant differences in concentrations by depth were not observed, but in one of the two Pond 1 observation dates, the time of day was found to be a significant factor. This study demonstrates the possibility for the formation of vertical E. coli concentration gradients in irrigation ponds and suggests that monitoring programs should be expanded to include sampling at greater water depths that better represent the water being removed for irrigation.
Supplementary Materials
The following supporting information can be downloaded at https://www.mdpi.com/article/10.3390/w14142276/s1, Figure S1: Sampling map of the three ponds in the study. Sampling sites are marked with blue dots. Ephemeral and constant inflows are marked with dashed and solid green arrows, respectively. Ephemeral and constant outflows are marked with dashed and solid orange arrows, respectively, Figure S2: Spearman correlation coefficients (rs) between concentrations of E. coli and water quality parameters. Observation dates in which E. coli concentrations were found to significantly differ by either time of day, water sampling depth, or both are shown in bold, Tables S1–S3: Measured water quality parameters by pond, date, depth, and time of day.
Author Contributions
Data curation—M.D.S. and J.E.S., Formal analysis—M.D.S., J.E.S. and Y.A.P., Investigation—M.D.S. and J.E.S., Methodology—M.D.S. and J.E.S., Writing—original draft—M.D.S. and Y.A.P., Funding acquisition—Y.A.P., Project administration—Y.A.P. All authors have read and agreed to the published version of the manuscript.
Funding
This work was supported through the USDA’s Agricultural Research Service project number 8042-12630-011-00D.
Data Availability Statement
The data shown in the text and supplementary document are currently under a 2-year hold as part of MDS’s doctoral dissertation. As of May 2024, all data will be publicly available. Requests for data before then can be made to the corresponding author, who will work with requestees in order to share the maximum allowable content.
Acknowledgments
We would like to acknowledge the invaluable field and laboratory assistance of Lauren Wyatt-Brown as well as the advisory role of Robert L. Hill.
Conflicts of Interest
The authors declare no conflict of interest.
References
- Food and Drug Administration (FDA). FSMA Final Rule on Produce Safety: Standards for the Growing, Harvesting, Packing, and Holding of Produce for Human Consumption. 2016. Available online: http://www.fda.gov/Food/GuidanceRegulation/FSMA/ucm334114.htm (accessed on 30 May 2022).
- U.S. Environmental Protection Agency (U.S. EPA). Sampling and Consideration of Variability (Temporal and Spatial) for Monitoring of Recreational Waters. EPA-823-R-10-005; U.S. EPA Office of Water: Washington, DC, USA, 2010.
- McEgan, R.; Mootian, G.; Goodridge, L.D.; Schaffner, D.W.; Danyluk, M.D. Predicting Salmonella populations from biological, chemical, and physical indicators in Florida surface waters. Appl. Environ. Microbiol. 2013, 79, 4094–4105. [Google Scholar] [CrossRef] [PubMed] [Green Version]
- Topalcengiz, Z.; Strawn, L.K.; Danyluk, M.D. Microbial quality of agricultural water in Central Florida. PLoS ONE 2017, 12, e0174889. [Google Scholar] [CrossRef] [PubMed]
- Solaiman, S.; Allard, S.M.; Callahan, M.T.; Jiang, C.; Handy, E.; East, C.; Haymaker, J.; Bui, A.; Craddock, H.; Murray, R.; et al. Longitudinal assessment of the dynamics of Escherichia coli, total coliforms, Enterococcus spp., and Aeromonas spp. in alternative irrigation water sources: A CONSERVE Study. Appl. Environ. Microbiol. 2020, 86, e00342-20. [Google Scholar] [CrossRef] [PubMed]
- Luo, Z.; Gu, G.; Ginn, A.; Giurcanu, M.C.; Adams, P.; Vellidis, G.; van Bruggen, A.H.; Danyluk, M.D.; Wright, A.C. Distribution and characterization of Salmonella enterica isolates from irrigation ponds in the Southeastern United States. Appl. Environ. Microbiol. 2015, 81, 4376–4387. [Google Scholar] [CrossRef] [Green Version]
- Lee, D.; Tertuliano, M.; Vellidis, G.; Harris, C.; Grossman, M.K.; Rajeev, S.; Levy, K. Evaluation of grower-friendly, science-based sampling approaches for the detection of Salmonella in ponds used for irrigation of fresh produce. Foodborne Pathog. Dis. 2018, 15, 627–636. [Google Scholar] [CrossRef]
- Antaki, E.M.; Vellidis, G.; Harris, C.; Aminabadi, P.; Levy, K.; Jay-Russell, M.T. Low concentration of Salmonella enterica and generic Escherichia coli in farm ponds and irrigation distribution systems used for mixed produce production in Southern Georgia. Foodborne Pathog. Dis. 2016, 13, 551–558. [Google Scholar] [CrossRef]
- NRCS. Ponds—Planning, Design, Construction. Natural Resource Conservation Service. United States Department of Agriculture. 1997. Available online: https://nrcspad.sc.egov.usda.gov/distributioncenter/product.aspx?ProductID=115 (accessed on 23 January 2022).
- Dias, D.F.C.; Passos, R.G.; Von Sperling, M. A review of bacterial indicator disinfection mechanisms in waste stabilisation ponds. Rev. Environ. Sci. Bio/Technol. 2017, 16, 517–539. [Google Scholar] [CrossRef]
- Davis, K.; Anderson, M.; Yates, M.V. Distribution of indicator bacteria in Canyon Lake, California. Water Res. 2005, 39, 1277–1288. [Google Scholar] [CrossRef]
- Partyka, M.L.; Bond, R.F.; Chase, J.A.; Atwill, E.R. Spatiotemporal variability in microbial quality of western U.S. agricultural water supplies: A multistate study. J. Environ. Qual. 2018, 47, 939–948. [Google Scholar] [CrossRef]
- Stocker, M.D.; Pachepsky, Y.A.; Smith, J.E.; Morgan, B.J.; Hill, R.L.; Kim, M. Persistent patterns of E. coli concentrations in two irrigation ponds from 3 years of monitoring. Water Air Soil Pollut. 2021, 232, 492. [Google Scholar] [CrossRef]
- U.S. Environmental Protection Agency (U.S. EPA). Method 1603: Escherichia coli (E. coli) in Water by Membrane Filtration Using Modified Membrane-Thermotolerant Escherichia coli Agar (Modified mTEC. EPA-821-R-04-025); U.S. Environmental Protection Agency, Office of Water: Washington, DC, USA, 2005.
- R Core Team. R: A Language and Environment for Statistical Computing; R Foundation for Statistical Computing: Vienna, Austria, 2021; Available online: https://www.R-project.org/ (accessed on 23 January 2022).
- Pachepsky, Y.; Kierzewski, R.; Stocker, M.; Sellner, K.; Mulbry, W.; Lee, H.; Kim, M. Temporal stability of Escherichia coli concentrations in waters of two irrigation ponds in Maryland. Appl. Environ. Microbiol. 2018, 84, 1876–1893. [Google Scholar] [CrossRef] [Green Version]
- Stocker, M.D.; Smith, J.E.; Hernandez, C.; Macarisin, D.; Pachepsky, Y. Seasonality of E. coli and enterococci concentrations in creek water, sediment, and periphyton. Water Air Soil Pollut. 2019, 230, 223. [Google Scholar] [CrossRef]
- Truitt, L.N.; Vazquez, K.M.; Pfuntner, R.C.; Rideout, S.L.; Havelaar, A.H.; Strawn, L.K. Microbial quality of agricultural water used in produce preharvest production on the Eastern Shore of Virginia. J. Food Prot. 2018, 81, 1661–1672. [Google Scholar] [CrossRef]
- Steele, M.; Mahdi, A.; Odumeru, J. Microbial assessment of irrigation water used for production of fruit and vegetables in Ontario, Canada. J. Food Prot. 2005, 68, 1388–1392. [Google Scholar] [CrossRef]
- Pahl, D.M.; Telias, A.; Newell, M.; Ottesen, A.R.; Walsh, C.S. Comparing source of agricultural contact water and the presence of fecal indicator organisms on the surface of ‘Juliet’ grape tomatoes. J. Food Prot. 2013, 76, 967–974. [Google Scholar] [CrossRef]
- Swallow, M.; Huffman, J.; Van Why, K.; D’Angelo, G. The effect of goose management on water quality. In Proceedings of the Vertebrate Pest Conference, Sacramento, CA, USA, 22–25 February 2010; Volume 24. [Google Scholar]
- Gu, G.; Luo, Z.; Cevallos-Cevallos, J.M.; Adams, P.; Vellidis, G.; Wright, A.; van Bruggen, A.H. Factors affecting the occurrence of Escherichia coli O157 contamination in irrigation ponds on produce farms in the Suwannee River Watershed. Can. J. Microbiol. 2013, 59, 175–182. [Google Scholar] [CrossRef]
- Kleinheinz, G.T.; McDermott, C.M.; Hughes, S.; Brown, A. Effects of rainfall on E. coli concentrations at Door County, Wisconsin beaches. Int. J. Microbiol. 2009, 2009, 876050. [Google Scholar] [CrossRef] [Green Version]
- Rodrigues, C.; da Silva, A.L.B.R.; Dunn, L.L. Factors impacting the prevalence of foodborne pathogens in agricultural water sources in the southeastern United States. Water 2019, 12, 51. [Google Scholar] [CrossRef] [Green Version]
- Whitman, R.L.; Nevers, M.B.; Korinek, G.C.; Byappanahalli, M.N. Solar and temporal effects on Escherichia coli concentration at a Lake Michigan swimming beach. Appl. Environ. Microbiol. 2004, 70, 4276–4285. [Google Scholar] [CrossRef] [Green Version]
- Ge, Z.; Whitman, R.L.; Nevers, M.B.; Phanikumar, M.S.; Byappanahalli, M.N. Nearshore hydrodynamics as loading and forcing factors for Escherichia coli contamination at an embayed beach. Limnol. Oceanogr. 2012, 57, 362–381. [Google Scholar] [CrossRef] [Green Version]
- Traister, E.; Anisfeld, S.C. Variability of indicator bacteria at different time scales in the upper Hoosic River watershed. Environ. Sci. Technol. 2006, 40, 4990–4995. [Google Scholar] [CrossRef]
- Lenart-Boroń, A.; Wolanin, A.; Jelonkiewicz, Ł.; Chmielewska-Błotnicka, D.; Żelazny, M. Spatiotemporal variability in microbiological water quality of the Białka river and its relation to the selected physicochemical parameters of water. Water Air Soil Pollut. 2016, 227, 22. [Google Scholar] [CrossRef]
- Stocker, M.D.; Rodriguez-Valentin, J.G.; Pachepsky, Y.A.; Shelton, D.R. Spatial and temporal variation of fecal indicator organisms in two creeks in Beltsville, Maryland. Water Qual. Res. J. Can. 2016, 51, 167–179. [Google Scholar] [CrossRef]
- Becker, C.C.; Weber, L.; Suca, J.J.; Llopiz, J.K.; Mooney, T.A.; Apprill, A. Microbial and nutrient dynamics in mangrove, reef, and seagrass waters over tidal and diurnal time scales. Aquat. Microb. Ecol. 2020, 85, 101–119. [Google Scholar] [CrossRef]
- Boehm, A.B.; Grant, S.B.; Kim, J.H.; Mowbray, S.L.; McGee, C.D.; Clark, C.D.; Wellman, D.E. Decadal and shorter period variability of surf zone water quality at Huntington Beach, California. Environ. Sci. Technol. 2002, 36, 3885–3892. [Google Scholar] [CrossRef]
- Boehm, A.B.; Weisberg, S.B. Tidal forcing of enterococci at marine recreational beaches at fortnightly and semidiurnal frequencies. Environ. Sci. Technol. 2005, 39, 5575–5583. [Google Scholar] [CrossRef]
- Lothrop, N.; Bright, K.R.; Sexton, J.; Pearce-Walker, J.; Reynolds, K.A.; Verhougstraete, M.P. Optimal strategies for monitoring irrigation water quality. Agric. Water Manag. 2018, 199, 86–92. [Google Scholar] [CrossRef] [Green Version]
- Maraccini, P.A.; Mattioli, M.C.M.; Sassoubre, L.M.; Cao, Y.; Griffith, J.F.; Ervin, J.S.; Van De Werfhorst, L.C.; Boehm, A.B. Solar inactivation of enterococci and Escherichia coli in natural waters: Effects of water absorbance and depth. Environ. Sci. Technol. 2016, 50, 5068–5076. [Google Scholar] [CrossRef]
- Jenkins, M.B.; Fisher, D.S.; Endale, D.M.; Adams, P. Comparative die-off of Escherichia coli 0157: H7 and fecal indicator bacteria in pond water. Environ. Sci. Technol. 2011, 45, 1853–1858. [Google Scholar] [CrossRef]
- Maïga, Y.; Wethe, J.; Denyigba, K.; Ouattara, A.S. The impact of pond depth and environmental conditions on sunlight inactivation of Escherichia coli and enterococci in wastewater in a warm climate. Can. J. Microbiol. 2009, 55, 1364–1374. [Google Scholar] [CrossRef]
- Mayo, A.W.; Noike, T. Response of mixed cultures of Chlorella vulgaris and heterotrophic bacteria to variation of pH. Water Sci. Technol. 1994, 30, 285. [Google Scholar] [CrossRef]
- Jamieson, R.C.; Joy, D.M.; Lee, H.; Kostaschuk, R.; Gordon, R.J. Resuspension of sediment-associated Escherichia coli in a natural stream. J. Environ. Qual. 2005, 34, 581–589. [Google Scholar] [CrossRef] [PubMed]
- Cho, K.H.; Pachepsky, Y.A.; Kim, J.H.; Guber, A.K.; Shelton, D.R.; Rowland, R. Release of Escherichia coli from the bottom sediment in a first-order creek: Experiment and reach-specific modeling. J. Hydrol. 2010, 391, 322–332. [Google Scholar] [CrossRef]
- Grant, S.B.; Litton Mueller, R.M.; Ahn, J.H. Measuring and modeling the flux of fecal bacteria across the sediment water interface in a turbulent stream. Water Resour. Res. 2011, 47, W05517. [Google Scholar] [CrossRef] [Green Version]
- Pachepsky, Y.; Stocker, M.; Saldaña, M.O.; Shelton, D. Enrichment of stream water with fecal indicator organisms during baseflow periods. Environ. Monit. Assess. 2017, 189, 51. [Google Scholar] [CrossRef]
- He, J.; Vale, C.; Chu, A. Variation in Water Quality of a Stormwater Pond from Diurnal Thermal Stratification. J. Water Resour. Hydraul. Eng. 2015, 4, 181–190. [Google Scholar] [CrossRef]
- Ouali, A.; Jupsin, H.; Ghrabi, A.; Vasel, J.L. Removal kinetic of Escherichia coli and enterococci in a laboratory pilot scale wastewater maturation pond. Water Sci. Technol. 2014, 69, 755–759. [Google Scholar] [CrossRef]
- Liu, L.; Hall, G.; Champagne, P. The role of algae in the removal and inactivation of pathogenic indicator organisms in wastewater stabilization pond systems. Algal Res. 2020, 46, 101777. [Google Scholar] [CrossRef]
- Park, J.B.; Weaver, L.; Davies-Colley, R.; Stott, R.; Williamson, W.; Mackenzie, M.; McGill, E.; Lin, S.; Webber, J.; Craggs, R.J. Comparison of faecal indicator and viral pathogen light and dark disinfection mechanisms in wastewater treatment pond mesocosms. J. Environ. Manag. 2021, 286, 112197. [Google Scholar] [CrossRef]
- Stocker, M.; Jeon, D.; Sokolova, E.; Lee, H.; Kim, M.; Pachepsky, Y. Accounting for the Three-Dimensional Distribution of Escherichia coli Concentrations in Pond Water in Simulations of the Microbial Quality of Water Withdrawn for Irrigation. Water 2020, 12, 1708. [Google Scholar] [CrossRef]
- Enns, A.A.; Vogel, L.J.; Abdelzaher, A.M.; Solo-Gabriele, H.M.; Plano, L.R.; Gidley, M.L.; Phillips, M.C.; Klaus, J.S.; Piggot, A.M.; Feng, Z.; et al. Spatial and temporal variation in indicator microbe sampling is influential in beach management decisions. Water Res. 2012, 46, 2237–2246. [Google Scholar] [CrossRef] [Green Version]
Figure 1.
E. coli concentrations measured at Pond 1 on two observation dates. Error bars show standard errors. Dates followed by the symbols ¤ and ‡ indicate statistical significance of the time of day and/or sampling depth, respectively, as a factor as determined by the two-way ANOVA.
Figure 1.
E. coli concentrations measured at Pond 1 on two observation dates. Error bars show standard errors. Dates followed by the symbols ¤ and ‡ indicate statistical significance of the time of day and/or sampling depth, respectively, as a factor as determined by the two-way ANOVA.

Figure 2.
Concentrations of E. coli measured at Pond 2 during the observation dates. Error bars show the standard error of the mean. Dates followed by the symbols ¤ and ‡ indicate statistical significance of the time of day and/or sampling depth, respectively, as a factor as determined by the two-way ANOVA.

Figure 3.
Concentrations of E. coli by sampling depth in Pond P3. Error bars show the standard error of the mean. Dates followed by the symbols ¤ and ‡ indicate statistical significance of the time of day and/or sampling depth, respectively, as a factor as determined by the two-way ANOVA.
Figure 3.
Concentrations of E. coli by sampling depth in Pond P3. Error bars show the standard error of the mean. Dates followed by the symbols ¤ and ‡ indicate statistical significance of the time of day and/or sampling depth, respectively, as a factor as determined by the two-way ANOVA.


Table 1.
Summary of two-way analysis of variance (ANOVA) testing with sampling depth and time of day as factors.
Table 1.
Summary of two-way analysis of variance (ANOVA) testing with sampling depth and time of day as factors.
| Site | Date | Time | Depth | Interaction |
|---|---|---|---|---|
| Pond 1 | 9/6/2019 | 0.321 | 0.368 | 0.861 |
| Pond 1 | 7/23/2020 | 0.000 | 0.183 | 0.859 |
| Pond 2 | 9/15/2019 | 0.087 | 0.274 | 0.128 |
| Pond 2 | 9/21/2019 | 0.433 | 0.822 | 0.374 |
| Pond 2 | 7/15/2020 | 0.494 | 0.336 | 0.987 |
| Pond 2 | 8/10/2020 | 0.579 | 0.000 | 0.748 |
| Pond 2 | 8/26/2020 | 0.002 | 0.028 | 0.788 |
| Pond 2 | 7/15/2021 | 0.529 | 0.001 | 0.393 |
| Pond 3 | 8/12/2020 | 0.632 | 0.621 | 0.271 |
| Pond 3 | 7/7/2021 | 0.270 | 0.554 | 0.840 |
| Pond 3 | 8/13/2021 | 0.182 | 0.098 | 0.733 |
Note: Values in bold indicate statistical significance at the (p = 0.05) level.
Publisher’s Note: MDPI stays neutral with regard to jurisdictional claims in published maps and institutional affiliations. |
© 2022 by the authors. Licensee MDPI, Basel, Switzerland. This article is an open access article distributed under the terms and conditions of the Creative Commons Attribution (CC BY) license (https://creativecommons.org/licenses/by/4.0/).
Share and Cite
MDPI and ACS Style
Stocker, M.D.; Smith, J.E.; Pachepsky, Y.A. Depth-Dependent Concentrations of E. coli in Agricultural Irrigation Ponds. Water 2022, 14, 2276. https://doi.org/10.3390/w14142276
AMA Style
Stocker MD, Smith JE, Pachepsky YA. Depth-Dependent Concentrations of E. coli in Agricultural Irrigation Ponds. Water. 2022; 14(14):2276. https://doi.org/10.3390/w14142276
Chicago/Turabian StyleStocker, Matthew D., Jaclyn E. Smith, and Yakov A. Pachepsky. 2022. "Depth-Dependent Concentrations of E. coli in Agricultural Irrigation Ponds" Water 14, no. 14: 2276. https://doi.org/10.3390/w14142276
Note that from the first issue of 2016, this journal uses article numbers instead of page numbers. See further details here.