Article

Evaluation of Microalgal Bacterial Dynamics in Pig-Farming Biogas Digestate under Impacts of Light Intensity and Nutrient Using Physicochemical Parameters

1
Vietnam Academy of Science and Technology, Graduate University of Sciences and Technology, 18 Hoang Quoc Viet, Cau Giay, Hanoi 100000, Vietnam
2
Department of Water-Environment-Oceanography, University of Science and Technology of Hanoi, Vietnam Academy of Science and Technology, 18 Hoang Quoc Viet, Cau Giay, Hanoi 100000, Vietnam
3
Institute of Environmental Technology, Vietnam Academy of Science and Technology, 18 Hoang Quoc Viet, Cau Giay, Hanoi 100000, Vietnam
4
Institute for Tropical Technology, Vietnam Academy of Science and Technology, 18 Hoang Quoc Viet, Cau Giay, Hanoi 100000, Vietnam
5
Le Quy Don Technical University, 236 Hoang Quoc Viet, Bac Tu Liem, Hanoi 100000, Vietnam
6
Institute of Natural Product Chemistry (INPC), Vietnam Academy of Science and Technology, 18 Hoang Quoc Viet, Cau Giay, Hanoi 100000, Vietnam
*
Authors to whom correspondence should be addressed.
Water 2022, 14(14), 2275; https://doi.org/10.3390/w14142275
Submission received: 16 June 2022 / Revised: 11 July 2022 / Accepted: 19 July 2022 / Published: 21 July 2022
(This article belongs to the Special Issue Biotechnology Applications in Water and Wastewater Treatment)

Abstract

:
Determination of the dynamics between microalgae and bacteria in pig farming biogas digestate is vital for a consistent and reliable application towards sustainable wastewater treatment and biofuel production. This study assesses the reliability of using physicochemical parameters as indicators for the rapid evaluation of microalgal bacterial dynamics in real digestate under impacts of light, nutrient loads, and N:P ratios. The relationship between variation profiles of nutrients, biomass and physicochemical properties in each experiment was analyzed. High light and high nutrient load enhanced biomass growth and nutrient removal rate. Ammonium addition (high N:P ratio) elevated NH3 level which inhibited the growth of microalgae, subsequently reducing the biomass growth and nutrient removal. Low N:P ratio triggered the accumulation of phosphorus and the growth of chlorophyll-a but exerted little influence on treatment. Variation profiles of dissolved oxygen, nutrient and biomass were highly consistent in every experiment allowing us to identify the shift from microalgal to bacterial predomination under unfavorable conditions including low light intensity and high N:P ratio. Strong linear correlation was also found between total nitrogen removal and electrical conductivity (R2 = 0.9754). The results show the great potential of rapid evaluation of microalgal bacterial dynamics for large scale system optimization and modelling.

1. Introduction

Wastewater from pig farming has become a serious environmental threat in many developing countries. In the East and Southeast Asian regions, pig farming consumes 88.0% of the total livestock water requirement and emits significant amounts of nutrients to water systems, posing a considerable risk of eutrophication [1]. Ineffective management, especially in small-scale pig farming, has resulted in discernible nutrient surpluses ranging from 48 to 75 g N kg−1 pork and 4 to 9 g P kg−1 pork for nitrogen (N) and phosphorous (P), respectively [2]. In small-scale pig farming, biogas digesters are used as the only wastewater treatment method prior to environment discharge [3]. Due to its inefficient treatment, digestate released from biogas digesters contain high levels of nutrients, up to 698–3355 mg N L−1 of total nitrogen (TN) and 14.4–107.8 mg P L−1 of total phosphorus (TP) [4]. This nutrient-rich biogas digestate can be a cause of eutrophication but at the same time a source of nutrients to grow microalgae for biofuel production [5,6].
The use of microalgal biomass as energy-rich material for biofuel production has been widely recognized [7]. In comparison with other conventional energy crops, microalgae showed competitive advantages such as year-round production with high areal productivities (20–33 t ha−1 yr−1), cultivation in non-arable land as well as low land requirement, and high lipid (4–35%) or carbohydrate (15–64%) accumulation thus resulting to high biofuel yield (24–137 m3 ha−1 yr−1) [8]. The role of microalgae in wastewater treatment has also long been acknowledged [9,10] especially in tertiary treatment systems such as waste stabilization and aerobic ponds [11]. Via symbiotic cooperation with bacteria in wastewater, microalgae consumes and hence enhances the removal of nutrients in tandem with pathogens [12] and heavy metals [13]. During photosynthesis, microalgae offer oxygen to heterotrophic bacteria to oxidize organic pollutants while using carbon dioxide released from aerobic respiration, thus reducing the energy consumption and pollutant volatilization risk of the wastewater treatment process [10]. In other words, microalgae help improve the wastewater treatment efficiency. In this context, microalgae have been deployed in many wastewater treatment systems for the dual purposes of enhanced treatment efficiency and biomass production to underpin sustainable biofuels production [14].
In combined microalgae wastewater treatment processes, the harmonious interactions between microalgae and bacteria play a vital role. On one hand, the cooperation between microalgae and bacteria enhances microbial growth and hence the process performance [15]. It has been indicated that synergistic symbiosis between microalgae and bacteria in raw pig farming wastewater could increase the biomass concentration from 33.3% to 72.2%, therefore elevating NH4+-N and PO43−-P removal efficiencies from 12.8% and 35.7% to 99.5% and 96.1%, respectively, comparing to axenic algal cultures [16]. The incorporation between those micro-organisms has also improved the settling ability of algal biomass, thus facilitating its harvest [17]. On the other hand, algal bacterial interactions in wastewater are highly dynamic and susceptible to external factors. For example, nutrient concentration and grazer were reported as the main causes (accounting for 80%) of variation in algal community structure in outdoor cultivation [18]. Rapid turnover (typically less than one week) in algal population structure and number of cells has also been observed in laboratory photobioreactors [19]. Notably, the relative amount of microalgae versus bacteria in wastewater could impact the system performance and the growth of algal biomass [20,21]. Therefore, monitoring the dynamics between microalgae and bacteria in wastewater is crucial for a consistent and reliable system in real applications regarding wastewater treatment and biomass production. Recent studies on combined microalgae wastewater treatment, however, have mainly focused on removal of different pollutants or general biomass production while little attention has been paid to the dynamics of microalgae and bacteria in wastewater.
Using mathematical models has been one approach to understanding the dynamics between microalgae and bacteria in combined microalgae wastewater treatment [22]. Recent models that comprise basic physical and biokinetic parameters have successfully simulated the growth of microalgae and bacteria in wastewater whereby complex interactions between nutrient amount, dissolved oxygen (DO), pH, and microbial biomass occur [23,24]. Despite these achievements, more efforts are required to improve the simulation in terms of hydrodynamics and light attenuation or gas transfer in the algal bacterial system, and to provide more comprehensive experimental data on real combined microalgae wastewater treatment [25].
The other approach to studying algal–bacterial dynamics relies on experimental data obtained in respirometers inoculated with microalgae and bacteria [26]. Under strictly controlled conditions, the impacts of light intensity, temperature, or nutrient sources on the growth of microalgae and bacteria can be quantified accurately [27]. This approach provides an independent measurement of biological activity of microalgae and bacteria and hence overcomes the uncertainty derived from model calibration without reliable experimental data [28]. However, it exhibits limited applicability in real combined microalgae wastewater treatment systems due to its rigorous requirements for controlling external factors.
Constant monitoring of physicochemical parameters including dissolved oxygen (DO), pH, or oxidation-reduction potential (ORP) has shown great potential in the real-time control of the bioprocesses in wastewater treatment facilities [29]. Via analysis of the link between nutrient variation profiles and the profiles variation of DO, pH and ORP, it has been pointed out that the treatment processes could be followed with high accuracy by monitoring those indirect parameters [30]. In systems employing microalgae and bacteria, until recently, the potential of using DO and pH variation profiles for monitoring treatment performance has been investigated [31]. It has also been reported that complete removal of ammonium in the reactor could be detected via a sudden sharp increase in both DO and pH profiles (known as a DO breakpoint or an Ammonia valley, respectively) while the appearance of high peaks in DO, pH and ORP profiles under maximum irradiance suggested the end of a treatment cycle due to the complete removal of Chemical Oxygen Demand (COD) and Total Kjeldahl Nitrogen (TKN) [32]. In terms of microalgal bacteria dynamics evaluation, a recent study has indicated that constant monitoring of DO in open raceway ponds allowed the calculation of the general oxygen production rate (OPR) and oxygen uptake rate (OUR) which have direct links to the growth of microalgae and bacteria in wastewater [33]. Nevertheless, the evaluation of microalgal bacterial dynamics in wastewater using physicochemical parameters still requires further investigation, especially under the impacts of crucial factors on their growth such as nutrient concentration, light intensity or N:P ratio [12].
This study aims to investigate the use of physicochemical parameters including DO, pH and Electrical Conductivity (EC) for evaluating the dynamics between microalgae and bacteria in real pig farming biogas digestate under the impacts of light intensity, nutrient concentration and N:P ratio. For this purpose, lab-scale experiments were carried out using batch reactor inoculated with axenic microalgae and digestate from a pig farming biogas reactor. Relationship between wastewater characteristics, biomass growth and profiles of DO, pH and EC were analyzed to provide insight into the interactions between microalgae and bacteria and shed light on the reliability of the physicochemical parameters as indicators for microalgal bacterial dynamics evaluation under these conditions.

2. Materials and Methods

Laboratory scale experiments were conducted under different conditions of light intensity, nutrient concentration and N:P ratio. In previous studies on the application of microalgae in wastewater treatment, real wastewater was commonly used as bacterial inoculum and nutrient supply [34]. This approach allows for the study of the interactions between microalgae, bacteria and wastewater under similar conditions to real cases. Therefore, real pig-farming biogas digestate was used in this study.

2.1. Biogas Digestate and Microalgae Inoculation

The digestate was collected at the outlet of an underground biogas digester receiving waste from a household pig farm located in Yen So Commune, Hoai Duc District, Hanoi, Vietnam. After collection, the digestate was settled overnight and then filtered with filter paper (pore size of 20–25 µm) to remove large, suspended matters while remaining its major bacterial community. The filtered digestate was then used as cultural medium for microalgae and as bacterial inoculum. To achieve different nutrient loads for the experiments, the filtered digestate was diluted with tap water. The initial characteristics of the raw and the 5- and 10-times diluted filtered digestate are provided in Table 1.
Microalgae Chlorella vulgaris has been widely recognized due to its adaptability to different wastewater types and hence recommended in systems combining wastewater treatment and biofuel production [7]. In this study, the axenic strain Chlorella vulgaris obtained from the Department of Environmental Hydrobiology, Institute of Environmental Technology, Vietnam Academy of Science and Technology, Hanoi, Vietnam was used as microalgal inoculum. The Chlorella vulgaris was enriched in CB medium to reach the stationary growth phase with biomass concentration of 66.0 ± 16.1 mg L−1 before use in all experiments.

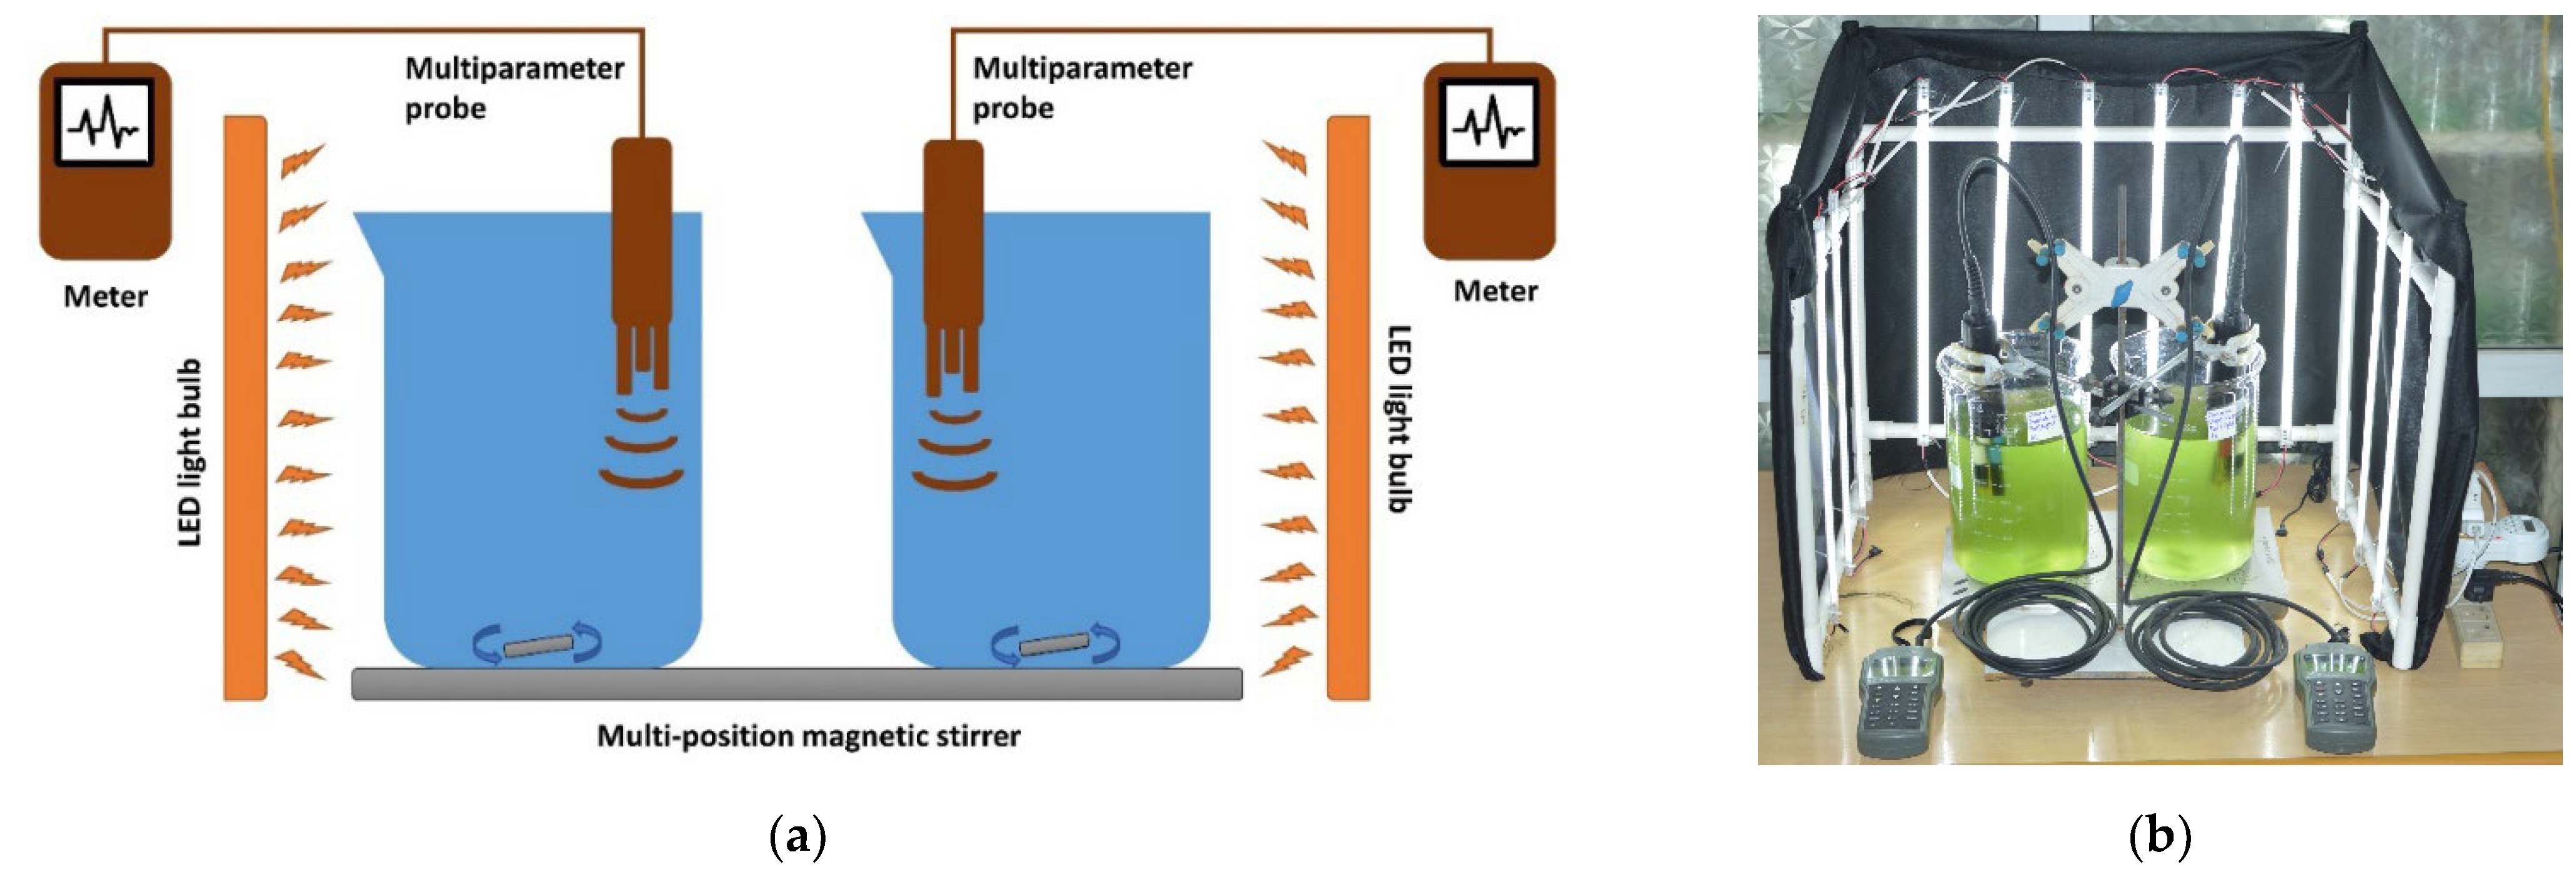
2.2. Experimental Setup

Each experiment was conducted in a 5 L glass cylindrical beaker (26.5 cm of height and 18 cm of diameter, Bomex, Shanghai, China) with a working volume of 4.5 L (Figure 1). All experiments were operated in batch mode for 14 days under laboratory condition with temperature of 27.3 ± 2.9 °C. This temperature level is close to the optimal range (28–35 °C) for algal growth [35], ensuring minor adverse impacts on the experiments. Proper mixing was ensured by a magnetic stirrer at 400 rpm without mechanical aeration, allowing materials to be evenly distributed in the beaker, avoiding negative impact of stagnant zone. Constant illumination was obtained from 12 cool white light LEDs (LED Hard Tube Strip 2835 SMD 220 V, 6500 K, Hanoi, Vietnam) positioned 10 cm away from the beakers in vertical direction (Figure 1). Light intensity was controlled by plugging a fixed number of LEDs. A photoperiod of 14 h light:10 h dark was applied in every experiment, which was suggested to improve microalgal growth [36]. Two levels of light intensity were applied including 12.7 ± 3.1 and 5.9 ± 2.5 μE s−1 m−2 for high and low levels (p value < 0.05), respectively. Although the light intensities applied in this study were at low level comparing to other studies [37], positive impact of low light level on increasing microalgal chlorophyll content was suggested [38].
Different nutrient loads were applied by diluting filtered digestate with tap water at various ratios (Table 2). For each experiment, 1 L of axenic culture microalgae was mixed with 0.8 L or 0.4 L of filtered digestate and then 2.2 L or 2.6 L tap water to obtain 5- or 10-times diluted digestate, respectively. Besides light intensity and nutrient load, the impact of extreme N:P ratios in the digestate on the dynamics of microalgae and bacteria was also studied. Desired ratios of N:P were achieved by modifying the level of NH4+-N or PO43−-P in a reactor, which are the most dominant form of N and P in pig farming biogas digestate [4]. At the beginning of the experiment, 3.06 g L−1 of NH4Cl (200 mg N L−1 of NH4+-N) (99.8%, Merck, Germany) or 0.26 g L−1 of KH2PO4 (15 mg P L−1 of PO43−-P) (99.5%, Merck, Germany) were added to each reactor. Both chemicals were commonly used as nitrogen [39] and phosphorus [40] sources for culturing microalgae, respectively. As a result, the N:P ratio was modified from an original value of 22.1 ± 3.4, within the optimal range of 10–30 for algal growth [12] to a high value of 53.2 and a low value of 4.2, indicating phosphorus and nitrogen limitations, respectively. Overall, in this study, 6 experiments were conducted in 3 stages (Table 2), in which two experiments with different nutrient loads or N:P ratios were conducted while light intensity remained constant.

2.3. Sample Collection and Analytical Procedure

Sample collection was performed every working day to assess the treatment performance of microalgae and bacteria and obtain the variation profile of nutrient and biomass in each experiment. At 9 a.m., a volume of 100 mL of well mixed liquid was drawn from the beaker, filtered by nitrate cellulose filters paper of 0.45 μm porosity and analyzed for ammonium nitrogen (NH4+-N) (manual spectrometric method, ISO 7150-1:1984), nitrate nitrogen (NO3-N) (spectrometric method using sulfosalicylic acid, ISO 7890-3:1988), nitrite nitrogen (NO2-N) (molecular absorption spectrometric method, ISO 6777:1984) and orthophosphate (PO43−-P) (ammonium molybdate spectrometric method, ISO 6878:2004). Chemical oxygen demand (COD) (colorimetric method, SMEWW 5220D:2012), total nitrogen (TN) (catalytic digestion after reduction with Devarda’s alloy method, ISO 10048:1991) and total phosphorus (TP) (ascorbic acid method, SMEWW 4500P C:2012) were analyzed every 2 days (3 times per week). The growth of microalgae and bacteria in digestate was followed everyday by a measure of the total suspended solids (TSS) (ISO 11923:1997) and chlorophyll-a (Chl-a) following spectrophotometric method [41].
Variation profile of dissolved oxygen (DO), pH, electrical conductivity (EC), and water temperature were obtained by recording data every 30 s at the middle point of the beaker along vertical direction using a multiparameter meter (HI98194, Hanna Instruments, Hungary). The probes were positioned on one side to avoid biomass clogging and obstruction to the flow due to agitation (Figure 1).

2.4. Sample Collection and Analytical Procedure

Digestate treatment performance was evaluated by the efficiency and the rate of nutrient removal using the following equations:
R % , t = C 0     C t C 0   ×   100 %
R t = C 0     C t t     t 0
where R % , t and R t are removal efficiency (%) and removal rate (mg L−1 d−1) at time t, respectively; C 0 and C t are material concentration in the mixed liquor expressed in mg L−1 at initial time t 0 and at time t (day).
To assess the growth of microalgae and bacteria, the production rate of biomass was calculated (3). The biomass of microalgae could be estimated (4) by assuming that the algal biomass has constant chlorophyll-a content of 1.5% of the dry weight [42]:
P t = X t X 0 t     t 0
X alg = C Chl-a   × 100 / 1 . 5
where P t is the biomass production rate (mg biomass L−1 d−1) at time t; X t and X 0 are biomass concentration (mg biomass L−1) at time t and initial time t 0 , respectively. X alg is the algal biomass corresponding to the concentration of Chl-a, denoted as C Chl-a (mg Chl-a L−1).
The recorded DO profile in each experiment was used to evaluate dynamics between microalgae and bacteria in terms of their activities in the digestate. The observed DO dynamics in the reactor with (5) and without light (6) can be generally described as:
dO 2 , light d t = OTR     OUR + OPR
dO 2 , dark d t = OTR     OUR
where oxygen transfer rate (OTR), oxygen uptake rates (OUR), and oxygen production rates (OPR) stand for oxygen transfer, uptake, and production rates, respectively, in light and dark conditions expressed in mg O2 L−1 d−1.
The OTR equals the product between the volumetric mass transfer coefficient (kLa) and the difference between measured and the saturation level of DO in water [43]. Since kLa is specific for each system as well as operational condition, in this study, the kLa value of 8.1 (1 d−1) was measured following dynamic method [44] in the same beaker under the same operational conditions (agitation, temperature, etc.). Hence the OTR corresponding to each value of DO recorded was calculated accordingly.
Data statistical analysis was performed using R software. Pearson’s correlation analysis was applied to explore correlation between two parameters. The difference between data obtained from various experiments was determined to evaluate the impact of the specific operational conditions on algal bacterial dynamics. The comparison of two data sets started with normal distribution determination using the Shapiro–Wilk test and then the homoscedasticity evaluation by Fisher–Snedecor test. In case of normal distribution, either the Student t-test or the Welch test was applied for equal or unequal variances, respectively. Otherwise, the Mann–Whitney–Wilcoxon test was used. For multiple dataset comparison, normally distributed datasets were determined for homoscedasticity by the Bartlett test. Then significant differences were analyzed using the Analysis of Variance (ANOVA) or ANOVA-Welch correction for equal or unequal variances, respectively, followed by pairwise t-test. Otherwise, the Kruskal–Wallis test followed by Pairwise Wilcoxon Rank Sum Tests was used. All tests were applied with the threshold value of 0.05. Mean values were presented with standard deviations. Nutrient and biomass concentration variations were presented with measurement errors.

3. Results and Discussion

Data on wastewater characteristics, biomass and physicochemical were obtained for each experiment. The link between those data were analyzed to reveal the dynamics of microalgae and bacteria and the reliability of using physical chemical parameters as indicators for rapid evaluation of the dynamics.

3.1. Evaluation of the Microalgal Bacterial Dynamics under the Impacts of Light and Nutrient Load

The general assessment of the main processes governing treatment performance of microalgae and bacteria under different light intensities and nutrient concentrations was made. The link between profiles variation of physical chemical parameters and nutrient as well as biomass of microalgae and bacteria were evaluated.

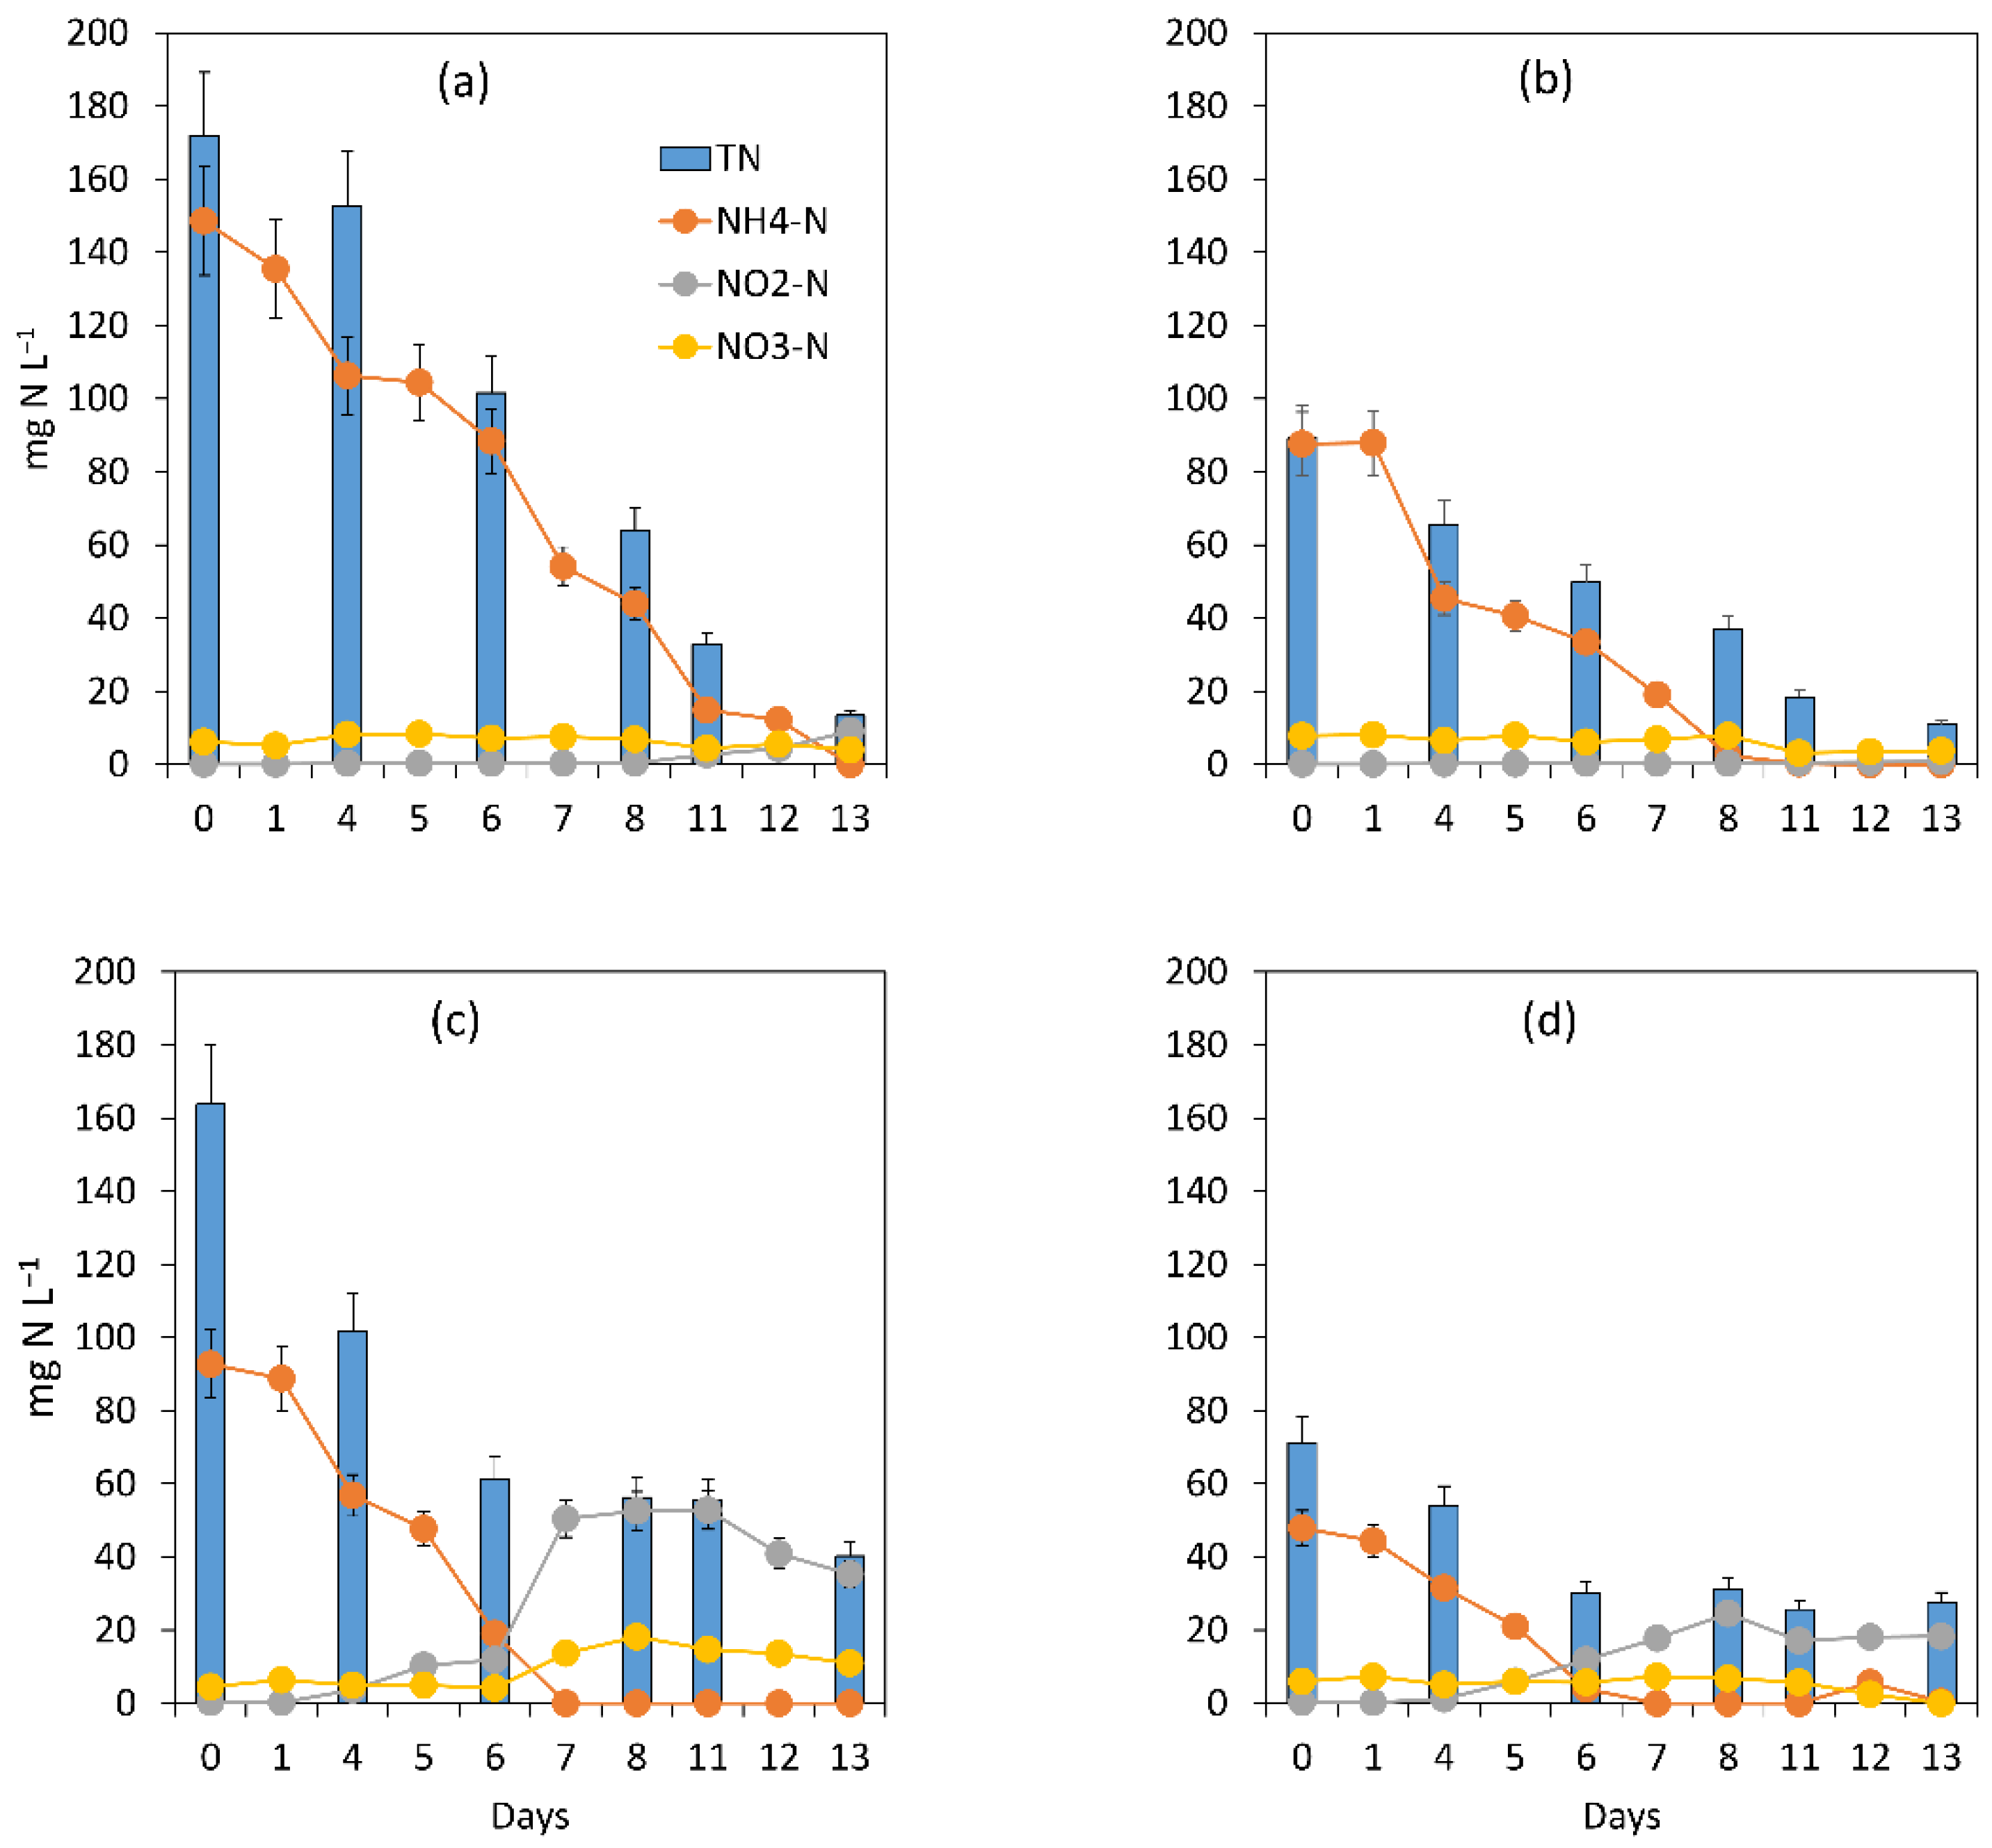
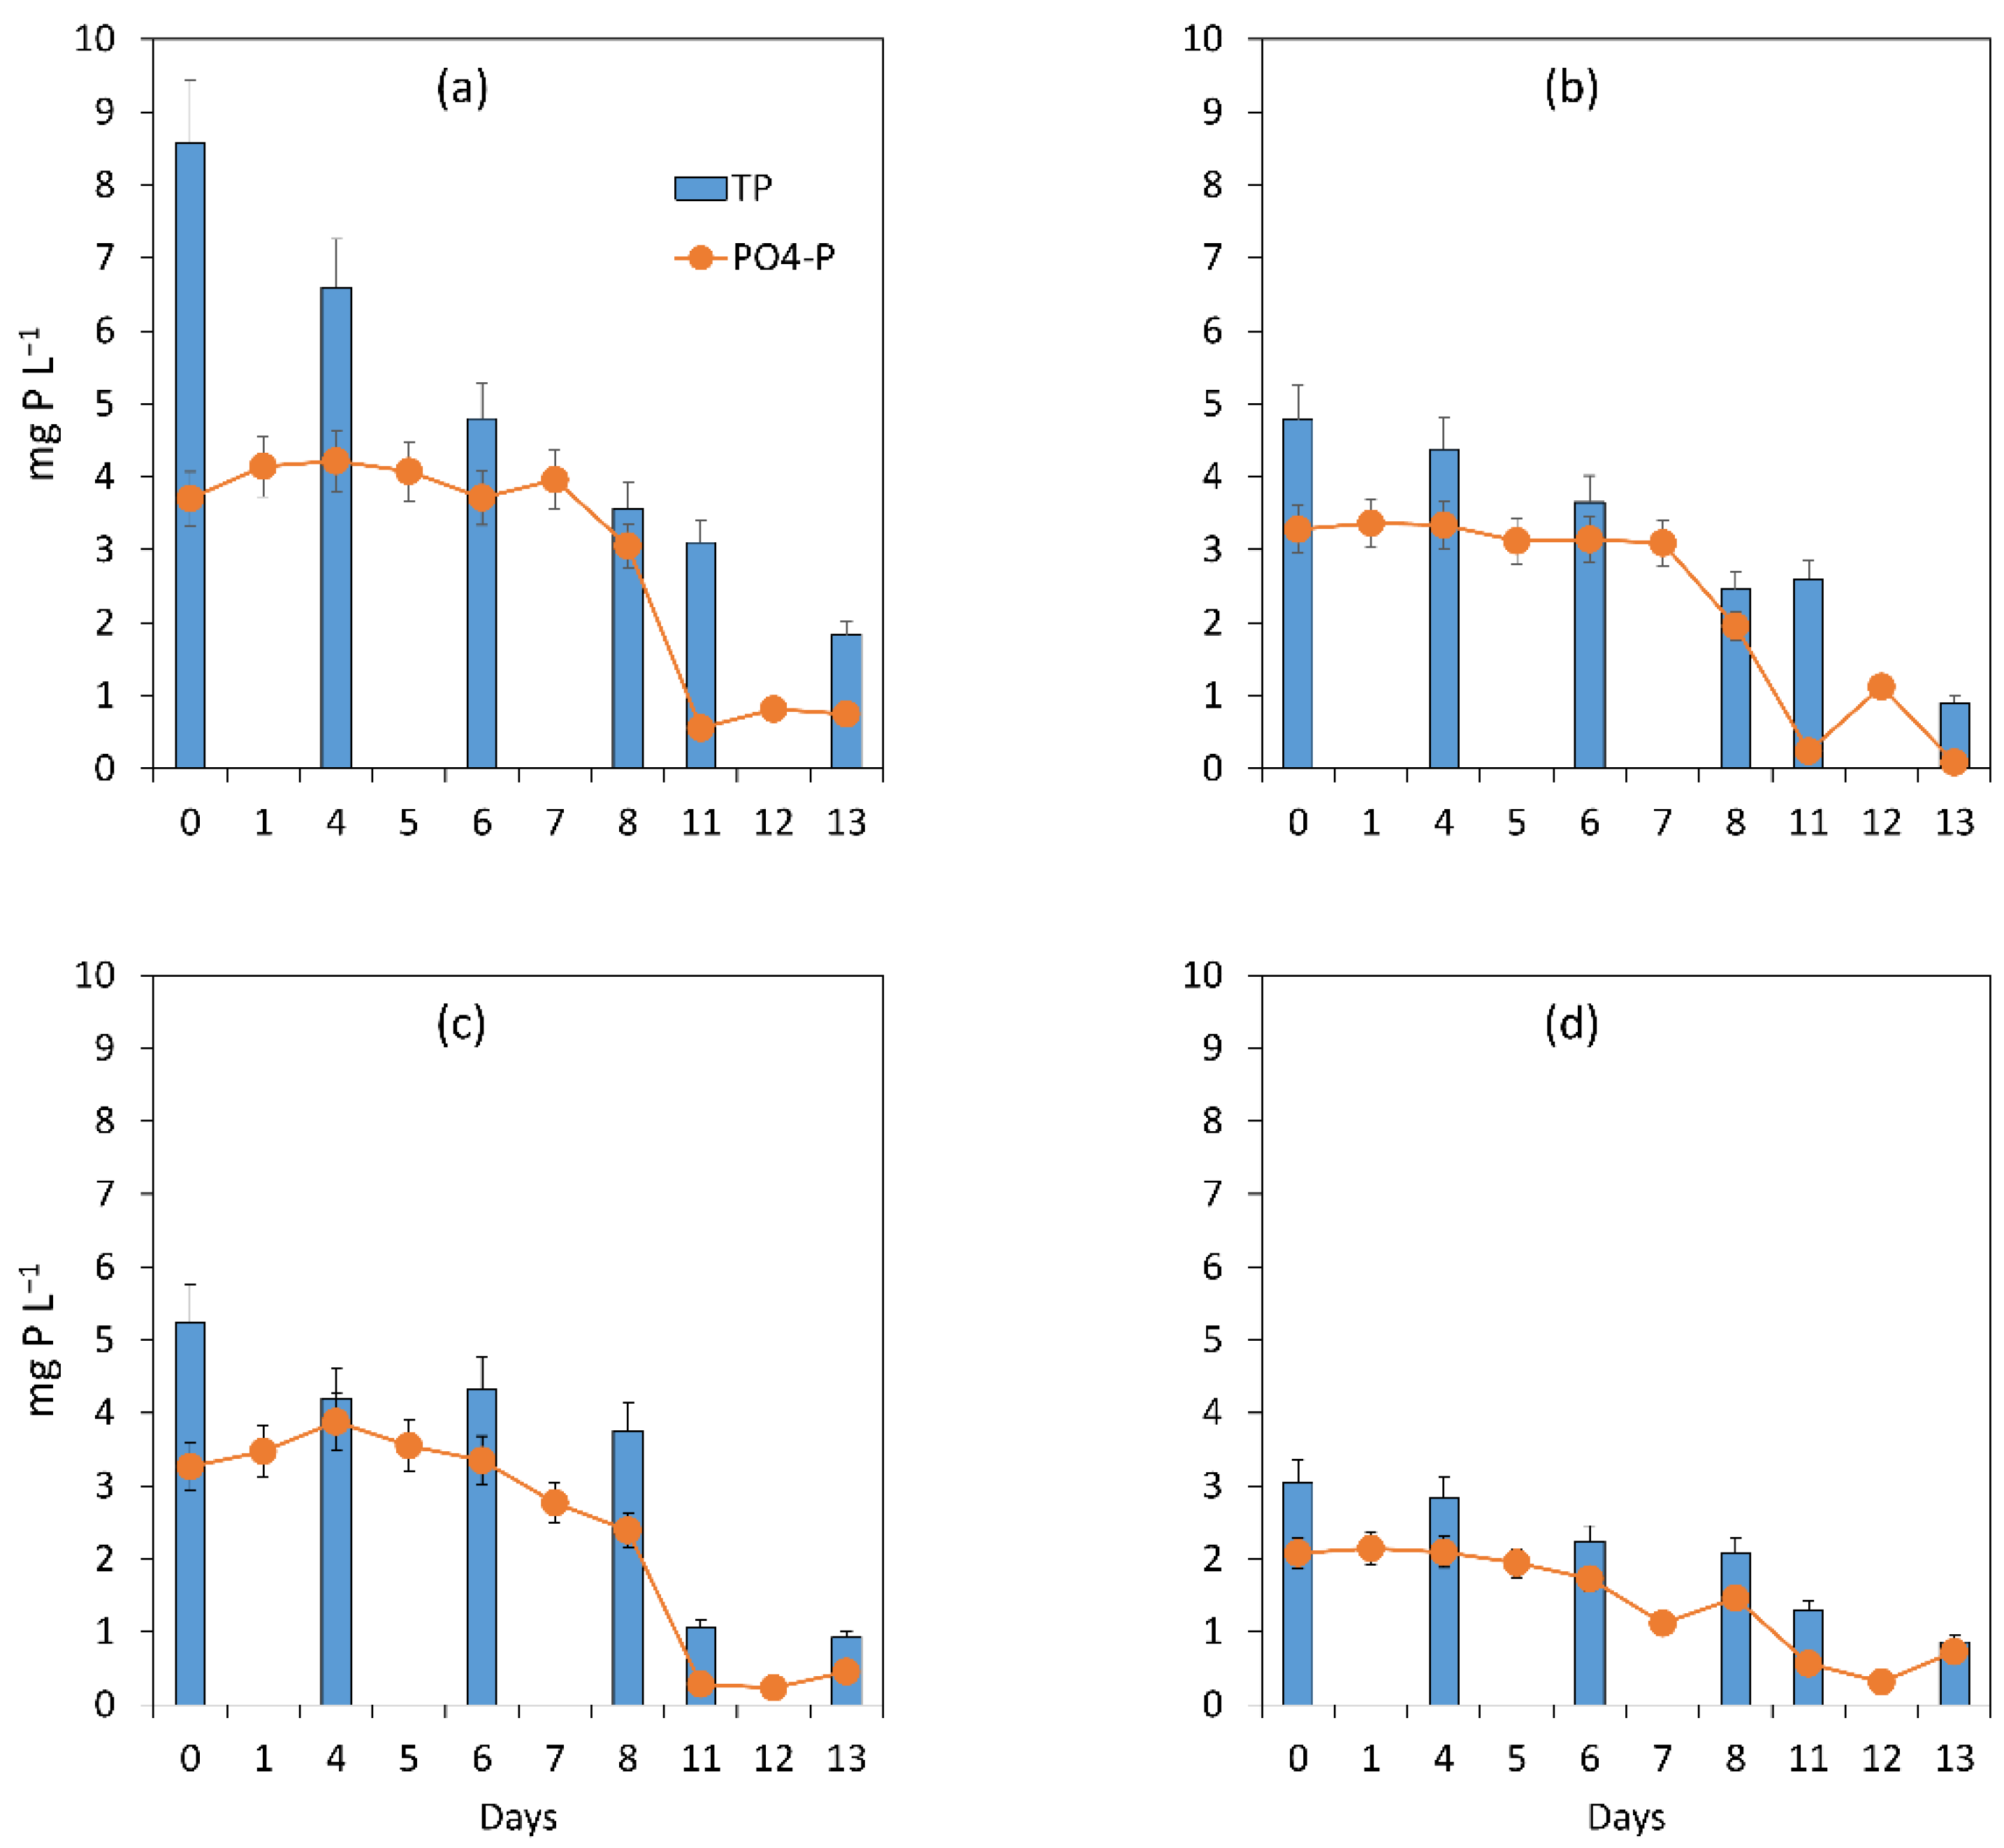
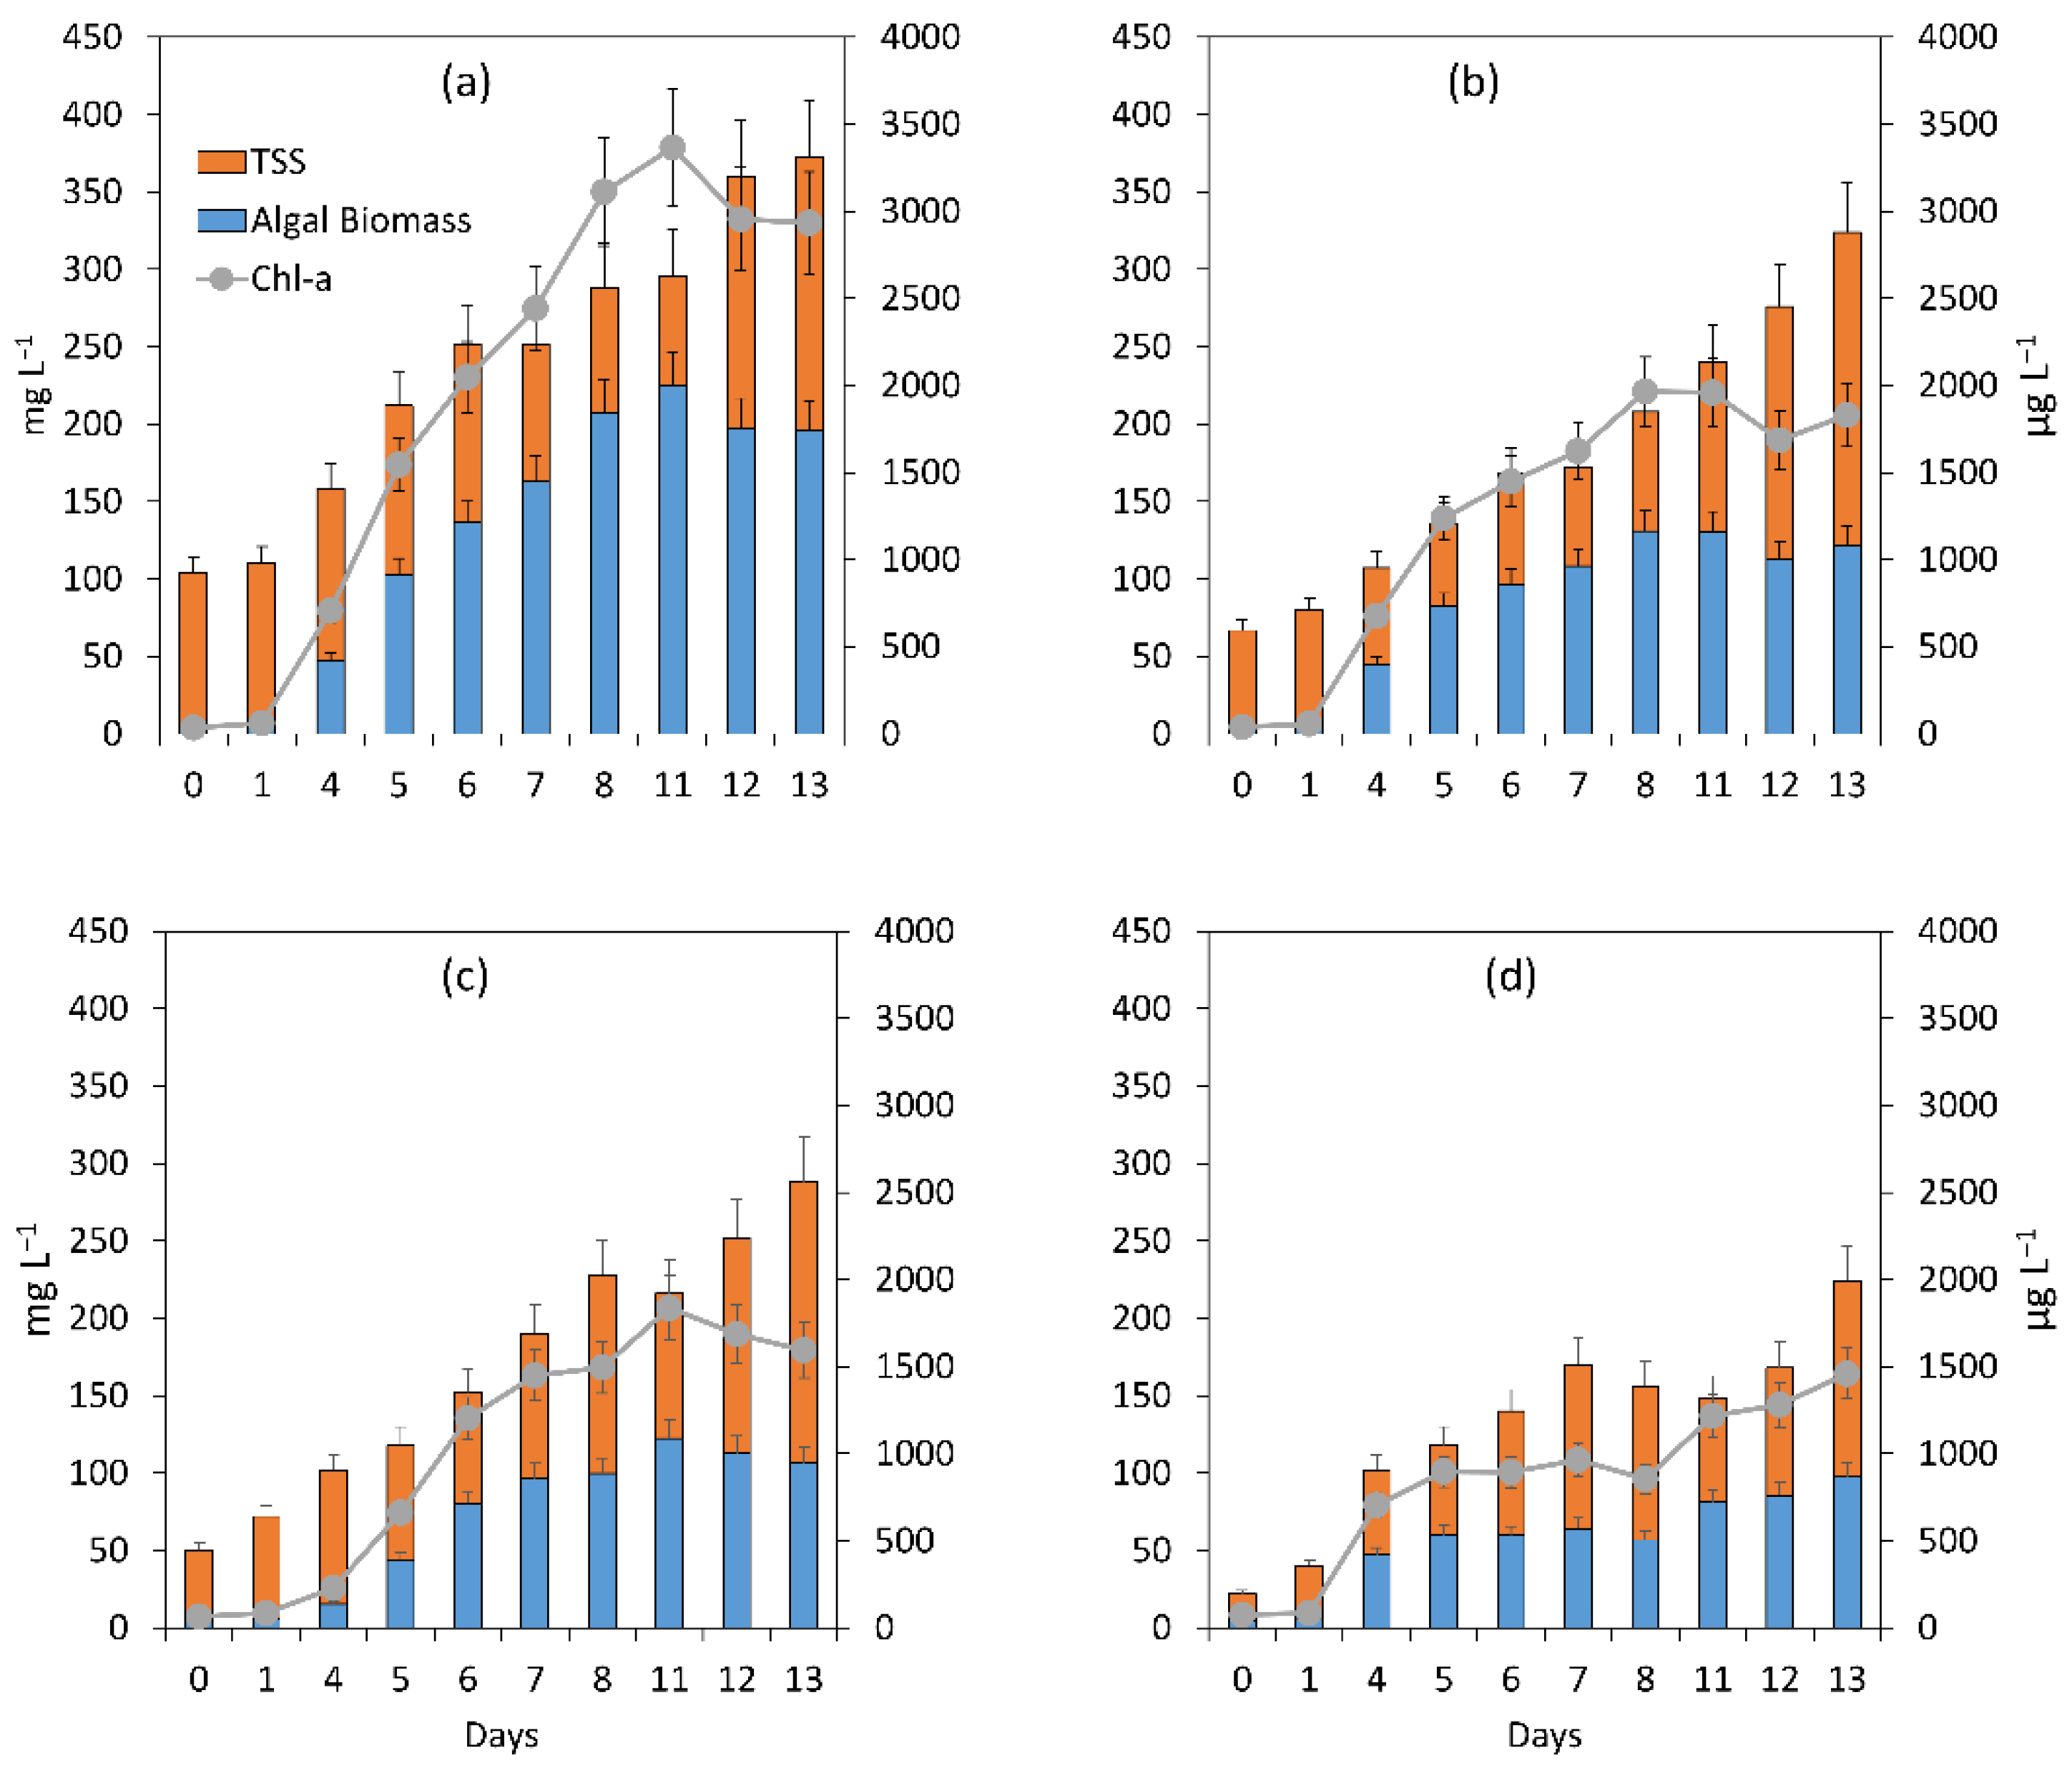
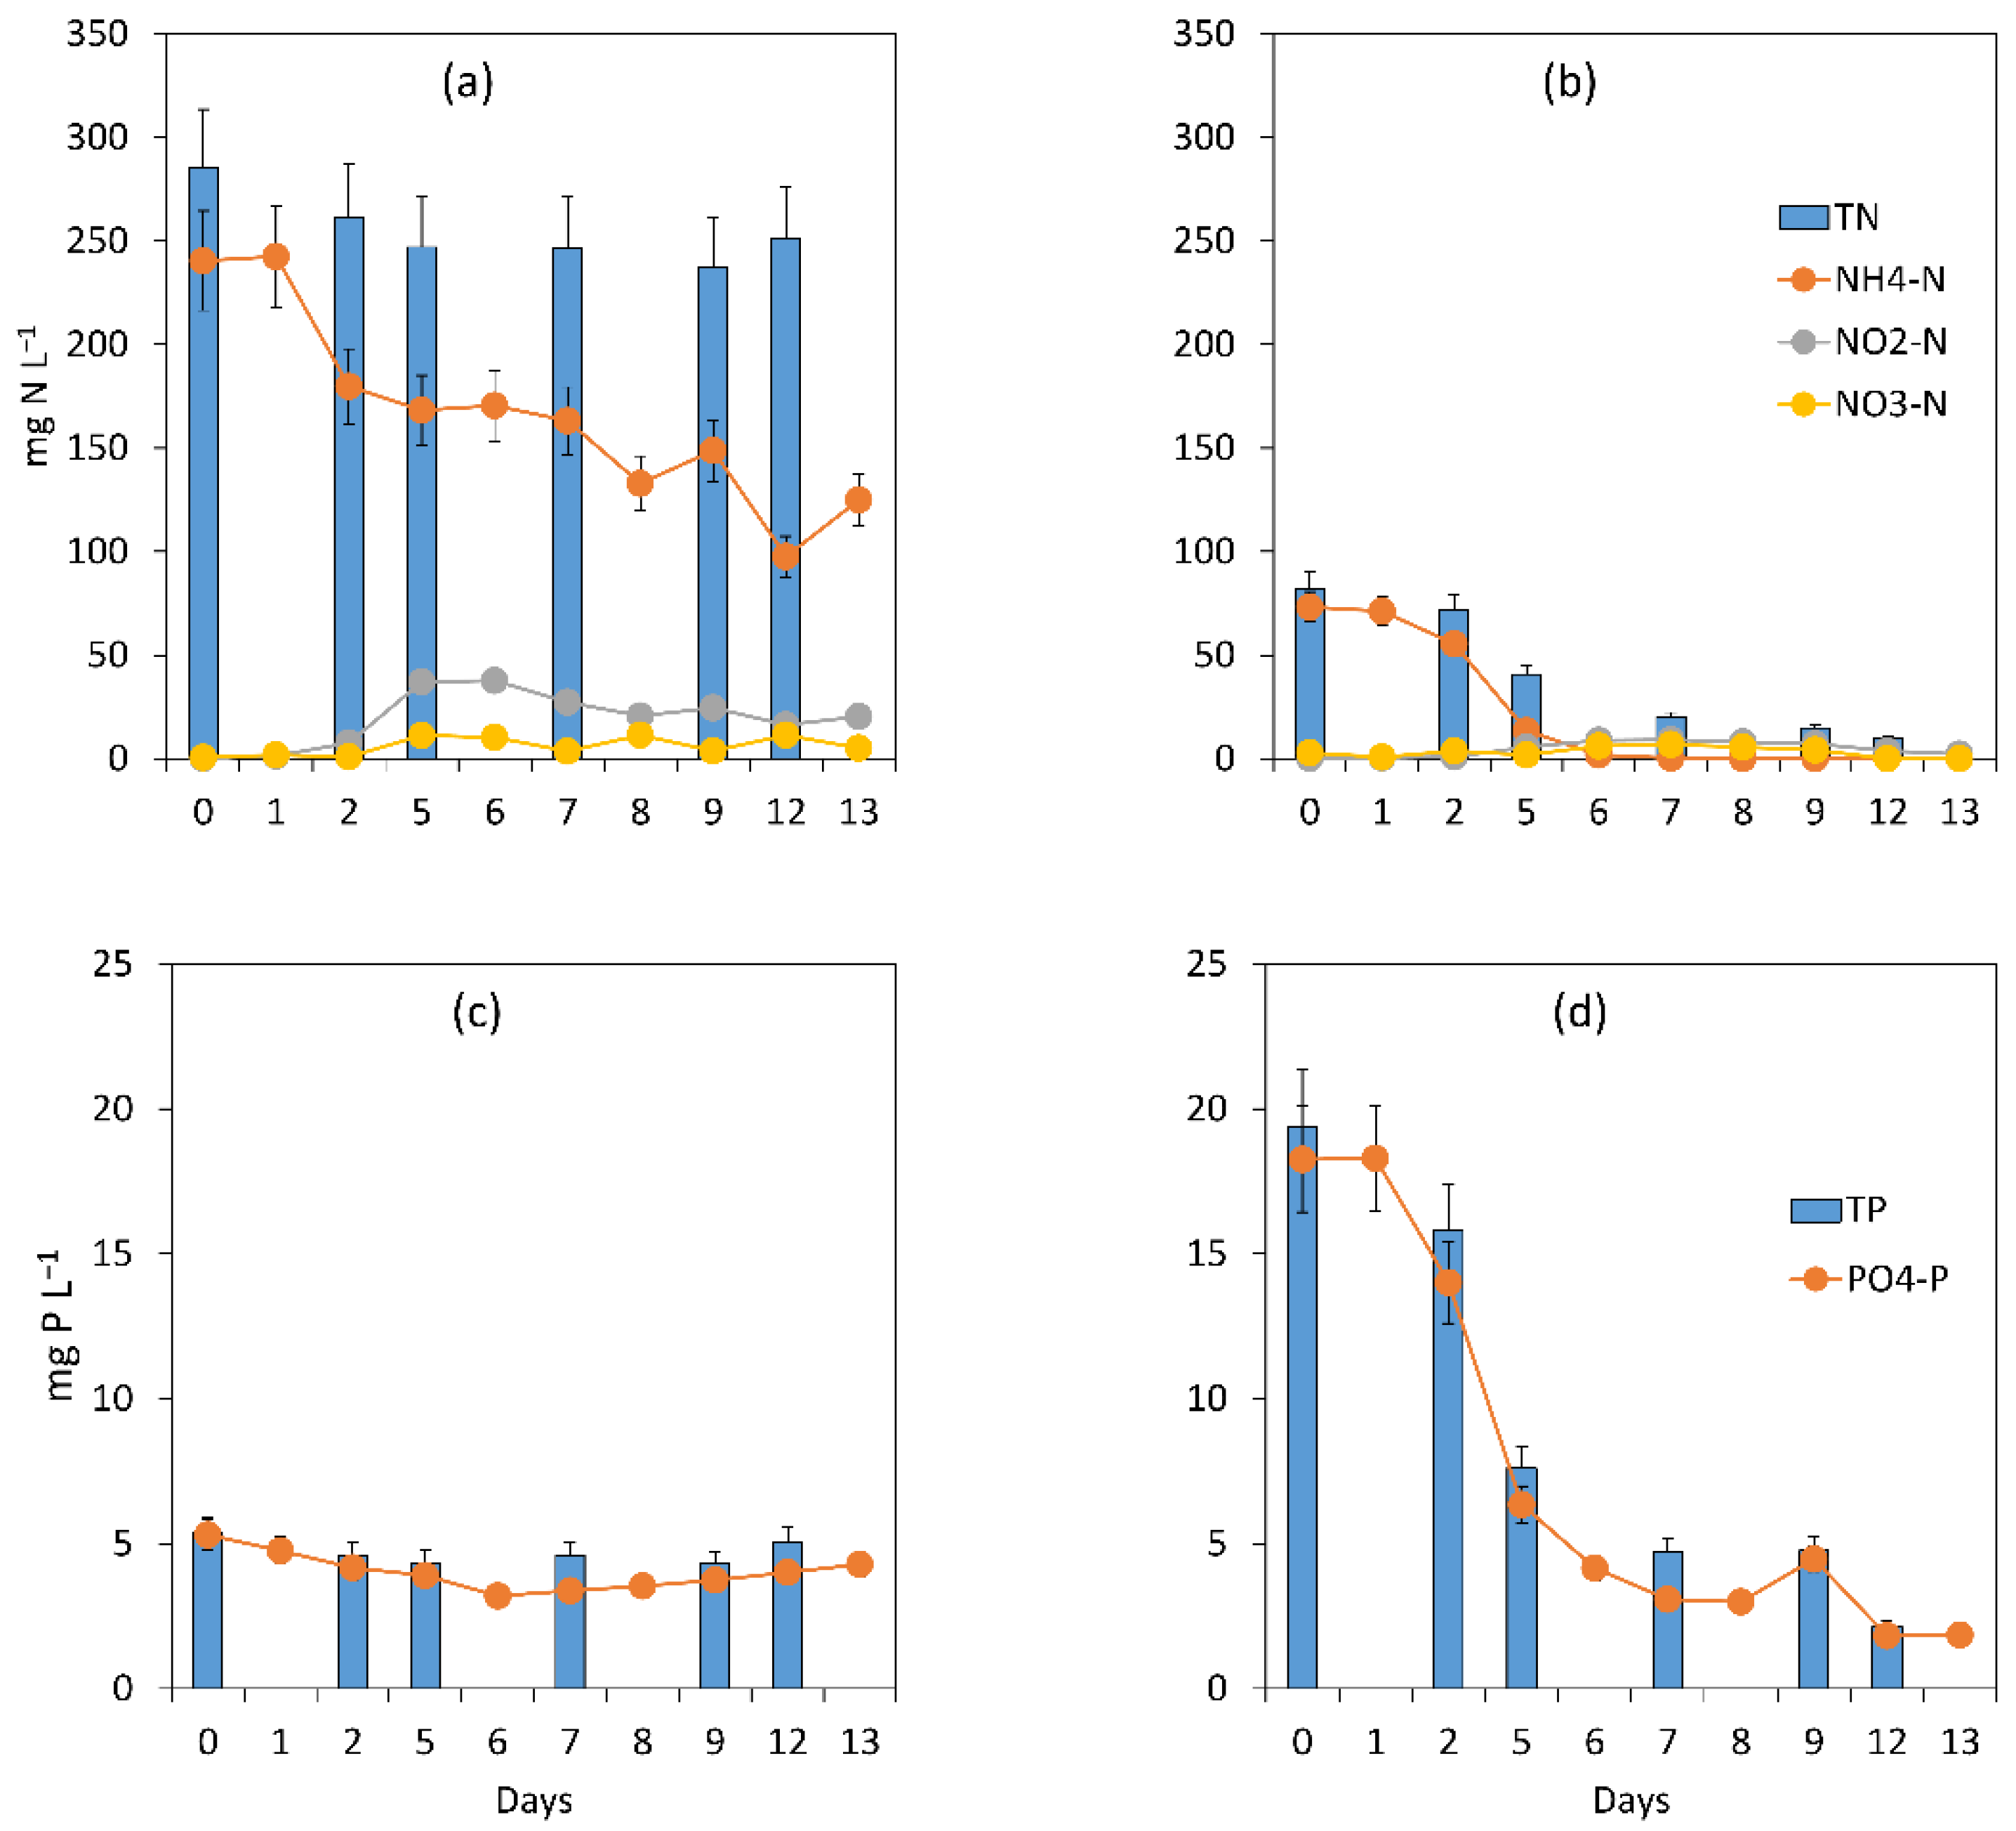
3.1.1. General Assessment of the Main Processes Governing Treatment Performance

In this study, all experiments were conducted in batch mode, allowing us to obtain the global removal efficiency and removal rate of major pollutants in pig farming digestate under different light intensities and nutrient loads (Table 3). All experiments showed good levels of treatment both in terms of nutrient removal rates (TN and TP removal rate of 3.4–12.2 mg N L−1 d−1 and 0.17–0.52 mg P L−1 d−1, respectively) and nutrient removal efficiencies (TN and TP removal of 61.3–92.2% and 71.8–82.4%, respectively). The results achieved in this study are comparable to those reported in similar work employing microalgae Chlorella vulgaris cultivated in 10-fold diluted pig farming digestate treatment with 88% (4.8 mg N L−1 d−1) of TN removal and 81% (0.7 mg P L−1 d−1) of TP removal [45].
Light intensity and nutrient load exhibited positive impacts on algal bacterial nutrient removal which increased removal rates (Table 3). It has been indicated that in treatment systems using microalgae and bacteria, removal of nutrients such as N and P mainly rely on algal processes while COD reduction is due to bacterial oxidation [46]. Hence, increase in illumination, followed by improved algal activities, could enhance nutrients removal in the system. This impact was clearly observed in TN and TP removal as TN and TP removal rates increasing from 3.4 (9.5) to 6.0 (12.2) mg N L−1 d−1 and from 0.17 (0.33) to 0.30 (0.52) mg P L−1 d−1 for low (high) nutrient load, respectively. Similar results have been reported earlier showing positive link between light intensity and nutrients uptake by six freshwater diatoms [47]. Other results on the performance of Chlorella vulgaris in wastewater under various light intensities also show an increase in removal rate from 10.58 ± 1.02 to 17.31 ± 0.38 mg N L−1 d−1 and from 1.17 ± 0.09 to 1.31 ± 0.15 mg P L−1 d−1 of N and P removals, respectively, when rising light intensity from 36 to 180 µE m−2 s−1 [36].
Higher nutrient removal rates achieved in 5-times diluted digestate suggested good adaptation of Chlorella vulgaris in this wastewater. It has been earlier reported that higher nutrient load resulted in an improved performance of microalgae under favorable environmental conditions (i.e., during summer) [48]. However, more concentrated nutrient level in the 5-times diluted digestate could require longer time for complete removal and thus lead to lower removal efficiencies (Table 3). The same conclusion has been made in a study using Chlorella vulgaris for pig farming wastewater treatment under various dilution rates that the highest biomass growth was achieved under the most concentrated wastewater (5-fold dilution) but the highest removal efficiencies were obtained under 20-fold diluted wastewater (39.6% and 91.3% of nitrogen removal efficiency for 5-fold and 20-fold dilution ratios, respectively) [49].
The impacts of light intensity and nutrient load on removal of COD followed a similar pattern in which higher levels of those factors improved COD removal rate while lower concentration of digestate resulted in higher removal efficiencies (Table 3). COD removal efficiencies in this study were generally from low to adequate levels compared to the range of 60.5–70.2% reported in an earlier study [49], suggesting the dominant role of microalgae in treatment performance and hence longer retention time would be required for enhanced bacterial removal efficiency of organic matter.
Global evaluation of physicochemical data can also provide additional information on the main processes of microalgae and bacteria in digestate and the average values of those parameters are summarized in Table 4. In an algal bacterial system, high levels of DO and pH indicate good photosynthesis of microalgae [35] which was the case in this study. Adequate values of oxygen (4.2–6.2 mg O2 L−1) and pH (8.6–9.1) were maintained during all experiments that are comparable with the typical range (5.6–9.7 mg O2 L−1 of DO and 7.2–8.4 of pH) reported by literature on the same topic [18,50,51]. The results are in agreement with good treatment performance and thus support the predominance of microalgae suggested above. However, no significant difference was found between DO and pH levels obtained in the four experiments (p values > 0.05). This was contrary to the positive correlation between daily DO values and nutrient concentrations as well as light intensity reported in another study [52]. Therefore, analysis of the link between those parameters should be established based on daily data which are discussed later.
A clear relationship between nutrient loads and their EC levels was recorded with higher nutrient load resulting to higher values of EC (p values < 0.05) while no significant difference was found between EC levels with different light intensities (p values > 0.05) (Table 4). Electrical conductivity (EC) has been earlier recognized as a crucial parameter for monitoring pollutant concentrations in wastewater [53]. It has been reported that EC showed linear correlation to the concentration of various pollutants including diclofenac, propranolol, ibuprofen or atenolol in wastewater with high coefficient values (r) from 0.781 to 0.908 [54]. In an algal bacterial system, EC also exhibited strong correlation with the reduction of Escherichia coli by Chlorella vulgaris [55] as well as with the growth of microalgae in sewage water [56]. Further correlation analysis between EC variation profile and nutrient concentration as well as biomass growth under the impact of different conditions is addressed in the following section.
The growth of microalgal bacterial biomass was assessed in terms of TSS production while at the same time, the productivity of microalgae was evaluated based on Chl-a production rate in each experiment (Table 4). Biomass production rates obtained in this study with diluted digestate were 15.5–20.6 mg L−1 d−1 with corresponding algal production of 7.1–14.9 mg L−1 d−1. The results are comparable to the range of 5.3–18.5 mg L−1 d−1 reported by various studies on similar conditions [19,57]. The favorable effect of high light intensity and nutrient load on the growth of microalgae was observed by higher growth rates of 14.9/9.2 mg L−1 d−1 (in HL.X5/HL.X10, respectively) comparing to 7.9/7.1 mg L−1 d−1 (in LL.X5/LL.X10, respectively). In addition, microalgal bacterial biomass also increased accordingly from 18.3/15.5 mg L−1 d−1 (LL.X5/LL.X10, respectively) to 20.6/19.8 mg L−1 d−1 (in HL.X5/HL.X10, respectively), confirming the positive and dominant role of microalgae in the biogas digestate treatment. Consequently, enhanced growth of microalgae as well as total biomass resulted in the improvement of treatment performance as discussed above.

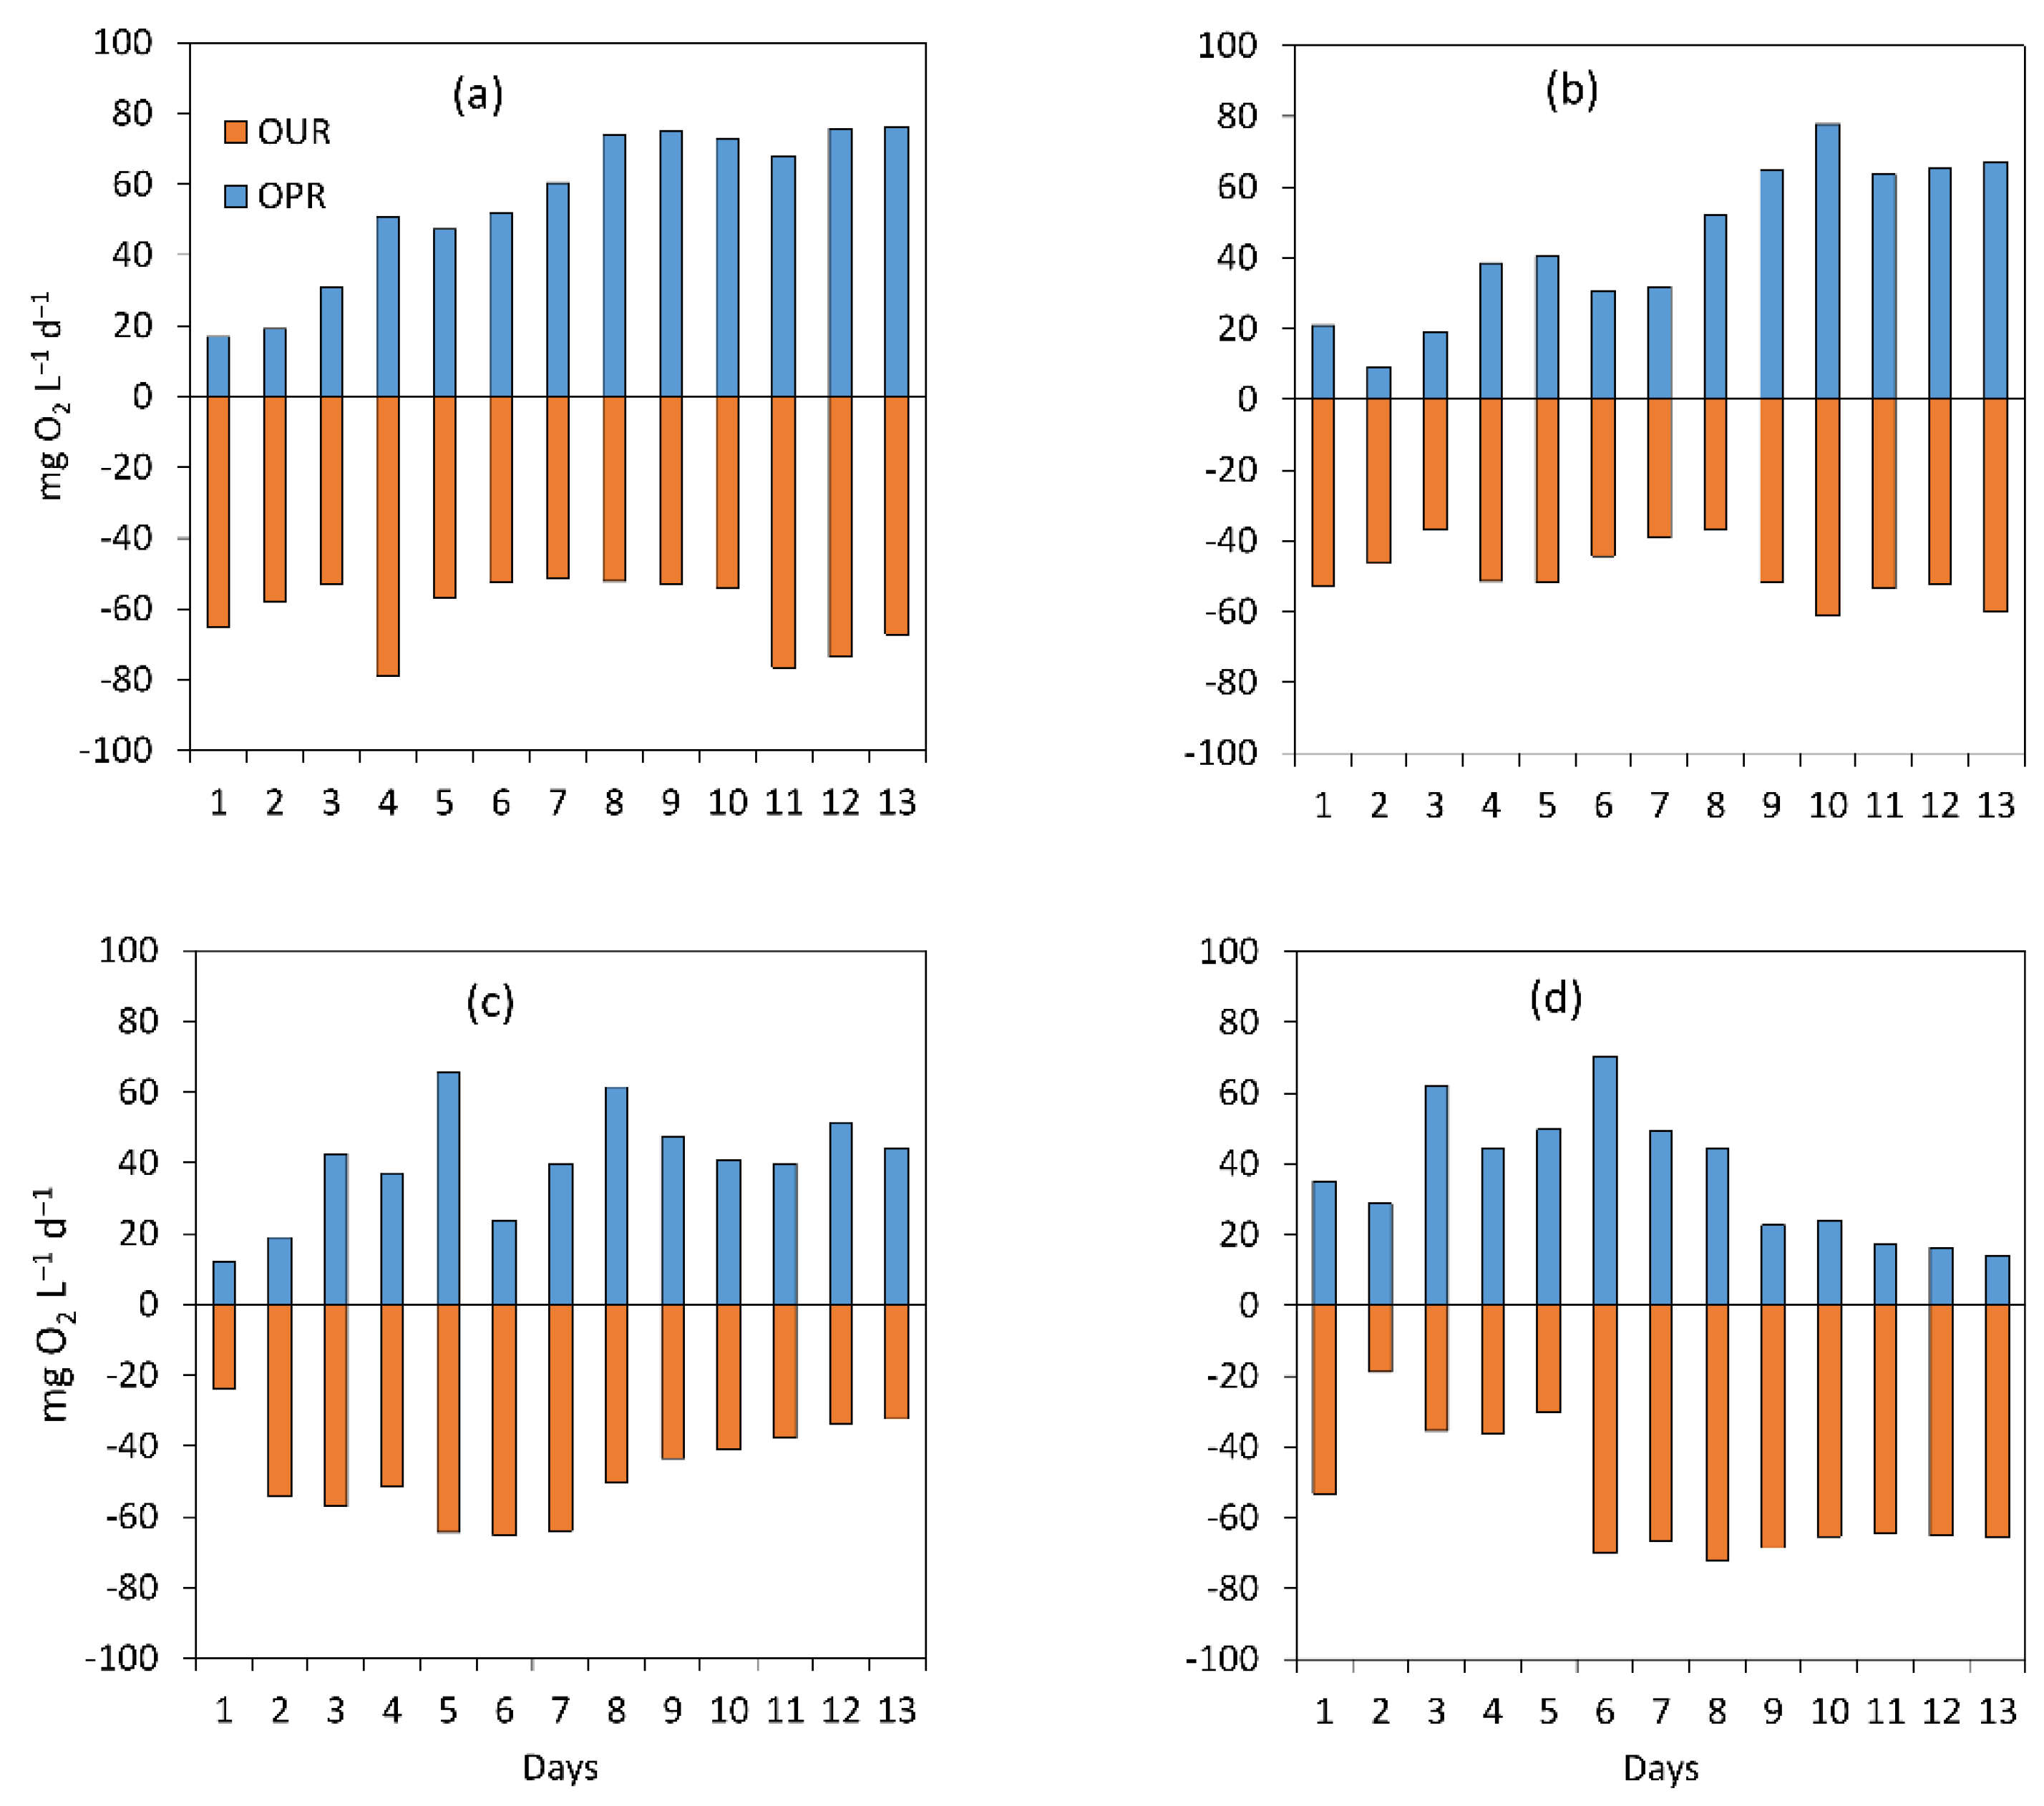
3.1.2. Assessment of the Treatment Process Dynamics between Microalgae and Bacteria

Further evaluation on the dynamics of treatment processes of microalgae and bacteria in pig-farming digestate was achieved via analysis of the profile variation of nutrient concentrations (Figure 2 and Figure 3) in the reactor. The main form of nitrogen in pig farming biogas digestate used in this study was NH4+-N, accounting for 56.6–98.2% of TN with low levels of NO2-N and NO3-N (2.9–8.9% of TN) (Figure 2), which is typical for this wastewater type [4]. Therefore, complete removal of nitrogen in the digestate would link directly to the reduction of NH4+-N via bacterial nitrification and subsequently denitrification processes or via microalgal cellular uptake as well as NH3 gas stripping [42]. As can be noticed in experiments under high light intensity (HL.X5 and HL.X10), the concentrations of NH4+-N as well as TN gradually decreased throughout the entire period (Figure 2a,b), respectively) suggesting the main removal mechanisms of TN in this case could be NH4+-N cellular uptake and/or NH3 stripping. Moreover, the low levels of NO2-N and NO3-N maintained at the same time indicates low level of nitrification. In addition, with a constantly high level of oxygen (Table 4) detected in the reactors (5.2 ± 3.3 and 6.2 ± 2.6 mg O2 L−1 in HL.X5 and HL.X10, respectively), the dominant condition would be aerobic and hence denitrification was unfavorable. Another study cultivating Chlorella vulgaris in pig-farming wastewater showed similar nitrogen variation patterns with both TN and NH4+-N decreasing during the experiment indicating ammonium incorporation in the microalgal cell as the main removal mechanism [58].
On the other hand, nitrogen removal of microalgae and bacteria followed a different pattern under low light intensity (LL.X5 and LL.X10 as shown in Figure 2c,d, respectively). During the first week, NH4+-N was effectively reduced to a minor level while TN concentration also decreased accordingly accounting for 62.6% and 57.6% of TN removed for LL.X5 and LL.X10, respectively. However, as NO2-N started to increase at the end of the first week and maintained a significant level during the second half of the experiments, the TN removal efficiencies during this period were at low levels (12.9% and 3.7% for LL.X5 and LL.X10, respectively). Results obtained at the first half of the experiments follow a similar trend observed under high light intensity in which nitrogen uptake as well as ammonia gas stripping were possibly the dominant processes. In contrary, high levels of nitrite maintained during the second half of the experiments (46.4 ± 7.9 and 19.2 ± 3.0 mg N L−1 for LL.X5 and LL.X10, respectively) suggest the significant role of nitrification in the reactors. It has been indicated earlier that ammonia-oxidizing bacteria (AOB), responsible for the first step of nitrification, have shorter generation time and hence are able to increase quickly in numbers compared with nitrite-oxidizing bacteria (NOB) [59]. The difference between their growth rates could directly affect the nitrification process, for instance in the high level of nitrite a in reactor during start-up period. A similar result was observed in a raceway pond employing microalgae and activated sludge for wastewater treatment in which high concentration of NO2-N was detected at the effluent during the first three weeks of the operation before being replaced by NO3-N form [33]. As with the experiments conducted under low light intensity, light penetration into the bulk solution inside reactors was reduced, especially with the increase of algal bacterial biomass. Light intensity penetrated into the mixed liquid could decrease 44.1% after 2 cm of water depth at the microalgal concentration of 70 mg L−1 and increase to 64.7% of reduction at higher concentration of 180 mg L−1 [60]. As a consequence, insufficient light at the second half of the experiments might inhibit algal activities, allowing nitrifying bacteria to thrive.
The concentration of phosphorus (Figure 3a,d) in all experiments followed similar patterns with a gradual reduction of TP concentration throughout the entire period regardless of the light intensities or nutrient loads applied. In algal bacterial treatment systems, the two main mechanisms of removing phosphorus are cellular accumulation and phosphorus precipitation at high pH level (higher than pH 9) [61]. In this study, the average pH levels recorded in HL.X5, HL.X10, LL.X5 and LL.X10 experiments were 9.1, 9.0, 8.9 and 8.6, respectively (Table 4) suggesting a low contribution of phosphorus removal via precipitation, leaving microbial uptake as the potential dominant process. Moreover, the N:P ratio of the digestate used in this study was 22.1 ± 3.4 (mg N mg−1 P), within the optimal range for microalgal growth [12] which confirms the dominant role of phosphorus cellular accumulation as nitrogen was also quickly consumed, especially at high light intensity. At the end of these experiments, the remaining phosphorus concentrations in digestate were at low levels of 1.8, 0.9, 0.9 and 0.9 mg P L−1 of TP for HL.X5, HL.X10, LL.X5 and LL.X10 experiments, respectively.

3.1.3. Microalgal Bacterial Dynamics Assessment under the Impacts of Light and Nutrient Load

Biomass evolution during the experiment (Figure 4) was used to assess the impacts of light intensity and nutrient load on the dynamics between microalgae and bacteria in pig-farming digestate. Under the condition of high light intensity, microalgae showed a continuous growth throughout two weeks of the experiments (HL.X5 and HL.X10) except for a short lag time at the beginning and the last three days where algal growth ceased (stable at 205.7 ± 16.3 and 121.7 ± 9.0 mg L−1 of HL.X5 and HL.X10, respectively), possibly due to low nitrogen and phosphorus concentration (Figure 2a,b and Figure 3a,b, respectively). In these experiments, microalgal biomass accounted for 56.5 ± 14.5% and 52.4 ± 10.6% (of HL.X5 and HL.X10, respectively) of total biomass, suggesting a dominant contribution in biomass production as well as reconfirming its role in nutrient removal. Similar proportion of 55.6% microalgae in the algal bacterial biomass has also been reported in another system treating domestic wastewater [62]. As indicated above, decrease in light intensity resulted in lower growth of microalgae and hence the global treatment performance of the system. This conclusion was further confirmed by lower algal growth observed in LL.X5 and LL.X10 experiments with algal biomass only contributed 42.3 ± 13.1% and 45.3 ± 6.5% of total biomass, respectively (p values < 0.05). Adequate growth of microalgae was noticed during the first half of LL.X5 and LL.X10 experiment with average productivities of 13.2 and 8.5 mg L−1 d−1, reaching 96.6 and 64.3 mg L−1 on the 7th day, respectively. Concentrations of microalgae then stabled around 110.2 ± 9.7 and 80.2 ± 8.4 mg L−1, respectively during the second half of the experiments. The results are highly consistent with the conclusion made above on the change in predominance from microalgae to bacterial based on nutrient variation profiles. Notably, nutrient load variation due to different digestate dilution rates show insignificant difference in microalgal contents of the total biomass (p values > 0.05).
Continuous recording of DO concentration in each reactor allowed us to calculate daily oxygen uptake rate (OUR) and oxygen production rate (OPR) (Figure 5), providing insight into the photosynthesis of microalgae and oxidation process of bacteria, respectively [63]. Under high light intensity, similar levels of OPR and OUR were obtained in both HL.X5 and HL.X10 experiments (p values > 0.05). After the short lag time at the beginning of each test, OPR and OUR were respectively 65.2 ± 11.6 mg O2 L−1 d−1 and 61.6 ± 11.2 mg O2 L−1 d−1 for HL.X5 while the values of 56.4 ± 16.7 mg O2 L−1 d−1 and 50.7 ± 8.3 mg O2 L−1 d−1, respectively were achieved in HL.X10. It was also noticed that more concentrated nutrient load condition showed slightly higher levels of OPR and OUR compared to more dilute equivalents although a significant difference was only detected between OUR values (p value < 0.05). The difference could be due to lower biomass density maintained in HL.X10 versus HL.X5. Similar results have also been reported in which comparable levels of OPR and OUR were obtained at sufficient light condition with high values of OPR and OUR rates up to 210.0 ± 25.5 mg O2 L−1 d−1 and 222.5 ± 53.0 mg O2 L−1 d−1, respectively corresponding to biomass levels of 1600 ± 500 mg L−1 [33]. The increasing trends of OPR data obtained in HL.X5 and HL.X10 experiments are consistent with the growth profiles of microalgae analyzed above. The OPR values raised from 16.9 and 20.9 to 72.8 and 77.8 mg O2 L−1 d−1, respectively during the first ten days, in line with the active treatment due to good microalgal growth period. OPR then stable around 73.2 ± 4.6 and 65.3 ± 1.8 mg O2 L−1 d−1 for the last three days of the experiments, respectively, when the microalgal growth ceased due to low level of nutrients.
As mentioned above, low light intensity resulted in poor nutrient removal at the second half of the experiments (LL.X5 and LL.X10), possibly due to the inhibition of algal process under the combination of low light and high biomass density. The OPR and OUR data obtained in LL.X5 experiment (Figure 5c) showed otherwise with similar levels of 45.5 ± 11.3 mg O2 L−1 d−1 and 47.8 ± 12.5 mg O2 L−1 d−1, respectively (p value > 0.05). On the other hand, a clear shift from the domination of microalgae to bacteria was shown in the data of LL.X10. In fact, the OPR value decreased from 53.3 ± 10.5 mg O2 L−1 d−1 to 17.7 ± 4.7 mg O2 L−1 d−1 while OUR raised from 34.0 ± 3.3 mg O2 L−1 d−1 to 66.8 ± 2.8 mg O2 L−1 d−1 (p values < 0.05). The transitional period during days six and seven accorded with a rising in NO2-N level (Figure 2d), as well as with the poor growth of microalgae, suggesting an increase in bacterial activity.

3.2. Evaluation of the Microalgal Bacterial Dynamics under the Impacts of Extreme N:P Ratios

The general assessment of the main processes governing treatment of microalgae and bacteria under the extreme condition of different N:P ratios was made. The link between profiles variation of physical chemical parameters and nutrient as well as biomass of microalgae and bacteria were subsequently evaluated.

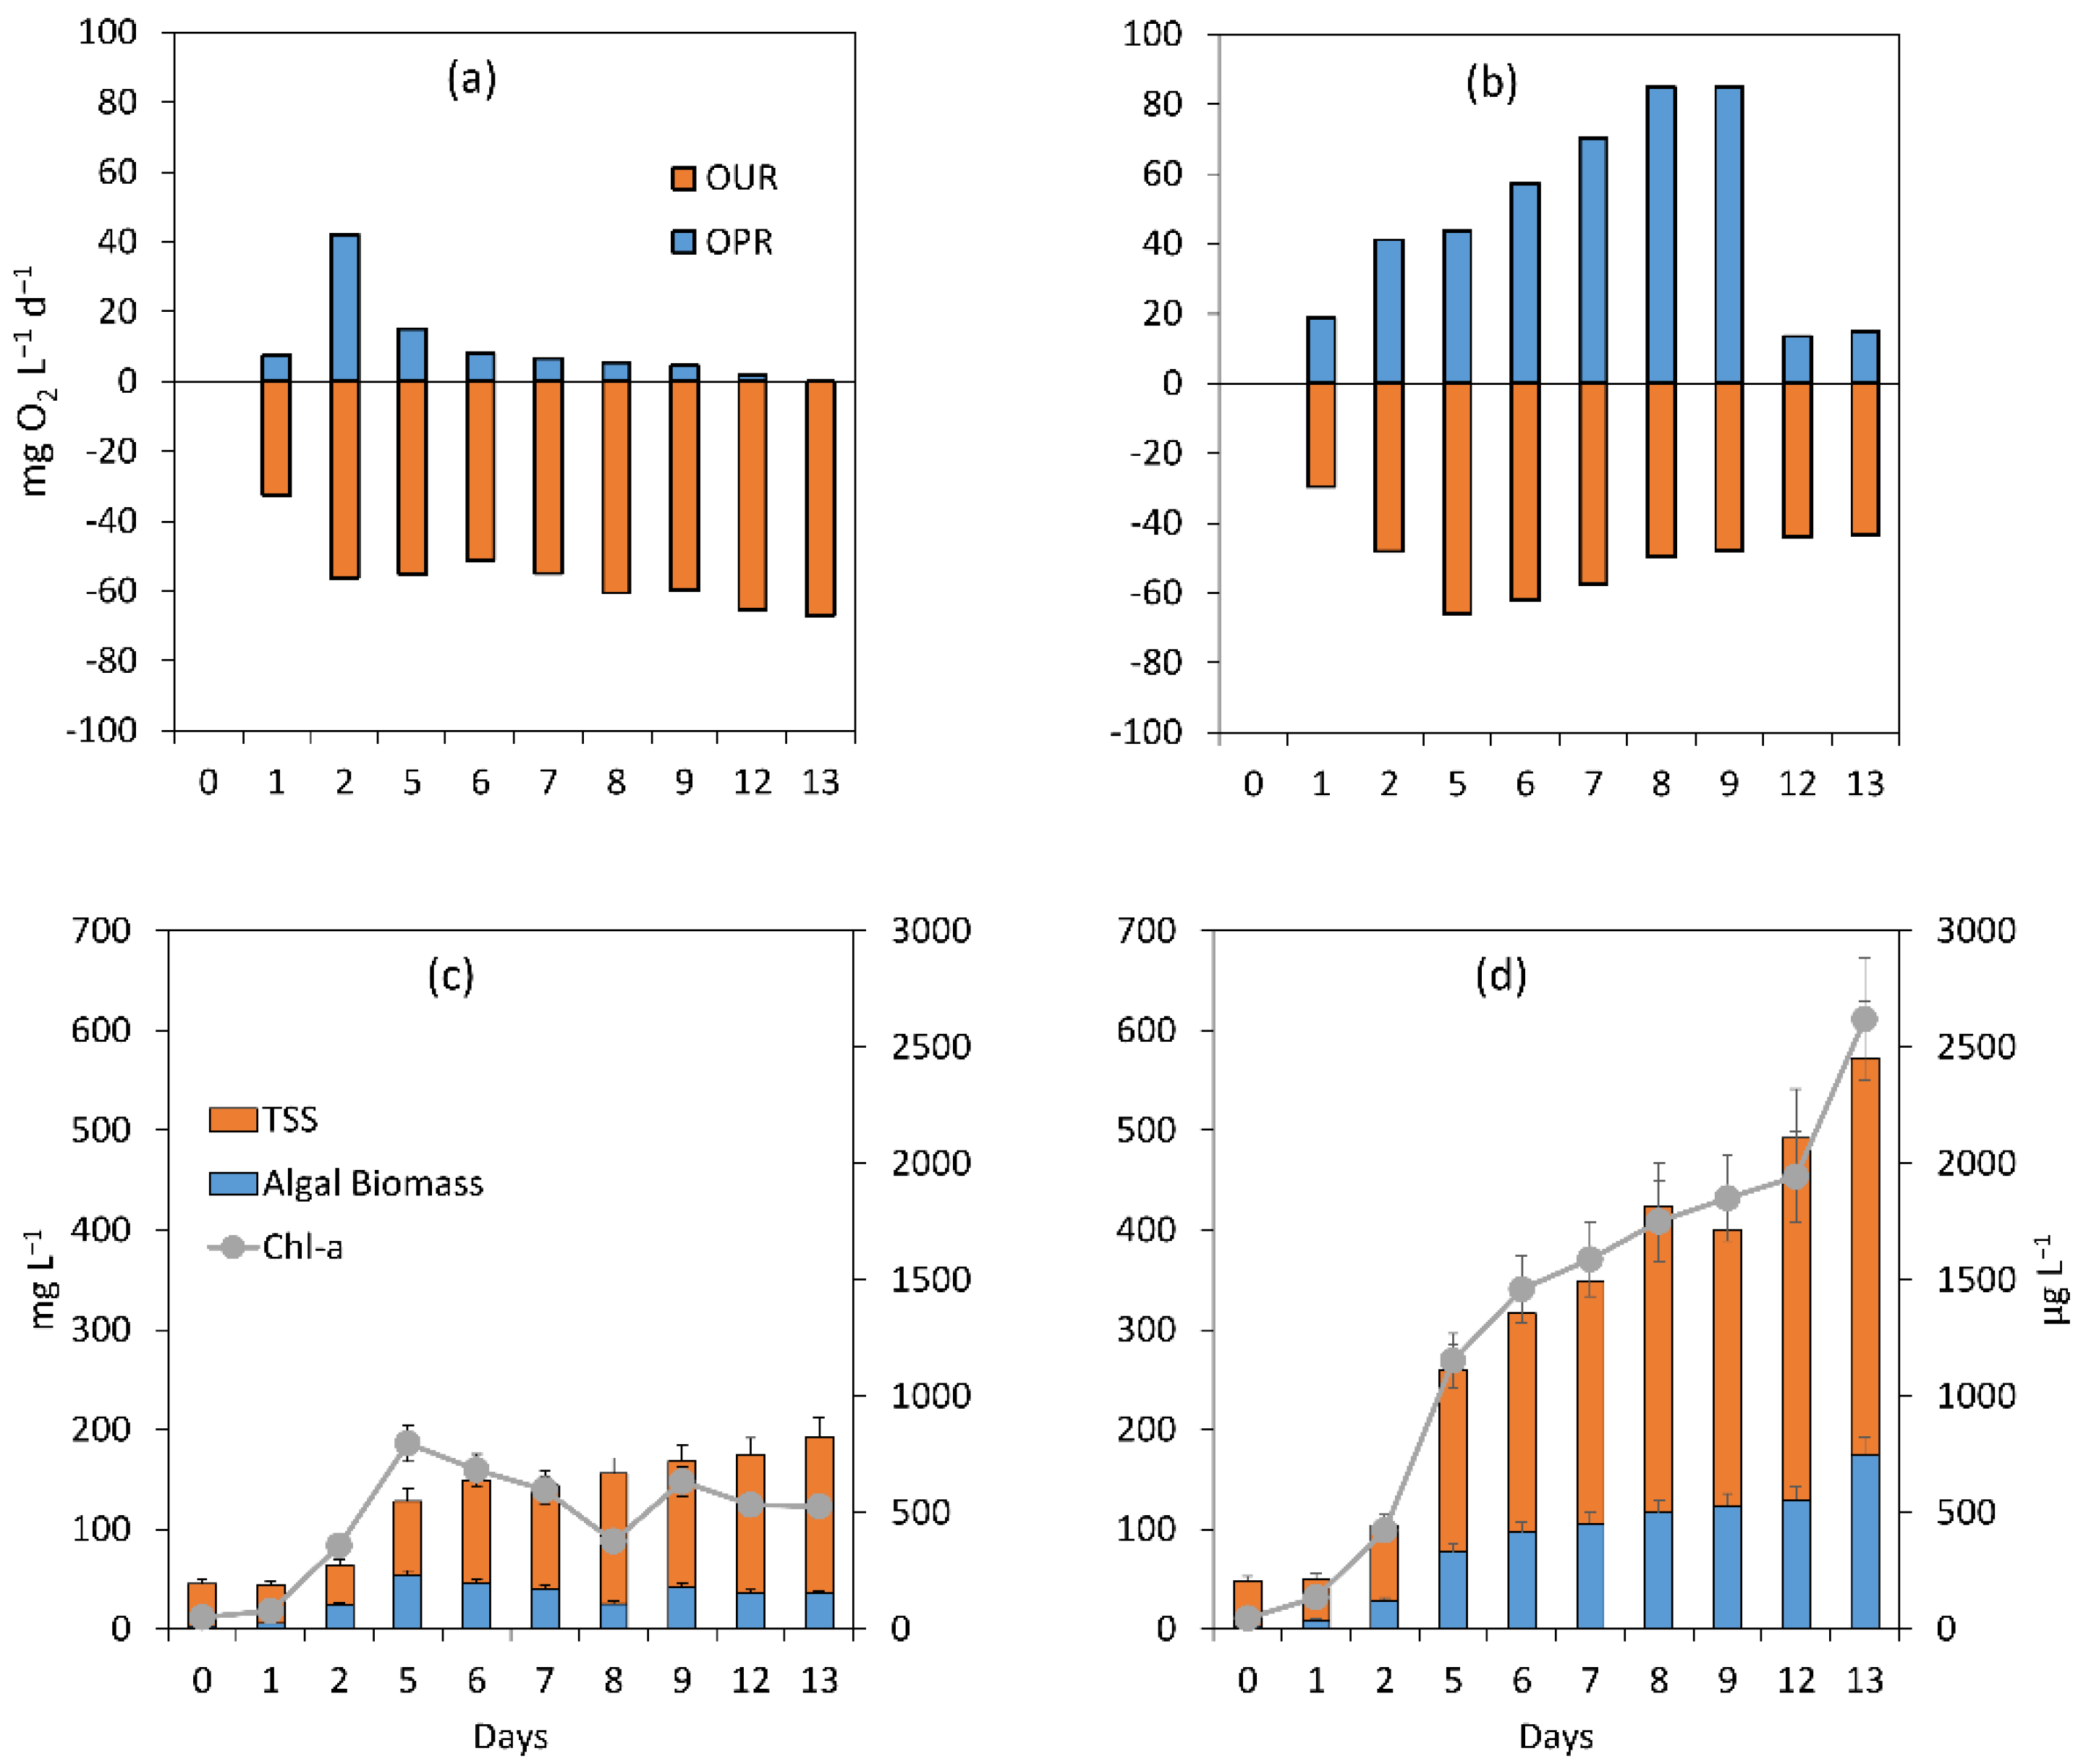
3.2.1. General Assessment of the Main Processes Governing Treatment Performance

Previous studies have suggested good tolerance of Chlorella vulgaris towards high level of ammonium in pig farming wastewater in which the microalgae could growth under the concentration from 800 to 1600 mg N L−1 of ammonium, much higher than in this study (initial concentration of 240.4 mg N L−1) [57]. Unexpectedly, the poor treatment performance obtained in HL.X10.N experiment suggests otherwise (Table 5). Both removal rates as well as removal efficiencies of nutrients achieved in this experiment were at low levels compared with the test under similar conditions but without NH4+-N addition (HL.X10, Table 3). The only exception was in the NH4+-N removal rate in which a slightly higher value was obtained (8.9 mg N L−1 d−1 of HL.X10.N versus 7.3 mg N L−1 d−1 of HL.X10). However, this result could be due to the conversion of NH4+-N to NO2-N and NO3-N forms via nitrification as the TN removal efficiency of HL.X10.N was poor. It has been indicated that a high pH level due to microalgal photosynthesis could move the NH3/NH4+ equilibrium in wastewater toward NH3 formation, raising ammonia fraction from 0.4% at pH 7 to 80% at pH 10 (water temperature of 20 °C) [64]. Therefore, the undesired performance could be attributed to the elevation of NH3 at the beginning of the experiment in which NH3 ranged from 6.0 mg N L−1 to 15.2 mg N L−1 in the first three days, hence potentially inhibiting the growth of the microalgae [65]. Indeed, it has been earlier reported that at this NH3 level, a significant reduction in bioactivities of Chlorella vulgaris was observed [66] while a reduction of 50% of their growth (EC50) was reached at 50.1 mg NH3-N L−1 [67]. In the same manner, comparable COD removal rate (4.2 mg O2 L−1) was achieved during the first five days of the HL.X10.N experiment, reducing 23.6% of total COD in digestate (Table 3). However, as a consequence of poor algal growth during the following period, COD removal was decreased, resulting in a minor total removal of organic matter.
Poor algal growth in HL.X10.N was further confirmed by low levels of microalgal bacterial biomass and microalgal biomass productivities (11.3 and 2.4 mg L−1 d−1, respectively) with low average values of DO (1.8 ± 1.9 mg O2 L−1) and pH (6.3 ± 0.8) (p values < 0.05) comparing with the HL.X10 experiment. During the first three days of the experiment, a certain level of algal growth was noticed with DO level of 3.8 ± 2.5 mg O2 L−1 and pH of 7.7 ± 0.2 which reduced to 1.2 ± 1.1 mg O2 L−1 of DO and 5.8 ± 0.2 of pH in the remaining period (p values < 0.05). A high EC level detected in HL.X10.N experiment was due to a high concentration (3.06 g L−1) of NH4Cl added to the digestate at the beginning of the test.
In contrary to HL.X10.N, high phosphorus concentration in HL.X10.P resulted in a sharp increase at phosphorus removal rate (Table 5), both in terms of TP (4.4-times higher) and PO43−-P (5-times higher) comparing to HL.X10 and other experiments (Table 3). The high removal rates performed in this experiment also resulted in high removal efficiencies (89.1 and 89.9% for TP and PO43−-P removals, respectively), comparable with other experiments at high light (HL.X5 and HL.X10, Table 3). A small enhancement was noticed in NH4+-N removal rate obtained in HL.X10.P comparing to HL.X10 (9.2 versus 7.3 mg N L−1 d−1, respectively) while no difference was found in NH4+-N removal rate and TN removal (rate and efficiency) between two experiments. In terms of organic matters oxidation, HL.X10.P showed comparable removal rate (6.7 mg O2 L−1 d−1) and removal efficiency (64.4%) (Table 5) with HL.X5 (Table 3) after the first week of the experiment. Quick removal, however, could lead to the depletion of nutrients in the reactor and hence decrease the total removal of COD. Another reason could be due to the release of carbohydrates due to the accumulation of phosphorus in algal cell resulting in a higher concentration of organic matter in the mixed liquid [68]. In general, a high level of phosphorus only led to increased TP and PO43−-P removal rate while similar performances were obtained in other aspects. It has been suggested that microalgae, including Chlorella vulgaris have the ability to store phosphorus in their cells and hence could tolerate a wide variation of N:P ratios [69]. Moreover, it has also been reported that higher phosphorus concentration in wastewater enhanced phosphorus removal whereas minor impact on growth as well as nitrogen removal via algal cellular accumulation was noticed [70]. The results in this study show similar behaviors of microalgae under high level of phosphorus as well as an improvement in bacterial activities under such condition.
The conclusion made above is supported by the similar levels (p values > 0.05) of DO, pH and EC in HL.X10.P (Table 5) comparing to the HL.X10 experiment (Table 4). Concerning biomass growth, higher growth of microalgae (derived from Chl-a data) than HL.X10 was noticed which is at the same level with HL.X5 experiment (13.2 versus 14.9 mg L−1 d−1, respectively). This is in agreement with another study reporting positive correlation between Chl-a content of microalgal cell and phosphorus concentration [71]. However, a large increase in microalgal bacterial biomass productivity, of 2-times that of the HL.X10 experiment (40.3 versus 19.8 mg L−1 d−1, respectively), was achieved. Consequently, a high value of total biomass (572 mg L−1) was obtained at the end of HL.X10.P experiment. One possible reason could be that the accumulation rate of phosphorus in microalgal cells under high concentration of phosphorus in the digestate was higher than the increasing rate of Chl-a, leading to an underestimation of microalgal biomass using Chl-a. Indeed, it has been reported that Chl-a content in microalgal cell could be varied under different culture conditions including nutrient ratio variation [72]. Since polyphosphate accumulating bacteria require anaerobic and aerobic conditions [73], adequate levels of DO (5.3 ± 3.2 mg O2 L−1) maintained in the reactor during HL.X10.P experiment suggests a minor contribution of bacteria in phosphorus removal.

3.2.2. Assessment of the Treatment Process Dynamics between Microalgae and Bacteria

The indication that high level of NH3 at the beginning of the HL.X10.N experiment could lead to poor performance in the nitrogen removal of microalgae as well as bacteria was further confirmed by assessing the nitrogen evolution in the reactor. Figure 6a shows that the effective removal of nitrogen via NH4+-N uptake and/or NH3 stripping only occurred during the first three days, accounting for 25.2% of NH4+-N removal and 8.3% of TN removal. After this short duration, nitrification became the dominant process in NH4+-N reduction as high levels of NO2-N and to some extent, NO3-N were maintained (26.2 ± 8.4 and 8.0 ± 3.8 mg N L−1 of NO2-N and NO3-N concentrations, respectively) during the remaining period of the experiment. At the same time, the TN concentration was stable around 245.4 ± 5.8 mg N L−1 in which nearly no nitrogen was actually eliminated from the digestate.
Similar to nitrogen removal, low algal growth due to the addition of NH4+-N in digestate resulted in a low level of phosphorus reduction (HL.X10.N, Figure 6c). The only significant decrease in phosphorus concentration was observed during the first three days of the experiment in which a 14.4% of TP removal was achieved. The average pH level recorded in this test was 6.3 ± 0.8 (Table 5) with the highest pH value of 8, hence the main mechanism of phosphorus removal could rely on microbial uptake. In the following period, TP concentration was maintained around a stable 4.6 ± 0.3 mg P L−1. It was also noted that PO43−-P concentration showed an increasing trend which could be due to the continuous conversion from organic phosphorus to orthophosphate [74].
Rapid removal of nitrogen was observed in the first week of the HL.X10.P experiment, leading to a complete removal of NH4+-N and 75.4% of TN (Figure 6b). The results suggest strong activities of microalgae in nitrogen removal with the dominant processes being nitrogen incorporation into the cells as well as potential NH3 gas stripping. Further reduction of TN hence could be due to quick consumption of NH4+-N converted from organic nitrogen with minor effects from nitrification represented by a low level of NO2-N and NO3-N concentrations during the test. During the second half of the experiment, only 6% of the initial TN was removed. Likewise, a strong removal of P was obtained during the first week (Figure 6d). During this period, 75.8% of TP was removed while only 13.3% reduction in TP was obtained during the second half of the experiment. The results confirm the dominant role of microalgae in nutrient removal during the first half of the HL.X10.P experiment leading to a nutrient depletion condition during the second half.

3.2.3. Microalgal Bacterial Dynamics Assessment under the Impacts of Extreme N:P Ratios

Concerning the HL.X10.N experiment, the growth of microalgae as well as total biomass were only witnessed during the first five days of the experiment (Figure 7c), in which algal biomass increased from 3.3 to 53.2 mg L−1 and from 45 to 128 mg L−1 for total biomass. This growth duration was a little longer than the active treatment period of three days observed above (Figure 6a,c) suggesting the ability of Chlorella vulgaris in withstanding the toxicity of NH3 even for a few days [66]. After this period, microalgal growth ceased, varying around 37.3 ± 7.1 mg L−1 while total biomass gradually increased to 192 mg L−1 suggesting the biomass gaining in this duration was mainly due to bacterial growth. The results are in agreement with the strong nitrification process observed at that time. Overall, poor microalgal growth was supported by the low algal content achieved in this experiment of 27.2 ± 9.1% (p value < 0.05).
OPR data (Figure 7a) were in agreement with the conclusion made above on microalgae inhibited by NH3 in digestate. During the first three days, corresponding to the active period of nutrient removal, the OPR value was 44.6 ± 8.4 mg O2 L−1 d−1 followed by a low level of 5.8 ± 4.3 mg O2 L−1 d−1 from the next day until the end of the experiment. OPR data showed good fit with the microalgal biomass evolution (Figure 7a,c) as well as the nutrient variation profiles (Figure 6a,c), confirming the reliability of using this parameter for rapid assessment of microalgal bacterial dynamics. In contrary to OPR, OUR was stable at 61.3 ± 6.4 mg O2 L−1 d−1 indicating normal activities of bacteria. The result is in agreement with the literature in which, although accumulation of NH3 could be harmful to nitrifying bacteria [75], bacterial tolerance over this substance (up to 2 g N L−1) was reported to be much higher than in the case of microalgae [76].
In the case of the HL.X10.P experiment, a steady growth of both microalgae and total biomass was obtained under phosphorus-rich condition (Figure 7d). After a lag phase in the first day, sharp increases were seen in the growth of both parameters during the first week from 50 to 316 and from 3.1 to 97.3 mg L−1 for total biomass and microalgae, respectively. As shown above, during this period, effective growth of microalgae resulted in the majority proportion of nutrients being consumed. The growths were much slower in the second half of the experiment which both microalgae and total biomass increased 1.8 times at the end of the test. This was in line with the nutrient scarcity period reported above. Surprisingly, the algal content in total biomass obtained in this experiment was 29.2 ± 1.8%, as low as the result from HL.X10.N experiment (p value > 0.05). This result further confirms the underestimation of algal biomass achieved in this study based solely on Chl-a data.
A consistent pattern was observed in daily OPR data (HL.X10.P, Figure 7b) with the OPR level of 65.4 ± 18.2 mg O2 L−1 d−1 during the first nine days of the test. At the same time, the OUR stabilized at a lower level of 52.7 ± 8.4 mg O2 L−1 d−1 (p value < 0.05), indicating the dominance of microalgae during the period. The OPR then dropped to 17.2 ± 4.1 mg O2 L−1 d−1 during the remaining period, possibly related to the low nutrient level after rapid removal while OUR remained the same.

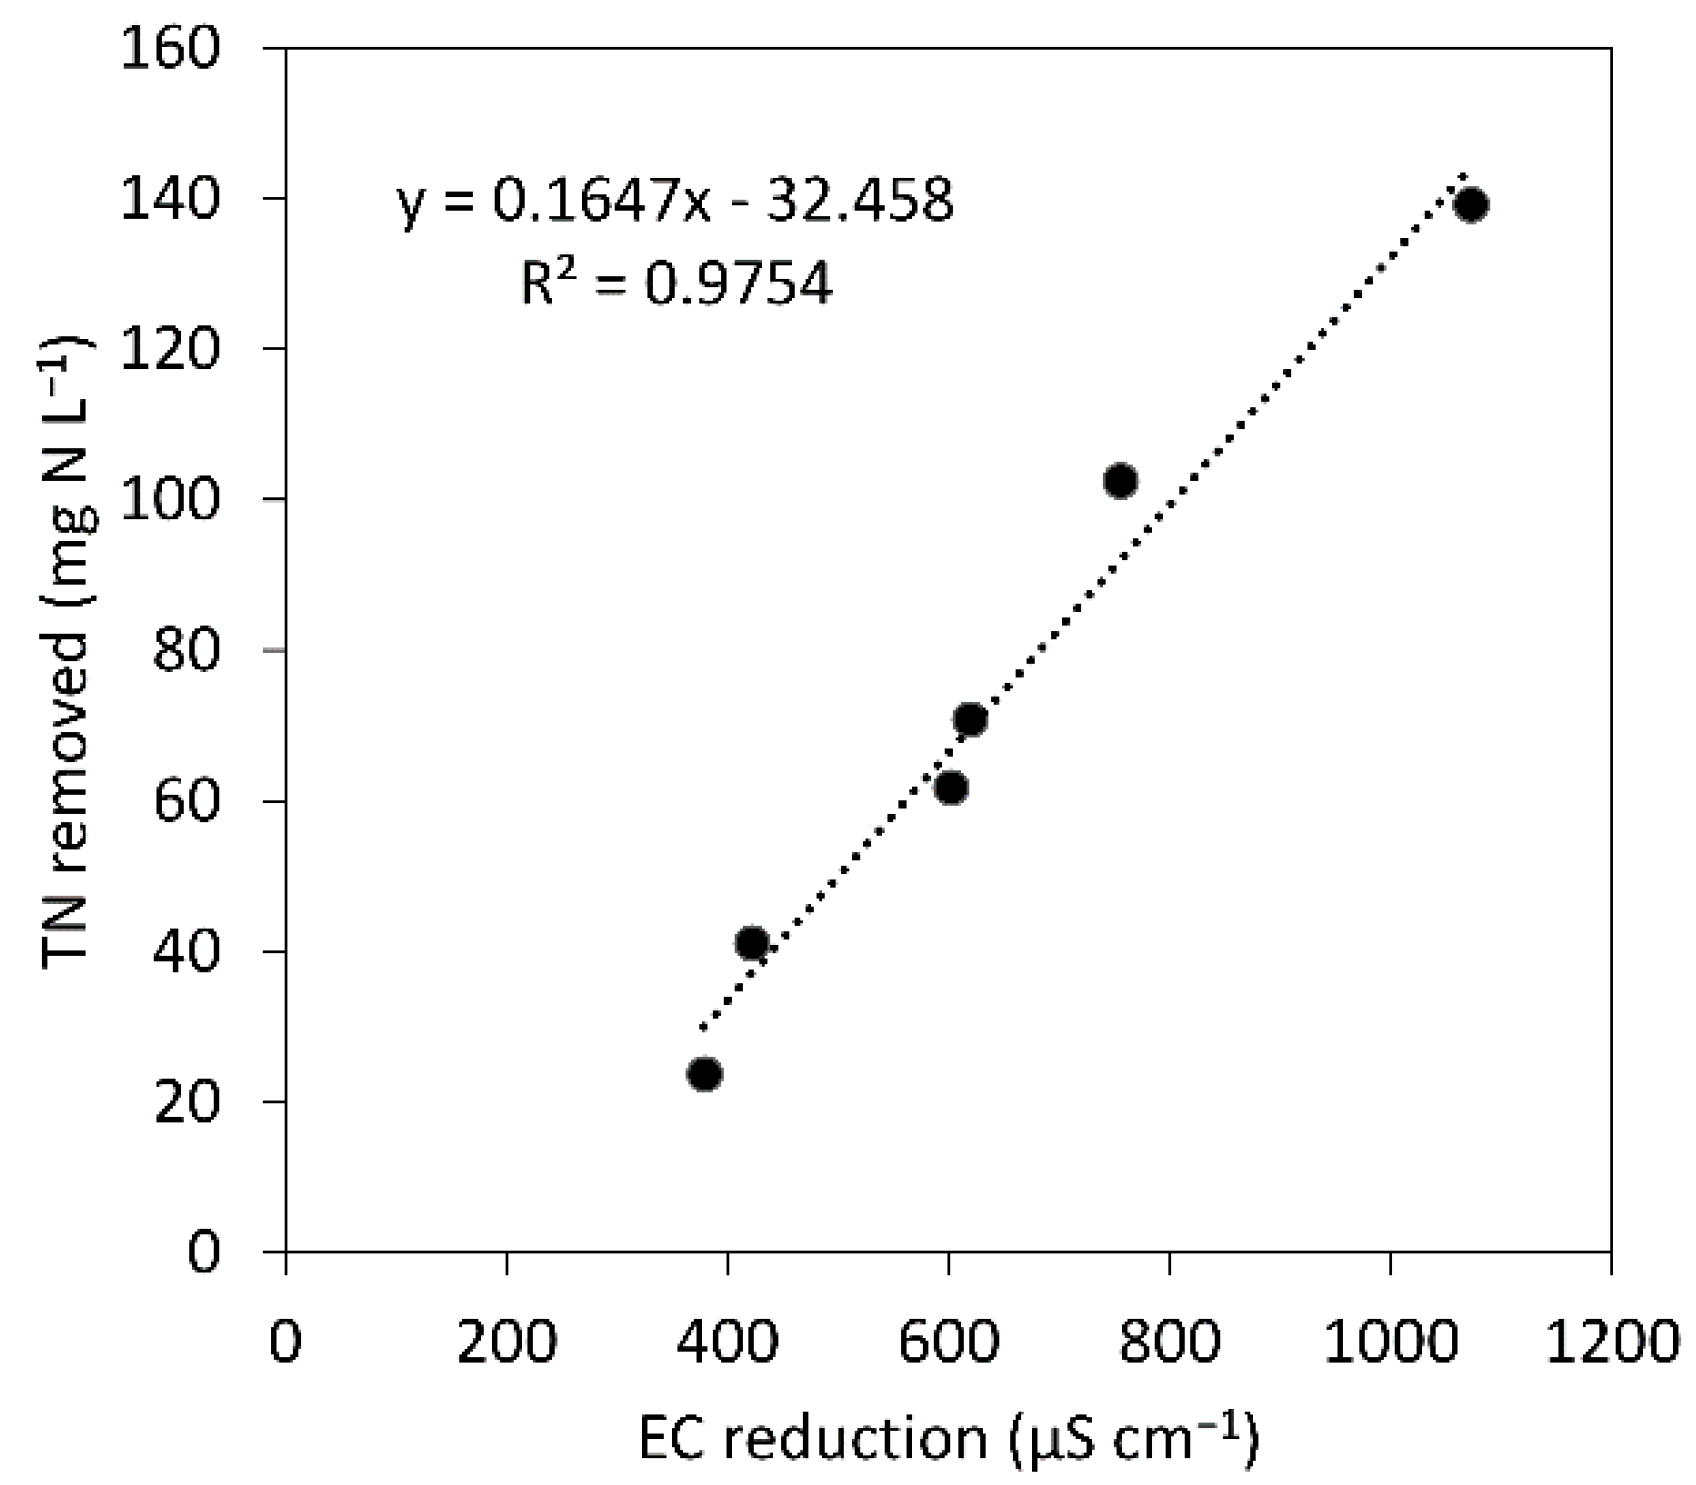
3.3. The Potential Use of Physicochemical Data for Microalgal Bacterial Dynamics Evaluation

Results from this study showed strong synchronization between nutrient, biomass as well as OPR/OUR evolution in the reactor. Hence the potential of using these conventional parameters as quick and reliable indicators of microalgal bacterial dynamics in real cases is evident. Since microalgal growth and its ability to accumulate energy-rich compounds such as carbohydrates or lipids are highly susceptible to various factors, the knowledge of microalgal status in wastewater is vital for a successful application of culturing microalgae towards biofuel production. The results of our study suggest that by regular monitoring of simple parameters, the growth of microalgae and its condition could be quickly assessed and any harmful conditions (i.e., NH3 inhibition or starvation) could be acknowledged in a short time (as short as one day). Moreover, the results could also be employed in mathematical model during calibration and validation processes.
It was also noticed that the reduction of EC recorded in each reactor showed, to some extent, synchronization with the removal of TN in the experiment (Table 4 and Table 5). Under high light conditions, as TN gradually reduced from 172.0 to 13.4 and from 89.3 to 10.9 mg N L−1, the corresponding EC levels also decreased regularly from 2342 to 1219 and from 1387 to 757 µS cm−1 in HL.X5 and HL.X10 experiments, respectively. Similar results were obtained under low light condition which EC profiles recorded in LL.X5 and LL.X10 experiments could follow the high reduction of TN due to algal uptake during the first week of the tests. During this period, EC levels reduced from 1924 to 1169 and from 1134 to 712 µS cm−1 (for LL.X5 and LL.X10, respectively) then stabilized around these values until the end of the experiments, at the same time as with low TN removals.
Strong relationships between EC and TN were also detected in HL.X10.N and HL.X10.P where a higher level of TN dynamics was observed. In the HL.X10.P experiment, rapid removal of TN in the first seven days was able to be followed by an EC profile in which a decrease from 1264 to 662 µS cm−1 was obtained, followed by a stable EC level of 647 ± 9.7 µS cm−1 in the second half of the test. The poor removal of TN in the HL.X10.N experiment was also be represented in which a short reduction of EC level from 3146 to 2767 µS cm−1 was detected during the first three days of the test while a gradual increase was followed to a value of 3081 µS cm−1 at the end. Overall, the removal of TN due to microalgae shows strong correlation with EC reduction showing an explanation of 97.54% (Figure 8). The use of EC data as indicators for online monitoring of piggery wastewater characteristics was recognized and applied intensively with high accuracy ranging from 86 to 97% [77]. This study suggests the potential application of this parameter as a quick and reliable indicator for monitoring TN removal by microalgae.
The economic gain by using physicochemical parameters to follow microalgal bacterial dynamics is evident, especially in large scale system. Indeed, via this simple process, the growth of microalgae could be quickly assessed and poor microalgal growth could be detected quickly without the need of complex mathematic models and costly chemical analysis. Earlier cost analyses have indicated that the total expenditure for producing microalgae using wastewater in open pond system could range from $0.59 to $1.08 kg−1. The production cost was highly sensitive to biomass productivity in which a 20% increase/decrease of the annual productivity could lead to a reduction/gain of 7.4/11.1% in production cost [78]. The most popular microalgal production systems, open ponds, are highly susceptible to external factors such as temperature and sun light resulting to the productivity of between 2.5 and 28 kg ha−1 h−1 [79]. The change in microalgae production cost subsequently impacts the price of biofuel, ranging from $10.87 to $13.32 gal−1 at a biomass production cost of $0.79–$0.96 kg−1 [80]. Therefore, the approach is promising in terms of reduction of chemical analysis cost as well as prevention of potential losses during the biomass production process.

4. Conclusions

In this study, the use of physicochemical data for the rapid determination of microalgal bacterial dynamics was evaluated. Batch experiments cultivating microalgae Chlorella vulgaris in real pig farming biogas digestate under different light intensities, nutrient loads and N:P ratios were conducted. The relationship between variation profiles of nutrient and biomass concentrations as well as physicochemical parameters obtained in each experiment were analyzed. Overall, higher light intensity and higher nutrient load showed improvement in both biomass growth as well as nutrient removal rate. Under ammonium-rich condition (high N:P ratio), microalgae were inhibited due to high NH3 level resulting in low biomass growth and nutrient removal. On the other hand, the addition of phosphorus (low N:P ratio) greatly enhanced phosphorus removal rate, total biomass growth and, to a lesser extent, microalgal biomass but had little effect on COD and nitrogen removal, suggesting the phosphorus accumulation effect. OPR and OUR data derived from DO profile of each experiment were highly consistent with the variation of nutrient and biomass concentrations, revealing insight into the dynamics between microalgae and bacteria in each system and allowing quantitative assessment of their actives under various conditions. Nutrient removal and biomass growth also showed high level of synchronization with the physicochemical data. Specifically, a strong linear correlation was found between TN removal and EC (R2 = 0.975), hence EC could be used as a quick and reliable indicator for TN removal estimation. Results from this study suggest the use of physicochemical data as a quick, simple and reliable method for rapid monitoring microalgal bacterial dynamics in large scale systems. The method showed potential in the reduction of economic losses due to operational failure in large scale systems, hence further optimizing microalgae-based systems toward sustainable development. Further assessment should be made on industrial scale facility over long periods as well as under the impact of other parameters such as different photoperiods or continuous cultivation modes in order to validate and optimize this method.

Author Contributions

A.L.P.: conceptualization, methodology, investigation, data curation, writing. K.D.L.: investigation, data curation, T.T.D.: supervision, conceptualization, methodology, writing—review & editing. T.M.T.D.: supervision, conceptualization, S.Q.N.: conceptualization, methodology. T.K.N.: investigation, H.C.D.: conceptualization, writing—review & editing. Q.P.T.L.: conceptualization, writing—review & editing. T.P.L.: supervision, conceptualization, methodology. All authors have read and agreed to the published version of the manuscript.

Funding

This research was funded by the Graduate University of Science and Technology (GUST), Vietnam Academy of Science and Technology (VAST), grant number GUST.STS.ĐT2020-MT03.

Institutional Review Board Statement

Not applicable.

Informed Consent Statement

Not applicable.

Data Availability Statement

Not applicable.

Acknowledgments

The authors gratefully acknowledge the International Joint Laboratory LOTUS—“Land Ocean aTmosphere regional coUpled System” and the French National Research Institute for Sustainability Development (IRD) for their support. The authors greatly appreciate the editorial team as well as reviewers who have dedicated their considerable time and expertise to improve the quality of this publication.

Conflicts of Interest

The authors declare no conflict of interest.

Nomenclature

Chl-aChlorophyll-a
CODChemical Oxygen Demand
DODissolved Oxygen
ECElectrical Conductivity
LEDLight Emitting Diode
NNitrogen
NH4+-NAmmonium nitrogen
NO2-NNitrite nitrogen
NO3-NNitrate nitrogen
OPROxygen Production Rate
OTROxygen Transfer Rate
OUROxygen Uptake Rate
ORPOxidation-Reduction Potential
PPhosphorus
PO43−-POrthophosphate
TNTotal Nitrogen
TPTotal Phosphorus
TSSTotal Suspended Solids

References

  1. Steinfeld, H.; Wassenaar, T.; Jutzi, S. Livestock Production Systems in Developing Countries: Status, Drivers, Trends. Rev. Sci. Tech. Int. Off. Epizoot. 2006, 25, 505–516. [Google Scholar] [CrossRef] [PubMed]
  2. Wei, S.; Bai, Z.H.; Qin, W.; Xia, L.J.; Oenema, O.; Jiang, R.F.; Ma, L. Environmental, Economic and Social Analysis of Peri-Urban Pig Production. J. Clean. Prod. 2016, 129, 596–607. [Google Scholar] [CrossRef]
  3. Vu, T.K.V.; Tran, M.T.; Dang, T.T.S. A Survey of Manure Management on Pig Farms in Northern Vietnam. Livest. Sci. 2007, 112, 288–297. [Google Scholar] [CrossRef]
  4. Baştabak, B.; Koçar, G. A Review of the Biogas Digestate in Agricultural Framework. J. Mater. Cycles Waste Manag. 2020, 22, 1318–1327. [Google Scholar] [CrossRef]
  5. Aditya, L.; Mahlia, T.M.I.; Nguyen, L.N.; Vu, H.P.; Nghiem, L.D. Microalgae-Bacteria Consortium for Wastewater Treatment and Biomass Production. Sci. Total Environ. 2022, 838, 155871. [Google Scholar] [CrossRef]
  6. Nguyen, T.-T.; Bui, X.-T.; Ngo, H.H.; Nguyen, T.-T.-D.; Nguyen, K.-Q.; Nguyen, H.-H.; Huynh, K.-P.-H.; Némery, J.; Fujioka, T.; Duong, C.H.; et al. Nutrient Recovery and Microalgae Biomass Production from Urine by Membrane Photobioreactor at Low Biomass Retention Times. Sci. Total Environ. 2021, 785, 147423. [Google Scholar] [CrossRef]
  7. Mata, T.M.; Martins, A.A.; Caetano, N.S. Microalgae for Biodiesel Production and Other Applications: A Review. Renew. Sustain. Energy Rev. 2010, 14, 217–232. [Google Scholar] [CrossRef] [Green Version]
  8. Sirajunnisa, A.R.; Surendhiran, D. Algae—A Quintessential and Positive Resource of Bioethanol Production: A Comprehensive Review. Renew. Sustain. Energy Rev. 2016, 66, 248–267. [Google Scholar] [CrossRef]
  9. Oswald, W.J.; Gotaas, H.B. Photosynthesis in Sewage Treatment. Trans. Am. Soc. Civ. Eng. 1957, 122, 73–97. [Google Scholar] [CrossRef]
  10. Muñoz, R.; Guieysse, B. Algal–Bacterial Processes for the Treatment of Hazardous Contaminants: A Review. Water Res. 2006, 40, 2799–2815. [Google Scholar] [CrossRef]
  11. Abdel-Raouf, N.; Al-Homaidan, A.A.; Ibraheem, I.B.M. Microalgae and Wastewater Treatment. Saudi J. Biol. Sci. 2012, 19, 257–275. [Google Scholar] [CrossRef] [Green Version]
  12. Sutherland, D.L.; Howard-Williams, C.; Turnbull, M.H.; Broady, P.A.; Craggs, R.J. Enhancing Microalgal Photosynthesis and Productivity in Wastewater Treatment High Rate Algal Ponds for Biofuel Production. Bioresour. Technol. 2015, 184, 222–229. [Google Scholar] [CrossRef]
  13. Wang, Y.; Ho, S.-H.; Cheng, C.-L.; Guo, W.-Q.; Nagarajan, D.; Ren, N.-Q.; Lee, D.-J.; Chang, J.-S. Perspectives on the Feasibility of Using Microalgae for Industrial Wastewater Treatment. Bioresour. Technol. 2016, 222, 485–497. [Google Scholar] [CrossRef]
  14. Rawat, I.; Ranjith Kumar, R.; Mutanda, T.; Bux, F. Dual Role of Microalgae: Phycoremediation of Domestic Wastewater and Biomass Production for Sustainable Biofuels Production. Appl. Energy 2011, 88, 3411–3424. [Google Scholar] [CrossRef]
  15. Ramanan, R.; Kim, B.-H.; Cho, D.-H.; Oh, H.-M.; Kim, H.-S. Algae–Bacteria Interactions: Evolution, Ecology and Emerging Applications. Biotechnol. Adv. 2016, 34, 14–29. [Google Scholar] [CrossRef] [Green Version]
  16. Qu, W.; Zhang, C.; Chen, X.; Ho, S.-H. New Concept in Swine Wastewater Treatment: Development of a Self-Sustaining Synergetic Microalgae-Bacteria Symbiosis (ABS) System to Achieve Environmental Sustainability. J. Hazard. Mater. 2021, 418, 126264. [Google Scholar] [CrossRef]
  17. Van Den Hende, S.; Beelen, V.; Bore, G.; Boon, N.; Vervaeren, H. Up-Scaling Aquaculture Wastewater Treatment by Microalgal Bacterial Flocs: From Lab Reactors to an Outdoor Raceway Pond. Bioresour. Technol. 2014, 159, 342–354. [Google Scholar] [CrossRef]
  18. Sutherland, D.L.; Turnbull, M.H.; Craggs, R.J. Environmental Drivers That Influence Microalgal Species in Fullscale Wastewater Treatment High Rate Algal Ponds. Water Res. 2017, 124, 504–512. [Google Scholar] [CrossRef]
  19. García, D.; Posadas, E.; Blanco, S.; Acién, G.; García-Encina, P.; Bolado, S.; Muñoz, R. Evaluation of the Dynamics of Microalgae Population Structure and Process Performance during Piggery Wastewater Treatment in Algal-Bacterial Photobioreactors. Bioresour. Technol. 2018, 248, 120–126. [Google Scholar] [CrossRef] [Green Version]
  20. Pham, L.A.; Laurent, J.; Bois, P.; Wanko, A. Finding Optimal Algal/Bacterial Inoculation Ratio to Improve Algal Biomass Growth with Wastewater as Nutrient Source. Water SA 2019, 45, 624–631. [Google Scholar] [CrossRef] [Green Version]
  21. Su, Y.; Mennerich, A.; Urban, B. Synergistic Cooperation between Wastewater-Born Algae and Activated Sludge for Wastewater Treatment: Influence of Algae and Sludge Inoculation Ratios. Bioresour. Technol. 2012, 105, 67–73. [Google Scholar] [CrossRef]
  22. Zambrano, J.; Krustok, I.; Nehrenheim, E.; Carlsson, B. A Simple Model for Algae-Bacteria Interaction in Photo-Bioreactors. Algal Res. 2016, 19, 155–161. [Google Scholar] [CrossRef]
  23. Solimeno, A.; Parker, L.; Lundquist, T.; García, J. Integral Microalgae-Bacteria Model (BIO_ALGAE): Application to Wastewater High Rate Algal Ponds. Sci. Total Environ. 2017, 601–602, 646–657. [Google Scholar] [CrossRef] [Green Version]
  24. Wágner, D.S.; Valverde-Pérez, B.; Sæbø, M.; Bregua de la Sotilla, M.; Van Wagenen, J.; Smets, B.F.; Plósz, B.G. Towards a Consensus-Based Biokinetic Model for Green Microalgae—The ASM-A. Water Res. 2016, 103, 485–499. [Google Scholar] [CrossRef] [Green Version]
  25. Solimeno, A.; García, J. Microalgae-Bacteria Models Evolution: From Microalgae Steady-State to Integrated Microalgae-Bacteria Wastewater Treatment Models—A Comparative Review. Sci. Total Environ. 2017, 607–608, 1136–1150. [Google Scholar] [CrossRef]
  26. Vergara, C.; Muñoz, R.; Campos, J.L.; Seeger, M.; Jeison, D. Influence of Light Intensity on Bacterial Nitrifying Activity in Algal-Bacterial Photobioreactors and Its Implications for Microalgae-Based Wastewater Treatment. Int. Biodeterior. Biodegrad. 2016, 114, 116–121. [Google Scholar] [CrossRef]
  27. Decostere, B.; Van Hulle, S.W.; Duyck, M.; Maere, T.; Vervaeren, H.; Nopens, I. The Use of a Combined Respirometric–Titrimetric Setup to Assess the Effect of Environmental Conditions on Micro-Algal Growth Rate. J. Chem. Technol. Biotechnol. 2014, 91, 248–256. [Google Scholar] [CrossRef]
  28. Flores-Salgado, G.; Thalasso, F.; Buitrón, G.; Vital-Jácome, M.; Quijano, G. Kinetic Characterization of Microalgal-Bacterial Systems: Contributions of Microalgae and Heterotrophic Bacteria to the Oxygen Balance in Wastewater Treatment. Biochem. Eng. J. 2021, 165, 107819. [Google Scholar] [CrossRef]
  29. Zanetti, L.; Frison, N.; Nota, E.; Tomizioli, M.; Bolzonella, D.; Fatone, F. Progress in Real-Time Control Applied to Biological Nitrogen Removal from Wastewater. A Short-Review. Desalination 2012, 286, 1–7. [Google Scholar] [CrossRef]
  30. Zhao, W.; Zhang, Y.; Lv, D.; Wang, M.; Peng, Y.; Li, B. Advanced Nitrogen and Phosphorus Removal in the Pre-Denitrification Anaerobic/Anoxic/Aerobic Nitrification Sequence Batch Reactor (Pre-A2NSBR) Treating Low Carbon/Nitrogen (C/N) Wastewater. Chem. Eng. J. 2016, 302, 296–304. [Google Scholar] [CrossRef]
  31. Robles, Á.; Capson-Tojo, G.; Gales, A.; Viruela, A.; Sialve, B.; Seco, A.; Steyer, J.-P.; Ferrer, J. Performance of a Membrane-Coupled High-Rate Algal Pond for Urban Wastewater Treatment at Demonstration Scale. Bioresour. Technol. 2020, 301, 122672. [Google Scholar] [CrossRef] [PubMed]
  32. Foladori, P.; Petrini, S.; Andreottola, G. Evolution of Real Municipal Wastewater Treatment in Photobioreactors and Microalgae-Bacteria Consortia Using Real-Time Parameters. Chem. Eng. J. 2018, 345, 507–516. [Google Scholar] [CrossRef]
  33. Pham, L.A.; Laurent, J.; Bois, P.; Teshome, T.M.; Wanko, A. Operating a Semi-Continuous Raceway Pond Allows to Link PH and Oxygen Dynamics to the Interaction between Microalgae and Bacteria. Desalin. Water Treat. 2021, 211, 105–116. [Google Scholar] [CrossRef]
  34. Su, Y.; Mennerich, A.; Urban, B. Municipal Wastewater Treatment and Biomass Accumulation with a Wastewater-Born and Settleable Algal-Bacterial Culture. Water Res. 2011, 45, 3351–3358. [Google Scholar] [CrossRef]
  35. Park, J.B.K.; Craggs, R.J.; Shilton, A.N. Wastewater Treatment High Rate Algal Ponds for Biofuel Production. Bioresour. Technol. 2011, 102, 35–42. [Google Scholar] [CrossRef]
  36. Gonçalves, A.L.; Simões, M.; Pires, J.C.M. The Effect of Light Supply on Microalgal Growth, CO2 Uptake and Nutrient Removal from Wastewater. Energy Convers. Manag. 2014, 85, 530–536. [Google Scholar] [CrossRef] [Green Version]
  37. Iasimone, F.; Panico, A.; De Felice, V.; Fantasma, F.; Iorizzi, M.; Pirozzi, F. Effect of Light Intensity and Nutrients Supply on Microalgae Cultivated in Urban Wastewater: Biomass Production, Lipids Accumulation and Settleability Characteristics. J. Environ. Manag. 2018, 223, 1078–1085. [Google Scholar] [CrossRef]
  38. Ferreira, V.S.; Pinto, R.F.; Sant’Anna, C. Low Light Intensity and Nitrogen Starvation Modulate the Chlorophyll Content of Scenedesmus dimorphus. J. Appl. Microbiol. 2016, 120, 661–670. [Google Scholar] [CrossRef] [Green Version]
  39. Xin, L.; Hong-ying, H.; Ke, G.; Jia, Y. Growth and Nutrient Removal Properties of a Freshwater Microalga Scenedesmus Sp. LX1 under Different Kinds of Nitrogen Sources. Ecol. Eng. 2010, 36, 379–381. [Google Scholar] [CrossRef]
  40. Yu, B.S.; Sung, Y.J.; Hong, M.E.; Sim, S.J. Improvement of Photoautotrophic Algal Biomass Production after Interrupted CO2 Supply by Urea and KH2PO4 Injection. Energies 2021, 14, 778. [Google Scholar] [CrossRef]
  41. Lorenzen, C.J. Determination of Chlorophyll and Pheo-Pigments: Spectrophotometric Equations1. Limnol. Oceanogr. 1967, 12, 343–346. [Google Scholar] [CrossRef]
  42. Park, J.; Craggs, R. Wastewater Treatment and Algal Production in High Rate Algal Ponds with Carbon Dioxide Addition. Water Sci. Technol. 2010, 61, 633–639. [Google Scholar] [CrossRef]
  43. Garcia-Ochoa, F.; Gomez, E. Bioreactor Scale-up and Oxygen Transfer Rate in Microbial Processes: An Overview. Biotechnol. Adv. 2009, 27, 153–176. [Google Scholar] [CrossRef]
  44. Pham, L.A.; Laurent, J.; Bois, P.; Wanko, A. Impacts of Operational Conditions on Oxygen Transfer Rate, Mixing Characteristics and Residence Time Distribution in a Pilot Scale High Rate Algal Pond. Water Sci. Technol. 2018, 78, 1782–1791. [Google Scholar] [CrossRef]
  45. López-Pacheco, I.Y.; Carrillo-Nieves, D.; Salinas-Salazar, C.; Silva-Núñez, A.; Arévalo-Gallegos, A.; Barceló, D.; Afewerki, S.; Iqbal, H.M.N.; Parra-Saldívar, R. Combination of Nejayote and Swine Wastewater as a Medium for Arthrospira maxima and Chlorella vulgaris Production and Wastewater Treatment. Sci. Total Environ. 2019, 676, 356–367. [Google Scholar] [CrossRef]
  46. Gonçalves, A.L.; Pires, J.C.M.; Simões, M. A Review on the Use of Microalgal Consortia for Wastewater Treatment. Algal Res. 2017, 24, 403–415. [Google Scholar] [CrossRef]
  47. Shi, P.; Shen, H.; Wang, W.; Chen, W.; Xie, P. The Relationship between Light Intensity and Nutrient Uptake Kinetics in Six Freshwater Diatoms. J. Environ. Sci. 2015, 34, 28–36. [Google Scholar] [CrossRef]
  48. Sutherland, D.L.; Turnbull, M.H.; Broady, P.A.; Craggs, R.J. Effects of Two Different Nutrient Loads on Microalgal Production, Nutrient Removal and Photosynthetic Efficiency in Pilot-Scale Wastewater High Rate Algal Ponds. Water Res. 2014, 66, 53–62. [Google Scholar] [CrossRef]
  49. Wang, Y.; Guo, W.; Yen, H.-W.; Ho, S.-H.; Lo, Y.-C.; Cheng, C.-L.; Ren, N.; Chang, J.-S. Cultivation of Chlorella vulgaris JSC-6 with Swine Wastewater for Simultaneous Nutrient/COD Removal and Carbohydrate Production. Bioresour. Technol. 2015, 198, 619–625. [Google Scholar] [CrossRef]
  50. Alcántara, C.; Domínguez, J.M.; García, D.; Blanco, S.; Pérez, R.; García-Encina, P.A.; Muñoz, R. Evaluation of Wastewater Treatment in a Novel Anoxic–Aerobic Algal–Bacterial Photobioreactor with Biomass Recycling through Carbon and Nitrogen Mass Balances. Bioresour. Technol. 2015, 191, 173–186. [Google Scholar] [CrossRef]
  51. Arashiro, L.T.; Ferrer, I.; Rousseau, D.P.L.; Van Hulle, S.W.H.; Garfí, M. The Effect of Primary Treatment of Wastewater in High Rate Algal Pond Systems: Biomass and Bioenergy Recovery. Bioresour. Technol. 2019, 280, 27–36. [Google Scholar] [CrossRef] [PubMed] [Green Version]
  52. Lage, S.; Toffolo, A.; Gentili, F.G. Microalgal Growth, Nitrogen Uptake and Storage, and Dissolved Oxygen Production in a Polyculture Based-Open Pond Fed with Municipal Wastewater in Northern Sweden. Chemosphere 2021, 276, 130122. [Google Scholar] [CrossRef] [PubMed]
  53. Prieto, F.; Barrado, E.; Vega, M.; Deban, L. Measurement of Electrical Conductivity of Wastewater for Fast Determination of Metal Ion Concentration. Russ. J. Appl. Chem. 2001, 74, 1321–1324. [Google Scholar] [CrossRef]
  54. De Sousa, D.N.R.; Mozeto, A.A.; Carneiro, R.L.; Fadini, P.S. Electrical Conductivity and Emerging Contaminant as Markers of Surface Freshwater Contamination by Wastewater. Sci. Total Environ. 2014, 484, 19–26. [Google Scholar] [CrossRef]
  55. Žitnik, M.; Šunta, U.; Godič Torkar, K.; Krivograd Klemenčič, A.; Atanasova, N.; Griessler Bulc, T. The Study of Interactions and Removal Efficiency of Escherichia coli in Raw Blackwater Treated by Microalgae Chlorella vulgaris. J. Clean. Prod. 2019, 238, 117865. [Google Scholar] [CrossRef]
  56. Renuka, N.; Sood, A.; Ratha, S.K.; Prasanna, R.; Ahluwalia, A.S. Nutrient Sequestration, Biomass Production by Microalgae and Phytoremediation of Sewage Water. Int. J. Phytoremediat. 2013, 15, 789–800. [Google Scholar] [CrossRef]
  57. Ayre, J.M.; Moheimani, N.R.; Borowitzka, M.A. Growth of Microalgae on Undiluted Anaerobic Digestate of Piggery Effluent with High Ammonium Concentrations. Algal Res. 2017, 24, 218–226. [Google Scholar] [CrossRef] [Green Version]
  58. Zheng, H.; Wu, X.; Zou, G.; Zhou, T.; Liu, Y.; Ruan, R. Cultivation of Chlorella vulgaris in Manure-Free Piggery Wastewater with High-Strength Ammonium for Nutrients Removal and Biomass Production: Effect of Ammonium Concentration, Carbon/Nitrogen Ratio and PH. Bioresour. Technol. 2019, 273, 203–211. [Google Scholar] [CrossRef]
  59. Munz, G.; Lubello, C.; Oleszkiewicz, J.A. Factors Affecting the Growth Rates of Ammonium and Nitrite Oxidizing Bacteria. Chemosphere 2011, 83, 720–725. [Google Scholar] [CrossRef]
  60. Wang, J.; Liu, J.; Liu, T. The Difference in Effective Light Penetration May Explain the Superiority in Photosynthetic Efficiency of Attached Cultivation over the Conventional Open Pond for Microalgae. Biotechnol. Biofuels 2015, 8, 49. [Google Scholar] [CrossRef] [Green Version]
  61. Arango, L.; Cuervo, F.M.; González-Sánchez, A.; Buitrón, G. Effect of Microalgae Inoculation on the Start-up of Microalgae-Bacteria Systems Treating Municipal, Piggery and Digestate Wastewaters. Water Sci. Technol. J. Int. Assoc. Water Pollut. Res. 2016, 73, 687–696. [Google Scholar] [CrossRef]
  62. Park, J.B.K.; Craggs, R.J. Nutrient Removal in Wastewater Treatment High Rate Algal Ponds with Carbon Dioxide Addition. Water Sci. Technol. J. Int. Assoc. Water Pollut. Res. 2011, 63, 1758–1764. [Google Scholar] [CrossRef]
  63. Casagli, F.; Zuccaro, G.; Bernard, O.; Steyer, J.-P.; Ficara, E. ALBA: A Comprehensive Growth Model to Optimize Algae-Bacteria Wastewater Treatment in Raceway Ponds. Water Res. 2021, 190, 116734. [Google Scholar] [CrossRef]
  64. Li, L.; Lollar, B.S.; Li, H.; Wortmann, U.G.; Lacrampe-Couloume, G. Ammonium Stability and Nitrogen Isotope Fractionations for NH4+–NH3(Aq)–NH3(Gas) Systems at 20–70 °C and PH of 2–13: Applications to Habitability and Nitrogen Cycling in Low-Temperature Hydrothermal Systems. Geochim. Cosmochim. Acta 2012, 84, 280–296. [Google Scholar] [CrossRef]
  65. Collos, Y.; Harrison, P.J. Acclimation and Toxicity of High Ammonium Concentrations to Unicellular Algae. Mar. Pollut. Bull. 2014, 80, 8–23. [Google Scholar] [CrossRef]
  66. Markou, G.; Depraetere, O.; Muylaert, K. Effect of Ammonia on the Photosynthetic Activity of Arthrospira and Chlorella: A Study on Chlorophyll Fluorescence and Electron Transport. Algal Res. 2016, 16, 449–457. [Google Scholar] [CrossRef]
  67. Rossi, S.; Díez-Montero, R.; Rueda, E.; Castillo Cascino, F.; Parati, K.; García, J.; Ficara, E. Free Ammonia Inhibition in Microalgae and Cyanobacteria Grown in Wastewaters: Photo-Respirometric Evaluation and Modelling. Bioresour. Technol. 2020, 305, 123046. [Google Scholar] [CrossRef]
  68. Zhu, S.; Wang, Y.; Xu, J.; Shang, C.; Wang, Z.; Xu, J.; Yuan, Z. Luxury Uptake of Phosphorus Changes the Accumulation of Starch and Lipid in Chlorella sp. under Nitrogen Depletion. Bioresour. Technol. 2015, 198, 165–171. [Google Scholar] [CrossRef]
  69. Xin, L.; Hong-ying, H.; Ke, G.; Ying-xue, S. Effects of Different Nitrogen and Phosphorus Concentrations on the Growth, Nutrient Uptake, and Lipid Accumulation of a Freshwater Microalga Scenedesmus sp. Bioresour. Technol. 2010, 101, 5494–5500. [Google Scholar] [CrossRef]
  70. Marcilhac, C.; Sialve, B.; Pourcher, A.-M.; Ziebal, C.; Bernet, N.; Béline, F. Control of Nitrogen Behaviour by Phosphate Concentration during Microalgal-Bacterial Cultivation Using Digestate. Bioresour. Technol. 2015, 175, 224–230. [Google Scholar] [CrossRef]
  71. Chen, M.; Li, J.; Dai, X.; Sun, Y.; Chen, F. Effect of Phosphorus and Temperature on Chlorophyll a Contents and Cell Sizes of Scenedesmus obliquus and Microcystis aeruginosa. Limnology 2011, 12, 187–192. [Google Scholar] [CrossRef]
  72. Da Silva Ferreira, V.; Sant’Anna, C. Impact of Culture Conditions on the Chlorophyll Content of Microalgae for Biotechnological Applications. World J. Microbiol. Biotechnol. 2016, 33, 20. [Google Scholar] [CrossRef]
  73. Muduli, M.; Sonpal, V.; Trivedi, K.; Haldar, S.; Kumar, M.A.; Ray, S. 12—Enhanced Biological Phosphate Removal Process for Wastewater Treatment: A Sustainable Approach. In Wastewater Treatment Reactors; Shah, M.P., Rodriguez-Couto, S., Eds.; Elsevier: Amsterdam, The Netherlands, 2021; pp. 273–287. ISBN 978-0-12-823991-9. [Google Scholar]
  74. Zhang, X.; Li, J.; Fan, W.-Y.; Sheng, G.-P. Photomineralization of Effluent Organic Phosphorus to Orthophosphate under Simulated Light Illumination. Environ. Sci. Technol. 2019, 53, 4997–5004. [Google Scholar] [CrossRef]
  75. Camargo, J.A.; Alonso, Á. Ecological and Toxicological Effects of Inorganic Nitrogen Pollution in Aquatic Ecosystems: A Global Assessment. Environ. Int. 2006, 32, 831–849. [Google Scholar] [CrossRef]
  76. Yang, X.; Xu, M.; Zou, R.; Angelidaki, I.; Zhang, Y. Microbial Protein Production from CO2, H2, and Recycled Nitrogen: Focusing on Ammonia Toxicity and Nitrogen Sources. J. Clean. Prod. 2021, 291, 125921. [Google Scholar] [CrossRef]
  77. Su, J.-J.; Ding, S.-T.; Chung, H.-C. Establishing a Smart Farm-Scale Piggery Wastewater Treatment System with the Internet of Things (IoT) Applications. Water 2020, 12, 1654. [Google Scholar] [CrossRef]
  78. Hoffman, J.; Pate, R.C.; Drennen, T.; Quinn, J.C. Techno-Economic Assessment of Open Microalgae Production Systems. Algal Res. 2017, 23, 51–57. [Google Scholar] [CrossRef] [Green Version]
  79. Banerjee, S.; Ramaswamy, S. Dynamic Process Model and Economic Analysis of Microalgae Cultivation in Open Raceway Ponds. Algal Res. 2017, 26, 330–340. [Google Scholar] [CrossRef]
  80. Sun, A.; Davis, R.; Starbuck, M.; Ben-Amotz, A.; Pate, R.; Pienkos, P.T. Comparative Cost Analysis of Algal Oil Production for Biofuels. Energy 2011, 36, 5169–5179. [Google Scholar] [CrossRef]
Figure 1. General illustration of the experimental setup (a) and picture of the real setup (b).
Water 14 02275 g001
Figure 2. Concentration of different nitrogen forms in the reactors under the impacts of light and nutrient load. (a) HL.X5, (b) HL.X10, (c) LL.X5 and (d) LL.X10.
Water 14 02275 g002
Figure 3. Concentration of TP and PO43−-P in the reactors under the impacts of light and nutrient load. (a) HL.X5, (b) HL.X10, (c) LL.X5 and (d) LL.X10.
Water 14 02275 g003
Figure 4. Biomass evolution including TSS, microalgal biomass (mg L−1) and Chl-a (µg L−1) under the impacts of light and nutrient load. (a) HL.X5, (b) HL.X10, (c) LL.X5 and (d) LL.X10.
Water 14 02275 g004
Figure 5. Calculated daily OUR and OPR for different experiments under the impacts of light and nutrient load. (a) HL.X5, (b) HL.X10, (c) LL.X5 and (d) LL.X10.
Water 14 02275 g005
Figure 6. Concentration of nitrogen (a) HL.X10.N, (b) HL.X10.P and phosphorus (c) HL.X10.N, (d) HL.X10.P in the reactors under the impacts of extreme N:P ratios.
Water 14 02275 g006
Figure 7. Daily OUR and OPR (a) HL.X10.N, (b) HL.X10.P and biomass evolution (c) HL.X10.N, (d) HL.X10.P including TSS, microalgal biomass (mg L−1) and Chl-a (µg L−1) under the impacts of extreme N:P ratios.
Water 14 02275 g007
Figure 8. Linear correlation between the amounts of TN removed and the corresponding reduction of EC recorded at the same period in all experiments.
Water 14 02275 g008
Table 1. Initial characteristics (average with standard deviation) of filtered biogas digestate and its diluted wastewater (X5 and X10 stand for 5- and 10- times dilution, respectively) used in this study.
ParametersFiltered WastewaterX5X10
COD (mg COD L−1)1173.3 ± 200.6166 ± 31.193.5 ± 2.1
TN (mg N L−1)777.2 ± 103.8167.9 ± 5.880.3 ± 12.7
NH4+-N (mg N L−1)625.3 ± 174.1120.7 ± 39.567.8 ± 28.1
NO2-N (mg N L−1)0.16 ± 0.030.18 ± 0.050.16 ± 0.08
NO3-N (mg N L−1)0.19 ± 0.245.4 ± 1.26.9 ± 1.3
TP (mg P L−1)35.9 ± 6.06.9 ± 2.43.9 ± 1.2
PO43−-P (mg P L−1)25.8 ± 5.63.5 ± 0.32.7 ± 0.9
TSS (mg L−1)369.8 ± 141.677.0 ± 38.244.3 ± 31.6
Table 2. Operational characteristics of different experiments.
StageNameLight Intensity (μE s−1 m−2)N:P RatioNutrient Load (Dilution)
1HL.X5High (12.7 ± 3.1)22.1 ± 3.4High (x5)
HL.X10High (12.7 ± 3.1)22.1 ± 3.4Low (x10)
2LL.X5Low (5.9 ± 2.5)22.1 ± 3.4High (x5)
LL.X10Low (5.9 ± 2.5)22.1 ± 3.4Low (x10)
3HL.X10.NHigh (12.7 ± 3.1)High (53.2)Low (x10)
HL.X10.PHigh (12.7 ± 3.1)Low (4.2)Low (x10)
Table 3. Treatment performance including removal rate and removal efficiency under the impacts of light and nutrient load.
Parameters HL.X5HL.X10LL.X5LL.X10
COD removalRate (mg L−1 d−1)6.84.64.03.8
Efficiency (%)46.865.236.151.6
TN removalRate (mg L−1 d−1)12.26.09.53.4
Efficiency (%)92.287.875.561.3
NH4+-N removalRate (mg L−1 d−1)11.47.313.26.8
Efficiency (%)10010010099.2
TP removalRate (mg L−1 d−1)0.520.300.330.17
Efficiency (%)78.781.282.471.8
PO43−-P removalRate (mg L−1 d−1)0.230.250.220.10
Efficiency (%)79.997.486.165.1
Table 4. Average values of physicochemical parameters (with standard deviations) and biomass production rate under the impacts of light and nutrient load.
ExperimentsDO (mg L−1)pHEC (µS cm−1)TSS Production Rate (mg L−1 d−1)Microalgal Production Rate (mg L−1 d−1)
HL.X55.2 ± 3.39.1 ± 0.31725.8 ± 395.120.614.9
HL.X106.2 ± 2.69.0 ± 0.4996.4 ± 215.519.89.2
LL.X55.3 ± 2.78.9 ± 0.91390.0 ± 275.918.37.9
LL.X104.2 ± 3.88.6 ± 0.7836.2 ± 137.215.57.1
Table 5. Microalgal bacterial performance including average removal rate, removal efficiency, biomass production rate and physicochemical parameters (with standard deviations) under the impacts of extreme N:P ratios.
Parameters HL.X10.NL.X10.P
COD removalRate (mg L−1 d−1)0 (4.2 1)0.5 (6.7 2)
Efficiency (%)0 (23.6 1)9.6 (64.4 2)
TN removalRate (mg L−1 d−1)2.62.6
Efficiency (%)11.988.0
NH4+-N removalRate (mg L−1 d−1)8.99.2
Efficiency (%)48.0100
TP removalRate (mg L−1 d−1)0.021.33
Efficiency (%)6.089.1
PO43−-P removalRate (mg L−1 d−1)0.081.26
Efficiency (%)19.389.9
TSS production rate (mg L−1 d−1) 11.340.3
Microalgal production rate (mg L−1 d−1) 2.413.2
DO (mg L−1) 1.8 ± 1.95.3 ± 3.2
pH 6.3 ± 0.89.5 ± 0.8
EC (µS cm−1) 2923.0 ± 97.8782.2 ± 204.5
Note: 1 Removal rate and removal efficiency for the first five days of the experiment. 2 Removal rate and removal efficiency for the first seven days of the experiment.
Publisher’s Note: MDPI stays neutral with regard to jurisdictional claims in published maps and institutional affiliations.

