1. Introduction
Population growth and rising food demand are still the main drivers of water use. However, within the context of water scarcity and climate change, wise water use is the sole pathway to assume sustainable development and food security. In fact, food production requires large amounts of water. FAO estimates that between 2000 and 5000 L of water are needed to produce a person’s daily food, and agriculture accounts for 70% of global freshwater withdrawals [
1]. Projections on population growth and food need increments showed that agricultural production will have to increase up to 70% by 2050 over the 2005–2007 levels [
1,
2]. Irrigation should be the key role to meet population needs. Globally, irrigated agriculture, covering around 16% of the arable land in use, provides 44% of all crop production. In developing countries with 21% of arable land, it accounts for 49% of all crop production and 60% of cereal production [
3]. Due to the projected increases in cropping intensities and increases in productivity, irrigated food production is projected to increase by 38% in 2050 [
2]. In water-scarce regions, relying on the irrigated activities has already reached the limits. Coping with this dilemma, several studies highlighted the imperative to increase the productivity and to improve the water-use efficiency, which matches perfectly with the sustainable development goals of United Nations stipulating that agricultural productivity should be doubled by 2030 (SDG2.3) and water use efficiency must substantially increase (SDG6.4) [
4].
The concepts, productivity, and water use-efficiency, are linked and widely used [
5,
6] to address the issues of water scarcity [
7,
8] and production increment [
9,
10], as well as the technology performance [
11,
12,
13]. The productivity signifies the ratio of the output to the input for the specific situation of production. Particularly in agriculture, water productivity (WP) means increasing the crop production per unit use of water resources. “More crop per drop” or “produce more food with less water” translates to the necessity to achieve maximum production by using water efficiently. In agriculture and under biotic environments, maximizing production depends on optimizing the input mix involving not only water but also land, seeds, fertilizers, etc. [
14]. Moreover, achieving maximum production reflects the farmers’ abilities to master the technology process known as technical efficiency. When a farmer achieves a volume of production under what should be released given the input mix, the difference of production translates to a technical inefficiency in performing the technology process [
15]. Several studies highlighted that improving technical efficiency entails increasing the productivity [
16,
17].
Worldwide, increasing cereal production remains the main pillar of fighting famine and ensuring food security. By 2050, the global demand for cereal is expected to reach 3 billion tons, which represents an increase of 940 million tons (31%) from the base years 2005/2007. Coping with limited land and water scarcity, FAO projections argued to raise cereal yields from 2.94 to 3.94 tha
−1 to meet the demand. Under the irrigated conditions, yields should increase from 3.88 to 5.16 tha
−1 [
3]. In developing countries, where self-sufficiency rates (production/demand) of cereals did not exceed 0.9, yields should increase from 2.49 to 3.6 tha
−1 and from 3.56 to 5.01 tha
−1 for irrigated cereals [
3,
15].
Despite of the agroecological constraints specific for each locality, raising yields require full valuation of the potential of existing technologies. Nowadays, analyzing yield gaps (Note: For a deeper understanding of the concept and how to measure its different levels, consult Rong et al. [
18]. In this research we are analyzing yield gap = attainable yield–actual yield (or observed yield)) for cereals are of interest to scientist worldwide [
19,
20,
21,
22,
23,
24,
25,
26,
27,
28]. Schils et al. [
25] highlighted that across Europe, the yields of rainfed wheat varied from 1.2 to 8.9 tha
−1, while the yield gaps varied from 0.2 to 6.9 tha
−1, which equals relative gaps from 2% to 84%. They found out that the consolidated yield gap of wheat, barley, and maize was estimated at 239 million tons, which represented 42% of the potential yield. If the yield gap would be reduced to 20% of the potential yield, the production would increase by 128 million tons (39%). In Bangladesh where the yield gaps of cereals ranged from 40% (rainfed wheat) to 63% (rainfed rice), Timsina et al. [
26] found out that full yield gap closure is requested to reach self-sufficiency by 2050. In Ethiopia, Silva et al. [
28] highlighted that the yield gaps reached 74% and 77%, respectively, for wheat and maize, which are largely attributed to the misuse of the technology process, particularly the land preparation. In India, Nayak et al. [
24] pointed out that the rice yield gaps varied from 20% to 30% of the potential yield, mostly explained by the technology yield gap.
In Tunisia, cereal growing is still the main activity of the agricultural sector. The cultivated area reaches an average of 1370 ha per year (for the period 2000–2018) representing 33% of the arable land. Durum wheat (DW) is the main crop with an average area of 676,705 ha [
29]. Approximately 93% of this area is rainfed, showing significant fluctuations from year to another. Wheat production reaches an average 0.98 million tons, but it can go down to 0.37 million tons in a dry year such as 2002 [
29]. To mitigate these fluctuations and ensure a minimum of production, the public authorities have relied on the development of irrigation. Irrigated DW areas covered an average of 48,700 ha, which guarantees an average production of 0.18 million tons. Hence, the yield reached an average of 3.6 tha
−1, which is still below expectations. Indeed, research estimates the potential yield at 6 or even 7 tha
−1 [
30]. For the period of 1990–2013, the potential yield of the irrigated wheat reached an average of 6.3 tha
−1 (
www.yieldgap.org accessed on 14 March 2022). Several studies have analyzed the weaknesses and technical inefficiencies that prevent farmers from achieving the potential yield. These findings were always carried out in the demonstration plots [
31,
32,
33] without taking into account the intrinsic operating conditions of the farm. These conditions are structural, institutional, and/or even social and might affect, directly or indirectly, the performance of the cultivated crop. In addition, the development of irrigated crops is facing the challenge of scarcity and rational management of water resources. In this context, the question of valuing water resources is at the heart of the debate on improving crop productivity.
The issue of the development of irrigated DW reveals the dilemma of increasing production and the optimal use of irrigation water. This dilemma can only be resolved by mastering the production technology process. Several studies have focused on assessing the ability of farmers to master the technology by adopting an input-oriented data envelopment analysis (DEA) approach. These studies, therefore, focus on minimizing the use of inputs rather than optimizing the production given the currently use of the inputs mix. However, the DEA approach makes it possible to measure the technical efficiency scores of each input.
By adopting this approach, the objective of this work is to rate the performance of the irrigated DW activity with the perspective of finding valuable pathways to increase the production and to improve the WP.
The remainder of the paper is structured as follows. The second section is dedicated to the presentation of the study area, and we will display the relevance of adopting the DEA approach from the theoretical side as well as its empirical application in the agricultural sector. The third section is devoted to to the presentation and the discussion of the results before concluding on the main policy implications of this study.
2. Materials and Methods
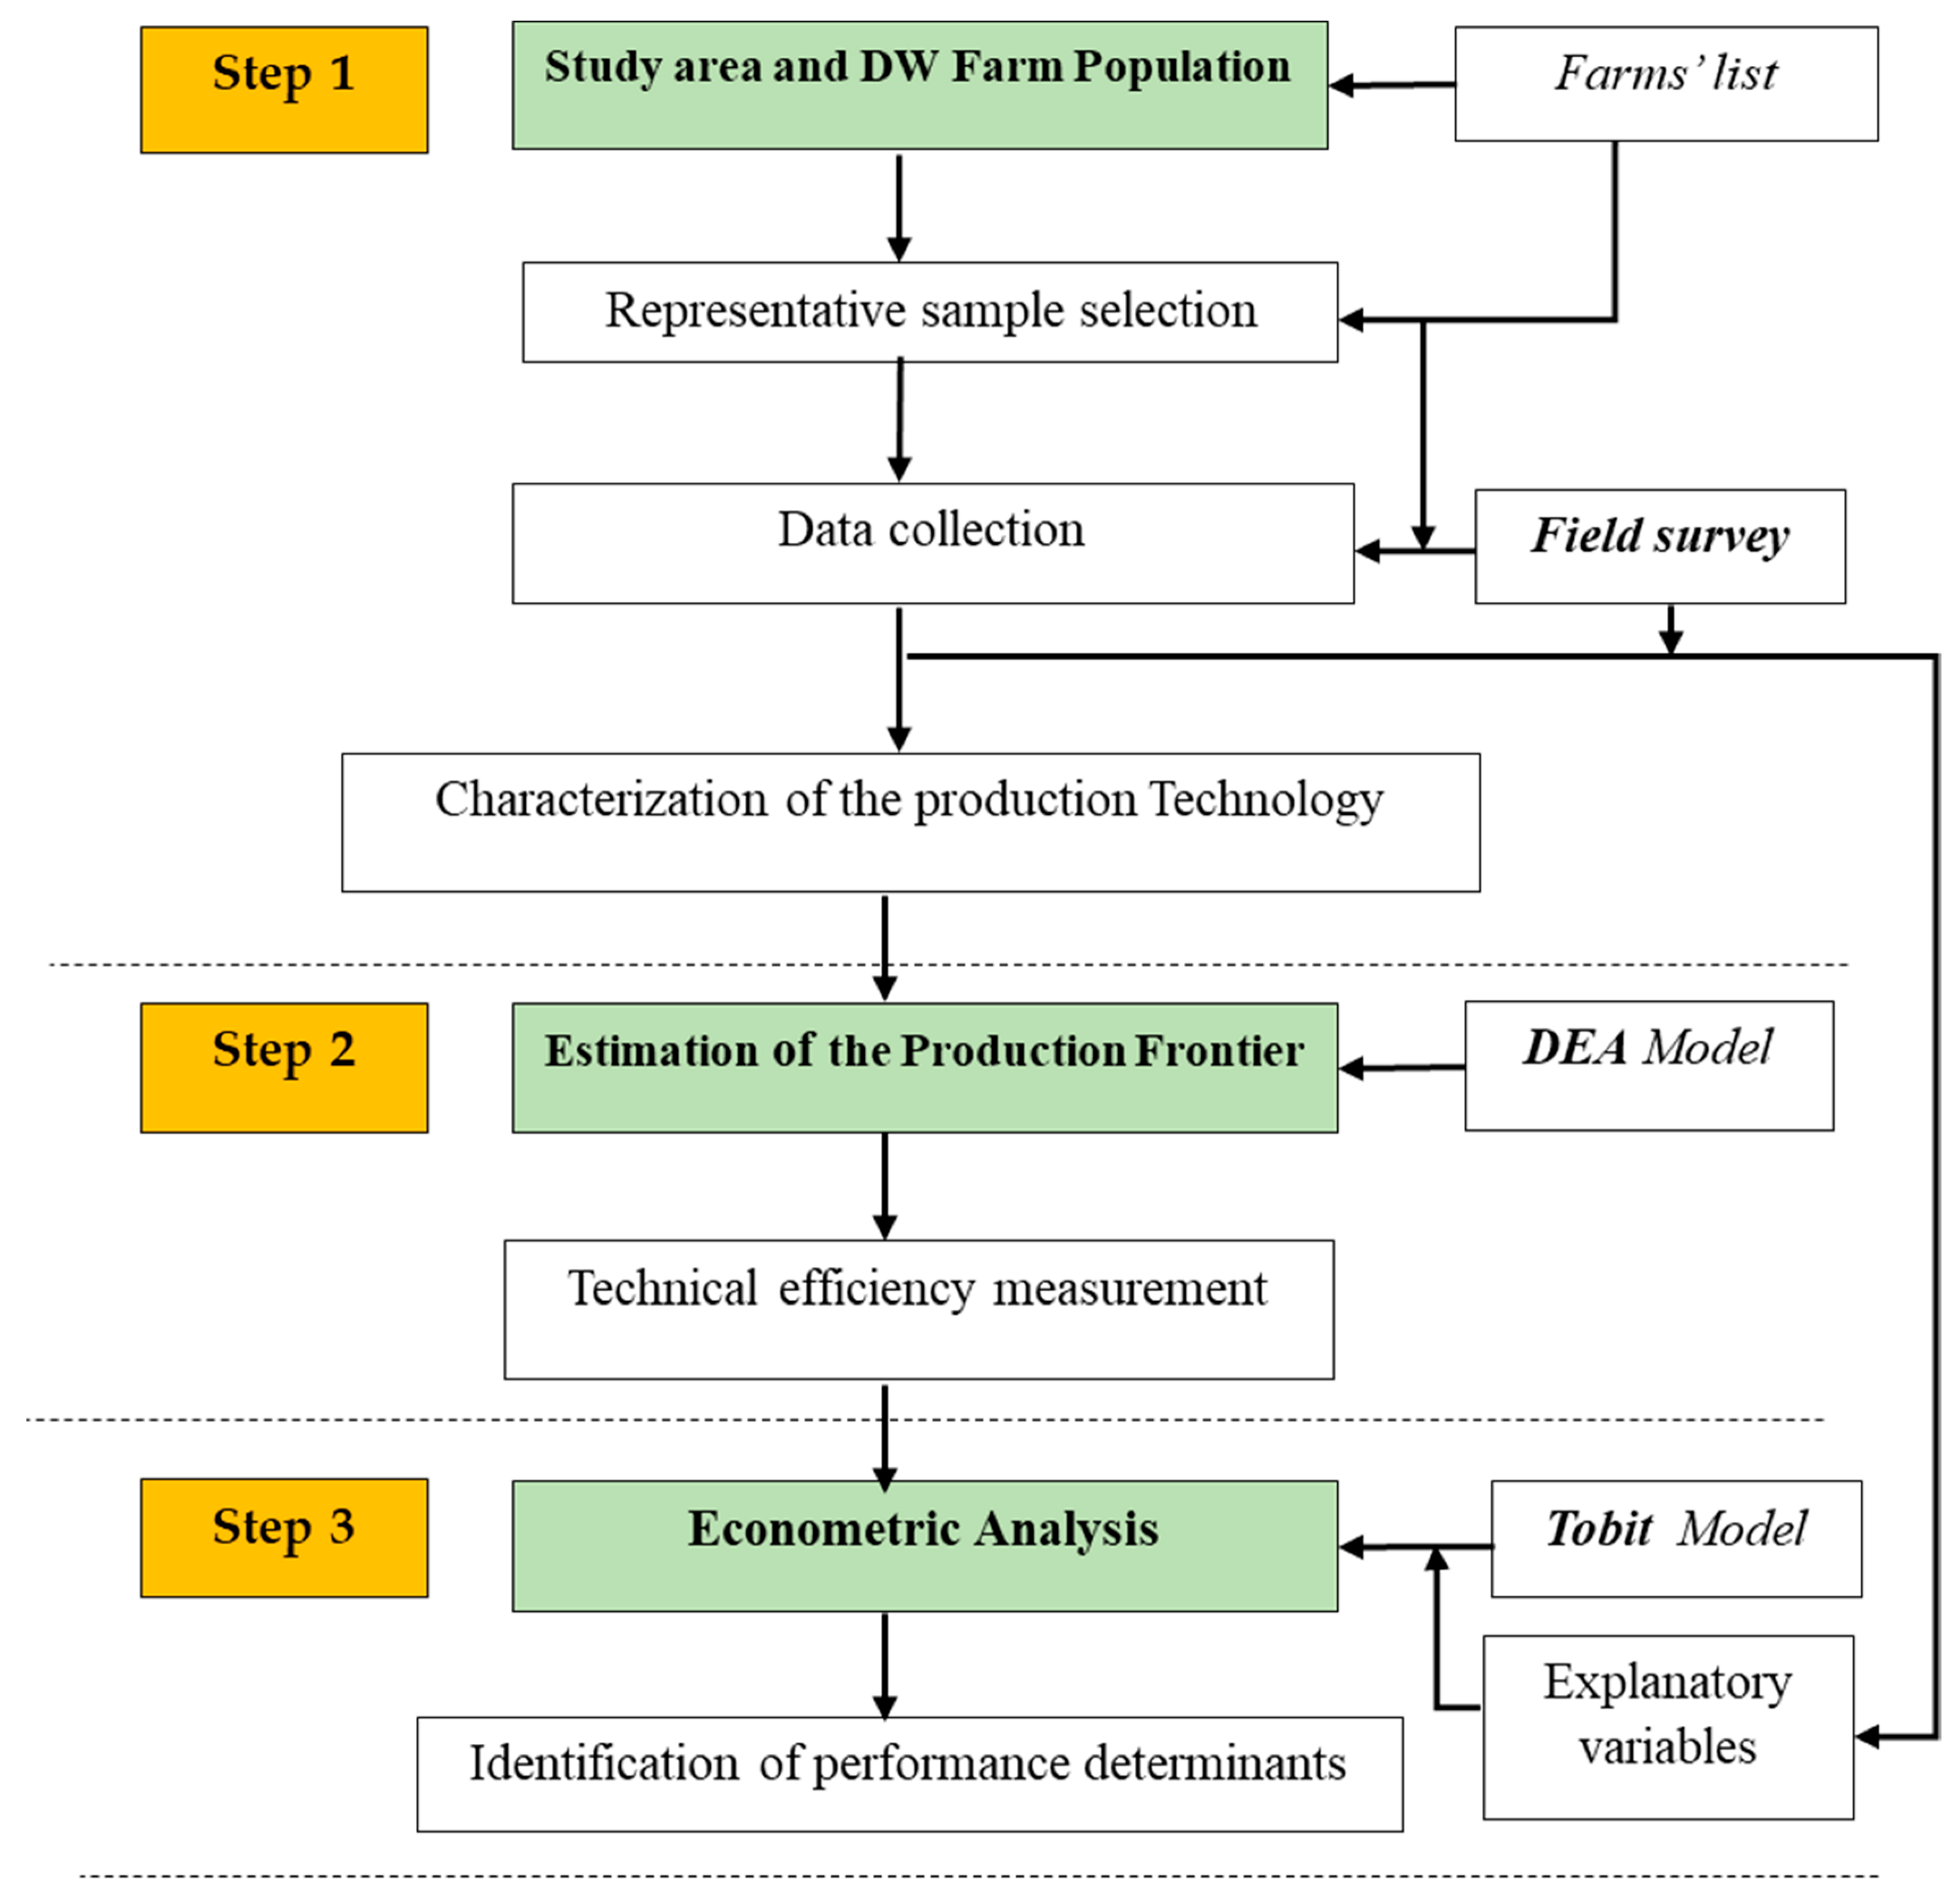
The assessment has been organized according to the conceptual framework presented in
Figure 1. After describing the study area and selected representative sample, we carried out a field survey to gather data related to the agricultural campaign of 2015. Then, we adopted a data envelopment analysis approach using GAMS (general algebraic modelling system) software to assess the technical efficiency and water use efficiency. The third step consists of estimating the Tobit model using “R” software to identify the determinants of the technical performance.
2.1. Study Area and Farm Population
2.1.1. Study Area
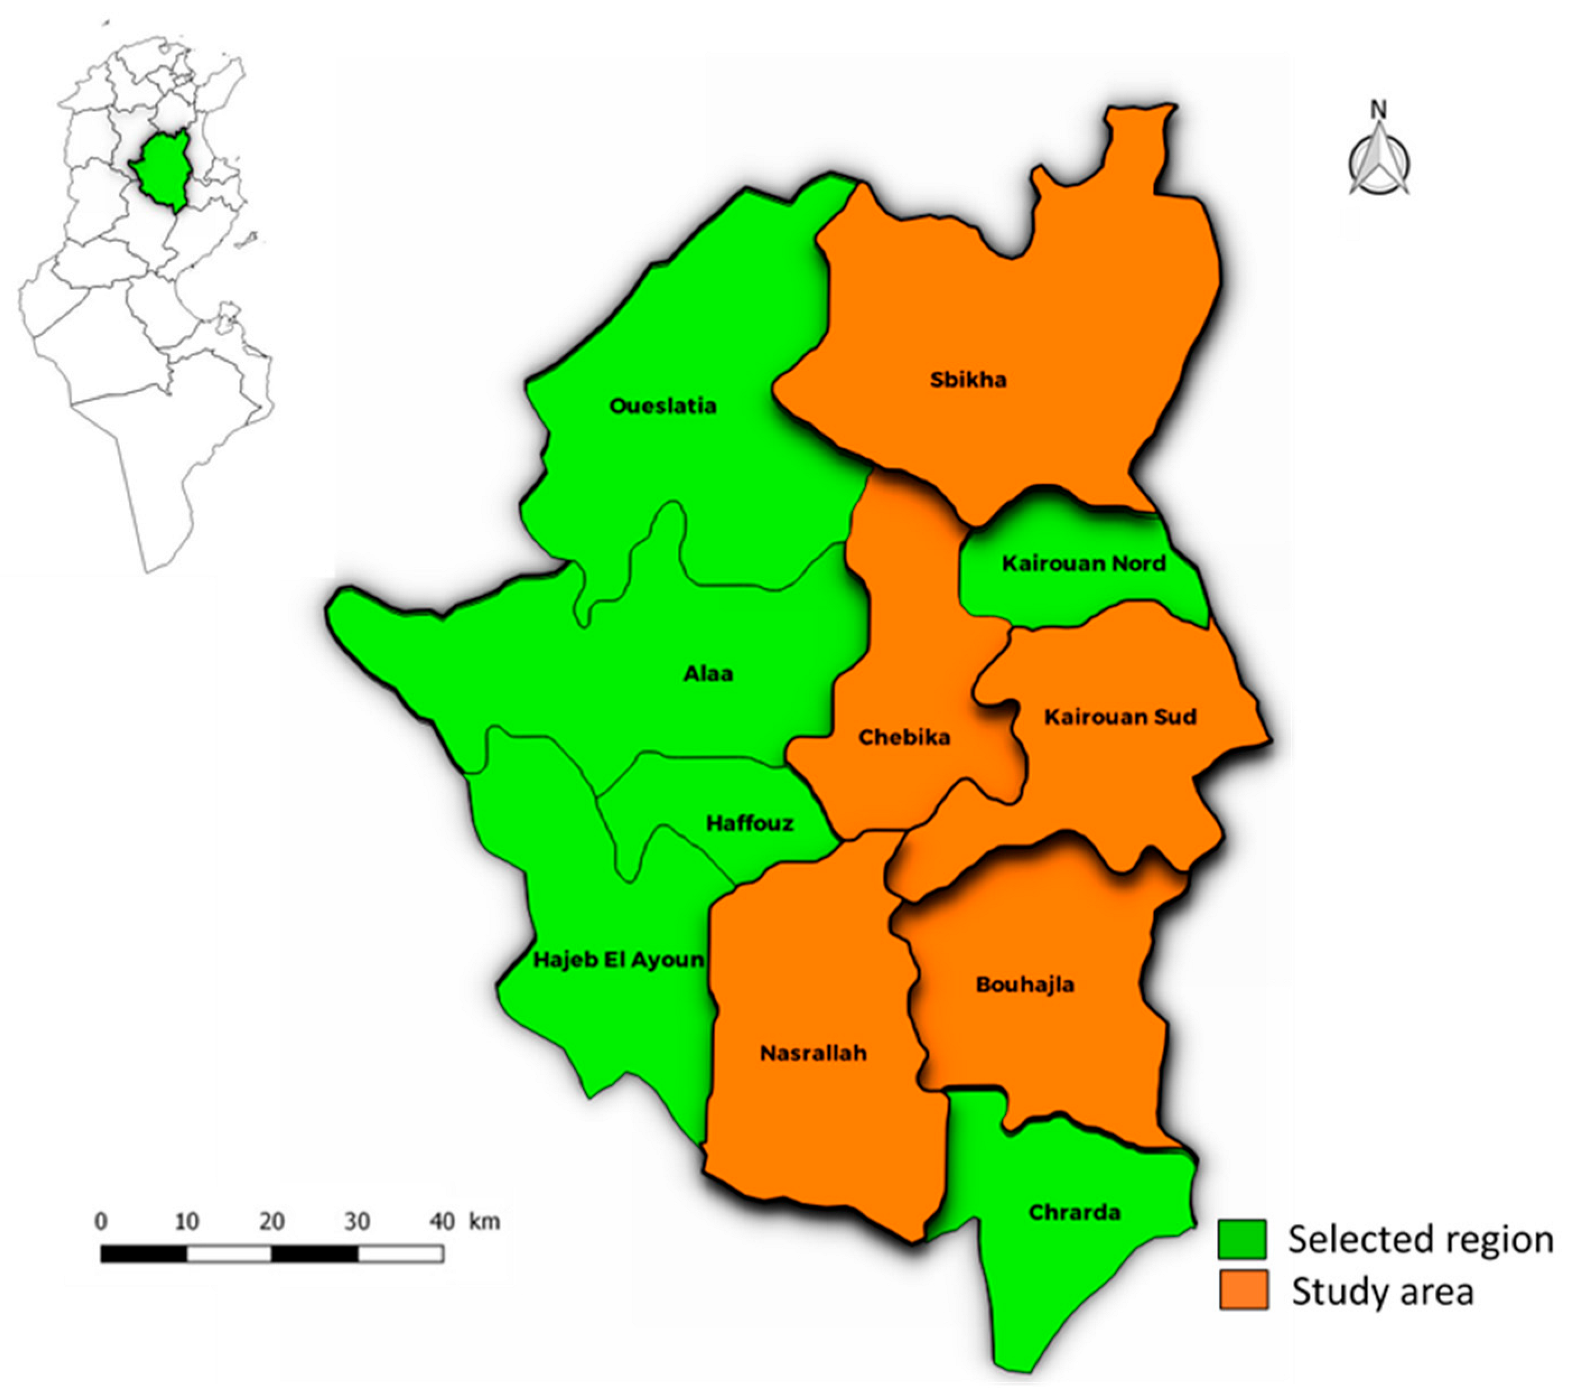
The study has been conducted in the governorate of Kairouan located in the center of Tunisia (
Figure 2).
The economy of the region relies on the agricultural sector, mainly the irrigated activity. The potential irrigable area reached 58,646 ha, which represents 16% of the national irrigable area. This area involves 16,580 ha of public irrigated area (PBIA) and 41,066 ha of private irrigated area (PRIA). The PBIA has been implemented around public water resources (forage or dams) where farmers used the water collectively. An agricultural development group (ADG) ensures the distribution and the sale of the water for irrigation according to the tower rule. The PRIA is the potential irrigable area where farmers drill their own private resources (wells, forage). Hence, farmers have free access to the resources and plan their irrigation calendar without any restriction.
In terms of irrigated cereal crops, the governorate of Kairouan occupies the first position. The cultivated area reached an average of 22,578 ha representing 24% at the national level. This area allows a production of 0.06 million tons, representing 25% of national production and which reached 36% in a dry year. In 2015, the region counted about 4278 farmers who practiced irrigated cereal farming. An exhaustive list of these farmers showed that the cultivated areas vary from 0.2 ha to 20 ha.
2.1.2. Sampling and Data Collection
To analyze the technical performance of irrigated DW, we attempted to select a representative sample. Thus, we adopted the stratum-sampling method by considering the three stratum (]0–5 ha], ]5–10 ha], and ]10–20 ha]) and fixing the sampling rate at 15%. Our sample reached 563 cereal farmers, distributed as follows: (i) 410 farmers cultivate areas between 0–5 ha, (ii) 123 farmers cultivate areas between 5–10 ha, and (iii) 30 farmers cultivate areas between 10–20 ha.
The survey was carried out face to face with a sample of 555 cereal producers during the spring of 2016 to gather data relating to the agricultural campaign of 2015 (
Supplementary Materials). We mainly focused on the characterization of the farms’ structures (SAU, number of plots, access to water) and on the farming systems (land use, livestock activity, irrigated activity, etc.). Since DW is the most widely grown crop, we focused the questionnaire on the technical and economic details for the implementation of its growing technology (seeds and sowing, tillage, fertilization, irrigation, treatment, labor, and harvesting, as well as all the input and product prices). In addition, we collected all the data relating to the socioeconomic environment as well as the perception of farmers regarding the constraints and prospects for the development of DW.
2.2. Data Envelopment Analysis Approach (DEA Model)
Since the seminal works of Debreu [
34] and Farrell [
35], the concept of technical efficiency (TE) was developed and widely adopted by scientists in the discipline of operation research/management sciences (OR/MS). In 1962, Farrell and Fieldhouse [
36] proposed a linear programming (LP) formulation for TE measurements. Based upon this formulation, Charnes et al. [
37] developed the data envelopment analysis (DEA) approach under the constant returns to scale (CRS) assumption, known as the CCR model. In 1984, Banker et al. [
38] proposed the DEA model under the variable returns to scale (VRS) assumption, known as the BCC model. By introducing the slacks in the objective function, the CCR and BCC models allows us to compute the Pareto–Koopmans TE. The later measurement meant that a decision-making unit (DMU) is Pareto-efficient if it is not possible to increase (decrease) any one of its output (input) levels without lowering (increasing) at least another one of its outputs (inputs) and/or without increasing (lowering) at least one of its input (output) levels.
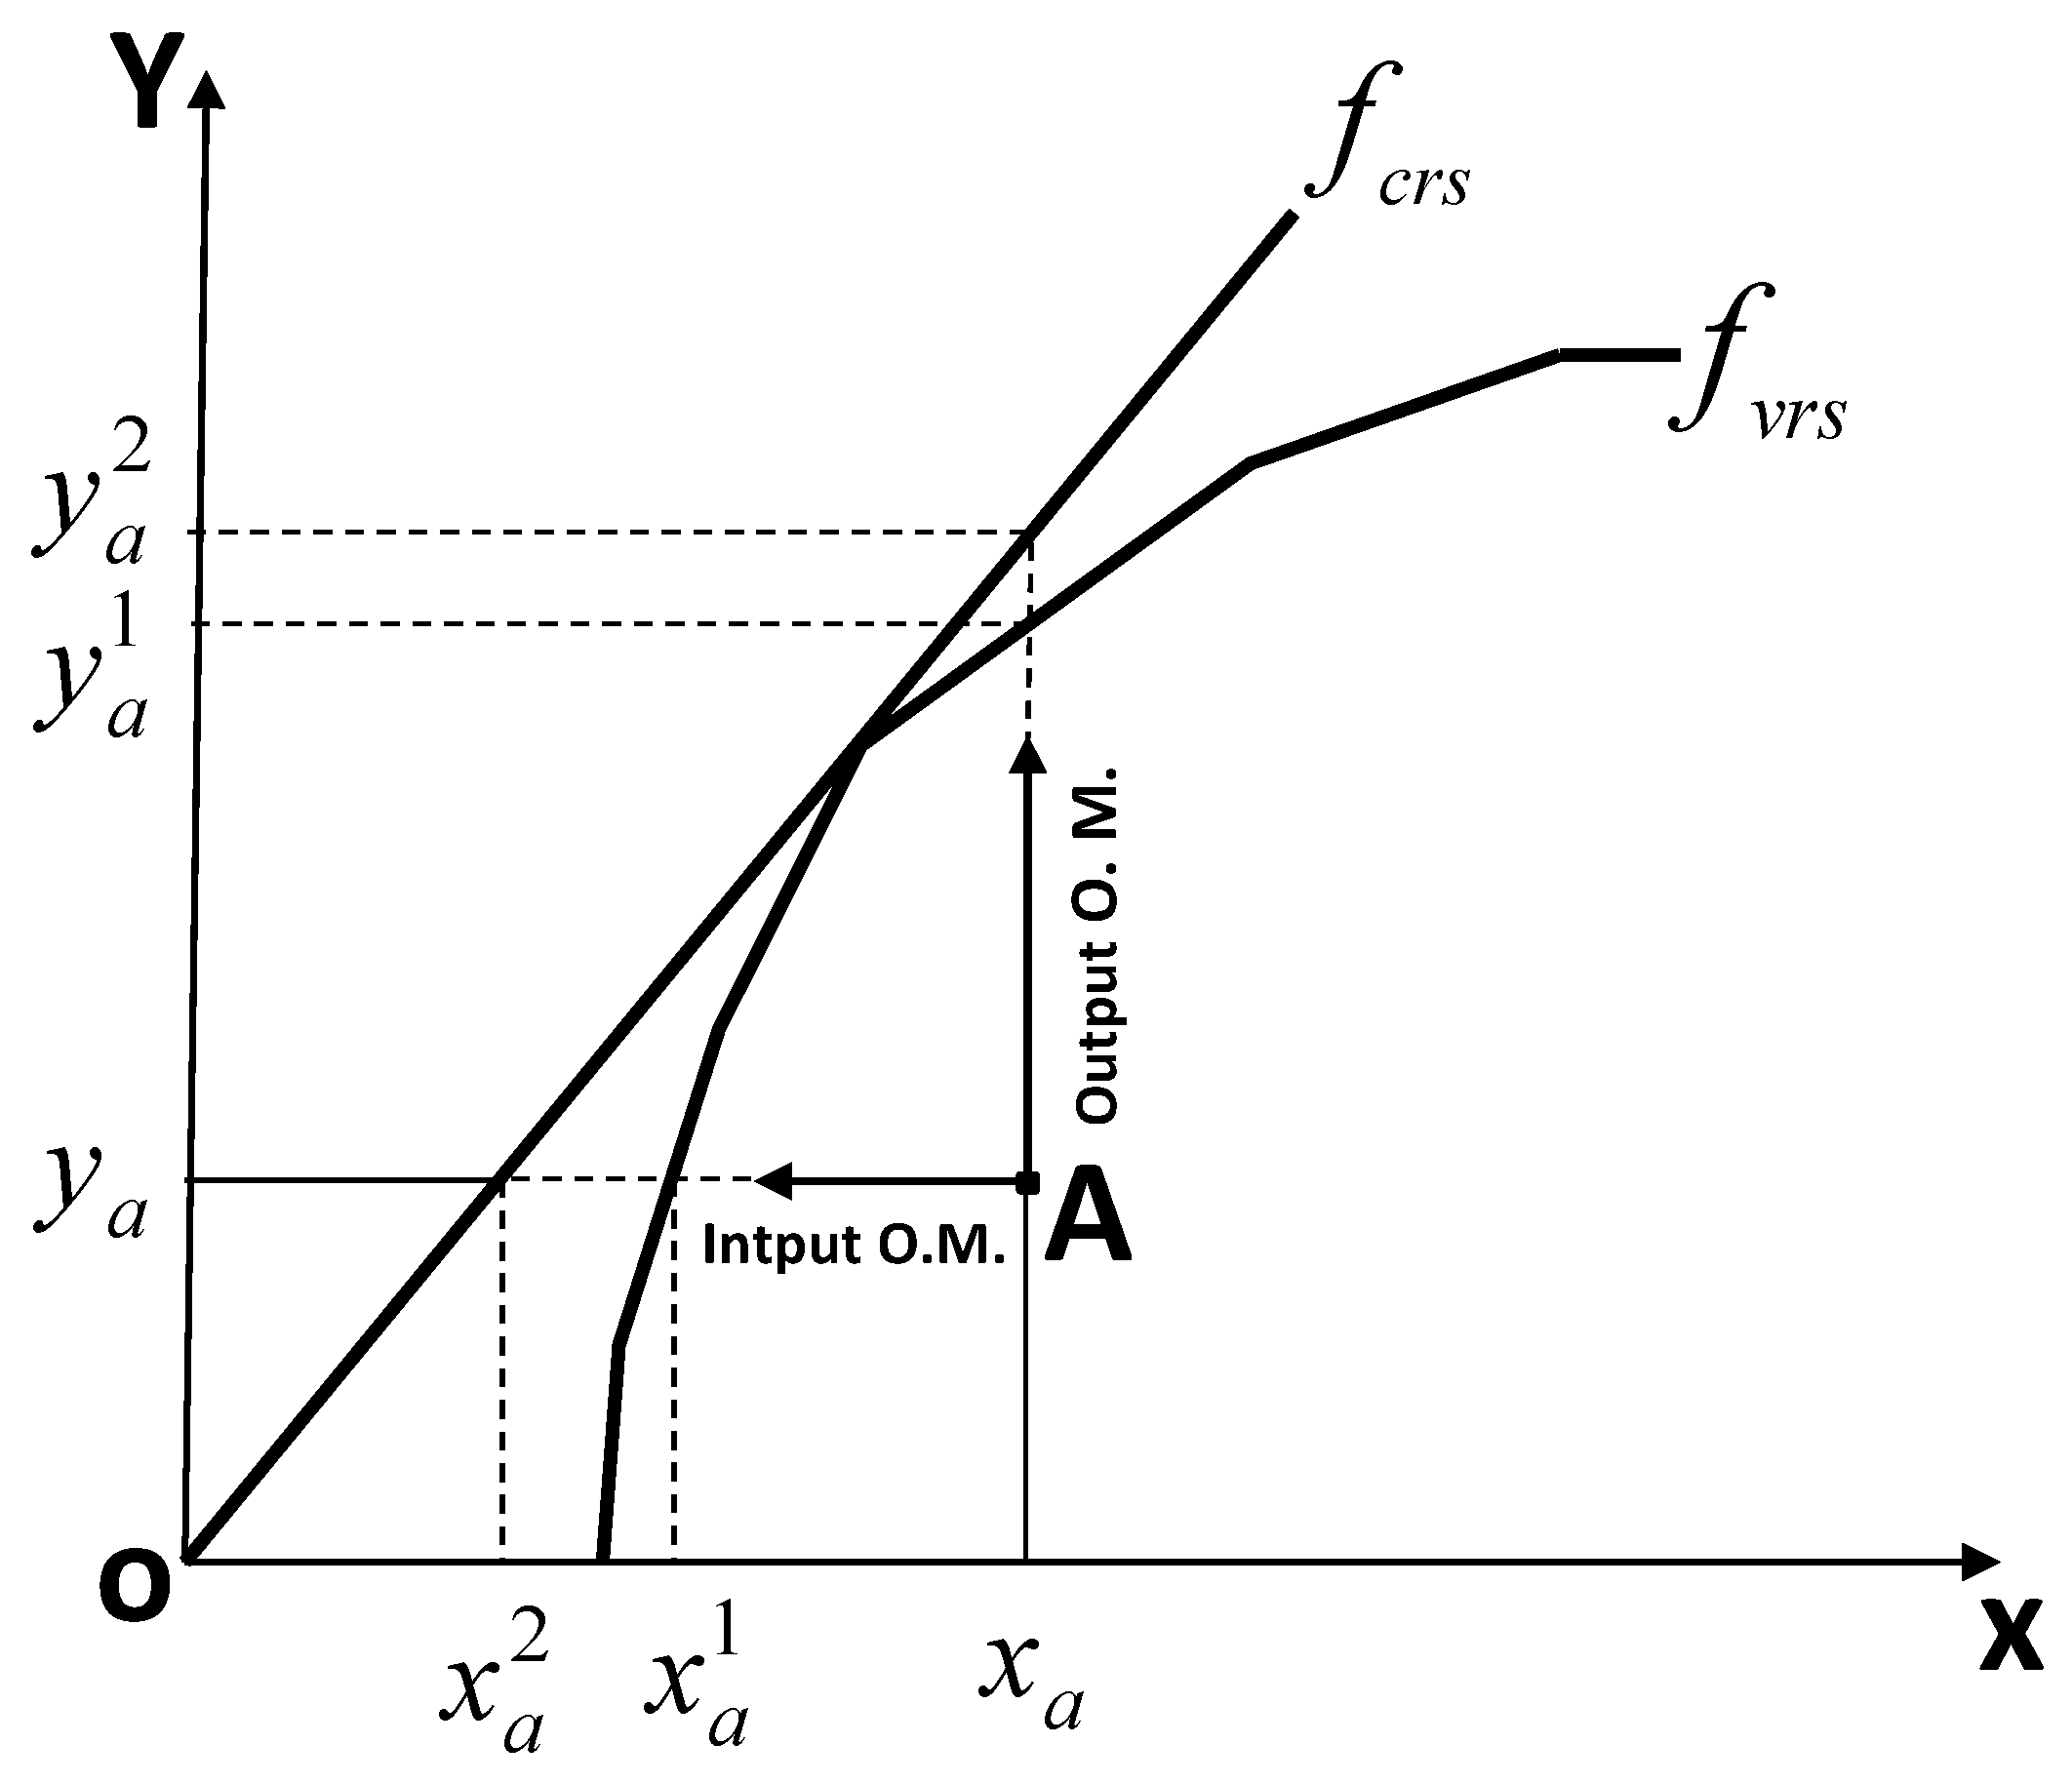
To understand better the TE measurement, we investigate the case of a DMU named A (
Figure 3).
The DMU produces the output Y by using the input X. fcrs and fvrs represent the production frontiers, respectively, under the CRS and VRS assumptions. A uses the quantity xa to produce the quantity ya. A is inefficient because it lies under the frontiers. The projection of A on the frontiers shows that A could produce the same level of output, ya, by using less input (input-oriented model). On the other hand, by using the same level of input, the projection on the frontier shows that A might increase its output (output-oriented model).
Considering the output-oriented model, the TE is expressed by the ratio under the CRS assumption and under the VRS assumption.
In the case of N DMUs using m inputs to produce s outputs, one can rate the technical efficiency of the DMU j0 () by solving the model LP1 under the CRS assumption or the model LP2 under the VRS assumption and .
ε is a non-Archimedean infinitesimal.
ε is a non-Archimedean infinitesimal.
Furthermore, one can compute the scale efficiency (SE) of the DMU
j0 as follows:
However, Färe et al. [
39] suggested the notion of sub-vector efficiency to deal with the technical efficiency use of each input (
v). Hence, they proposed to solve the following linear program (LP3):
ε is a non-Archimedean infinitesimal.
The DEA is a non-parametric research method. It has the advantages of analyzing the multi-outputs, multi-inputs function. Moreover, there is no restriction on the functional form of the technology process. However, two main disadvantages characterize the DEA model. The first one is that DEA remains a deterministic approach and the second is its high sensitivity to the outliers.
Since the development of the CCR and BCC models, the DEA approach has been widely used not only in economic sectors but also in education, health care, environment, criminality, and so on. Within forty years (1978–2016), Emrouznejad and Yang [
40] revealed that 10,300 DEA-related articles were published of which two-thirds were empirical research. During the two last decades, the number of articles showed exponential growth with an average of 680 articles each year. Between 1978 and 2010, Liu et al. [
41] highlighted that the top five fields of DEA applications were banking, health care, agriculture, transportation, and education. During this period, the number of DEA applications in agriculture reached only 258. However, Emrouznejad and Yang [
40] found this number reached almost 800 papers by 2016 and detected that agriculture was the first field of DEA applications in 2015 and 2016.These results showed the expansion and the interest of the DEA approach for rating the technology production in the agriculture sector.
2.3. Tobit Model and Expected Determinants
To identify factors that might affect farms’ technical inefficiencies, we will estimate the Tobit model. Adopting this model remains the appropriate approach given that efficiency scores constitute the truncated variable, which varies between 0 and 1. The theoretical formula of the model is as follows:
where
TEj is the technical efficiency score of the DMU
j. represents the explanatory variables selected that might affect the efficiency of the production process.
is a vector of the coefficient to be estimated.
Hence, based on the previous literature, a set of exogenous factors could be sources of inefficiency. These factors characterize the demographic and socioeconomic conditions of the household as well as the infrastructural, institutional, and economic environment of the farming activity. The size of the cultivated plot might positively or negatively affect the TE. When a farmer increases the land size, he could gain in return to scale of the resources used and perform more efficiently the inputs mix. However, he could not continue to increase indefinitely the land size because he risks losing its ability to manage efficiently the required inputs. In the case of irrigated DW within the context of the Kairouan region, we expect a positive impact because the average of the cultivated land per farm reach only 5 ha with the max of 20 ha that should be managed easily. In addition, we expect that the free access to the water resource might also impact positively the TE because it allows farmers to better plan their irrigation calendar and to provide the required water in the due time. In terms of factors related to the household characterization, the increase in farmers’ ages is expected to positively affect the TE because we assume that the age means more expertise to more efficiently manage the activity. The same impact might be stimulated by the education level of the farmer because we expect that farmers with more years of schooling were able to better manage the technology process. Regarding the farmers’ strategies in terms of cropping techniques, we assume that the use of improved seeds allow farmers to optimize the inputs mix and reach better technical efficiencies. The production purposes might also affect the technical efficiencies. According to the economic theory of production, the rational behavior of the farmers remains maximizing their profits. This behavior should be confirmed mainly when farmers decide to produce for the market. Given that the government fixes the price of the DW, farmers must reach the best technical efficiencies to ensure profit maximization. Hence, we expect that the higher the production share for the sale, the higher the technical efficiency.
Table 1 defines the explanatory variables selected to estimate the Tobit model that might affect the technical efficiencies according to the expected signs.
3. Results
3.1. Descriptive Analysis
By carrying out the survey, we interviewed 555 farmers. The surveyed area reached 5369 ha. The cropping system involved mainly cereal crops (2861 ha), fodder (1243 ha), and olive trees (698 ha). A total of 449 farmers (80%) practiced irrigated DW, and the total area amounted to1936 ha. Hence, the average area per farm has 4.3 ha. A total of 305 farmers (68%) cultivated less than 5 ha, and only 26 farmers (6%) cultivated more than 10 ha.
In terms of irrigation, the results showed that 386 farmers (86%) belong to the private irrigated area (PRIA). The remainder (63 farmers) belong to the public irrigated area (PBIA), and farmers have limited access to water resources in terms of quantity and time. All farmers use the sprinkler irrigation system to irrigate DW. The water consumption reached an average of 3486 m
3 ha
−1. Farmers used hired mechanization for all their cultural operations. In average, they reserved eight hours per hectare for the operation of tillage, sowing, and harvesting. In terms of seeds, they used around 200 kg ha
−1. However, by computing the water productivity, the results showed that eighteen farms (three from PBIA and fifteen from PRIA) achieved an amount exceeding 20 kg ha
−1 mm
−1, which is very high compared to the optimal and theoretical performance that could be achieved by farms in the region [
42]. To avoid outliers in the DEA analysis, we removed these farms from the database. Thus, the remainder of our analysis take in to account the data of 431 farms. The following
Table 2 displays the details of the different technical operations of implementing the DW activity as well as their economical evaluations.
Regarding the expenditure weight, we have to highlight the importance of the irrigation costs in the PRIA, which reached 1487 TND ha−1, representing 59% of total costs. While in the PBIA, it reached 199 TND ha−1, representing only 17%. This disparity is due to the huge difference in water price, which reached 0.403 TND in the PRIA, while it was fixed at 0.065 TND in PBIA. The reason for the higher level of the price in the PRIA is the use of domestic electric power to pump water. In fact, around 65% of surveyed farmers belonging to PRIA declared that they created their boreholes without obtaining authorization from the ministry of agriculture. Hence, they could not profit from the electrical network with a preferential tariff. The other heading of operational costs showed little differences between PBIA and PRIA. The total expenditures reached 2516 TND ha−1 in the PRIA, while it reached 1140 TND ha−1 in the PBIA.
In terms of production, the achieved grain yield reached an average of 3.5 tha−1, but it decreased to 3.2 tha−1 in PBIA. The production value reached 2457 TND ha−1 in the PBIA, while it reached 2782 TND ha−1 in the PRIA. Hence, farmers of PBIA earned a gross margin of 1317 TND ha−1, while those of PRIA earned only 266 TND ha−1.
3.2. Technical Performances and Water Productivity
To evaluate the technical performance, we assume that the production technology of the irrigated DW might fulfill the following functional form:
Yield = ƒ (seed, mecan, fert, labor, water)
Table 3 defines the variables of this functional relationship and presents descriptive statistics of them.
By solving the DEA models, LP1 and LP2, respectively, under the CRS and VRS assumptions, we obtained the technical efficiency scores of the 431 farms (
Table 4).
Under the VRS assumption, 54 farms (13%) were technically efficient (TEvrs = 1), while the remainder (87%) were technically inefficient. The technical efficiency of the whole sample reached an average of 0.63, while it decreased to 0.50 under the CRS assumption. The results meant that farms could increase their grain yield by 37% using the same quantity of inputs. Hence, the yield could increase to 4.8 tha
−1 instead of 3.5 tha
−1 as currently achieved. The analysis of the scale efficiency scores revealed that thirty farms (7%) operated at their optimal size of which three farms (10%) belonged to the PBIA. However, a deeper analysis of the return to scale showed that 352 farms (63%) have decreasing return to scale, while only 51 farms are increasing return to scale. The distribution of the efficiency scores (
Table 5) showed that one-third of farms did not reach 50% of technical efficiency under the VRS assumption. The farms of the PBIA revealed an average technical efficiency of 0.56, while those of PRIA revealed an average of 0.64.
By solving LP3, we computed the water-use efficiency (WUE), which reached an average of 30% (
Table 4). The results meant that farmers could achieve the observed yield by using only an average of 30% of the water volume currently consumed (an average of 3604 m
3 ha
−1), which reached an average of 870 m
3 ha
−1. The later volume reached an average of 892 m
3 ha
−1 in the PRIA and 729 m
3 ha
−1 in the PBIA. According to this result, the WP will shift from 8 kg ha
−1 mm
−1 to 17 kg ha
−1 mm
−1 (
Figure 4). However, if we consider the results of the TEvrs, the yields could be improved by 37%, which allows for an increase in the average yield of up to 4.8 tha
−1. Hence, the WP will increase from 8 kg ha
−1 mm
−1 to 10 kg ha
−1 mm
−1 (
Figure 4). Hence, the results showed that increasing yields by optimizing the currently input mix would increase the volume of the wheat production, which allows an enhancement of the WP at the same time. However, saving water by minimizing the currently water consumption allows an important improvement of the WP without increasing the production of the DW.
3.3. Determinants of Technical Performance
Table 6 displays the descriptive statistics of the selected variables to estimate the Tobit model.
The results of estimation (
Table 7) showed that the size of cultivated area positively affects the technical efficiency. It is statistically significant (
p < 0.01) and implies an improvement in the technical efficiency with an increase in the land size. The type of water resource was also found to be significant (
p < 0.10) and indicates that farmers of PRIA are more technically efficient than those of PBIA. Despite this, it was found to be non-significant that age positively affects the TE, meaning older farmers can more efficiently master the technology process. The education level positively affects the TE at the significant level of 5%. The result implies that farmers with at least a secondary level year can manage the production process more efficiently. The quality of seed was found to be significant (
p <0.01) and positively affects the TE. The result meant that using the improved seed allows for an improvement of TE and allow farmers to better optimize the inputs mix. Finely, the results showed that producing for the market has a positive and a significant impact (
p < 0.10), which implies that such a strategy stimulates the ability of the farmer to better master the technology process.
The positive impact of the cropping size and the quality of seeds is also well confirmed by analyzing the achieved yield (
Table 8). Thus, according to the data of the cropping year 2015, the average yield achieved by farms cultivating large size and using improved seeds is usually expected to be higher.
4. Discussion
The study provides a deeper analysis of the irrigated DW within the context of the Kairouan region. Based on the investigation of the representative sample, we have gathered all technical and economic aspects related to the production process. In terms of the operational costs, the findings pointed out the importance of irrigation costs in the private area due to the use of the domestic electricity [
43]. The situation is critical because farmers continue to drill wells without obtaining authorization, and the government refuses to provide electric power with preferential prices. The situation revealed the weak governance issue of the groundwater in Tunisia [
44,
45]. Moreover, this over cost of irrigation significantly reduces the gross margin in the PRIA, which represents only a third of what farms of PBIA earned [
46]. This result seriously compromises the DW competitiveness mainly compared to horticulture crops [
47].
In addition, technical inefficiencies are also another important dimension of the weak crop competitiveness [
48,
49,
50]. The results revealed that there is the possibility to improve the TE by 37%. The finding was in line with previous studies. Chebil et al. [
51] analyzed the DW activity in the Chebika zone from the Kairouan region and pointed out that the TE reached an average of 70%. Lasram et al. [
52] showed that the TE of the DW activity reached 72% in the Kairouan region and 76% at the national level. In China, Zhou et al. [
53] revealed that the TE of wheat reached 84%. Across locations, it varies between 78% and 90%. By improving the technical efficiency, farms might increase the DW yield up to 4.9 tha
−1, which allows for increasing the production as well as the WP.
The results of the Tobit model revealed some key factors influencing the technical efficiency. Several previous studies confirmed the positive impact of the land size [
54]. Yuan [
55] already confirmed the positive impact of the land size. To the contrary, Zhou et al. [
53] pointed out the negative impact of size on the wheat TE but the positive impact on the maize TE. They argued that the effect of land size needs to be investigated further for the specific cereal crop production [
53]. By analyzing the technical efficiencies of vegetable farms, Bozoglu and Ceyhan [
56] found small farms were more technically efficient than the large ones.
Regarding the type of water resource, the results showed that farms of PRIA were more technically efficient. The results confirm the importance of free access to the resources and stress the issue of weakness of the collective management. This is in contradiction to findings of Chemak et al. [
46] who pointed out that farms of PBIA were more technically efficient than those of PRIA and concluded that free access to water resources might reveal overconsumption and unwise use.
The positive impact of age on TE agreed with the findings of [
57]. The authors explain that when farmers’ ages increase, their experiences in efficient use of resources increases as well. This finding was also confirmed by several studies [
58,
59]. However, other studies revealed a negative impact of age [
60,
61], considering that it is challenging for the aged farmers to adopt the new agricultural technology [
53]. However, the results were in contradiction with the findings of Bozoglu and Ceyhan [
56] and Mathijis and Vranken [
62] who showed that younger farmers were more efficient than the older ones.
As expected, education has a positive impact on the TE, which was confirmed by the previous studies [
56,
57,
58]. Tian et al. [
58] revealed that farmers with longer years of schooling were able to produce sesame more efficiently. However, Hong et al. [
63] and Ullah et al. [
60] found a negative but non-significant impact from education.
Growing DW with the perspective to sell it in the market seems to also favor a better level of technical efficiency. By analyzing the total productivity of production factors of cereal farms in Tunisia, Rached et al. [
64] confirmed that the guaranteed price of wheat is a key element of the improvement of the competitiveness of the crop, but this price still depends on the quality of the seed produced and the production technology.
Seed quality is of the utmost importance in the production process [
65]. However, farmers are not committed to use it annually for two main reasons. Given the financial constraints, several farmers used their own seeds. Moreover, improved seeds are not usually available on the market. Thus, farmers are constrained to using their own seeds or buying it from their neighbors. The results showed a positive impact on TE efficiency. It is in line with the findings of Maruod et al. [
66] and Shavgulidze et al. [
67].


 ,
, 


