
Generate_SWMM_inp: An Open-Source QGIS Plugin to Import and Export Model Input Files for SWMM


Department of Water Management, University of Rostock, 18059 Rostock, Germany
*
Author to whom correspondence should be addressed.
Water 2022, 14(14), 2262; https://doi.org/10.3390/w14142262
Submission received: 24 June 2022
/
Revised: 11 July 2022
/
Accepted: 16 July 2022
/
Published: 20 July 2022
(This article belongs to the Special Issue Innovative Methods and Applications of Stormwater Management)
Abstract
:SWMM is an open-source model and software developed by the US EPA for the simulation of rainfall-runoff and routing in water bodies, sewer systems and wastewater infrastructures. It has been applied in numerous practical works and research projects. For a new SWMM model, objects such as nodes, links and catchments can either be drawn via SWMM’s graphical user interface (GUI) or specified manually in a plain text file in “.inp” format (“input file”). Since the required data regarding sewer geometries and river systems are usually available as spatial data in a GIS environment, there is a need for user-friendly interfaces for the model setup. SWMM contains neither an import function for geodata nor processing tools as provided in geographic information systems (GIS) such as the open-source software QGIS. Existing approaches were script-based or required commercial all-in-one products. We developed a free and open-source QGIS plugin to generate SWMM models from geodata and to import existing SWMM input files into QGIS. An application example is presented to demonstrate the basic features and usage of the plugin.
1. Introduction
The Stormwater Management Model (SWMM) developed by the US Environmental Protection Agency is a well-established software in the field of urban drainage modelling. It includes a hydrologic model for rainfall-runoff simulations and a dynamic hydraulic model for routing along a watercourse or drainage system [1]. Since its first version in 1971, scientists and practitioners have continuously enhanced the source code, which is mainly written in C since version 5 [2]. As SWMM is available as open source software [3], users can edit the code to add new features and algorithms, which makes the software suitable for educational purposes and experimental studies. It has been used for numerous research projects and practical applications [4]. Among these are studies in the field of sanitary environmental engineering, such as the design of drainage systems [5,6] including Low Impact Development (LID) structures [7,8], as well as river system models for flooding predictions [9] or for the assessment of impacts of urbanization scenarios [10,11], and water quality models [12].
To set up the sewer network model or watercourse model, SWMM needs a system of nodes, links and subcatchment areas. Nodes represent, for example, manholes, outlets or storage objects. Links can be pipes, watercourse sections, weirs or orifices. Specific properties of objects and settings are described by curves such as cross sections, pump curves and storage curves which are linked to the objects via unique identifiers. Rainfall intensities and dry weather inflows to nodes (i.e., wastewater inflows in a sewage network or base flows in rivers) are added to the model in the form of tabular time series and patterns. In the standard open-source version of SWMM, the data input can be performed in two ways: Objects can be drawn or edited manually in the graphical user interface (GUI); alternatively, all data can be imported as a text file called “input file” with the file extension “.inp” [1]. The latter option is the standard for all larger systems.
The required data about catchments, river systems, sewer networks and further water infrastructure are usually available as drawings for computer-aided design (CAD) software or as geospatial data (“geodata”) [1], including vector data as well as raster data such as digital elevation models (DEM). So far, SWMM does not offer a direct import function for such files. The integration of geodata processing and SWMM model control is mainly included in commercial and proprietary variants of SWMM (e.g., PCSWMM [13] with a ArGIS-like graphical user interface, InfoSWMM [14] or GeoSWMM [15]). Another commercial and closed-source tool is the “Lago Toolbox” with a GUI to generate SWMM input files, which is limited to 20 nodes and links in its free version and can only convert shapefiles [16].
Hence, the typical workflow starts with the preprocessing of spatial data in a geographic information system (GIS) environment. Numerous studies describing suitable GIS methods can be found. For example, catchments and subcatchments can be defined by aggregating, intersecting and spatially joining official data such as parcels in cadastral maps or land use surveys, or by DEM-based subcatchment delineation. The parametrization of subcatchments, e.g., calculation of terrain roughness, slope, width and depression losses from DEMs can be performed with GIS tools [9,17,18]. The share of impervious surfaces can be derived from aerial photographs and cadastral data. Parameters needed for modelling infiltration and groundwater flow can be obtained using soil maps and spatially located information from boreholes [11]. Spatial queries in GIS can be used to allocate areas to receiving nodes. Advanced GIS methods for model parametrization of ungauged urban catchments with LIDs have been presented by Krebs et al. [8]. Yang et al. [19] proposed a GIS-based approach for the generalization of storm sewer networks. Tu and Smith [12] used land use data and aerial photography to derive pollutant build-up and wash-off parameters. For studies in which data availability is limited, Blumensaat et al. [20] developed an algorithm to set up a hydraulic sewer model based on freely available DEMs, street networks and Open Street Map (OSM) data in GIS. Their approach included a GIS-based surface flow accumulation along a DEM with road information carved into the grid in order to generate a flow path network and connected catchments. Additionally, they estimated network dimensions by using the total catchment area, housing information from OSM and standard rainfall intensities.
The prepared geodata must then be converted into text strings for the SWMM input file, e.g., via “copy-and-paste” using a text editor or with scripts in programming languages such as R [21] or Python [22]. For the latter, several libraries are available to facilitate this process. For instance, for the R programming language, the swmmr library [23] offers tools to read and write SWMM files (input, output and report files) and facilitate model data management. Comparable functions for Python are provided by the swmm_api package [24]. PySWMM is a Python interfacing wrapper to SWMM which enables the interaction with the model during a simulation [25]. The Python package swmmio [26] allows the modeller to change data in existing input files in order to run altered models for the comparison of scenarios or sensitivity analysis. Tools for the access and visualization of model results, stored in a binary output file (“.out”), are provided by the swmmtoolbox package [27]. Kachholz and Tränckner [11] demonstrated the use of Microsoft Excel with its Visual Basic for Applications (VBA) programming interface to set up SWMM models with parameterized geodata. Especially for the development of real-time control strategies with SWMM algorithms, MatSWMM 5.1.012 by Riaño-Briceño et al. is an open-source software package written for Matlab, Python and LabView [28]. However, the application of these packages and scripts requires basic programming skills for the input via command-line interfaces or integrated development environments.
An alternative approach is the integration of or connection with SWMM in an existing GIS environment. This idea was realized for the ArcGIS environment by Shamsi et al. [29] and Lee et al. [30], but the application of their software is limited to users with a license for the closed-source GIS. QGIS, by contrast, is an open-source GIS with programming interfaces in Python and R, which allow the users to create their own tools [31]. New tools and collections of tools can be shared with other users as so-called plugins. QGEP, for example, is a wastewater management plugin, which is maintained by the Swiss user group of QGIS. Its data structure, based on the data model standard “VSA-DSS” of the Swiss Wastewater Association VSA, is implemented in a PostgreSQL database with PostGIS. The plugin is able to create an input file, run SWMM and read the results of the simulation [32]. GISWATER is another open-source application that can be integrated in QGIS as a plugin. Again, the water infrastructure data are managed in a PostgreSQL database system with PostGIS. The plugin provides a variety of tools with a complex user interface including import and export functions to SWMM and EPANET [33]. A common challenge with these all-in-one solutions, especially for first-time users, is the initial setup of the database systems and file structures. Simple export/import tools in QGIS, as for other modelling software (RiverGIS for HEC-RAS [34], TUFLOW Plugin [35], or QEPANET [36] for EPANET), are to date not available for SWMM [18].
2. Concept and Implementation of a QGIS Plugin as an Interface between GIS and SWMM
To address the mentioned challenges, our goal was to develop an open-source QGIS plugin that enables the direct transfer of geodata and tabular characteristic curves or time series into an input file and conversely, to read out existing SWMM input files into editable data structures. The concept of the plugin is to allow data processing in the appropriate software solution (QGIS for geodata and, if necessary, EXCEL/LibreOffice Calc for tables). The column names of the attribute tables are derived from the names, which would be automatically generated in the input file by SWMM after saving a model. Thus, they are quite similar to those in the SWMM user interface, e.g., the columns “Elevation”, “MaxDepth”, “InitDepth”, “SurDepth”, “Aponded” in the junctions’ layer refer to “Invert El.”, “Max. Depth”, “Initial Depth”, “Surcharge Depth”, and “Ponded Area” in the corresponding input mask in SWMM. For a fast workflow, input masks of the tools are designed as simply as possible. The plugin is written in Python with a focus on fast processing of data in dictionaries and in table structures with the aid of the pandas package [37]. The plugin “generate_swmm_inp” is made available in the official QGIS plugin repository [38]. After installation with the plugin manager in QGIS, three tools are added to the toolbar.
The first tool, “1_GenerateDefaultData”, loads a default data set containing layers for basic SWMM objects. Default files are provided for both SWMM version 5.1 and SWMM version 5.2. The layers are added to the QGIS project with pre-defined symbols according to the style in the GUI of SWMM. Model options and further parameters are saved in tables in the same folder. An overview of default files for different SWMM objects and attributes is presented in Table A1 and Table A2 (Appendix A).
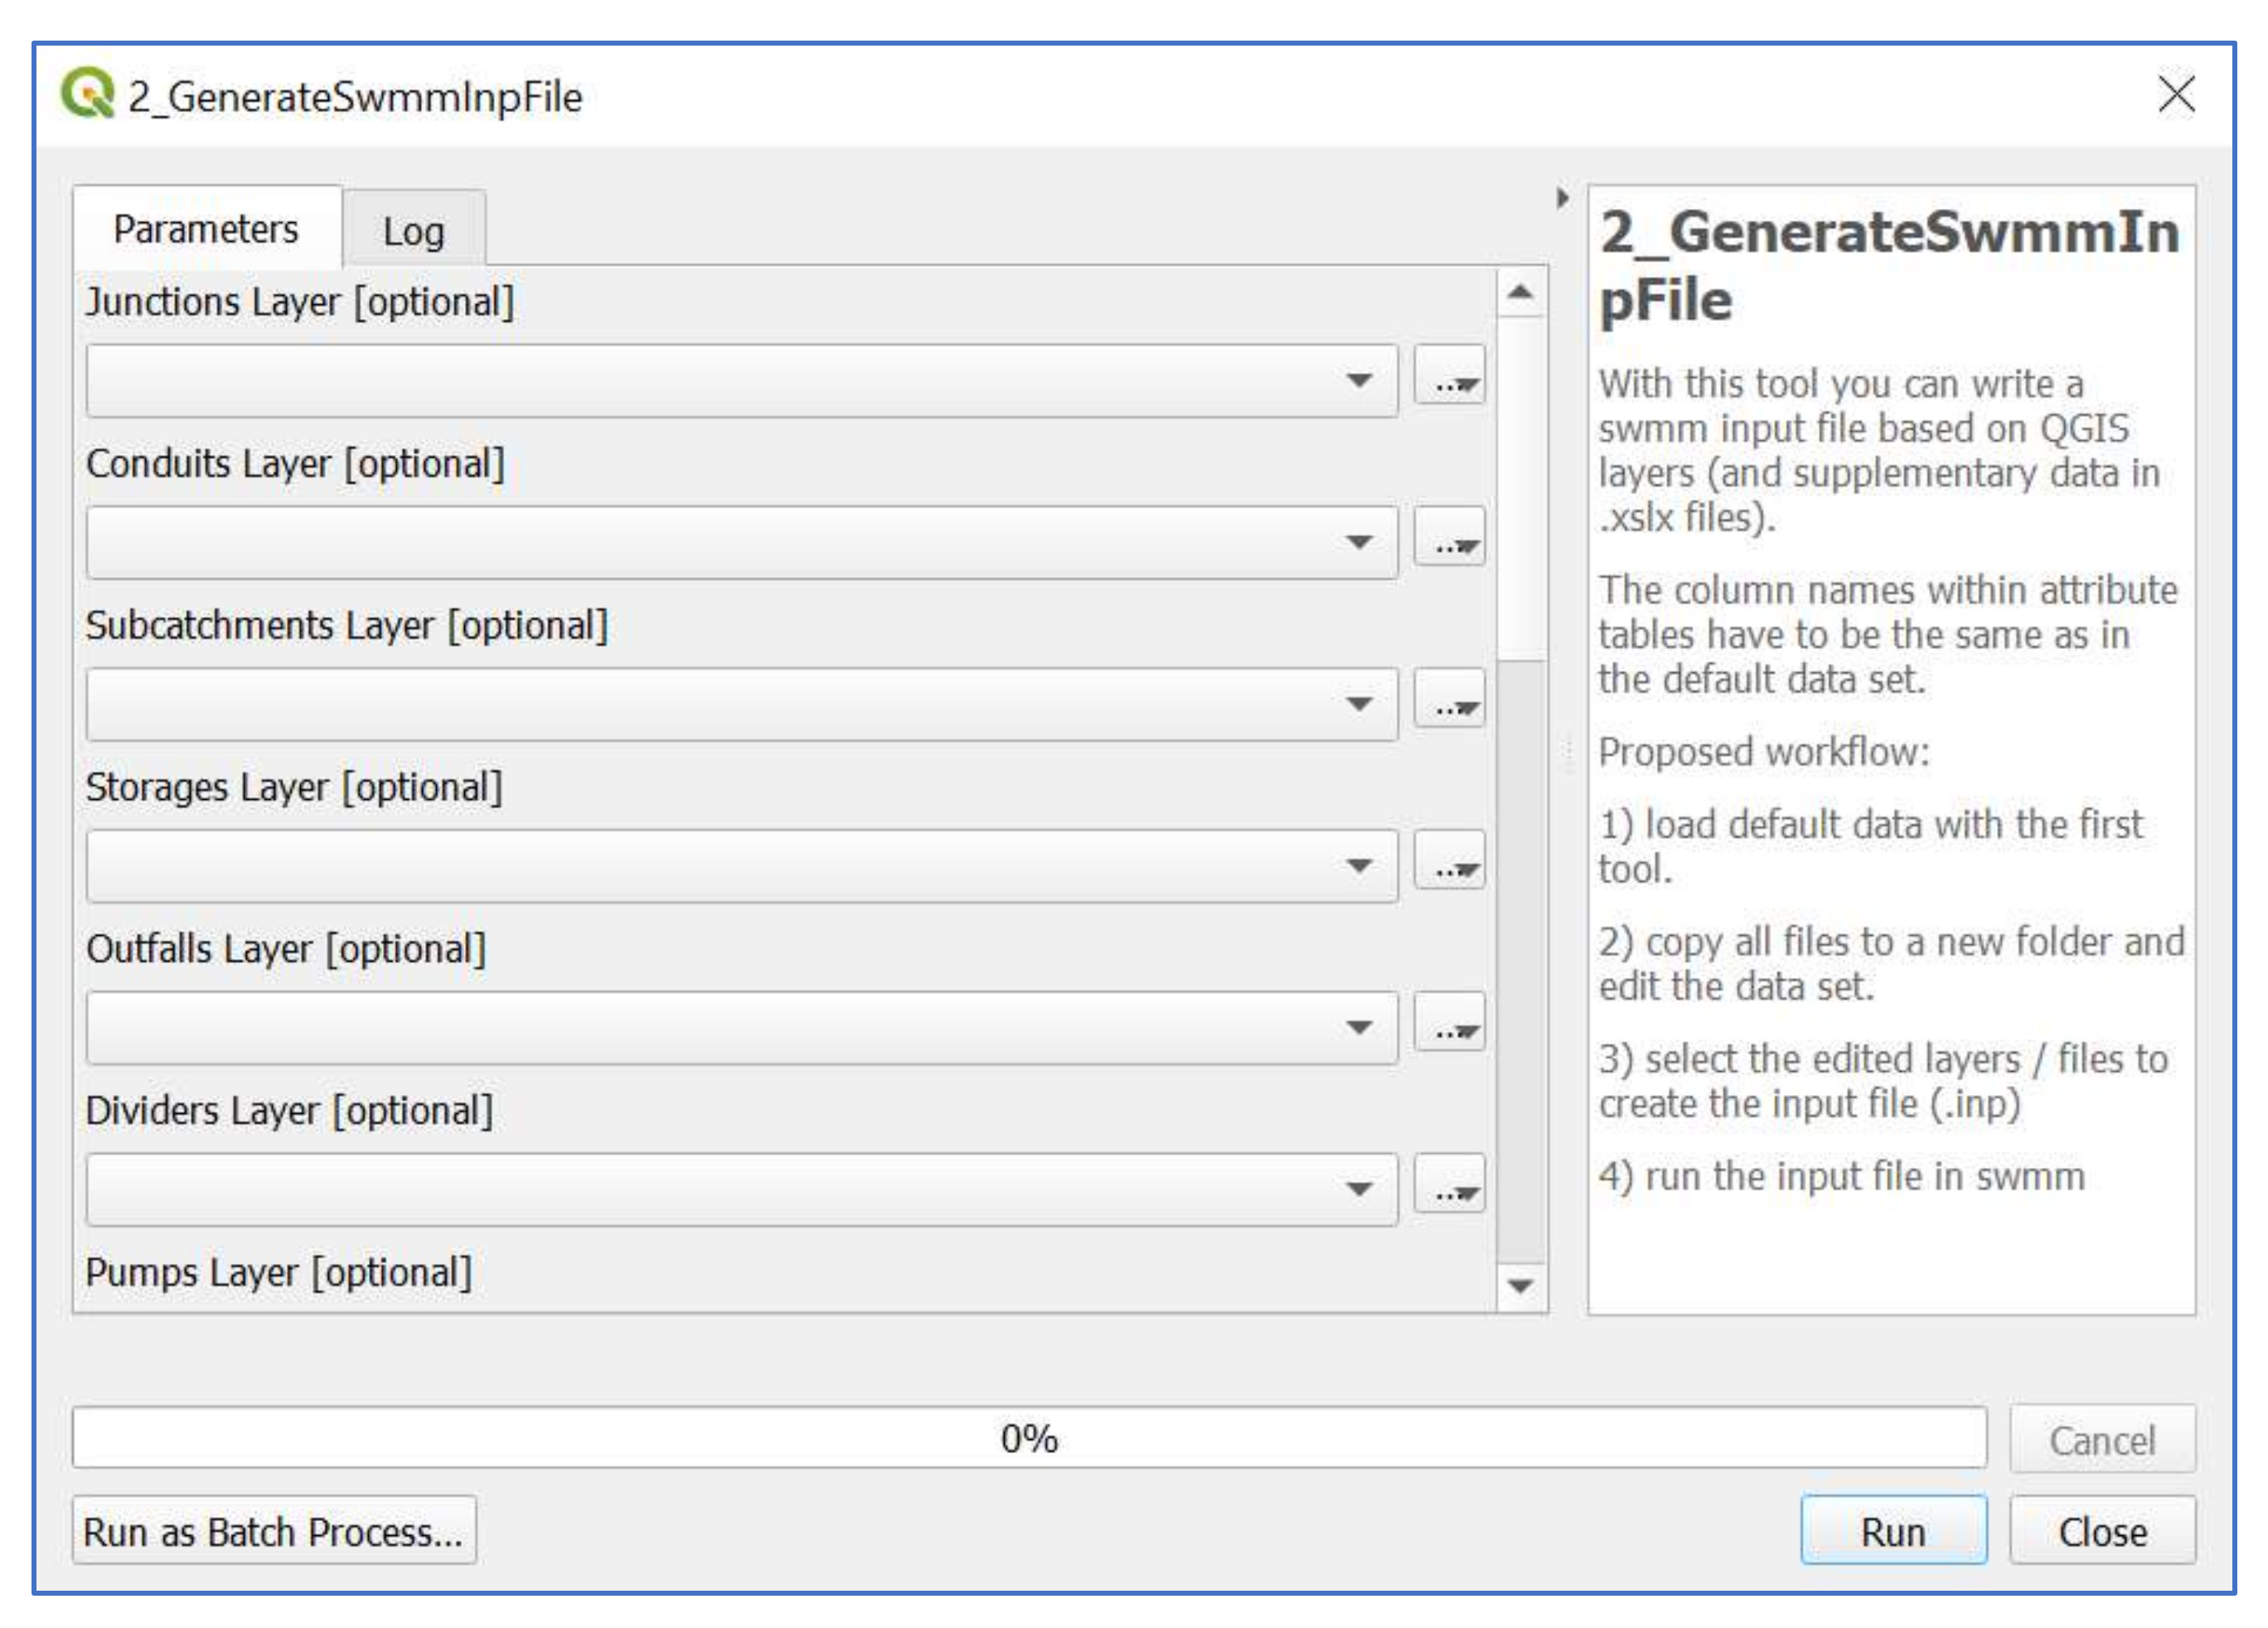
The second tool, “2_GenerateSwmmInpFile”, enables the user to create a SWMM input file directly from layers and tables within QGIS. In the input mask of the tool, the user chooses a file name for the resulting input file and selects the desired layers and tables (c.f. Figure 1). The layers’ attributes are then translated into text strings for each section. This requires specific column names within the shapefiles and spreadsheet names within the tables. A warning is displayed if a required column is missing. The tool finally joins the corresponding sections to create the input file.
With the third tool, “3_ImportInpFile”, input files for existing SWMM models can be imported into QGIS. The resulting layers can be saved in different formats (e.g., shapefile, geopackage or geojson). A user-defined prefix can be added to the imported files in order to distinguish between different models and layer versions.
3. Application Example
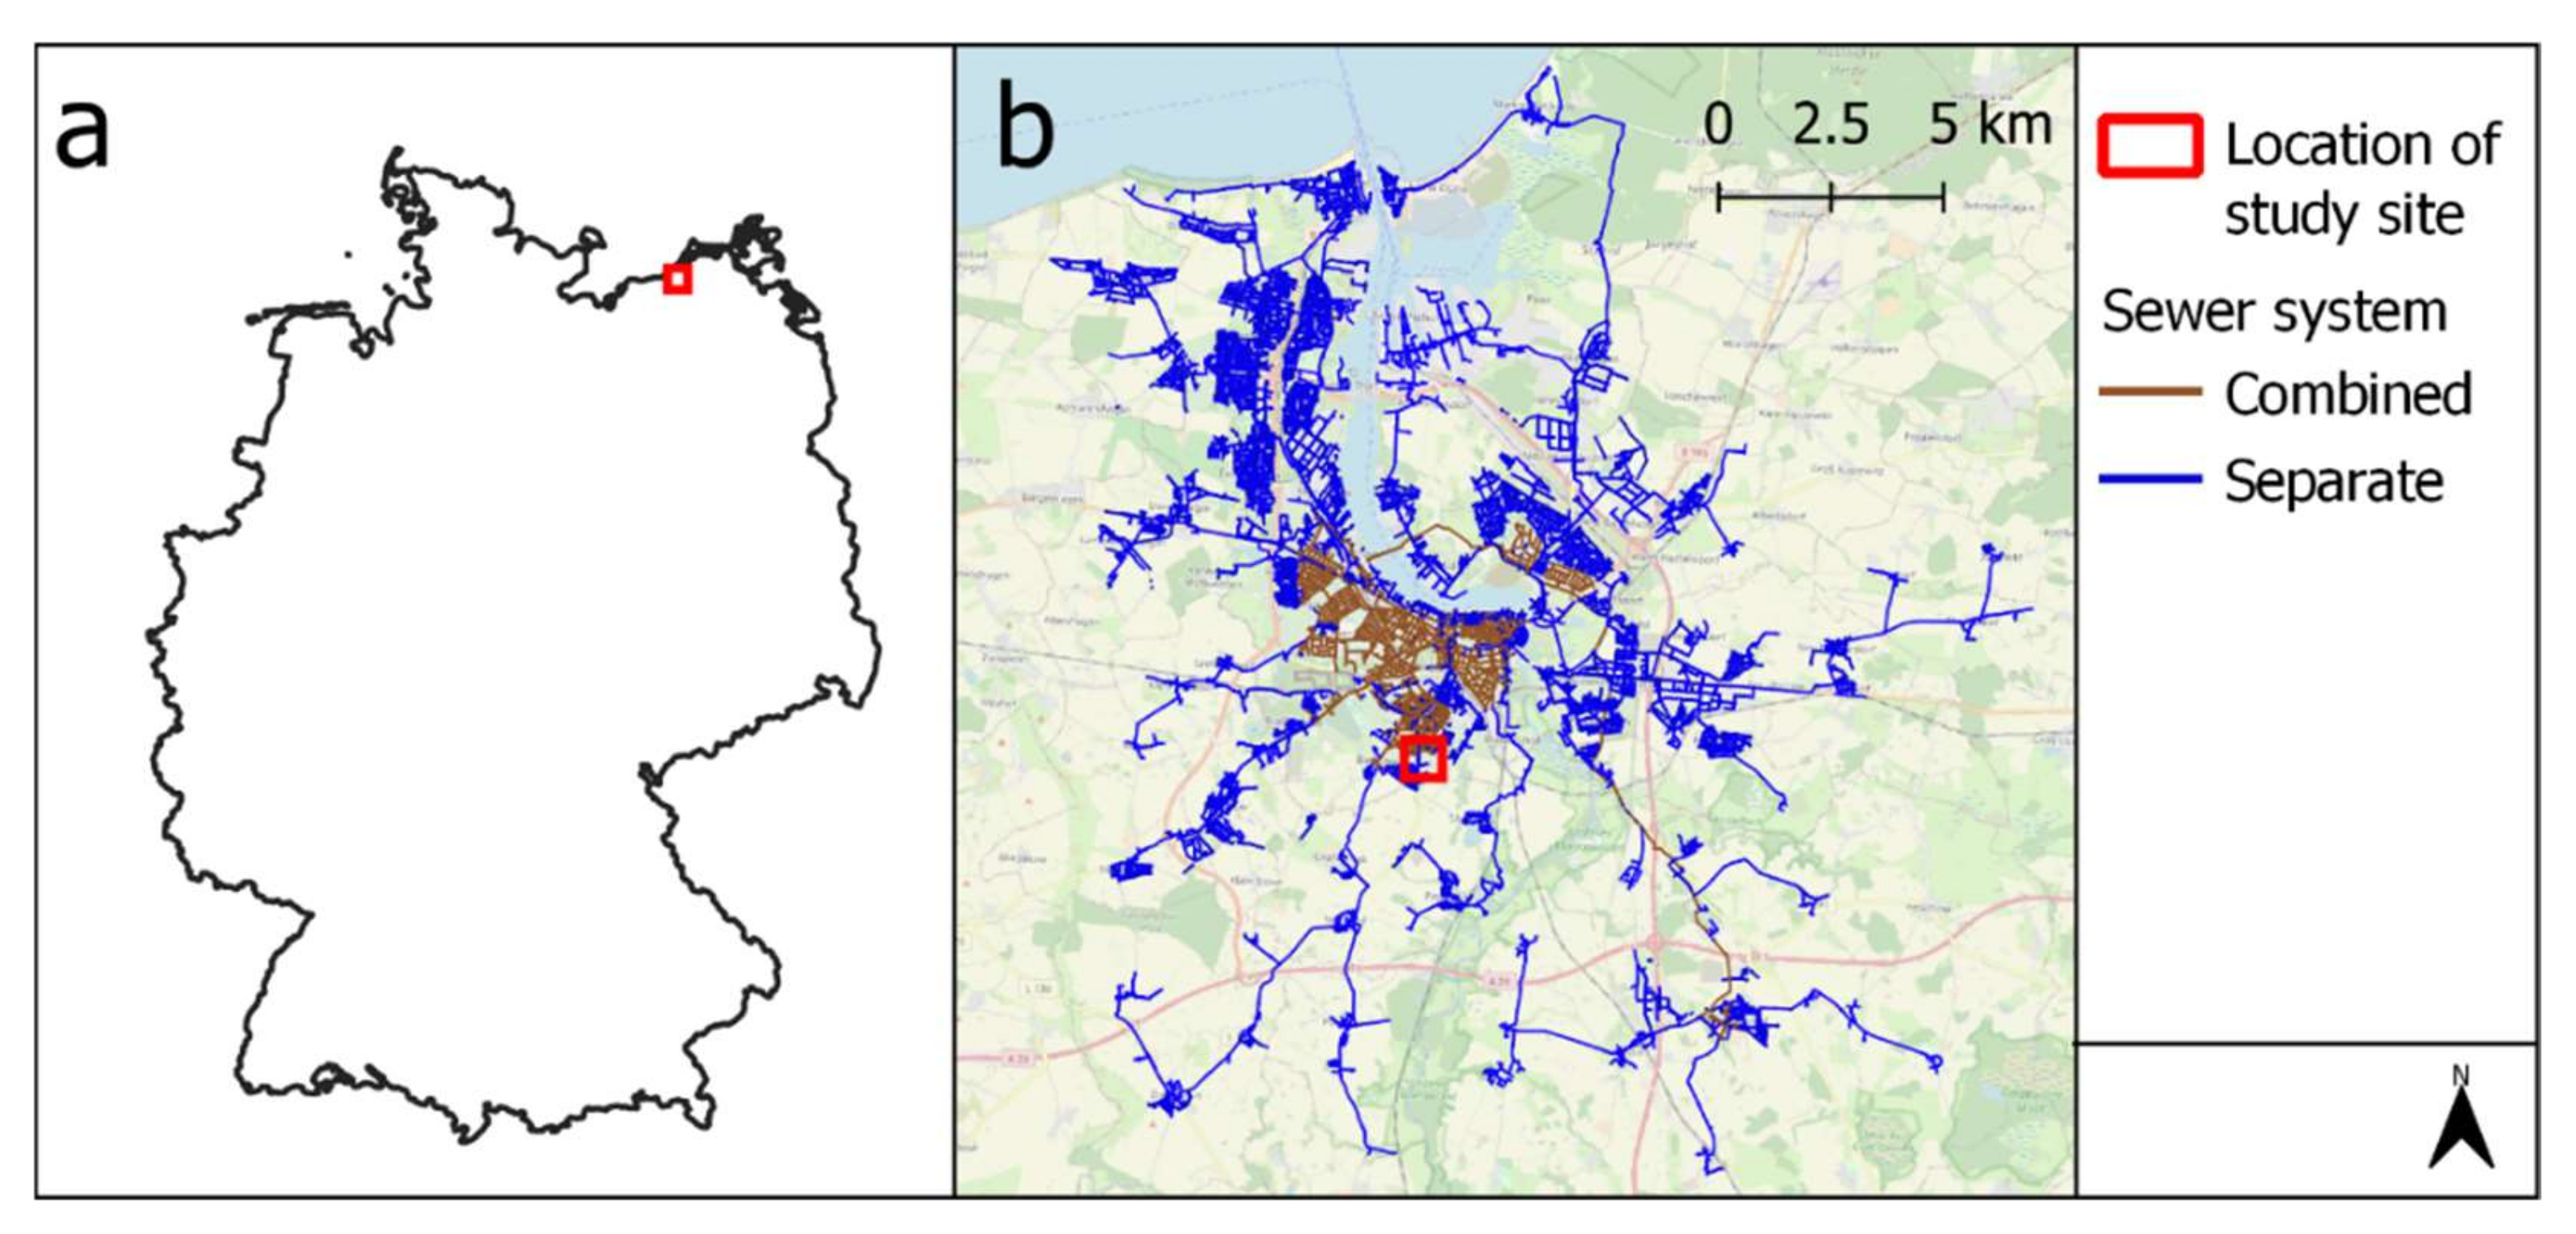
The workflow of the plugin in both directions is demonstrated for a subcatchment of the sewer system in Rostock. The city of Rostock is located in the northeast of Germany (c.f. Figure 2a). Its sewage and stormwater network has a total length of about 1500 km. In the city centre, a combined sewer system is operated, whereas in the surrounding districts and suburban areas a separate sewer system is prevalent (c.f. Figure 2b). Combined sewer overflows, occurring during rainfall events, are conducted to the estuary of the Warnow river. For the application example, parts of the corresponding subcatchments shall be converted into a separate system, in order to mitigate combined sewer overflows. In this imaginary, so-called “future scenario”, stormwater would have to be captured and retained or discharged separately into a watercourse.
To assess possible impacts of this conversion on both sewer system and discharge points, the aim of this application example is to:
- characterize the subcatchments by geodata in QGIS;
- use these values to set up a model in SWMM to estimate for rainfall events of different intensities:
- (a)
- current discharge volumes;
- (b)
- expected discharge volumes in future scenarios.
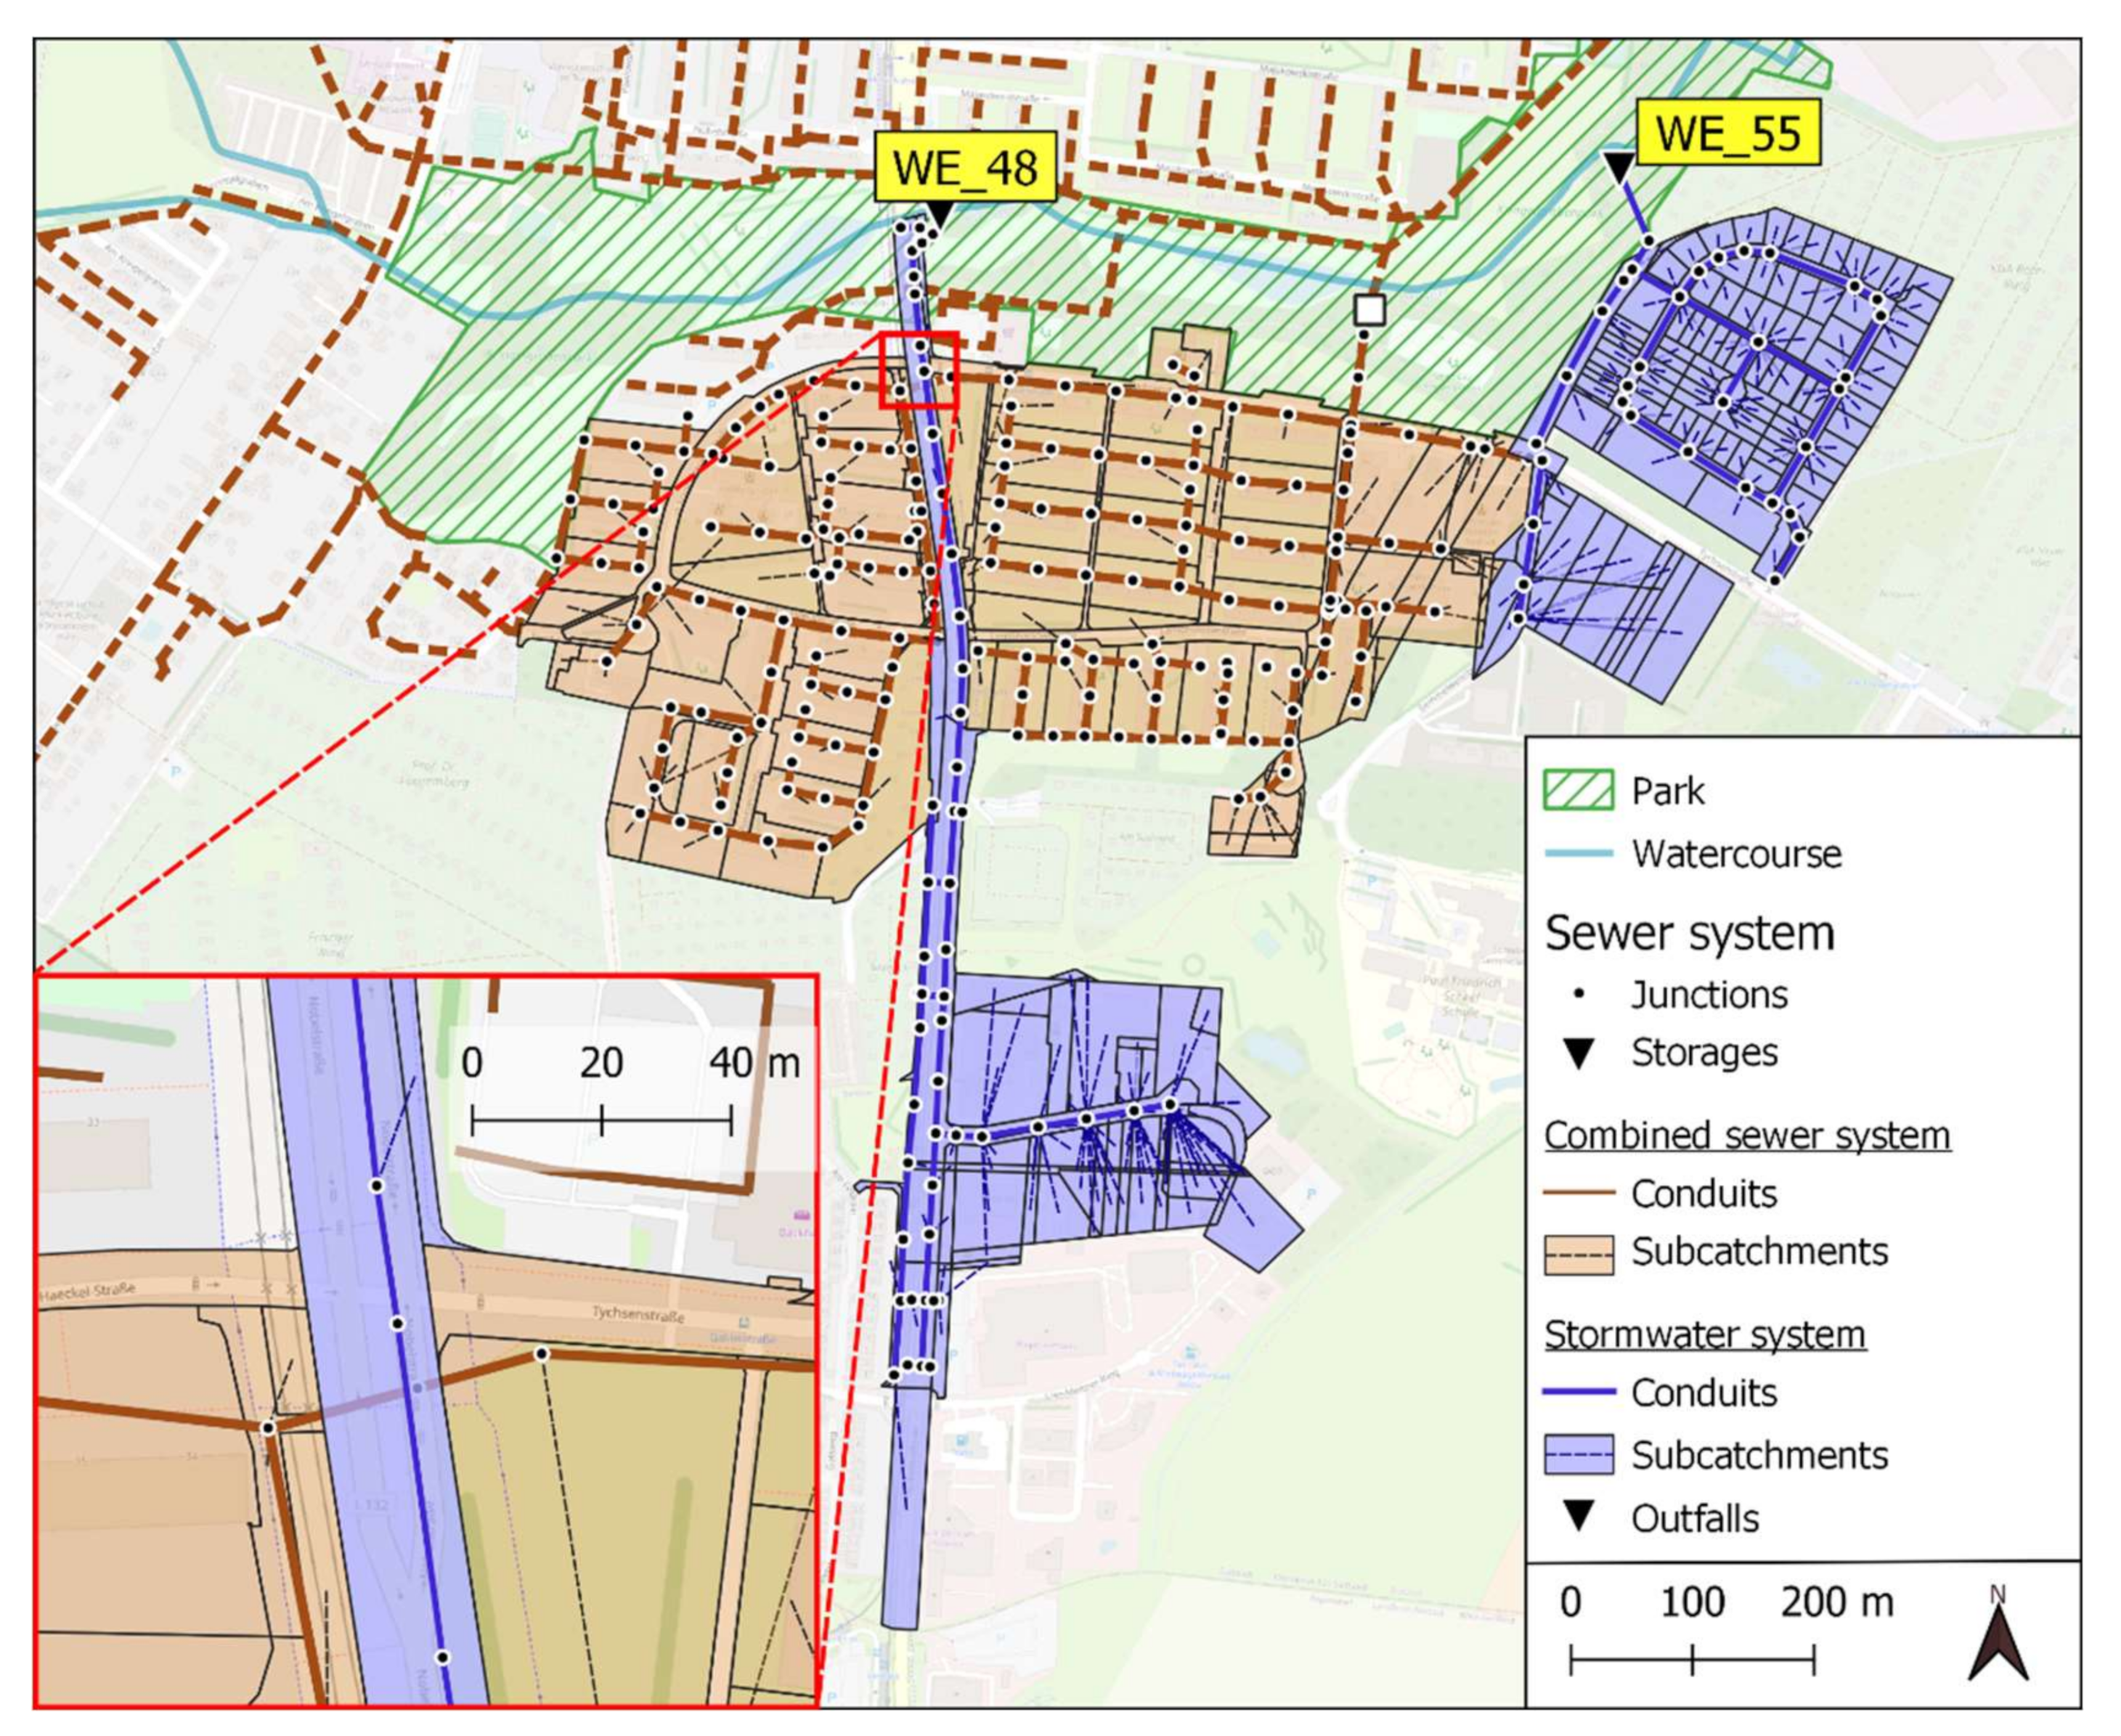
The exemplary study site is located next to the park “Kringelgrabenpark” in the south of Rostock. Surrounding areas are drained by both separate and combined sewer networks. A small open watercourse “Kringelgraben” runs through the park from west to east, where it starts to run through piped watercourse sections. There are two urban stormwater catchments with separate sewer systems (c.f. Figure 3), whose stormwater runoff is discharged directly into the watercourse. The stormwater catchments were named according to the name of the discharge permits of the outfalls (“WE_48” and “WE_55”). Adjacent parcels in the north of the study area are currently drained by the combined sewer system of the city (brownish area in Figure 3). As the detailed picture in Figure 3 shows, the sewer system crosses the street of catchment “WE_48”, but the two catchments are not connected to each other. A storage unit in the combined sewer system throttles maximum flows towards the city centre.
For the imaginary model of the separate stormwater system in the “future scenario”, it was assumed that the layout and pipe dimensions would be the same as the dimensions of the combined sewer system at present. The storage would stay in use and an outfall into the Kringelgraben would be placed behind it. This scenario is depicted in Figure 4. The new discharge point as well as the catchment are named “Var_Sep”.
3.1. Geodata and Preprocessing in QGIS
Preprocessing of geodata was performed in QGIS version 3.22 [39]. Geodata for the sewer network (junctions, conduits, and pumping stations) were provided by the local wastewater asscociation “Warnow Wasser und Abwasserverband” (WWAV) in shapefile format. The sewer objects needed for the model in SWMM were selected with the aid of the routing algorithm of the plugin “WaterNetAnalyzer” [40] and grouped in separate layers in QGIS. The attributes of each layer were then adjusted based on the default data set by using the standard QGIS tool “field calculator”.
The catchment area boundaries and subcatchments were extracted from official cadastral datasets. Each subcatchment was connected to the nearest junction with a spatial join. Streets were further subdivided by Voronoi cells from junction points if multiple manholes were located within a street area. The mean slope was derived from DEM rasters with a grid size of 1 m2. Subcatchment widths and areas were calculated from subcatchment geometries. Roughness and infiltration parameters were set by a spatial join according to previous models of the Kringelgraben catchment from Kachholz and Tränckner [11], which were imported into QGIS with the tool “3_ImportInpFile” from the developed plugin. Landuse data of the same study and OpenStreetMap (OSM) [41] were used to derive the degree of imperviousness of the subcatchments. The resulting summary for each subcatchment was prepared using the QGIS field calculator to generate mean, maximum and minimum values.
3.2. Rainfall Data and Model Setup
Synthetic rainfall time series for the model were generated in Microsoft Excel by transferring statistic block rains (provided by the German Weather Service) into dynamic model rains as described by Kachholz and Tränckner [11]. Three rainfall events were applied in the models with a return period of 1 year and duration times of 15 min, 1 h and 2 h. Simulations were executed with SWMM version 5.1.015 with a dynamic wave routing model. The total simulation time was set to 6 h, with a routing step of 10 s. The Green-Amp method was used for the infiltration model for all subcatchments. With the tool “2_GenerateSwmmInpFile”, the prepared layers in QGIS and tables for rainfall data and model options were merged into an input file for SWMM.
3.3. Results and Discussion
The GIS analysis carried out in advance shows that the three catchments of the study site differ in several properties that are relevant to water management. Table 1 summarizes main characteristic values for each site. “WE_55” is a residential area of 8.3 ha with mainly detached houses. Approximately 59% of its area is pervious as many houses are surrounded by gardens. By contrast, the catchment “WE_48” is characterized by a commercial area in the south and a major road that connects the commercial area with the city and represents an important transport axis in the southern direction. Impervious surfaces cover approximately 78% of the catchment. The future stormwater catchment “Var_Sep” would be another residential area of 24.1 ha covered with blocks of houses and larger green areas in between.
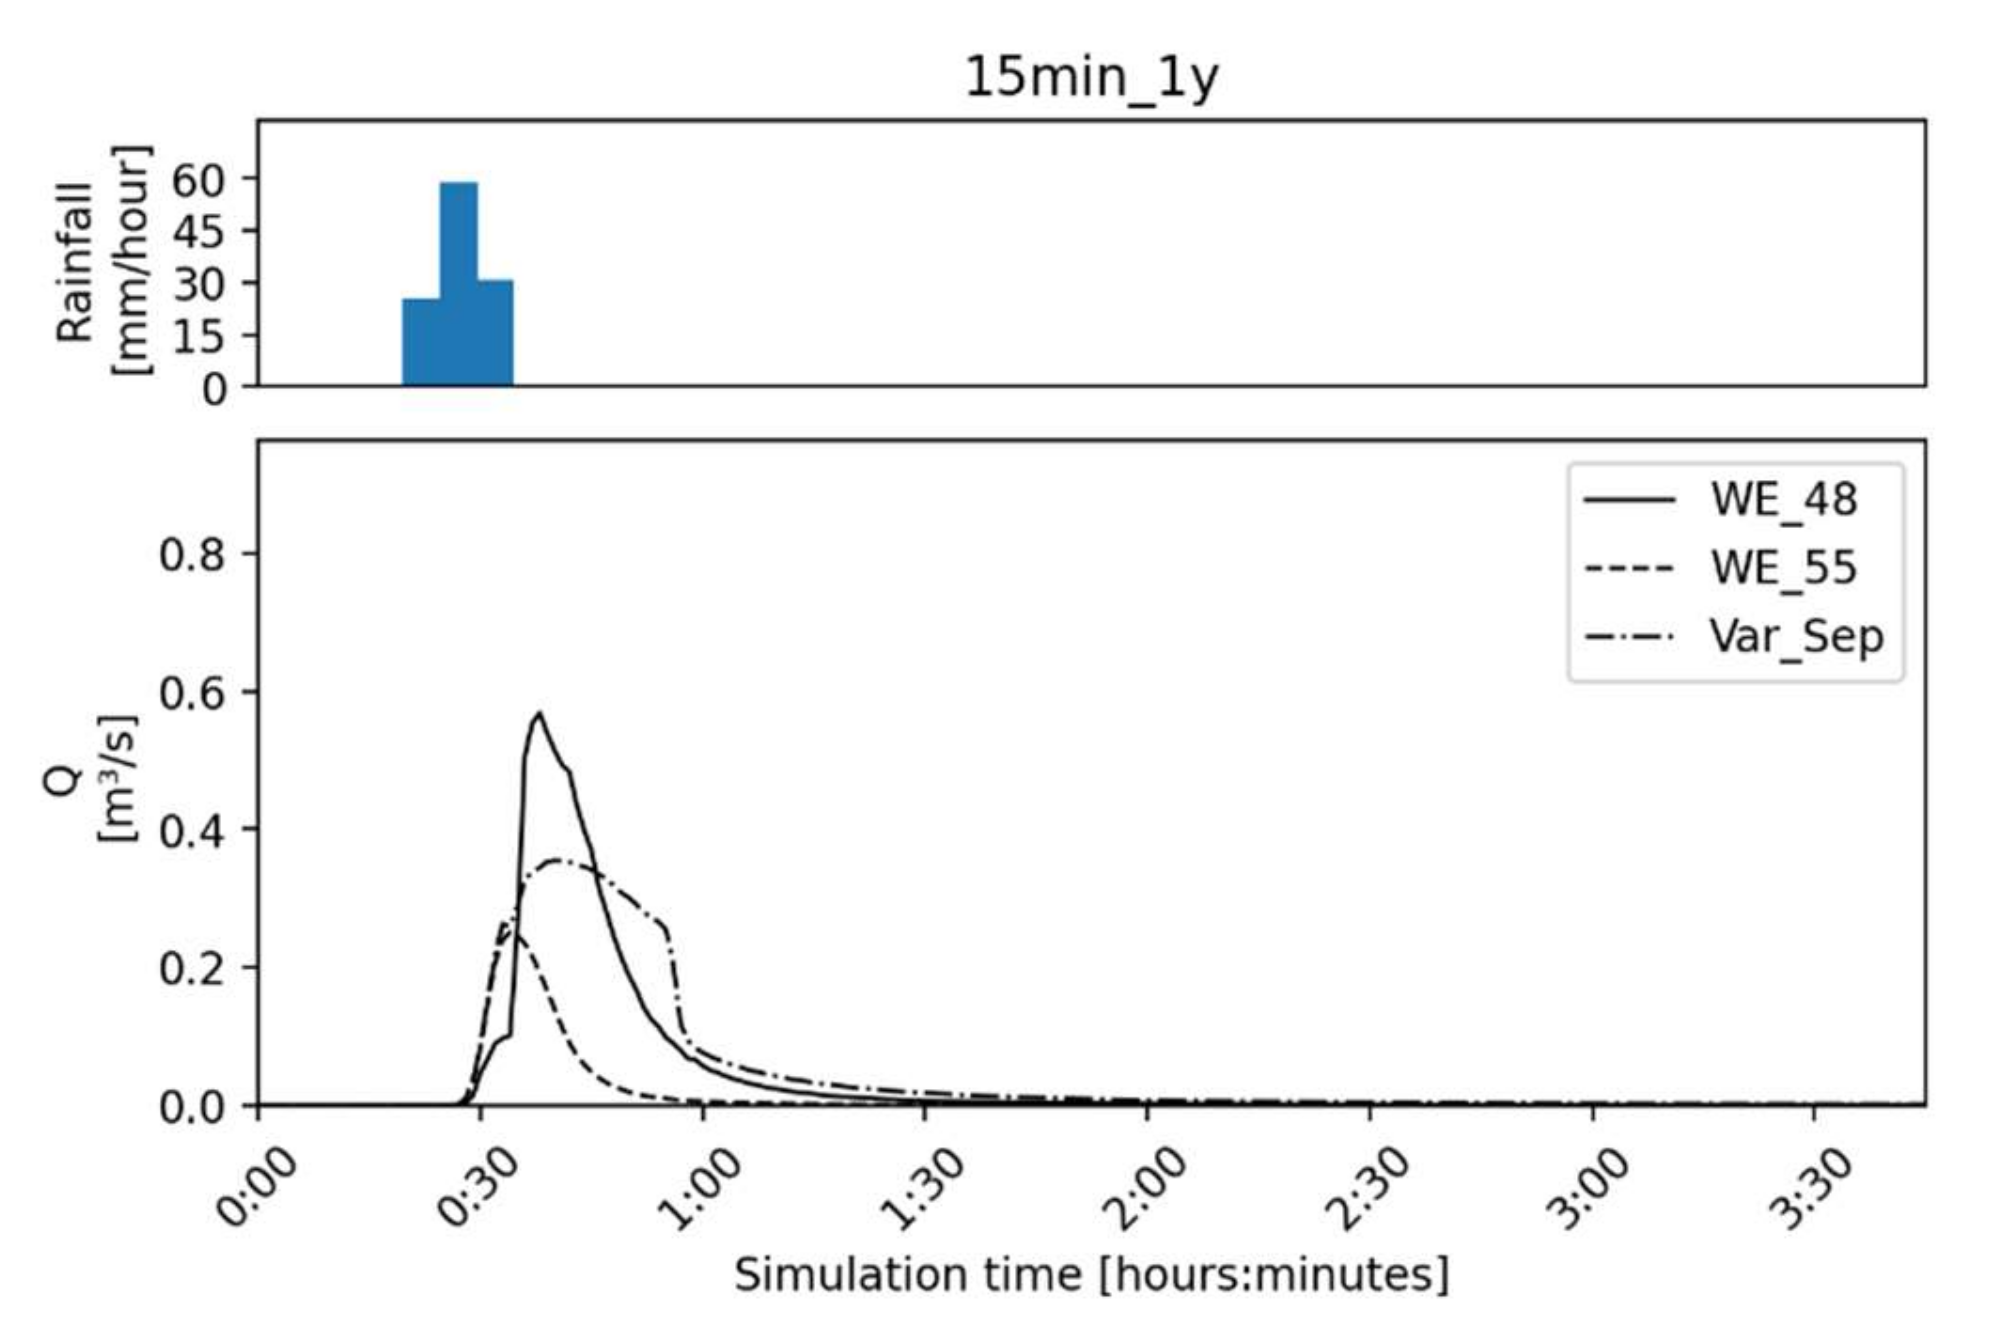
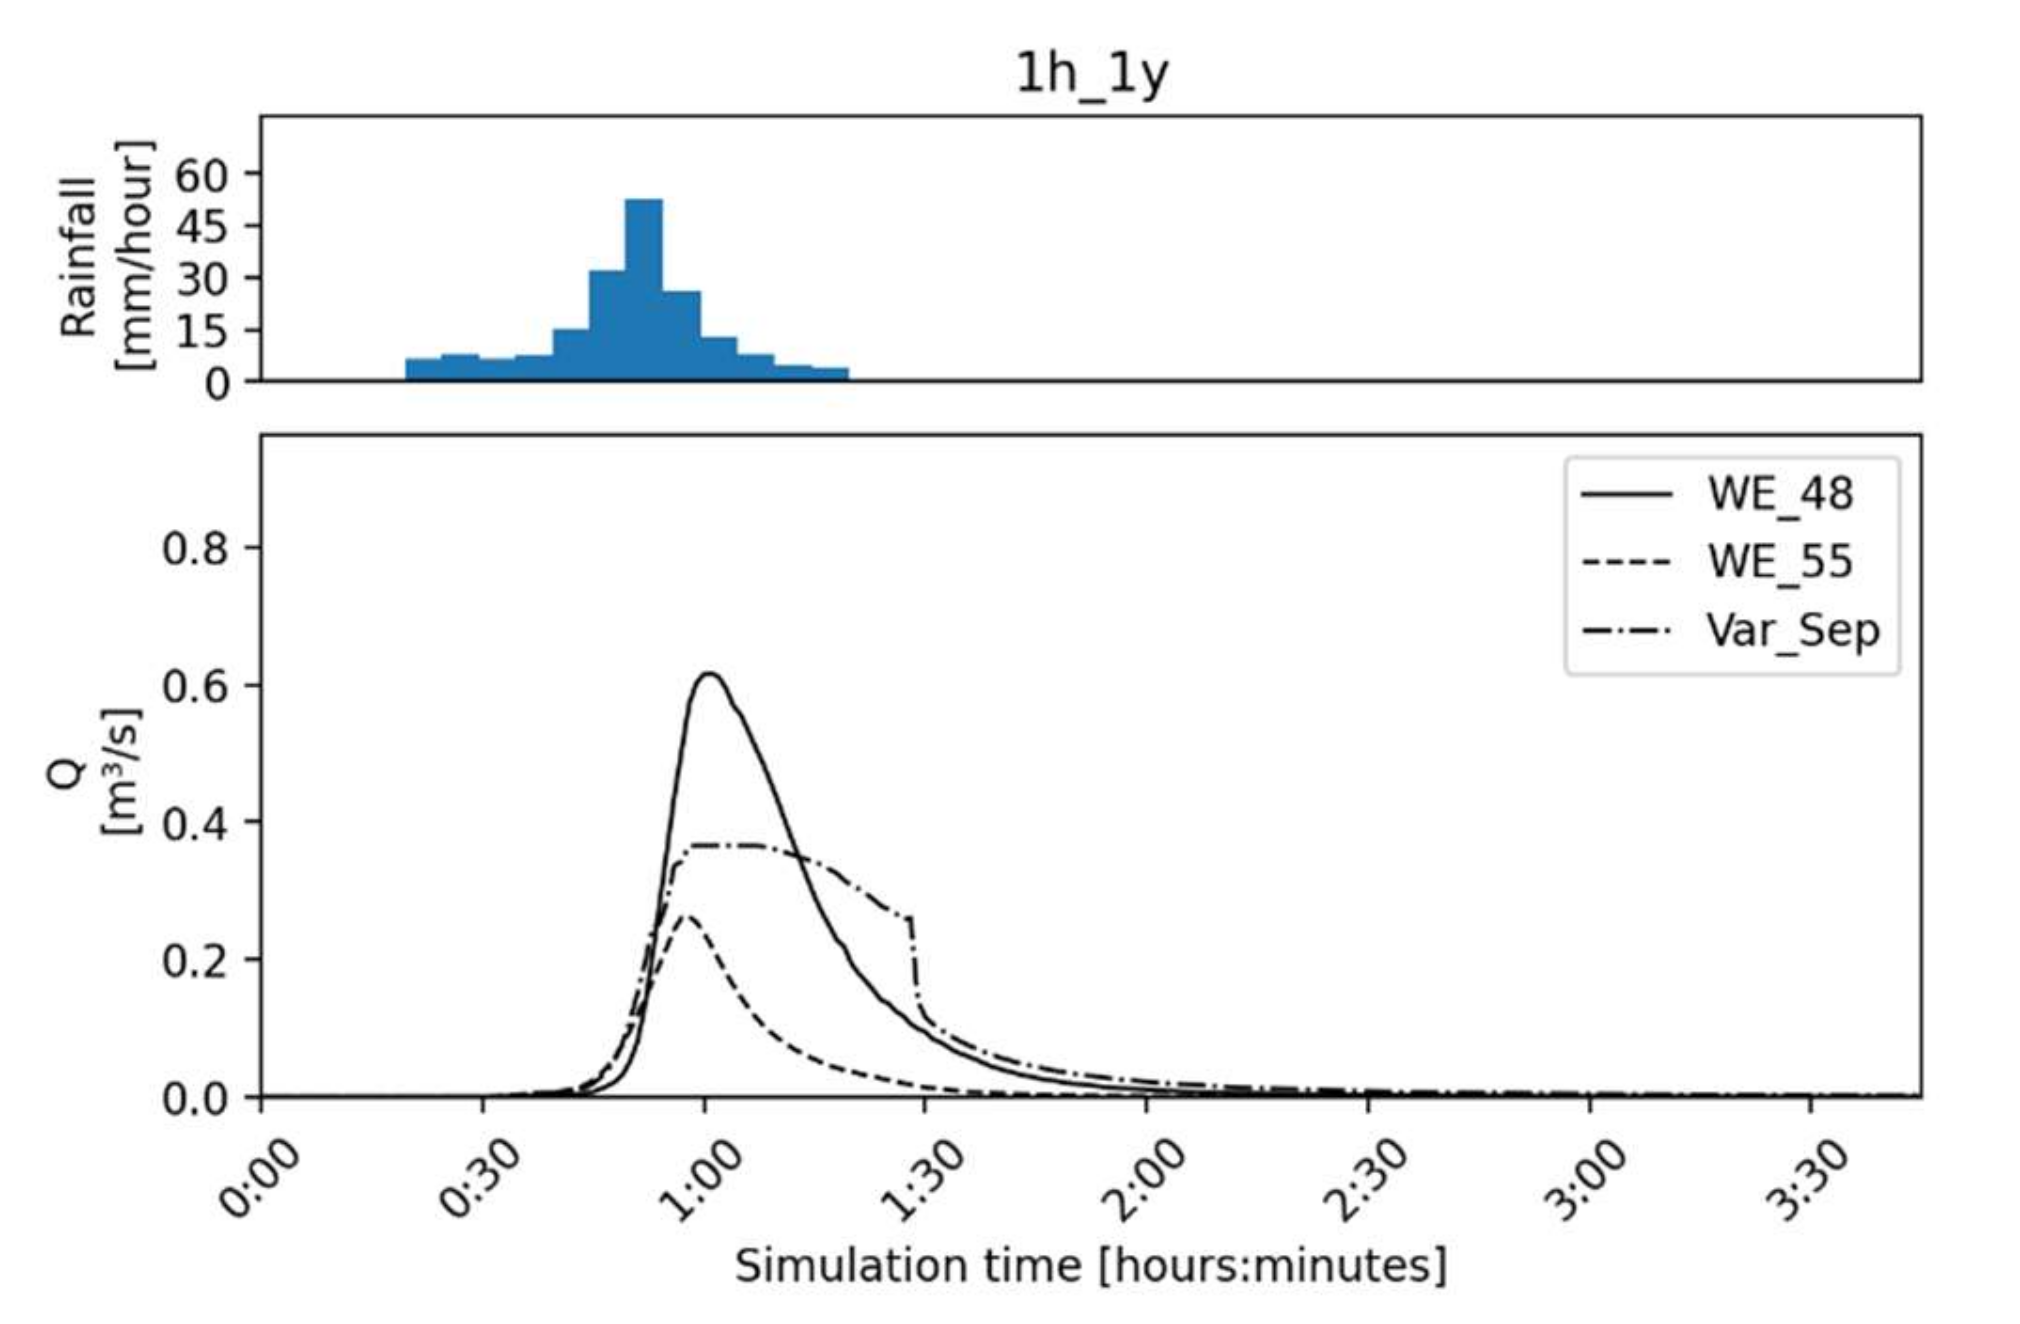
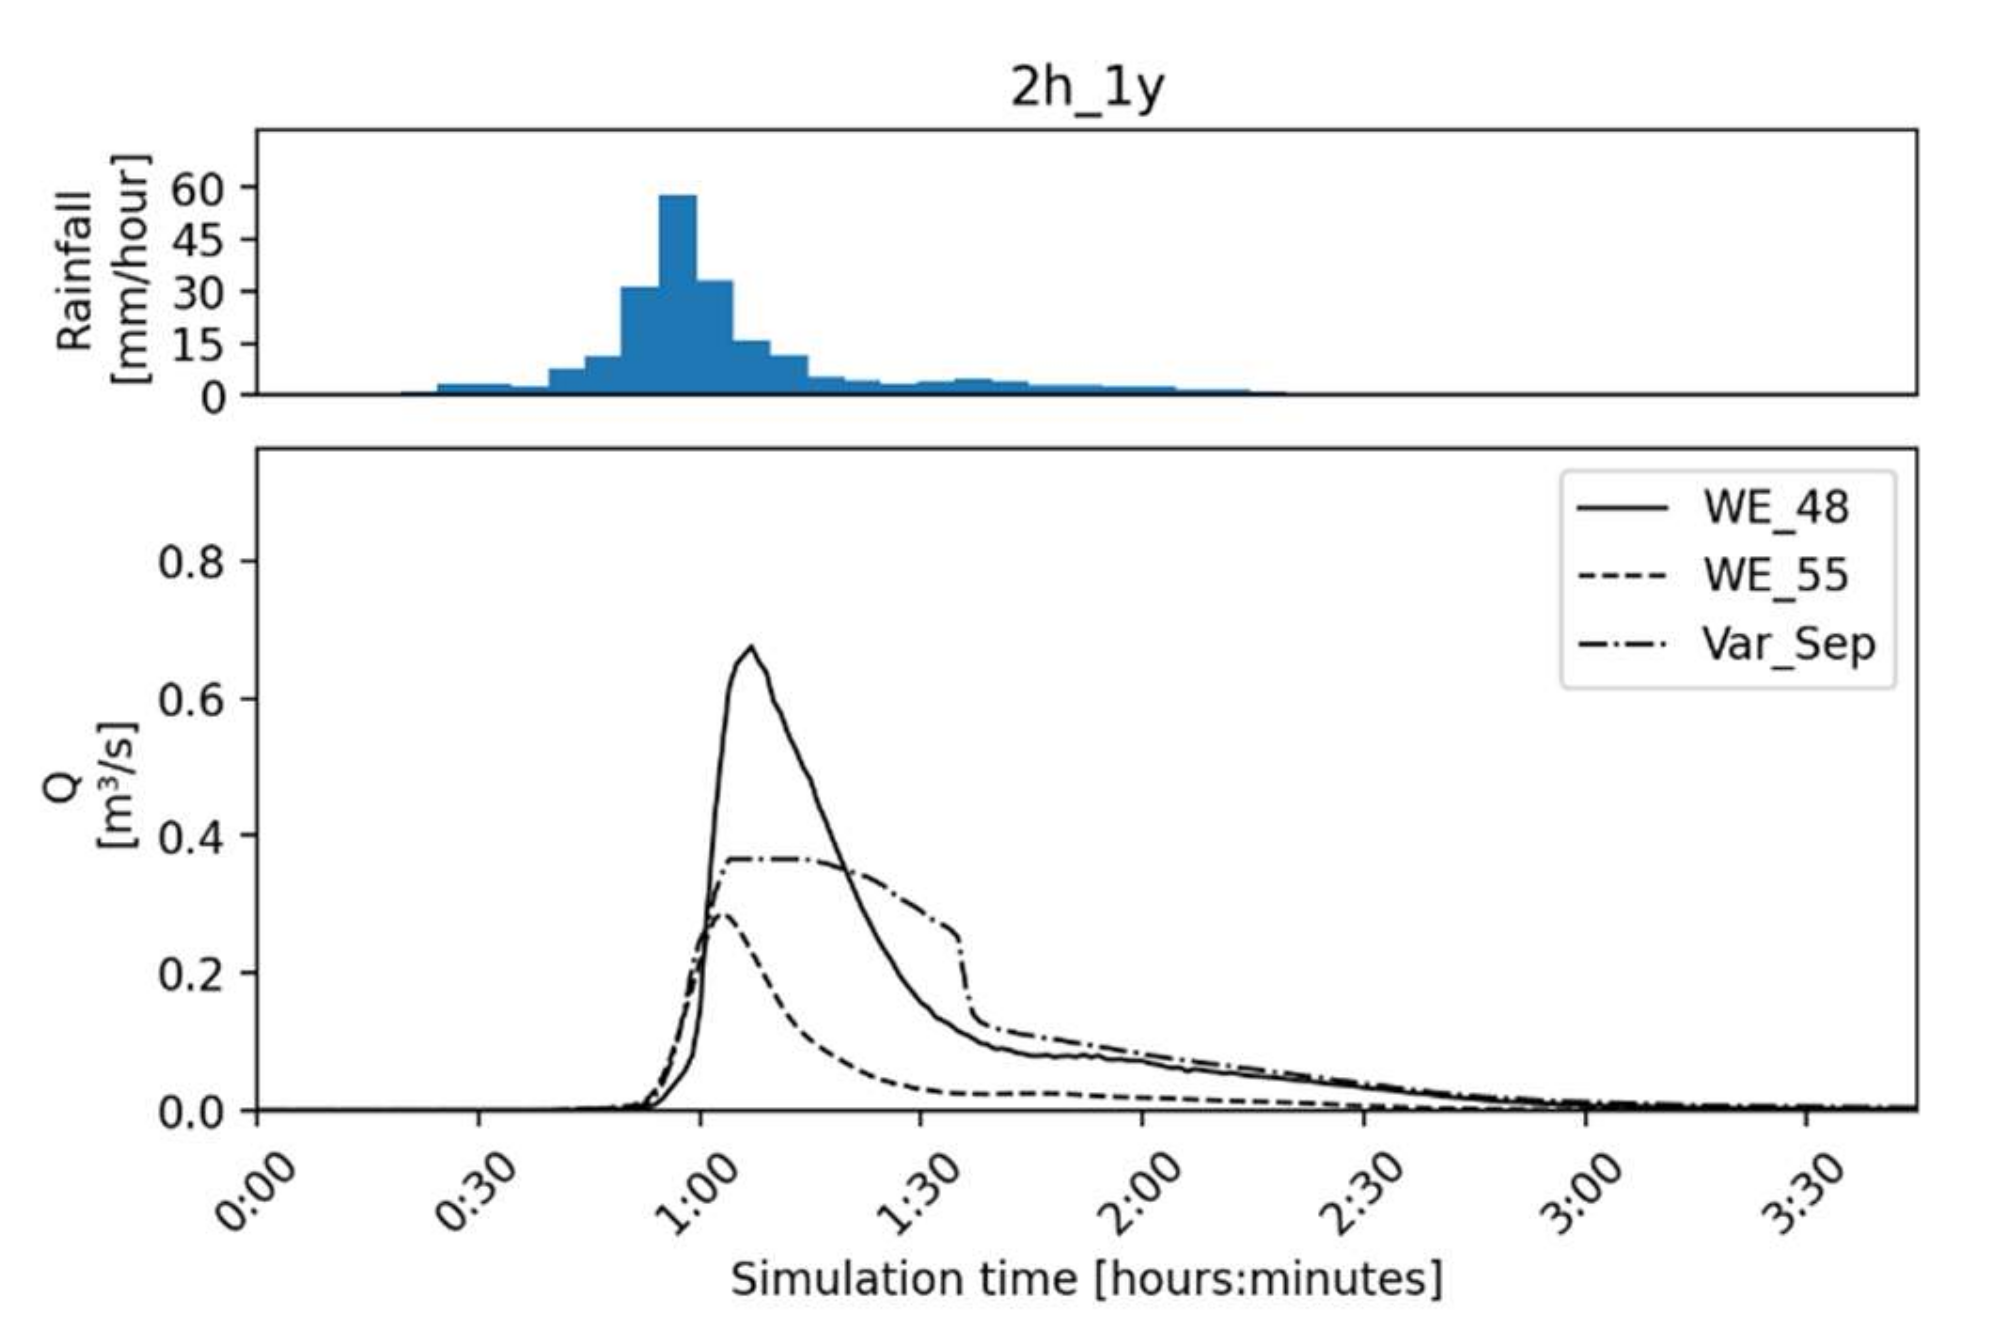
In this model, the conversion of the current combined sewer system into a separate system would likely have a remarkable impact in this section of the watercourse. Total discharge volumes would increase by 88% (15 min_1 y), 77% (1 h_1 y) and 77% (2 h_1 y). Likewise, peak inflows of 0.359 m3/s (15 min_1 y), 0.366 m3/s (1 h_1 y) and 0.365 m3/s (2 h_1 y) from “Var_Sep” would affect the flow regime of the Kringelgraben (c.f. Table 2). Moreover, in comparison to “WE_48” and “WE_55”, peak stormwater discharges form catchment “Var_sep” continue for a longer time after a rain event (c.f. Figure A1, Figure A2 and Figure A3, Appendix B).
Since this model represents a fictitious scenario in which the model parameters were derived from existing models without further calibration, the uncertainty of the results cannot be quantified. The example, however, shows that the tools of the plugin allow a user-friendly and systematic construction of SWMM models by open-source software based on geodata from various sources. The variety of data formats that can be imported by QGIS expands the amount of information that can directly be used for the model setup [42]. As the main advantage of the plugin, the tool “2_GenerateSwmmInpFile” simplifies the former time-consuming data transfer from QGIS to SWMM, which was mentioned for example by Sadeghi et al. [18]. Since individual layers can be selected for export with this tool, it is possible to build model variants from different layer combinations. For example, subcatchments and sewer networks with different levels of detail can be used, as proposed by Krebs et al. [8] and Yang et al. [19], or design variants of a sewer network with different routes and pipe dimensions.
The import function (“3_ImportInpFile”) of the plugin facilitates the editing process of existing models and enables them to be conveniently integrated into new models. As shown in the application example, model parameters such as catchment properties can be transferred by spatial queries in GIS to create a submodel for particular case scenarios. Moreover, importing models and creating partial models or simplified models in GIS could be used to reduce the computation time [19]. The import function also extends user possibilities to gather additional information when data availability or accessibility is limited, e.g., as described by Blumensaat et al. [20].
So far, the functions of the plugin “generate_swmm_inp” are limited to the import and export of geodata and tables for model preparation. Several features in SWMM such as settings regarding climate-related variables still have to be manged manually in SWMM. Model results can be saved as a text file within the SWMM user interface. The extraction of model results from SWMM output files, e.g., as it is possible using python scripts with packages such as swmm-api [24] or swmmtoolbox [27], is not yet implemented in the plugin. However, the combination of direct manipulation of the base data with the QGIS toolbox and the translation of these data into models for SWMM already fills a large gap in the functionality of the SWMM user interface [18].
4. Conclusions
This article describes the goals and functions of the plugin “generate_swmm_inp” for QGIS, which serves as an interface between the GIS environment and SWMM. The plugin considerably simplifies the workflow from the preparation of geodata to the model. Different from the aforementioned solutions [23,24,25,26], SWMM input files can be created without the need for any programming knowledge. A challenge for first time users is to arrange their own data according to the specific column names required for the creation of the input file. Therefore, using the default data set as a template, which can be added to a QGIS project with a few clicks, is recommended. Further case studies are currently being conducted to test the deeper application of the tools. Users are invited to share their experience in the public code repository (see Data Availability Statement) and to participate in the future development of the open-source software.
Author Contributions
Conceptualization, J.S.; methodology, J.S.; software, J.S.; investigation, J.S.; data curation, J.S.; writing—original draft preparation, J.S.; writing—review and editing, J.T.; visualization, J.S.; supervision, J.T.; project administration, J.T.; funding acquisition, J.T. All authors have read and agreed to the published version of the manuscript.
Funding
This study was conducted within the framework of the Project PROSPER-RO, funded by BMBF, grant number 033L212. We acknowledge financial support by Deutsche Forschungsgemeinschaft and Universität Rostock within the funding programme Open Access Publishing.
Institutional Review Board Statement
Not applicable.
Data Availability Statement
The plugin can be downloaded at: https://plugins.qgis.org/plugins/generate_swmm_inp/ (accessed on 18 June 2022) or with the plugin manager in QGIS. The source code is available on GitHub at: https://github.com/Jannik-Schilling/generate_swmm_inp (accessed on 18 June 2022). A default data set to test the plugin can be downloaded at https://github.com/Jannik-Schilling/generate_swmm_inp/tree/main/test_data/swmm_data (accessed on 18 June 2022).
Acknowledgments
We thank the local wastewater association (WWAV) and its operator Nordwasser GmbH for providing the sewer network data.
Conflicts of Interest
The authors declare no conflict of interest. The funders had no role in the design of the study; in the collection, analyses, or interpretation of data; in the writing of the manuscript, or in the decision to publish the results.
Appendix A

Table A1.
SWMM objects and attributes linked to GIS layers.
| Section in SWMM Input File | File Name in Default Data Set | Layer Geometry | Annotations |
|---|---|---|---|
| SUBCATCHMENTS | SWMM_subcatchments.gpkg | Polygon | |
| SUBAREAS | |||
| INFILTRATION | |||
| Polygons | Automatically derived from subcatchment geometries | ||
| CONDUITS | SWMM_conduits.gpkg | Line | |
| LOSSES | |||
| PUMPS | SWMM_pumps.gpkg | Line | |
| WEIRS | SWMM_weirs.gpkg | Line | |
| OUTLETS | SWMM_outlets.gpkg | Line | |
| ORIFICES | Line | ||
| XSECTIONS | - | - | Automatically derived from CONDUITS, WEIRS and ORIFICES |
| VERTICES | - | - | Automatically derived from line geometries |
| JUNCTIONS | SWMM_junctions.gpkg | Point | |
| STORAGES | SWMM_storages.gpkg | Point | |
| OUTFALLS | SWMM_outfalls.gpkg | Point | |
| DIVIDERS | SWMM_dividers.gpkg | Point | |
| COORDINATES | - | - | Automatically derived from point geometries |
Table A2.
SWMM sections, which are saved in tables by the tool.
| Section in SWMM Input File | File Name in Default Data Set | Table Names in Excel File |
|---|---|---|
| OPTIONS | gisswmm_options.xlsx | OPTIONS |
| CURVES | gisswmm_curves.xlsx | Rating |
| Storage | ||
| Tidal | ||
| Weir | ||
| Pump1 | ||
| Pump2 | ||
| Pump3 | ||
| Pump4 | ||
| Pump5 | ||
| Control | ||
| Diversion | ||
| Shape | ||
| INFLOWS | gisswmm_inflows.xlsx | Direct |
| DWF | Dry_Weather | |
| PATTERNS | gisswmm_patterns.xlsx | HOURLY |
| MONTHLY | ||
| DAILY | ||
| WEEKEND | ||
| POLLUTANTS | gisswmm_quality.xlsx | POLLUTANTS |
| LANDUSES | LANDUSES | |
| BUILDUP | ||
| WASHOFF | ||
| COVERAGES | COVERAGES | |
| LOADINGS | LOADINGS | |
| TIMESERIES | gisswmm_timeseries.xlsx | - |
| RAINGAGES | ||
| STREETS | gisswmm_streets.xlsx | STREETS |
| INLETS | INLETS | |
| INLET_USAGE | INLET_USAGE | |
| TRANSECTS | gisswmm_transects.xlsx | Data |
| XSections |
Appendix B
Figure A1.
Model rainfall intensity (duration = 15 min, return period = 1 year) and flow (Q) at discharge points.
Figure A1.
Model rainfall intensity (duration = 15 min, return period = 1 year) and flow (Q) at discharge points.

Figure A2.
Model rainfall intensity (duration = 1 h, return period = 1 year) and flow (Q) at discharge points.
Figure A2.
Model rainfall intensity (duration = 1 h, return period = 1 year) and flow (Q) at discharge points.

Figure A3.
Model rainfall intensity (duration = 2 h, return period = 1 year) and flow (Q) at discharge points.
Figure A3.
Model rainfall intensity (duration = 2 h, return period = 1 year) and flow (Q) at discharge points.

References
- Rossman, L.A.; Simon, M. Storm Water Management Model User’s Manual Version 5.2; National Risk Management Research Laboratory, Office of Research and Development, US Environmental Protection Agency: Cincinnati, OH, USA, 2022. [Google Scholar]
- Rossman, L.A.; Dickinson, R.E.; Schade, T.; Chan, C.C.; Burgess, E.; Sullivan, D.; Lai, F.-H. SWMM 5—The Next Generation of EPA’s Storm Water Management Model. J. Water Manag. Model. 2004, 12, 339–358. [Google Scholar] [CrossRef]
- Simon, M.; Tryby, M. Open Source SWMM: Community—Based Software Development for Storm Water Management Modeling; EPA/600/S-18/129; U.S. Environmental Protection Agency: Washington, DC, USA, 2018. [Google Scholar]
- Niazi, M.; Nietch, C.; Maghrebi, M.; Jackson, N.; Bennett, B.R.; Tryby, M.; Massoudieh, A. Storm Water Management Model: Performance Review and Gap Analysis. J. Sustain. Water Built Environ. 2017, 3, 04017002. [Google Scholar] [CrossRef] [PubMed] [Green Version]
- Peng, J.; Yu, L.; Cui, Y.; Yuan, X. Application of SWMM 5.1 in flood simulation of sponge airport facilities. Water Sci. Technol. 2020, 81, 1264–1272. [Google Scholar] [CrossRef] [PubMed]
- Lowe, S.A. Sanitary sewer design using EPA storm water management model (SWMM). Comput. Appl. Eng. Educ. 2009, 18, 203–212. [Google Scholar] [CrossRef]
- Burszta-Adamiak, E.; Mrowiec, M. Modelling of green roofs’ hydrologic performance using EPA’s SWMM. Water Sci. Technol. 2013, 68, 36–42. [Google Scholar] [CrossRef]
- Krebs, G.; Kokkonen, T.; Setälä, H.; Koivusalo, H. Parameterization of a Hydrological Model for a Large, Ungauged Urban Catchment. Water 2016, 8, 443. [Google Scholar] [CrossRef]
- Rai, P.K.; Chahar, B.R.; Dhanya, C.T. GIS-based SWMM model for simulating the catchment response to flood events. Hydrol. Res. 2017, 48, 384–394. [Google Scholar] [CrossRef]
- Jang, S.; Cho, M.; Yoon, J.; Yoon, Y.; Kim, S.; Kim, G.; Kim, L.; Aksoy, H. Using SWMM as a tool for hydrologic impact assessment. Desalination 2007, 212, 344–356. [Google Scholar] [CrossRef]
- Kachholz, F.; Tränckner, J. A Model-Based Tool for Assessing the Impact of Land Use Change Scenarios on Flood Risk in Small-Scale River Systems—Part 1: Pre-Processing of Scenario Based Flood Characteristics for the Current State of Land Use. Hydrology 2021, 8, 102. [Google Scholar] [CrossRef]
- Tu, M.-C.; Smith, P. Modeling pollutant buildup and washoff parameters for SWMM based on land use in a semiarid urban watershed. Water Air Soil Pollut. 2018, 229, 121. [Google Scholar] [CrossRef]
- CHI. PCSWMM. Available online: https://www.pcswmm.com/ (accessed on 18 June 2022).
- Innovyze. InfoSWMM. Available online: https://www.innovyze.com/media/2352/key-features-infoswmm.pdf (accessed on 18 June 2022).
- Streamstech. GeoSWMM. Available online: https://streamstech.com/Products/GeoSWMM (accessed on 18 June 2022).
- Lago Consulting. Lago Toolbox. Available online: https://www.lago-consulting.com/lago-toolbox.html (accessed on 18 June 2022).
- Lee, J.G.; Nietch, C.T.; Panguluri, S. Drainage area characterization for evaluating green infrastructure using the Storm Water Management Model. Hydrol. Earth Syst. Sci. 2018, 22, 2615–2635. [Google Scholar] [CrossRef] [Green Version]
- Sadeghi, F.; Rubinato, M.; Goerke, M.; Hart, J. Assessing the Performance of LISFLOOD-FP and SWMM for a Small Watershed with Scarce Data Availability. Water 2022, 14, 748. [Google Scholar] [CrossRef]
- Yang, Q.; Dai, Q.; Han, D.; Zhu, X.; Zhang, S. Impact of the Storm Sewer Network Complexity on Flood Simulations According to the Stroke Scaling Method. Water 2018, 10, 645. [Google Scholar] [CrossRef] [Green Version]
- Blumensaat, F.; Wolfram, M.; Krebs, P. Sewer model development under minimum data requirements. Environ. Earth Sci. 2012, 65, 1427–1437. [Google Scholar] [CrossRef]
- R Development Core Team, RFFSC. R: A Language and Environment for Statistical Computing; R Foundation for Statistical Computing: Vienna, Austria, 2011. [Google Scholar]
- Python Software Foundation. Python. Available online: https://www.python.org (accessed on 7 July 2022).
- Leutnant, D.; Döring, A.; Uhl, M. swmmr—An R package to interface SWMM. Urban Water J. 2019, 16, 68–76. [Google Scholar] [CrossRef] [Green Version]
- Pichler, M. Swmm-api, Version 0.2.0.18.3; Institute of Urban Water Management and Landscape Water Engineering, Graz University of Technology: Graz, Austria, 2022.
- McDonnell, B.; Ratliff, K.; Tryby, M.; Wu, J.; Mullapudi, A. PySWMM: The Python Interface to Stormwater Management Model (SWMM). JOSS 2020, 5, 2292. [Google Scholar] [CrossRef]
- Erispaha, A. Swmmio. Available online: https://swmmio.readthedocs.io/en/v0.4.9/ (accessed on 17 July 2022).
- Cera, T. Swmmtoolbox. Available online: https://pypi.org/project/swmmtoolbox/ (accessed on 18 June 2022).
- Riaño-Briceño, G.; Barreiro-Gomez, J.; Ramirez-Jaime, A.; Quijano, N.; Ocampo-Martinez, C. MatSWMM—An open-source toolbox for designing real-time control of urban drainage systems. Environ. Model. Softw. 2016, 83, 143–154. [Google Scholar] [CrossRef] [Green Version]
- Shamsi, U.M.; Smith, P. ArcGIS and SWMM Integration. J. Water Manag. Model. 2005, 13, 295–308. [Google Scholar] [CrossRef] [Green Version]
- Lee, H.; Woo, W.; Park, Y.S. A User-Friendly Software Package to Develop Storm Water Management Model (SWMM) Inputs and Suggest Low Impact Development Scenarios. Water 2020, 12, 2344. [Google Scholar] [CrossRef]
- QGIS. A Free and Open Source Geographic Information System. Available online: https://qgis.org/en/site/index.html (accessed on 7 July 2022).
- The QGEP Project. QGEP/TEKSI Wastewater Module Documentation. Available online: https://qgep.github.io/docs/ (accessed on 18 June 2022).
- Giswater. GISWATER User Manual. Available online: https://giswater.gitbook.io/giswater-manual/ (accessed on 18 June 2022).
- Cimpianu, C.I.; Mihu-Pintilie, A. Open Source flood mapping tools—QGIS, RIVER GIS and HEC-RAS. Acta Geobot. 2019, 6, 35–41. [Google Scholar] [CrossRef]
- Tuflow. TUFLOW Plugin for QGIS. Available online: https://www.tuflow.com/products/gis-plugins/ (accessed on 18 June 2022).
- Menapace, A.; Pisaturo, G.R.; de Luca, A.; Gerola, D.; Righetti, M. EPANET in QGIS framework: The QEPANET plugin. J. Water Supply Res. Technol.-Aqua 2020, 69, 1–5. [Google Scholar] [CrossRef]
- Reback, J.; Jbrockmendel; McKinney, W.; van den Bossche, J.; Augspurger, T.; Cloud, P.; Hawkins, S.; Roeschke, M.; gfyoung; Sinhrks; et al. pandas-dev/pandas: Pandas 1.4.1, Zenodo: Genève, Switzerland, 2022.
- QGIS Project. QGIS Python Plugins Repository. Available online: https://plugins.qgis.org/plugins/ (accessed on 7 July 2022).
- QGIS Project. QGIS User Guide. Available online: https://docs.qgis.org/3.22/en/docs/user_manual/ (accessed on 18 June 2022).
- Schilling, J.; Tränckner, J. Estimation of Wastewater Discharges by Means of OpenStreetMap Data. Water 2020, 12, 628. [Google Scholar] [CrossRef] [Green Version]
- Geofabrik GmbH. OpenStreetMap Data Extracts. Available online: https://download.geofabrik.de/ (accessed on 22 April 2022).
- QGIS Project. Exploring Data Formats and Fields. Available online: https://docs.qgis.org/3.22/de/docs/user_manual/managing_data_source/supported_data.html (accessed on 8 July 2022).
Figure 1.
User interface of the export tool.

Figure 2.
(a) Location of the study site in Germany; (b) classification of the sewer system and location of the study site within the city of Rostock; background map: OSM © OSM contributors.
Figure 2.
(a) Location of the study site in Germany; (b) classification of the sewer system and location of the study site within the city of Rostock; background map: OSM © OSM contributors.

Figure 3.
Current situation at the study site: stormwater catchment “WE_55”, stormwater catchment “WE_48” and adjacent combined sewer system; relevant subareas of the combined sewer system for this study are highlighted in brown; background map: OSM © OSM contributors.
Figure 3.
Current situation at the study site: stormwater catchment “WE_55”, stormwater catchment “WE_48” and adjacent combined sewer system; relevant subareas of the combined sewer system for this study are highlighted in brown; background map: OSM © OSM contributors.

Figure 4.
Future scenario with three stormwater catchments; background map: OSM © OSM contributors.

Table 1.
Characteristic numbers of the exemplary study sites.
| Catchment | WE_48 | WE_55 | Var_sep | Base Data in QGIS |
|---|---|---|---|---|
| Catchment properties | ||||
| Total area (ha) | 8.9 | 8.3 | 24.1 | Cadastral data (polygons) |
| Number of subcatchments | 85 | 118 | 121 | |
| Mean impervious area (%) | 78 | 39 | 32 | Landuse Data, OSM |
| Slope (%) (min, max, mean) | 0.9, 16.9, 3.4 | 2.8, 15.0, 5.7 | 3.1, 23.0, 4.6 | DEM |
| Sewer system properties | ||||
| Number of conduits | 51 | 33 | 176 | Sewer network (lines) |
| Total conduit length (m) | 1743 | 1331 | 5525 | |
| Longest flow path (m) | 986 | 474 | 1057 | |
| Manning roughness of conduits (s/m1/3) | 0.015 | 0.015 | 0.015 | Imported model data |
| Number of junctions and outfalls | 52 | 34 | 180 | Sewer network (lines) |
Table 2.
Model results for the simulated rainfall events.
| Catchment | WE_48 | WE_55 | Var_sep |
|---|---|---|---|
| Rainfall event | 15 min_1 y | ||
| Total precipitation (mm) | 9.57 | ||
| Total discharge volume at outfall (m3) | 514 | 171 | 608 |
| Peak inflow (m3/s) | 0.574 | 0.250 | 0.359 |
| Rainfall event | 1 h_1 | ||
| Total precipitation (mm) | 15.39 | ||
| Total discharge volume at outfall (m3) | 889 | 293 | 906 |
| Peak inflow (m3/s] | 0.648 | 0.263 | 0.366 |
| Rainfall event | 2 h_1 y | ||
| Total precipitation (mm) | 18.24 | ||
| Total discharge volume at outfall (m3) | 1077 | 354 | 1095 |
| Peak inflow (m3/s) | 0.678 | 0.287 | 0.365 |
Publisher’s Note: MDPI stays neutral with regard to jurisdictional claims in published maps and institutional affiliations. |
© 2022 by the authors. Licensee MDPI, Basel, Switzerland. This article is an open access article distributed under the terms and conditions of the Creative Commons Attribution (CC BY) license (https://creativecommons.org/licenses/by/4.0/).
Share and Cite
MDPI and ACS Style
Schilling, J.; Tränckner, J. Generate_SWMM_inp: An Open-Source QGIS Plugin to Import and Export Model Input Files for SWMM. Water 2022, 14, 2262. https://doi.org/10.3390/w14142262
AMA Style
Schilling J, Tränckner J. Generate_SWMM_inp: An Open-Source QGIS Plugin to Import and Export Model Input Files for SWMM. Water. 2022; 14(14):2262. https://doi.org/10.3390/w14142262
Chicago/Turabian StyleSchilling, Jannik, and Jens Tränckner. 2022. "Generate_SWMM_inp: An Open-Source QGIS Plugin to Import and Export Model Input Files for SWMM" Water 14, no. 14: 2262. https://doi.org/10.3390/w14142262
Note that from the first issue of 2016, this journal uses article numbers instead of page numbers. See further details here.