
Hydrochemistry of Medium-Size Pristine Rivers in Boreal and Subarctic Zone: Disentangling Effect of Landscape Parameters across a Permafrost, Climate, and Vegetation Gradient

 , , ,
, , ,  ,
, 
Abstract
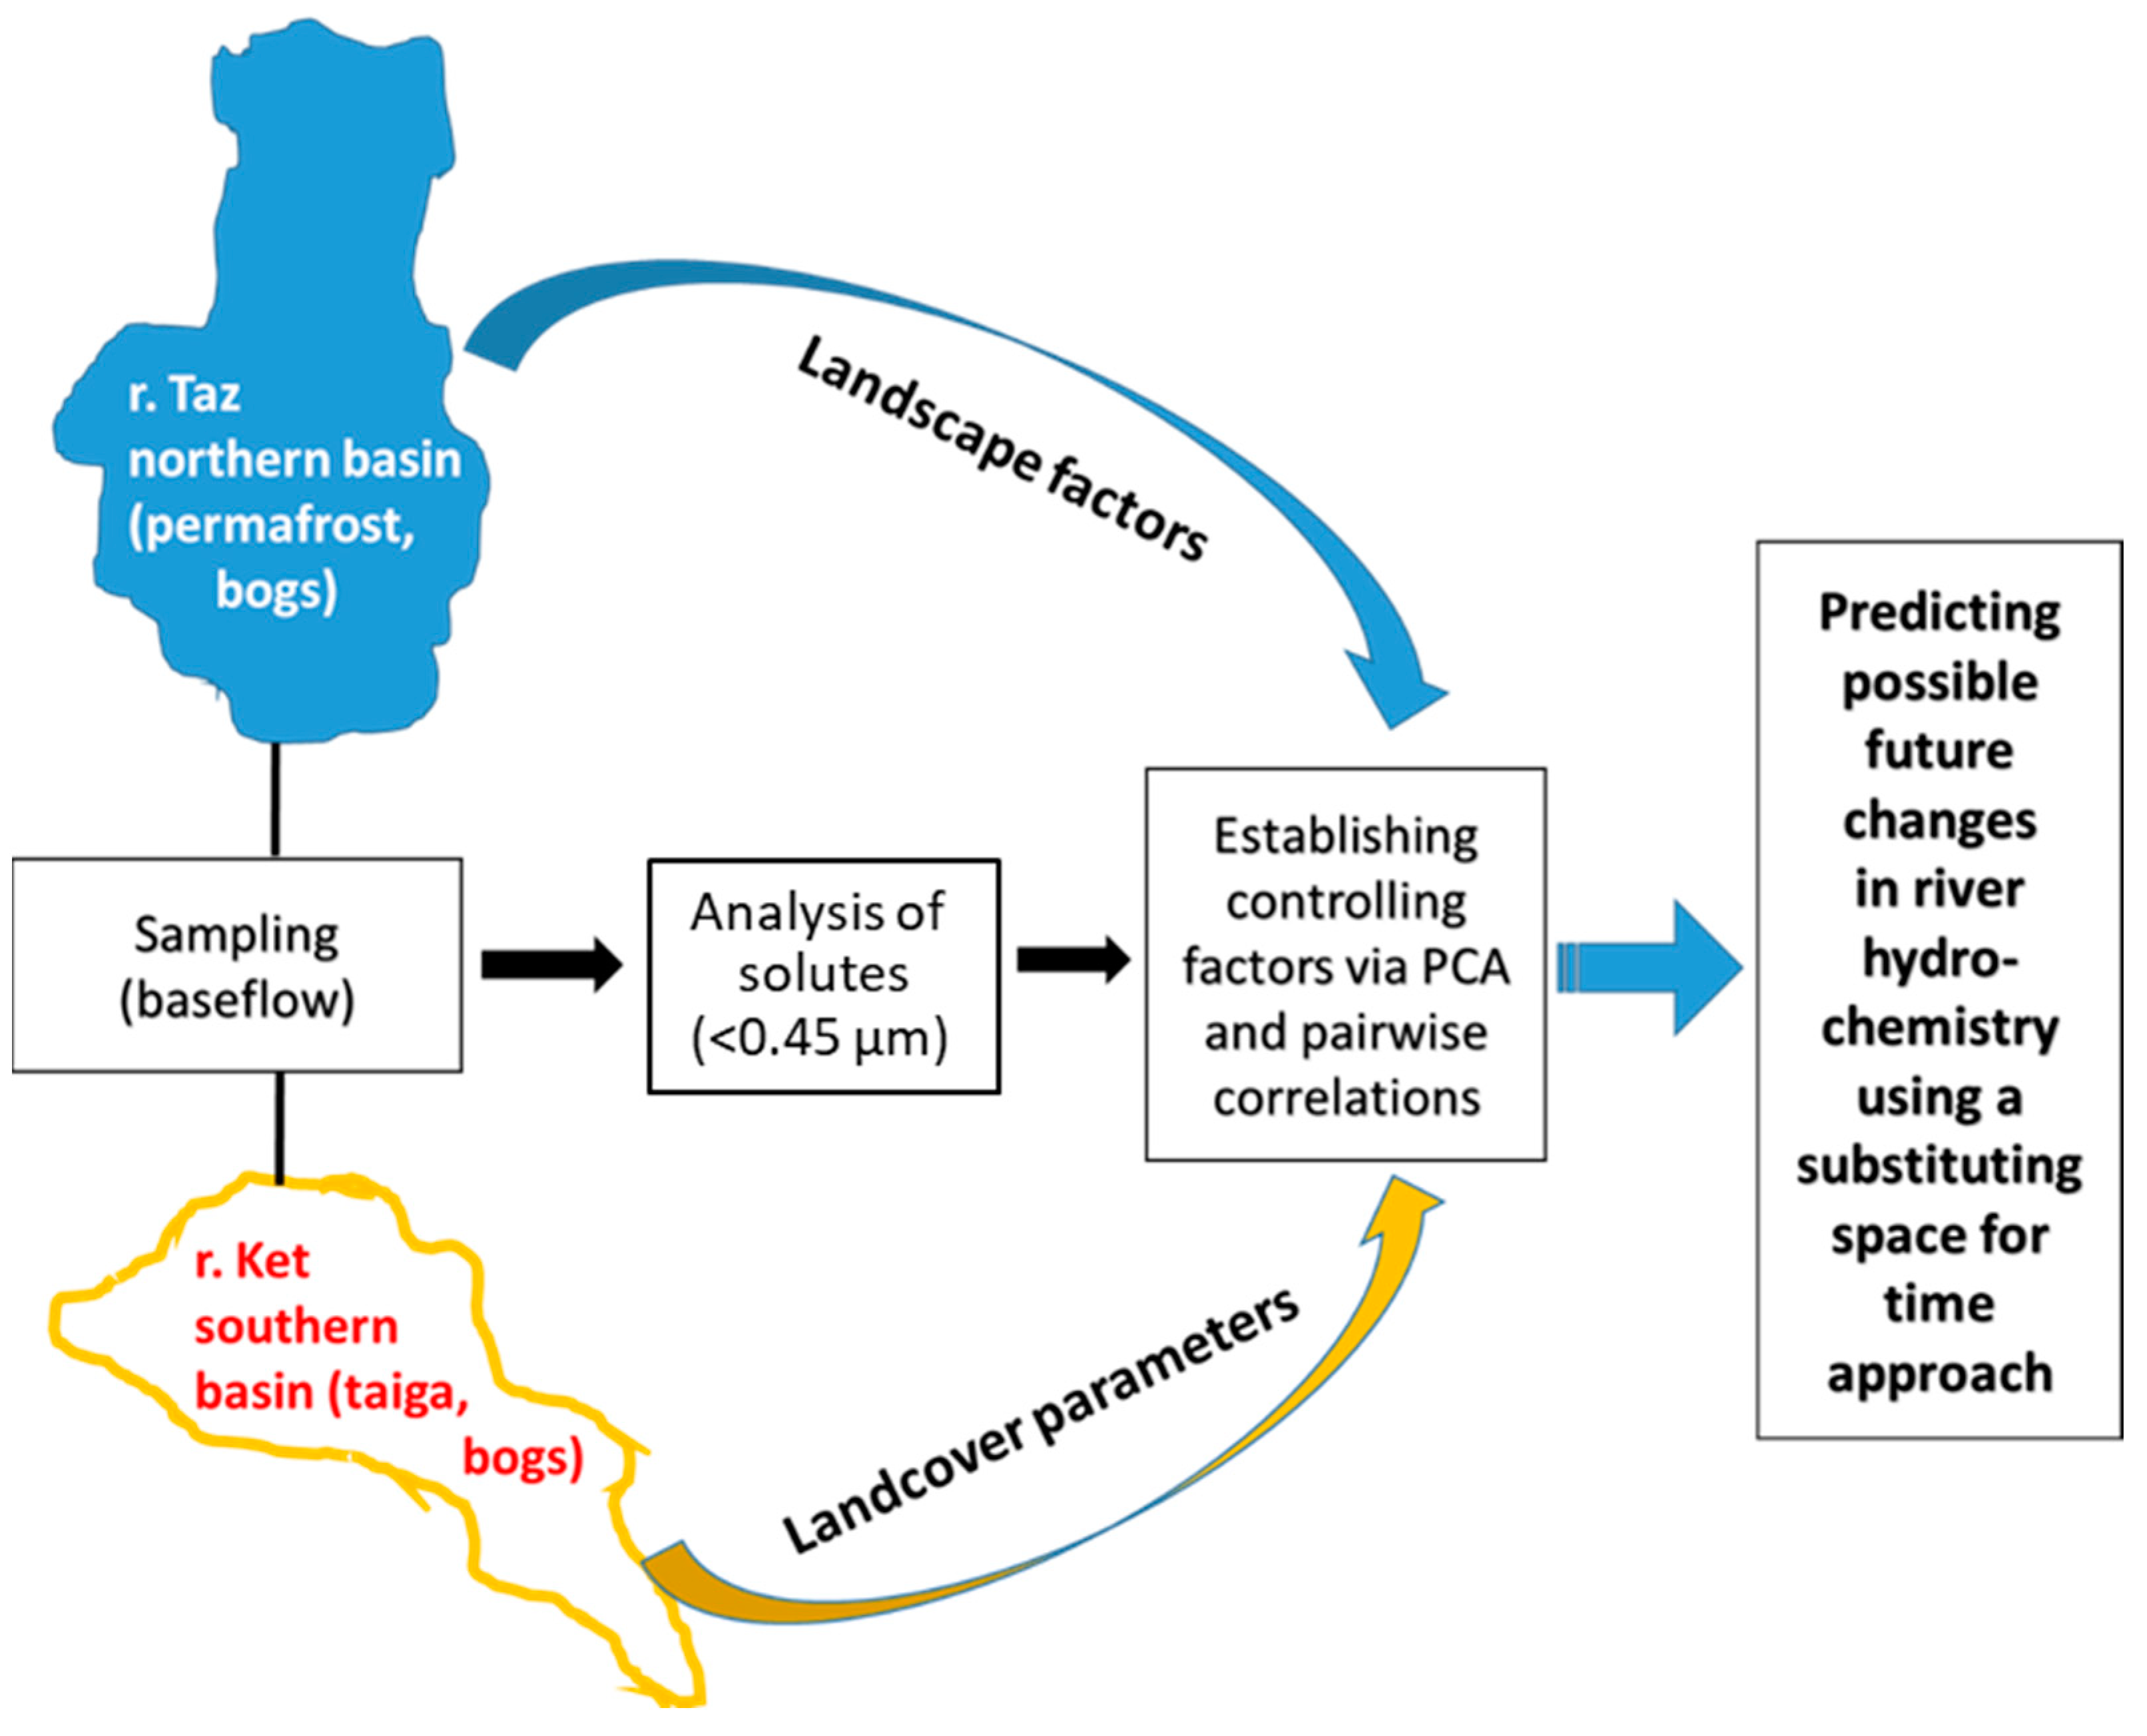
:1. Introduction
2. Study Site and Methods
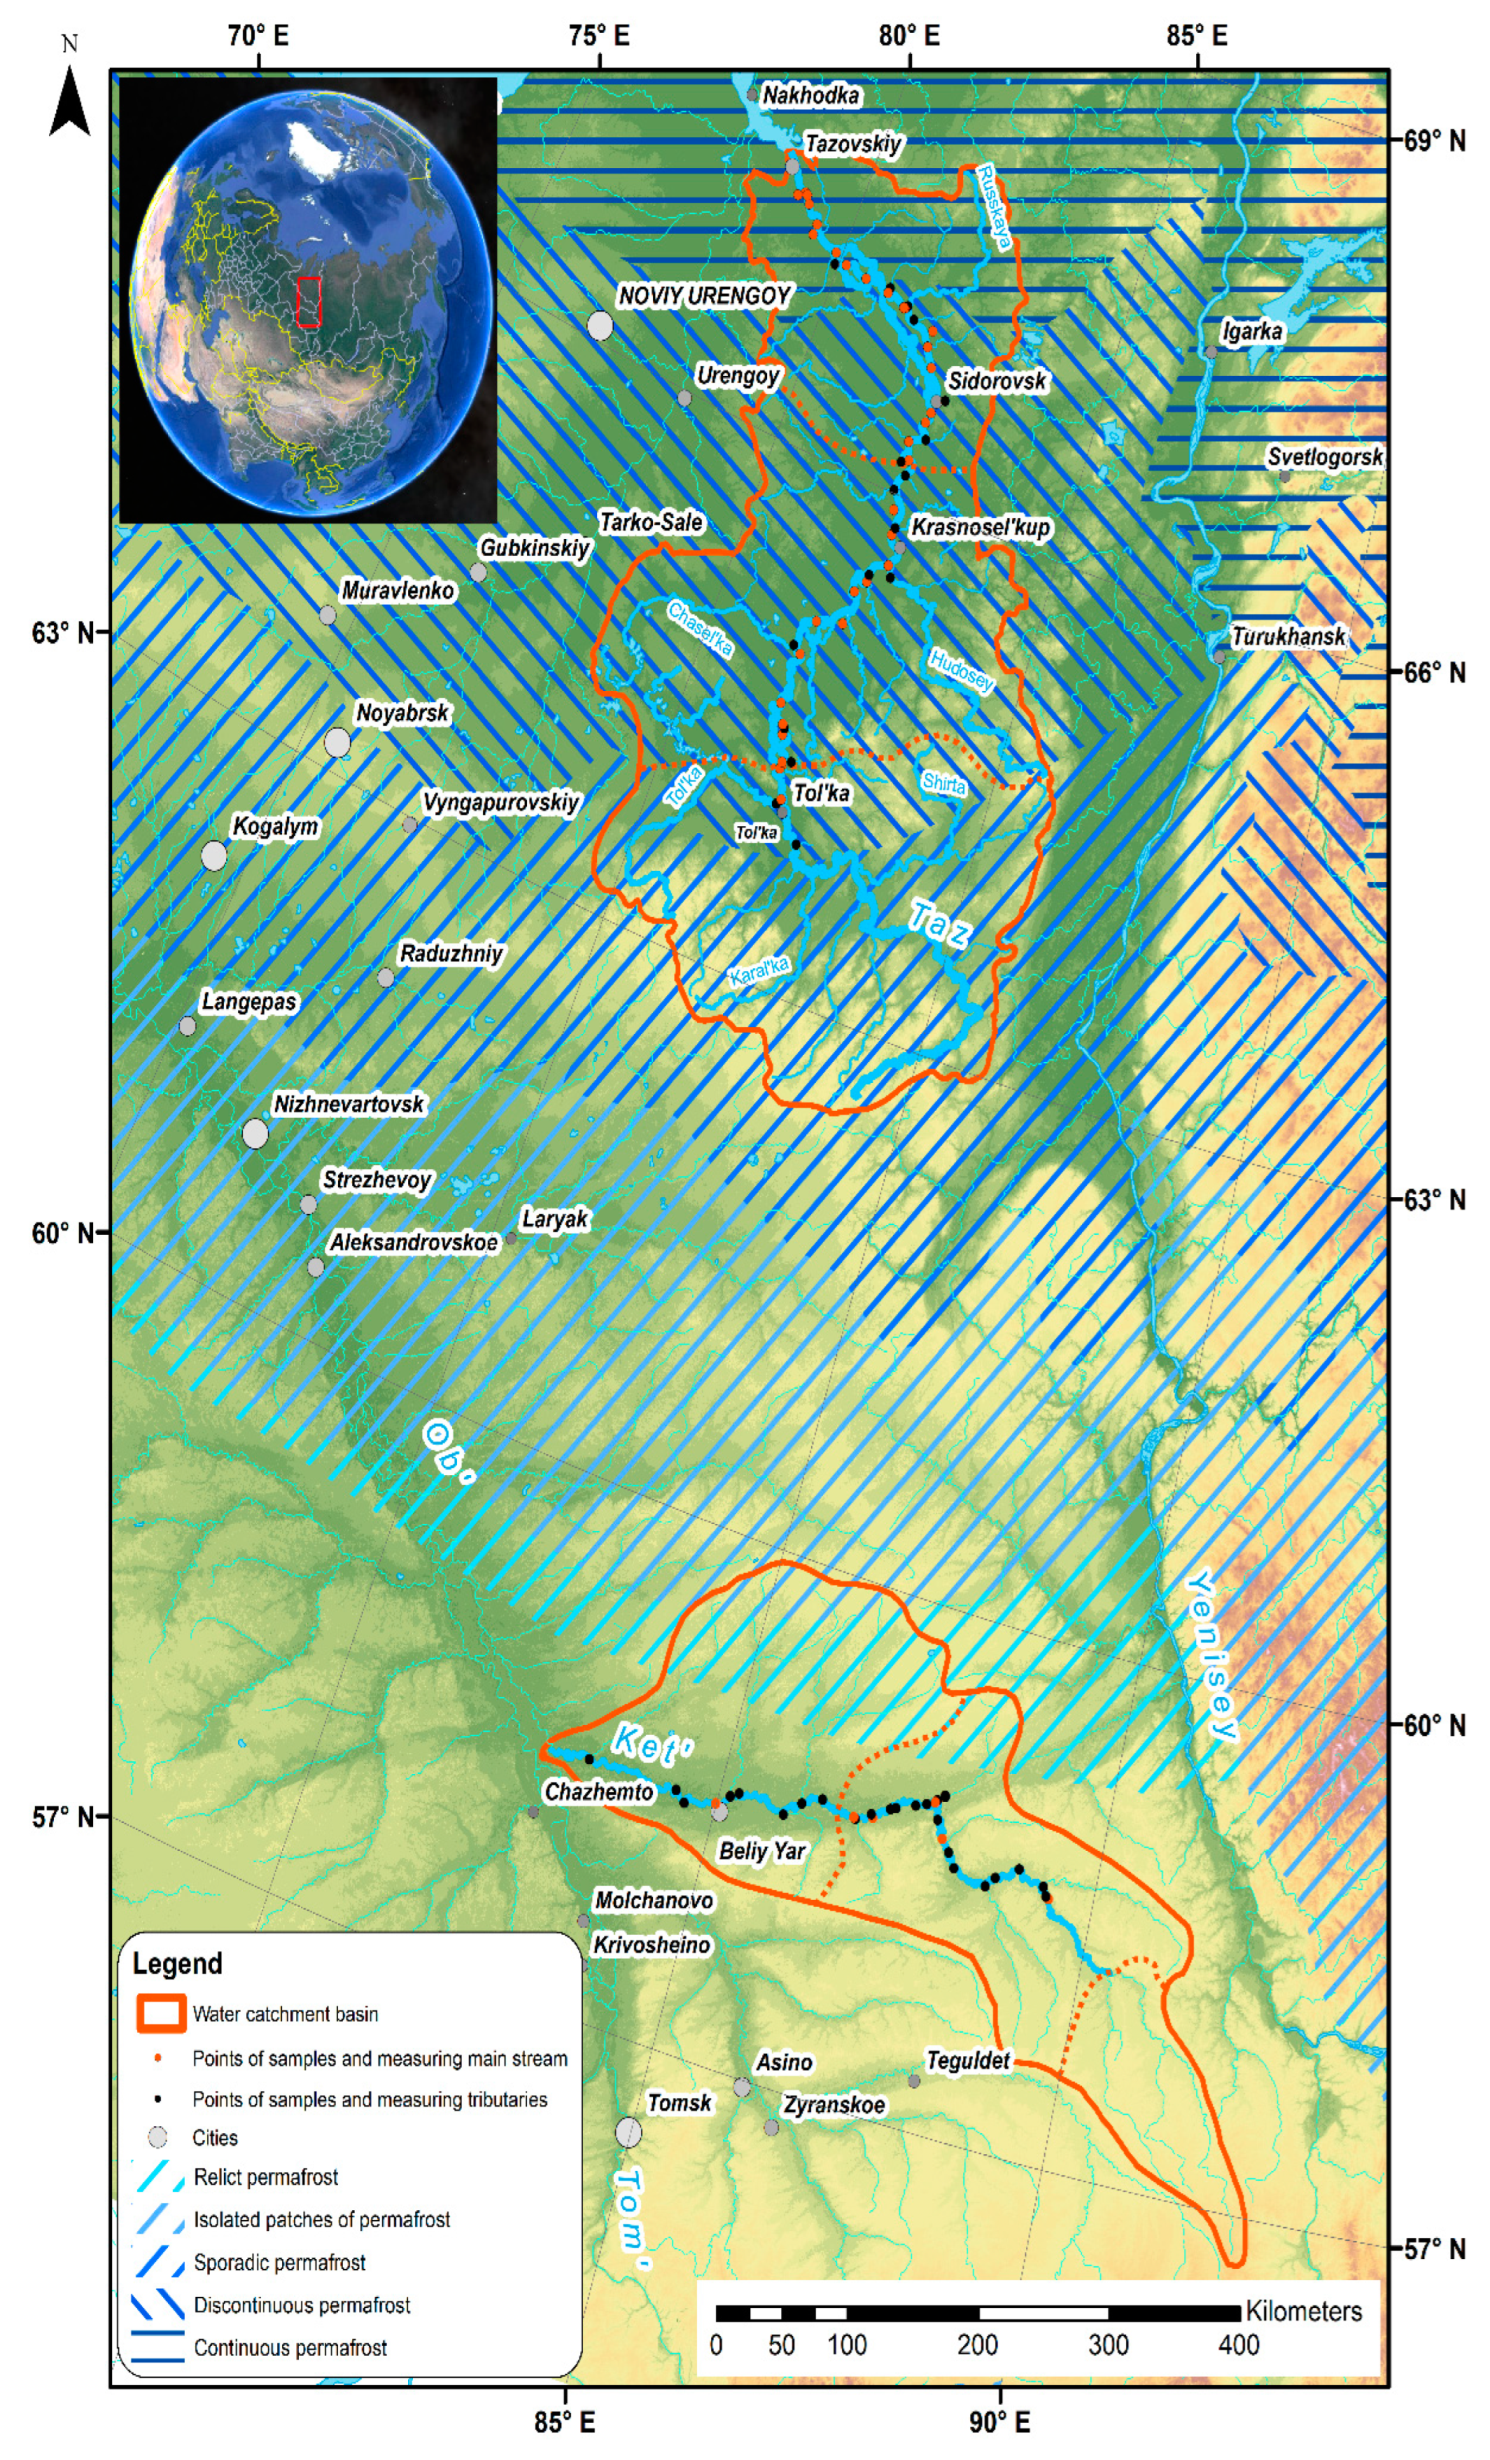
2.1. Ket River Basin
2.2. Taz River Basin
2.3. Sampling
2.4. Analyses
2.5. Landscape Parameters and Water Surface Area of the Ket and Taz River Basin
2.6. Data Analysis
3. Results and Discussion
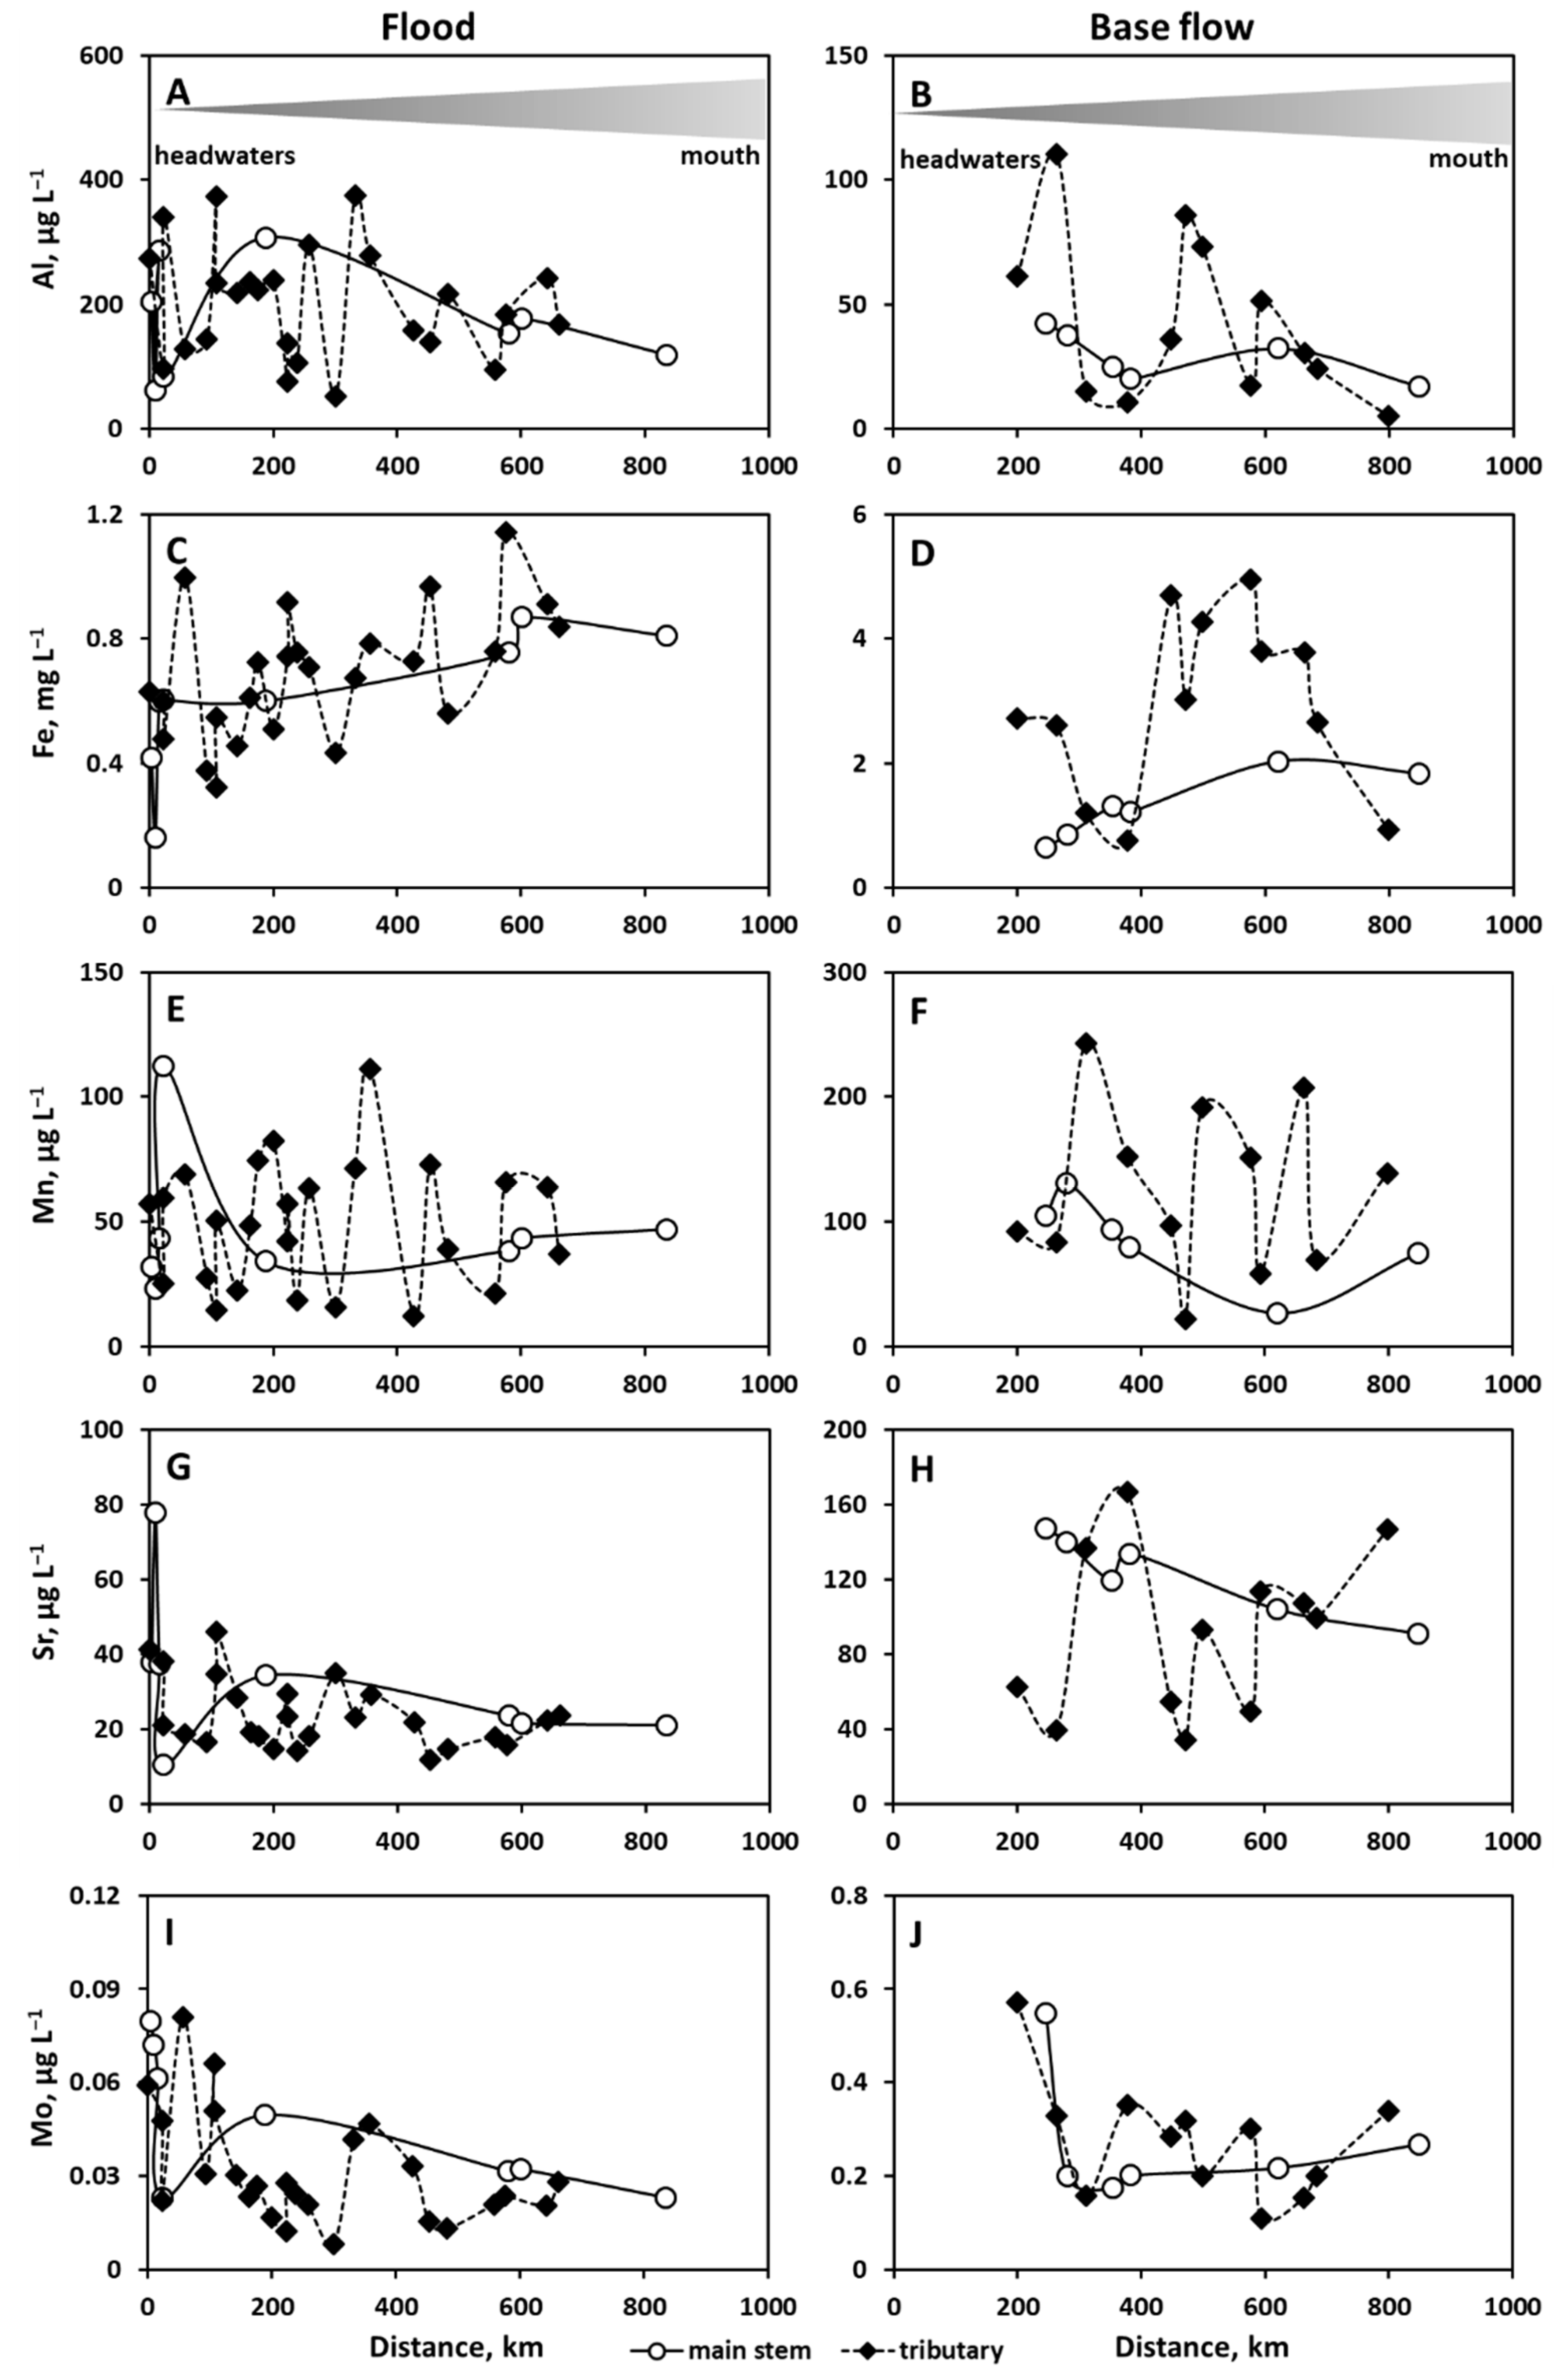
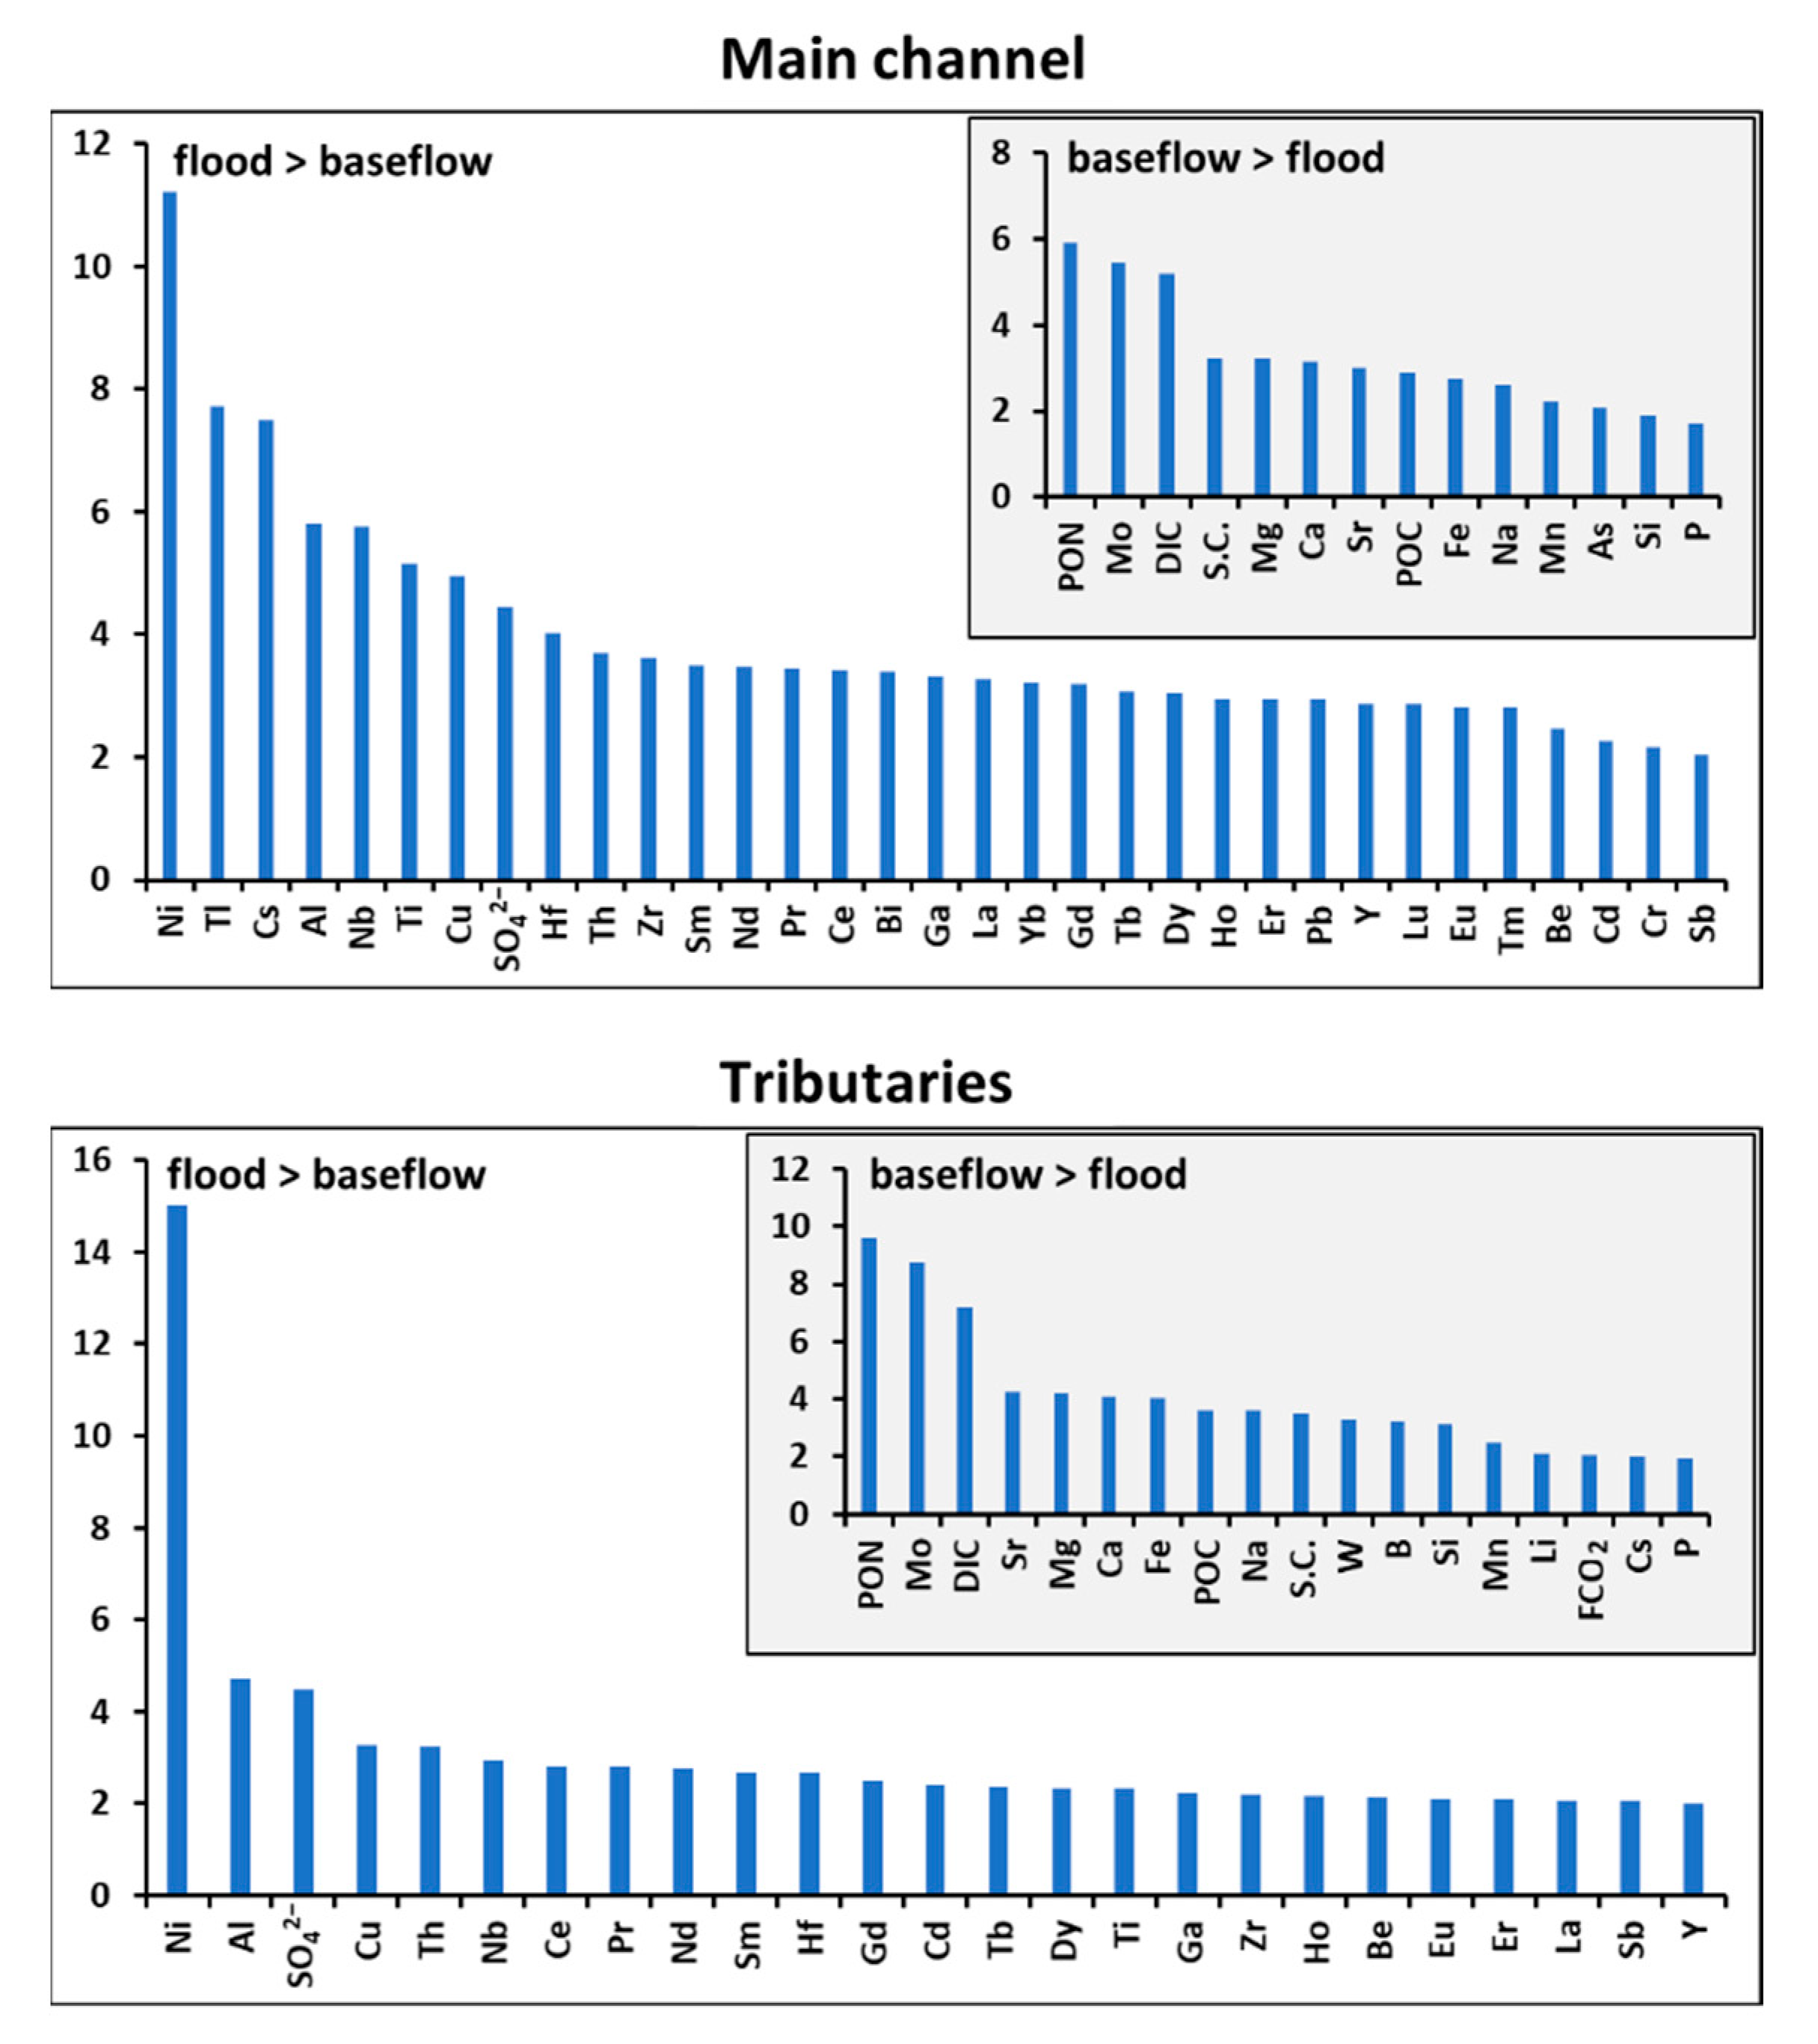
3.1. Spatial and Seasonal Variation of Elements in the Ket River and Control of River Hydrochemistry by Landscape Parameters
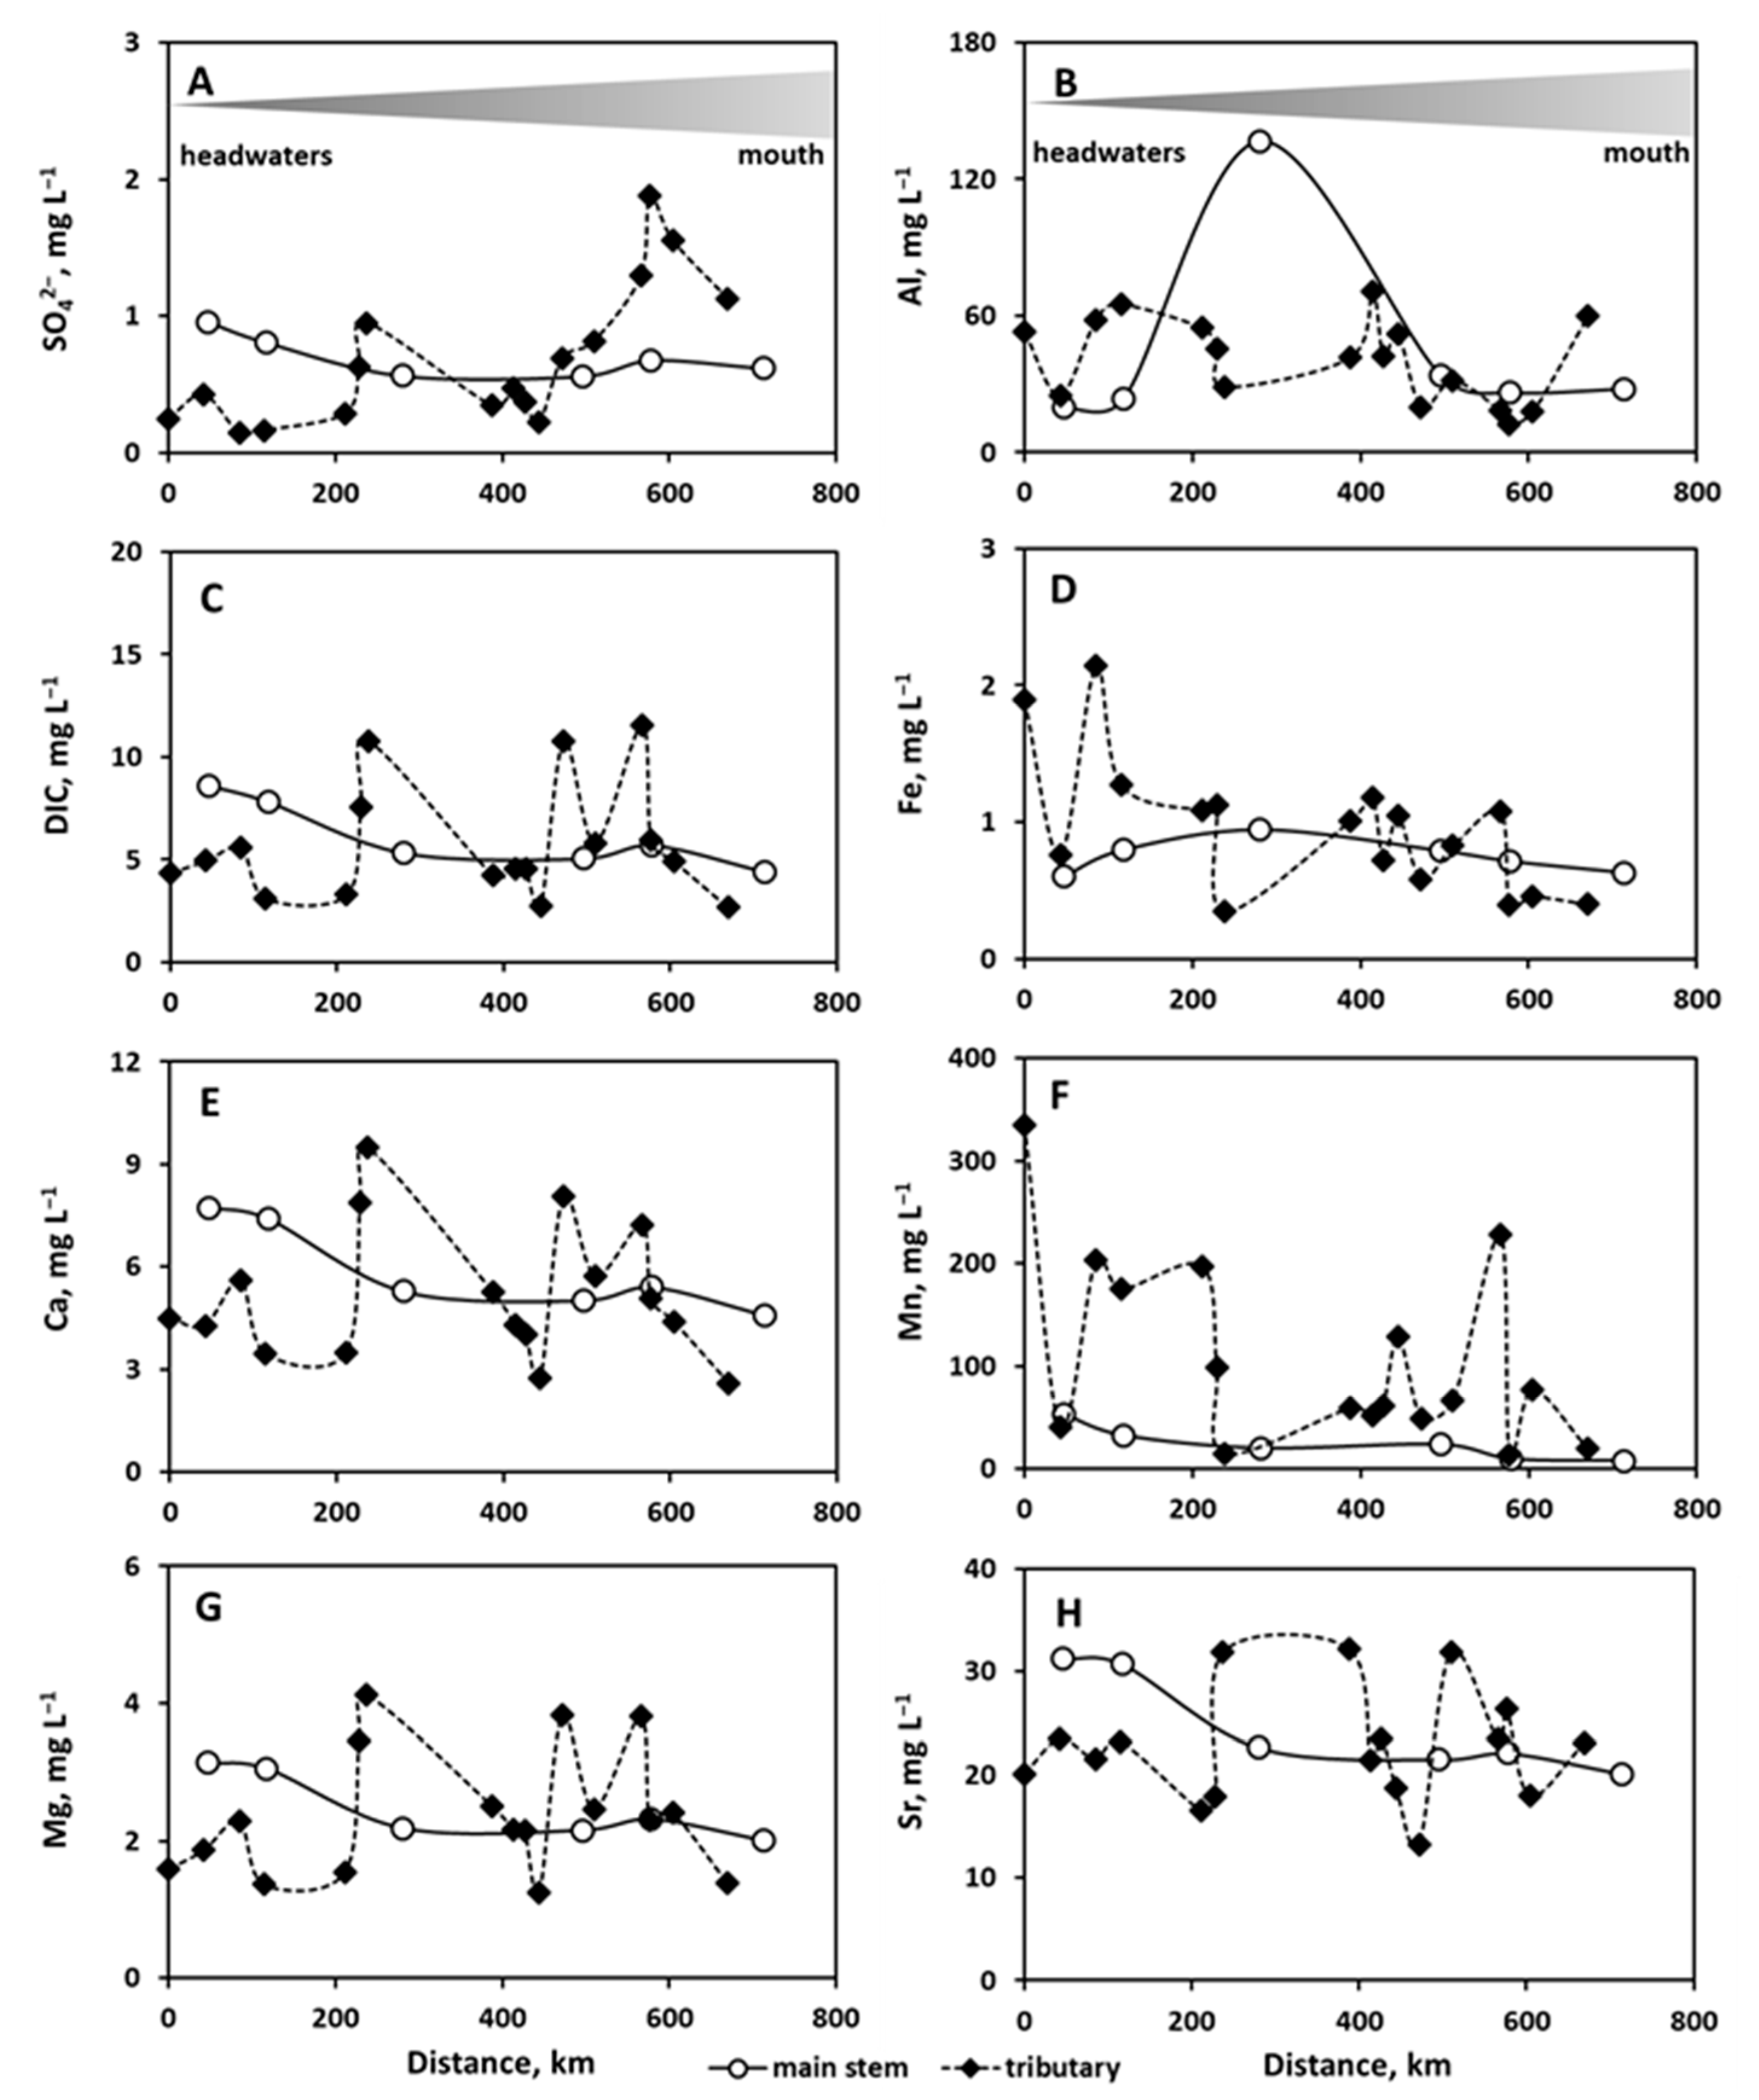
3.2. Major and Trace Element Spatial Variation over the River Main Stem and among Tributaries of the Taz River Basin and Land Cover Control
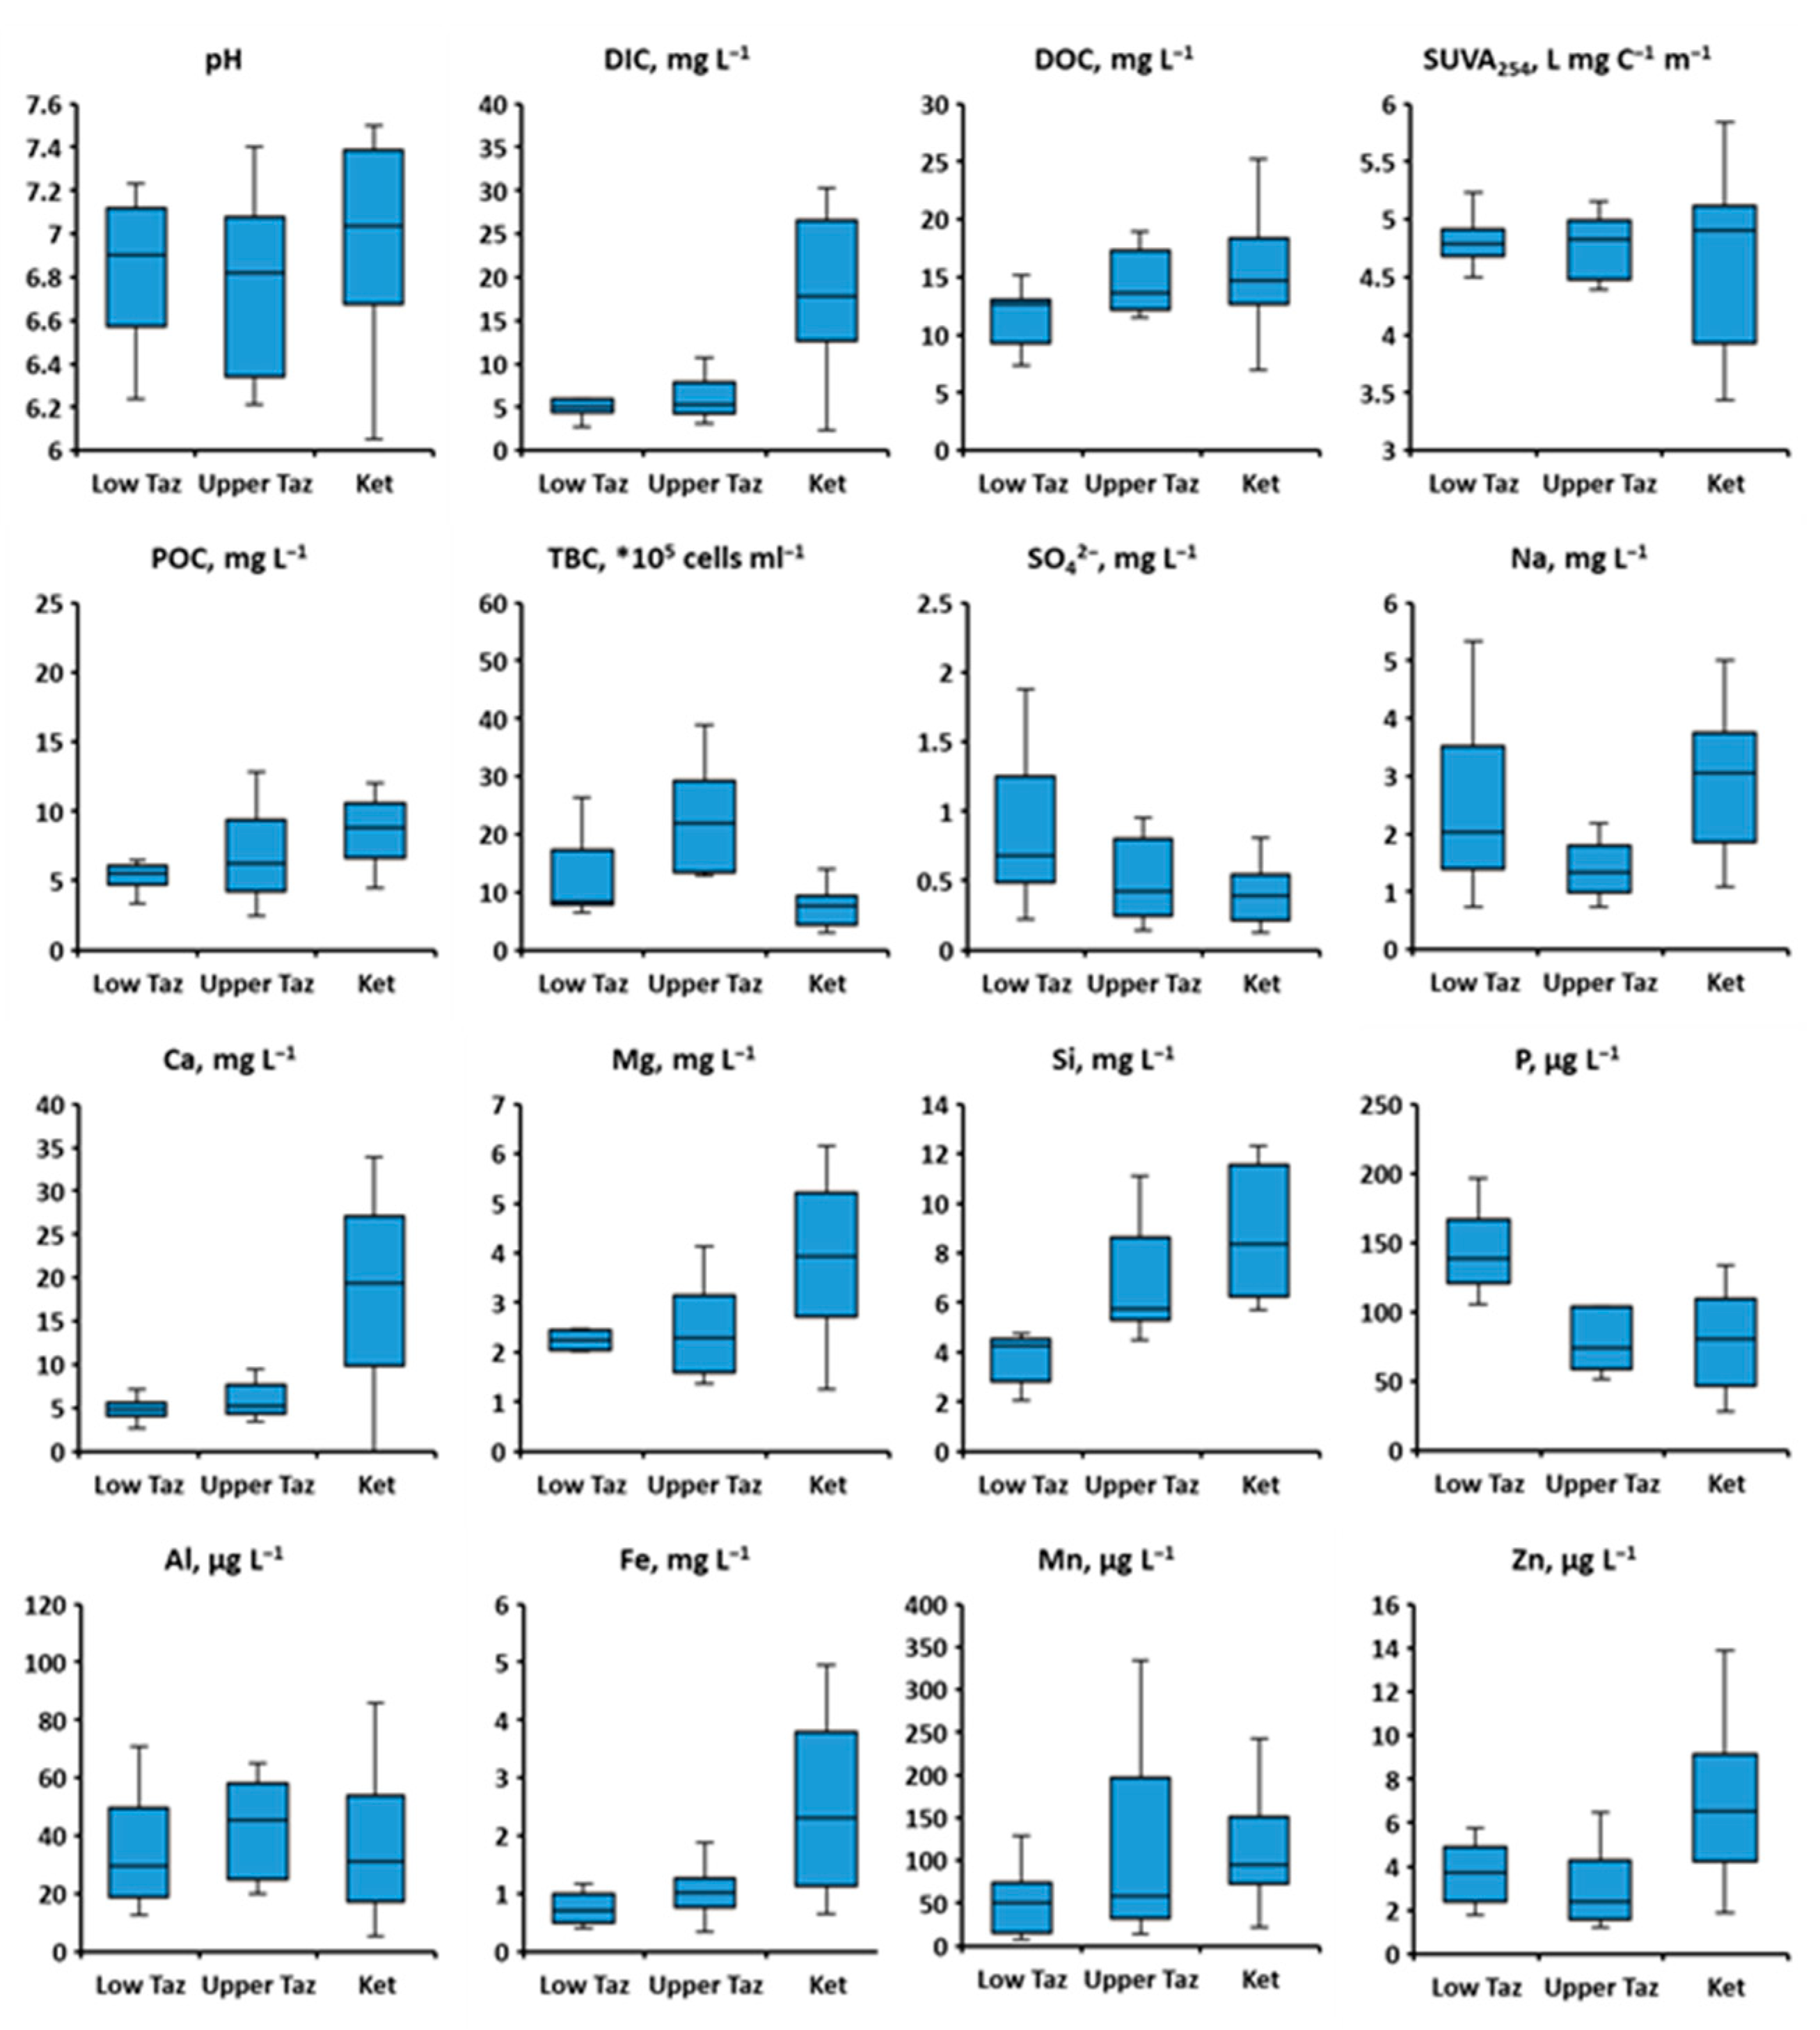
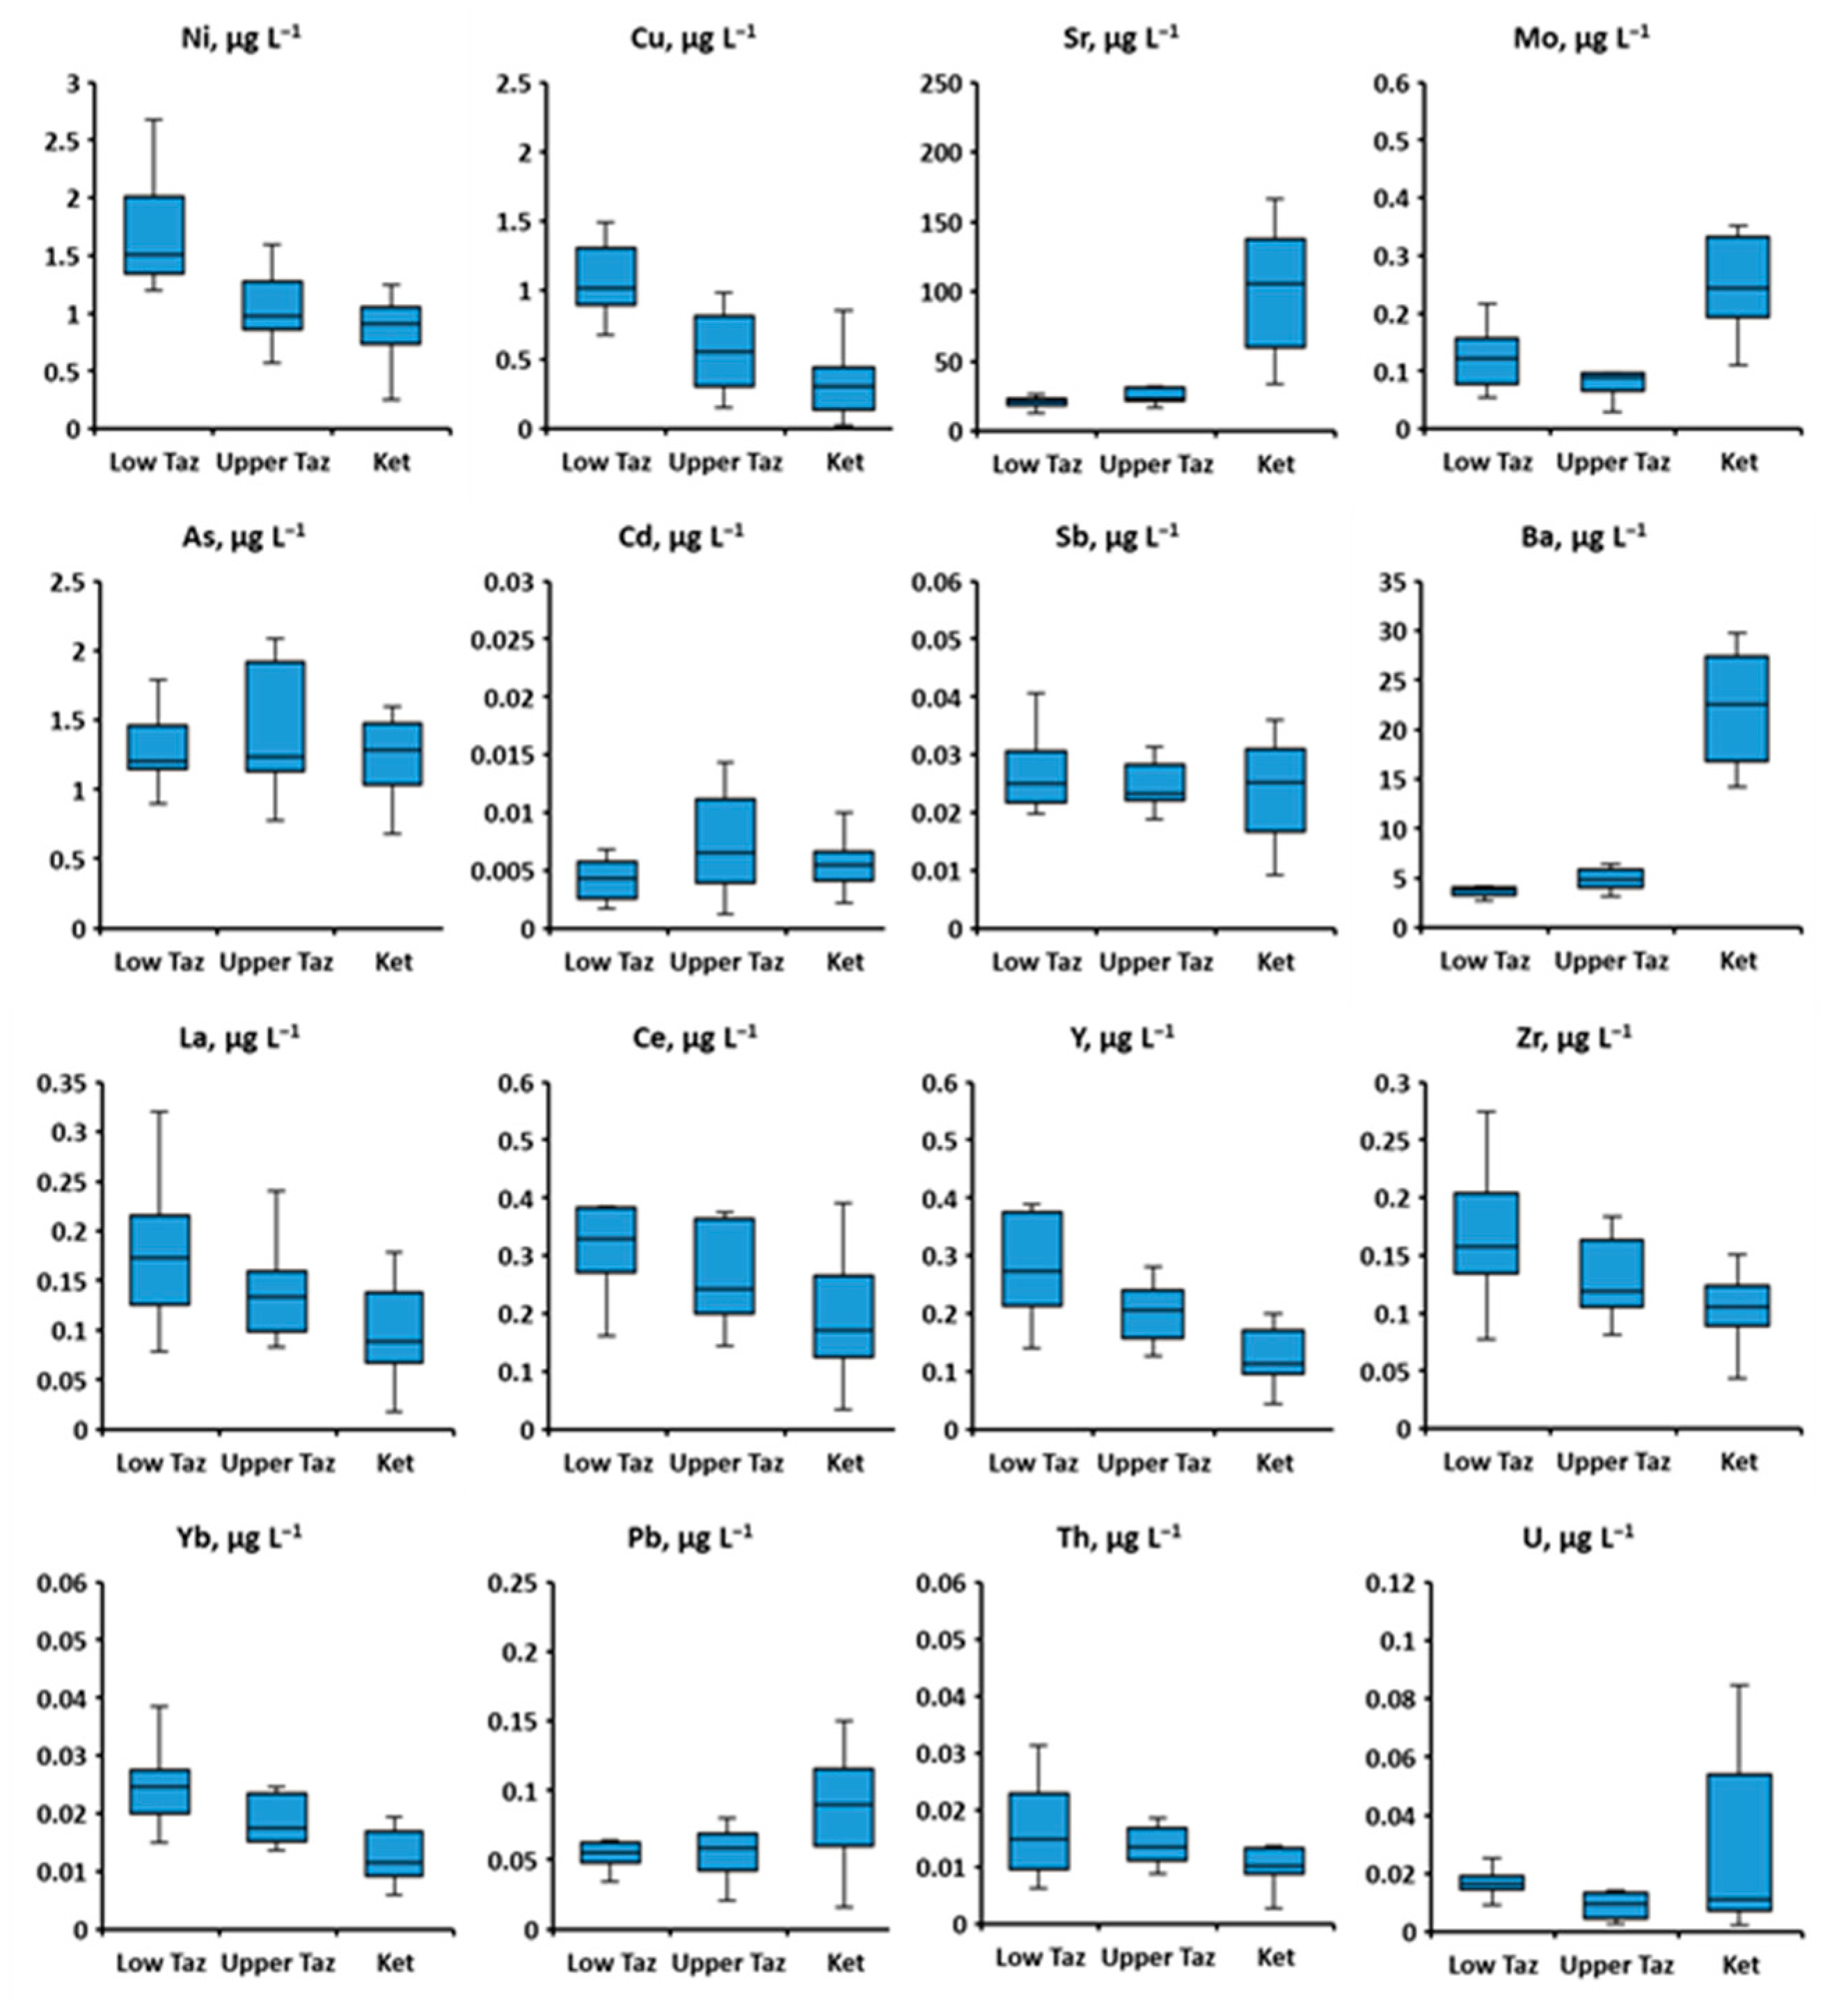
3.3. Common Features of Spatial Distribution of Major and Trace Element in Two River Basins during Summer
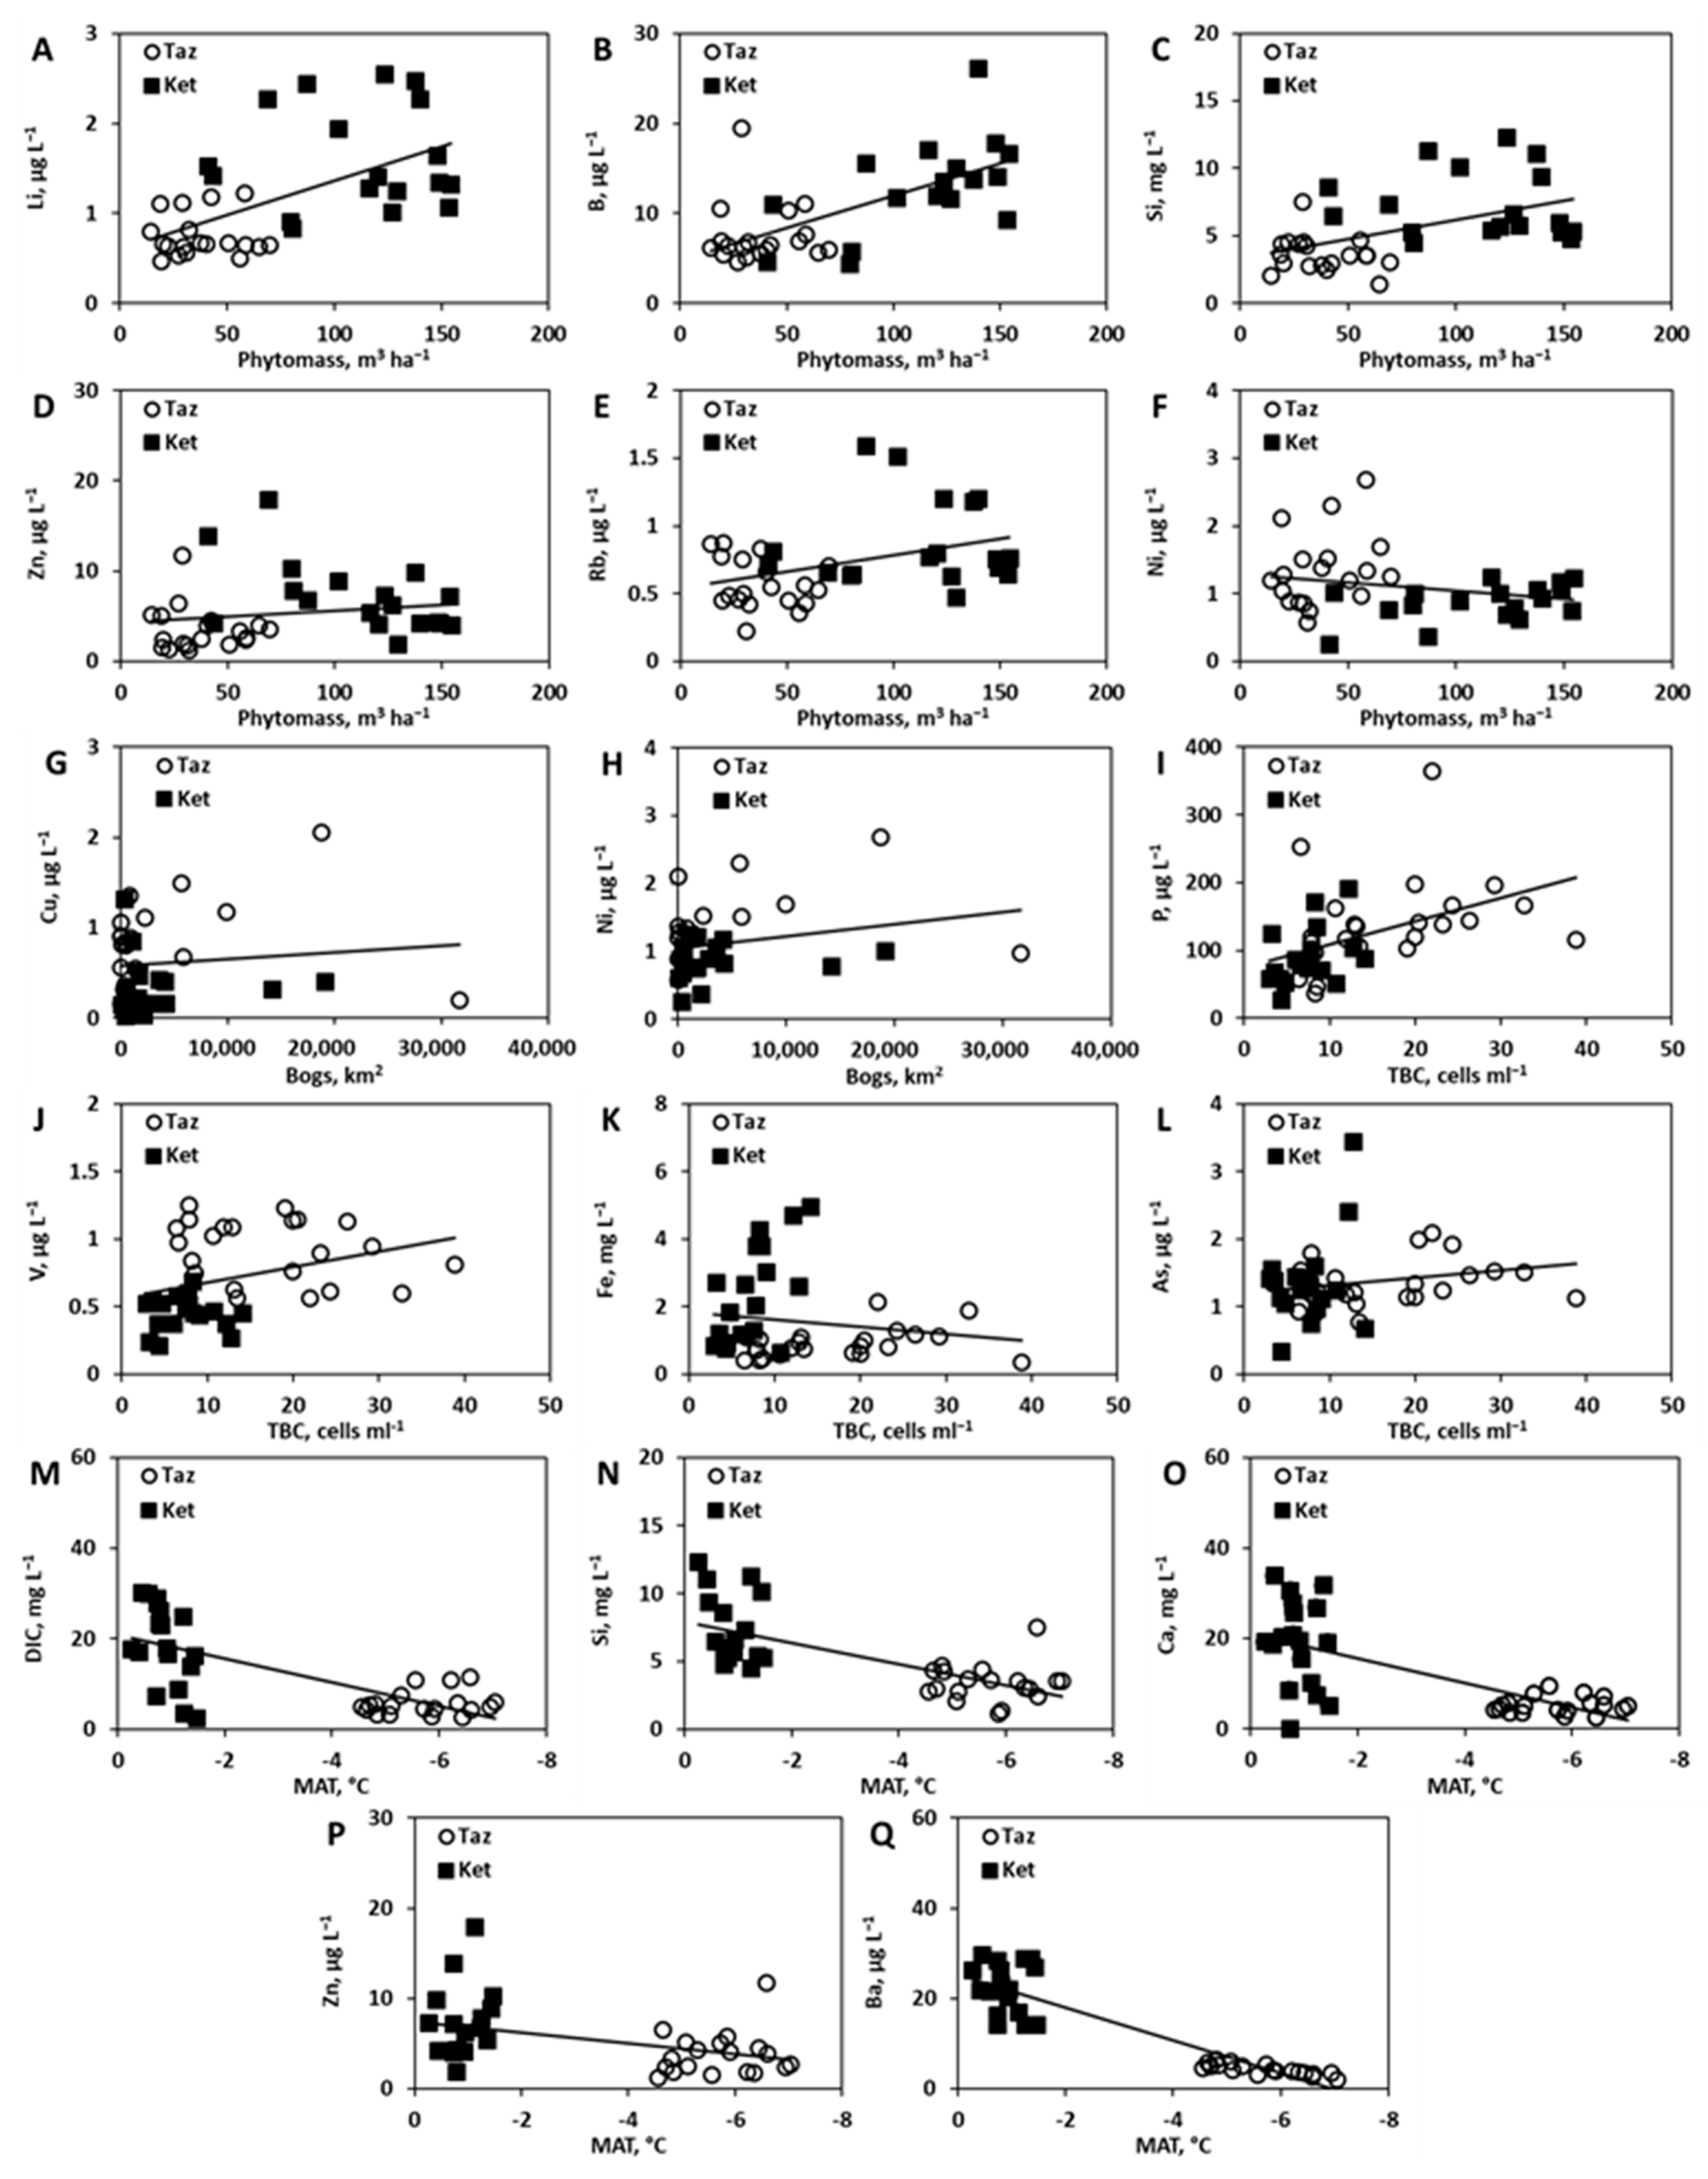
3.4. Climate Change Consequences on Element Concentration in WSL Rivers (Vegetation and Permafrost/Lithology Control) Using a Substituting Space for Time Approach
4. Conclusions
Supplementary Materials
Author Contributions
Funding
Informed Consent Statement
Acknowledgments
Conflicts of Interest
References
- Frey, K.E.; McClelland, J.W. Impacts of permafrost degradation on arctic river biogeochemistry. Hydrol. Process. 2009, 23, 169–182. [Google Scholar] [CrossRef]
- Vonk, J.E.; Tank, S.E.; Bowden, W.B.; Laurion, I.; Vincent, W.F.; Alekseychik, P.; Amyot, M.; Billet, M.F.; Canário, J.; Cory, R.M.; et al. Reviews and Syntheses: Effects of permafrost thaw on arctic aquatic ecosystems. Biogeosciences 2015, 12, 7129–7167. [Google Scholar] [CrossRef] [Green Version]
- Vonk, J.E.; Tank, S.E.; Walvoord, M.A. Integrating hydrology and biogeochemistry across frozen landscapes. Nat. Commun. 2019, 10, 5377. [Google Scholar] [CrossRef] [PubMed] [Green Version]
- White, D.; Hinzman, L.; Alessa, L.; Cassano, J.; Chambers, M.; Falkner, K.; Francis, J.; Gutowski, W.J., Jr.; Holland, M.; Holmes, R.M.; et al. The arctic freshwater system: Changes and impacts. J. Geophys. Res. 2007, 112, G04S54. [Google Scholar] [CrossRef]
- Barbieri, M.; Barberio, M.D.; Banzato, F.; Billi, A.; Boschetti, T.; Franchini, S.; Gori, F.; Petitta, M. Climate change and its effect on groundwater quality. Environ. Geochem. Health 2021, 1–12. [Google Scholar] [CrossRef]
- Eskandari, E.; Mohammadzadeh, H.; Nassery, H.; Vadiati, M.; Zadeh, A.M.; Kisi, O. Delineation of isotopic and hydrochemical evolution of karstic aquifers with different cluster-based (HCA, KM, FCM and GKM) methods. J. Hydrol. 2022, 609, 127706. [Google Scholar] [CrossRef]
- Frey, K.E.; Smith, L.C. How well do we know northern land cover? Comparison of four global vegetation and wetland products with a new ground-truth database for West Siberia. Glob. Biogeochem. Cycles 2007, 21, GB1016. [Google Scholar] [CrossRef]
- Kremenetsky, K.V.; Velichko, A.A.; Borisova, O.K.; MacDonald, G.M.; Smith, L.C.; Frey, K.E.; Orlova, L.A. Peatlands of the West Siberian Lowlands: Current knowledge on zonation, carbon content, and Late Quaternary history. Quat. Sci. Rev. 2003, 22, 703–723. [Google Scholar] [CrossRef]
- Romanovsky, V.E.; Drozdov, D.S.; Oberman, N.G.; Malkova, G.V.; Kholodov, A.L.; Marchenko, S.S.; Moskalenko, N.G.; Sergeev, D.O.; Ukraintseva, N.G.; Abramov, A.A.; et al. Thermal state of permafrost in Russia. Permafr. Periglac. Processes 2010, 21, 136–155. [Google Scholar] [CrossRef]
- Smith, L.C.; Macdonald, G.M.; Velichko, A.A.; Beilman, D.W.; Borisova, O.K.; Frey, K.E.; Kremenetsky, K.V.; Sheng, Y. Siberian peatlands as a net carbon sink and global methane source since the early Holocene. Science 2004, 303, 353–356. [Google Scholar] [CrossRef] [Green Version]
- Frey, K.E.; Siegel, D.I.; Smith, L.C. Geochemistry of west Siberian streams and their potential response to permafrost degradation. Water Resour. Res. 2007, 43, W03406. [Google Scholar] [CrossRef] [Green Version]
- Frey, K.E.; Smith, L.C. Amplified carbon release from vast West Siberian peatlands by 2100. Geophys. Res. Lett. 2005, 32. [Google Scholar] [CrossRef] [Green Version]
- Krickov, I.; Lim, A.; Manasypov, R.M.; Loiko, S.V.; Shirokova, L.S.; Kirpotin, S.N.; Karlsson, J.; Pokrovsky, O.S. Riverine particulate C and N generated at the permafrost thaw front: Case study of western Siberian rivers across a 1700-km latitudinal transect. Biogeosciences 2018, 15, 6867–6884. [Google Scholar] [CrossRef] [Green Version]
- Krickov, I.V.; Pokrovsky, O.S.; Manasypov, R.M.; Lim, A.G.; Shirokova, L.S.; Viers, J. Colloidal transport of carbon and metals by western Siberian rivers during different seasons across a permafrost gradient. Geochim. Cosmochim. Acta 2019, 265, 221–241. [Google Scholar] [CrossRef]
- Krickov, I.V.; Lim, A.G.; Manasypov, R.M.; Loiko, S.V.; Vorobyev, S.N.; Shevchenko, V.P.; Dara, O.M.; Gordeev, V.V.; Pokrovsky, O.S. Major and trace elements in suspended matter of western Siberian rivers: First assessment across permafrost zones and landscape parameters of watersheds. Geochim. Cosmochim. Acta 2020, 269, 429–450. [Google Scholar] [CrossRef]
- Pokrovsky, O.S.; Manasypov, R.M.; Shirokova, L.S.; Loiko, S.V.; Krickov, I.V.; Kopysov, S.; Zemtzov, V.A.; Kulizhsky, S.P.; Vorobyev, S.N.; Kirpotin, S.N. Permafrost coverage, watershed area and season control of dissolved carbon and major elements in western Siberia rivers. Biogeosciences 2015, 12, 6301–6320. [Google Scholar] [CrossRef] [Green Version]
- Pokrovsky, O.S.; Manasypov, R.M.; Loiko, S.; Krickov, I.A.; Kopysov, S.G.; Kolesnichenko, L.G.; Vorobyev, S.N.; Kirpotin, S.N. Trace element transport in western Siberia rivers across a permafrost gradient. Biogeosciences 2016, 13, 1877–1900. [Google Scholar] [CrossRef] [Green Version]
- Vorobyev, S.N.; Pokrovsky, O.S.; Serikova, S.; Manasypov, R.M.; Krickov, I.V.; Shirokova, L.S.; Lim, A.; Kolesnichenko, L.G.; Kirpotin, S.N.; Karlsson, J. Permafrost boundary shift in Western Siberia may not modify dissolved nutrient concentrations in rivers. Water 2017, 9, 985. [Google Scholar] [CrossRef] [Green Version]
- Vorobyev, S.N.; Pokrovsky, O.S.; Kolesnichenko, L.G.; Manasypov, R.M.; Shirokova, L.S.; Karlsson, J.; Kirpotin, S.N. Biogeochemistry of dissolved carbon, major, and trace elements during spring flood periods on the Ob River. Hydrol. Processes 2019, 33, 1579–1594. [Google Scholar] [CrossRef]
- Kolesnichenko, I.; Kolesnichenko, L.G.; Vorobyev, S.N.; Shirokova, L.S.; Semiletov, I.P.; Dudarev, O.V.; Vorobev, R.S.; Shavrina, U.; Kirpotin, S.N.; Pokrovsky, O.S. Landscape, soil, lithology, climate and permafrost control on dissolved carbon, major and trace elements in the Ob River, western Siberia. Water 2021, 13, 3189. [Google Scholar] [CrossRef]
- Lim, A.G.; Loiko, S.V.; Kuzmina, D.; Krickov, I.V.; Shirokova, L.S.; Kulizhsky, S.P.; Vorobyev, S.N.; Pokrovsky, O.S. Dispersed ground ice of permafrost peatlands: A non-accounted for source of C, nutrients and metals. Chemosphere 2021, 266, 128953. [Google Scholar] [CrossRef] [PubMed]
- Raudina, T.V.; Loiko, S.V.; Lim, A.G.; Krickov, I.V.; Shirokova, L.S.; Istigichev, G.I.; Kuzmina, D.M.; Kulizhsky, S.P.; Vorobyev, S.N.; Pokrovsky, O.S. Dissolved organic carbon and major and trace elements in peat porewater of sporadic, discontinuous, and continuous permafrost zones of western Siberia. Biogeosciences 2017, 14, 3561–3584. [Google Scholar] [CrossRef] [Green Version]
- Raudina, T.V.; Loiko, S.V.; Lim, A.; Manasypov, R.M.; Shirokova, L.S.; Istigechev, G.I.; Kuzmina, D.M.; Kulizhsky, S.P.; Vorobyev, S.N.; Pokrovsky, O.S. Permafrost thaw and climate warming may decrease the CO2, carbon, and metal concentration in peat soil waters of the Western Siberia Lowland. Sci. Total Environ. 2018, 634, 1004–1023. [Google Scholar] [CrossRef]
- Raudina, T.V.; Loiko, S.; Kuzmina, D.M.; Shirokova, L.S.; Kulizhsky, S.P.; Golovatskaya, E.A.; Pokrovsky, O.S. Colloidal organic carbon and trace elements in peat porewaters across a permafrost gradient in Western Siberia. Geoderma 2021, 390, 114971. [Google Scholar] [CrossRef]
- Karlsson, J.; Serikova, S.; Vorobyev, S.N.; Rocher-Ros, G.; Denfeld, B.; Pokrovsky, O.S. Carbon emission from Western Siberian inland waters. Nat. Commun. 2021, 12, 825. [Google Scholar] [CrossRef]
- Serikova, S.; Pokrovsky, O.S.; Ala-Aho, P.; Kazantsev, V.; Kirpotin, S.N.; Kopysov, S.G.; Krickov, I.V.; Laudon, H.; Manasypov, R.M.; Shirokova, L.S.; et al. High riverine CO2 emissions at the permafrost boundary of Western Siberia. Nat. Geosci. 2018, 11, 825–829. [Google Scholar] [CrossRef] [Green Version]
- Serikova, S.; Pokrovsky, O.S.; Laudon, H.; Krickov, I.V.; Lim, A.G.; Manasypov, R.M.; Karlsson, J. High carbon emissions from thermokarst lakes of Western Siberia. Nat. Commun. 2019, 10, 1552. [Google Scholar] [CrossRef] [Green Version]
- Pokrovsky, O.; Lim, A.; Korets, M.; Krickov, I.; Vorobyev, S. Dissolved (<0.45 µm) major and trace elements and landscape parameters of Ket and Taz Rivers, Western Siberia. Mendeley Data 2022, V1. [Google Scholar] [CrossRef]
- Marie, D.; Partensky, F.; Vaulot, D.; Brussaard, C. Enumeration of phytoplankton, bacteria, and viruses in marine samples. Curr. Protoc. Cytom. 1999, 10, 11.11.1–11.11.5. [Google Scholar] [CrossRef]
- Pokrovsky, O.S.; Manasypov, R.M.; Loiko, S.V.; Shirokova, L.S. Organic and organo-mineral colloids in discontinuous permafrost zone. Geochim. Cosmochim. Acta 2016, 188, 1–20. [Google Scholar] [CrossRef]
- Shirokova, L.S.; Pokrovsky, O.S.; Kirpotin, S.N.; Desmukh, C.; Pokrovsky, B.G.; Audry, S.; Viers, J. Biogeochemistry of organic carbon, CO2, CH4, and trace elements in thermokarst water bodies in discontinuous permafrost zones of Western Siberia. Biogeochemistry 2013, 113, 573–593. [Google Scholar] [CrossRef]
- Heimburger, A.; Tharaud, M.; Monna, F.; Losno, R.; Desboeufs, K.; Nguyen, E.B. SLRS-5 elemental concentrations deduced from SLRS-5/SLRS-4 ratios of thirty-three uncertified elements. Geostand. Geoanal. Res. 2013, 37, 77–85. [Google Scholar] [CrossRef]
- Yeghicheyan, D.; Bossy, C.; Bouhnik Le Coz, M.; Douchet, C.; Granier, G.; Heimburger, A.; Lacan, F.; Lanzanova, A.; Rousseau, T.C.C.; Seidel, J.-L.; et al. A Compilation of Silicon, Rare Earth Element and Twenty-One other Trace Element Concentrations in the Natural River Water Reference Material SLRS-5 (NRC-CNRC). Geostand. Geoanal. Res. 2013, 37, 449–467. [Google Scholar] [CrossRef]
- Bartalev, S.A.; Egorov, V.A.; Ershov, D.V.; Isaev, A.S.; Lupyan, E.A.; Plotnikov, D.E.; Uvarov, I.A. Remote mapping of vegetation land cover of Russia based on data of MODIS spectroradmeter. Mod. Probl. Earth Remote Sens. Space 2011, 8, 285–302. Available online: http://d33.infospace.ru/d33_conf/2011v8n4/285-302.pdf (accessed on 15 June 2022).
- Harris, I.; Jones, P.D.; Osborn, T.J.; Lister, D.H. Updated high-resolution grids of monthly climatic observations—The CRU TS3.10 Dataset. Int. J. Climatol. 2014, 34, 623–642. [Google Scholar] [CrossRef] [Green Version]
- Hugelius, G.; Tarnocai, C.; Broll, G.; Canadell, J.G.; Kuhry, P.; Swanson, D.K. The Northern Circumpolar Soil Carbon Database: Spatially distributed datasets of soil coverage and soil carbon storage in the northern permafrost regions. Earth Syst. Sci. Data 2013, 5, 3–13. [Google Scholar] [CrossRef] [Green Version]
- Santoro, M.; Beer, C.; Cartus, O.; Schmullius, C.; Shvidenko, A.; McCallum, I.; Wegmueller, U.; Wiesmann, A. The BIOMASAR algorithm: An approach for retrieval of forest growing stock volume using stacks of multi-temporal SAR data. In Proceedings of the ESA Living Planet Symposium, Bergen, Norway, 28 June–2 July 2010; Available online: https://www.researchgate.net/publication/230662433 (accessed on 15 June 2022).
- Krickov, I.V.; Lim, A.G.; Shevchenko, V.P.; Vorobyev, S.N.; Candaudap, F.; Pokrovsky, O.S. Dissolved metal (Fe, Mn, Zn, Ni, Cu, Co, Cd, Pb) and metalloid (As, Sb) in snow water across a 2800-km latitudinal profile of western Siberia: Impact of local pollution and global transfer. Water 2022, 14, 94. [Google Scholar] [CrossRef]
- Barker, A.J.; Douglas, T.A.; Jacobson, A.D.; McClelland, J.W.; Ilgen, A.G.; Khosh, M.S.; Lehn, G.O.; Trainor, T.P. Late season mobilization of trace metals in two small Alaskan arctic watersheds as a proxy for landscape scale permafrost active layer dynamics. Chem. Geol. 2014, 381, 180–193. [Google Scholar] [CrossRef] [Green Version]
- Keller, K.; Blum, J.D.; Kling, G.W. Geochemistry of soils and streams on surfaces of varying ages in arctic Alaska. Arct. Antarct. Alp. Res. 2007, 39, 84–98. [Google Scholar] [CrossRef]
- Keller, K.; Blum, J.D.; Kling, G.W. Stream geochemistry as an indicator of increasing permafrost thaw depth in an arctic watershed. Chem. Geol. 2010, 273, 76–81. [Google Scholar] [CrossRef]
- Laudon, H.; Sjoblom, V.; Buffam, I.; Seibert, J.; Morth, M. The role of catchment scale and landscape characteristics for runoff generation of boreal streams. J. Hydrol. 2007, 344, 198–209. [Google Scholar] [CrossRef]
- Viers, J.; Prokushkin, A.S.; Pokrovsky, O.S.; Beaulieu, E.; Oliva, P.; Dupré, B. Seasonal and spatial variability of elemental concentrations in boreal forest larch folliage of Central Siberia on continuous permafrost. Biogeochemistry 2013, 113, 435–449. [Google Scholar] [CrossRef]
- Lidman, F.; Morth, C.M.; Laudon, H. Landscape control of uranium and thorium in boreal streams—Spatiotemporal variability and the role of wetlands. Biogeosciences 2012, 9, 4773–4785. [Google Scholar] [CrossRef] [Green Version]
- Lidman, F.; Kohler, S.J.; Morth, C.-M.; Laudon, H. Metal transport in the boreal landscape—The role of wetlands and the affinity for organic matter. Environ. Sci. Technol. 2014, 48, 3783–3790. [Google Scholar] [CrossRef]
- Ingri, J.; Widerlund, A.; Land, M.; Gustafsson, Ö.; Andersson, P.S.; Öhlander, B. Temporal variations in the fractionation of the rare earth elements in a boreal river, the role of colloidal particles. Chem. Geol. 2000, 166, 23–45. [Google Scholar] [CrossRef]
- Stolpe, B.; Guo, L.; Shiller, A.M.; Aiken, G.R. Abundance, size distribution and trace-element binding of organic and iron-rich nanocolloids in Alaskan rivers, as revealed by field-flow fractionation and ICP-MS. Geochim. Cosmochim. Acta 2013, 105, 221–239. [Google Scholar] [CrossRef]
- Vasyukova, E.V.; Pokrovsky, O.S.; Viers, J.; Oliva, P.; Dupré, B.; Martin, F.; Candaudap, F. Trace elements in organic- and iron-rich surficial fluids of the boreal zone: Assessing colloidal forms via dialysis and ultrafiltration. Geochim. Cosmochim. Acta 2010, 74, 449–468. [Google Scholar] [CrossRef]
- Oleinikova, O.; Drozdova, O.Y.; Lapitskiy, S.A.; Demin, V.V.; Bychkov, A.Y.; Pokrovsky, O.S. Dissolved organic matter degradation by sunlight coagulates organo-mineral colloids and produces low-molecular weight fraction of metals in boreal humic waters. Geochim. Cosmochim. Acta 2017, 211, 97–114. [Google Scholar] [CrossRef]
- Oleinikova, O.; Shirokova, L.S.; Gérard, E.; Drozdova, O.Y.; Lapitsky, S.A.; Bychkov, A.Y.; Pokrovsky, O.S. Transformation of organo-ferric peat colloids by a heterotrophic bacterium. Geochim. Cosmochim. Acta 2017, 205, 313–330. [Google Scholar] [CrossRef]
- Shirokova, L.S.; Bredoire, R.; Rolls, J.-L.; Pokrovsky, O.S. Moss and peat leachate degradability by heterotrophic bacteria: Fate of organic carbon and trace metals. Geomicrobiol. J. 2017, 34, 641–655. [Google Scholar] [CrossRef]
- Shirokova, L.S.; Chupakova, A.A.; Chupakov, A.V.; Pokrovsky, O.S. Transformation of dissolved organic matter and related trace element in the mouth zone of the largest European Arctic river: Experimental modeling. Inland Waters 2017, 7, 272–282. [Google Scholar] [CrossRef]
- Vorobyev, S.N.; Kolesnichenko, Y.; Korets, M.; Pokrovsky, O.S. Testing landscape, climate and lithology impact on carbon, major and trace elements of the Lena River and its tributaries during a spring flood period. Water 2021, 13, 2093. [Google Scholar] [CrossRef]
- Pokrovsky, O.S.; Bueno, M.; Manasypov, R.M.; Shirokova, L.S.; Karlsson, J.; Amouroux, D. Dissolved organic matter controls on seasonal and spatial selenium concentration variability in thaw lakes across a permafrost gradient. Environ. Sci. Technol. 2018, 52, 10254–10262. [Google Scholar] [CrossRef] [PubMed]
- Chupakov, A.V.; Pokrovsky, O.S.; Moreva, O.Y.; Shirokova, L.S.; Neverova, N.V.; Chupakova, A.A.; Kotova, E.I.; Vorobyeva, T.Y. High resolution multi-annual riverine fluxes of organic carbon, nutrient and trace element from the largest European Arctic river, Severnaya Dvina. Chem. Geol. 2020, 538, 119491. [Google Scholar] [CrossRef]
- Bagard, M.L.; Chabaux, F.; Pokrovsky, O.S.; Prokushkin, A.S.; Viers, J.; Dupré, B.; Stille, P.; Rihs, S.; Schmitt, A.-D. Seasonal variability of element fluxes in two Central Siberian rivers draining high latitude permafrost dominated areas. Geochim. Cosmochim. Acta 2011, 75, 3335–3357. [Google Scholar] [CrossRef]
- Dahlqvist, R.; Andersson, K.; Ingri, J.; Larsson, T.; Stolpe, B.; Turner, D. Temporal variations of colloidal carrier phases and associated trace elements in a boreal river. Geochim. Cosmochim. Acta 2007, 71, 5339–5354. [Google Scholar] [CrossRef]
- Lyvén, B.; Hassellöv, M.; Turner, D.R.; Haraldsson, C.; Andersson, K. Competition between iron- and carbon-based colloidal carriers for trace metals in a freshwater assessed using flow field-flow fractionation coupled to ICPMS. Geochim. Cosmochim. Acta 2003, 67, 3791–3802. [Google Scholar] [CrossRef]
- Pokrovsky, O.S.; Manasypov, R.M.; Kopysov, S.; Krickov, I.V.; Shirokova, L.S.; Loiko, S.V.; Lim, A.G.; Kolesnichenko, L.G.; Vorobyev, S.N.; Kirpotin, S.N. Impact of permafrost thaw and climate warming on riverine export fluxes of carbon, nutrients and metals in western Siberia. Water 2020, 12, 1817. [Google Scholar] [CrossRef]
- Manasypov, R.M.; Vorobyev, S.N.; Loiko, S.V.; Kritzkov, I.V.; Shirokova, L.S.; Shevchenko, V.P.; Kirpotin, S.N.; Kulizhsky, S.P.; Kolesnichenko, L.G.; Zemtzov, V.A.; et al. Seasonal dynamics of organic carbon and metals in thermokarst lakes from the discontinuous permafrost zone of western Siberia. Biogeosciences 2015, 12, 3009–3028. [Google Scholar] [CrossRef] [Green Version]
- Manasypov, R.M.; Lim, A.G.; Kriсkov, I.V.; Shirokova, L.S.; Vorobyev, S.N.; Kirpotin, S.N.; Pokrovsky, O.S. Spatial and seasonal variations of C, nutrient, and metal concentration in thermokarst lakes of Western Siberia across a permafrost gradient. Water 2020, 12, 1830. [Google Scholar] [CrossRef]
- Blois, J.L.; Williams, J.W.; Fitzpatrick, M.C.; Jackson, S.T.; Ferrier, S. Space can substitute for time in predicting climate-change effects on biodiversity. Proc. Natl. Acad. Sci. USA 2013, 110, 9374–9379. [Google Scholar] [CrossRef] [PubMed] [Green Version]
- García Criado, M.; Myers-Smith, I.H.; Bjorkman, A.D.; Lehmann, C.E.R.; Stevens, N. Woody plant encroachment intensifies under climate change across tundra and savanna biomes. Glob. Ecol. Biogeogr. 2020, 29, 925–943. [Google Scholar] [CrossRef]
- Mauclet, E.; Agnan, Y.; Hirst, C.; Monhonval, A.; Pereira, B.; Vandeuren, A.; Villani, M.; Ledman, J.; Taylor, M.; Jasinski, B.L.; et al. Changing sub-Arctic tundra vegetation upon permafrost degradation: Impact on foliar mineral element cycling. Biogeosciences 2022, 19, 2333–2351. [Google Scholar] [CrossRef]
- Tape, K.; Sturm, M.; Racine, C. The evidence for shrub expansion in Northern Alaska and the Pan-Arctic. Glob. Change Biol. 2006, 12, 686–702. [Google Scholar] [CrossRef]


Publisher’s Note: MDPI stays neutral with regard to jurisdictional claims in published maps and institutional affiliations. |
© 2022 by the authors. Licensee MDPI, Basel, Switzerland. This article is an open access article distributed under the terms and conditions of the Creative Commons Attribution (CC BY) license (https://creativecommons.org/licenses/by/4.0/).
Share and Cite
Pokrovsky, O.S.; Lim, A.G.; Krickov, I.V.; Korets, M.A.; Shirokova, L.S.; Vorobyev, S.N. Hydrochemistry of Medium-Size Pristine Rivers in Boreal and Subarctic Zone: Disentangling Effect of Landscape Parameters across a Permafrost, Climate, and Vegetation Gradient. Water 2022, 14, 2250. https://doi.org/10.3390/w14142250
Pokrovsky OS, Lim AG, Krickov IV, Korets MA, Shirokova LS, Vorobyev SN. Hydrochemistry of Medium-Size Pristine Rivers in Boreal and Subarctic Zone: Disentangling Effect of Landscape Parameters across a Permafrost, Climate, and Vegetation Gradient. Water. 2022; 14(14):2250. https://doi.org/10.3390/w14142250
Chicago/Turabian StylePokrovsky, Oleg S., Artem G. Lim, Ivan V. Krickov, Mikhail A. Korets, Liudmila S. Shirokova, and Sergey N. Vorobyev. 2022. "Hydrochemistry of Medium-Size Pristine Rivers in Boreal and Subarctic Zone: Disentangling Effect of Landscape Parameters across a Permafrost, Climate, and Vegetation Gradient" Water 14, no. 14: 2250. https://doi.org/10.3390/w14142250