
C, N, and P Mass Balances in the Bottom Seawater–Surface Sediment Interface in the Reducing Environment due to Anoxic Water of Gamak Bay, Korea


1
Faculty of Environmental & Symbiotic Sciences, Prefectural University of Kumamoto, 3-1-100, Tsukide, Higashi-Ku, Kumamoto 862-8502, Japan
2
Department of Ocean Integrated Science, College of Fisheries & Ocean Science, Chonnam National University, 50, Daehak-Ro, Yeosu 59626, Korea
*
Author to whom correspondence should be addressed.
Water 2022, 14(14), 2244; https://doi.org/10.3390/w14142244
Submission received: 24 April 2022
/
Revised: 24 June 2022
/
Accepted: 12 July 2022
/
Published: 17 July 2022
(This article belongs to the Special Issue Eutrophication Management in Coastal Zones for Better Water Quality)
Abstract
:Current mass balances of C, N, and P were estimated using a model (Fluxin = Fluxout + Flux) from Gamak Bay, Korea, in August 2017, where eutrophication and reducing conditions are prevalent. To examine the current fluxes of particulate organic carbon (POC), nitrogen (PON), and phosphorus (POP), sinking and re-floating sediment traps were deployed, a sediment oxygen demand (SOD) chamber experiment and ex-situ nutrient incubation experiment were conducted, and Fick’s first law of diffusion was applied. The principal component analysis and cluster analysis were performed to identify the three groups of water masses based on the characteristics of the bay, including the effects of the reducing environment due to the anoxic water mass using 14 bottom water quality parameters. In the reducing environment (sampling point GA4), the SOD20 flux was 3047.2 mg O2/m2/d. Additionally, the net sinking POC flux was 861.0 mg C/m2/d, while 131.8% of the net sinking POC flux (1134.5 mg C/m2/d) was removed toward the overlying water. This indicates that the organic matter that had been deposited was decomposed as a flux of 273.6 mg C/m2/d. The net sinking PON flux was 187.9 mg N/m2/d, whereas 15.8% of the net sinking PON flux was eluted, and 84.2% remained in the surface sediments. The dissolved inorganic nitrogen (DIN) elution flux from the surface sediments consisted of NH4+ elution (33.7 mg N/m2/d) and NOx− elution (4.1 mg N/m2/d) fluxes. Despite the net sinking POP flux being 26.0 mg P/m2/d, the 47.7 mg P/m2/d of DIP elution flux (179.5% of the net sinking POP flux) was eluted to the overlying water. Similar to C mass balance, the additional elution flux occurred. Therefore, severe eutrophication (16.5 of the Okaichi eutrophication index) with the lowest N:P ratio (2.6) in GA4 was noted. This indicates that not only the freshly exported organic matter to the surface sediments but also the biochemical processes under anoxic conditions played an essential role as a remarkable nutrient source–particularly P–for eutrophication in Gamak Bay, Korea.
1. Introduction
Marine environments respond to anthropogenic pollutants caused by industrialization and urbanization. Point source, defining any discernible and confined pollutant sources [1], is a primary route for loading the eutrophic substances to marine environments. While eutrophication refers to a status of nutrients, which are supplied exceeding the necessity [2,3,4,5], eutrophication induces phytoplankton blooms, particularly when temperature, light, and micronutrients (e.g., trace metals) also reach optimal levels for phytoplankton growth [6,7,8].
Organic matter produced through a series of blooms settles at the surface sediments [9,10], and oxygen consumption is required for bacterial activity to decompose the organic matter [8,11,12,13]. Concomitantly, the strong stratification in the water column causes the bottom hypoxia by inhibiting the oxygen supply to the bottom water [14,15]. Prolonged oxygen consumption gives rise to anoxic waters with less than 1.0 mg/L of dissolved oxygen [9,15]. The definition of hypoxia differs among studies, primarily due to different responses of ecosystem function [16]. The National Institute of Fisheries Science in South Korea defines hypoxia as dissolved oxygen levels below 3.0 mg/L and annually monitors hypoxic water masses along the coastal sea of Korea to preserve marine ecosystems and fishery resources [17].
The redox processes of nitrogen and phosphorus disturb their biogeochemical cycles, and the mass balances in the bottom seawater–sediment interface have been investigated for many decades [11,18,19,20,21]. Under oxygen-deficient conditions, marine microbes facultatively gain energy by oxidizing organic matter and other reduced species such as sulfide and manganese [22]. Ammonification and dissimilatory nitrogen reduction to ammonium (DNRA) produce ammonium nitrogen [23,24,25,26], and hydrogen sulfide is produced from sulfate-reducing bacteria-mediated reactions [12,22]. Hydrogen sulfide can be removed through the oxidation processes in the aerobic water column, but hypoxic or anoxic environments drive the accumulation of hydrogen sulfide, affecting the marine ecosystem and often forming blue tides [27,28]. In addition, phosphorus is also released into the overlying seawater from the surface sediments, and eutrophication is exacerbated [11,29]. Thus, the hypoxic conditions encourage the re-occurrence of phytoplankton blooms, and the resulting organic matter further consumes dissolved oxygen accelerating coastal eutrophication [9].
Globally, many chemical oceanographers have focused on coastal waters, where terrestrial organic matter is excessive [30,31,32], anthropogenically driven organic matter affects ecosystems (e.g., aquaculture farms) [33,34,35], and hypoxic or anoxic water masses are formed [11,20]. Gamak Bay, located in the southern coastal waters of Korea, represents the eutrophic aspects described above. Previous studies have investigated eutrophication status and the formation of bottom hypoxia in Gamak Bay [10,12,36,37]. However, recent patterns of hypoxia or anoxia demonstrating the earlier formation and longer duration in the bay have not been considered [9,13].
The researchers have also emphasized that hypoxia and nutrient elution from sediments are the primary factors of eutrophication in this bay [9,10,12,13]. Nevertheless, C, N, and P mass balances under reducing environments in the bottom water–surface sediment interface were rarely determined for Gamak Bay. Notably, previous studies were restricted mainly to organic carbon cycles, or ignored the ecological function of resuspension, which play an essential role in the perspective of mass balances [12,33]. In the bay, for ~100 years, hypoxia and anoxia have regularly been observed during every summer in the bay [12]. It is necessary to quantify the extent to which the C, N, and P mass balances are affected by the reducing environment in the interface.
The present study modeled the mass balances of C, N, and P in Gamak Bay under anoxic conditions (Fluxin = Fluxout + Flux). Principal component analysis (PCA) and cluster analysis with Euclidean distance were utilized using the bottom water quality parameters to define the water masses mainly affected by reduction processes. Subsequently, data obtained from sinking and re-floating sediment traps, a sediment oxygen demand (SOD) chamber, ex-situ nutrient incubating experiments, and Fick’s first law of diffusion were applied to the model. Our results highlight the biogeochemical cycles and the nutrient elution in the reducing environment as the primary nutrient source in Gamak Bay. This eventually provides insight into managing the marine ecology of the bay in an aspect of eutrophication in the bottom water and surface sediments.
2. Materials and Methods
2.1. A Study Area
Gamak Bay in Yeosu City, Korea, is 225.29 km2 in an area spanning 15 km from north to south and 9 km from west to east [38]. It is characterized by a concaved bottom topography in the northwestern region with 9 m of mean water depth [38]. Typical semi-enclosed geography inhibits water circulation and induces stratification [39]. Nutrients and organic matter loaded from point/non-point sources surrounding Gamak Bay cause eutrophication and generate hypoxic waters [9,10,13]. In Gamak Bay, there are shellfish and fish farms that provide 30% of domestic oyster production [39]. Therefore, the Ministry of Oceans and Fisheries of Korea has conserved this bay as a marine protected area for cultivating and protecting fisheries resources [40].
2.2. Field Survey
Samples for environmental parameters of bottom waters and surface sediments were collected at 10 sampling points on 16 August, 2017 (Figure 1). Water temperature (WT), salinity (SAL), dissolved oxygen (DO), pH, and water depth were measured in situ using a multiparameter probe (YSI ProDSS, YSI Inc./Xylem Inc., Yellow Springs, OH, USA). Water samples were collected at 0.5 m above the seafloors using a Van Dorn sampler (Wildlife Supply Company®, Yulee, FL, USA) to minimize sediment disturbance. To collect dissolved inorganic nutrient samples, 700 mL of water sample was filtered through GF/F filters (diameter 47 mm, Whatman plc, Maidstone, UK). The GF/F filters were rinsed with distilled water and dried for 4 h at 110 °C before filtering water samples. For the H2S, water samples were collected in the 300 mL of biological oxygen demand bottles with glass robotic stoppers through a rubber tube of the water sampler to minimize bubbles, and then a zinc acetate solution was added to stabilize [41]. Sediment samples were grabbed using a Van Veen grab (Eijkelkamp, Giesbeek, The Netherlands), and surface sediments at 0–2 cm depth were collected using a stainless spoon to measure water contents and the dissolved inorganic nutrients in the pore water. Samples were kept in a cooler with dry ice, transported to a laboratory within an hour after collection, and immediately analyzed.
2.3. Analyses of Water Quality and Surface Sediment Parameters
The H2S and dissolved inorganic nutrients, comprising dissolved inorganic nitrogen (DIN), dissolved inorganic phosphorus (DIP), and dissolved silicate (DSi), were colorimetrically measured according to the Official Standard Measurement Methods for Marine Environment of the Ministry of Oceans and Fisheries, Korea [41]. Ammonium-N (NH4+) was analyzed using an indophenol blue colorimetric method. Nitrite-N (NO2−) was analyzed using an azo compound colorimetric method. Nitrate-N (NO3−) was reduced to NO2− using a Cd–Cu reduction column. The molybdenum blue and molybdic acid colorimetric methods were applied to measure DIP and DSi, respectively. The H2S was analyzed using a methylene blue colorimetric method. A spectrophotometer (UV-1800, SHIMADZU, Kyoto, Japan) was used to measure colorimetric methods. Bottom water samples were filtered through mixed cellulose ester membrane filters (diameter 47 mm, Advantec Toyo Kaisha, Tokyo, Japan), and chlorophyll-a (Chl-a) was extracted using 90% acetone from the membrane filters and then measured using the spectrophotometer. Chemical oxygen demand (COD) was measured using an alkaline potassium permanganate method. For measuring suspended particulate matter (SPM) concentration, the GF/F filters were weighed before and after filtering 700 mL of water samples and drying for 4 h at 110 °C.
The pore water was extracted from the surface sediments by centrifuging at 3500 rpm and diluted with distilled water. The dissolved inorganic nutrients in the pore water were measured as described above. Water content (W) of the surface sediments was calculated from a comparison between weights before and after drying the raw surface sediments at 110 °C.
2.4. An Eutrophication Index
The Okaichi eutrophication index (OEI) was calculated using COD, DIN, and DIP to assess the intensity of eutrophication [42]. The OEI has been widely applied to semi-enclosed bays along the Korean coastal waters [43].
where COD (mg/L), DIN (µM), and DIP (µM) indicate concentrations of each parameter, and 3.43 is a constant, which is derived from algal bloom waters with 0.83 mg/L of carbon (i.e., COD = 1.0 mg/L), 7.17 µM of DIN, and 0.48 µM of DIP. Eutrophic waters are defined as the OEI being greater than one.
Okaichi Eutrophication Index (OEI) = COD × DIN × DIP/3.43
2.5. Deployment of Sinking and Re-Floating Sediment Traps in Bottom Seawater–Surface Sediments Interface
To investigate the net sinking flux by comparing the gross sinking and resuspended sinking fluxes, two types of sediment traps were simultaneously deployed at GA4 from 28 August to 1 September 2017. GA4 was chosen because of the anoxia-driven reducing environment. One sediment trap, composed of a straight acrylic tube of 0.5 cm thickness, 10 cm inside diameter, and 100 cm height, was designed to collect sinking particulates. The other sediment trap was designed to collect re-floating particles through a PVC (polyvinyl chloride) pipe top of 10 cm inside diameter and 15 cm height, collected to a straight acrylic tube with the same dimension as the first trap. Sample bottles were attached to each sediment trap to capture sinking particles (Figure 2a). After four days of mooring, samples were collected from each trap, and the concentrations of SPM, particulate organic carbon (POC), and particulate organic nitrogen (PON) were measured. The 300 mL of sample was filtered through GF/F filters (diameter 25 mm, Whatman plc, Maidstone, UK) and dried in a 110 °C oven for 4 h and then in a silica gel desiccator for 2 h. Particulate inorganic carbon was removed using fuming samples with steam from boiling hydrogen chloride at 110 °C. The particulate inorganic carbon-removed samples were dried again, and the POC and PON were analyzed using a Macro elemental analyzer (Vario MACRO cube, ELMENTAR Americas Inc., Ronkonkoma, NY, USA). Fluxes of POC and PON were calculated from sediment trap data as follows:
where CSPM is the SPM concentrations (mg/L) obtained from the bottom sampling bottles of each trap; PPOC or PPON are the percentile concentrations (dimensionless) of POC or PON relative to SPM; VTrap is a volume (1.6 L) of the bottom bottle; STrap is the area of the trap entrance (0.01 m2); D is the mooring duration (4 days).
Sinking or Re-floating SPM (or POC, PON) Fluxes (mg/m2/day) = CSPM × (PPOC or PPON) × VTrap × 1/STrap × 1/D
2.6. SOD Flux in Bottom Seawater–Surface Sediments Interface
To examine the oxygen demand of the surface sediment, a SOD chamber was modified based on Jung and Cho [31] (Figure 2b). The chamber was placed in a cooler filled with tap water to maintain the bottom water temperature and prevent light penetration. The bottom seawater of GA4, filtered through GF/C filters (diameter 150 mm, Whatman plc, Maidstone, UK), was filled into a 50 L chamber in which four small sediment cores were installed using a siphon to minimize the disturbance on the surface sediments. The filtered bottom seawater was manually aerated to exclude the POC decomposition via electron acceptors other than oxygen [22] and estimate the POC oxidation in the surface sediment, as described below. The water was continuously circulated using a magnetic stirrer to simulate seawater circulation. The stirrer speed was approximately 120 rpm to minimize the surface sediment disturbance until the experiment was terminated. Simultaneously, the YSI ProDSS multiparameter probe was installed to measure DO at 0, 2, 4, 8, 12, 18, 24, and 36 h after incubation. During incubation, the mean values of WT and SAL were 24.1 ± 0.1 °C and 32.36 ± 0.00 PSU (practical salinity unit), respectively. The SOD flux was calculated using Equation (3) [44]. The biological and chemical processes were dependent on water temperatures, and the SODT flux (i.e., ambient temperature) was calibrated to 20 °C using Equation (4) [45,46], which has been commonly adopted in the SOD correction [47,48].
where DO0 and DOn are DO concentrations (mg/L) before and after the experiment, respectively; t is the experimental duration (36 h); VSOD is the volume of the chamber (50 L); VCORE is the total volume of the four small sediment cores installed in the chamber (1.6 × 10⁻³ m3); ASOD is the total surface area of the four small sediment cores (0.02 m2); 1.065 is a temperature correction factor [46]; T is the water temperature maintained during the experiment (the mean temperature was 24.1 °C); and c1 (10−3 m3/L) and c2 (103 L/m3 × 24 h/day) are constants for unit conversion. The respiration of benthos was negligible during the incubation because benthos was not found in GA4 from July to October 2017 [49].
SODT Flux (mg O2/m2/day) = (DO0 − DOn) ×1/t × (VSOD × c1 − VCORE) × 1/ASOD × c2
SOD20 Flux (mg O2/m2/day) = SODT Flux/1.065 (T−20.0)
2.7. Nutrient Elution and Diffusion Fluxes in Bottom Seawater–Surface Sediments Interface
Using core samples containing 1.5 L of seawater above 15 cm of sediments (Figure 2c), ex situ incubating experiments were conducted to examine nutrient fluxes from the surface sediments to overlying water in the reducing environment, based on previous studies [32,50,51]. Overlying water in the core was removed using a siphon to minimize the sediment disturbance. Bottom water (1.5 L) at GA4 was filtered using GF/C filters (diameter 150 mm, Whatman plc, Maidstone, UK) and added to the core without disturbing the sediment. The reducing environment was then manually generated with infusing nitrogen gas (99.99%) into the overlying seawater. The core was settled inside a non-transparent plastic box filled with tap water at the same temperature as the bottom seawater (24.0 °C) to simulate the dark and cold bottom seawater. After samples were stabilized through a pre-incubating step for 2 h [50], 250 mL supernatant water was extracted using a syringe from each sample at 2, 4, 8, 12, 18, 24, and 36 h after incubation. The overlying water was refilled with fresh 250 mL of filtered bottom seawater after each extraction. Nutrient fluxes were calculated according to Equation (5) [51,52].
where N0 is the nutrient concentration (mg/L) in the initial overlying water; Nn is the nutrient concentration (mg/L) in the overlying water at n times of sample collection; Nin is the nutrient concentration (mg/L) in the added water at each collection; n is the sampling frequency (dimensionless); VE is the overlying water volume (1.5 L); Vc is the water volume extracted or added into the overlying water (250 mL); AE is a surface area of sediment core (0.008 m2); t is the experimental duration (36 h); c is a constant (24 h/d) for unit conversion. Since there was no benthos from July to October 2017 [49], the sediment bioturbation was negligible during incubation [53].
The nutrient elution flux indicates the entire geochemical processes, including diffusion, between the bottom water and surface sediments. The nutrient diffusion flux was employed to design an elaborate mass balance model as one of the factors in the nutrient elution part. The diffusion coefficient, derived from the concentration difference between pore water and overlying water, was applied to calculate the nutrient diffusion flux based on Fick’s first law of diffusion [11,20,50,51].
where is the porosity (dimensionless) of surface sediments; DSED is the substance-specific effective diffusion coefficient (cm2/s); is the concentration gradient (mg/L cm−1) of the investigated nutrients at the bottom water–surface sediment interface; c is the constant (10−3 L/cm3 104 cm2/m2 24 × 3600 s/day) for unit conversion. A previous study in Gamak Bay [33] calculated according to Louchouam et al. [54].
where is the mean density (1.02 g/cm3) of pore water; is the mean density (2.65 g/cm3) of surface sediments; W is the water content (dimensionless) of surface sediments.
In addition, DSED for each nutrient substance in Equation (6) was calculated using diffusion coefficient (DSW) and tortuosity () from previous studies, and tortuosity was calculated from the porosity of the surface sediments [11,20,55]
where D0 is the diffusion coefficient at 0 °C (0.980 × 10⁻⁵ cm2/s for NH4+, 0.922 × 10⁻⁵ cm2/s for NO2−, 0.978 × 10⁻⁵ cm2/s for NO3−, 0.340 × 10⁻⁵ cm2/s for HPO42−) [11,56,57]; t is water temperature (24.0 °C); the cation and anion coefficients (a) were 0.048 and 0.040, respectively [58,59].
DSW = D0 × (1 + a × t)
2.8. A Mass Balance Model for Bottom Seawater–Surface Sediments Interface
The mass balance model for nutrients obtained from Klump and Martens [60] has been applied in several oceanographic studies in various coastal areas [19,33,34,35,61,62].
where Jin is the total depositional flux of substances to the bottom water–surface sediment interface; Jout is the flux of regenerated nitrogen or phosphorus released to the overlying water; Jbur is the burial flux of permanent sedimentation. According to the model, the system is assumed to be stabilized for more than 1 year due to seasonal remineralization rates and seasonal variation in the deposition [60]. In the study region, the intensity of hypoxia was frequently varied for 4 months, vertically and spatially (Figure S1) [9]. Although the GA4 remained in a fairly stable reducing environment, seasonality was not reflected because the hypoxic water was removed from October, 2017.
Jin = Jout + Jbur
Thus, a modified simple model, incorporating Equation (11), was suggested, applicable in short-term investigations. This model assumes the following;
- The system at the interface between the overlying water and surface sediments is under a stable condition, in which input and output fluxes are the same;
- The input flux indicates only the net substance deposition via gravity from the water column to the surface sediments;
- The output flux includes the biological process of decomposing organic particles and the chemical process at the interface under redox conditions;
- The remaining or supplemental fluxes function between the overlying water and surface sediments.
2.9. Statistical Analysis
Principal component analysis (PCA) and cluster analysis were performed to determine the characteristics of water masses affected by the bottom waters in Gamak Bay in the summer of 2017. Data were tested for normality using the Shapiro–Wilk test. The nutrient concentrations (NH4+, NO2−, NO3−, DIP) in the bottom water and pore water followed a normal distribution (p = 0.761 − 0.055 > 0.05) except for DIP in the pore water (p = 0.001 < 0.05). Therefore, the mean DIN and median DIP concentrations in the bottom seawater and surface sediments were compared via the paired t-test and Wilcoxon signed-rank test, respectively. Statistical analyses were executed through PASW statistics 18 of SPSS (SPSS Inc., Chicago, IL, USA).
3. Results
3.1. Spatial Distributions of Environmental Quality Parameters in Bottom Seawater and Surface Sediments in Gamak Bay, August 2017
The spatial distributions of bottom seawater quality parameters are illustrated in Table S1 and Figure 3 and Figure 4. The lowest WT and the highest SAL were observed in the center of northern Gamak Bay, which is deeper compared to other parts of the bay (Figure 3a,b). Anoxic waters, reflecting DO, showed a similar pattern to pH (Figure 3c,d), throughout the bay near Sunso (GA1), Najin, Hodu, and the center of the bay (GA3, GA4, and GA6). The H2S, DIP, and DSi were significantly high at GA4 (Figure 3e and Figure 4c,d). The NH4+ distribution was similar to other nutrients (Figure 3f), but the NO2− and NO3− concentrations increased toward the outer bay (GA9, GA10) (Figure 4a,b). High concentrations of Chl-a, SPM, and COD were found at GA4 as well as near Sunso (GA1) (Figure 4e–g). The OEI values were 2.2 and 16.5 at GA1 and GA4, respectively (Figure 5).
The spatial distribution of nutrients in the pore waters of the surface sediments showed similar patterns to those of bottom waters (Table S1 and Figure S2). The NH4+ and DIP concentrations were higher in the inner bay than those in the outer bay, while their concentrations were specifically high near Najin, Hodu, and in the center of the bay (GA3, GA4, GA6) (Figure S2a,b). The mean NH4+ (p = 0.0006 < 0.001; paired t-test), NO2− (p = 0.001 < 0.01; paired t-test), and median DIP concentrations (p = 0.005 < 0.01; Wilcoxon signed-rank test) in the pore waters were significantly higher than those in the bottom waters (Figure S2a,b,d). The NO3− concentration was not significantly different between the bottom waters and pore waters (p = 0.053 > 0.05; paired t-test; Figure S2c).
3.2. Defining Characteristics of Water Masses in Gamak Bay, August 2017 Using PCA and Cluster Analysis
Three principal components (PC) were extracted from PCA analysis with a cumulative contribution of 90.1% (Table S2, Figure 6). PC1 (37.8%) illustrated an environment in which DO, pH, and WT negatively contributed, while DIP, DSi, H2S, and NH4+ positively contributed (Figure 6a). PC2 (28.0%) exhibited negative contributions of SAL and water depth and positive contributions of pH, DO, and NO2− (Figure 6a). PC3 (24.3%) showed highly positive contributions of Chl-a and SPM (Figure 6b). Collectively, PC1 reflects the effects of the reducing condition due to anoxic water, PC2 the oxidation condition, and PC3 the phytoplankton blooms. Based on score plots (Figure S3) and cluster analyses (Figure 6c), water masses were classified into three groups. Group A consisted of sampling points GA2, GA3, and GA5–GA10, Group B GA1, and Group C GA4 (Figure 6d).
3.3. Net Substance Sinking Fluxes at GA4 in Gamak Bay, August 2017
The SPM fluxes were 17.6 and 14.1 g SPM/m2/d from the gross sinking and re-floating traps, respectively, and the re-floating rate was 80.1% of the gross sinking flux (Table 1). Net sinking fluxes, indicated by the difference between the gross sinking and re-suspended fluxes, were 861.0 mg C/m2/d, 187.9 mg N/m2/d, and 26.0 mg P/m2/d for POC, PON, and POP, respectively. The flux from the re-floating trap relative to that from the sinking trap was 43.8% for POC and 32.6% for PON and POP. This indicates that the resuspension flux of substances is not negligible across the coastal bottom water–surface sediment interface.
3.4. SOD Flux at the Bottom Seawater–Surface Sediments Interface at GA4 in Gamak Bay, August 2017
As observed, DO concentration declined from the initial 6.85 mg/L (DO saturation 98.1%) (Figure 7). It continuously decreased, was relatively stable for 18 h, and reached 4.37 mg/L (DO saturation 62.8%) in 36 h after the experiment termination. The SOD20 flux (i.e., SOD flux at 20 °C) sharply increased after 4 h of post-incubation and reached the maximum flux (13,138.9 g O2/m2/d) after 12 h. The SODT and SOD20 fluxes were 3938.7 mg O2/m2/d (123.1 mmol/m2/d), and 3047.2 mg O2/m2/d (95.5 mmol/m2/d), respectively.
3.5. Nutrient Elution and Diffusion Fluxes at the Bottom Seawater–Surface Sediments Interface at GA4 in Gamak Bay, August 2017
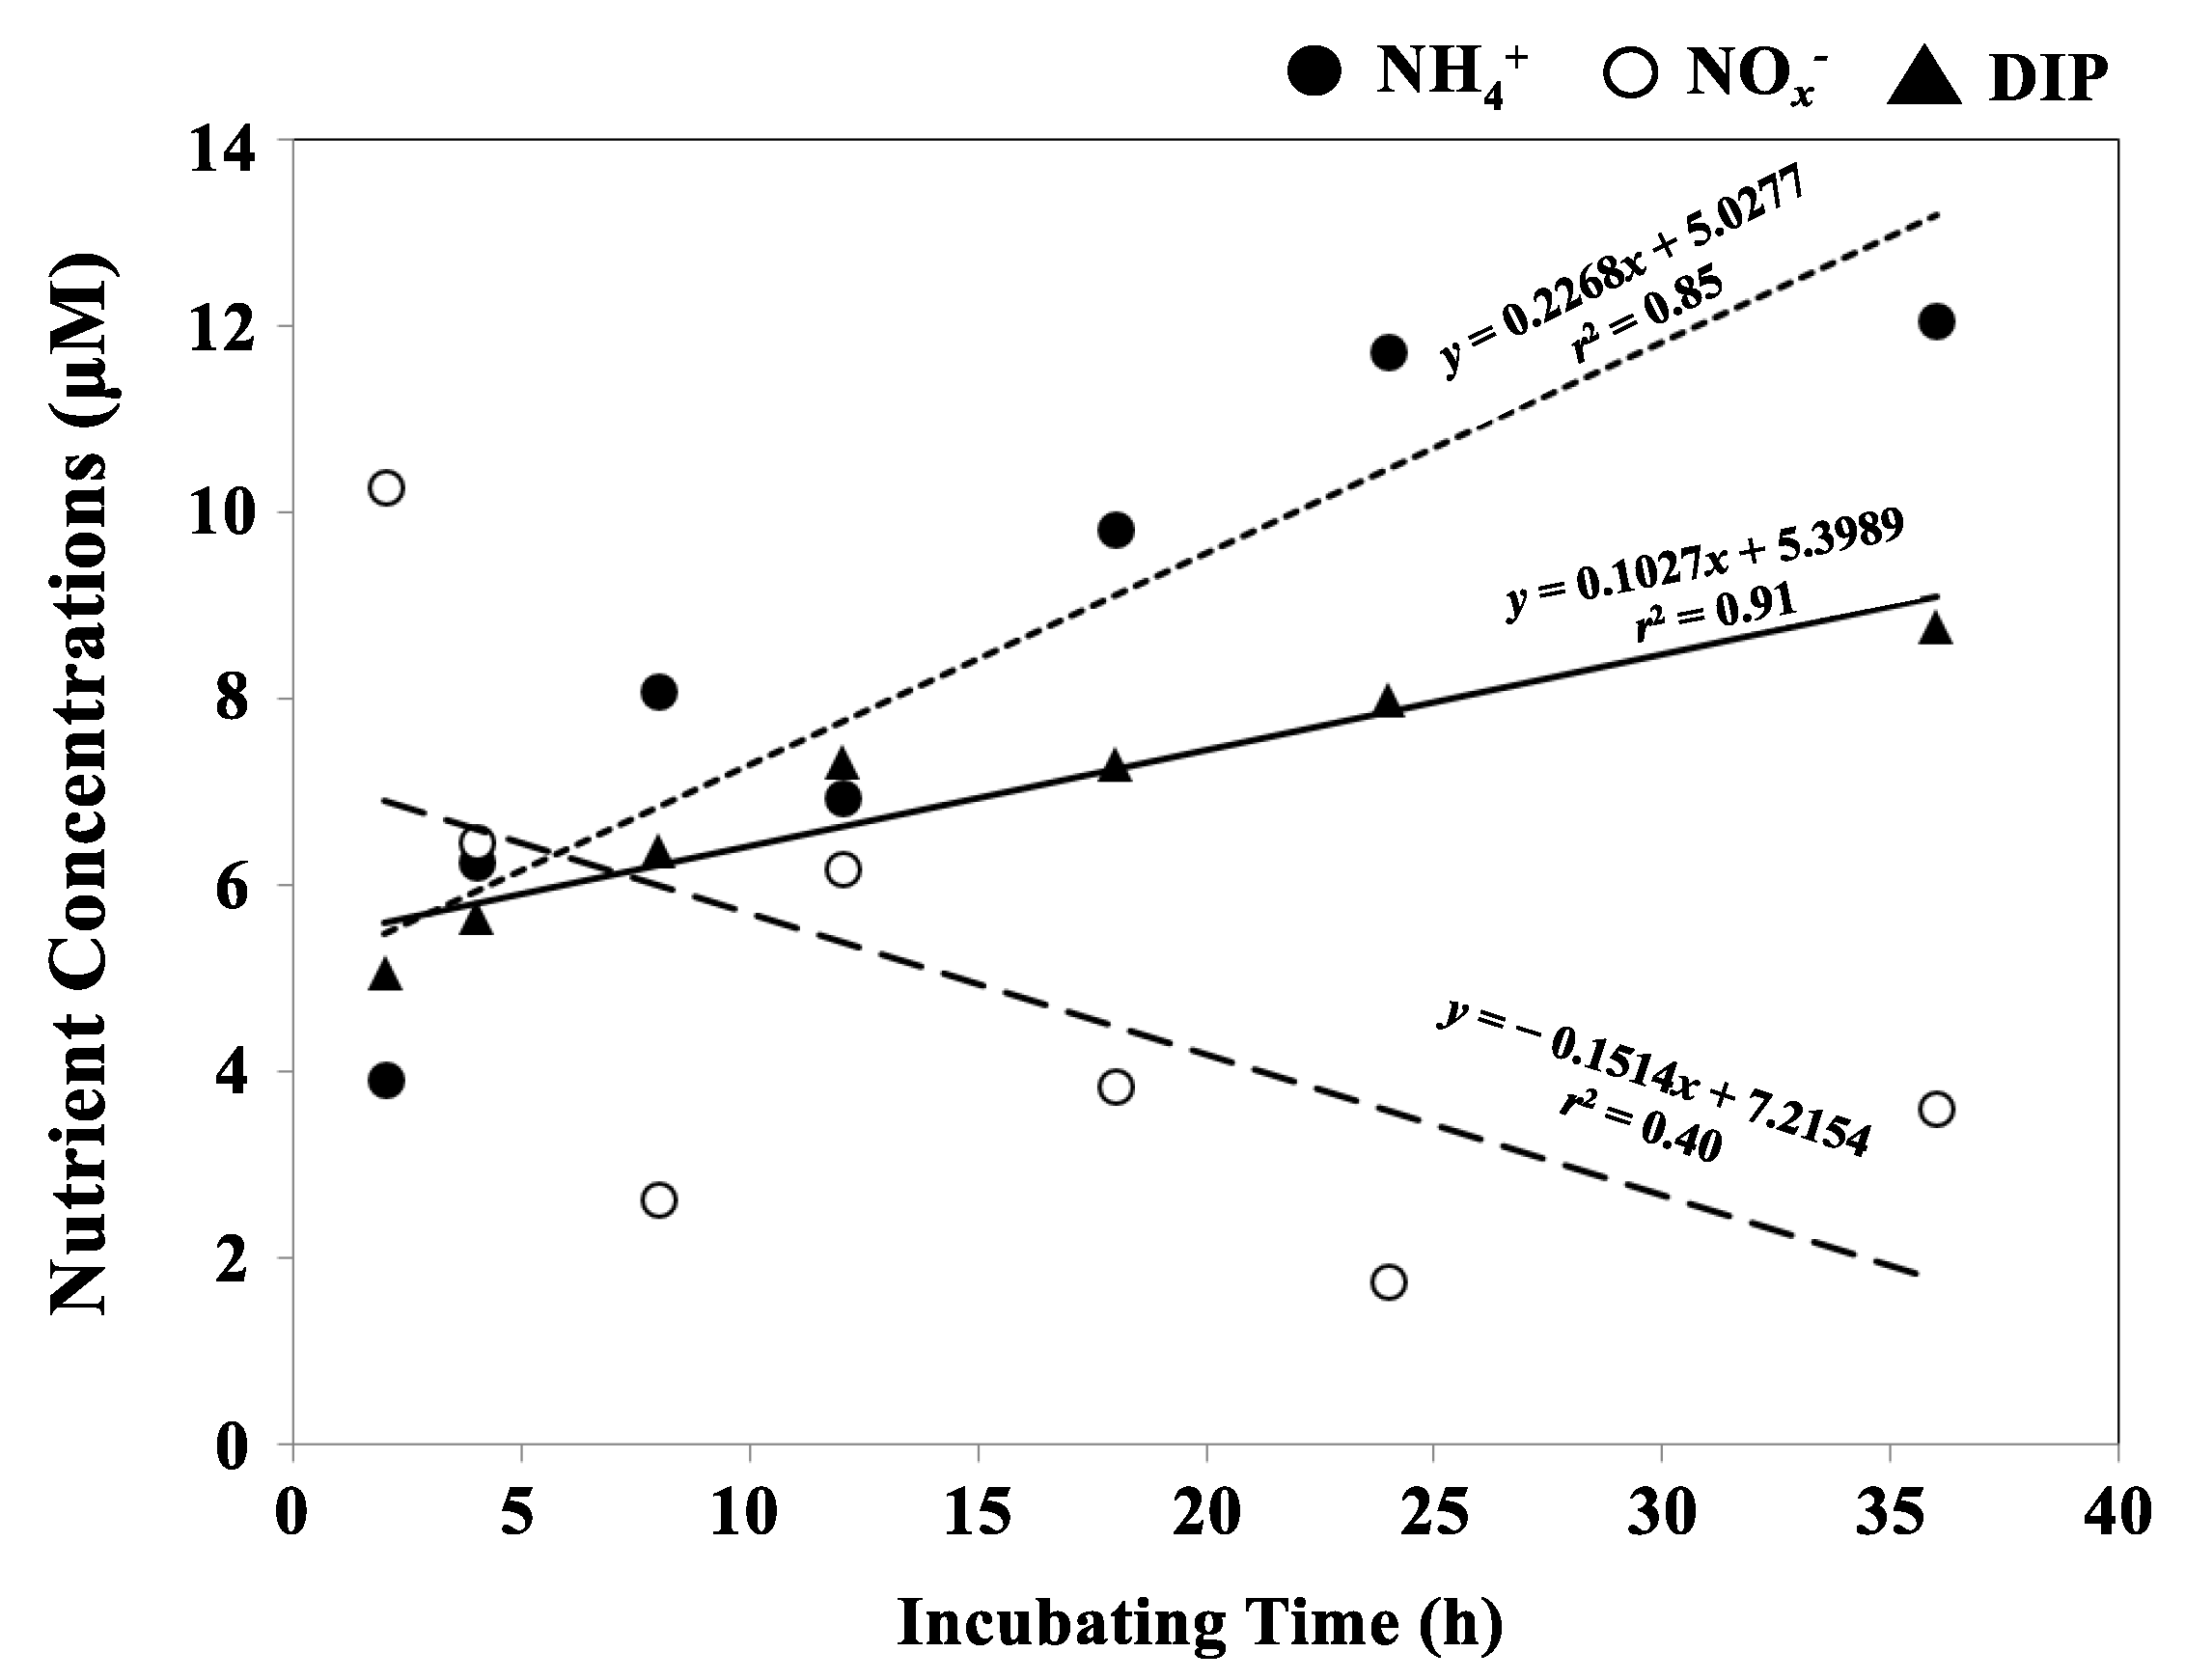
Nutrient elution fluxes were obtained from experiments performed under anaerobic conditions. The NH4+ (r2 = 0.85) and DIP (r2 = 0.91) concentrations in the overlying water increased with the incubation time, but the NOx− (i.e., NO2− + NO3−; r2 = 0.40) concentration decreased sharply (Figure 8). The nutrient elution fluxes were one or two orders of magnitude higher fraction than the nutrient diffusion fluxes in this study (Table 2).
4. Discussion
4.1. Characteristics of Bottom Seawater in Gamak Bay in August 2017
GA1 belonging to Group B showed fewer effects of the reducing environment due to anoxic waters (PC1), had an oxidation environment (PC2), and was characterized by phytoplankton blooms (PC3) (Figure 6). The spatial distribution showed that the SAL in GA1, located near point/non-point sources of Sunso with a shallow depth (Figure 1), was higher than those in the outer bay (GA9, GA10) (Figure 3b). The vertical profiles (Figure S1) indicated that heavy rainfall (151.1 mm on 11–15 August, 2017) prior to the sampling on 16 August led to low SAL throughout the bay surface and formed a strong halocline, thereby causing a steady water column from the inner bay near Sunso (GA1) to the central bay (GA3–GA7) [9]. In June, eutrophic indicators observed for Sunso (GA1) surface sediments were 5.2–8.8% of loss on ignition (LOI), 32.1–32.6 mg/g-dw. of COD, 3.98–4.36 mg S/g-dw. of acid volatile sulfide (AVS), and 4.0–6.2% of total organic carbon [10]. This organic matter in the surface sediments was mainly terrestrial-derived (C/N ratio > 12); the levels exceeded the environmental guideline values and require purification [10]. Terrestrial organic matter, introduced to the inner bay through the point/non-point sources, caused the formation of hypoxic bottom waters in Sunso (GA1). The strong stratification driven by the halocline enabled the hypoxia to persist [9,13,36]. Consistent with the previous studies, our results showed that a hypoxic water mass (2.5 mg/L of DO) was formed near Sunso (GA1), with 0.03 mg/L of H2S and 3.4 μM of NH4+, indicating a reducing environment.
Although GA1 was characterized by the reducing conditions, concentrations of oxidation parameters such as NO2− (0.3 μM) and NO3− (2.1 μM) were relatively high compared to those in adjacent waters (Figure 4a,b). This might be associated with the incomplete reduction or the variation in hypoxic intensity due to factors such as meteorological conditions, relatively shallow water depth (4 m), daily tidal effects, and neap/spring tides [9,13,36,39]. For example, the DO concentration of bottom waters at GA1 was 6.95 mg/L on 8 August [9], but it was 2.5 mg/L a week later. Thus, it appears that reducing and oxidation environments occurred simultaneously.
Additionally, the shallow depth allows light penetration to the seafloor, and the OEI of 2.2 indicated that GA1 was eutrophic. Optimal light intensity and eutrophic conditions might synergistically promote phytoplankton blooms (10 μg/L of Chl-a). This level exceeded 5.5 μg/L–one of the parameters for the very poor water quality (Class 5)–according to the Korean water quality index [9].
Further, hypoxia occurred in the western region of the bay around Soho, Hodu, and Najin (GA3, GA4, GA6, GA7), but the effects of the reducing environment, driven by the anoxic condition, dominated only at GA4 (Figure 6). Relatively higher NOx− concentrations were found at GA7 (2.9 mg/L DO, 0.2 μM NO2−, 2.1 μM NO3−) and GA 8 (2.8 mg/L DO, 0.2 μM NO2−, 2.7 μM NO3−) than those in the adjacent waters, with hypoxic waters at GA1 (2.5 mg/L DO, 0.3 μM NO2−, 2.1 μM NO3−). Although the intensity and duration of hypoxia varied widely because of various causes [9,13], hypoxia, which lasted for 4 months at GA4 in 2017, further reduced the DO levels to anoxia (Figure S1) [9]. Our data provide a snapshot of environmental conditions. Thus, it is reasonable to assume causality based on ecological consequences, but assessment of long-term variations in hypoxia and anoxia are necessary for a firm conclusion.
This study found high concentrations of H2S, DIN, DIP, and DSi in the bottom water collected from GA4, consistent with previous studies [12,66]. The OEI was 16.5, indicative of severe eutrophication. In addition, the light extinction coefficient is relatively low in Gamak Bay compared to the other bays, and the sufficient radiation promotes a bloom of benthic diatoms [13,37]. The observed Chl-a was 4.8 μg/L at GA4, but it was recorded as high as 100 μg/L, according to a previous study [13]. The proliferation of phytoplankton was associated with the sufficient lights and eluted nutrients in the anoxic environment, thereby linking to the DO consumption in the bottom water [9,13].
At GA4, the SOD20 flux was 3047.2 mg O2/m2/d (95.5 mmol O2/m2/d). This was lower than that in other marine ecosystems, such as coastal waters with the high accumulation of organic matter—e.g., Barnegat Bay, NJ, USA (0.21–5.94 g O2/m2/d) [21], fish farms in the Bolinao area, Philippines (61–337 mmol/m2/d) [67], and fish farms in Loch Creran, Scotland (435 mmol/m2/d) [68].
The SOD20 flux was approximately 5 to 10 times higher than SOD fluxes in six southern coastal areas of Korea (Deukrang Bay, Koheung, Yeoja Bay, Kwangyang Bay, Yeosu, Namhae) (10.8–27.6 mmol O2/m2/d) with similar characteristics as Gamak Bay [33]. This indicates that the hypoxic and anoxic waters accompanying the eutrophication are significantly developed in this bay. Oysters (C. gigas), the primary fishery resource in Gamak Bay, stop the shell movement below 2 mg/L of DO [69]. The LC50 (i.e., 50% lethal concentration) of benthic organisms was reported to be 1.54 mg/L in fishes, 2.45 mg/L in crustaceans, 0.89 mg/L in gastropods, and 1.42 mg/L in bivalves [70]. The hypoxic waters accompanying eutrophic surface sediments in Gamak Bay caused changes in the population of macrobenthic polychaetes [71] and zooplankton [72], ASR (aquatic surface respiration) behavior of oriental gobies (A. flavimanus), and massive mortality of oriental gobies, crab, and gastropods [36].
Notably, benthos in the surface sediments was not found from July 2017 at GA4, and this non-living condition was continued until the hypoxic waters disappeared in October [49]. This implies that although the DO was supplied to the bottom waters when the reducing environment was switched to the oxidative environment, the eutrophic surface sediment continuously affected the benthic ecology [49]. The eutrophication driven by the regeneration of organic matter from the surface sediments under the reducing condition sharply increases the phytoplankton abundance [9] and changes its community composition [13]. Therefore, determining C, N, and P mass balances are significant because the eutrophic water, driven by the reducing environment, plays a critical role as the nutrient source for organic matter cycles (i.e., phytoplankton blooms) at GA4.
4.2. C, N, and P Mass Balances under the Effects of the Reducing Environment due to Anoxic Water in Gamak Bay in August 2017
The estimated C, N, and P mass balances for GA4 are illustrated in Figure 9. Carbon cycles are primarily related to the remineralization of organic matter, accompanied by DO consumption and carbon sequestration to the deep sea [73]. The dissolved inorganic carbon is converted to POC as a consequence of phytoplankton blooms; the POC sinks to the deep sea via the biological carbon pump as part of the marine carbon cycle [74]. In the mass balance for organic carbon (Figure 9a), the ratio of re-floating to sinking C fluxes was 0.44. This indicates that the considerable flux of organic carbon was resuspended to the water column and the resuspension was an essential process in the carbon cycle of coastal waters. This is consistent with Kim [73], who reviewed the mean proportion of 25% shown in the 150 global marine sediment trap studies.
Net sinking POC flux (861.0 mg C/m2/d) differed from organic carbon Fluxout (1134.5 mg C/m2/d), estimated using SODT flux. The additional flux of 273.5 mg C/m2/d (31.8% of the organic carbon Fluxout) acted as the decomposition from the surface sediments to the overlying water. During the sampling period, the contents of eutrophic indicators in the surface sediments at GA4 were 11% LOI, 20.8 mg/g-dw. COD, and 0.578 mg S/g-dw. AVS [10]. The ΔFlux/Fluxin rate of POC was 0.32, indicating that an origin of organic matter causing hypoxia or anoxia in Gamak Bay [10]. Unlike the region near Sunso (GA1), where terrestrial organic matter dominated, the C/N ratio of the surface sediments implied the prevalence of oceanic organic matter at GA4 [10]. Thus, eutrophication-driven phytoplankton blooms and organic matter transported from the adjacent aquaculture farms might affect the study region [71]. The oxidation rate of organic carbon was 1.32, consistent with previous studies showing that high oxidation rates were found when organic matter is rapidly exported to the surface sediment in shallow waters [33,75].
In nitrogen cycles, organic matter is regenerated via ammonification under oxidation, and then nitrification induces NO3− production [25]. However, under the anoxic condition, NOx− is converted to N2 gas through denitrification, and NH4+ is produced due to ammonification and DNRA using NO2− [23,50,76]. The NH4+ is accumulated in pore water and released into the overlying water, but the released NH4+ is removed at the diffusivity boundary layer [33,50]. Our ex situ incubating experiments ascribed that the bottom waters in Gamak Bay remained anaerobic, inhibiting the oxidation of NH4+ and inducing NH4+ elution (Figure 8). Additionally, Fick’s first law of diffusion estimates only the molecular diffusion [11,58], and the nutrient diffusion fluxes, estimated using this law (Table 2), were applied as the calibration function for DIN and DIP elution fluxes of incubation experiments in the mass balance model design in this study.
As a result of the N mass balance (Figure 9b), the DIN elution flux was 29.6 mg N/m2/d, including 5.85 mg N/m2/d of DIN diffusion flux. The extra elution flux (23.8 mg N/m2/d) represented the ammonification and DNRA of NH4+ and the denitrification of NOx−. The estimation result of the DIN diffusion flux showed that both NH4+ and NOx− were diffused from high levels of those in the pore water (248.2 μM NH4+, 4.5 μM NOx−) to the bottom water (5.3 μM NH4+, 2.7 μM NOx−) (Table S1).
The portion of the DIN diffusion flux related to the DIN elution flux except for the diffusion process was 24.6%, i.e., DIN diffusion flux/(total DIN elution flux − DIN diffusion flux). This implies that the geochemical processes under the reducing environment, such as DNRA, ammonification, and denitrification, at the interface were approximately four times stronger than the diffusion from the surface sediment. The NH4+ was the dominant nutrient in the DIN elution and diffusion fluxes in this area. This is a representative phenomenon of the reducing condition, changing the biogeochemical nutrient cycles of the general oxidation environment [11,18,19,20,21]. Additionally, the DIN elution flux contributed only 15.8% of the net sinking PON flux, and it was estimated that the 158.3 mg N/m2/d of ΔFlux functioned as the remaining flux in the surface sediments. The deposited organic nitrogen acts as the accelerating factor of eutrophication in the surface sediments [10].
Under the oxidation condition, the re-mineralized P is removed from the overlying water to the surface sediments by adsorption and co-precipitation into Fe(III)OOH [50,51]. On the contrary, under the reducing condition, binding the iron oxyhydroxide and PO43− is dissociated and transferred to the overlying water [11,29]. This process occurs at −50 mV (pH 7) or −100 mV (pH 8) of oxidation–reduction potential (ORP, Eh) depending on pH and compound concentrations [77]. The ranges of ORP at GA4 were reported from −169 mV to −204 mV [78], indicating that the DIP elution flux included the inorganic phosphorous (IP) accumulation by iron oxyhydroxide dissociation (Figure 9c). In the meantime, the H2S that is produced by sulfate-reducing bacteria can bind to iron, forming FeS or FeS2, and this reaction further inhibits the binding of iron oxyhydroxide to IP [11,22].
In the P mass balance (Figure 9c), 46.7 mg P/m2/d of DIP elution flux with the DIP diffusion flux of 0.2 mg P/m2/d was released from the surface sediment, and this elution flux was responsible for 179.5% of net sinking DIP flux (26.0 mg P/m2/d). The estimation result of DIP diffusion flux shows that the DIP was diffused from high levels of those in the pore water (16.2 μM) to the bottom water (3.1 μM) (Table S1).
Similarly, the portion of the DIP diffusion flux related to the DIP elution flux except for the diffusion process was 0.4%, i.e., DIP diffusion flux/(total DIP elution flux − DIP diffusion flux). This implies that the diffusion was a considerably restrained process compared to the regeneration and Fe(III) reduction at the interface. Notably, 20.7 mg P/m2/d of ΔFlux, which indicates the deposited organic matter and dissociation of iron oxyhydroxide, was supplementary functioned from the surface sediments to the overlying water. The N/P ratio in the bottom water ranged from 2.6 to 5.9 (average 4.0 ± 1.2). The lowest N/P ratio at GA4 implied that the DIP elution under the reducing environment remarkably occurred in GA4 compared to the other sampling points.
Other Gamak Bay studies have provided computed estimation results using the eco-hydrodynamic model [79] and the ex situ elution experiment results from surface sediment [80] in the early 2000s. The computed remineralization flux was above 10 mg/m2/day for DIN, 1.0–3.0 mg/m2/day for DIP [79], and the elution fluxes in the ex situ experiment were 5.60 mg/m2/day for NH4+ and 4.68 mg/m2/day for DIP [80]. However, the DO values applied to the model indicates Gamak Bay was in the oxidation environment back then [79], and there was no record of DO in the ex situ elution experiment [80]. This implies that the previous study reported conditions different from a case in the reducing environment, which is determined in our study.
Recent hypoxia is more rapid and strongly occurring than it was 10 years ago [9,13]. The current eutrophication under the reducing environment may be more accelerated than it was in the past. The acceleration is also expedited depending on abnormal climate changes, such as global warming [9], because the WT is a dominant parameter of nutrient elution [32,50,51] and stratification in the water column [9,14].
The DIN and DIP Fluxout/Fluxin ratios, showing the remineralization rate in the oxidation, were 0.16 and 1.80, respectively. In Tongyong Fishery farm, 17% of N and 27% of P were re-mineralized [35]. The case of nitrogen was consistent with this study, while this study observed a considerably high fraction of DIP elution flux under the reducing condition. Phosphorous in the surface sediments at Gamak Bay comprised 64% of NAI-P (non-apatite inorganic P), 25% of residual-P associated with organic matter, 8% of P absorbed to particles, and 4% of apatite P [66]. A high portion of labile P (NAI-P + absorbed-P), vulnerable to hypoxia/anoxia, pH, and ORP, is expected to induce the high fraction of DIP elution flux.
Meanwhile, there are previous reports on the DIN elution flux in the Korean coastal areas, such as the enclosed characteristic Jinhae Bay (7.9 mmol/m2/d) [63], the wart sea squirt farms in Jindong Bay (NH4+, 11.13 mmol/m2/d) [34], the fish farms in Baekya Island, Yeosu City (3.74 mmol/m2/d) [62], and the oyster and sea squirt farms in Tongyeong Bay (7.0 and 9.3 mmol/m2/d) [64]. The results on the DIP elution flux are from in Jinhae Bay (0.49 mmol/m2/d) [63], Jindong Bay (−0.13 mmol/m2/d) [34], Yeosu City (0.18 mmol/m2/d) [62] and Tongyeong Bay (0.44 and 0.58 mmol/m2/d) [64]. Although the DIN elution flux (2.1 mmol/m2/d) in this study was lower than those in other dense fishery farms [32,62,63,64], the DIP elution (1.5 mmol/m2/d) was considerably higher than those in the farms [32,62,63,64]. This reflects that the labile-P contents in the surface sediments were significantly high in Gamak Bay relative to the adjacent bays [66].
Our study highlights the current mass balances of C, N, and P at the bottom water– surface sediment interface under the reducing environment using the mass balance model elaboratively designed to apply in a short-term period with elution fraction, including the diffusion factor. The statistical results and systematic experiments supported the objective evidence to estimate the mass balances in the reducing environment. The results showed that the nutrient elution under the reducing environment due to anoxic water mass is regarded as a significant source of the highly eutrophic bottom water in Gamak Bay [61]–particularly phosphorus, as shown by the OEI value of 16.5.
However, a ΔFlux variation in Equation (12) denotes the variation of substance flux in the short term, and it is unknown what process the remaining nitrogen are undergoing in the surface sediments after the anoxic condition is removed. Thus, determining the nutrient mass balance before and after the reducing environment is also essential. In addition, the urban sewer pipes and aquaculture farms are also the major players in causing eutrophication in Gamak Bay [9,10,39]. Additionally, replicated sampling, current mass balances between the surface and bottom waters, excessive nutrient loading, and residence time of introduced nutrients should be examined to protect aquaculture organisms and marine organisms living in the bay and conserve the marine ecosystem and resources in Gamak Bay.
Since 2005, a wastewater treatment plant has been operating near Gamak Bay to collect the urban sewage, but sewer pipes still act as point sources near the Sunso area (Figure 1) [10]. The sewer pipes connecting to storm sewer pipes, designed as the combined sewer overflows, can be non-point sources when it rains [9]. Moreover, there are aquaculture farms for bivalves, fishes, and seaweed, and the shellfish production from this bay reaches 8300 tons/yr [39]. Interestingly, oligotrophic surface water is one of the main reasons for the decrease in annual oyster production [39,81]. These oligotrophic surfaces are contrary to the eutrophication in the bottom water and surface sediment [9,10,79,81]. Two decades ago, a study computed the nutrient transfer data depending on water layer [79]; however, it is difficult to reflect the current Gamak bay condition, as mentioned above. Lee [39] proposed that future environmental studies should combine engineering perspectives to solve the current problems in the bay (e.g., production of fishery resources). Therefore, studies on current eutrophication in the Gamak bay are significant in contributing to this aspect.
5. Conclusions
This study estimated the quantified current C, N, and P mass balances (Fluxin = Fluxout + Flux) of the bottom water–surface sediment interface in a reducing environment due to anoxic water. As of August 2017, the bottom water condition was categorized into three groups, including Group C based on effects of the reducing environment due to anoxia. In the anoxic environment at GA4 (Group C), the SOD20 flux was 3047.2 mg O2/m2/d, which is a considerably high estimation in the Korean marine environment. The results of the C mass balance emphasized that the considerable flux of organic carbon was resuspended. The NH4+ elution process was predominant in the N mass balance, representing the reducing environment. The DIN diffusion flux was approximately four times lower than the DNRA, ammonification, and denitrification. However, the DIP diffusion flux was restrained compared to the other DIP elution process, such as regeneration and Fe(III) reduction. Notably, the DIP elution flux estimated in this study was significantly higher than those of the other Korean coastal sea areas because of the high portion of labile P type in Gamak Bay, Korea. The ∆Flux in C and P mass balances indicated the supplementary flux from the surface sediment toward the bottom water. Contrary to this, the ∆Flux in the N mass balance indicated depositing the PON flux and accelerating the eutrophication on the surface sediments. Collectively, our study highlights that the nutrient elution under reducing environments acts as the primary nutrient source to accelerate eutrophication, particularly P, in benthic ecosystems in Gamak Bay. The previous nutrient mass balance studies had limitations in reflecting the current environmental situation under the reducing environment in the bay. The studies on eutrophication in the bay are expected to be carried out in the future. The present study provides insights into managing the marine ecology of the bay in the aspect of eutrophication in the bottom water and surface sediments.
Supplementary Materials
The following supporting information can be downloaded at: https://www.mdpi.com/article/10.3390/w14142244/s1. Figure S1. The sampling areas in Gamak Bay, Korea by Jeong et al. (2021), Journal of the Korean Society of Marine Environment & Safety, 27(6):708-720., and results of the vertical Water Temperature (WT), Salinity (SAL), Dissolved Oxygen (DO) distributions on August 16th, 2017, and the spatial DO distributions in the bottom seawater from May to October 2017. Figure S2. The spatial distributions (a) ammonia-nitrogen, (b) nitrite-nitrogen, (c) nitrate-nitrogen, (d) Dissolved Inorganic Phosphate (DIP) in the porewater of surface sediments in Gamak Bay, Korea, August 2017. Figure S3. The score plots of Principal Component Analysis (PCA) results. The sampling stations were grouped using the Cluster analysis results. Table S1. Results of bottom seawater and porewater parameters in Gamak Bay, Korea, August 2017. Table S2. Results of Principal Component Analysis (PCA) using dependent variations as bottom seawater parameters, Gamak Bay, Korea, August 2017.
Author Contributions
Conceptualization, H.C.; methodology, H.J. and H.C.; software, H.J.; validation, H.J. and H.C.; formal analysis, H.J.; investigation, H.J. and H.C.; resources, H.C.; data curation, H.J. and H.C.; writing—original draft preparation, H.J. and Y.K.; writing—review and editing, H.J. and Y.K.; visualization, H.J.; supervision, H.C.; project administration, H.C.; funding acquisition, H.C. All authors have read and agreed to the published version of the manuscript.
Funding
This research was funded by National Institute of Fisheries Science (NIFS), grant number R2017032.
Institutional Review Board Statement
Not applicable.
Informed Consent Statement
Not applicable.
Data Availability Statement
Not applicable.
Acknowledgments
This study was supported by grants from the Ministry of Oceans and Fisheries (MOF) and National Research Foundation (NRF), Korea. The authors wish to appreciate entire stakeholders, professors, and laboratory students at Chonnam National University, who commented on enhancing data quality and were dedicated to amicable research progress.
Conflicts of Interest
The authors declare no conflict of interest.
References
- US EPA. Basic Information about Nonpoint Source (NPS) Pollution. Available online: https://www.epa.gov/nps/basic-infor-mation-about-nonpoint-source-nps-pollution (accessed on 8 July 2021).
- Lu, D.; Huang, X.; Yang, B.; Dan, S.F.; Kang, Z.; Zhou, J.; Lao, Y.; Zhong, Q.; Wu, H. Composition and Distributions of Nitrogen and Phosphorus and Assessment of Eutrophication Status in the Maowei Sea. J. Ocean Univ. China 2021, 20, 361–371. [Google Scholar] [CrossRef]
- Morsy, A.; Ebeid, M.; Soliman, A.; Halim, A.A.; Ali, A.; Fahmy, M. Evaluation of the water quality and the eutrophication risk in Mediterranean Sea area: A case study of the Port Said Harbour, Egypt. Environ. Chall. 2022, 7, 100484. [Google Scholar] [CrossRef]
- Takasu, H.; Uchino, K. Nutrient regeneration from riverine high-molecular-weight dissolved organic matter through marine bacterial decomposition in a eutrophic coastal system: The Ariake Sea, Japan. J. Sea Res. 2021, 177, 102114. [Google Scholar] [CrossRef]
- Wang, B.; Xin, M.; Wei, Q.; Xie, L. A historical overview of coastal eutrophication in the China Seas. Mar. Pollut. Bull. 2018, 136, 394–400. [Google Scholar] [CrossRef]
- Baohong, C.; Kang, W.; Xu, D.; Hui, L. Long-term changes in red tide outbreaks in Xiamen Bay in China from 1986 to 2017. Estuar. Coast. Shelf Sci. 2021, 249, 107095. [Google Scholar] [CrossRef]
- Kim, T.H.; Chae, C.U. Environmental impact analysis of acidification and eutrophication due to emissions from the production of concrete. Sustainability 2016, 8, 578. [Google Scholar] [CrossRef] [Green Version]
- Tsutsumi, H.; Takamatsu, A.; Nagata, S.; Orita, R.; Umehara, A.; Komorita, T.; Shibanuma, S.; Takahashi, T.; Komatsu, T.; Momtani, S. Implications of changes in the benthic environment and decline of macro-benthic communities in the inner part of Ariake Bay in relation to seasonal hypoxia. Plankton Benthos Res. 2015, 10, 187–201. [Google Scholar] [CrossRef] [Green Version]
- Jeong, H.; Choi, S.-D.; Cho, H.-S. Characteristics of hypoxic water mass occurrence in the Northwestern Gamak Bay, Korea, 2017. J. Korean Soc. Mar. Environ. Saf. 2021, 27, 708–720. [Google Scholar] [CrossRef]
- Jeong, H.; Kang, S.; Jung, H.; Jeong, D.; Oh, J.; Choi, S.; An, Y.; Choo, H.; Choi, S.; Kim, S.; et al. The current status of eutrophication and suggestions of the purification & restoration on surface sediment in the northwestern Gamak bay, Korea, 2017. J. Korean Soc. Mar. Environ. Energy 2019, 22, 105–113. [Google Scholar]
- Graca, B.; Witek, Z.; Burska, D.; Białkowska, I.; Łukawska-Matuszewska, K.; Bolałek, J. Pore water phosphate and ammonia below the permanent halocline in the south-eastern Baltic Sea and their benthic fluxes under anoxic conditions. J. Mar. Syst. 2006, 63, 141–154. [Google Scholar] [CrossRef]
- Lee, T. Sediment Oxygen Consumption Rate and Hydrogen Sulfide Release by Dissolved Oxygen Depletion in Hypoxic Area of the Gamak Bay, Korea. J. Wet. Res. 2015, 17, 293–302. [Google Scholar] [CrossRef] [Green Version]
- Kim, J.-B.; Lee, S.-Y.; Yu, J.; Choi, Y.-H.; Jung, C.-S.; Lee, P.-Y. The characteristics of oxygen deficient water mass in Gamak Bay. J. Korean Soc. Mar. Environ. Energy 2006, 9, 216–224. [Google Scholar]
- Kim, S.; Hayami, Y.; Tai, A.; Tada, A. The mechanism of bottom water DO variation in summer at the northern mouth of Isahaya Bay, Japan. J. Oceanogr. 2018, 74, 595–605. [Google Scholar] [CrossRef]
- Orita, R.; Umehara, A.; Komorita, T.; Choi, J.W.; Montani, S.; Komatsu, T.; Tsutsumi, H. Contribution of the development of the stratification of water to the expansion of dead zone: A sedimentological approach. Estuar. Coast. Shelf Sci. 2015, 164, 204–213. [Google Scholar] [CrossRef]
- US EPA. Hypoxia in the Gulf of Mexico and Long Island Sound. Available online: https://cfpub.epa.gov/roe/indicator.cfm?i=41 (accessed on 15 April 2022).
- National Institute of Fisheries Science, Korea. Forecast·Breaking News/Abnormal Sea State. Available online: https://www.nifs.go.kr/dokdo/bbs?id=seastate&flag=lis (accessed on 22 April 2022).
- Lee, J.S.; Kim, K.H.; Kim, S.S.; Jung, R.H.; Kim, K.Y.; Park, J.S.; Lee, P.Y.; Lee, Y.S.; Choi, W.J.; Park, Y.C. The assessment of trophic state and the importance of benthic boundary layer in the southern coast of Korea. J. Korean Soc. Oceanogr. 2004, 9, 179–195. [Google Scholar]
- Lee, J.S.; Bahk, K.-S.; Khang, B.-J.; Kim, Y.-T.; Bae, J.-H.; Kim, S.-S.; Park, J.-J.; Choi, O.-I. The development of a benthic chamber (Belc I) for benthic boundary layer studies. J. Korean Soc. Oceanogr. 2010, 15, 41–50. [Google Scholar]
- Lengier, M.; Szymczycha, B.; Brodecka-Goluch, A.; Kłostowska, Ż.; Kuliński, K. Benthic diffusive fluxes of organic and inorganic carbon, ammonium and phosphates from deep water sediments of the Baltic Sea. Oceanologia 2021, 63, 370–384. [Google Scholar] [CrossRef]
- Wilson, T.; DePaul, V. In Situ Benthic Nutrient Flux and Sediment Oxygen Demand in Barnegat Bay, New Jersey. J. Coast. Res. 2017, 78, 46–59. [Google Scholar] [CrossRef]
- Hyun, J.-H.; Lee, H.K.; Kwon, K.K. Sulfate Reduction in the Marine Environments: Its Controlling Factors and Relative Significance in Mineralization of Organic Matter. J. Korean Soc. Oceanogr. 2003, 8, 210–224. [Google Scholar]
- Herbert, R.A. Nitrogen cycling in coastal marine ecosystems. FEMS Microbiol. Rev. 1999, 23, 563–590. [Google Scholar] [CrossRef]
- Hines, D.E.; Lisa, J.A.; Song, B.; Tobias, C.R.; Borrett, S.R. Estimating the effects of seawater intrusion on an estuarine nitrogen cycle by comparative network analysis. Mar. Ecol. Prog. Ser. 2015, 524, 137–154. [Google Scholar] [CrossRef] [Green Version]
- Zerkle, A.L.; Poulton, S.W.; Newton, R.J.; Mettam, C.; Claire, M.W.; Bekker, A.; Junium, C.K. Onset of the aerobic nitrogen cycle during the Great Oxidation Event. Nature 2017, 542, 465–467. [Google Scholar] [CrossRef] [PubMed] [Green Version]
- Camargo, J.A.; Alonso, Á. Ecological and toxicological effects of inorganic nitrogen pollution in aquatic ecosystems: A global assessment. Environ. Int. 2006, 32, 831–849. [Google Scholar] [CrossRef] [PubMed]
- Higa, H.; Koibuchi, Y.; Kobayashi, H.; Toratani, M.; Sakuno, Y. Numerical Simulation and Remote Sensing for the Analysis of Blue Tide Distribution in Tokyo Bay in September 2012. J. Adv. Simulat. Sci. Eng. 2015, 2, 1–15. [Google Scholar] [CrossRef] [Green Version]
- Yao, W.; Millero, F.J. Oxidation of hydrogen sulfide by hydrous Fe(III) oxides in seawater. Mar. Chem. 1996, 52, 1–16. [Google Scholar] [CrossRef]
- Sundby, B.; Gobeil, C.; Silverberg, N.; Alfonso, M. The phosphorus cycle in coastal marine sediments. Limnol. Oceanogr. 1992, 37, 1129–1245. [Google Scholar] [CrossRef]
- Barbosa, J.S.B.; Bellotto, V.R.; da Silva, D.B.; Lima, T.B. Nitrogen and phosphorus budget for a deep tropical reservoir of the Brazilian Savannah. Water 2019, 11, 1205. [Google Scholar] [CrossRef] [Green Version]
- Jung, H.-Y.; Cho, K.-J. Environmental conditions of sediment and bottom waters near sediment in the downstream of the Nagdong River. Korean J. Ecol. Environ. 2003, 36, 311–321. [Google Scholar]
- Kim, T.H.; Jung, J.H.; Choi, S.H.; Choi, I.S.; Oh, J.M. Physicochemical Characteristics and Nutrient Release from Sediment in an Urban Stream. Ecol. Resil. Infrastruct. 2015, 2, 167–176. [Google Scholar] [CrossRef] [Green Version]
- Lee, J.S.; Kim, K.-H.; Yu, J.; Jung, R.-H.; Ko, T.-S. Estimation of oxygen consumption rate and organic carbon oxidation rate at the sediment/water interface of coastal sediments in the South Sea of Korea using an oxygen microsensor. J. Korean Soc. Oceanogr. 2003, 8, 392–400. [Google Scholar]
- Park, J.; Cho, Y.; Lee, W.-C.; Hong, S.; Kim, H.-C.; Kim, J.-B.; Park, J. Characteristics of carbon circulation for ascidian farm in Jindong Bay in summer and winter. J. Wet. Res. 2012, 14, 211–221. [Google Scholar]
- Shim, J.H.; Kang, Y.; Choi, J. Chemical fluxes at the sediment-water interface below marine fish cages on the coastal water off Tong-Young, South Coast of Korea. J. Korean Soc. Oceanogr. 1997, 2, 151–159. [Google Scholar]
- Kim, J.-B.; Park, J.-I.; Jung, C.-G.; Choi, W.-J.; Lee, W.-C.; Lee, Y.-H. Physicochemical characteristics of seawater in Gamak Bay for a period of hypoxic water mass disappearance. J. Korean Soc. Mar. Environ. Saf. 2010, 16, 241–248. [Google Scholar]
- Oh, S.-J.; Park, J.-S.; Yoon, Y.-H.; Yang, H.-S. Variation analysis of phytoplankton communities in northern Gamak Bay, Korea. J. Korean Soc. Mar. Environ. Saf. 2009, 15, 329–338. [Google Scholar]
- Kim, B.-K.; Lee, M.-O.; Park, S.-J. Characteristics of water temperature and salinity variations, and seawater exchange in Gamak Bay. J. Korean Soc. Mar. Environ. Energy 2012, 15, 101–110. [Google Scholar] [CrossRef] [Green Version]
- Lee, M.O.; Kim, J.K.; Kim, B.K. Past, present, and future for the study of Gamak Bay, Korea. J. Korean Soc. Mar. Environ. Energy 2020, 23, 148–164. [Google Scholar] [CrossRef]
- Jeong, H.; Kim, D.W.; Nguyen Hoang, L.; Choi, T.B.; Cho, H.S. Heavy metal pollution in the surface sediments of the Korean South-West Environmental Preservation Sea Areas. J. Korean Soc. Environ. Anal. 2017, 20, 93–99. [Google Scholar]
- Ministry of Oceans and Fisheries, Korea. The Official Experiment Standard of Marine Environment. Available online: https://www.law.go.kr/admRulLsInfoP.do?ad-mRulSeq=2000000109042#:~:text=%EC%A0%9C1%EC%A1%B0(%EB%AA%A9%EC%A0%81)%20%EC%9D%B4,%EC%A0%95%EC%9D%98%EB%8A%94%20%EB%8B%A4%EC%9D%8C%EA%B3%BC%20%EA%B0%99%EB%8B%A4 (accessed on 22 April 2022).
- Okaichi, T. The cause of red tide in neritic water. Japanese Association for the Protection of Fisheries Resources: Tokyo, Japan, 1985; pp. 58–75. [Google Scholar]
- Kang, Y.; Kim, H.-J.; Moon, C.-H. Eutrophication driven by aquaculture fish farms controls phytoplankton and dinoflagellate cyst abundance in the southern coastal waters of Korea. J. Mar. Sci. Eng. 2021, 9, 362. [Google Scholar] [CrossRef]
- Garrison, T.F.; Kaminski, M.A.; Tawabini, B.; Frontalini, F. Sediment oxygen demand and benthic foraminiferal faunas in the Arabian Gulf: A test of the method on a siliciclastic substrate. Saudi J. Biol. Sci. 2021, 28, 2907–2913. [Google Scholar] [CrossRef]
- Bowie, G.L.; Mills, W.B.; Porcella, D.B.; Campbell, C.L.; Pagenkopf, J.R.; Rupp, G.L.; Johnson, K.M.; Chan, P.W.H.; Gherini, S.A.; Chamberlin, C.E. Rates, Constants, and Kinetics Formulations in Surface Water Quality Modeling, 2nd ed; US EPA: Athens, GA, USA, 1985. Available online: https://webpages.charlotte.edu/~jdbowen/6141/bowie_et_al_1985/sect1-1.pdf (accessed on 22 April 2022).
- Truax, D.D.; Member, I.; Shindala, A.; Sartain, H. Comparison of two sediment oxygen demand measurement techniques. J. Environ. Eng. 1995, 121, 619–624. [Google Scholar] [CrossRef]
- Mehring, A.S.; Kuehn, K.A.; Tant, C.J.; Pringle, C.M.; Lowrance, R.R.; Vellidis, G. Contribution of surface leaf-litter breakdown and forest composition to benthic oxygen demand and ecosystem respiration in a South Georgia blackwater river. Freshw. Sci. 2014, 33, 377–389. [Google Scholar] [CrossRef] [Green Version]
- Shimotori, K.; Yamamoto, H.; Imai, A.; Kohzu, A.; Okamoto, T. Development of a new high-throughput and small-size method for measuring sediment oxygen demand in lakes. J. Soils Sediments 2021, 21, 1222–1231. [Google Scholar] [CrossRef]
- Choi, S.M. Characteristics of Hypoxia Water Masses and the Disruption of Marine Ecosystem in Gamak Bay. Doctor Dissertation, Graduate School Chonnam National University, Gwangju, Korea, February 2021. [Google Scholar]
- Kim, K.H.; Kim, S.-H.; Jin, D.R.; Huh, I.A.; Hyun, J.-H. A study on the measurement method for benthic nutrient flux in freshwater sediments. J. Korean Soc. Environ. Eng. 2017, 39, 288–302. [Google Scholar] [CrossRef]
- Kim, D.-H.; Park, C.-K. A study on the measurement of nutrients release from Sediment. J. Environ. Sci. Int. 2002, 11, 1333–1337. [Google Scholar]
- Seitzinger, S.P. Denitrification and Nitrification Rates in Aquatic Sediments. In Handbook of Methods in Aquatic Microbial Ecology, 1st ed.; Kemp, P.F., Sherr, B.F., Sherr, E.B., Cole, J.J., Eds.; Lewis Publisher: Boca Raton, FL, USA, 1993. [Google Scholar]
- Richard, A.; de Montaudouin, X.; Rubiello, A.; Maire, O. Cockle as second intermediate host of trematode parasites: Consequences for sediment bioturbation and nutrient fluxes across the benthic interface. J. Mar. Sci. Eng. 2021, 9, 749. [Google Scholar] [CrossRef]
- Louchouarn, P.; Lucotte, M.; Duchemin, E.; de Vernal, A. Early diagenetic processes in recent sediments of the Gulf of St-Lawrence: Phosphorus, carbon and iron burial rates. Mar. Geol. 1997, 139, 181–200. [Google Scholar] [CrossRef]
- Boudreau, B.P. Diagenetic Models and Their Implementation: Modelling Transport and Reactions in Aquatic Sediments, 1st ed.; Springer: Berlin/Heidelberg, Germany, 1997; pp. 37–46. [Google Scholar]
- Klump, J.V.; Martens, C.S. Biogeochemical cycling in an organic rich coastal marine basin-II. Nutrient sediment-water exchange processes. Geochim. Cosmochim. Acta 1981, 45, 101–121. [Google Scholar] [CrossRef]
- Li, Y.; Gregory, S. Diffusion of ions in sea water and in deep-sea sediments. Geochim. Cosmochim. Acta 1974, 38, 703–714. [Google Scholar]
- Kim, D.; Park, C. Estimation of nutrients released from sediments of Deukryang Bay. J. Environ. Sci. Int. 1998, 7, 425–431. [Google Scholar]
- Yamamoto, T.; Matsuda, O.; Hashimoto, T.; Imose, H.; Kitamura, T. Estimation of benthic fluxes of dissolved inorganic nitrogen and phosphorus from sediments of the Seto Inland Sea. Oceanogr. Jpn. 1998, 7, 151–158. [Google Scholar] [CrossRef] [Green Version]
- Klump, J.V.; Martens, C.S. Biogeochemical cycling in an organic-rich coastal marine basin. 5. Sedimentary nitrogen and phosphorus budgets based upon kinetic models, mass balances, and the stoichiometry of nutrient regeneration. Geochim. Cosmochim. Acta 1987, 51, 1161–1173. [Google Scholar] [CrossRef]
- Lee, J.S.; Kim, K.H.; Shim, J.H.; Han, J.H.; Choi, Y.H.; Khang, B.J. Massive sedimentation of fine sediment with organic matter and enhanced benthic-pelagic coupling by an artificial dyke in semi-enclosed Chonsu Bay, Korea. Mar. Pollut. Bull. 2012, 64, 153–163. [Google Scholar] [CrossRef] [PubMed]
- Park, J.-H.; Cho, Y.-S.; Lee, W.-C.; Hong, S.-J.; Kim, H.-C.; Kim, J.-B. Comparison of material flux at the sediment-water interface in marine finfish and abalone cage farms, Southern Coast of Korea; In-situ and laboratory incubation examination. J. Korean Soc. Mar. Environ. Saf. 2012, 18, 536–544. [Google Scholar] [CrossRef] [Green Version]
- Lee, J.S.; Kim, S.H.; Kim, Y.T.; Hong, S.J.; Han, J.H.; Hyun, J.H.; Shin, K.H. Influence of sea squirt (Halocynthia roretzi) aquaculture on benthic-pelagic coupling in coastal waters: A study of the South Sea in Korea. Estuar. Coast. Shelf Sci. 2012, 99, 10–20. [Google Scholar] [CrossRef]
- Lee, J.S.; Kim, Y.T.; Shin, K.H.; Hyun, J.H.; Kim, S.Y. Benthic nutrient fluxes at longline sea squirt and oyster aquaculture farms and their role in coastal ecosystems. Aquac. Int. 2011, 19, 931–944. [Google Scholar] [CrossRef]
- Kim, S.H.; Lee, J.S.; Hyun, J.H. Extremely high sulfate reduction, sediment oxygen demand and benthic nutrient flux associated with a large-scale artificial dyke and its implication to benthic-pelagic coupling in the Yeongsan River estuary, Yellow Sea. Mar. Pollut. Bull. 2017, 120, 126–135. [Google Scholar] [CrossRef]
- Kim, S.-Y.; Jun, S.-H.; Lee, Y.-S.; Lee, Y.-H.; Kim, B.-M. Characteristics of phosphate flux at the sediment-water interface in Gamak Bay during the hypoxic water mass. J. Environ. Sci. Int. 2011, 20, 1069–1078. [Google Scholar] [CrossRef]
- Holmer, M.; Marb, U.; Terrados, J.; Duarte, C.M.; Fortes, M.D. Impacts of milkfish (Chanos chanos) aquaculture on carbon and nutrient fluxes in the Bolinao area, Philippines. Mar. Pollut. Bull. 2002, 44, 685–696. [Google Scholar] [CrossRef] [Green Version]
- Nickell, L.A.; Black, K.D.; Hughes, D.J.; Overnell, J.; Brand, T.; Nickell, T.D.; Breuer, E.; Harvey, S.M. Bioturbation, sediment fluxes and benthic community structure around a salmon cage farm in Loch Creran, Scotland. J. Exp. Mar. Biol. Ecol. 2003, 285–286, 221–233. [Google Scholar] [CrossRef]
- Jeon, J.; Moon, S.; Oh, S.J. Bio-monitoring System using Shell Valve Movements of Pacific Oyster (Crassostrea gigas) (Detecting Abnormal Shell Valve Movements Under Hypoxia Water using Hall Element Sensor). J. Mar. Life Sci. 2016, 1, 25–30. [Google Scholar]
- Vaquer-Sunyer, R.; Duarte, C.M. Thresholds of hypoxia for marine biodiversity. Proc. Nati. Acad. Sci. USA 2008, 105, 15452–15457. [Google Scholar] [CrossRef] [PubMed] [Green Version]
- Jang, S.Y.; Shin, H.C. Differences in the community structures of macrobenthic polychaetes from farming grounds and natural habitats in Gamak bay. J. Korean Soc. Mar. Environ. Energy 2016, 19, 297–309. [Google Scholar] [CrossRef]
- Moon, S.-Y.; Oh, H.-J.; Kim, S.-Y. Short-term variations of mesozooplankton related to the environmental factors in Gamak Bay during summer, 2006. J. Environ. Sci. Int. 2009, 18, 21–32. [Google Scholar]
- Kim, M. Sediment trap studies to understand the oceanic carbon cycling: Significance of resuspended sediments. J. Korean Soc. Oceanogr. 2021, 26, 145–166. [Google Scholar]
- Henson, S.A.; Sanders, R.; Madsen, E.; Morris, P.J.; le Moigne, F.; Quartly, G.D. A reduced estimate of the strength of the ocean’s biological carbon pump. Geophys. Res. Lett. 2011, 38, L04606. [Google Scholar] [CrossRef] [Green Version]
- Accornero, A.; Picon, P.; Bovée, F.d.; Charrière, B.; Buscail, R. Organic carbon budget at the sediment–water interface on the Gulf of Lions continental margin. Cont. Shelf Res. 2003, 23, 79–92. [Google Scholar] [CrossRef]
- Laverock, B.; Gilbert, J.A.; Tait, K.; Osborn, A.M.; Widdicombe, S. Bioturbation: Impact on the marine nitrogen cycle. Biochem. Soc. Trans. 2011, 39, 315–320. [Google Scholar] [CrossRef] [Green Version]
- Gomez, E.; Durillon, C.; Rofes, G.; Picot, B. Phosphate adsorption and release from sediments of brackish lagoons: pH, O2 and loading influence. Water Res. 1999, 33, 2437–2447. [Google Scholar] [CrossRef]
- Kim, P.-J.; Shon, S.-G.; Park, S.-Y.; Kim, S.-S.; Jang, S.-J.; Jeon, S.-B.; Ju, J.-S. Biogeochemistry of metal and nonmetal elements in the surface sediment of the Gamak Bay. J. Korean Soc. Mar. Environ. Saf. 2012, 18, 67–83. [Google Scholar] [CrossRef] [Green Version]
- Kim, D.-M. Estimation of Nutrients Transport in Kamak Bay using the Eco-hydrodynamic Model. J. Environ. Sci. Int. 2003, 12, 745–751. [Google Scholar] [CrossRef] [Green Version]
- Lee, D.I.; Cho, H.S. A Study on the Characteristics of Pollutant Loads in Kamak Bay Watershed. J. Environ. Sci. Int. 2002, 11, 945–954. [Google Scholar] [CrossRef] [Green Version]
- Kim, C.W.; Oh, H.J.; Shin, Y.K. Effects of Water Temperature on The Mass Mortality of Pacific Oyster, Crassostrea gigas in Gamak Bay. Korean J. Malacol. 2013, 29, 245–250. [Google Scholar] [CrossRef] [Green Version]
Figure 1.
Scheme of sampling points for bottom seawater, surface sediments, and sediment traps in Gamak Bay, Korea, August 2017. The contour means the water depth, indicating 2 m, 4 m, 6 m, 8 m, 10 m, and 15 m (https://www.khoa.go.kr/eng/Main.do, accessed on 24 April 2022).
Figure 1.
Scheme of sampling points for bottom seawater, surface sediments, and sediment traps in Gamak Bay, Korea, August 2017. The contour means the water depth, indicating 2 m, 4 m, 6 m, 8 m, 10 m, and 15 m (https://www.khoa.go.kr/eng/Main.do, accessed on 24 April 2022).

Figure 2.
Schemes of the designated instruments to estimate the mass balances: (a) sinking/re-floating sediment traps; (b) SOD (Sediment Oxygen Demand) chamber; (c) ex situ nutrients incubating experiments.
Figure 2.
Schemes of the designated instruments to estimate the mass balances: (a) sinking/re-floating sediment traps; (b) SOD (Sediment Oxygen Demand) chamber; (c) ex situ nutrients incubating experiments.

Figure 3.
The spatial distributions of bottom seawater quality parameters, in Gamak Bay, Korea, in August 2017, (a) Water temperature (WT); (b) Salinity (SAL); (c) pH; (d) Dissolved oxygen (DO); (e) Hydrogen sulfide (H2S); (f) Ammonium-nitrogen (NH4+).
Figure 3.
The spatial distributions of bottom seawater quality parameters, in Gamak Bay, Korea, in August 2017, (a) Water temperature (WT); (b) Salinity (SAL); (c) pH; (d) Dissolved oxygen (DO); (e) Hydrogen sulfide (H2S); (f) Ammonium-nitrogen (NH4+).


Figure 4.
The spatial distributions of bottom water quality parameters in Gamak Bay, Korea, in August 2017: (a) Nitrite-nitrogen (NO2–); (b) Nitrate-nitrogen (NO3–); (c) Dissolved inorganic phosphorus (DIP); (d) Dissolved silicate (DSi); (e) Chlorophyll-a (Chl-a); (f) Suspended particulate matter (SPM); (g) Chemical oxygen demand (COD).

Figure 5.
The Okaichi eutrophication index (OEI) results for the bottom seawater in Gamak Bay, Korea, in August 2017.
Figure 5.
The Okaichi eutrophication index (OEI) results for the bottom seawater in Gamak Bay, Korea, in August 2017.

Figure 6.
The results of principal component analysis (PCA) and cluster analysis using 14 bottom seawater quality parameters: (a) loading plot with PC1 and PC2; (b) loading plot with PC1 and PC2; (c) classification of the sampling points into three groups based on cluster analysis; (d) Groups A, B, and C are illustrated in the sampling area.


Figure 7.
Results of the sediment oxygen demand (SOD) chamber experiment for dissolved oxygen (○, solid line) and SOD20 Flux (■, dotted line), which depended on incubating times in the reducing environment due to anoxic water at GA4, Gamak bay, Korea.
Figure 7.
Results of the sediment oxygen demand (SOD) chamber experiment for dissolved oxygen (○, solid line) and SOD20 Flux (■, dotted line), which depended on incubating times in the reducing environment due to anoxic water at GA4, Gamak bay, Korea.

Figure 8.
Results of the ex situ incubating experiment for eluted nutrients from the surface sediment toward overlying water at GA4, Gamak bay, Korea: ammonium-nitrogen (NH4+) (●, dotted line); nitrite nitrogen and nitrate nitrogen (NOx−) (○, dashed line); dissolved inorganic phosphorous (DIP) (▲, solid line).

Figure 9.
The illustrations of mass balances based on the simple model (Fluxin = Fluxout + Flux) for GA4, Gamak Bay, Korea, August 2017: (a) Carbon (C); (b) Nitrogen (N); (c) Phosphorus (P).
Figure 9.
The illustrations of mass balances based on the simple model (Fluxin = Fluxout + Flux) for GA4, Gamak Bay, Korea, August 2017: (a) Carbon (C); (b) Nitrogen (N); (c) Phosphorus (P).


Table 1.
Estimated sinking/re-floating suspended particulate matter (SPM), particulate organic carbon (POC), nitrogen (PON), and phosphorus (POP) fluxes at the bottom seawater–surface sediment interface with the reducing environment due to anoxic water at GA4 in Gamak bay, Korea.
Table 1.
Estimated sinking/re-floating suspended particulate matter (SPM), particulate organic carbon (POC), nitrogen (PON), and phosphorus (POP) fluxes at the bottom seawater–surface sediment interface with the reducing environment due to anoxic water at GA4 in Gamak bay, Korea.
| Parameters | SPM | SPM Flux | POC | POC Flux | PON | PON Flux | POP | POP |
|---|---|---|---|---|---|---|---|---|
| Unit | mg/L | mg/m2/d | mg/L | mg/m2/d | mg/L | mg/m2/d | mg/L | mg/m2/d |
| Sinking Flux | 352.0 | 17,600 | 30.6 | 1531.2 | 5.6 | 278.8 | 0.3 | 38.6 |
| Re-floating Flux | 282.0 | 14,100 | 13.4 | 670.2 | 1.9 | 90.8 | 0.1 | 12.6 |
| Net Sinking Flux | - | 3500 | - | 861.0 | - | 187.9 | - | 26.0 |
Table 2.
Estimated nutrient elution and diffusion fluxes at the bottom seawater–surface sediment interface with reducing conditions due to anoxic water at GA4, Gamak bay, Korea.
Table 2.
Estimated nutrient elution and diffusion fluxes at the bottom seawater–surface sediment interface with reducing conditions due to anoxic water at GA4, Gamak bay, Korea.
| Parameter | NH4+ | NOx− | DIN | DIP |
|---|---|---|---|---|
| Unit | mg N/m2/d | mg N/m2/d | mg N/m2/d | mg P/m2/d |
| Nutrient Elution Flux | 33.7 | −4.1 | 29.6 | 46.7 |
| Nutrient Diffusion Flux | 5.81 | 0.04 | 5.85 | 0.20 |
Publisher’s Note: MDPI stays neutral with regard to jurisdictional claims in published maps and institutional affiliations. |
© 2022 by the authors. Licensee MDPI, Basel, Switzerland. This article is an open access article distributed under the terms and conditions of the Creative Commons Attribution (CC BY) license (https://creativecommons.org/licenses/by/4.0/).
Share and Cite
MDPI and ACS Style
Jeong, H.; Kang, Y.; Cho, H. C, N, and P Mass Balances in the Bottom Seawater–Surface Sediment Interface in the Reducing Environment due to Anoxic Water of Gamak Bay, Korea. Water 2022, 14, 2244. https://doi.org/10.3390/w14142244
AMA Style
Jeong H, Kang Y, Cho H. C, N, and P Mass Balances in the Bottom Seawater–Surface Sediment Interface in the Reducing Environment due to Anoxic Water of Gamak Bay, Korea. Water. 2022; 14(14):2244. https://doi.org/10.3390/w14142244
Chicago/Turabian StyleJeong, Huiho, Yoonja Kang, and Hyeonseo Cho. 2022. "C, N, and P Mass Balances in the Bottom Seawater–Surface Sediment Interface in the Reducing Environment due to Anoxic Water of Gamak Bay, Korea" Water 14, no. 14: 2244. https://doi.org/10.3390/w14142244
Note that from the first issue of 2016, this journal uses article numbers instead of page numbers. See further details here.