Article

Cephalexin Adsorption by Acidic Pretreated Jackfruit Adsorbent: A Deep Learning Prediction Model Study

by
Adel Ali Al-Gheethi
1,2,3,*,
Mohammad Shafiq Mohd Salleh
1,
Efaq Ali Noman
1,2,*,
Radin Maya Saphira Radin Mohamed
1,2,
Rich Crane
3,
Rafidah Hamdan
1,2 and
Mu. Naushad
4
1
Department of Civil Engineering, Faculty of Civil Engineering and Built Environment, Universiti Tun Hussein Onn Malaysia, Parit Raja, Batu Pahat 86400, Malaysia
2
Micropollutant Research Centre (MPRC), Institute of Integrated Engineering, Universiti Tun Hussein Onn Malaysia, Parit Raja, Batu Pahat 86400, Malaysia
3
Camborne School of Mines, College of Engineering, Mathematics and Physical Sciences, University of Exeter, Exeter EX4 4QD, UK
4
Department of Chemistry, College of Science, King Saud University (KSU), Riyadh P.O. Box 2455, Saudi Arabia
*
Authors to whom correspondence should be addressed.
Water 2022, 14(14), 2243; https://doi.org/10.3390/w14142243
Submission received: 18 June 2022 / Revised: 6 July 2022 / Accepted: 15 July 2022 / Published: 17 July 2022
(This article belongs to the Special Issue Point-Source and Diffuse Water Pollution)

Abstract

:
Cephalexin (CFX) residues in the environment represent a major threat to human health worldwide. Herein we investigate the use of novel approaches in deep learning in order to understand the mechanisms and optimal conditions for the sorption of cephalexin in water onto an acidic pretreated jackfruit peel adsorbent (APJPA). The interaction between the initial concentration of CFX (10–50 mg/100 mL), APJAP dosage (3–10 mg/100 mL), time (10–60 min), and the pH (4–9), was simulated using the one-factor-at-a-time method. APJPA was characterized by FESEM images showing that APJPA exhibits a smooth surface devoid of pores. FTIR spectra confirmed the presence of -C-O, C–H, C=C, and -COOH bonds within the APJPA. Maximum removal was recorded with 6.5 mg/100 mL of APJAP dosage, pH 6.5, after 35 min and with 25 mg/100 mL of CFX, at which the predicted and actual adsorption were 96.08 and 98.25%, respectively. The simulation results show that the dosage of APJAP exhibits a high degree of influence on the maximum adsorption of CFX removal (100%) between 2 and 8 mg dose/100 mL. The highest adsorption capacity of APJAP was 384.62 mg CFX/g. The simulation for the effect of pH determined that the best pH for the CFX adsorption lies between pH 5 and 8.

1. Introduction

Water contaminants have become one of the most common pollutants in the environment due to the random disposal of wastewater, as well as utilization of fertilizers and pesticides, which are classified as emerging pollutants [1,2,3,4,5]. Cephalexin (CFX) is a broad-spectrum drug that can inhibit Gram-negative and Gram-positive bacteria. Cephalexin is used to treat articular infections, including cellulitis, as a rational first-line treatment. However, CFX in aquatic environments is now considered an emerging contaminant of global concern due to the significant risk it poses to the health of humans and the environment [6]. It has been reported that 30–90% of the given antibiotic dose is not wholly metabolized in the cell metabolism pathway and it is eventually excreted into the environment through the sewage disposal [7]. Traditional wastewater treatment plants have insufficient efficiency to complete removal of antibiotics from wastewater and represent one of the main sources of antibiotics in the environment [8]. Thus, removing CFX from aquatic environments is considered an extremely important area of research and development [9].
Sorption is widely regarded as an effective method for the removal of contaminants from water and wastewater. Among the methods available, non-ionic polymers, ionic exchange resins, and activated carbons have all been confirmed to be effective for the removal of antibiotics from wastewater [10]. Activated carbon has shown particularly high promise for antibiotic removal due to its extensive surface, high porosity, and high absorbency capacity [11]. Active carbons produced from agricultural waste exhibit very different physical characteristics in terms of adsorption [12]. Changes in adsorbent-surface chemistry are recognized as possible routes for new applications [13]. Among the various modification methods, hydrogen peroxide (H2O2) and nitric acid (HNO3) are known to be low-cost and have the ability to introduce oxygen functional groups into carbon. HNO3 is considered to be among the most effective oxidants for such applications and is also known to increase the surface area of sorbent materials due to dissolution processes [14].
CFX is a complex compound with two proton-binding sites (carboxyls and amino groups), and the pKa value varies from 2.56 to 6.88 [15]. It exists in the form of cations, zwitterions, or anions in water. Consequently, the interactions of sorption of carbon, CFX, and activated carbon are complex. Several adsorbents have been investigated to remove CFX from water and wastewater. Fu et al. [16] prepared activated carbon from Arundo donax L. using iron salts and activation at 700 °C to produce activated carbon with microporous nature and crystalline structure and then used it to remove different concentrations (100 to 400 mg/L) of CFX from solutions. The results revealed that the activated carbon exhibited 285.71 mg/g of adsorption capacity. Khanday et al. [17] prepared carbon using a single-step activation with phosphoric acid. Chitin-AC has a porous structure with pores and cavities or slits, and a group of NH and OH. The CFX removal experiments exhibited 245.19 mg/g of adsorption capacity, obtained at 50 °C. Rashtbari et al. [18] used activated carbon treated with H3PO4 and activation at 800 °C to remove CFX from the aqueous solution and found that the highest adsorption capacity was 95 mg/g. Despite these studies, several knowledge gaps remain, including an understanding of CFX sorption in more complex chemical conditions, including as a function of pH, redox, and as a function of time and varying solid–liquid ratio. A range of factors have been investigated regarding the one-factor-at-a-time (OFAT) method, or on the response surface methodology (RSM). However, both methods showed limited responses with a small range for each factor. In contrast, in the environment, CFX is exposed to a wide range of environmental processes that could exhibit a major effect on its sorption behavior. Therefore, simulations with deep learning methods, such artificial neural networks (ANNs), are among the most advanced modelling tools for investigating such complex antibiotic-removal pathways. Al-Gheethi et al. [19] used ANN to study the removal of CFX using Cu-Zn bio-nanocomposite for dosage, time, and temperature. The study has highlighted the role of ANN in predicting removal efficiency. However, the work studied the CFX responses with a limited number of experiments and within a narrow range for each factor. In fact, deep learning simulations are used to validate and optimize experiments in mechanical processes and kinetics at the laboratory scale to inform the design of large-scale industrial processes. Despite these benefits, there are currently only a few studies using mathematical prediction modelling to remove antibiotics.
Several studies have been conducted on antibiotic adsorption; however, no studies have investigated the efficiency of APJPA to remove CFX [20,21,22,23]. Furthermore, most studies used RSM for optimization, which evaluates the removal efficiency based on the coefficient (R2). In comparison, the coevolutionary neural network has proved to be very capable of extracting feature maps, and of solving all constraints of geometric features. ANN analysis of the elimination data provided accurate information about CFX responses to independent factors achieved by RSM. Machine learning algorithms have great advantages in extracting deep functions with high speed and precision and can be classified with high accuracy in comparison with RSM. Tests and trainings, as well as values of valid experimental data, were evaluated on the basis of the determination coefficient (R2), while the relative absolute error (RAE), root-mean-square error (RMSE), mean squared error (MSE), mean absolute error (MAE), root relative squared error (RRSE), and correlation coefficient (R) provided more information on the errors than R2.
In this present work, acidic pretreated jackfruit (Artocarpus heterophyllus) peel adsorbent using HNO3 (APJPA) was used to remove CFX from an aqueous solution for the first time. The sensitivity and optimization of the adsorption process for the environmental factors were investigated in the laboratory and analyzed based on the RSM. In contrast, the responses of CFX removal for the environmental factors were studied based on deep learning simulations with ANN analysis. The interaction between the independent factors and their effects on the CFX behavior in the environment has been studied, and this represents the core of the present study, and emphasizes the novelty of the current work, since no studies have used the simulation process for this purpose. The mechanism of the interaction between the adsorbents and CFX was explained by the microstructure of APJPA. The study developed appropriate separation processes with understanding for the applicability of CFX removal from a contaminated environment.

2. Materials and Methods

2.1. Preparation of the Adsorbent

The jackfruit peels were obtained from the neighborhood stores in Parit Raja, Batu Pahat, Malaysia. Jackfruit peels were rinsed in distilled water to remove dirt and pollutants, and the clean peels were dried at 150 °C for 24 h. The jackfruit peels were then powdered and sieved to a particle size <150 µm. A fixed mass (100 g) of dried APJPA was impregnated with 30% nitric acid (HNO3) (1:1 with mass ratio) at 80 °C for 2 h as described by Lee et al. [24] with a slight modification where the phosphoric acid (H3PO4) was replaced by HNO3. The pre-treated APJPA was filtered and washed with distilled water and then subjected to drying at 105 °C for 48 h.
A CFX stock solution was prepared by dissolving 5 g of CFX in 1000 mL of (0.1 N) HCl. The mixture was homogenized for 5 min using a magnetic stirrer (125 rpm). The solution was used as a stock solution to prepare aliquots of different concentrations of CFX (10 to 50 mg/100 mL).

2.2. Characteristics of APJPA

The characteristics of pretreated APJPA before and after the adsorption process were determined using Fourier transform infrared FTIR spectroscopy, field emission scanning electron microscopy (FESEM), X-ray diffraction, atomic force microscopy (AFM), and energy dispersive X-ray diffraction (EDX). The samples were prepared by placing a small portion of APJPA (one gram) on the surface of a glass slide (1.0 cm × 1.0 cm in dimension) and subjected for gold coating before the analysis using FESEM and EDS. A one-gram dry powder of APJPA before and after was used for FTIR analysis. The analysis using XRD and AFM was performed without the gold coating process.

2.3. Optimization of CFX Removal by APJPA

CFX removal as a function of the adsorption process using APJPA was conducted on the lab-scale experiments. The factors affecting adsorption process were: initial CFX concentration (10–50 mg/100 mL), APJAP dosage (3–10 mg/100 mL), time (10–60 min), and pH (4–9). All experiments were conducted using a fixed 100 mL CFX solution in a 250 mL-conical glass bottle. CFX solution with APJPA was stirred magnetically at 250 rpm at room temperature (25 °C) for 60 min to ensure homogeneity of the APJAP in the solution, unless specified differently. At the end of each experimental run, APJAP was separated from the aqueous phase using a centrifuge (10,000 rpm for 20 min). CFX residue concentrations in the aqueous phase were determined using a UV-Vis spectrophotometer (DR6000, absorbance at 260 nm, linear calibration) [25]. The adsorption efficiency (E%) and capacity (Qmax) were calculated using Equations (1) and (2).
E = (CiCf/Ci) × 100
Qmax = V (Ci − Cf/M)
where Qmax is the adsorbed CFX (mg/g adsorbent), Ci is the concentration of CFX in the solution (mg/L), Cf is the equilibrium concentration of CFX (mg/L), V is the liquid sample (L) and M is the amount of dry basis (g).

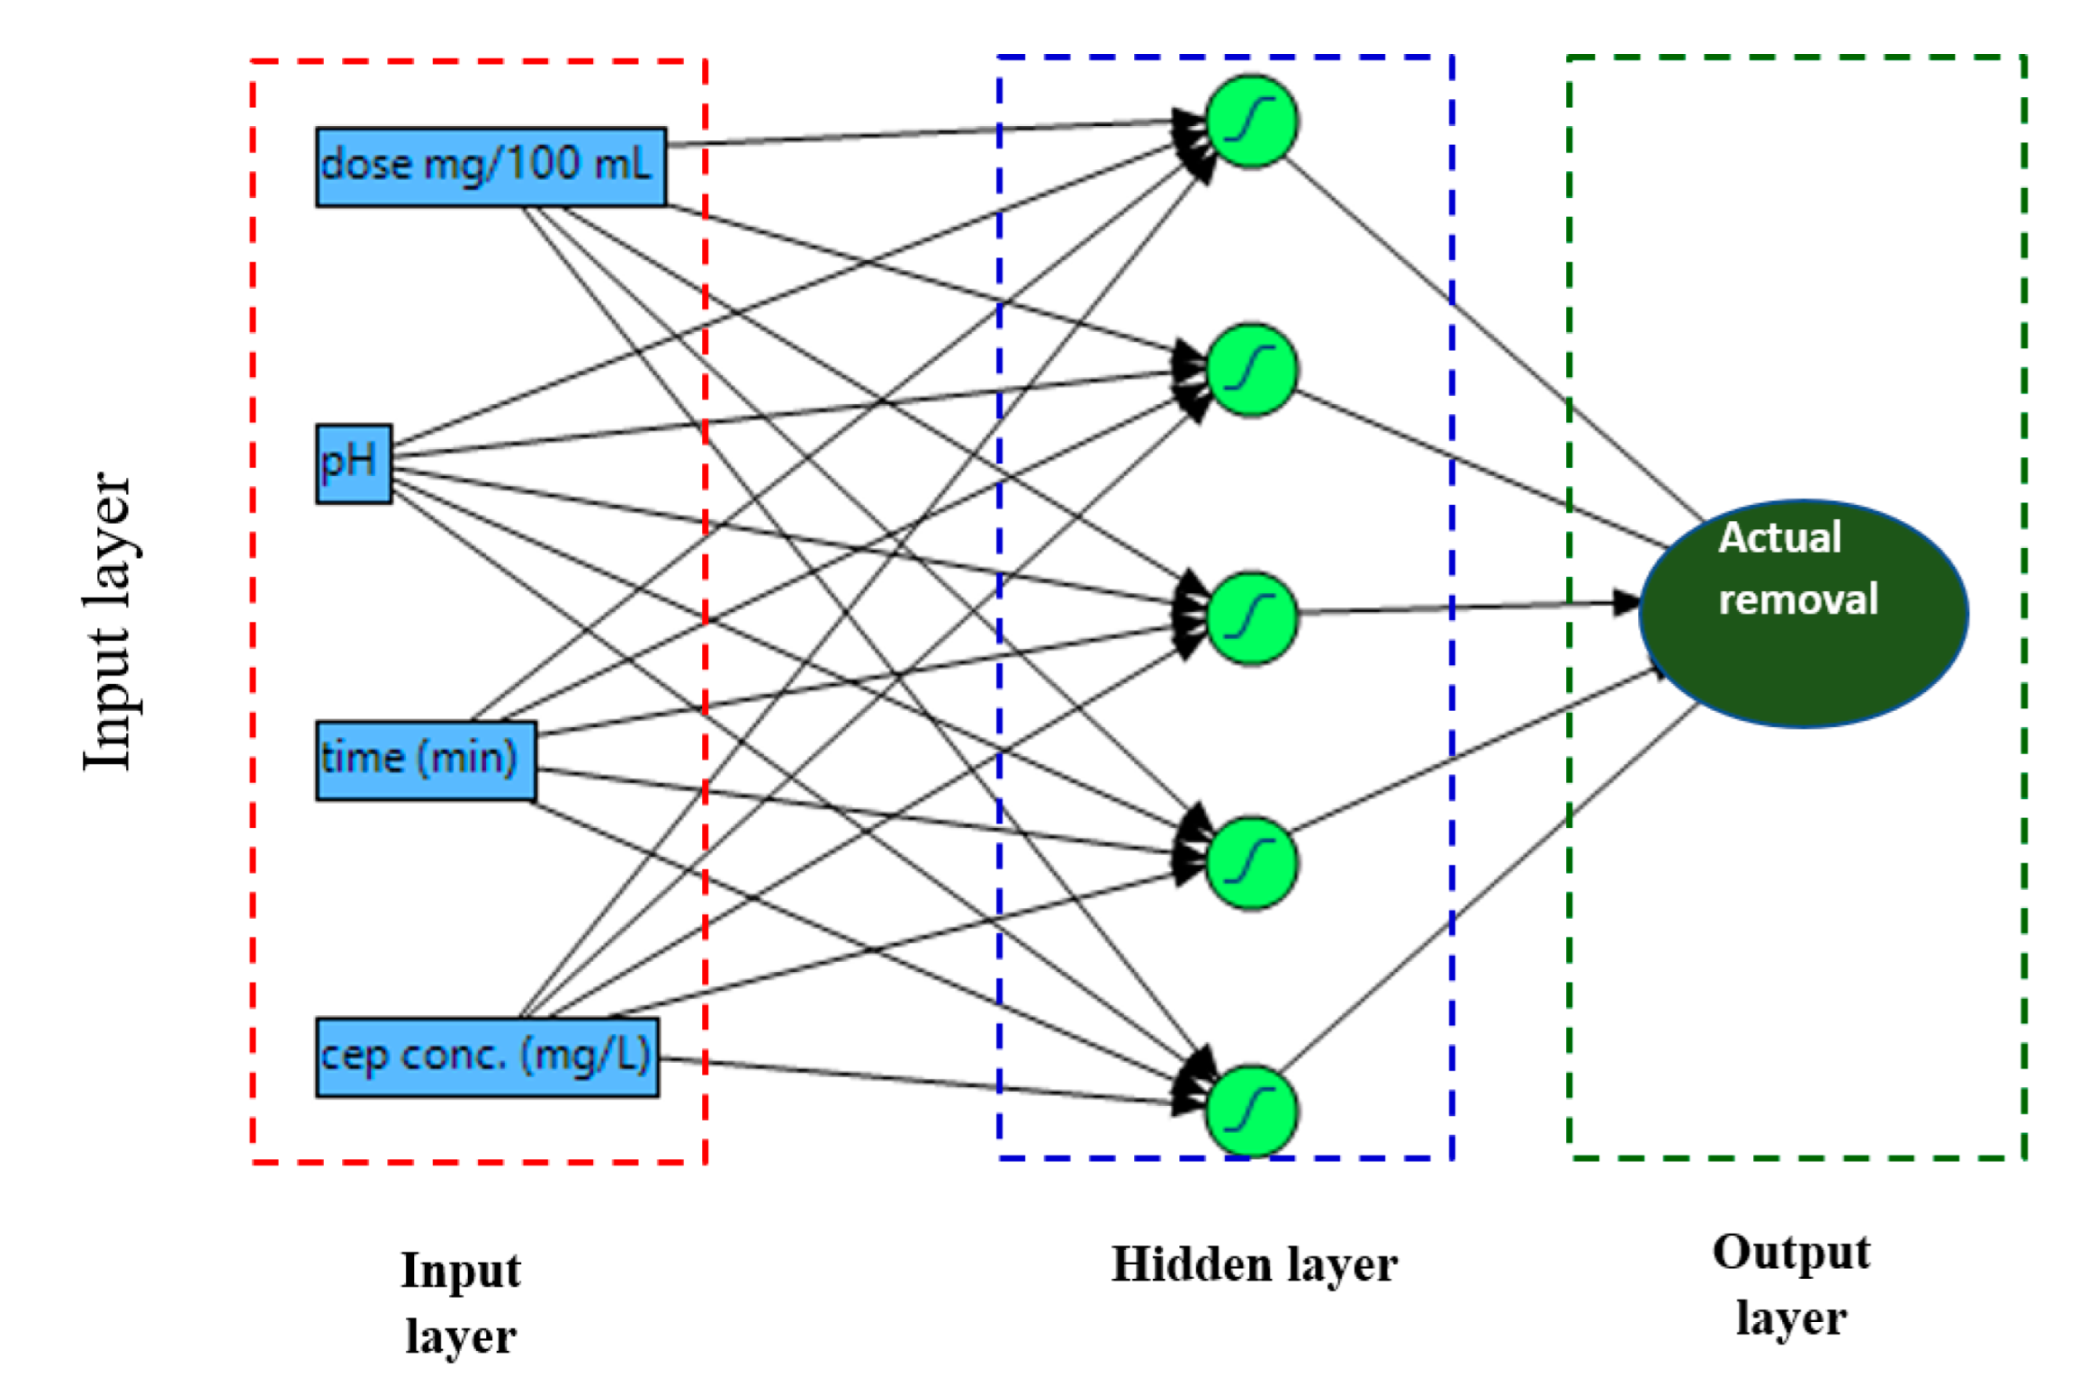
2.4. Artificial Neural Network (ANN) Analysis and Deep Learning Simulations

The ANN models were used to investigate the sensitivity of CFX for the factors affecting the adsorption process using APJAP as a response to initial concentrations of CFX, ( I n 1 ) (10–50 mg/100 mL), APJAP dosage, ( I n 2 ) (3–10 mg/100 mL), time, ( I n 3 ) (10–60 min), and pH, ( I n 4 ) (4–9). The models developed consisted of three layers, namely: layer 1 (input layer with four independent factors), layer 2 (hidden layer with five neurons), and layer 3 with one output that represents CFX removal) (Figure 1).
A total of 20 experimental runs was used to design optimization using design expert software, and the proposed ANN model and simulation processes using JMP software version 15. In the JMP software, 70% of the experimental data were used as training data (70%), while 30% of the data were used as a testing data (30%). The testing and training, as well as the validity experimental data values, were evaluated based on coefficient of determination (R2), while RAE, RMSE, MSE, MAE, RRSE, and correlation coefficient (R) were calculated according to the following equations.
R A E =   | P A |   | P 1 N   A |        
M S E = 1 n i = 1 n ( A P ) 2      
M A E =   | ( P A ) | N    
R M S E = 1 n i = 1 n ( A P ) 2
R R S E =   ( P A ) 2   ( P 1 N   A ) 2
R S E =   | ( P A ) 2 |   ( P 1 N   A ) 2  
In contrast, the degree of the fitting between the experimental data ( y actual ) and network output ( y m o d e l ) was plotted using JMB software and evaluated based on the coefficient of determination (R2).
In order to test the influence of a single independent factor, and multiple factors, on the removal of CFX as a function of the adsorption process using APJAP, the simulation process was conducted with 10,000 random runs using JMP software. The starting concentrations used in the simulation process were between −10 to 60 mg/100 mL, the APJAP dosage between −2 to 16 mg/100 mL, the time between 0 and 100 min, and the pH between 1 and 14.

3. Results and Discussion

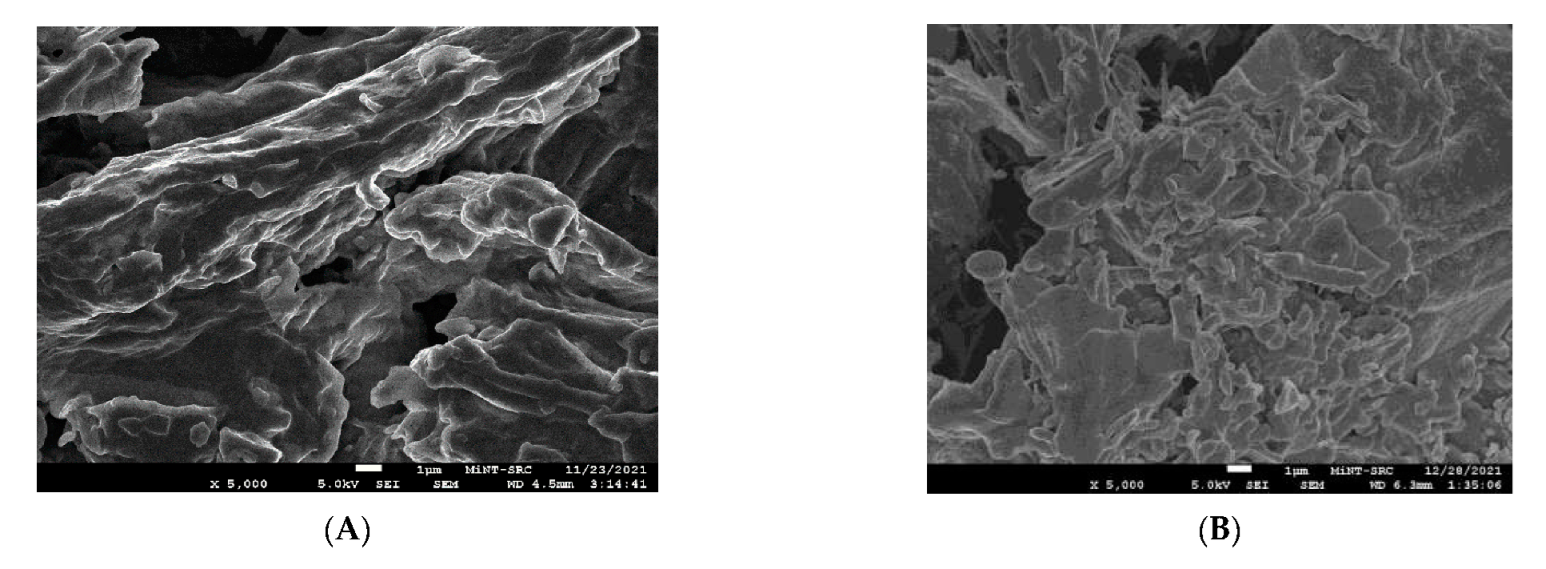
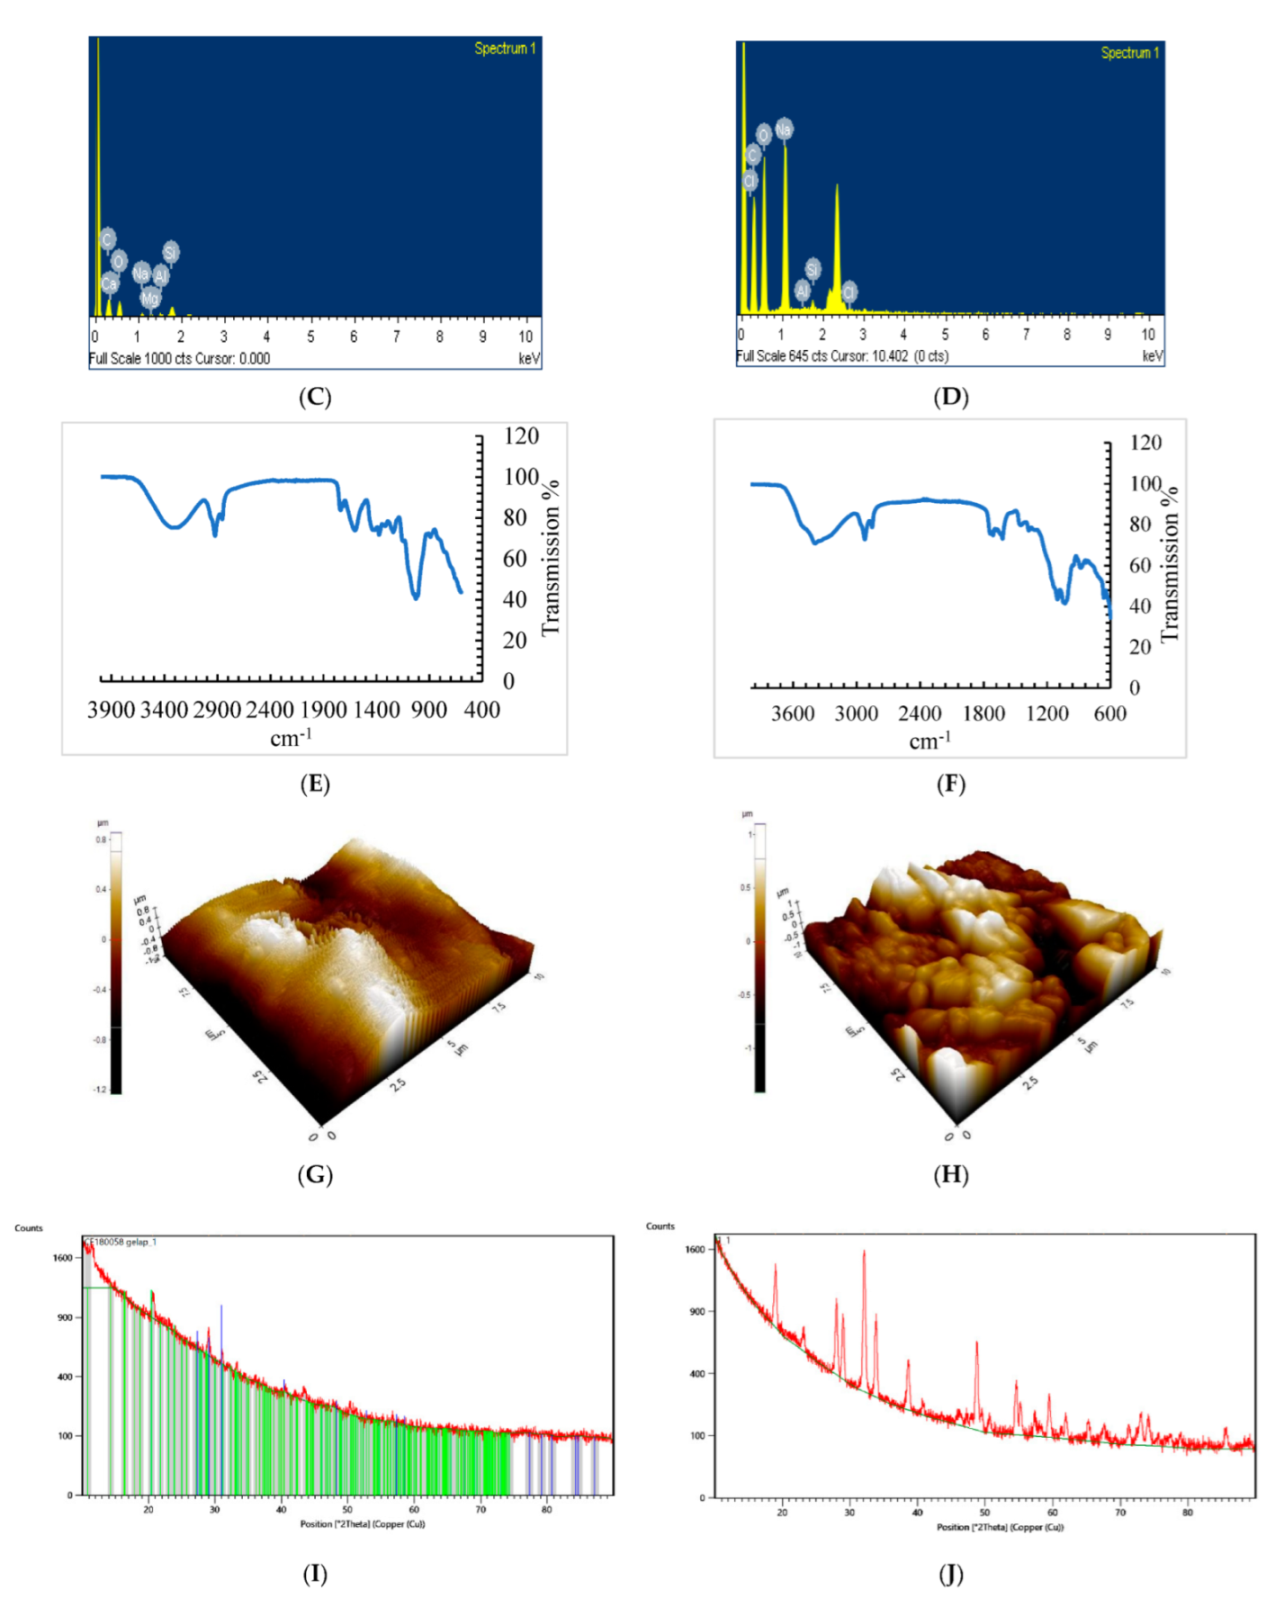
3.1. Characterization of Pre-Treated Jackfruit before and after the CFX Adsorption Process

The characteristics of the APJAP were studied using FE-SEM analysis. The results revealed that the APJAP exhibited a smooth surface with no holes (Figure 2A) perhaps due to the high contents of the pectin and lignin in the adsorbent surface. However, APJAP after the adsorption process exhibited a rough surface morphology (Figure 2B), which does mean that the CFX reacted with the adsorption site on the surface of APJAP. EDX analysis of APJAP before and after the adsorption process revealed that raw APJAP contains several elements, including Na, Mg and Ca, with high contents of O and C (Figure 2C).
The elements Mg and Ca disappeared after the adsorption process, confirming their role in ion exchange with CFX on the surface of APJAP (Figure 2D). FTIR spectra show a broad peak of 2900 cm−1, indicating the existence of a lignin and cellulose phenol group. The peak of 1600 cm−1 is defined as the area of aromatic bonds or amino acids of C=C, which is a characteristic of proteins and enzymes. The spectrum, which is exhibited in 1000 cm−1, is classified as the C-O expansion vibration of sulfuric acid (-COOH). The spectrum of 2900 cm−1 for APJAP is an asymmetric expansion of the C-H bond of substituted amines. The peak was 1100 cm −1 due to the C-O stretching of tertiary alcohol (Figure 2E,F). The disappearance of the functional groups after the adsorption process confirms their usage in the removal process of CFX.
Atomic force microscopy (AFM) was used for quantifying nanometer-scale structures as well as the roughness of jackfruit. The results indicated that the three-dimensional views of the sample surface across a distance of 10 μm showed a uniform surface consisting of grains covering the entire surface. Similarly, as seen in Figure 2G, after the utilization of APJAP in the adsorption process, the AFM revealed changes in the APJAP as a result of temperature, pH, CFX concentration, and incubation time, which exhibited a major effect on the form and size of the APJAP (Figure 2H).
On the basis of the data obtained from the XRD analysis, it was noted that the difference in patterns is due to their different calcination temperatures. Figure 2I,J show the raw pattern APJAP peak, with highest value at 518.02 and the 2-theta position at 11.57 with 258.56 calcined crystallites of size at a temperature of 60 Celsius. The pattern of APJAP after the adsorption process shows that the highest value was recorded at 1283.61, and the 2-theta position at 32.07 with 267.376 crystallites of size calcined at a temperature of 60-Celsius. There have been increases in the crystallite size for APJAP after the adsorption process (Figure 2I).

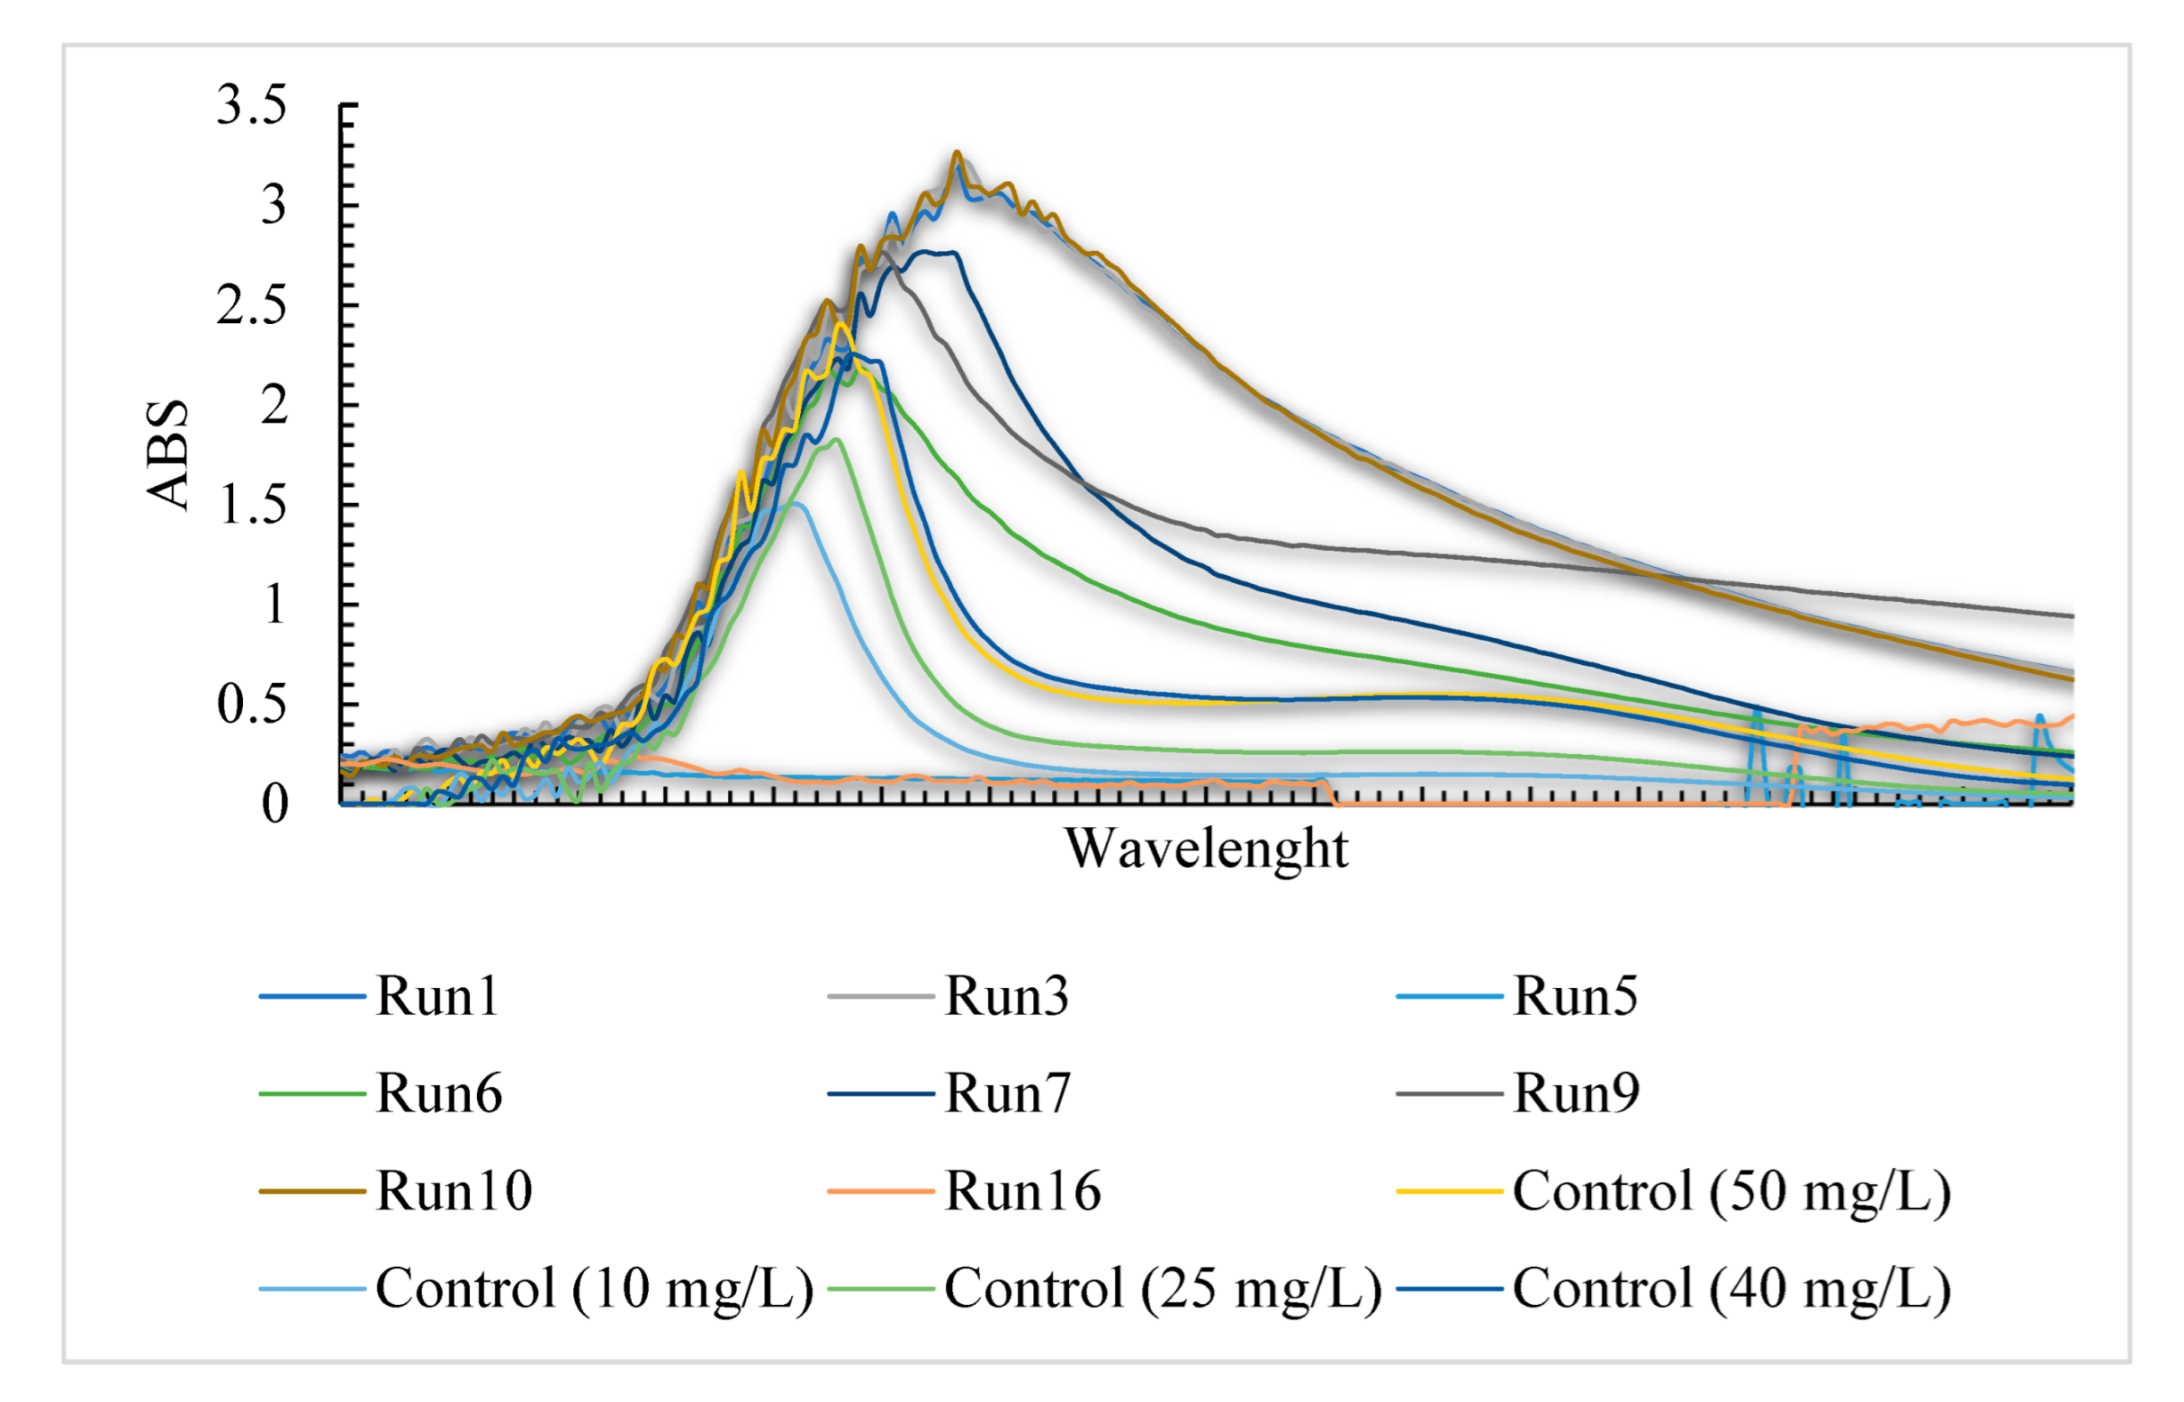
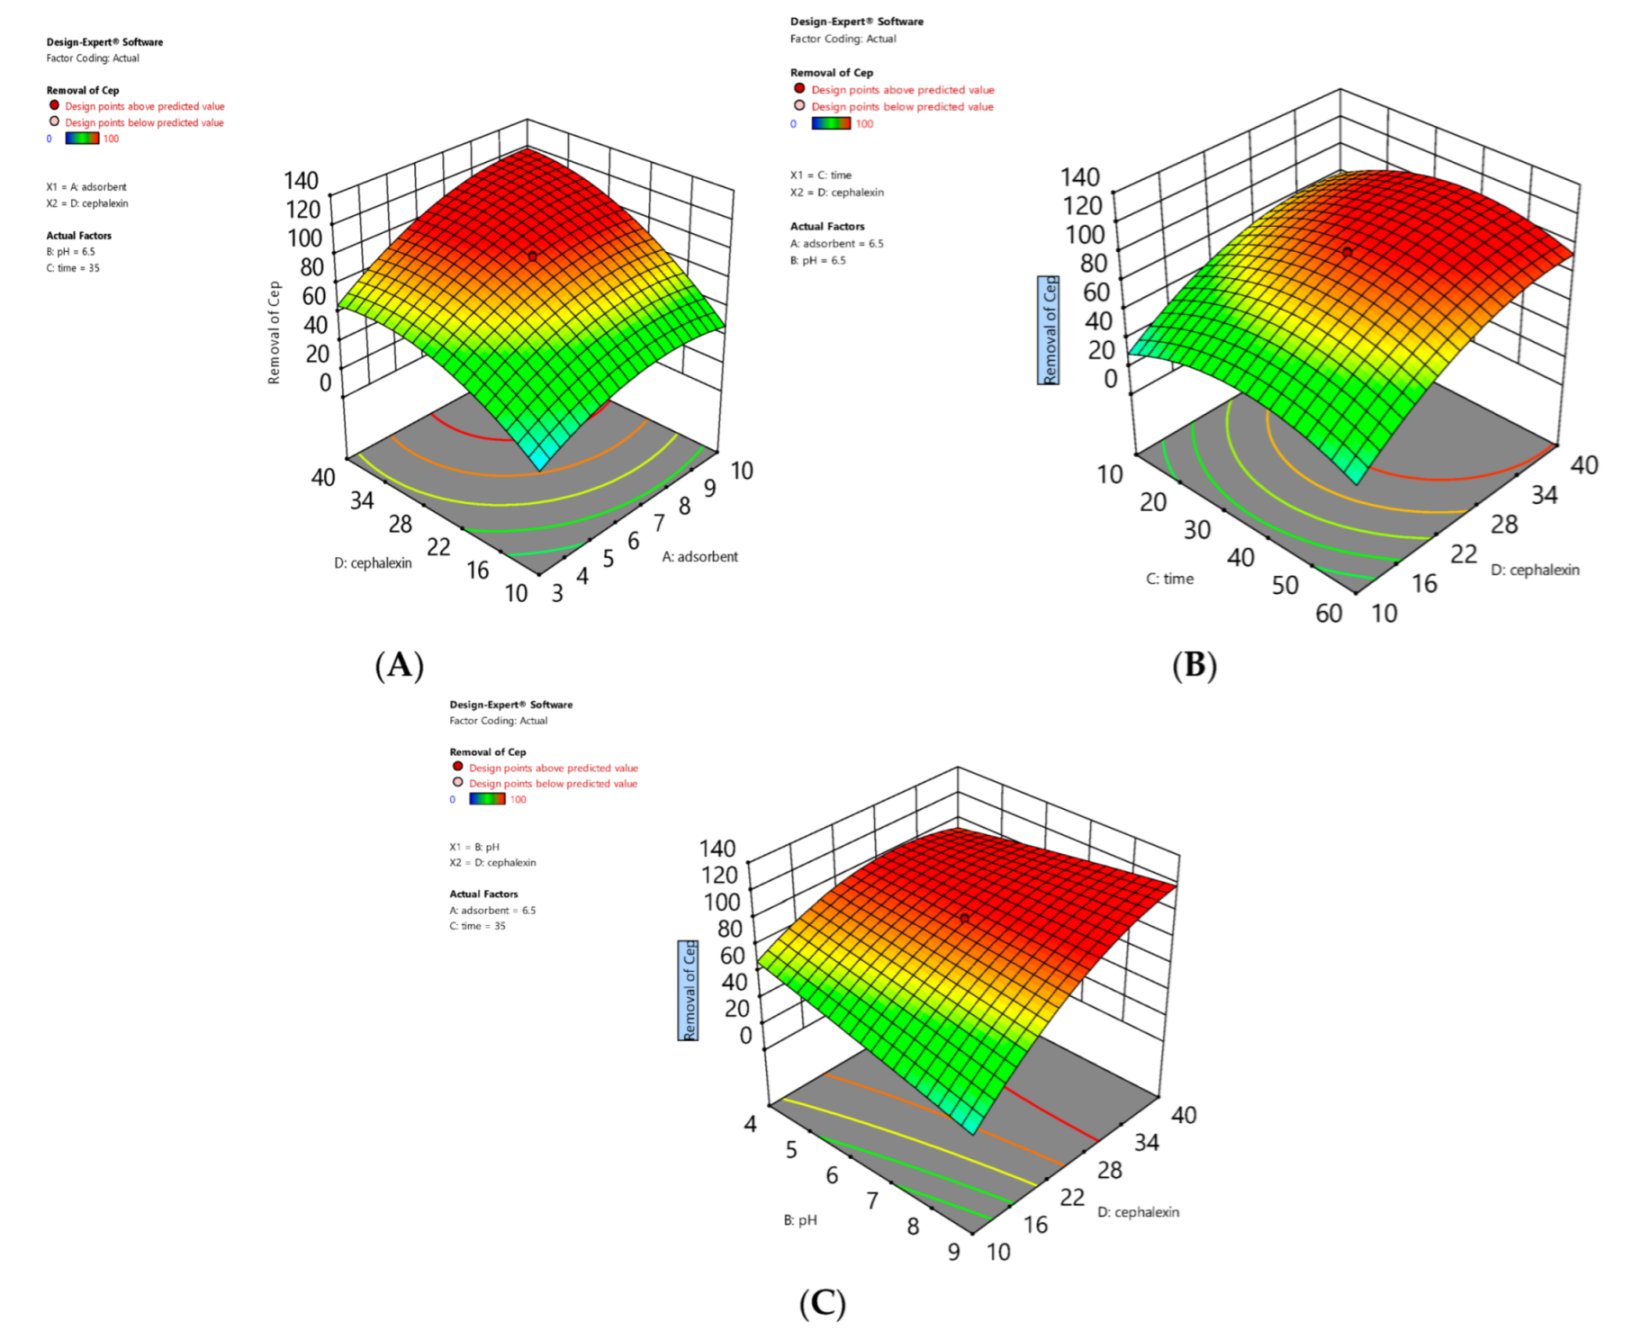
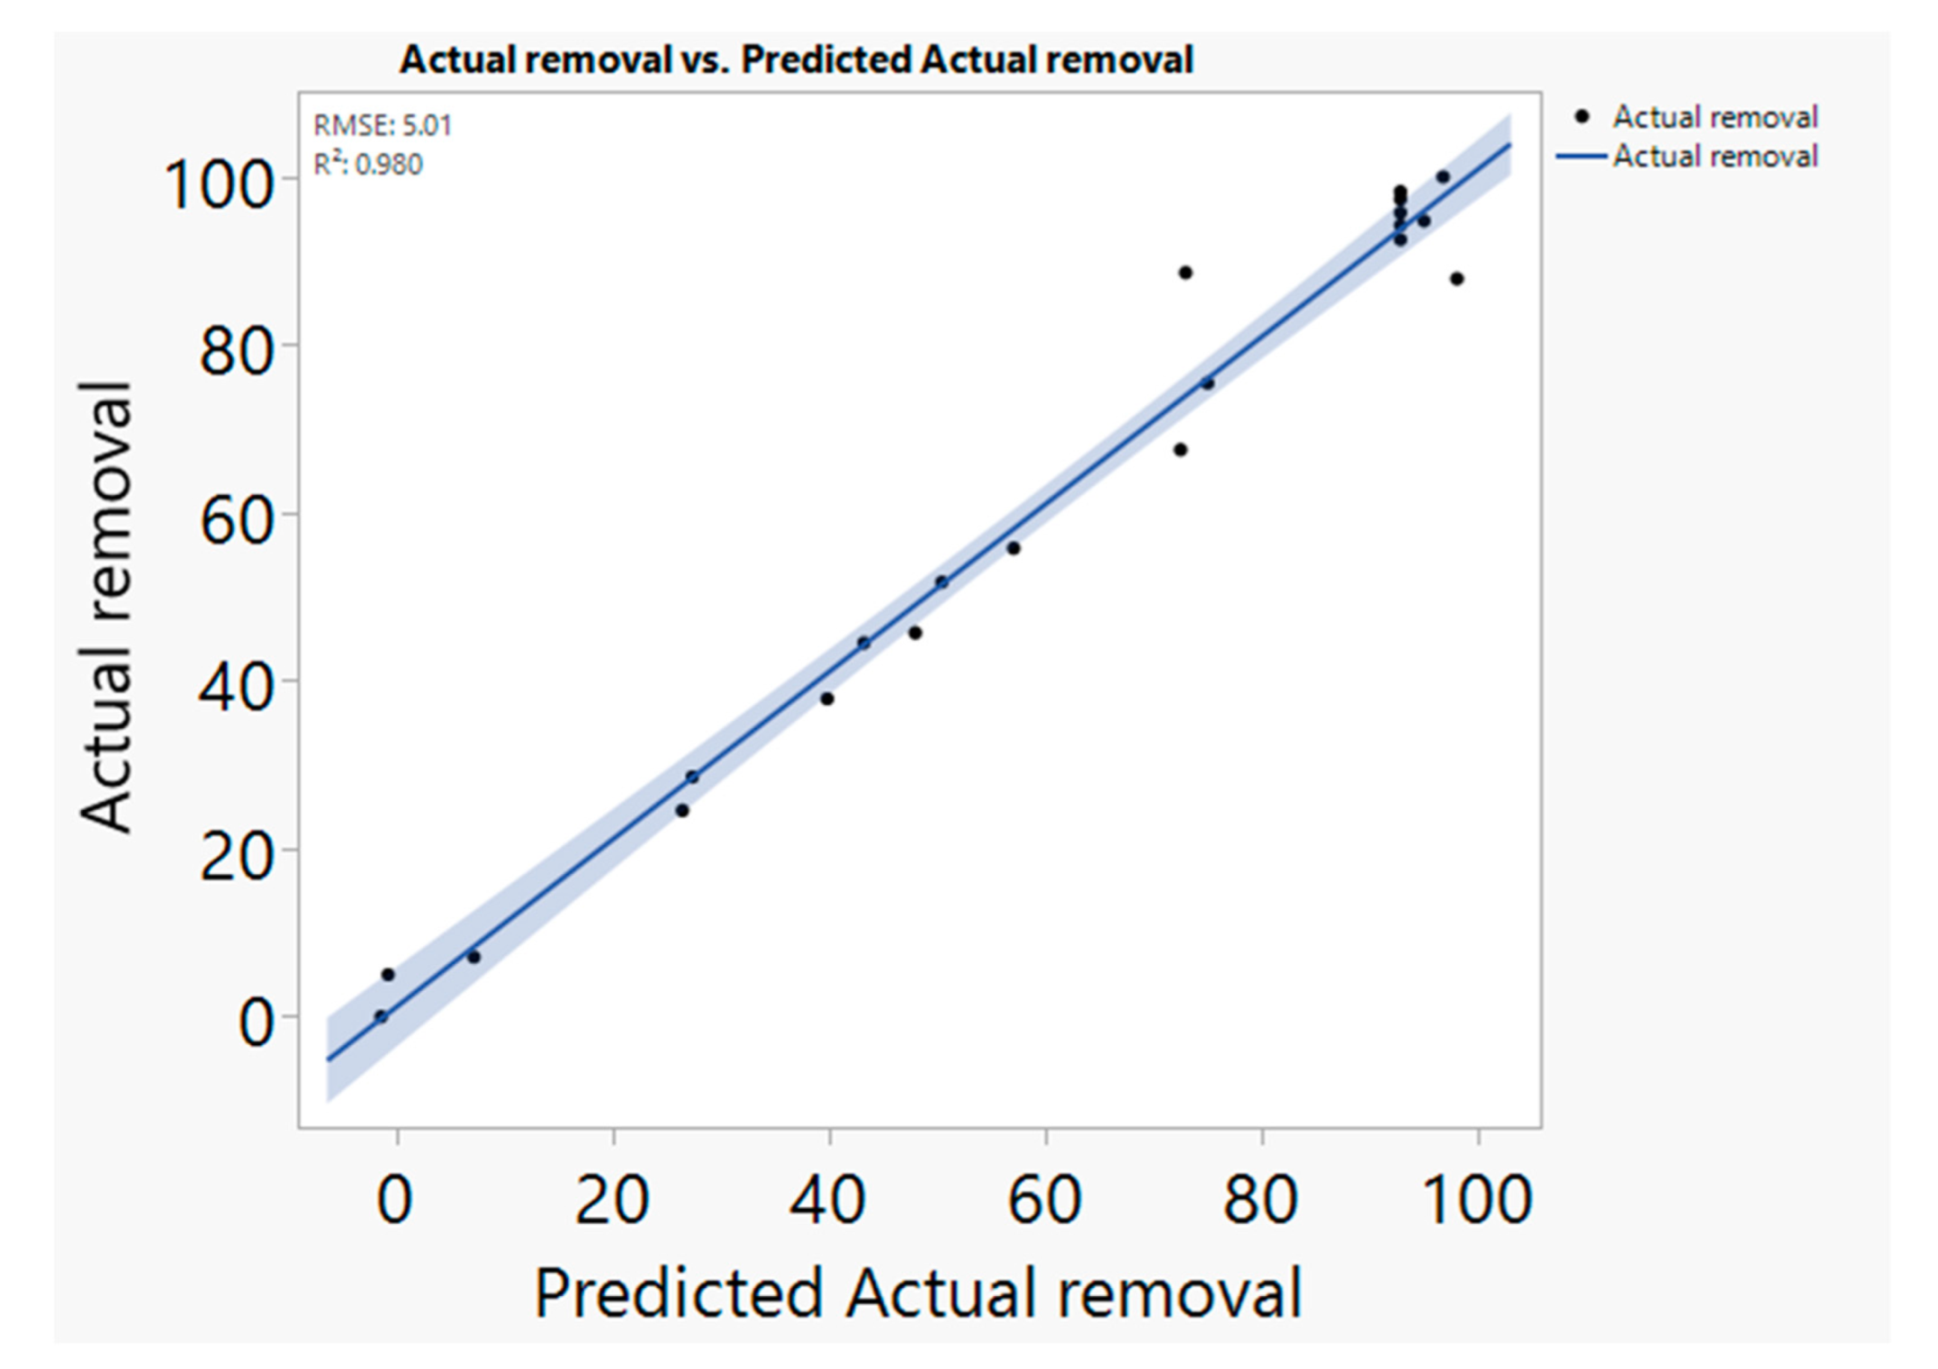
3.2. Optimization and Deep Learning Study

The optimization of CFX adsorption from aqueous solution as a function of APJAP concentration was investigated with four independent factors, including initial CFX concentration (10–50 mg/100 mL) ( x 1 ) , APJAP dosage (3–10 mg/100 mL) ( x 2 ) , time (10–60 min) ( x 3 ) , and pH (4–9) ( x 4 ) . CFX concentration was measured using a UV-vis spectrophotometer (DR6000, absorbance at 260 nm, linear calibration determined based on screening for full absorbance at different wavelengths) (Figure 3).
The results revealed that the maximum removal was recorded with 6.5 mg/100 mL of APJAP dosage, pH 6.5, after 35 min, and with 25 mg/100 mL of CFX. The predicted and actual adsorption were 96.08 vs. 98.25%, respectively (Table 1). The lowest removal was 19.80 vs. 7.10% of the predicted and actual results, respectively, with 3 mg/100 mL of APJAP dose, pH 9, after 60 min, and with 40 mg/100 mL of CFX. At high concentrations of APJAP dosage (10 mg/100 mL) the removal was 44.52 vs. 33.18% for the actual and predicted results, respectively, perhaps due to the agglomeration of the adsorbent. Acelas et al. [26] revealed that the maximum removal of CFX (>90%) was recorded at pH 6.5, 2 g/L of the adsorbent dose (palm oil fiber). Rashtbari et al. (2018) reported that the time required to achieve high CFX removal efficiency depends on CFX concentration. However, 60 min was enough to achieve more than 80% of the CFX removal. Panahi et al. [27] reported that the optimal removal of CFX (90%) by mesoporous silica materials was recorded with pH 3, 800 mg/L of the adsorbent dose, for 50 mg/L of CFX at 40 °C, and after 30 min.
The interaction between x 1 and x 2 increased the adsorption of CFX significantly (p < 0.02) (Figure 4A). However, time and pH exhibited a secondary influence on the effects and interaction on CFX adsorption (Figure 4B,C).
The equation of the first, and a quadratic model, are given in Equation (9).
𝑦𝑐𝑒𝑝 𝑟𝑒𝑚𝑜𝑣𝑎𝑙 = 132.11 − 10.38𝑥1 − 32.39𝑥2 + 2.38𝑥3 + 1.75𝑥4 + 3.9𝑥1𝑥2 − 0.05𝑥1𝑥3
+ 0.145𝑥1𝑥4 − 0.086𝑥2𝑥3 + 0.427𝑥2𝑥4 + 0.008𝑥3𝑥4 − 1.17𝑥12 − 0.155𝑥22
0.032 × 32 + 0.078𝑥42
Moreover, the ANN simulation analysis of the adsorption process of CFX was investigated using JMP software based on the independent factors used in the optimization process. The results revealed that the actual and predicted removal of CFZ exhibited similar trends, with R2 of 0.9891 vs. 0.9435, respectively (Table 2). The proposed model was tested with a variety of tests, including several validation methods R2, RMSE, MSE, RRSE, RSE, and MAE as shown in Table 3. It was observed that the correlation coefficient (R) was greater than 0.86 with a p value of less than 0.001, indicating the validity of the ANN model (Figure 5). Furthermore, MAE and RMSE were used as more accurate indicator errors than R2, which recorded a very low error in this study. According to Shahmansouri et al. [28], the interaction and correlation with more than 70% of the coefficient is considered acceptable for reflecting the strength of the mathematical models.

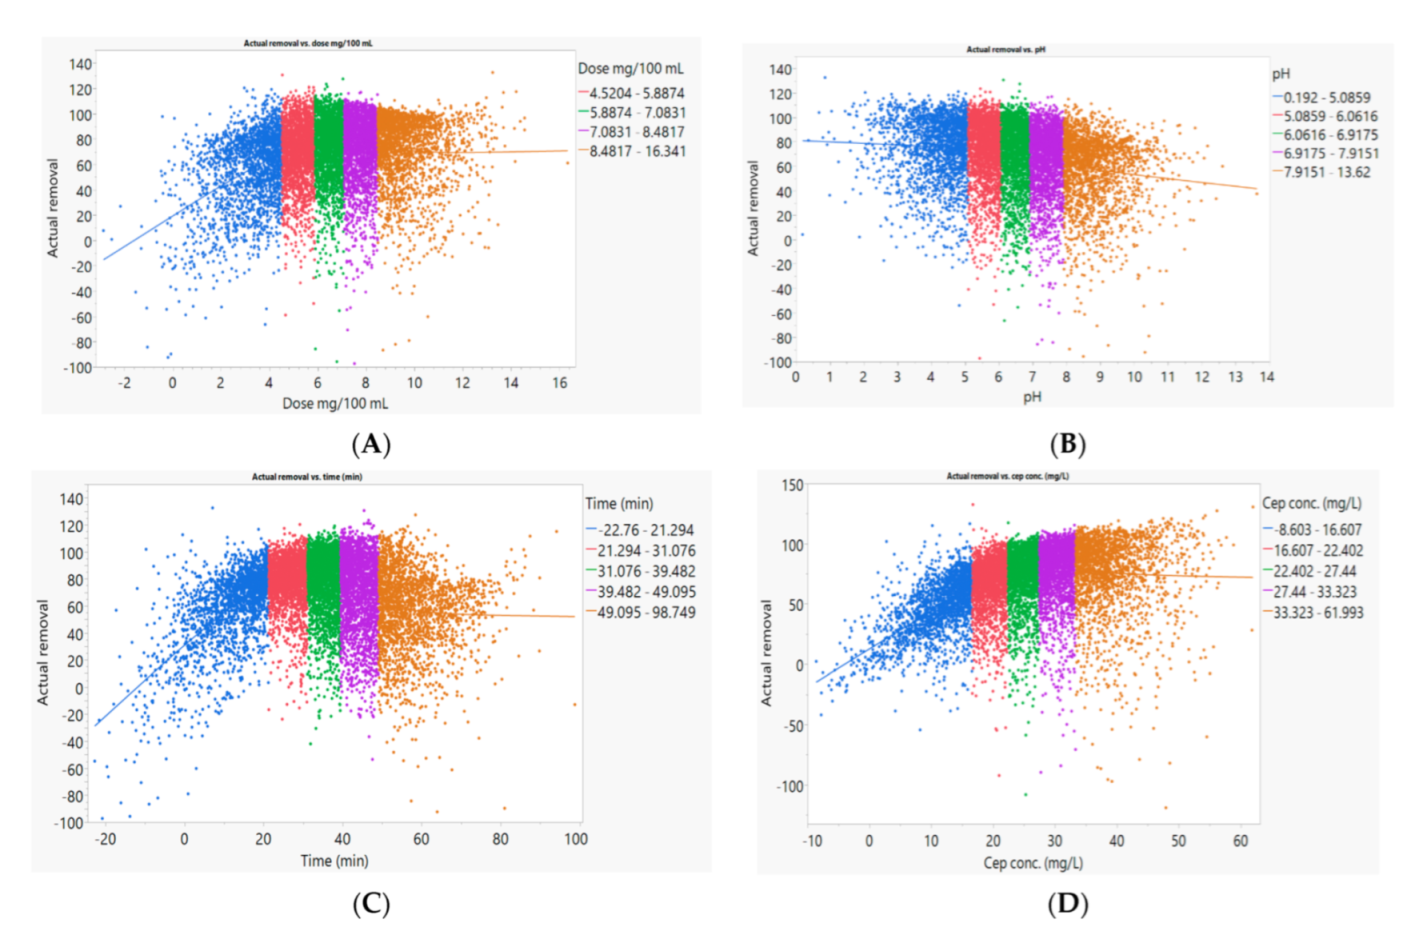
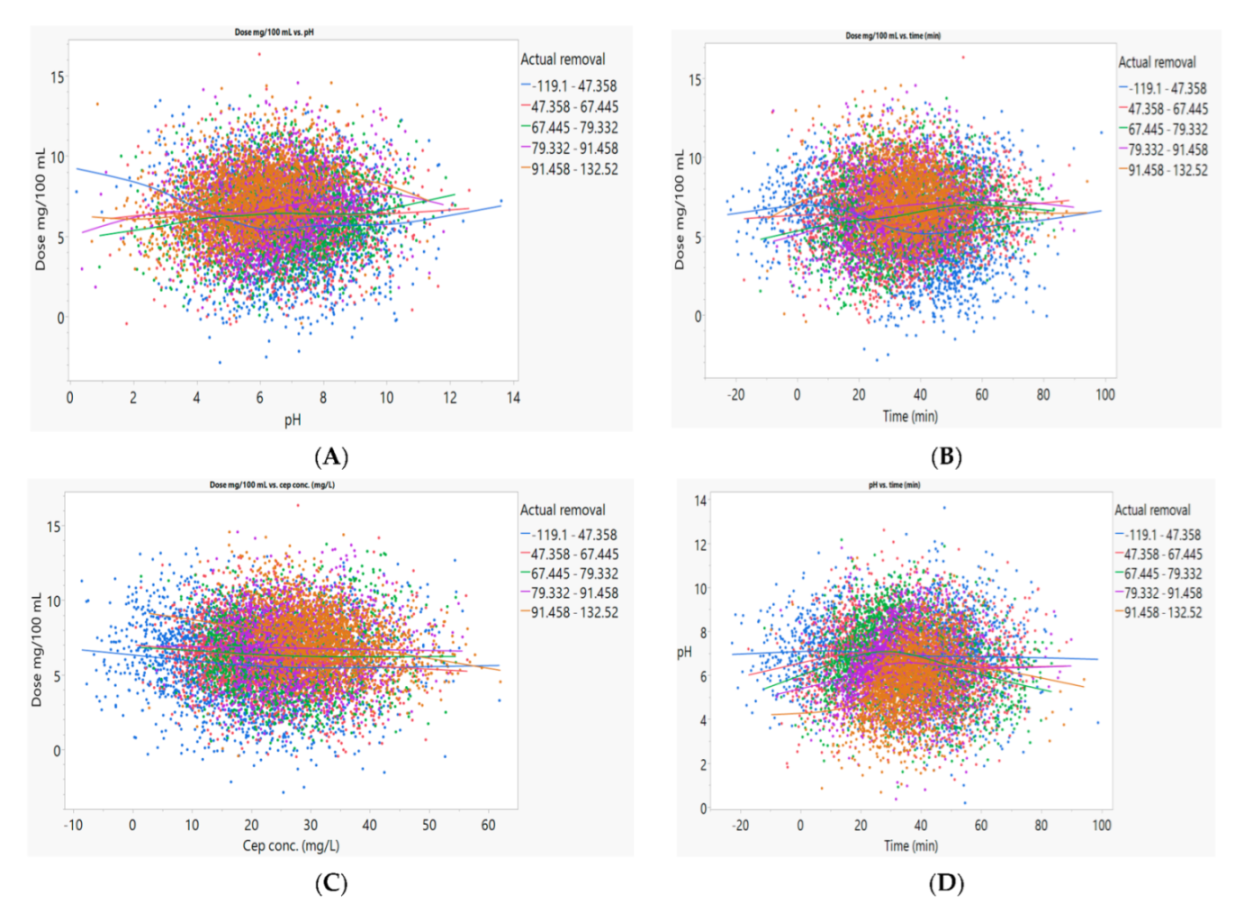
3.3. Sensitivity of CFX for Environmental Factors

The simulation for the removal of CFX using APJAP was investigated with the one-factor-at-a-time method. The results show that the APJAP exhibited a high influence on the maximum adsorption of CFX removal (100%) between 2 and 8 mg dose/100 mL (Figure 6A).
The highest adsorption capacity of APJAP was 384.62 mg CFX/g. In a comparison with previous studies, APJAP exhibited higher capacity for CFX compared to Arundo donax L. (285.71 mg of CFX/g), while it was less than for activated biochar (ACT-B), which exhibited 724.50 mg of CFX/g (Table 4).
These differences in the characteristics of adsorbents from agricultural waste may be related to the function groups and the pre-treatment processes of the adsorbent. Anthriscus sylvestris was pre-treated with HCl and high thermal temperature to produce biochar. This process provides high efficiency adsorbent with high adsorption capacity [36]. Arundo donax L. was pretreated at heat (700 °C) with iron salts, which have less efficiency in producing highly efficient adsorbent [11]. In the present study APJAP was pre-treated with HNO3 and at 105 °C; these findings indicated that the acidic treatment provides more efficient adsorbent than iron salts, but the use of high temperature alongside the acidic treatment produces more efficient adsorbents such as biochar.
In contrast, simulation of the effect of pH revealed that the best pH for CFX adsorption lies between pH 5 and 8, where the adsorption efficiency reached 100% based on the simulation process (Figure 6B). The results for the simulation of time effects are presented in Figure 6C, and it was observed that the time between 20 and 40 min is the best to achieve the highest adsorption efficiency. The results for simulating the CFX adsorption using APJAP as a function of CFX concentrations revealed that the maximum efficiency of the adsorption was recorded in the range between 20 to 40 mg CFX/100 mL (Figure 6D).
The simulation of the interaction between pH and the APJAP and effects on CFX removal is presented in Figure 7A. The adsorbent between 5 and 10 mg/100 mL and pH between 4 and 8 having a synergistic effect on the adsorption of CFX, where the removal could reach more than 90%. These findings are consistent with previous studies which mentioned the pH influences related to the effect on the adsorbent surface charge and functional groups: the CPX removal was 90% at pH 6.5, however, the removal efficiency decreases as the pH value reaches 12 [26].
Based on the simulation for the effect of time and dose on the CFX removal, it was noted that the maximum removal lies in the range of 20 to 40 min and with 5 to 10 mg dose/100 mL. At these ranges the CFX exceeded 90% (Figure 7B). Dosage and CFX concentrations are among the factors that have strong interactions during the adsorption of CFX from aqueous solutions. The simulation process revealed that maximum CFX removal (more than 90%) was recorded in CFX concentrations between 10 and 40 mg/L with a dose between 5 and 10 mg/100 mL (Figure 7C). The simulation for the interaction effects of pH and time displayed a significant improvement in the adsorption process of CFX. The optimal range of pH ranged from 4 to 9 while the time ranged from 20 to 60 min.
However, with low or high pH and at short or long adsorption times, a detectable concentration of CFX removal was achieved (Figure 7D). The simulation of the response and behavior of the CFX removal for pH and CEX concentration revealed that the CFX exhibited a positive sensitivity for increasing pH values (Figure 7E). However, the high pH might have a negative effect on adsorbing CFX. The minimum removal (<50%) was recorded at pH 10. Time and CFX concentration exhibited a correlation in the adsorption process. Increasing CFX (to 60 mg/100 mL) and time to 60 min was associated with high CFX removal efficiency (Figure 7F). There have been few studies on the interaction between environmental factors and their influence on CFX. However, the previous work indicated that the increasing of adsorbent dose is associated with high CFX removal but to a limited level, since the high-dose concentrations are agglomerated. The dose of the adsorbent has resulted in the accumulation of excess sites [37].
The interaction between pH and CFX concentration is related to the KPa of the CFZ which has an optimal range between 2 and 6. At pH (<3) CFX is available in a cationic form, while it is available in an anionic form at pH 6, at pH between 3 and 6 the CFX is available in a zwitterion form [29]. These characteristics of CFX could explain the low- affinity for low- or high-pH adsorption. The positive surface load of CPX in the NH3+ cationic group may have a negative effect on the removal efficiency. The time is considered as a secondary factor since it depends on the optimization of pH, CFX concentrations and adsorbent dosage. However, many studies have shown that when the active site is free, CFX absorption occurs very quickly [38].

4. Conclusions

The optimization and simulation of CFX sorption onto APJPA across a range of chemical parameters has been investigated herein. The dose and concentration of CFX are important factors that interact during the absorption of CFX from water solutions. The simulation process revealed that the maximum removal of CFX (more than 90%) was recorded in CFX concentrations between 10 and 40 mg/L with doses between 5 and 10 mg/100 mL. The microstructure analysis confirmed the high potential of APJPA to remove CFX due to the surface characteristics and presence several functional groups. The ANN and the simulation model provide more detail on the sensitivity of CFX to environmental factors which can be adjusted and optimized to achieve high removal efficiency. Overall, our results suggest APJPA is a highly effective and low-cost biocompatible sorbent for CFX removal from the environment. Therefore, APJPA holds great promise as a new sorbent to safeguard humankind against CFX emissions worldwide.

Author Contributions

Conceptualization, A.A.A.-G. and R.M.S.R.M.; methodology, M.S.M.S. and A.A.A.-G.; software, E.A.N.; validation, R.M.S.R.M. and A.A.A.-G.; formal analysis, A.A.A.-G.; investigation, M.S.M.S.; resources, M.N.; data curation, R.H.; writing—original draft preparation, A.A.A.-G. and E.A.N.; writing—review and editing, R.C.; supervision, A.A.A.-G. and R.C.; project administration, A.A.A.-G.; funding acquisition, M.N. All authors have read and agreed to the published version of the manuscript.

Funding

The research was supported by Ministry of Higher Education Malaysia (MOHE) for providing the Fundamental Research Grant Scheme (FRGS) with reference code: Ref: FRGS/1/2020/WAB02/UTHM/03/5, K338 as financial support for this research project. We would like to acknowledge support of the Royal Society (RGS\R1\191351). Mu. Naushad is grateful to the Researchers Supporting Project number (RSP-2021/8), King Saud University, Riyadh, Saudi Arabia for the financial support.

Institutional Review Board Statement

Not applicable.

Informed Consent Statement

Not applicable.

Data Availability Statement

Not applicable.

Acknowledgments

The research was supported by Ministry of Higher Education Malaysia (MOHE) for providing the Fundamental Research Grant Scheme (FRGS) with reference code: Ref: FRGS/1/2020/WAB02/UTHM/03/5, K338 as financial support for this research project. We would like to acknowledge support of the Royal Society (RGS\R1\191351). Mu. Naushad is grateful to the Researchers Supporting Project number (RSP-2021/8), King Saud University, Riyadh, Saudi Arabia for the financial support.

Conflicts of Interest

The authors declare no conflict of interest.

References

  1. Basheer, A.A. Chemical chiral pollution: Impact on the society and science and need of the regulations in the 21st century. Chirality 2018, 30, 402–406. [Google Scholar] [CrossRef] [PubMed]
  2. Basheer, A.A.; Ali, I. Stereoselective uptake and degradation of (±)-o, p-DDD pesticide stereomers in water-sediment system. Chirality 2018, 30, 1088–1095. [Google Scholar] [CrossRef] [PubMed]
  3. Basheer, A.A. New generation nano-adsorbents for the removal of emerging contaminants in water. J. Mol. Liq. 2018, 261, 583–593. [Google Scholar] [CrossRef]
  4. Ali, I.; Jain, C.K. Groundwater contamination and health hazards by some of the most commonly used pesticides. Curr. Sci. 1998, 75, 1011–1014. [Google Scholar]
  5. Ali, I.; Burakov, A.E.; Melezhik, A.V.; Babkin, A.V.; Burakova, I.V.; Neskomornaya, E.A.; Galunin, E.V.; Tkachev, A.G.; Kuznetsov, D.V. 2019. Kinetics, thermodynamics and mechanism of copper and zinc metal ions removal in water on newly synthesized polyhydroquinone/graphene nanocomposite material. ChemSelect 2019, 4, 12708–12718. [Google Scholar]
  6. Das, N.; Madhavan, J.; Selvi, A.; Das, D. An overview of cephalosporin antibiotics as emerging contaminants: A serious environmental concern. 3 Biotech 2019, 9, 231. [Google Scholar] [CrossRef]
  7. Polianciuc, S.I.; Gurzău, A.E.; Kiss, B.; Ştefan, M.G.; Loghin, F. Antibiotics in the environment: Causes and consequences. Med. Pharm. Rep. 2020, 93, 231. [Google Scholar] [CrossRef]
  8. Sabri, N.A.; van Holst, S.; Schmitt, H.; van der Zaan, B.M.; Gerritsen, H.W.; Rijnaarts, H.H.M.; Langenhoff, A.A.M. Fate of antibiotics and antibiotic resistance genes during conventional and additional treatment technologies in wastewater treatment plants. Sci. Total Environ. 2020, 741, 140199. [Google Scholar] [CrossRef]
  9. Liu, W.; Xie, H.; Zhang, J.; Zhang, C. Sorption removal of cephalexin by HNO3 and H2O2 oxidized activated carbons. Sci. China Chem. 2012, 55, 1959–1967. [Google Scholar] [CrossRef]
  10. Wang, T.; Pan, X.; Ben, W.; Wang, J.; Hou, P.; Qiang, Z. Adsorptive removal of antibiotics from water using magnetic ion exchange resin. J. Environ. Sci. 2017, 52, 111–117. [Google Scholar] [CrossRef]
  11. Saleem, J.; Shahid, U.B.; Hijab, M.; Mackey, H.; McKay, G. Production and applications of activated carbons as adsorbents from olive stones. Biomass Convers. Biorefinery 2019, 9, 775–802. [Google Scholar] [CrossRef] [Green Version]
  12. Blachnio, M.; Derylo-Marczewska, A.; Charmas, B.; Zienkiewicz-Strzalka, M.; Bogatyrov, V.; Galaburda, M. Activated carbon from agricultural wastes for adsorption of organic pollutants. Molecules 2020, 25, 5105. [Google Scholar] [CrossRef] [PubMed]
  13. Bhatnagar, A.; Hogland, W.; Marques, M.; Sillanpää, M. An overview of the modification methods of activated carbon for its water treatment applications. Chem. Eng. J. 2013, 219, 499–511. [Google Scholar] [CrossRef]
  14. El-Hendawy, A.N.A. Influence of HNO3 oxidation on the structure and adsorptive properties of corncob-based activated carbon. Carbon 2003, 41, 713–722. [Google Scholar] [CrossRef]
  15. Noman, E.A.; Al-Gheethi, A.; Mohamed, R.M.S.R.; Talip, B.A.; Hossain, M.S.; Altowayti, W.A.H.; Ismail, N. Sustainable approaches for removal of cephalexin antibiotic from non-clinical environments: A critical review. J. Hazard. Mater. 2021, 417, 126040. [Google Scholar] [CrossRef] [PubMed]
  16. Fu, K.; Yue, Q.; Gao, B.; Sun, Y.; Wang, Y.; Li, Q.; Zhao, P.; Chen, S. Physicochemical and adsorptive properties of activated carbons from Arundo donax Linn utilizing different iron salts as activating agents. J. Taiwan Inst. Chem. Eng. 2014, 45, 3007–3015. [Google Scholar] [CrossRef]
  17. Khanday, W.A.; Ahmed, M.J.; Okoye, P.U.; Hummadi, E.H.; Hameed, B.H. Single-step pyrolysis of phosphoric acid-activated chitin for efficient adsorption of cephalexin antibiotic. Bioresour. Technol. 2019, 280, 255–259. [Google Scholar] [CrossRef]
  18. Rashtbari, Y.; Hazrati, S.; Afshin, S.; Fazlzadeh, M.; Vosoughi, M. Data on cephalexin removal using powdered activated carbon (PPAC) derived from pomegranate peel. Data Brief 2018, 20, 1434–1439. [Google Scholar] [CrossRef]
  19. Al-Gheethi, A.; Noman, E.; Mohamed, R.M.S.R.; Talip, B.; Vo, D.V.N.; Algaifi, H.A. Cephalexin removal by a novel Cu–Zn bionanocomposite biosynthesized in secondary metabolic products of Aspergillus arenarioides EAN603 with pumpkin peels medium: Optimization, kinetic and artificial neural network models. J. Hazard. Mater. 2021, 419, 126500. [Google Scholar] [CrossRef]
  20. Arab, M.; Faramarz, M.G.; Hashim, K. Applications of computational and statistical models for optimizing the electrochemical removal of cephalexin antibiotic from water. Water 2022, 14, 344. [Google Scholar] [CrossRef]
  21. Ahmadi, S.; Ghosh, S.; Malloum, A.; Bornman, C.; Osagie, C.; Mohammadi, L.; Igwegbe, C.A. Modeling the Liquid-Phase Adsorption of Cephalexin onto Coated Iron Nanoparticles Using Response Surface and Molecular Modeling. Adsorpt. Sci. Technol. 2022, 2022, 7619063. [Google Scholar] [CrossRef]
  22. Wernke, G.; Shimabuku-Biadola, Q.L.; Dos Santos, T.R.T.; Silva, M.F.; Fagundes-Klen, M.R.; Bergamasco, R. Adsorption of cephalexin in aqueous media by graphene oxide: Kinetics, isotherm, and thermodynamics. Environ. Sci. Pollut. Res. 2022, 27, 4725–4736. [Google Scholar] [CrossRef] [PubMed]
  23. Alhasan, H.S.; Alahmadi, N.; Yasin, S.A.; Khalaf, M.Y.; Ali, G.A. Low-cost and eco-friendly hydroxyapatite nanoparticles derived from eggshell waste for cephalexin removal. Separations 2022, 9, 10. [Google Scholar] [CrossRef]
  24. Lee, C.L.; H’ng, P.S.; Paridah, M.T.; Chin, K.L.; Rashid, U.; Maminski, M.; Go, W.Z.; Nazrin, R.A.R.; Rosli, S.N.A.; Khoo, P.S. Production of bioadsorbent from phosphoric acid pretreated palm kernel shell and coconut shell by two-stage continuous physical activation via N2 and air. R. Soc. Open Sci. 2018, 5, 180775. [Google Scholar] [CrossRef] [PubMed] [Green Version]
  25. Isa, E.D.M.; Shameli, K.; Ch’ng, H.J.; Jusoh, N.W.C.; Hazan, R. Photocatalytic degradation of selected pharmaceuticals using green fabricated zinc oxide nanoparticles. Adv. Powder Technol. 2021, 32, 2398–2409. [Google Scholar]
  26. Acelas, N.; Lopera, S.M.; Porras, J.; Torres-Palma, R.A. Evaluating the removal of the antibiotic cephalexin from aqueous solutions using an adsorbent obtained from palm oil fiber. Molecules 2021, 26, 3340. [Google Scholar] [CrossRef] [PubMed]
  27. Panahi, A.H.; Ashrafi, S.D.; Kamani, H.; Khodadadi, M.; Lima, E.C.; Mostafapour, F.K.; Mahvi, A.H. Removal of cephalexin from artificial wastewater by mesoporous silica materials using Box-Behnken response surface methodology. Desalin. Water Treat. 2019, 159, 169–180. [Google Scholar] [CrossRef] [Green Version]
  28. Shahmansouri, A.A.; Bengar, H.A.; Jahani, E. Predicting compressive strength and electrical resistivity of eco-friendly concrete containing natural zeolite via GEP algorithm. Constr. Build. Mater. 2019, 229, 116883. [Google Scholar] [CrossRef]
  29. Nazari, G.; Abolghasemi, H.; Esmaieli, M.; Pouya, E.S. Aqueous phase adsorption of cephalexin by walnut shell-based activated carbon: A fixed-bed column study. Appl. Surf. Sci. 2016, 375, 144–153. [Google Scholar] [CrossRef]
  30. Shirani, Z.; Song, H.; Bhatnagar, A. Efficient removal of diclofenac and cephalexin from aqueous solution using Anthriscus sylvestris-derived activated biochar. Sci. Total Environ. 2020, 745, 140789. [Google Scholar] [CrossRef]
  31. Ahmed, M.J.; Theydan, S.K. Adsorption of cephalexin onto activated carbons from Albizia lebbeck seed pods by microwave-induced KOH and K2CO3 activations. Chem. Eng. J. 2012, 211, 200–207. [Google Scholar] [CrossRef]
  32. Kan, Y.; Yue, Q.; Liu, S.; Gao, B. Effects of Cu and CuO on the preparation of activated carbon from waste circuit boards by H3PO4 activation. Chem. Eng. J. 2018, 331, 93–101. [Google Scholar] [CrossRef]
  33. Miao, M.S.; Liu, Q.; Shu, L.; Wang, Z.; Liu, Y.Z.; Kong, Q. Removal of cephalexin from effluent by activated carbon prepared from alligator weed: Kinetics, isotherms, and thermodynamic analyses. Process Saf. Environ. Prot. 2016, 104, 481–489. [Google Scholar] [CrossRef]
  34. Yu, J.; Kang, Y.; Yin, W.; Fan, J.; Guo, Z. Removal of antibiotics from aqueous solutions by a carbon adsorbent derived from protein-waste-doped biomass. ACS Omega 2020, 5, 19187–19193. [Google Scholar] [CrossRef]
  35. Liu, H.; Liu, W.; Zhang, J.; Zhang, C.; Ren, L.; Li, Y. Removal of cephalexin from aqueous solutions by original and Cu (II)/Fe (III) impregnated activated carbons developed from lotus stalks kinetics and equilibrium studies. J. Hazard. Mater. 2011, 185, 1528–1535. [Google Scholar] [CrossRef]
  36. Pouretedal, H.R.; Sadegh, N. Effective removal of amoxicillin, cephalexin, tetracycline and penicillin G from aqueous solutions using activated carbon nanoparticles prepared from vine wood. J. Water Process Eng. 2014, 1, 64–73. [Google Scholar] [CrossRef]
  37. Mohseni-Bandpi, A.; Al-Musawi, T.J.; Ghahramani, E.; Zarrabi, M.; Mohebi, S.; Vahed, S.A. Improvement of zeolite adsorption capacity for cephalexin by coating with magnetic Fe3O4 nanoparticles. J. Mol. Liq. 2016, 218, 615–624. [Google Scholar] [CrossRef]
  38. Rashtbari, Y.; Hazrati, S.; Azari, A.; Afshin, S.; Fazlzadeh, M.; Vosoughi, M. A novel, eco-friendly and green synthesis of PPAC-ZnO and PPAC-nZVI nanocomposite using pomegranate peel: Cephalexin adsorption experiments, mechanisms, isotherms and kinetics. Adv. Powder Technol. 2020, 31, 1612–1623. [Google Scholar] [CrossRef]
Figure 1. Model of an artificial neural network (ANN) of CFX removal by adsorption process of APJAP.
Water 14 02243 g001
Figure 2. Characteristics of APJAP; (A) FE-SEM before; smooth; (B) FE-SEM after rough surface; (C) EDX of APJAP before; (D) EDX of APJAP after; (E) FTIR of APJAP before; (F) FRIR of APJAP after; (G) AFM of APJAP before; (H) AFM of APJAP after; (I) ZRD of APJAP before; (J) XRD of APJAP after.
Water 14 02243 g002aWater 14 02243 g002b
Figure 3. Absorbance of CFX before and after each adsorption run.
Water 14 02243 g003
Figure 4. Optimization of CFX adsorption using APJPA as a function of initial CFX concentration (10–50 mg/100 mL) ( x 1 ) , APJAP dosage (3–10 mg/100 mL) ( x 2 ) , time (10–60 min) ( x 3 ) , and pH (4–9) ( x 4 ) .
Water 14 02243 g004
Figure 5. Behavior of CFX adsorption using APJPA for the independent factors and fitting between actual data ( y a ) and predicted data ( y p ) .
Water 14 02243 g005
Figure 6. Factors affecting CFX adsorption using APJPA; (A) effect of APJPA (mg/L), (B); pH; (C) Effect of time (min); (D) CFX concentrations (mg/L).
Water 14 02243 g006
Figure 7. Interaction between independent factors and their influences on CFX adsorption, (A) interaction between pH and dose (mg/L); (B) interaction between time and dose (mg/L); (C) interaction between CFX (mg/L) and dose (mg/L); (D) interaction between time (min) and pH; (E) interaction between CFX (mg/L) and pH; (F) interaction between CFX (mg/L) and time (min).
Water 14 02243 g007aWater 14 02243 g007b
Table 1. Screening for factors affecting CFX adsorption with APJPA.
Runx1x2x3x4Removal
ActualPredicted
140.0010.0010.004.0044.5233.18
2−0.236.5035.006.500.00−0.96
325.0012.3935.006.5087.8886.92
410.003.0010.004.0067.5156.18
540.0010.0060.004.0055.7968.49
625.006.5035.006.5092.5496.08
725.006.5035.006.5095.7596.08
810.0010.0060.009.0028.5541.25
910.0010.0010.009.0051.7440.41
1025.006.50−7.046.505.0032.61
1125.006.5077.046.5075.4545.91
1225.006.5035.002.30100.0099.04
1310.003.0060.004.0045.7158.41
1425.000.6135.006.5024.5623.60
1525.006.5035.0010.7088.6187.64
1640.003.0060.009.007.1019.80
1750.236.5035.006.5094.7793.81
1825.006.5035.006.5097.3596.08
1925.006.5035.006.5098.2596.08
2025.006.5035.006.5094.2596.08
2140.003.0010.009.0037.8626.53
Initial CFX concentration (10–50 mg/100 mL) (x1), APJAP dosage (3–10 mg/100 mL) (x2), time (10–60 min) (x3), and pH (4–9) (x4).
Table 2. Model validation using ANN analysis.
Actual RemovalActual Removal
MeasuresValueMeasuresValue
RSquare0.9891RSquare0.9435
RASE3.4193RASE8.649
Mean Abs Dev2.381Mean Abs Dev6.805
-Log likelihood45.022-Log likelihood14.3055
SSE198.75SSE299.23
Sum Freq17Sum Freq4
Table 3. Statistical validation methods of CFX adsorption using APJAP.
ItemCFX Removal
MSE55.03
RMSE7.41
RAE−0.028
MAE1.61
RSE2.23
RRSE1.49
Table 4. Comparison between adsorption capacity of APJPA used in the present study and previous studies.
AdsorbentAdsorption Capacity (mg g1)Synthesis MethodReferences
Anthriscus sylvestris724.50A. sylvestris powder was mixed with ceramic combustion tanks, treated with HCl and NaOH and heat activation[25]
Acidic pretreated jackfruit adsorbent (APJPA)384.62Jackfruit was pre-treated with HNO3This study
Arundo donax L.285.71Arundo donax L. is treated with iron salt and activated at 700 degrees C.[16]
Chitin-AC245.19Chitin–AC is produced by activating phosphorus acid in a single step.[17]
Walnut shell233.10The chemical activation method uses the supply of ZnCl2 and the thermal activation method[29]
The alnut shell AC233.00
KOH AC137.00Treatment with KOH and K2CO3 solutions.[30]
Circuit boards106.48Pre-treatment with CuO and heat activation at 450 °C[31]
Alligator weed AC90.00Chemical treatments using phosphorus and NaOH and thermal activation[32]
PPWF-doped Phragmites australis (PA)85.82Carbon adsorbent obtained from the dopamine pigmites australis (PA) of PWF, a dust puffed waterfowl.[33]
Walnut shell AC81.60Pre-treatment with ZnCl2 solutions and heat treatments.[34]
Lotus stalk78.12Pretreated with H3PO4 and heat activation.[35]
Publisher’s Note: MDPI stays neutral with regard to jurisdictional claims in published maps and institutional affiliations.

