Article

Possible Increases in Floodable Areas Due to Climate Change: The Case Study of Calabria (Italy)

by
Giuseppe Barbaro
1,*,
Giuseppe Bombino
2,
Giandomenico Foti
1,
Giuseppina Chiara Barillà
1,
Pierfabrizio Puntorieri
1 and
Pierluigi Mancuso
3
1
DICEAM Department, Mediterranea University of Reggio Calabria, 89122 Reggio Calabria, Italy
2
Agriculture Department, Mediterranea University of Reggio Calabria, 89122 Reggio Calabria, Italy
3
Public Works Department, Calabria Region, Viale Europa Loc. Germaneto, 88100 Catanzaro, Italy
*
Author to whom correspondence should be addressed.
Water 2022, 14(14), 2240; https://doi.org/10.3390/w14142240
Submission received: 1 May 2022 / Revised: 13 July 2022 / Accepted: 14 July 2022 / Published: 16 July 2022
(This article belongs to the Special Issue Assessment of Current and Future Vulnerability of Coastal Flooding)

Abstract

:
Coastal flooding is an important current issue due to climate change and due to significant increases in anthropogenic pressures observed in the second half of the last century. Indeed, climate change has been causing an increase in the frequency and the intensity of various natural events such as floods and sea storms; anthropogenic pressures have caused an increase in impermeable surfaces with negative consequences on the vulnerability of territories under the action of natural events. In this paper, we analyze the effects of climate change in terms of possible increases in floodable areas and in terms of population, infrastructure, coastal dunes, and sites of social, economic, and strategic interest exposed along the coasts of the region of Calabria in southern Italy. Calabria was chosen as a case study due to its geomorphological peculiarities and its considerable anthropogenic pressures. These peculiarities cause significant variability of weather and sea conditions among the different coastal areas, which influences the coastal dynamics and the characteristics of meteorological events. The main results show that, in the analyzed areas, the floodable areas double between current and future scenarios, involving both significant percentages of the population and railways, highways, industrial areas, and coastal dunes.

1. Introduction

Climate change caused by global warming is a very topical issue. Indeed, in recent years, the average temperature of the Earth has significantly increased to levels never seen in recent times. Furthermore, at the end of the last century, several international panels were established with the aim to monitor the current state of climate change and its prospects, to assess their possible causes, and to identify possible mitigation strategies. The most important of these panels is the Intergovernmental Panel on Climate Changes (IPCC), a scientific advisory panel of the United Nations established in 1988 and based on a committee of thousands of scientists from several countries.
In its sixth and latest climate report [1], the IPCC highlighted that during the period 2011–2020 the global average temperature of the Earth was 1.09 °C higher than that during the period 1850–1900. In addition, it highlighted that, in 2019, the atmospheric concentrations of CO2, the main greenhouse gas, were the highest in the last two million years. An important consequence of this warming is the average sea level rise [2,3,4]. According to the latest IPCC report [1], the average sea level globally increased by 20 cm between 1901 and 2018. Because of this, it is necessary to increase the protection of coastlines [5]. Furthermore, the average rate of average sea level rise was 1.3 mm/year between 1901 and 1971, while between 2006 and 2018, it reached 3.7 mm/year. This increase was accelerated due to the melting of the Greenland glaciers, the Antarctic polar ice cap, and the thermal expansion of the ocean caused by its warming [6]. As a result, future projections are even greater. Indeed, the global average sea level is expected to rise throughout the 21st century. As compared with 1995–2014, the probable increase will be between 0.28 and 0.55 m by 2100 in the very low GHG emissions scenario (SSP1-1.9) and between 0.63 and 1.01 m in a very high emissions scenario (SSP5-8.5). Alternatively, the estimated increase by 2150 is between 0.37 and 0.86 m in a very low scenario (SSP1-1.9) and between 0.98 and 1.88 m in a very high scenario (SSP5-8.5). Nevertheless, a rise of about 2 m by 2100 and about 5 m by 2150 is possible in a very high greenhouse gas emissions scenario (SSP5-8.5).
The effects of sea level rise are not uniform but depend on the geomorphological and climatic characteristics of each coastal area. These effects are particularly relevant in low-lying coastal areas such as alluvial coastal plains and delta river mouths [7]. Therefore, sea level rise is a widely investigated issue. Lambeck et al. [8] analyzed a possible sea level rise scenario along the Italian coast in the year 2100 based on a lower and a higher scenario combined with local isostatic tectonic values. The lower scenario was the “low-impact” B1 projection of the IPCC [9] and the higher scenario was that of Rahmstorf [10]. Galassi and Spada [11] analyzed sea level rise in the Mediterranean Sea by 2050 due to terrestrial ice melt, glacio-isostatic, and steric sea-level components. Zviely et al. [12] examined the effects of sea level rise between 0.5 and 1 m on various types of marine structures, such as ports, detached breakwaters, sea walls, and bathing beach infrastructures. Aucelli et al. [13] assessed the coastal inundation risk due to sea level rise, assuming the best and the worst conditions of the IPCC report of 2014 [14] and due to subsidence in the Volturno coastal plain in Southern Italy. Similar to a study by Lambeck et al. [8], Antonioli et al. [15] analyzed a possible sea level rise scenario along the main Italian coastal plains in the year 2100 based on the scenario of Rahmstorf [10] and the RPC-8.5 scenario of the IPCC report of 2014 [14,16]. Da Lio and Tosi [17] analyzed the vulnerability of sea level rise, assuming the RPC-8.5 scenario of the IPCC report of 2014 [14,16], of the Po River delta in Northern Italy. Ju et al. [18] analyzed the floodable areas until 2100 due to sea level rise, under 24 climate scenarios with two greenhouse gas concentration levels, and due to storm surge in the San Francisco Bay, a highly urbanized area. Mills et al. [19] analyzed the impact of sea level rise in the Guadiana Estuary, in the Southern Iberian Peninsula, based on the intermediate and the worst conditions of the IPCC report of 2014 [14,16]. De Lima et al. [20] analyzed a possible sea level rise scenario along the Brazilian coast in the year 2100 based on the intermediate and the worst conditions of the IPCC report of 2014 [14,16]. Roy et al. [21] analyzed the impact of sea level rise on coastal areas of Bangladesh and possible adaptive measures. In addition, climate change has consequences on wave motion [22,23,24,25,26,27,28,29,30] and on the increase in frequency and intensity of various natural events such as floods, sea storms, and extreme events [31,32,33,34,35,36,37]. These events, in addition to average sea level rise, can cause coastal erosion [38,39,40,41] and coastal flooding phenomena [42,43,44,45,46]. Additionally, the significant increase in anthropogenic pressures observed in the second half of the last century [47,48,49,50,51,52,53] have caused an increase in impermeable surfaces, with negative consequences on vulnerability of territories under the action of climate change and natural events, especially in the case of concurrent events [54,55,56,57,58].
In this paper, we analyze the effects of climate change in terms of possible increases in floodable areas along the coasts of the region of Calabria in southern Italy. Calabria represents an interesting case study due to its geomorphological peculiarities and due to its considerable anthropogenic pressures. These peculiarities cause significant variability of weather and sea conditions among the different coastal areas, which influences the coastal dynamics and the characteristics of the meteorological events. The analysis was carried out in over 50 sample areas.

2. Materials and Methods

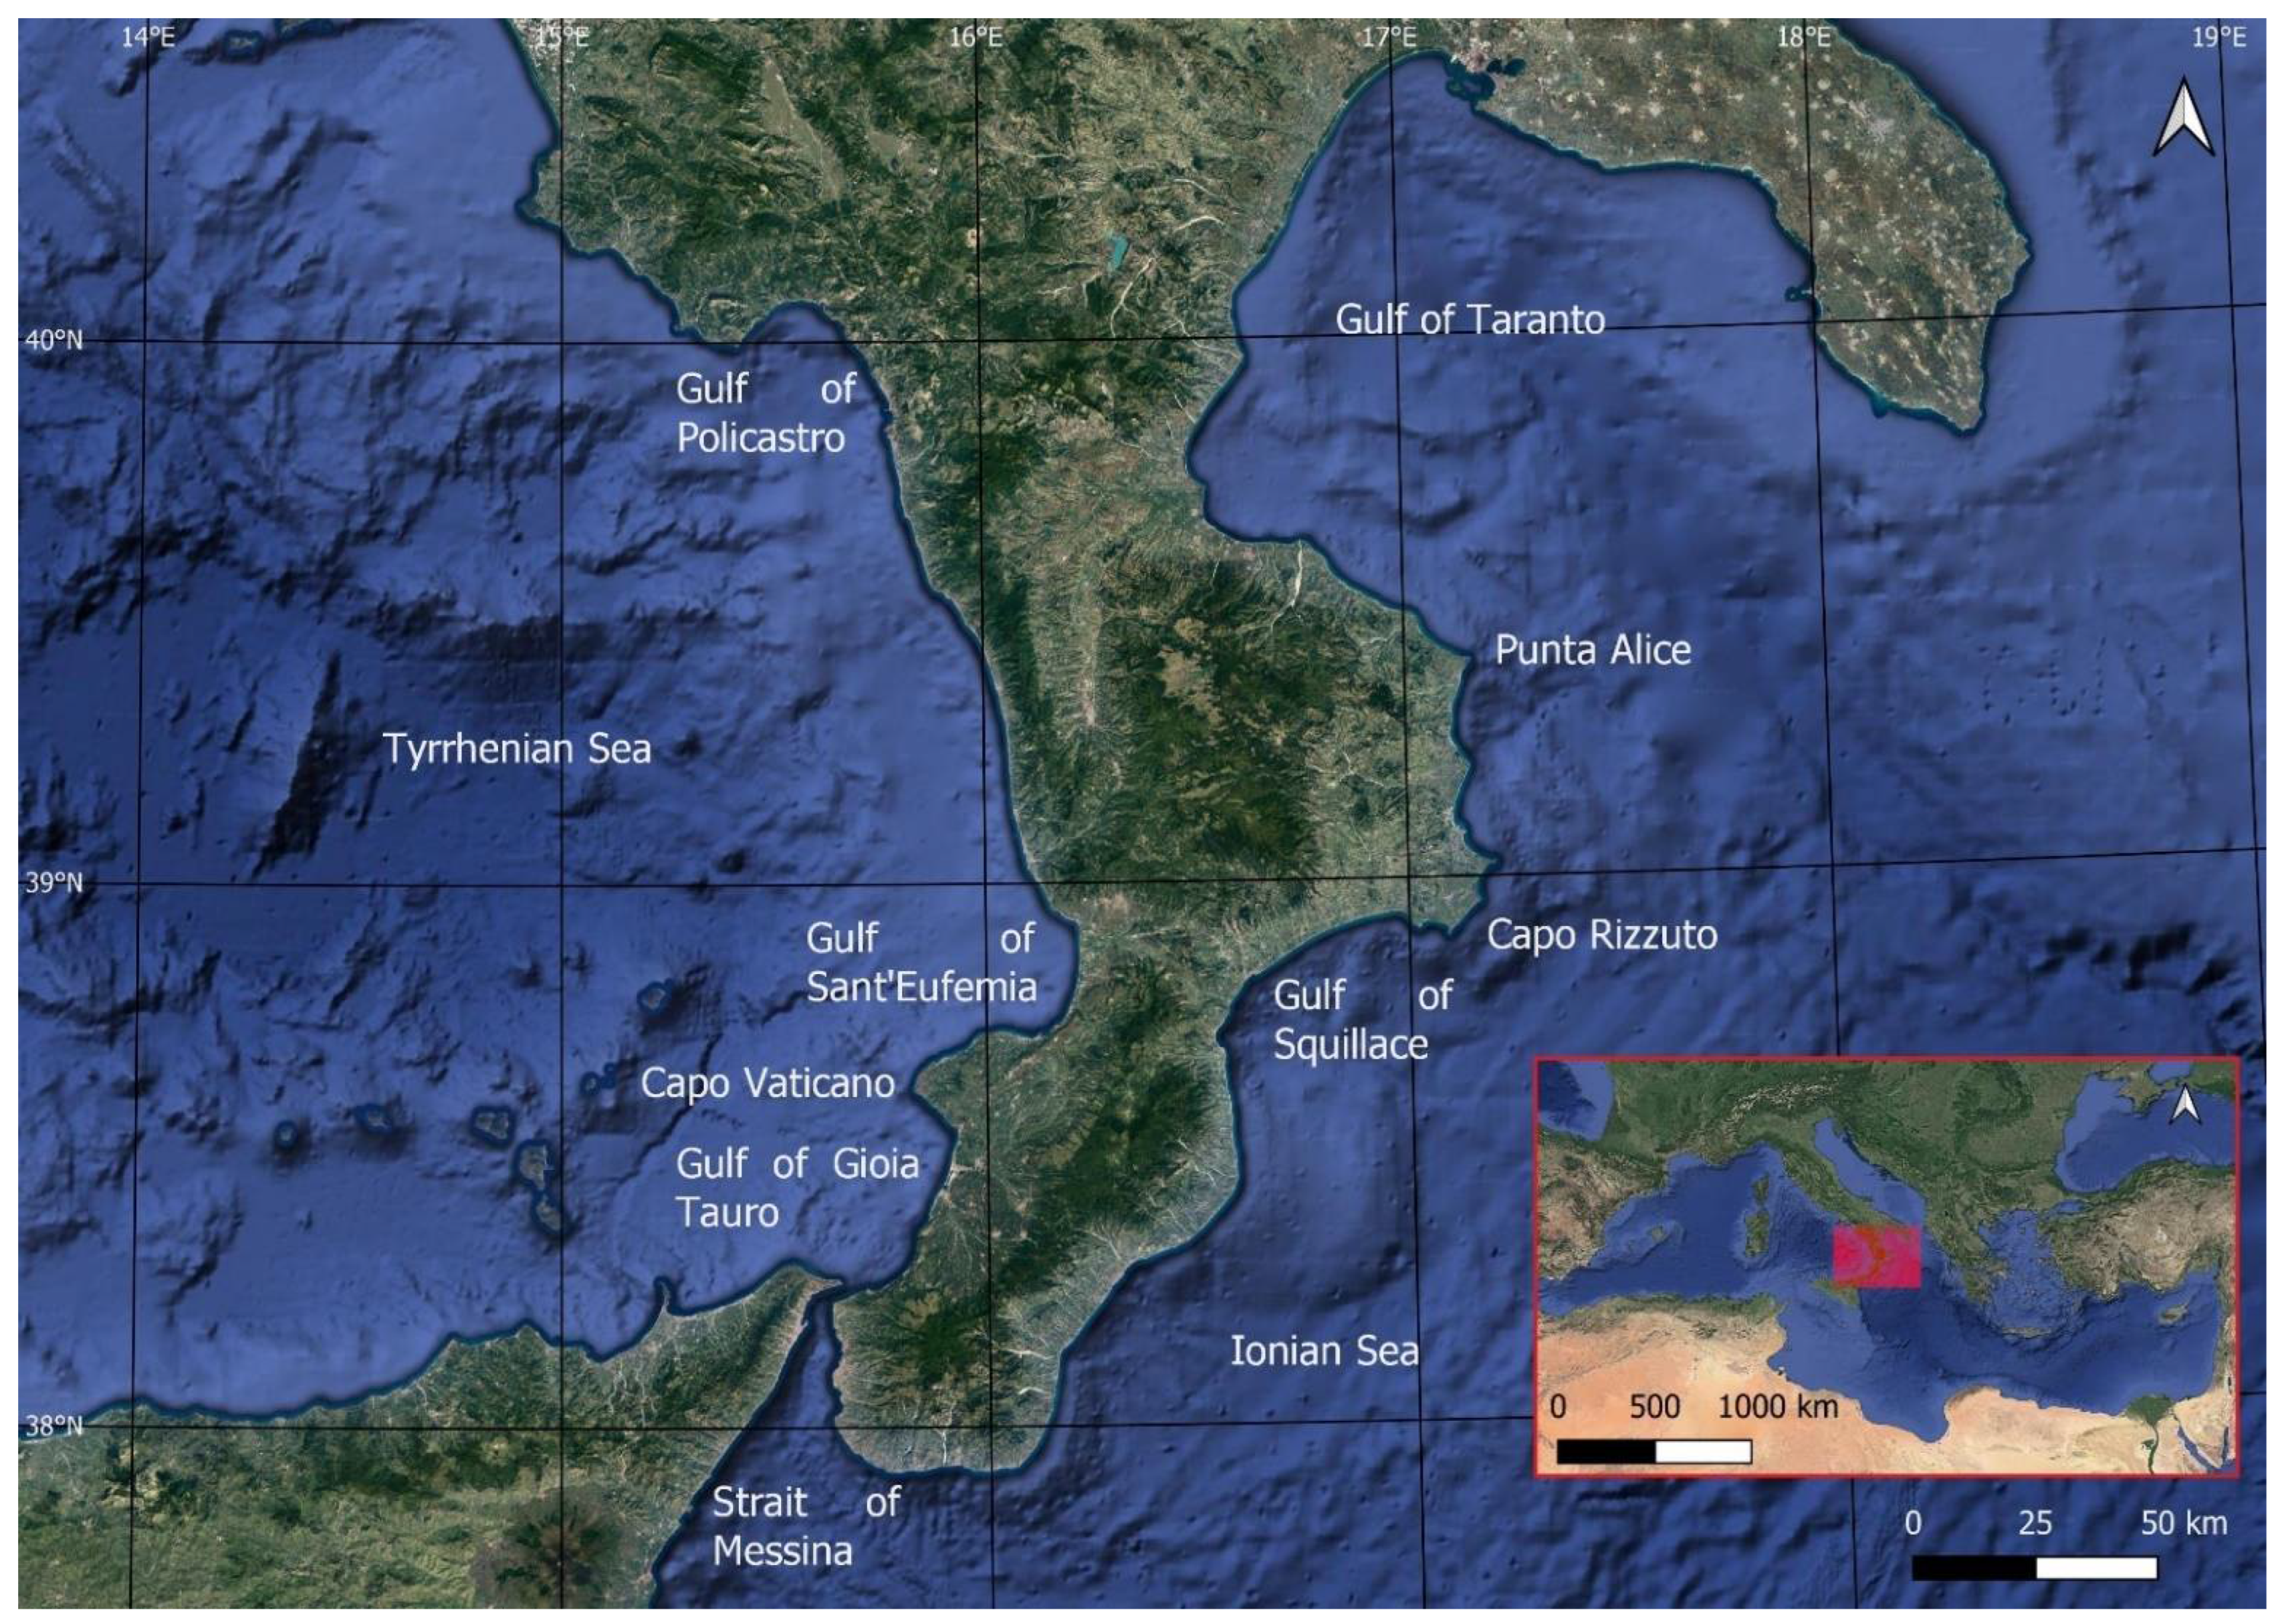
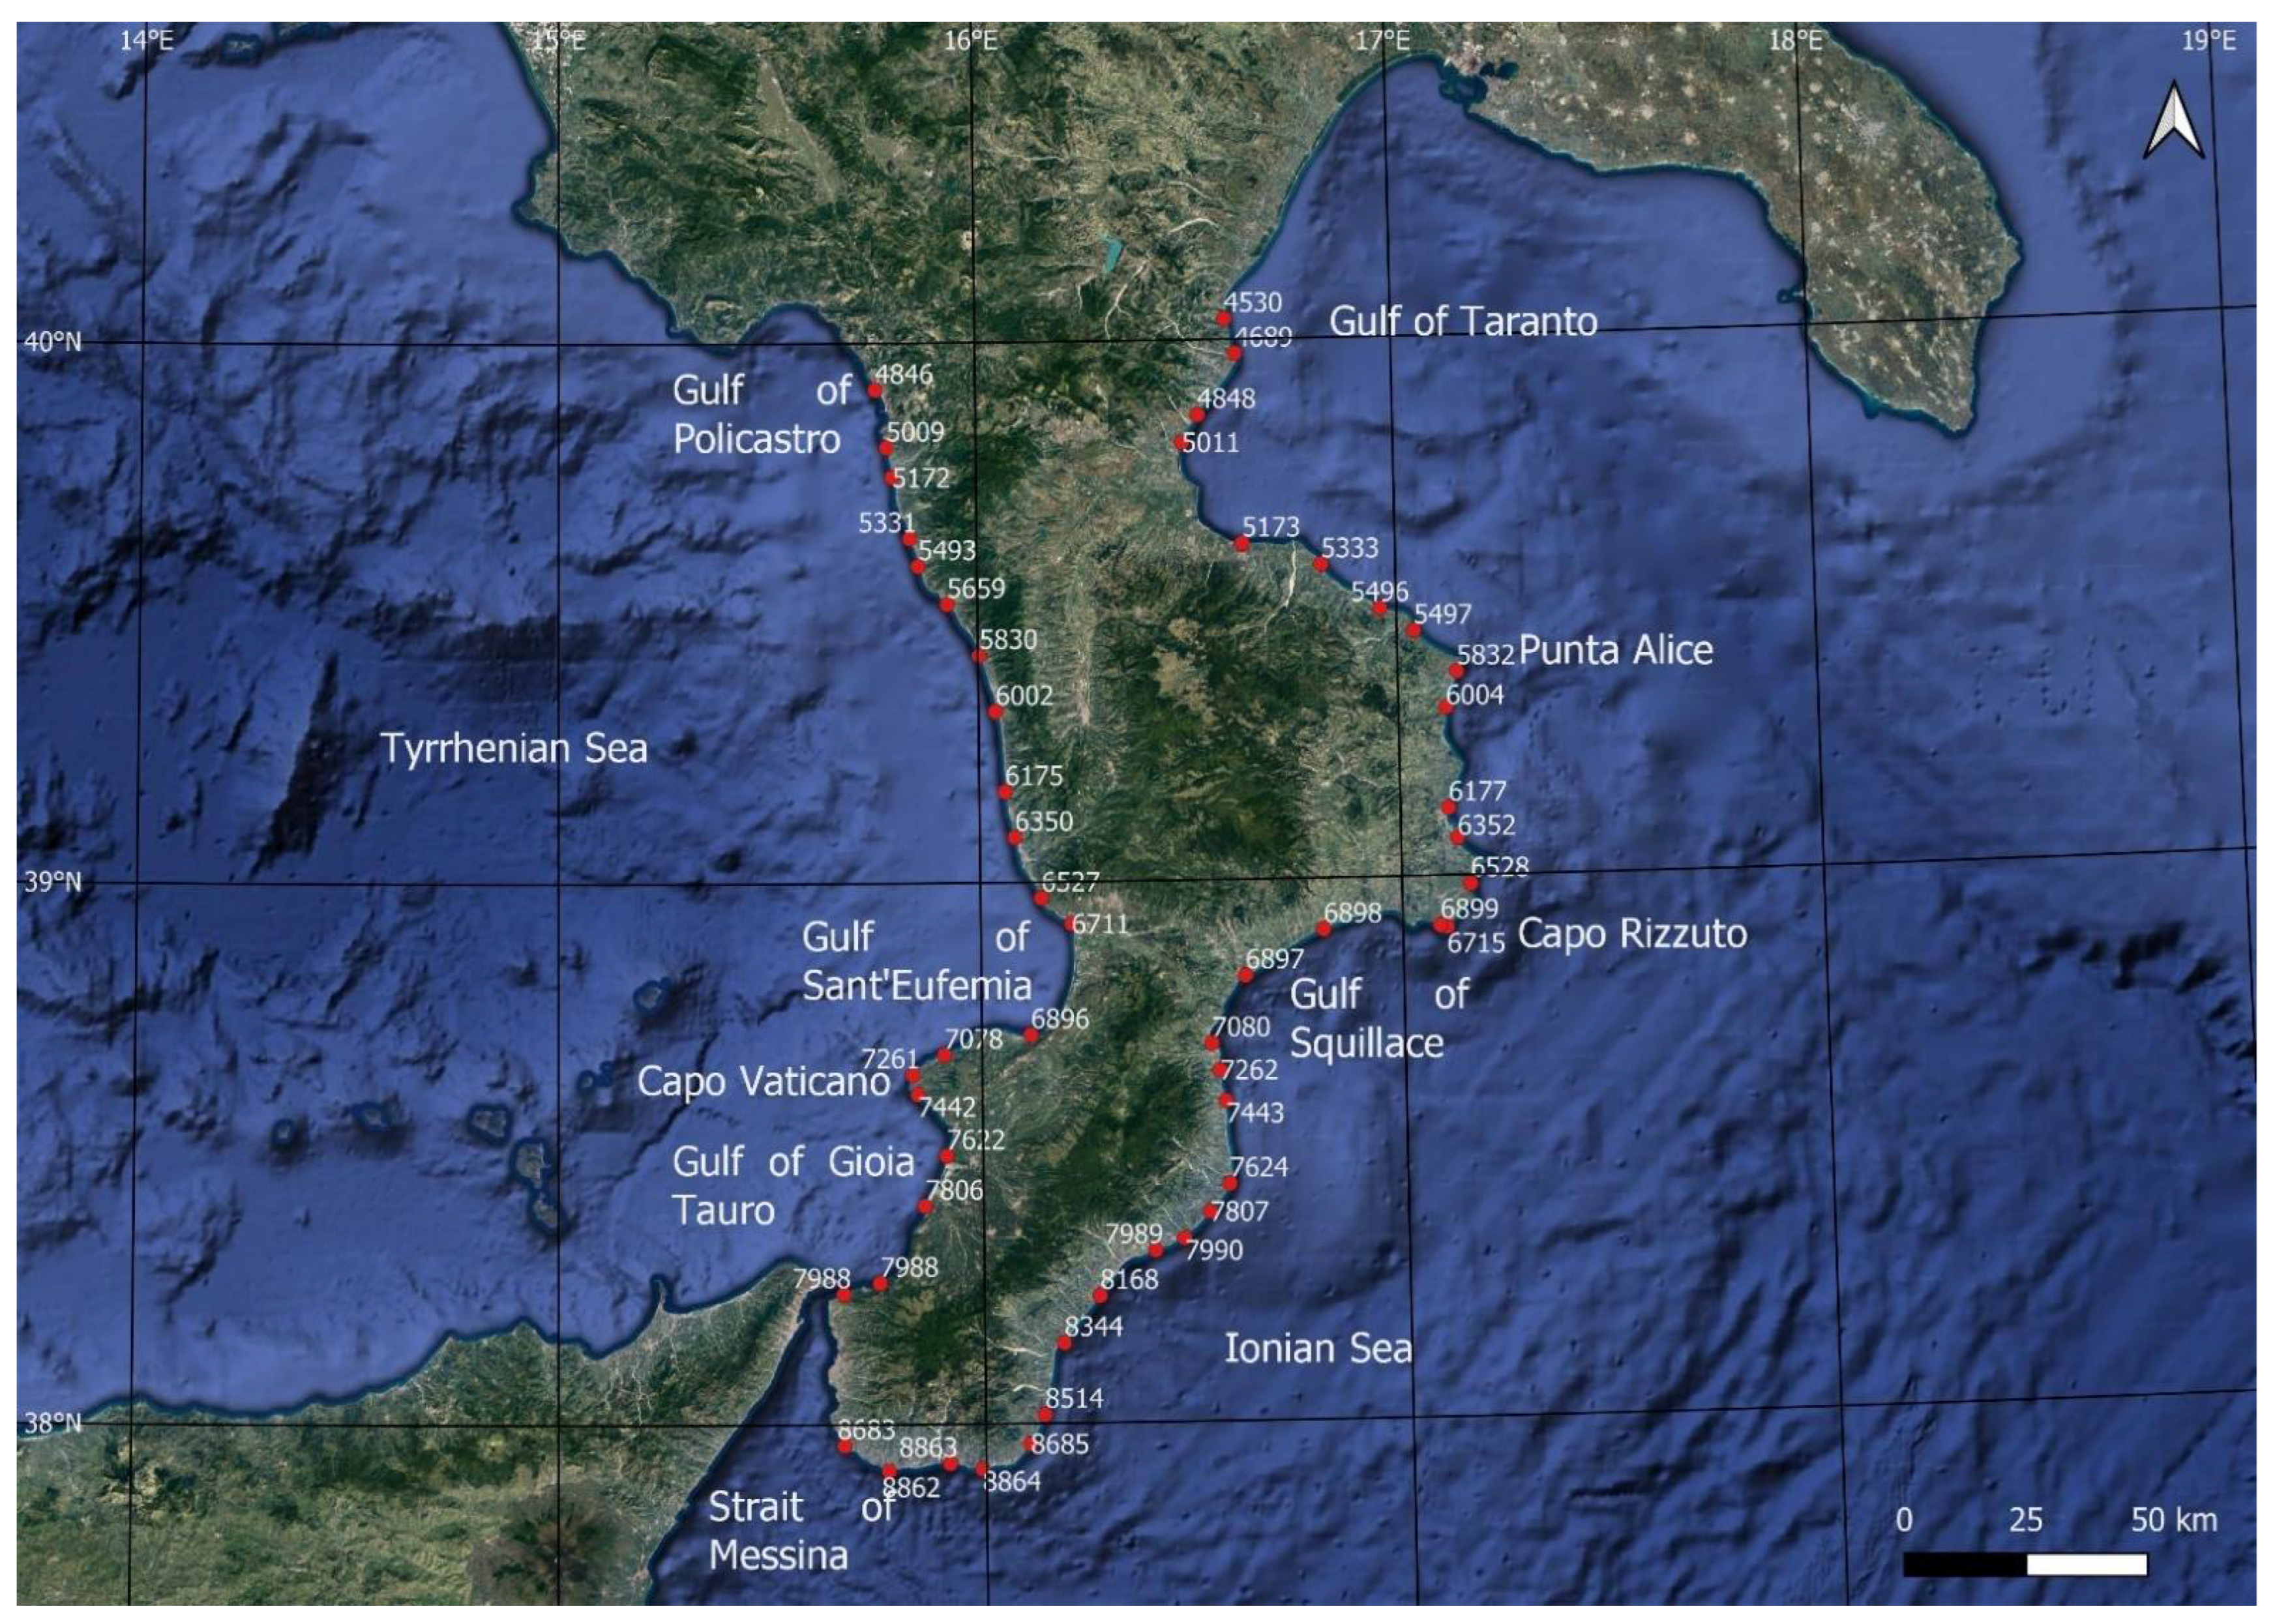
2.1. Site Description

Calabria is an interesting case study for a floodable area analysis due to considerable anthropization of many of its coastal areas, its geographical position, and some geomorphological and climatic peculiarities.
Regarding the anthropogenic pressure, in the last 70 years in Calabria, there have been considerable increases in the number and the extent of inhabited centers near the shoreline, which has grown from 32 in the 1950s to 83 today and from about 15 km2 in the 1950s to more than 250 km2 today [59]. This process occurs especially in the northern Tyrrhenian Sea coastal areas.
From a geographical position point of view, the region of Calabria is in southern Italy, in the center of the Mediterranean Sea; it is a peninsula with a total coastal length of about 750 km (Figure 1). In fact, it is bathed by the sea to the south, east, and west and is connected to the Italian peninsula only to the north, through a strip of land about 75 km long. The eastern coast of Calabria is located on the Ionian Sea, this sea is bordered by Greece to the east and by the Libyan Sea to the south and is characterized by depths of over 5000 m and by fetch lengths in the order of hundreds of kilometers, up to over 1000 km. The western coast of Calabria is located on the Tyrrhenian Sea, this sea is bordered by Corsica and Sardinia to the west, by Sicily to the south, and by the Island of Elba and the Italian peninsula to the north; it is characterized by depths of about 3800 m and by fetch lengths in the order of hundreds of kilometers, up to over 700 km. Within the Ionian Sea there are two gulfs, Taranto and Squillace. The Gulf of Taranto is in the northern part of Calabria and is characterized by depths of about 1500 m and by fetch lengths up to about 130 km. The Gulf of Squillace is in the central part of Calabria and is characterized by fetch lengths up to about 60 km. In addition, within the Tyrrhenian Sea, there are three gulfs, Policastro, Sant’Eufemia, and Gioia Tauro. The Gulf of Policastro is in the northern part of Calabria and is characterized by fetch lengths up to about 30 km. The Gulf of Sant’Eufemia is in the central part of Calabria and is characterized by depths of about 200 m and by fetch lengths up to about 30 km. The Gulf of Gioia Tauro is in the southern part of Calabria and is characterized by fetch lengths up to about 40 km. Finally, in its southern part, Calabria is separated from Sicily by the Strait of Messina. This strait is characterized by depths of up to 2000 m and by fetch lengths that vary between 3 and 30 km.
From a geomorphological point of view, 90% of the Calabrian territory is mountainous or hilly. The main massifs are Pollino, Sila, and Aspromonte, all with a maximum altitude in the order of 2000 m and the Catena Costiera which is located a short distance from the northern Tyrrhenian coast and has a maximum height of over 1500 m. In addition, there are some promontories, the main ones being Capo Rizzuto, on the Ionian coast, and Capo Vaticano, on the Tyrrhenian coast. The main coastal plains are Sibari, on the Ionian coast in the Gulf of Taranto, and those of Lamezia Terme in the Gulf of Sant’Eufemia and of Gioia Tauro in the homonymous gulf, both on the Tyrrhenian coast. Regarding the coastline, it alternates between sandy and pebbly beaches, and high coasts.
From a climatic point of view, the Calabrian climate is strongly influenced by the geomorphological variability described above. The mountainous areas have a typical mountain climate, with frequent snow during the winter. Instead, the coastal areas have a Mediterranean climate with significant differences in rainfall and temperatures between the two coasts. In fact, the Tyrrhenian coast is cooler and rainier than the Ionian coast. The greatest rainfall occurs mainly in winter and autumn and is significantly reduced in the summer months, varying between 1400 and 1800 mm per year in the mountainous areas, between 700 and 1000 mm per year on the Tyrrhenian coast, and around 500 mm per year on the Ionian coast. The sea water temperature reaches the highest value of 26 °C in July and August, it remains around 22–23 °C until October, and then decreases to 14 °C in winter. The high sea water temperature in the autumn months favors the formation of particularly intense atmospheric disturbances, which sometimes become a type of hurricane, also called Medicane (i.e., Mediterranean Hurricane) or tropical-like cyclones (TLC). Finally, the Ionian coast is mainly exposed to the winds of Scirocco (south-east wind) and Grecale (north-east wind), while the Tyrrhenian coast is mainly exposed to the winds of the Mistral (north-west wind). These differences, together with the different fetch lengths between the two seas and the various gulfs, lead to a remarkable variability of sea conditions between the two coastal areas.

2.2. Methodology

The methodology is divided into the following three main phases:
  • Assessment of the floodable areas in the current scenario, without climate change, caused by forcings that include storm surge due to wind and due to barometric effect, high tide height, and wave run-up;
  • Assessment of floodable areas in the future scenario, with climate change, and with SSP5-8.5 values in addition to the forcings defined in the current scenario;
  • Comparisons between the two scenarios.
Regarding the various forcings, storm surge due to wind (Sw) was estimated using the Bretschneider model [60]. This model depends on the depth at the shelf edge (d1), the depth near the coast (d2), the wind drag coefficient (K), and the length of the wind fetch (L). The storm surge due to barometric effect (Sb) is related to the minimum atmospheric pressure recorded during an atmospheric disturbance and is evaluated considering that a barometric decrease of 1 mbar, as compared with the normal value of 1013 mbar, causes a surge of 1 cm. To estimate high tide height (HT), the recordings of the tide gauges present in the study area, which are those of Crotone and Reggio Calabria, were analyzed. In addition to these, the Tide Tables of the Italian Marine Hydrographic Institute [61] and scientific papers were consulted, especially that of Sannino et al. [62]. Wave run-up exceeded by 2% of the number of incident waves (Ru2%) was estimated using the Stockdon et al. model [63]. This model is based on the following equations and depends on the foreshore beach slope (βf), the significant wave height in deep water (H0), the wave length in deep water (L0), and the Iribarren number (ξ0):
Ru2% = 1.1 {0.35 βf (H0 L0)1/2 + ½ [H0 L0 (0.563 βf2 + 0.004]1/2} for ξ0 < 0.3
Ru2% = 0.043 (H0 L0)1/2 for ξ0 ≥ 0.3
The slope was estimated by analyzing the open access bathymetry available on the EMODNET portal (https://www.emodnet-bathymetry.eu/, accessed on 15 March 2022), while significant wave height and wave length in deep water were calculated starting from the time series of wave data corresponding to sea storms with a return time of 100 years. In detail, the analyzed time series relates to the last 40 years and is available in the database developed by the MeteOcean group of the University of Genoa (http://www3.dicca.unige.it/meteocean/hindcast.html, accessed on 15 February 2022). This group performed a reanalysis of atmospheric and wave conditions, and produced a hindcast database which started from January 1979 until today. This database was reconstructed from the Climate Forecast System Reanalysis (CFSR) database through a numerical model which consists of a meteorological model for the reanalysis and simulation of winds and atmospheric fields and a third-generation model for the description of the generation and propagation of wind and swell waves in the Mediterranean basin. In addition, the Mediterranean basin was discretized into a regular grid with a resolution of 0.1273 × 0.09 degrees, corresponding almost to 10 km at the latitude of 45° N [64,65,66].
To consider the significant geographical differences among the coasts of the Calabria region described above, over 50 points were chosen, with each point identified by a numerical code and characterized by a time series in the order of hundreds of thousands of sea states, from a minimum of 330,000 to a maximum of 350,000. In addition, for each sea state, significant wave height, mean and peak periods, and wave direction were available.
Therefore, the methodology was applied in over 50 Calabrian sample areas, one for each point of the database of the MeteOcean group examined (Figure 2). Sample areas were chosen to have different morphological and anthropogenic characteristics. In each sample area, the current scenario was defined considering the maximum values of the forcings described above. The sum of the maximum values of all forcings represents the maximum height reached by the water referred to the average sea level. The estimate of floodable areas was carried out on QGIS by comparing the maximum height with the land elevation, obtained by analyzing the DTM and DSM LIDAR of 1 m and 2 m side square meshes, available on the Italian Geoportal (http://www.pcn.minambiente.it/mattm/, accessed on 15 February 2022).
In the SSP5-8.5 scenario, the maximum height reached by the water referred to the average sea level is equal to the height obtained without climate change, increased by the value that considers the possible sea level rise related to this scenario. These values along the Calabrian coasts were estimated starting from a tool developed by the National Aeronautics and Space Administration (NASA), which is a global sea level consultation tool for identifying coastal areas at risk up to 2150. A map of the sea level, based on projections reported in the latest IPCC report, data collected from satellites and ground-based instruments, as well as numerical analyses and simulations, is available in this tool (https://sealevel.nasa.gov/ipcc-ar6-sea-levelprojection-tool/, accessed on 15 February 2022). Finally, the procedure for estimating floodable areas with this scenario was similar to that followed in the current scenario.
It should be highlighted that the analyzed scenarios are very conservative. In fact, storm surge due to wind and wave run-up forcings were calculated considering the maximum values reached by the related parameters within each sample area. In addition, the wave run-up was calculated considering significant wave height and wave length in deep water corresponding to sea storms with a return time of 100 years. Instead, the high tide height forcing was calculated at the level of homogeneous macro-areas from the tide point of view. Within each macro-area, the relative maximum value of high tide height was considered, assuming it to be constant in each sample area belonging to each macro-area. The four macro-areas considered were the Ionian Sea, the Strait of Messina and the southernmost part of the Ionian Sea, the Tyrrhenian Sea, and the southernmost part of the Tyrrhenian Sea. Finally, to calculate the storm surge due to barometric effect and the SSP5-8.5 forcings, the relative maximum values were assumed to be constant throughout Calabria.
From the point of view of uncertainties, it should be highlighted that the values of storm surge due to wind, barometric effect, and high tide height are affected by modest uncertainties. In fact, these values were always between a few centimeters and less than half a meter and, moreover, the values of the main parameters were calculated starting from data recorded on site. Run-up values also have low uncertainty. In fact, regarding its main parameters, it highlighted that the significant wave height in deep water of fixed return period was estimated using a Weibull-type distribution of the probability of exceeding a fixed significant height threshold. This distribution has been shown to be appropriate for the Mediterranean Sea and Italian Sea [67,68] and its reliability was tested by calculating the coefficient of determination R-squared [69], obtaining very high values. Furthermore, the quality of the bathymetry, which influences the slope, was estimated by means of a combined quality indicator which, in the study area, always showed a high score. Finally, uncertainties slightly greater than the previous ones characterized the DTM and DSM LIDAR, which had an accuracy of 15 cm in height.

3. Results

Table 1 shows a summary of the floodable areas and of the values of the forcings analyzed in the two scenarios.
Table 1. Sample areas, related codes, and values of storm surge due to wind (Sw), storm surge due to barometric effect (Sb), high tide height (HT), wave run-up exceeded by 2% of the number of incident waves (Ru2%), maximum height reached by the water referred to the average sea level in current scenario (Max h CS), floodable area in current scenario (FA CS), SSP5-8.5 future scenario (FS), maximum height reached by the water referred to the average sea level in future scenario (Max h FS), floodable area in future scenario (FA FS), variations of floodable areas between current and future scenarios (∆FA). Legend: The higher values are in red; the lower values are in green; Sb and FS are constants, and therefore, are not colored.
Sample AreaCodeSw
(m)
Sb (m)HT (m)Ru2% (m)Max h CS (m)FA CS (km2)FS
(m)
Max h FS (m)FA FS (km2)∆FA (km2)
Montegiordano45300.150.430.131.532.240.0371.263.500.0810.044
Roseto Capo Spulico46890.150.430.131.522.230.0491.263.490.1020.053
Trebisacce48480.170.430.131.432.160.0421.263.420.090.048
Villapiana50110.090.430.131.251.890.1611.263.150.2230.062
Rossano51730.030.430.133.273.861.0711.265.121.2530.182
Calopezzati53330.060.430.131.351.960.0521.263.220.2070.155
Cariati54960.130.430.131.382.070.2621.263.330.5440.282
Crucoli-Torretta54970.130.430.131.572.260.0631.263.520.0980.035
Cirò Marina58320.050.430.131.742.350.0421.263.610.1150.073
Torre Melissa60040.080.430.131.732.360.0541.263.620.0690.015
Crotone-Zigari61770.090.430.131.752.400.1371.263.660.5160.379
Crotone63520.040.430.131.762.350.0641.263.610.0950.031
Isola C.R.—Marinella65280.060.430.131.752.370.0041.263.630.0060.002
Isola Capo Rizzuto67150.040.430.131.792.390.0101.263.650.0130.003
Isola C.R.—Le Castella68990.050.430.131.712.320.0151.263.580.0470.032
Cropani68980.010.430.131.622.190.0501.263.450.1660.116
Catanzaro Lido68970.070.430.131.592.220.0491.263.480.0690.02
Soverato70800.040.430.131.632.220.0351.263.480.0490.014
San Sostene72620.020.430.131.622.200.0641.263.460.3390.275
Badolato74430.090.430.131.712.350.6331.263.611.150.517
Monasterace76240.060.430.131.692.310.0631.263.570.0830.02
Riace78070.050.430.131.812.420.0271.263.680.0870.06
Caulonia79900.090.430.131.682.320.2741.263.580.3950.121
Roccella Ionica79890.060.430.131.542.160.0321.263.420.0610.029
Locri81680.030.430.131.532.130.0261.263.390.0550.029
Bovalino83440.020.430.131.662.240.0581.263.500.0950.037
Ferruzzano85140.050.430.131.712.320.0371.263.580.0520.015
Brancaleone86850.110.430.131.702.370.0461.263.630.080.034
Palizzi88640.030.430.101.652.210.0261.263.470.0460.02
Bova Marina88630.020.430.101.622.170.0541.263.430.1150.061
Melito Porto Salvo88620.010.430.101.542.080.0431.263.340.0760.033
Lazzaro86830.010.430.106.026.560.2881.267.820.3380.05
Favazzina79880.020.430.201.592.240.0381.263.500.0410.003
Palmi78060.050.430.201.852.530.1151.263.790.2210.106
San Ferdinando76220.070.430.201.812.510.1511.263.771.3691.218
Ricadi74420.020.430.201.642.290.0161.263.550.0280.012
Capo Vaticano72610.030.430.252.042.740.0251.264.000.0510.026
Tropea70780.020.430.252.012.710.0331.263.970.0370.004
Vibo Marina68960.060.430.251.872.600.6791.263.861.4270.748
Gizzeria67110.120.430.251.812.610.1141.263.870.4640.35
Falerna65270.080.430.252.102.860.0521.264.120.1780.126
Amantea63500.050.430.252.012.740.0711.264.000.1580.087
Belmonte61750.040.430.251.982.700.0561.263.960.0910.035
San Lucido60020.060.430.251.942.680.0771.263.940.1070.03
Fuscaldo58300.070.430.251.782.520.0501.263.780.110.06
Cetraro56590.070.430.252.012.760.2241.264.020.3770.153
Sangineto54930.070.430.251.962.710.0501.263.970.1110.061
Belvedere53310.090.430.252.022.790.0931.264.050.1240.031
S.M. del Cedro51720.040.430.251.902.620.1061.263.880.9620.856
Scalea50090.040.430.251.832.550.1061.263.810.2340.128
Tortora48460.020.430.251.662.360.0381.263.620.0410.026
The storm surge due to wind (Sw), calculated with the Bretschneider model [60], varies between 0.01 m in Cropani, Melito Porto Salvo, and Lazzaro and 0.17 m in Trebisacce. The value of Sw exceeds 0.1 m only in seven sample areas, almost all located within the Gulf of Taranto. The only exceptions are Brancaleone in the southern Ionian Sea, and Gizzeria, the only area in the Tyrrhenian Sea.
The storm surge due to barometric effect (Sb) was calculated considering that, in the Mediterranean Sea, the minimum atmospheric pressure recorded during an atmospheric disturbance assumes values no lower than 970 mbar. Therefore, the maximum value of Sb is equal to 0.43 m.
The high tide height (HT) values vary between 0.10 and 0.25 m. The lowest values are observed near the southern mouth of the Strait of Messina, between Lazzaro and Palizzi, while the highest values are observed in the Tyrrhenian Sea, from the promontory of Capo Vaticano to the north. Instead, in the remaining part of the Ionian coast, from Palizzi to the north, the value of HT is equal to 0.13 m, while in the remaining part of the Tyrrhenian coast, from Capo Vaticano to the south up to the northern mouth of the Strait of Messina, the value of HT is equal to 0.2 m. Therefore, Calabria is a microtidal environment where the tidal excursion is in the order of tens of centimeters. Finally, it should be highlighted that, for each area, the maximum HT values were taken into consideration.
Most run-up values are between 1.5 and just over 2 m, with slightly higher values in the Tyrrhenian Sea than in the Ionian Sea. The exceptions are Lazzaro, located at the southern mouth of the Strait of Messina and characterized by run-up of just over 6 m; Rossano, located in the Gulf of Taranto and characterized by run-up of about 3.3 m; and then Trebisacce, Villapiana, Calopezzati, and Cariati, all located in the Gulf of Taranto and characterized by run-ups of less than 1.5 m. It should be highlighted that the maximum foreshore beach slope within each sample area was considered to calculate the run-up.
Therefore, the maximum height in the current scenario is generally greater in the Tyrrhenian Sea than in the Ionian Sea. In fact, it is between 2 and 2.5 m in the Ionian Sea and between 2.5 and 3 m in the Tyrrhenian Sea. The exceptions are Lazzaro, located at the southern mouth of the Strait of Messina, where the maximum height exceeds 6.5 m; Rossano, located in the Gulf of Taranto, where the maximum height is just under 4 m; Villapiana and Calopezzati, located in the Gulf of Taranto, where the maximum height is less than 2 m; and Favazzina and Ricadi, located in the central-southern Tyrrhenian Sea, where the maximum height is less than 2.5 m.
The total floodable area in the current scenario is about 6 km2. The highest floodable area values are observed in Rossano, over 1 km2, and in Vibo Marina and Badolato, both around 0.65 km2. Furthermore, only 14 sample areas exceed 0.1 km2 and the lowest floodable area values are observed in the three sample areas of Isola Capo Rizzuto and in Ricadi, always less than 0.015 km2.
The future scenario was obtained by adding the value of SSP5-8.5, equal to 1.26 m constant throughout Calabria, to the maximum height reached in the current scenario. The maximum height values in the future scenario thus obtained are almost all between 3.5 and 4 m, with the same exceptions described in the current scenario. In fact, the greatest maximum height is observed in Lazzaro, greater than 7.8 m, while the lowest maximum height is observed in Villapiana, equal to 3.15 m.
The total floodable areas in the future scenario would more than double, increasing from about 6 to 13 km2. The highest floodable areas in the future scenario would be Vibo Marina and San Ferdinando in the Tyrrhenian Sea, and Rossano and Badolato in the Ionian Sea, all with values between 1 and 1.5 km2. Furthermore, more than half of the sample areas exceed 0.1 km2 and the lowest floodable areas would be in Isola Capo Rizzuto and its hamlet Marinella, both located in the Ionian Sea and with values below 0.015 km2. Instead, the largest increases in the floodable areas between the two scenarios would be in San Ferdinando, located in the Tyrrhenian Sea, with a value over 1.2 km2. Other significant increases would be observed in Santa Maria del Cedro and Vibo Marina, both located in the Tyrrhenian Sea, with values of 0.85 and 0.75 km2 respectively. Furthermore, in 16 sample areas, the increases in floodable areas would exceed 0.1 km2, while the lowest increases would be observed in Isola Capo Rizzuto and its hamlet Marinella, both located in the Ionian Sea, and in Favazzina and Tropea, both located in the Tyrrhenian Sea. In all these cases, the increases would be less than 0.05 km2.

4. Discussion

4.1. Current Scenario

The current scenario shows very high variability in terms of floodable areas among the various sample areas. In fact, the floodable areas vary from 0.004 km2 in the Marinella, hamlet of Isola Capo Rizzuto, up to 1.071 km2 in Rossano. In this scenario, the Rossano sample area alone has about 20% of all Calabrian floodable areas.
This considerable variability in floodable areas is not evident in the maximum height reached by the water referred to the average sea level. The values of this parameter are very similar to each other in the various sample areas, with higher values in the Tyrrhenian Sea than in the Ionian Sea and with an average difference between the two seas of about 0.5 m. Furthermore, Rossano and Lazzaro are exceptions, where the maximum height reached by the water referred to the average sea level are much greater than those of all the other sample areas. The higher values in the Tyrrhenian Sea than in the Ionian Sea are related to the significant differences between the two seas from the point of view of the wave climate [70]. In detail, the average and frequent wave conditions are slightly higher in the Ionian coast, while the exceptional wave conditions, such as those considered for the run-up calculation, are much greater in the Tyrrhenian coast. Furthermore, in the Tyrrhenian Sea, the intense wave conditions are concentrated along a few directions, coming mainly from the north-west, and there are no secondary and tertiary sectors. Instead, in the Ionian Sea, the intense wave conditions come from different directions varying between north-east and south-east, and in different locations there are secondary and tertiary sectors.
The high maximum height values reached by the water referred to the average sea level observed in Rossano (Figure 3) and Lazzaro (Figure 4) are caused by the high run-up values of both locations. Generally, the run-up is influenced by various parameters, the most important being the significant wave height and the foreshore beach slope. Regarding the first parameter, on the one hand, it should be highlighted that the significant wave height values calculated in Rossano are the lowest of all the sample areas. These values may be related to the position of Rossano within the Gulf of Taranto, and therefore the fetch lengths are modest in size along most of the directions. Therefore, in this case, the high run-up value can only be correlated to a high foreshore beach slope. In this sample area, the foreshore beach slope is variable, with a peak of 15% at the mouth of the Citrea River where there is an underwater canyon, and with significantly lower values in the adjacent areas. Therefore, the floodable area in this sample area is overestimated as a constant slope has been assumed within the entire sample area, equal to the maximum one as described above. In addition, low values of significant wave height are observed within the Gulf of Taranto, which explain the low run-up values obtained between Montegiordano and Cariati. The difference between these localities and Rossano is represented by the absence of high slope points within these sample areas. On the other hand, in Lazzaro, the values of significant wave height are of the same order of magnitude as the neighboring sample areas. Therefore, even in this sample area, the high run-up value can only be correlated to a high foreshore beach slope which is higher than 20%. However, unlike Rossano, the high foreshore beach slope is not located in a single point but is significantly constant along the entire sample area. This is due to the geographical position of Lazzaro at the southern mouth of the Strait of Messina, where the seabed depth reaches 2000 m in a few tens of kilometers of distance between the two coasts. Furthermore, high run-up values at Lazzaro were also observed following the 1908 earthquake with consequent tsunami [71]. Despite this, the floodable area in Lazzaro is not very large due to the presence of a highway that crosses the town at a higher altitude and that delimits the floodable area.
Regarding the sample areas with the least floodable areas, both Isola Capo Rizzuto and its hamlet Marinella are two pocket beaches with small inhabited centers on the back. The limited extension of the floodable areas is due to the morphological conformation of the areas between Capo Colonna and Capo Rizzuto, within both sample areas are located. These areas are characterized almost exclusively by a high coast and only a few pocket beaches. This coastal area is the easternmost of Calabria and is exposed to fetch lengths in the order of hundreds of kilometers along most directions, so it is very exposed to intense wave motion [70]. Another sample area with small floodable areas is Ricadi (Figure 5), which is a pocket beach located within the Capo Vaticano promontory on the Tyrrhenian coast but, unlike the previous two, it also has a partially flooded inhabited center.
Regarding the sample areas with the major floodable areas, which are Badolato (Figure 6) on the Ionian coast and Vibo Marina (Figure 7), it should be highlighted that both areas have a port. Badolato, unlike Vibo Marina, around the port has only scattered houses, therefore, the floodable areas mainly concern coastal dunes. Instead, in Vibo Marina the floodable area mainly concerns a large inhabited center near the port.

4.2. Future Scenario

In the future scenario, the floodable areas would have more than doubled as compared with the current scenario, going from 6 to 13 km2. The floodable areas and the relative increases between the two scenarios both show very high variability among the various sample areas. In fact, these areas vary from 0.006 km in Marinella, up to 1.427 km2 in Vibo Marina. The increases between current and future scenarios vary from 0.002 km2 in Marinella, up to 1.218 km2 in San Ferdinando. The analysis in terms of percentage of increase highlights very high variability among the various sample areas. In fact, the average increase varies between 7% in Favazzina and 89% in Santa Maria del Cedro. However, grouping the results by Ionian and Tyrrhenian coasts, the average percentage variations are very similar and equal to 44% along the Ionian coast and equal to 50% along the Tyrrhenian coast. Therefore, there are no areas or macro-areas with homogeneous behavior, such as occurs for the wave climate between the Ionian and Tyrrhenian coasts, for example. Regarding San Ferdinando, which is located on the Tyrrhenian coast near a port (Figure 8), the floodable area only partially concerns the inhabited center as it mainly concerns the coastal dunes and the flat areas near the mouth of the Mesima River, just north of San Ferdinando.
The effects of the possible increases in floodable areas in terms of population, infrastructure, coastal dunes, and sites of social, economic, and strategic interest exposed are discussed below.
In most of the sample areas, the population living in floodable areas is in the order of a hundred inhabitants, with values exceeding a thousand obtained only in Vibo Marina and Rossano and with values close to a thousand obtained in Cariati, Cetraro, and Santa Maria del Cedro. These are low values in absolute terms but become significant when compared to the actual population of the sample areas. In fact, in many cases, these areas correspond to towns of a few thousand inhabitants where the percentages of the population living in floodable areas become high. The highest values, greater than 20%, are observed in Vibo Marina and Lazzaro, while values close to or greater than 10% are observed in Santa Maria del Cedro, Badolato, Cariati, Caulonia, San Ferdinando, Cetraro, Falerna, and Gizzeria.
Regarding the infrastructures affected by the possible increases in floodable areas, in more than half of the sample areas there are promenades, in about ten areas there are railways, and in four areas, i.e., Caulonia and Lazzaro on the Ionian coast and Santa Maria del Cedro and Scalea on the coast Tyrrhenian, there are highways. Furthermore, in five sample areas, these increases may affect coastal dunes. Finally, regarding sites of social, economic, and strategic interest affected by the possible increases in floodable areas, there are a medical center in Sangineto; a football stadium in Cariati; a swimming pool in Vibo Marina; two industrial areas in Crotone, Zigari and in Vibo Marina. In almost all the sample areas, there are bathing establishments and accommodation facilities.
It should be highlighted that the floodable areas of the Ionian coast involve fewer houses and important infrastructures than the Tyrrhenian coast. This is related to the anthropization process that is more evident on the Tyrrhenian coast than on the Ionian coast. This result could be related to the morphological peculiarities of the territory. Indeed, on the one hand, the northern Calabrian Tyrrhenian coast, from Falerna to the Basilicata region, is characterized by a mountainous relief very close to the coast with few flat coastal areas. Therefore, the inhabited centers have expanded close to the coast. On the other hand, on the Ionian coast there is generally a greater distance between the coast and the reliefs, so several inhabited centers have been built away from the coast, often behind the existing dunes.
The issue of an increase in floodable areas due to sea level rise and other factors has been extensively studied worldwide. Many studies have mainly been focused in flat coastal areas, especially heavily man-made areas. Among the main studies, Aucelli et al. [13] assessed the coastal inundation risk due to sea level rise, assuming the best and the worst conditions of the IPCC report of 2014 [14] and due to subsidence in the Volturno coastal plain in Southern Italy. Sukop et al. [72] analyzed the impact of sea level rise, tides, and rain on water table flooding in the Arch Creek basin (Miami-Dade County, FL, USA). Wang et al. [73] analyzed the effects of sea level rise, land subsidence, bathymetric change, and typhoon tracks on coastal flooding in the coastal areas of Shanghai. Carvalho and Wang [74] analyzed the impacts of sea level rise in terms of potential floodable coastal areas in the Indian Ocean. Gornitz et al. [75] analyzed increases in coastal flooding due to the sea level rise in New York City. Cao et al. [76] assessed flood areas due to sea level rise and subsidence in four major Asian coastal metropolises, i.e., Tokyo, Jakarta, Manila, and Ho Chi Minh City. Paulik et al. [77] analyzed the effects of increases in floodable areas due to sea level rise in twenty major coastal urban areas in New Zealand. Xu et al. [78] evaluated the compound effects of sea level rise and urban growth on coastal flood risk in Xiamen, Southeast China. Amoura and Dahmani [79] estimated the extent of the floodable areas due to the sea level rise, according to the indications of the sixth and latest IPCC climate report [1], in the coastal area of Algiers.
Regarding Calabria, the main studies are those of Lambeck et al. [8] and Furlan et al. [80]. In detail, Lambeck et al. [8] estimated the possible sea level rises in 2100 in over 30 Italian coastal plains, including those of Sibari, Gioia Tauro, and Sant’Eufemia. The analysis by Lambeck et al. [8] was based on a lower (IPCC 2007, [9]) and a higher [10] scenario combined with local isostatic tectonic values neglecting the effects of wave, tide, and storm surge. Consequently, the results obtained were lower than those obtained in the present study. Furlan et al. [80] analyzed a flood scenario in 2050 along the Italian coasts to estimate a Coastal Vulnerability Index. Unlike the present study, the scenario analyzed by Furlan et al. [80] was based on the RPC-8.5 scenario of the IPCC report of 2014 [14,16]. Furthermore, it did not estimate floodable areas and used a coarser DTM, with a spatial resolution of 25 m, from Copernicus.
Generally, most of the main previous studies have focused mainly on coastal plains, heavily man-made areas, and large metropolises and were based on the fourth and fifth IPCC reports [9,14,16]. Instead, the present study differs from them because we considered the most recent IPCC report [1] and because we analyzed a territory with notable geomorphological, climatic, and anthropic peculiarities. In addition, not only coastal plains and heavily anthropized areas were considered but also towns and areas characterized by infrastructures, coastal dunes, and sites of social, economic, and strategic interest. The results highlight that these peculiarities cause significant variability of weather and sea conditions among the different coastal areas, which influences the characteristics of the meteorological events and of the wave climate [70]. Furthermore, the present study is characterized by a high level of detail, both from the wave climate point of view and from the altimetry point of view, which is a key factor for accurately estimating floodable areas. Regarding wave climate, it has a high spatial detail level as it has been evaluated for each study area, and various weather-climatic factors, such as run-up and storm surge, have also been considered. Regarding the altimetry, we analyzed DTM and DSM LIDAR of 1 m and 2 m side square meshes, available on the Italian Geoportal, while many previous studies were based on coarser DTMs.

5. Conclusions

In this paper, we describe an analysis of the effects of climate change in terms of possible increases in floodable areas and in terms of population, infrastructure, coastal dunes, and sites of social, economic, and strategic interest exposed in over 50 sample areas along the Calabrian coasts. Calabria is a region of southern Italy that represents an interesting case study due to its high coastal length, over 700 km, and due to its geomorphological and climatic complexity. Calabria is enclosed by two seas, the Ionian Sea and Tyrrhenian Sea, and is characterized by various gulfs and promontories that cause considerable variability in terms of wave climate.
The analysis described in the paper was carried out by examining a current and a future scenario. The current scenario is without climate change and is caused by the following forcings: storm surge due to wind and due to barometric effect, high tide height, and wave run-up. The future scenario is with climate change and with SSP5-8.5 values in addition to the forcings defined in the current scenario.
The main result is that the floodable areas in the future scenario would have more than doubled as compared with the current scenario. In addition, the possible increases in floodable areas involve both significant percentages of the population, greater than 20% in Vibo Marina and Lazzaro, as well as railways, highways, industrial areas, coastal dunes, a medical center, a football stadium, swimming pools, promenades, bathing establishments, and accommodation facilities.
However, both the floodable areas in the two scenarios and the relative increases between the current and future scenarios show very high variability among the various sample areas, mainly due to the morphology and the anthropization of the coastal areas.
Finally, this analysis is easily applicable and replicable, it is of interest both in the field of scientific research and in the fields of planning and management of coastal areas for the identification and design of interventions and strategies to mitigate the effects of climate change in coastal floodable areas.

Author Contributions

Conceptualization, G.B. (Giuseppe Barbaro), G.F., and G.C.B.; methodology, G.B. (Giuseppe Barbaro), G.B. (Giuseppe Bombino), G.F., G.C.B., P.P., and P.M.; software, G.F., and G.C.B.; validation, G.B. (Giuseppe Barbaro), G.B. (Giuseppe Bombino), G.F., G.C.B., P.P., and P.M.; formal analysis, G.B. (Giuseppe Barbaro), G.F., and G.C.B.; investigation, G.B. (Giuseppe Barbaro), G.F., and G.C.B.; resources, G.B. (Giuseppe Barbaro), G.F., and G.C.B.; data curation, G.B. (Giuseppe Barbaro), G.F., and G.C.B.; writing—original draft preparation, G.F.; writing—review and editing, G.B. (Giuseppe Barbaro), G.B. (Giuseppe Bombino), G.F., G.C.B., P.P., and P.M.; visualization, G.F.; supervision, G.B. (Giuseppe Barbaro); project administration, G.B. (Giuseppe Barbaro); funding acquisition, G.B. (Giuseppe Barbaro), and P.M. All authors have read and agreed to the published version of the manuscript.

Funding

This research was funded by the Public Works Department of Calabria Region.

Institutional Review Board Statement

Not applicable.

Informed Consent Statement

Not applicable.

Acknowledgments

The authors sincerely thank Giovanni Besio of the University of Genoa for providing the wave data of the database developed by the MeteOcean group.

Conflicts of Interest

The authors declare no conflict of interest. The funders had no role in the design of the study; in the collection, analyses, or interpretation of data; in the writing of the manuscript, or in the decision to publish the results.

References

  1. IPCC. Summary for Policymakers. Working Group I Contribution to the Sixth Assessment Report of the Intergovernmental Panel on Climate Change. In Climate Change 2021: The Physical Science Basis; Masson-Delmotte, V., Zhai, P., Pirani, A., Connors, S.L., Péan, C., Berger, S., Caud, N., Chen, Y., Goldfarb, L., Gomis, M.I., Eds.; Cambridge University Press: Cambridge, UK, 2021; in press. [Google Scholar]
  2. Breaker, L.C.; Ruzmaikin, A. Estimating rates of acceleration based on the 157-year record of sea level from San Francisco, California, USA. J. Coast. Res. 2013, 29, 43–51. [Google Scholar] [CrossRef]
  3. Nerem, R.S.; Beckley, B.D.; Fasullo, J.T.; Hamlington, B.D.; Masters, D.; Mitchum, G.T. Climate-change–driven accelerated sea-level rise detected in the altimeter era. Proc. Natl. Acad. Sci. USA 2018, 115, 2022–2025. [Google Scholar] [CrossRef] [PubMed] [Green Version]
  4. Tomasicchio, G.R.; Lusito, L.; D’Alessandro, F.; Frega, F.; Francone, A.; De Bartolo, S. A direct scaling analysis for the sea level rise. Stoch. Environ. Res. Risk Assess. 2018, 32, 3397–3408. [Google Scholar] [CrossRef]
  5. Rubinato, M.; Heyworth, J.; Hart, J. Protecting coastlines from flooding in a changing climate: A preliminary experimental study to investigate a sustainable approach. Water 2020, 12, 2471. [Google Scholar] [CrossRef]
  6. Freitas, A.; Bernardino, M.; Soares, C.G. The influence of the Arctic Oscillation on North Atlantic wind and wave climate by the end of the 21st century. Ocean. Eng. 2022, 246, 110634. [Google Scholar] [CrossRef]
  7. Nicholls, R.J.; Cazenave, A. Sea-level rise and its impact on coastal zones. Science 2010, 328, 1517–1520. [Google Scholar] [CrossRef]
  8. Lambeck, K.; Antonioli, F.; Anzidei, M.; Ferranti, L.; Leoni, G.; Scicchitano, G.; Silenzi, S. Sea level change along the Italian coast during the Holocene and projections for the future. Quat. Int. 2011, 232, 250–257. [Google Scholar] [CrossRef]
  9. IPCC. Summary for policymakers. Contribution of Working Group I to the Fourth Assessment Report of the Intergovernmental Panel on Climate Change. In Climate Change 2007: The Physical Science Basis; Solomon, S., Qin, D., Manning, M., Chen, Z., Marquis, M., Averyt, K.B., Tignor, M., Miller, H.L., Eds.; Cambridge University Press: Cambridge, UK, 2007. [Google Scholar]
  10. Rahmstorf, S. A semi-empirical approach to projecting future sea-level rise. Science 2007, 315, 368–370. [Google Scholar] [CrossRef] [Green Version]
  11. Galassi, G.; Spada, G. Sea-level rise in the Mediterranean Sea by 2050: Roles of terrestrial ice melt, steric effects and glacial isostatic adjustment. Glob. Planet. Change 2014, 123, 55–66. [Google Scholar] [CrossRef]
  12. Zviely, D.; Bitan, M.; Di Segni, D.M. The effect of sea-level rise in the 21st century on marine structures along the Mediterranean coast of Israel: An evaluation of physical damage and adaptation cost. Appl. Geogr. 2015, 57, 154–162. [Google Scholar] [CrossRef]
  13. Aucelli, P.P.C.; Di Paola, G.; Incontri, P.; Rizzo, A.; Vilardo, G.; Benassai, G.; Buonocore, B.; Pappone, G. Coastal inundation risk assessment due to subsidence and sea level rise in a Mediterranean alluvial plain (Volturno coastal plain–southern Italy). Estuar. Coast. Shelf Sci. 2017, 198, 597–609. [Google Scholar] [CrossRef]
  14. IPCC. Fifth Assessment Report (AR5). Intergovernmental Panel on Climate Change. In Climate Change 2014: Mitigation of Climate Change; Cambridge University Press: Cambridge, UK, 2014. [Google Scholar]
  15. Antonioli, F.; Anzidei, M.; Amorosi, A.; Presti, V.L.; Mastronuzzi, G.; Deiana, G.; De Falco, G.; Fontana, A.; Fontolan, G.; Lisco, S.; et al. Sea-level rise and potential drowning of the Italian coastal plains: Flooding risk scenarios for 2100. Quat. Sci. Rev. 2017, 158, 29–43. [Google Scholar] [CrossRef] [Green Version]
  16. Church, J.A.; Clark, P.U.; Cazenave, A.; Gregory, J.M.; Jevrejeva, S.; Levermann, A.; Merrifield, M.A.; Milne, G.A.; Nerem, R.S.; Nunn, P.D.; et al. Sea-level change. Contribution of working group I to the Fifth assessment Report of the intergovernmental Panel on climate change. In Climate Change 2013: The Physical Science Basis; Stocker, T.F., Qin, D., Plattner, G.-K., Tignor, M., Allen, S.K., Boschung, J., Nauels, A., Xia, Y., Bex, V., Midgley, P.M., Eds.; Cambridge University Press: Cambridge, UK, 2013. [Google Scholar]
  17. Da Lio, C.; Tosi, L. Vulnerability to relative sea-level rise in the Po river delta (Italy). Estuar. Coast. Shelf Sci. 2019, 228, 106379. [Google Scholar] [CrossRef]
  18. Ju, Y.; Lindbergh, S.; He, Y.; Radke, J.D. Climate-related uncertainties in urban exposure to sea level rise and storm surge flooding: A multi-temporal and multi-scenario analysis. Cities 2019, 92, 230–246. [Google Scholar] [CrossRef]
  19. Mills, L.; Janeiro, J.; Neves, A.A.S.; Martins, F. The impact of Sea level rise in the guadiana estuary. J. Comput. Sci. 2020, 44, 101169. [Google Scholar] [CrossRef]
  20. De Lima, L.T.; Fernández-Fernández, S.; Weiss, C.V.; Bitencourt, V.; Bernardes, C. Free and open-source software for Geographic Information System on coastal management: A study case of sea-level rise in southern Brazil. Reg. Stud. Mar. Sci. 2021, 48, 102025. [Google Scholar] [CrossRef]
  21. Roy, B.; Penha-Lopes, G.P.; Uddin, M.S.; Kabir, M.H.; Lourenço, T.C.; Torrejano, A. Sea level rise induced impacts on coastal areas of Bangladesh and local-led community-based adaptation. Int. J. Disaster Risk Reduct. 2022, 73, 102905. [Google Scholar] [CrossRef]
  22. Hemer, M.A.; Katzfey, J.; Trenham, C.E. Global dynamical projections of surface ocean wave climate for a future high greenhouse gas emission scenario. Ocean. Model. 2013, 70, 221–245. [Google Scholar] [CrossRef]
  23. Wandres, M.; Pattiaratchi, C.; Hemer, M.A. Projected changes of the southwest Australian wave climate under two atmospheric greenhouse gas concentration pathways. Ocean. Model. 2017, 117, 70–87. [Google Scholar] [CrossRef]
  24. Morim, J.; Hemer, M.; Cartwright, N.; Strauss, D.; Andutta, F. On the concordance of 21st century wind-wave climate projections. Glob. Planet. Change 2018, 167, 160–171. [Google Scholar] [CrossRef]
  25. Wang, L.; Perrie, W.; Long, Z.; Blokhina, M.; Zhang, G.; Toulany, B.; Zhang, M. The impact of climate change on the wave climate in the Gulf of St. Lawrence. Ocean. Model. 2018, 128, 87–101. [Google Scholar] [CrossRef]
  26. Rusu, L. Evaluation of the near future wave energy resources in the Black Sea under two climate scenarios. Renew. Energy 2019, 142, 137–146. [Google Scholar] [CrossRef]
  27. Kamranzad, B.; Lin, P. Sustainability of wave energy resources in the South China Sea based on five decades of changing climate. Energy 2020, 210, 118604. [Google Scholar] [CrossRef]
  28. Başaran, B.; Güner, H.A.A. Effect of wave climate change on longshore sediment transport in Southwestern Black Sea. Estuar. Coast. Shelf Sci. 2021, 258, 107415. [Google Scholar] [CrossRef]
  29. Goharnejad, H.; Nikaein, E.; Perrie, W. Assessment of wave energy in the Persian Gulf: An evaluation of the impacts of climate change. Oceanologia 2021, 63, 27–39. [Google Scholar] [CrossRef]
  30. Lobeto, H.; Menendez, M.; Losada, I.J.; Hermer, M. The effect of climate change on wind-wave directional spectra. Glob. Planet. Change 2022, 213, 103820. [Google Scholar] [CrossRef]
  31. Panagoulia, D.; Dimou, G. Sensitivity of flood events to global climate change. J. Hydrol. 1997, 191, 208–222. [Google Scholar] [CrossRef]
  32. Fiori, E.; Comellas, A.; Molini, L.; Rebora, N.; Siccardi, F.; Gochis, D.J.; Tanelli, S.; Parodi, A. Analysis and hindcast simulations of an extreme rainfall event in the Mediterranean area: The Genoa 2011 case. Atmos. Res. 2014, 138, 13–29. [Google Scholar] [CrossRef] [Green Version]
  33. Tiron, R.; Gallagher, S.; Gleeson, E.; Dias, F.; McGrath, R. The future wave climate of Ireland: From averages to extremes. Procedia IUTAM 2015, 17, 40–46. [Google Scholar] [CrossRef] [Green Version]
  34. Vanem, E. A regional extreme value analysis of ocean waves in a changing climate. Ocean. Eng. 2017, 144, 277–295. [Google Scholar] [CrossRef]
  35. Zellou, B.; Rahali, H. Assessment of the joint impact of extreme rainfall and storm surge on the risk of flooding in a coastal area. J. Hydrol. 2019, 569, 647–665. [Google Scholar] [CrossRef]
  36. Vieira, B.F.; Pinho, J.L.; Barros, J.A. Extreme wave value analysis under uncertainty of climate change scenarios off Iberian Peninsula coast. Ocean. Eng. 2021, 229, 109018. [Google Scholar] [CrossRef]
  37. Bhavithra, R.S.; Sannasiraj, S.A. Climate change projection of wave climate due to Vardah cyclone in the Bay of Bengal. Dyn. Atmos. Ocean. 2022, 97, 101279. [Google Scholar] [CrossRef]
  38. Codignotto, J.O.; Dragani, W.C.; Martin, P.B.; Simionato, C.G.; Medina, R.A.; Alonso, G. Wind-wave climate change and increasing erosion in the outer Río de la Plata, Argentina. Cont. Shelf Res. 2012, 38, 110–116. [Google Scholar] [CrossRef]
  39. Bacino, G.L.; Dragani, W.C.; Codignotto, J.O. Changes in wave climate and its impact on the coastal erosion in Samborombón Bay, Río de la Plata estuary, Argentina. Estuar. Coast. Shelf Sci. 2019, 219, 71–80. [Google Scholar] [CrossRef]
  40. Sharaan, M.; Udo, K. Projections of future beach loss along the mediterranean coastline of Egypt due to sea-level rise. Appl. Ocean. Res. 2020, 94, 101972. [Google Scholar] [CrossRef]
  41. Foti, G.; Barbaro, G.; Barillà, G.C.; Mancuso, P.; Puntorieri, P. Shoreline Evolutionary Trends Along Calabrian Coasts: Causes and Classification. Front. Mar. Sci. 2022, 9, 846914. [Google Scholar] [CrossRef]
  42. Bernatchez, P.; Fraser, C.; Lefaivre, D.; Dugas, S. Integrating anthropogenic factors, geomorphological indicators and local knowledge in the analysis of coastal flooding and erosion hazards. Ocean. Coast. Manag. 2011, 54, 621–632. [Google Scholar] [CrossRef]
  43. Muis, S.; Haigh, I.D.; Guimarães Nobre, G.; Aerts, J.C.; Ward, P.J. Influence of El Niño-Southern Oscillation on global coastal flooding. Earth’s Future 2018, 6, 1311–1322. [Google Scholar] [CrossRef]
  44. Barbaro, G.; Foti, G.; Nucera, A.; Barillà, G.C.; Canale, C.; Puntorieri, P.; Minniti, F. Risk mapping of coastal flooding areas. Case studies: Scilla and Monasterace (Italy). Int. J. Saf. Secur. Eng. 2020, 10, 59–67. [Google Scholar] [CrossRef]
  45. Lemee, C.; Navarro, O.; Restrepo-Ochoa, D.; Mercier, D.; Fleury-Bahi, G. Protective behaviors regarding coastal flooding risk in a context of climate change. Adv. Clim. Change Res. 2020, 11, 310–316. [Google Scholar] [CrossRef]
  46. Mori, N.; Takemi, T.; Tachikawa, Y.; Tatano, H.; Shimura, T.; Tanaka, T.; Fujimi, T.; Osakada, Y.; Webb, A.; Nakakita, E. Recent nationwide climate change impact assessments of natural hazards in Japan and East Asia. Weather. Clim. Extrem. 2021, 32, 100309. [Google Scholar] [CrossRef]
  47. Komar, P.D. Coastal erosion–underlying factors and human impacts. Shore Beach 2000, 68, 3–16. [Google Scholar]
  48. Dada, O.A.; Li, G.; Qiao, L.; Asiwaju-Bello, Y.A.; Anifowose, A.Y.B. Recent Niger Delta shoreline response to Niger River Hydrology: Conflicts between forces of Nature and Humans. J. Afr. Earth Sci. 2018, 139, 222–231. [Google Scholar] [CrossRef]
  49. Ozpolat, E.; Demir, T. The spatiotemporal shoreline dynamics of a delta under natural and anthropogenic conditions from 1950 to 2018: A dramatic case from the Eastern Mediterranean. Ocean. Coast. Manag. 2019, 180, 104910. [Google Scholar] [CrossRef]
  50. Anthony, E.J.; Almar, R.; Besset, M.; Reyns, J.; Laibi, R.; Ranasinghe, R.; Abessolo Ondoa, G.; Vacchi, M. Response of the Bight of Benin (Gulf of Guinea, West Africa) coastline to anthropogenic and natural forcing, Part 2: Sources and patterns of sediment supply, sediment cells, and recent shoreline change. Cont. Shelf Res. 2019, 173, 93–103. [Google Scholar] [CrossRef]
  51. Zhai, T.; Wang, J.; Fang, Y.; Qin, Y.; Huang, L.; Chen, Y. Assessing ecological risks caused by human activities in rapid urbanization coastal areas: Towards an integrated approach to determining key areas of terrestrial-oceanic ecosystems preservation and restoration. Sci. Total Environ. 2020, 708, 135153. [Google Scholar] [CrossRef]
  52. Barbaro, G.; Foti, G.; Barillà, G.C.; Frega, F. Beach and Dune Erosion: Causes and Interventions, Case Study: Kaulon Archaeological Site. J. Mar. Sci. Eng. 2022, 10, 14. [Google Scholar] [CrossRef]
  53. Foti, G.; Barbaro, G.; Barillà, G.C.; Frega, F. Effects of Anthropogenic Pressures on Dune Systems—Case Study: Calabria (Italy). J. Mar. Sci. Eng. 2022, 10, 10. [Google Scholar] [CrossRef]
  54. Dissanayake, P.; Brown, J.; Wisse, P.; Karunarathna, H. Comparison of stormcluster vs isolated event impacts on beach/dune morphodynamics. Estuar. Coast. Shelf Sci. 2015, 164, 301–312. [Google Scholar] [CrossRef] [Green Version]
  55. Mavromatidi, A.; Briche, E.; Claeys, C. Mapping and analyzing socio-environmental vulnerability to coastal hazards induced by climate change: An application to coastal Mediterranean cities in France. Cities 2018, 72, 189–200. [Google Scholar] [CrossRef]
  56. Barbaro, G.; Petrucci, O.; Canale, C.; Foti, G.; Mancuso, P.; Puntorieri, P. Contemporaneity of floods and storms. A case study of Metropolitan Area of Reggio Calabria in Southern Italy. In Proceedings of the 3rd International Symposium New Metropolitan Perspectives (ISTH2020), Reggio Calabria, Italy, 22–25 May 2108; Smart Innovation, Systems and Technologies. Springer: Cham, Switzerland, 2019; Volume 101, pp. 614–620. [Google Scholar] [CrossRef]
  57. Canale, C.; Barbaro, G.; Petrucci, O.; Fiamma, V.; Foti, G.; Barillà, G.C.; Puntorieri, P.; Minniti, F.; Bruzzaniti, L. Analysis of floods and storms: Concurrent conditions. Ital. J. Eng. Geol. Environ. 2020, 1, 23–29. [Google Scholar] [CrossRef]
  58. Canale, C.; Barbaro, G.; Foti, G.; Petrucci, O.; Besio, G.; Barillà, G.C. Bruzzano river mouth damage due to meteorological events. Int. J. River Basin Manag. 2021. [Google Scholar] [CrossRef]
  59. Foti, G.; Barbaro, G.; Barillà, G.C.; Mancuso, P.; Puntorieri, P.; Mandalari, M. Analysis of the correlation between coastal erosion and anthropogenic pressure using remote sensing. Case study: Calabria (Italy). In Proceedings of the X AIT International Conference—Italian Society of Remote Sensing, Cagliari, Italy, 13–15 September 2021. (Virtual event). [Google Scholar]
  60. Bretschneider, C.L. Engineering Aspects of Hurricane Surge. In Estuary and Coastline Hydrodynamics; Ippen, A.T., Ed.; McGraw-Hill: New York, NY, USA, 1966. [Google Scholar]
  61. Istituto Idrografico della Marina. Tavole di Marea e Delle Correnti di Marea; Istituto Idrografico della Marina: Genoa, Italy, 2020; p. 144. ISBN 97888II3133. (In Italian) [Google Scholar]
  62. Sannino, G.; Carillo, A.; Pisacane, G.; Naranjo, C. On the relevance of tidal forcing in modeling the Mediterranean thermohailine circulation. Prog. Oceanogr. 2015, 134, 304–329. [Google Scholar] [CrossRef]
  63. Stockdon, H.F.; Holman, R.A.; Howd, P.A.; Sallenger, A.H., Jr. Empirical parameterization of setup, swash, and runup. Coast. Eng. 2006, 53, 573–588. [Google Scholar] [CrossRef]
  64. Tolman, H.L. User Manual and System Documentation of WAVEWATCH III TM Version 3.14. Technical Note. Available online: https://polar.ncep.noaa.gov/mmab/papers/tn276/MMAB_276.pdf276 (accessed on 15 February 2022).
  65. Mentaschi, L.; Besio, G.; Cassola, F.; Mazzino, A. Developing and validating a forecast/hindcast system for the Mediterranean Sea. J. Coast. Res. 2013, 65, 1551–1556. [Google Scholar] [CrossRef]
  66. Mentaschi, L.; Besio, G.; Cassola, F.; Mazzino, A. Performance evaluation of Wavewatch III in the Mediterranean Sea. Ocean. Model. 2015, 90, 82–94. [Google Scholar] [CrossRef]
  67. Boccotti, P. Wave Mechanics for Ocean Engineering; Elsevier Oceanography Series; Elsevier: Amsterdam, The Netherlands, 2000; Available online: https://www.sciencedirect.com/bookseries/lsevier-oceanography-series/vol/64/suppl/C (accessed on 15 March 2022).
  68. Sartini, L.; Mentaschi, L.; Besio, G. Comparing different extreme wave analysis models for wave climate assessment along the Italian coast. Coast. Eng. 2015, 100, 37–47. [Google Scholar] [CrossRef]
  69. Kotz, S.; Balakrishnan, N.; Read, C.B.; Vidakovic, B. Encyclopedia of Statistical Sciences; John Wiley & Sons: Hoboken, NJ, USA, 2005; Volume 1. [Google Scholar]
  70. Foti, G.; Barbaro, G.; Besio, G.; Barillà, G.C.; Mancuso, P.; Puntorieri, P. Wave Climate along Calabrian Coasts. Climate 2022, 10, 80. [Google Scholar] [CrossRef]
  71. Schambach, L.; Grilli, S.T.; Tappin, D.R.; Gangemi, M.D.; Barbaro, G. New simulations and understanding of the 1908 Messina tsunami for a dual seismic and deep submarine mass failure source. Mar. Geol. 2020, 421, 106093. [Google Scholar] [CrossRef]
  72. Sukop, M.C.; Rogers, M.; Guannel, G.; Infanti, J.M.; Hagemann, K. High temporal resolution modeling of the impact of rain, tides, and sea level rise on water table flooding in the Arch Creek basin, Miami-Dade County Florida USA. Sci. Total Environ. 2018, 616, 1668–1688. [Google Scholar] [CrossRef] [PubMed]
  73. Wang, J.; Yi, S.; Li, M.; Wang, L.; Song, C. Effects of sea level rise, land subsidence, bathymetric change and typhoon tracks on storm flooding in the coastal areas of Shanghai. Sci. Total Environ. 2018, 621, 228–234. [Google Scholar] [CrossRef] [PubMed]
  74. Carvalho, K.S.; Wang, S. Characterizing the Indian Ocean sea level changes and potential coastal flooding impacts under global warming. J. Hydrol. 2019, 569, 373–386. [Google Scholar] [CrossRef]
  75. Gornitz, V.; Oppenheimer, M.; Kopp, R.; Horton, R.; Orton, P.; Rosenzweig, C.; Solecki, W.; Patrick, L. Enhancing New York City’s resilience to sea level rise and increased coastal flooding. Urban Clim. 2020, 33, 100654. [Google Scholar] [CrossRef]
  76. Cao, A.; Esteban, M.; Valenzuela, V.P.B.; Onuki, M.; Takagi, H.; Thao, N.D.; Tsuchiya, N. Future of Asian Deltaic Megacities under sea level rise and land subsidence: Current adaptation pathways for Tokyo, Jakarta, Manila, and Ho Chi Minh City. Curr. Opin. Environ. Sustain. 2021, 50, 87–97. [Google Scholar] [CrossRef]
  77. Paulik, R.; Stephens, S.; Wild, A.; Wadhwa, S.; Bell, R.G. Cumulative building exposure to extreme sea level flooding in coastal urban areas. Int. J. Disaster Risk Reduct. 2021, 66, 102612. [Google Scholar] [CrossRef]
  78. Xu, L.; Cui, S.; Wang, X.; Tang, J.; Nitivattananon, V.; Ding, S.; Nguyen, M.N. Dynamic risk of coastal flood and driving factors: Integrating local sea level rise and spatially explicit urban growth. J. Clean. Prod. 2021, 321, 129039. [Google Scholar] [CrossRef]
  79. Amoura, R.; Dahmani, K. Visualization of the spatial extent of flooding expected in the coastal area of Algiers due to sea level rise. Horizon 2030/2100. Ocean. Coast. Manag. 2022, 219, 106041. [Google Scholar] [CrossRef]
  80. Furlan, E.; Dalla Pozza, P.; Michetti, M.; Torresan, S.; Critto, A.; Marcomini, A. Development of a Multi-Dimensional Coastal Vulnerability Index: Assessing vulnerability to inundation scenarios in the Italian coast. Sci. Total Environ. 2021, 772, 144650. [Google Scholar] [CrossRef]
Figure 1. The region of Calabria (large panel). Geographical position of the region of Calabria in the center of Mediterranean Sea (small panel).
Water 14 02240 g001
Figure 2. Calabrian sample areas, identified with a code. The names of the sample areas are shown in Table 1.
Water 14 02240 g002
Figure 3. Rossano. Legend: Yellow, the floodable area in the current scenario; red, the floodable area in the future scenario.
Water 14 02240 g003
Figure 4. Lazzaro. Legend: Yellow, the floodable area in the current scenario; red, the floodable area in the future scenario.
Water 14 02240 g004
Figure 5. Ricadi. Legend: Yellow, the floodable area in the current scenario; red, the floodable area in the future scenario.
Water 14 02240 g005
Figure 6. Badolato. Legend: Yellow, the floodable area in the current scenario; red, the floodable area in the future scenario.
Water 14 02240 g006
Figure 7. Vibo Marina. Legend: Yellow, the floodable area in the current scenario; red, the floodable area in the future scenario.
Water 14 02240 g007
Figure 8. San Ferdinando. Schemes follow the same formatting. Legend: Yellow, the floodable area in the current scenario; red, the floodable area in the future scenario.
Water 14 02240 g008
Publisher’s Note: MDPI stays neutral with regard to jurisdictional claims in published maps and institutional affiliations.

