
Effects of Eutrophication on Plankton Abundance and Composition in the Gulf of Gabès (Mediterranean Sea, Tunisia)

 , , , ,
Abstract
:Highlights
- A total of 42 phytoplankton and 24 Copepoda taxa were identified in the coastal environment of Gabès (Tunisia).
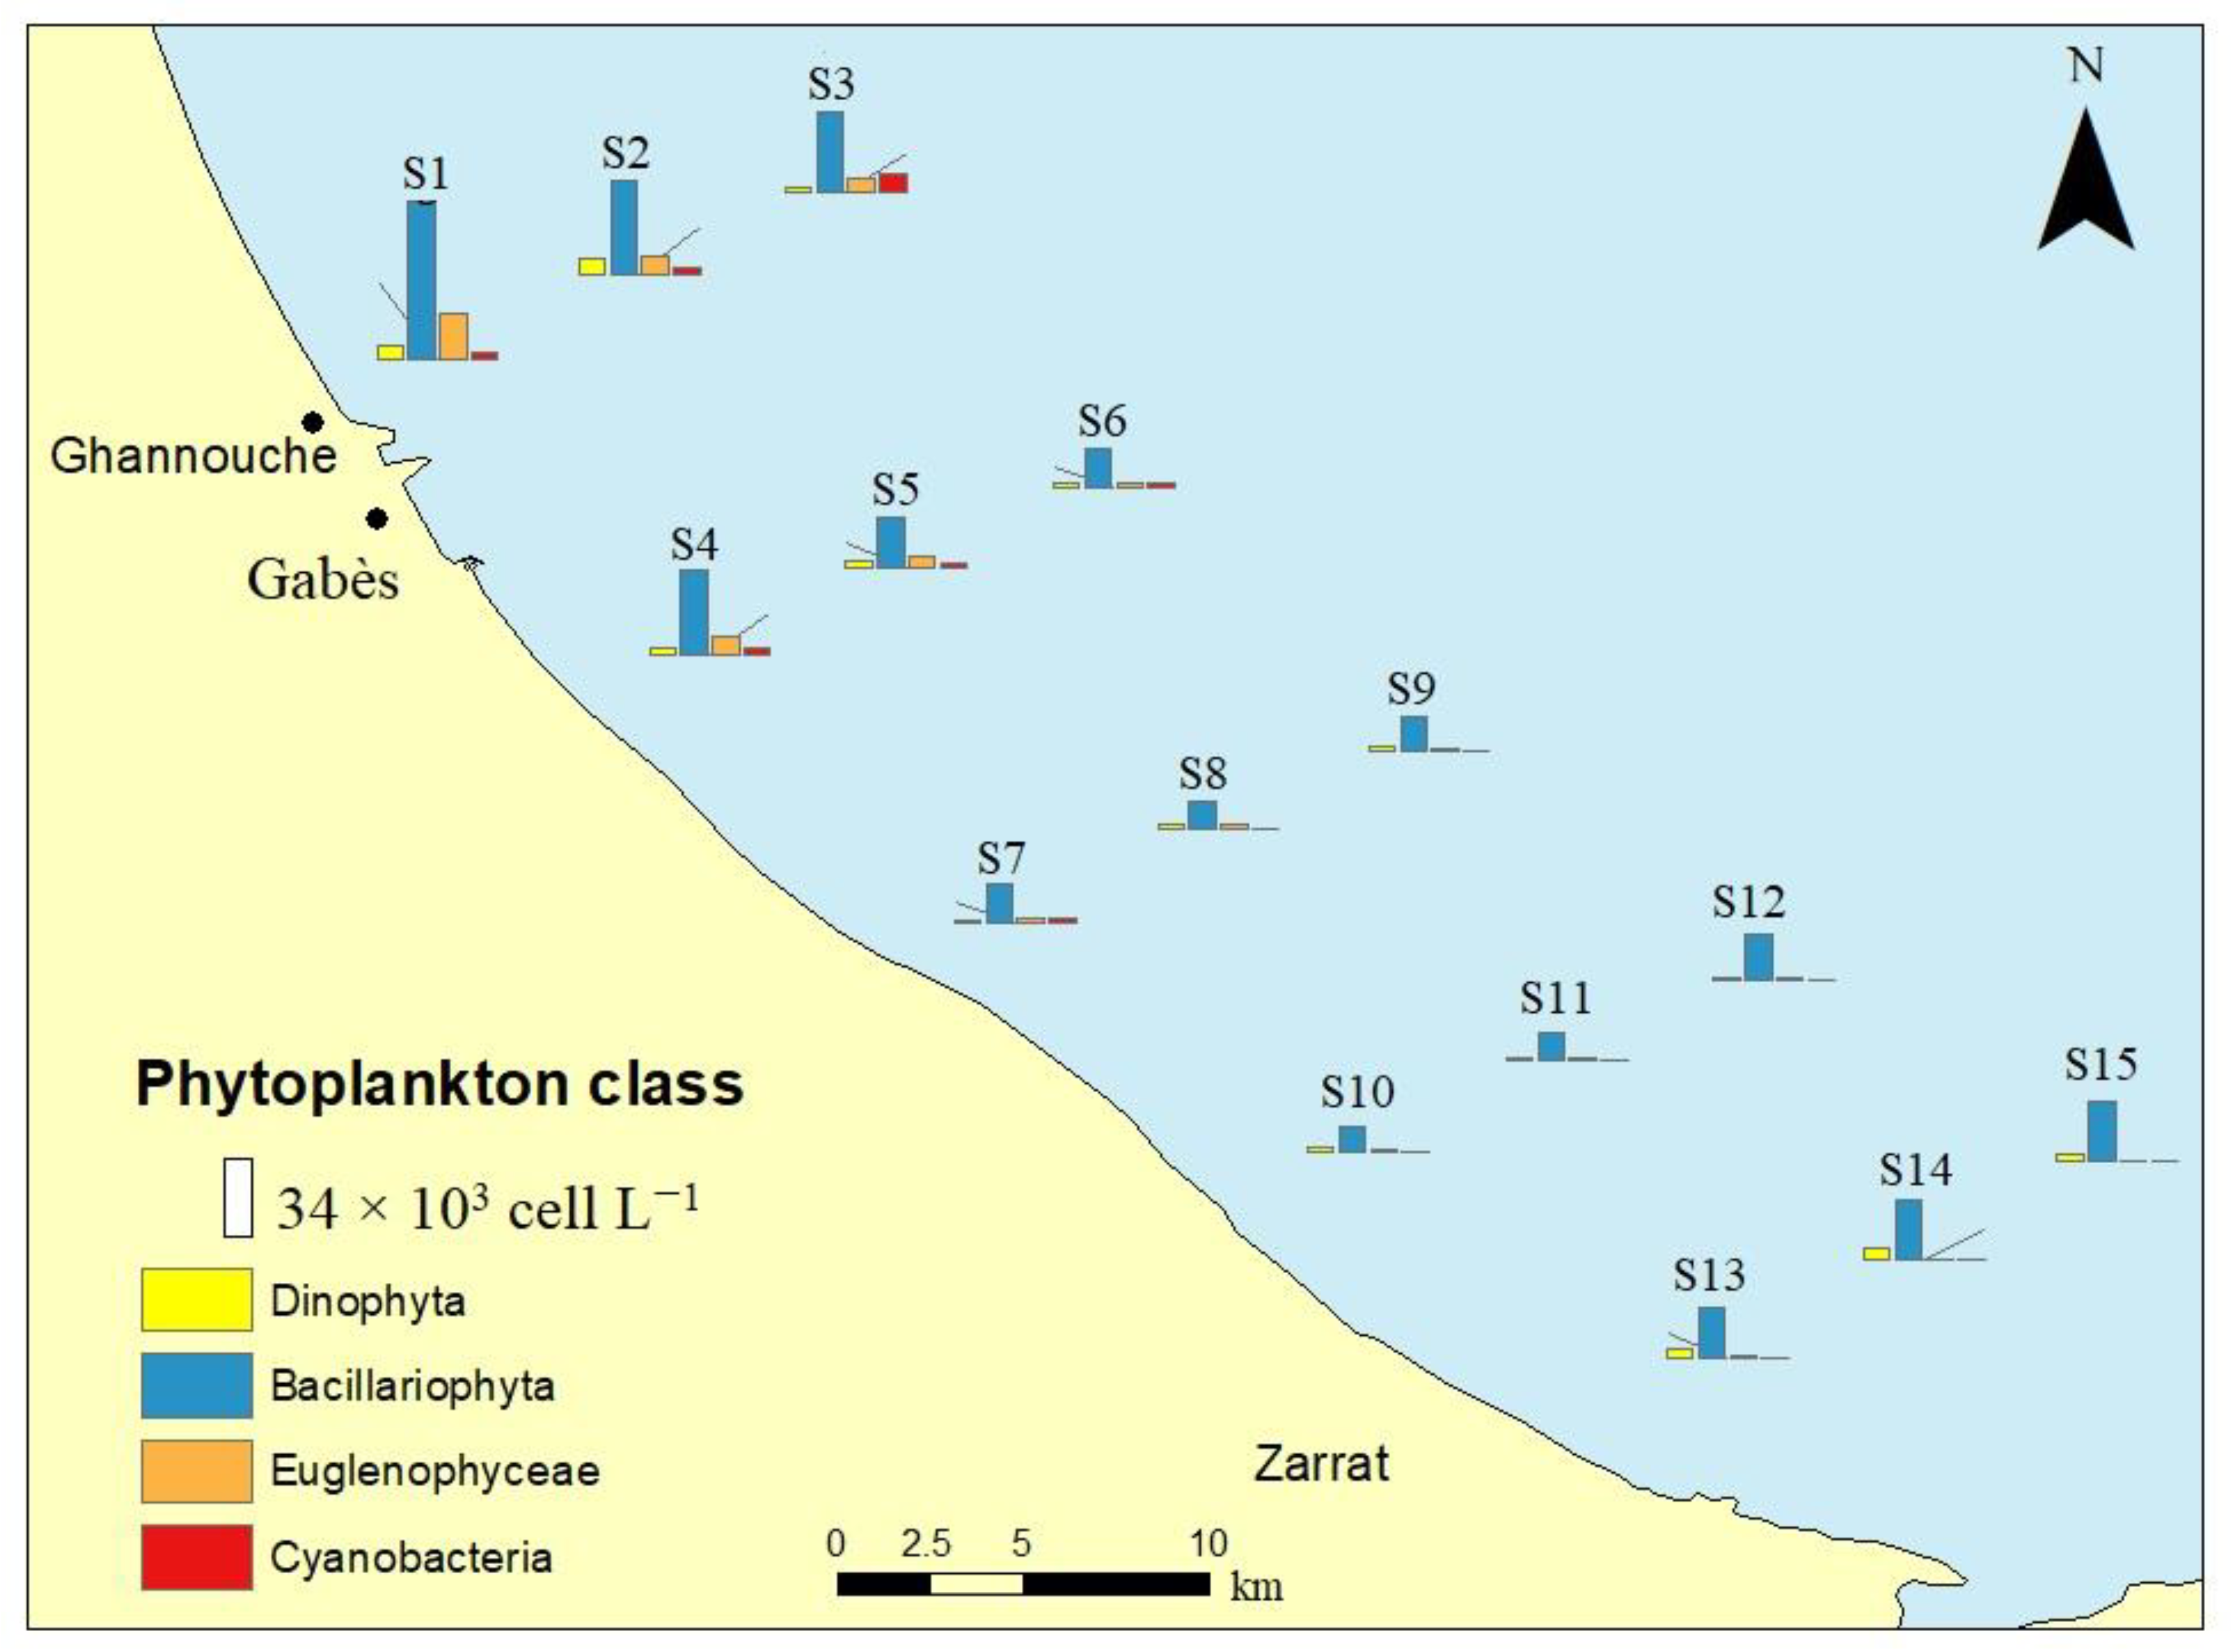
- Bacillariophyta were the most abundant group (67.7–89.2% of total phytoplankton abundance).
- Shannon–Weaver diversity index of phytoplankton and Copepoda showed negative correlations with Eutrophication Index.
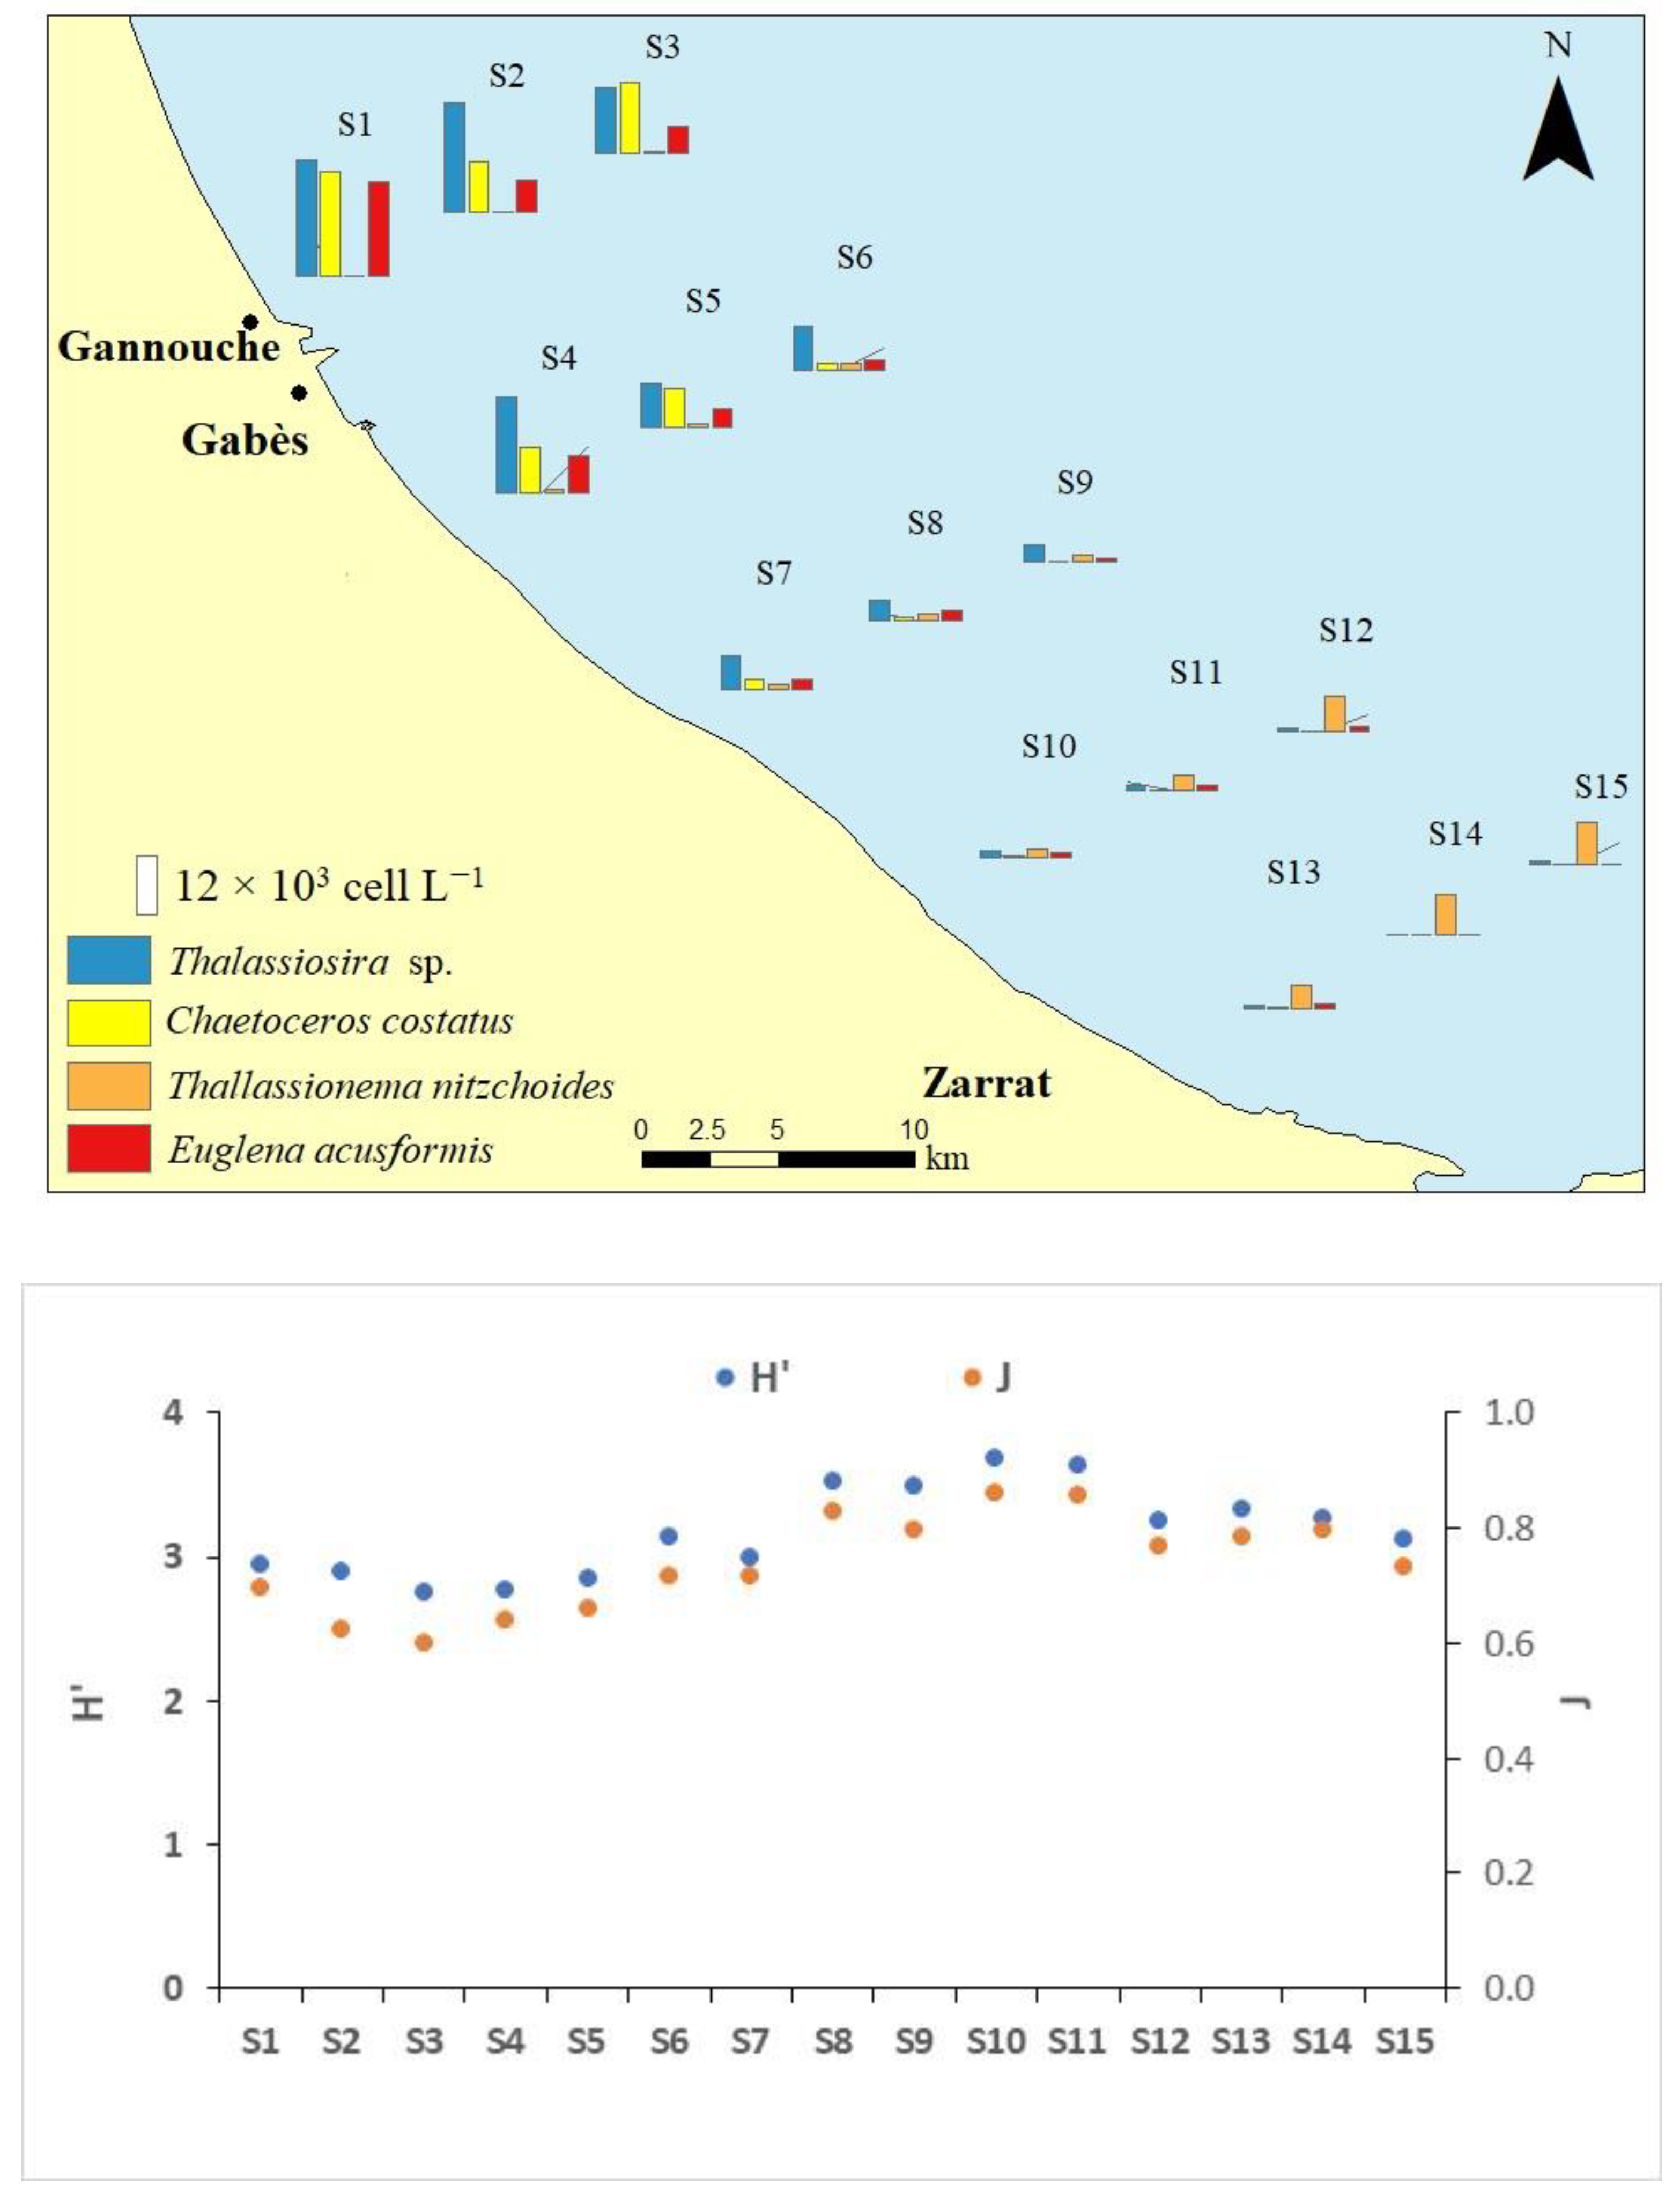
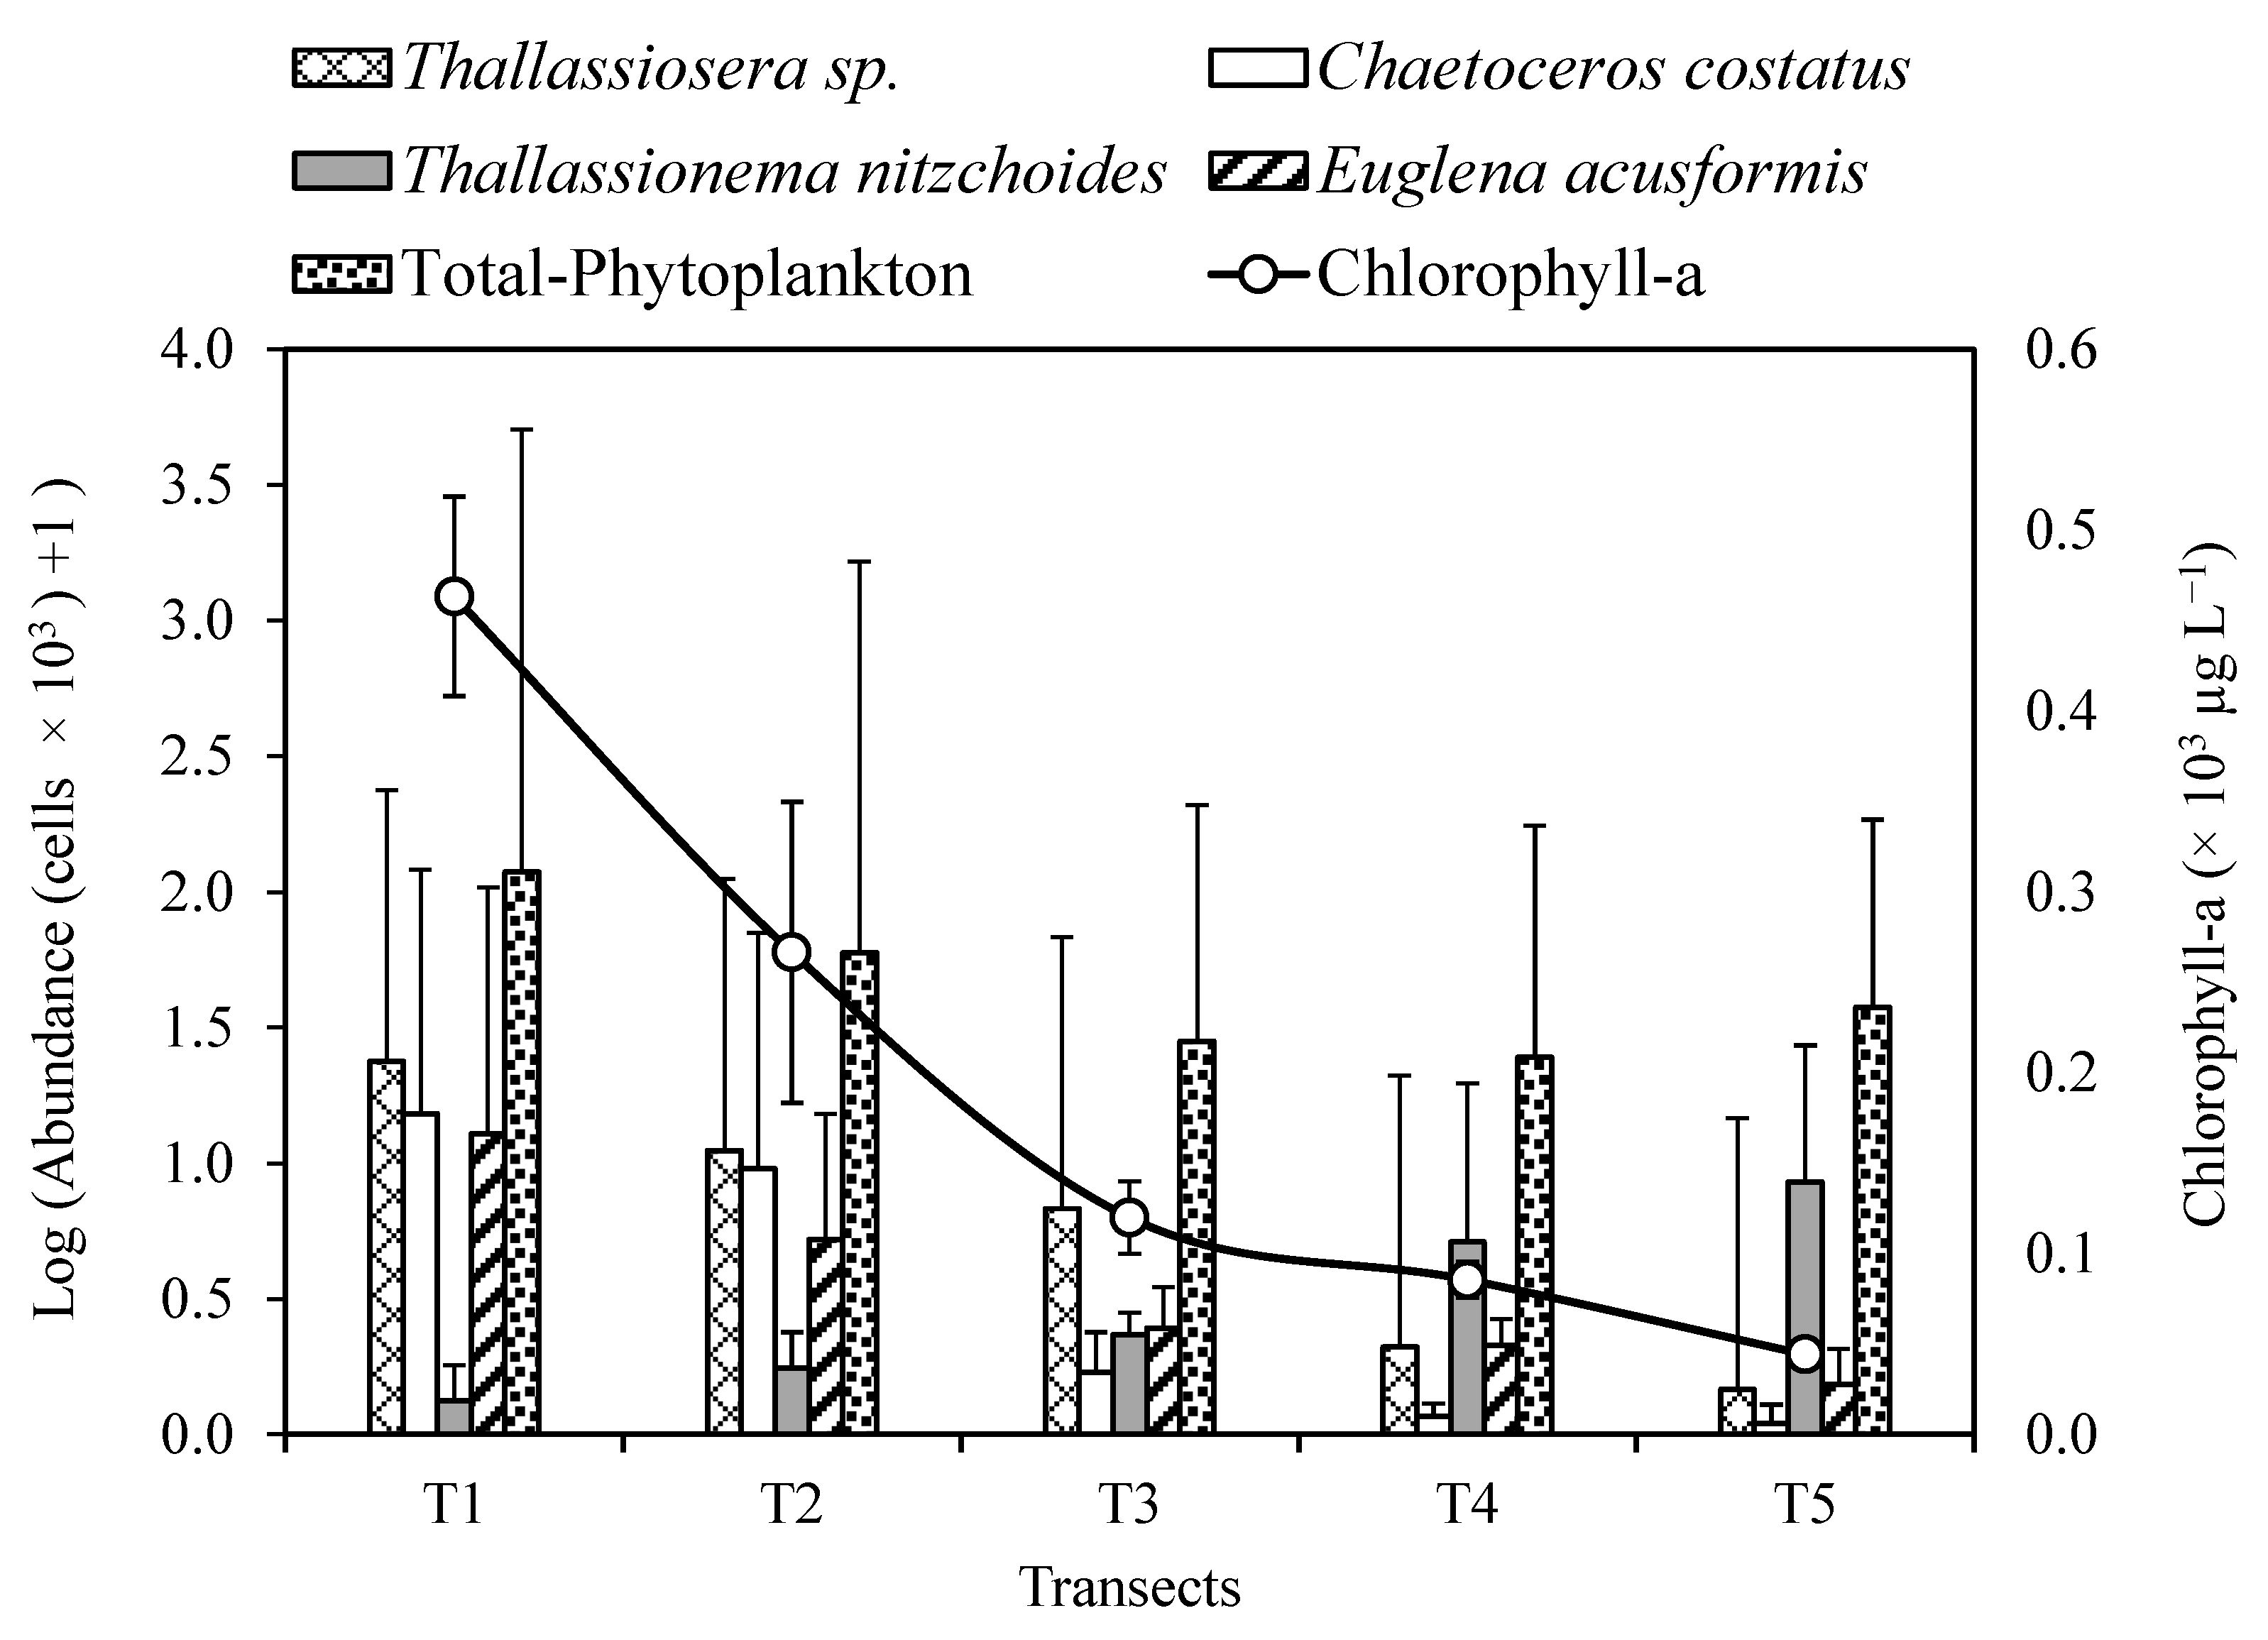
- Opportunistic and r strategist species (Chaetoceros costatus, Euglena acusformis, and Thalassiosira sp.) showed a positive correlation with Eutrophication Index.
- Among Copepoda, Oithona similis and Euterpina acutifrons were indifferent to eutrophication.
Abstract
1. Introduction
2. Material and Methods
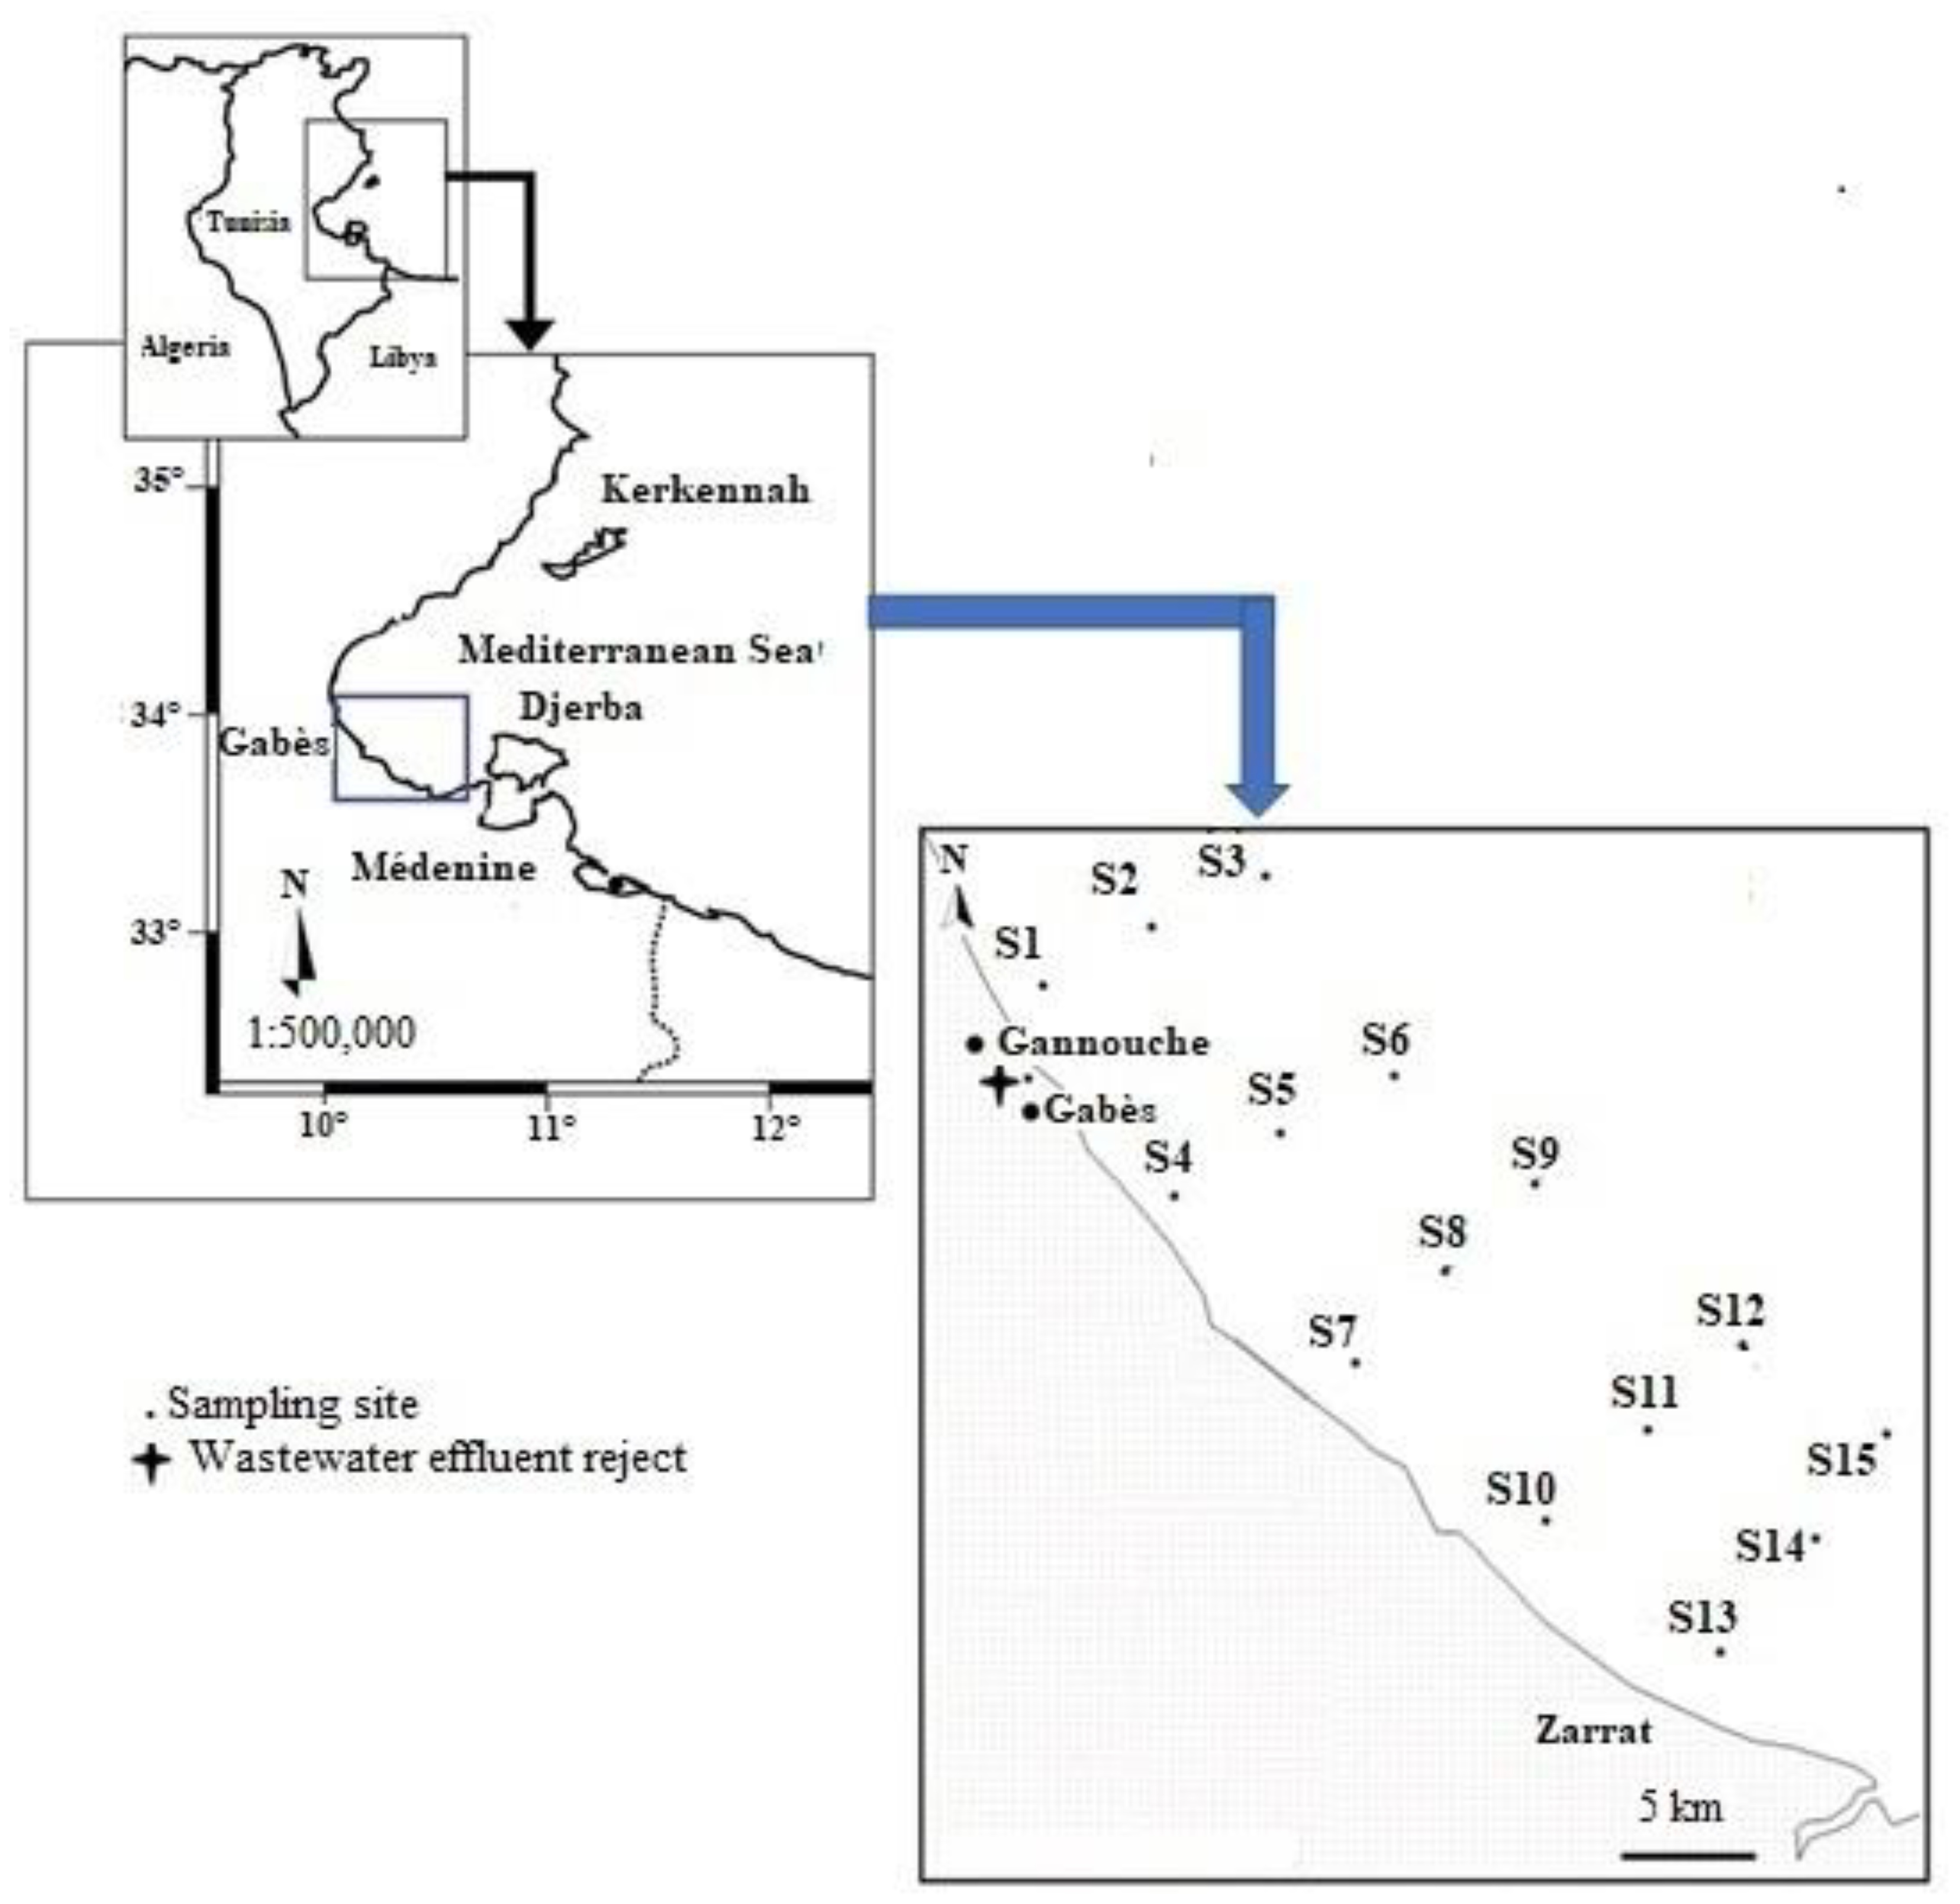
2.1. Field Sampling
2.2. Physico-Chemical and Chl-a Analysis
- 1.
- (High ecological water quality, E.I. < 0.04),
- 2.
- (Good E.I. = 0.04–0.38),
- 3.
- (Moderate, E.I. = 0.38–0.85),
- 4.
- (Poor, E.I. = 0.85–1.51),
- 5.
- (Bad, E.I. > 1.51).
2.3. Phytoplankton and Zooplankton Abundance
2.4. Statistics
3. Results
3.1. Seawater Analysis and Trophic State
3.2. Chl-a and Phytoplankton Community Structure
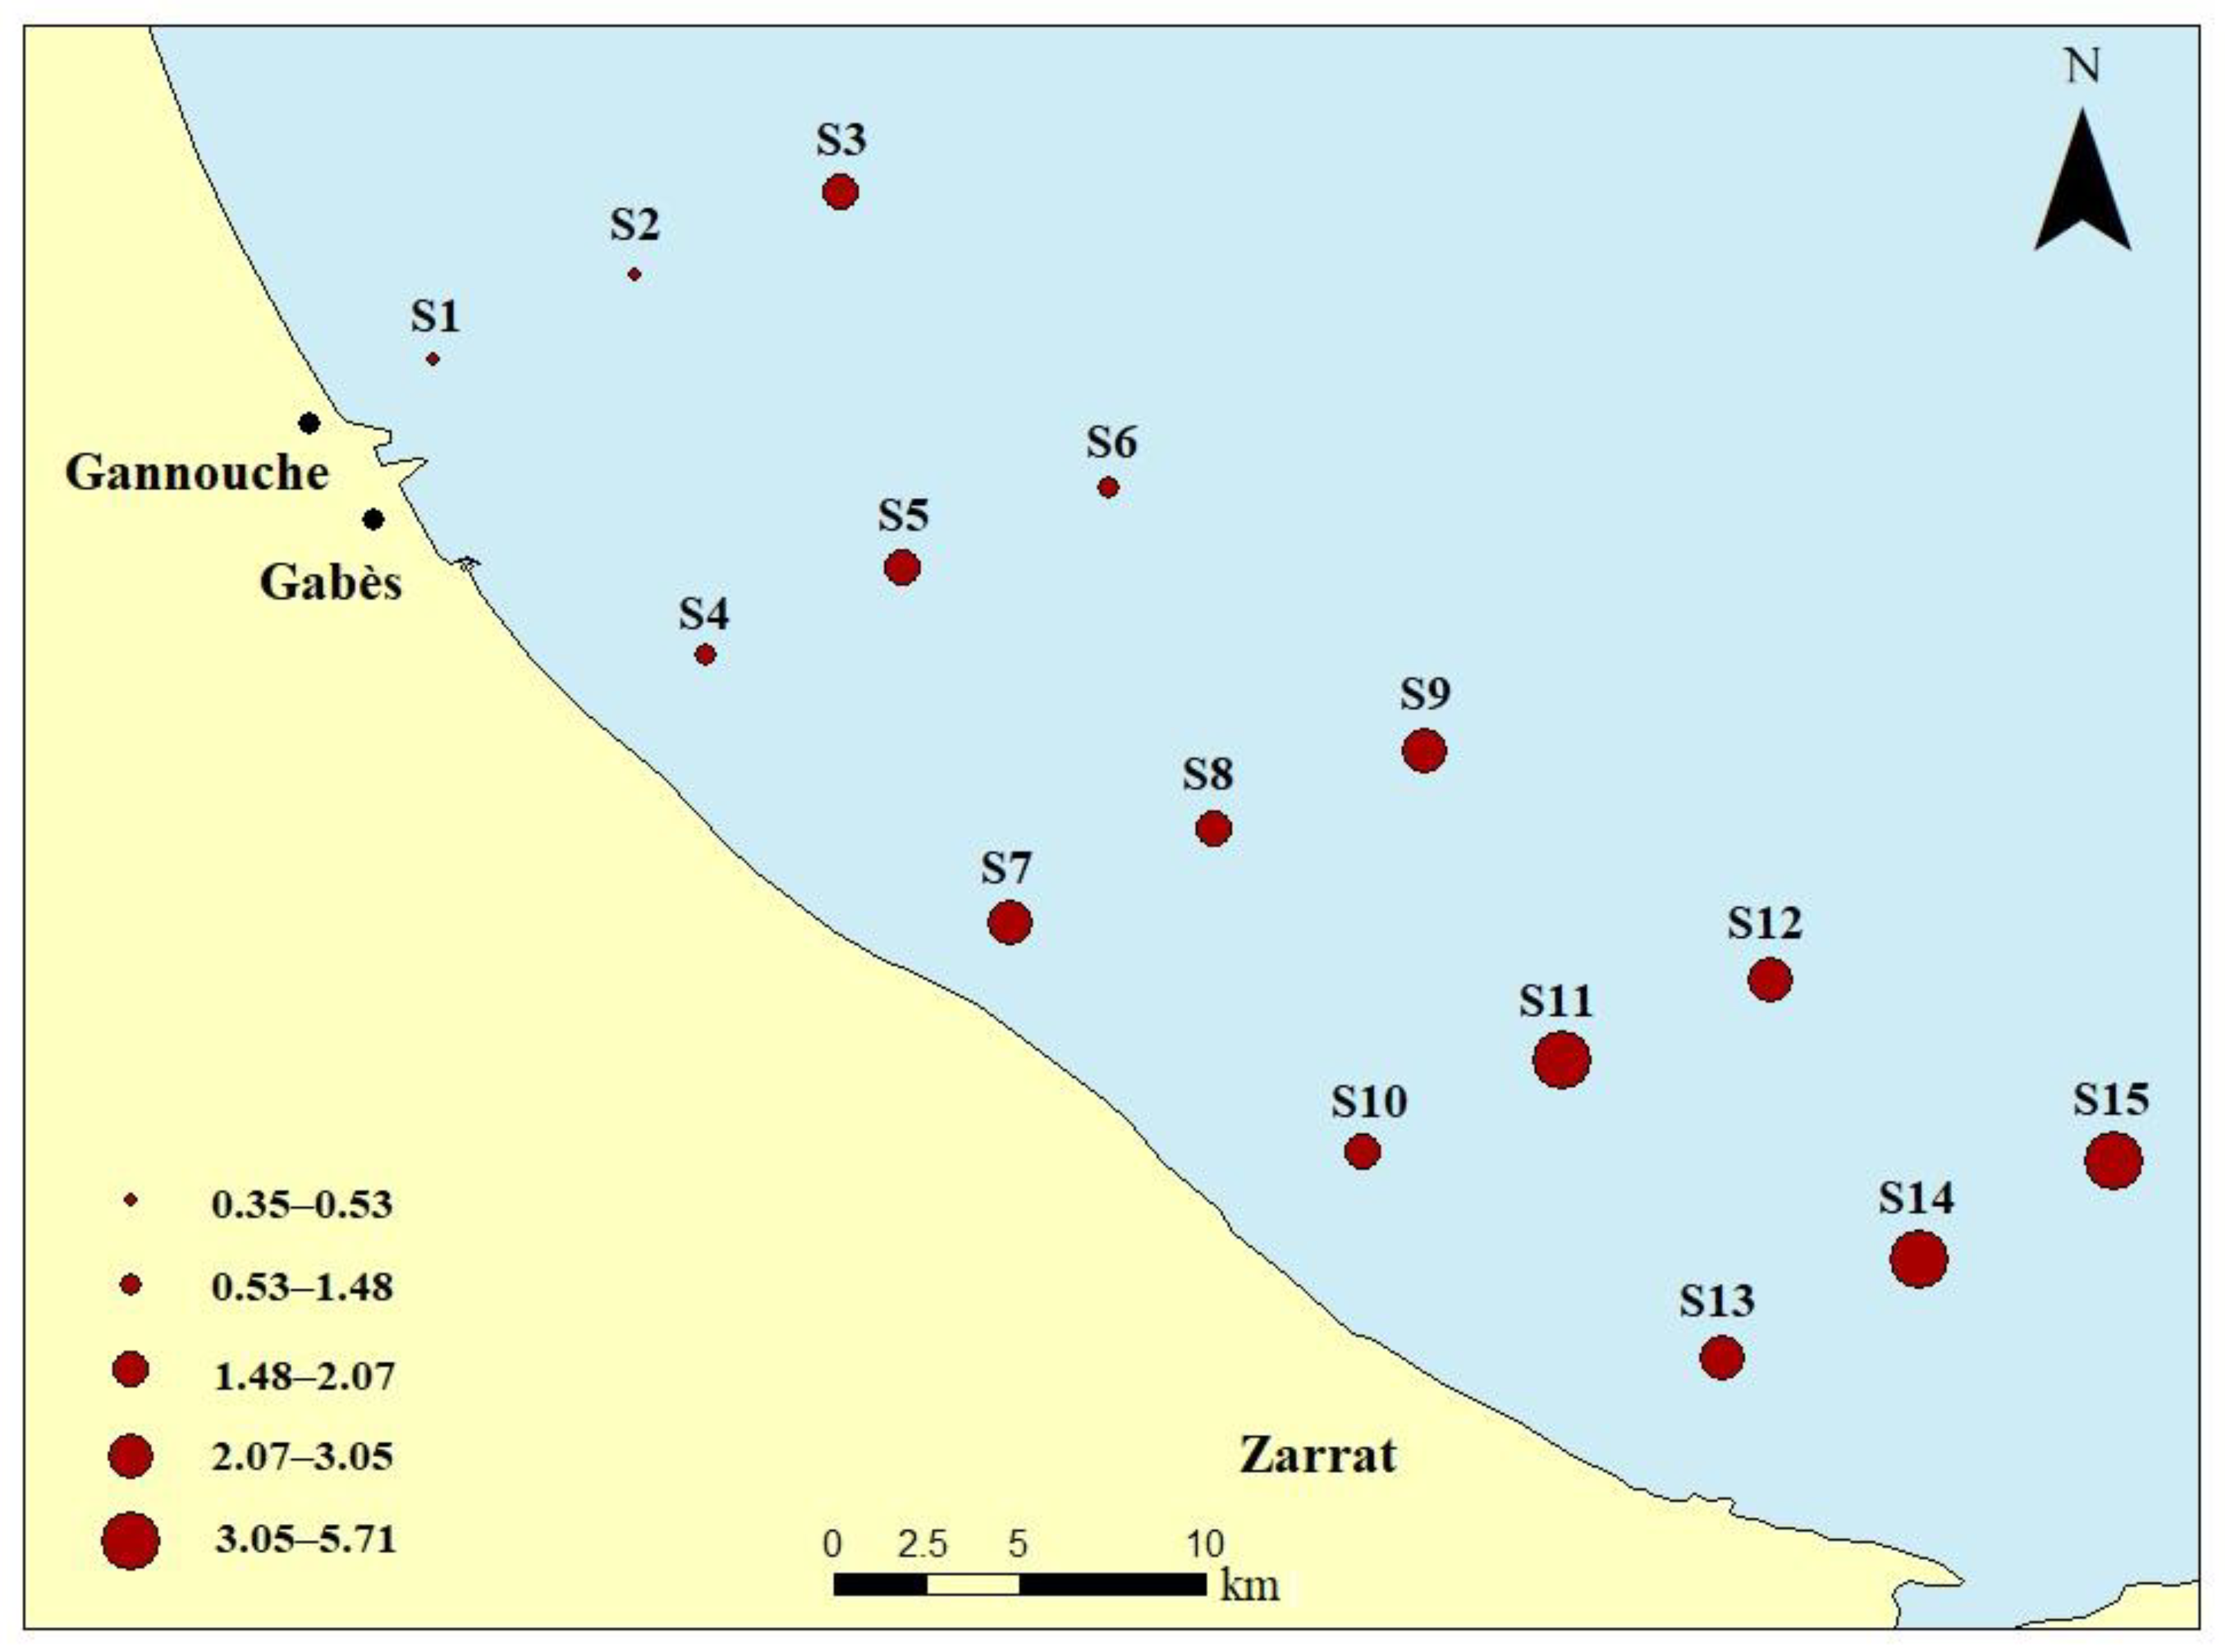
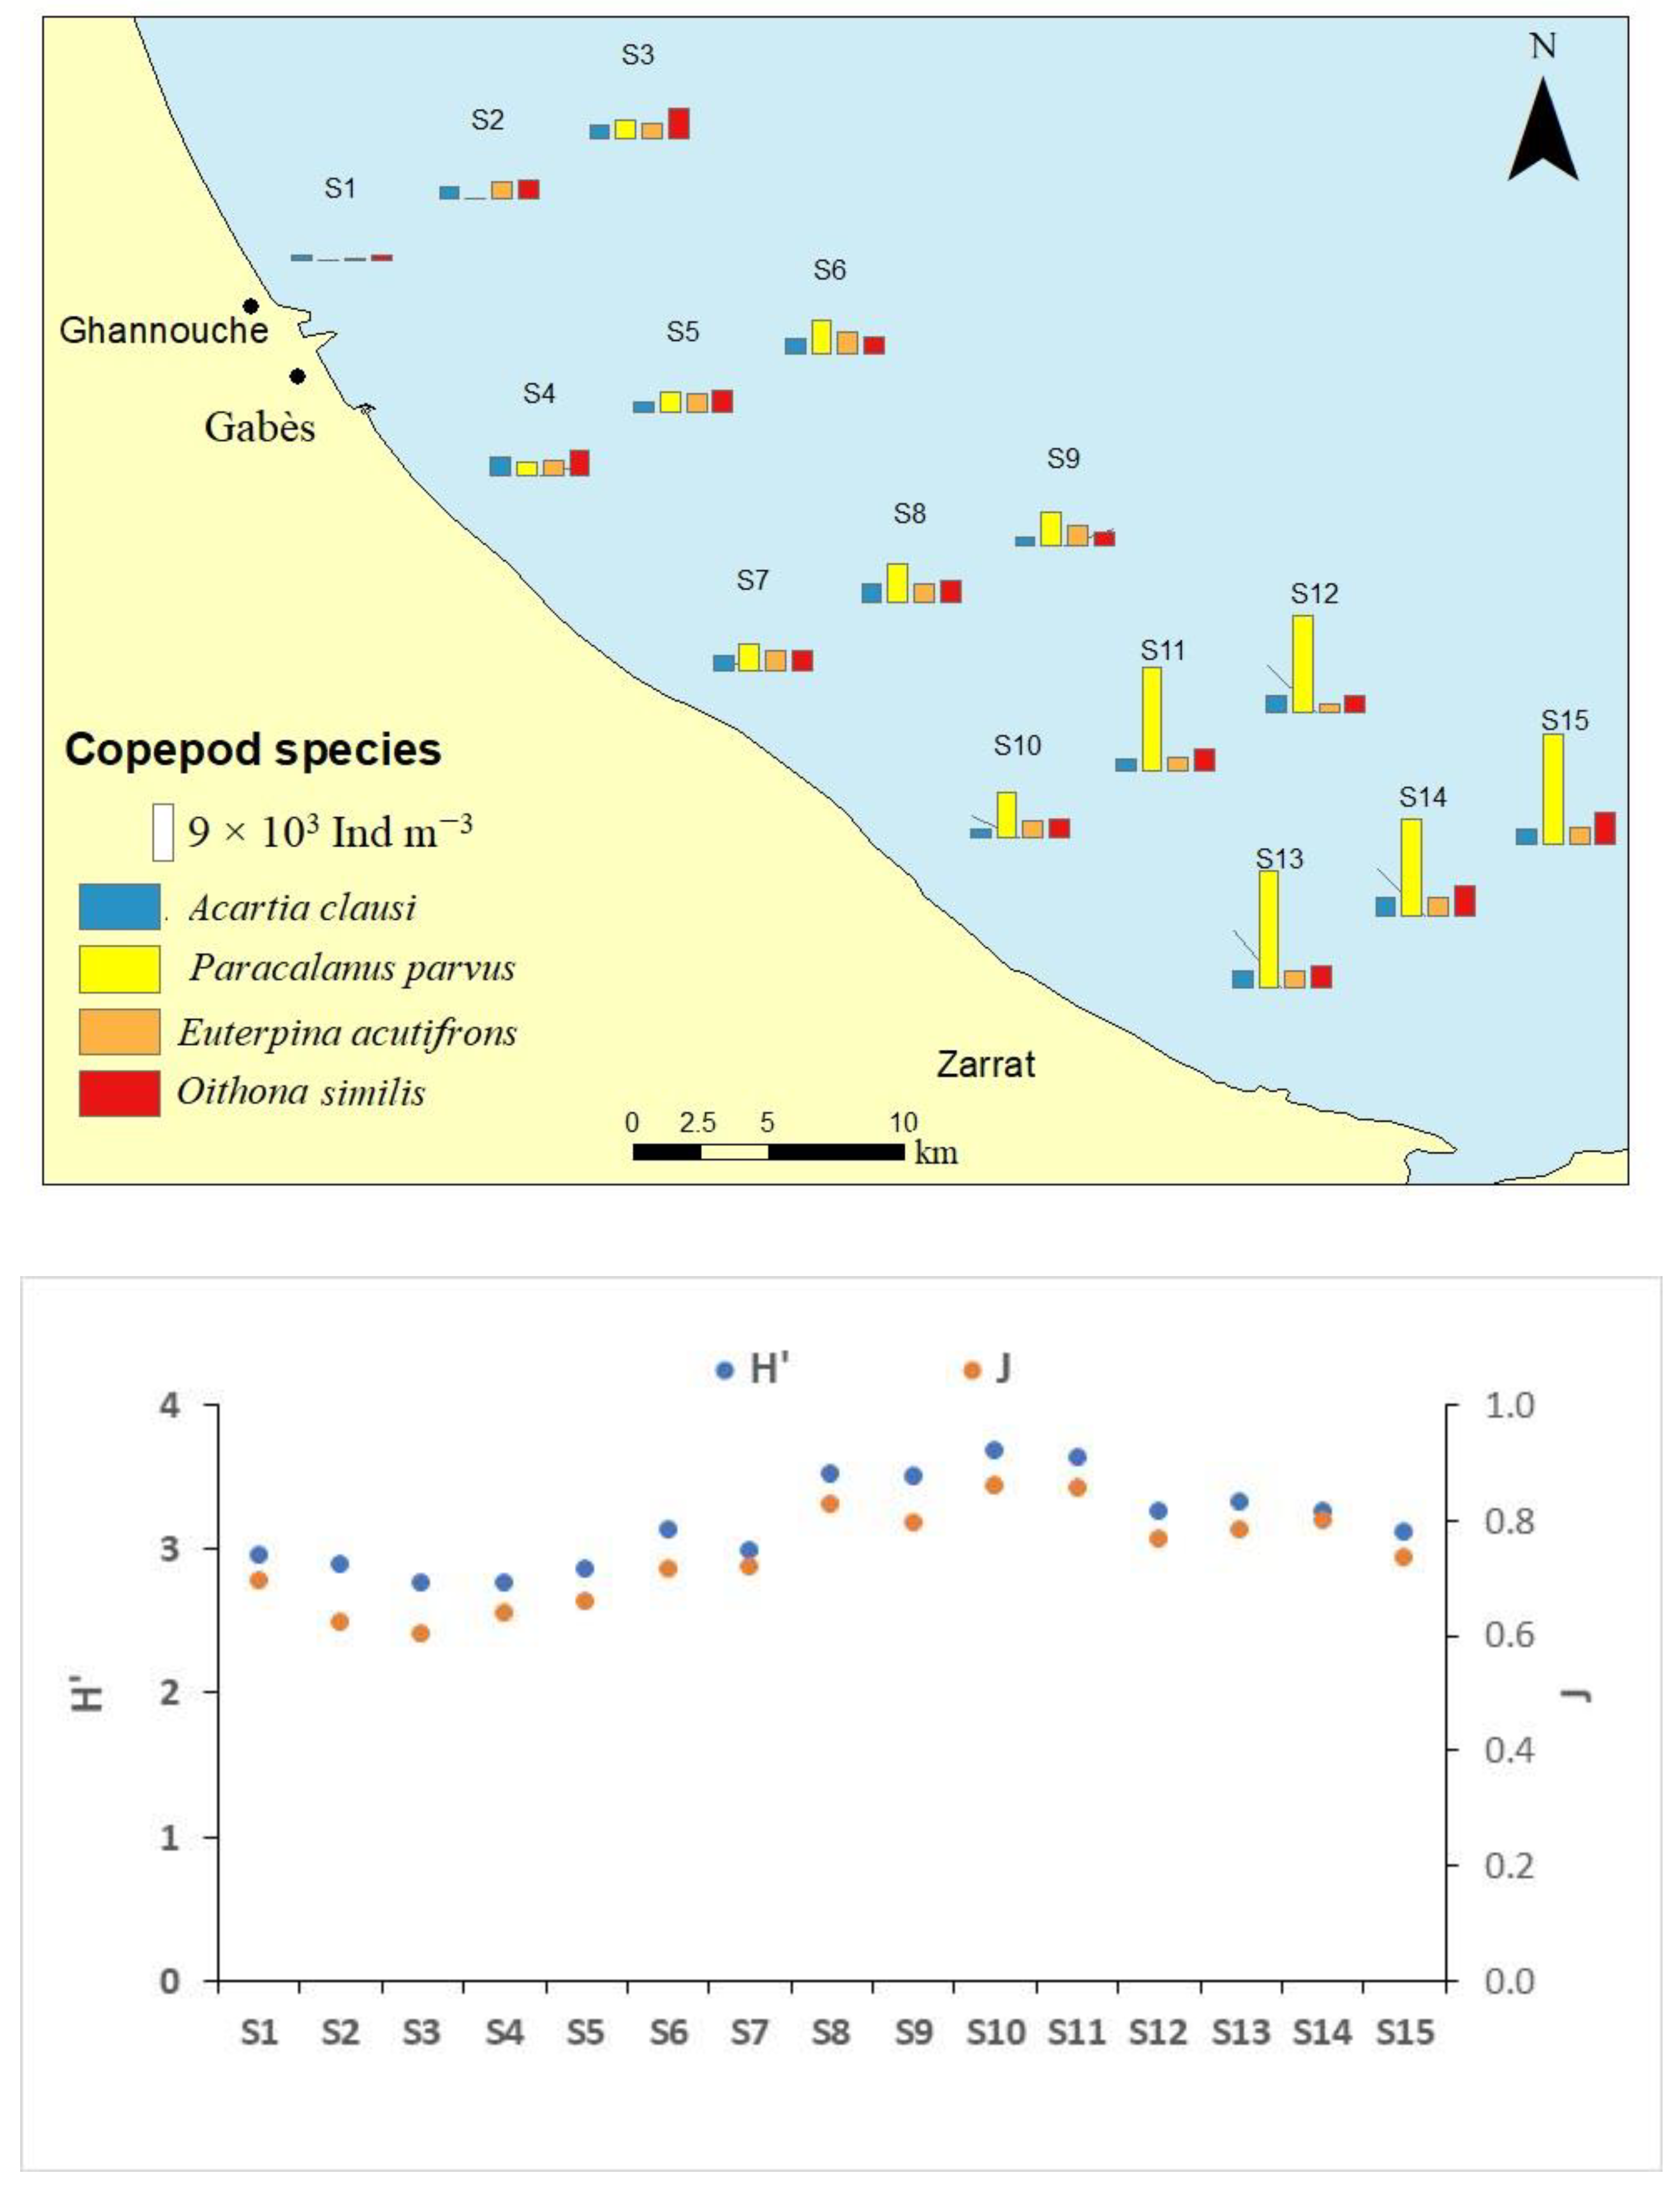
3.3. Copepoda Community Structure
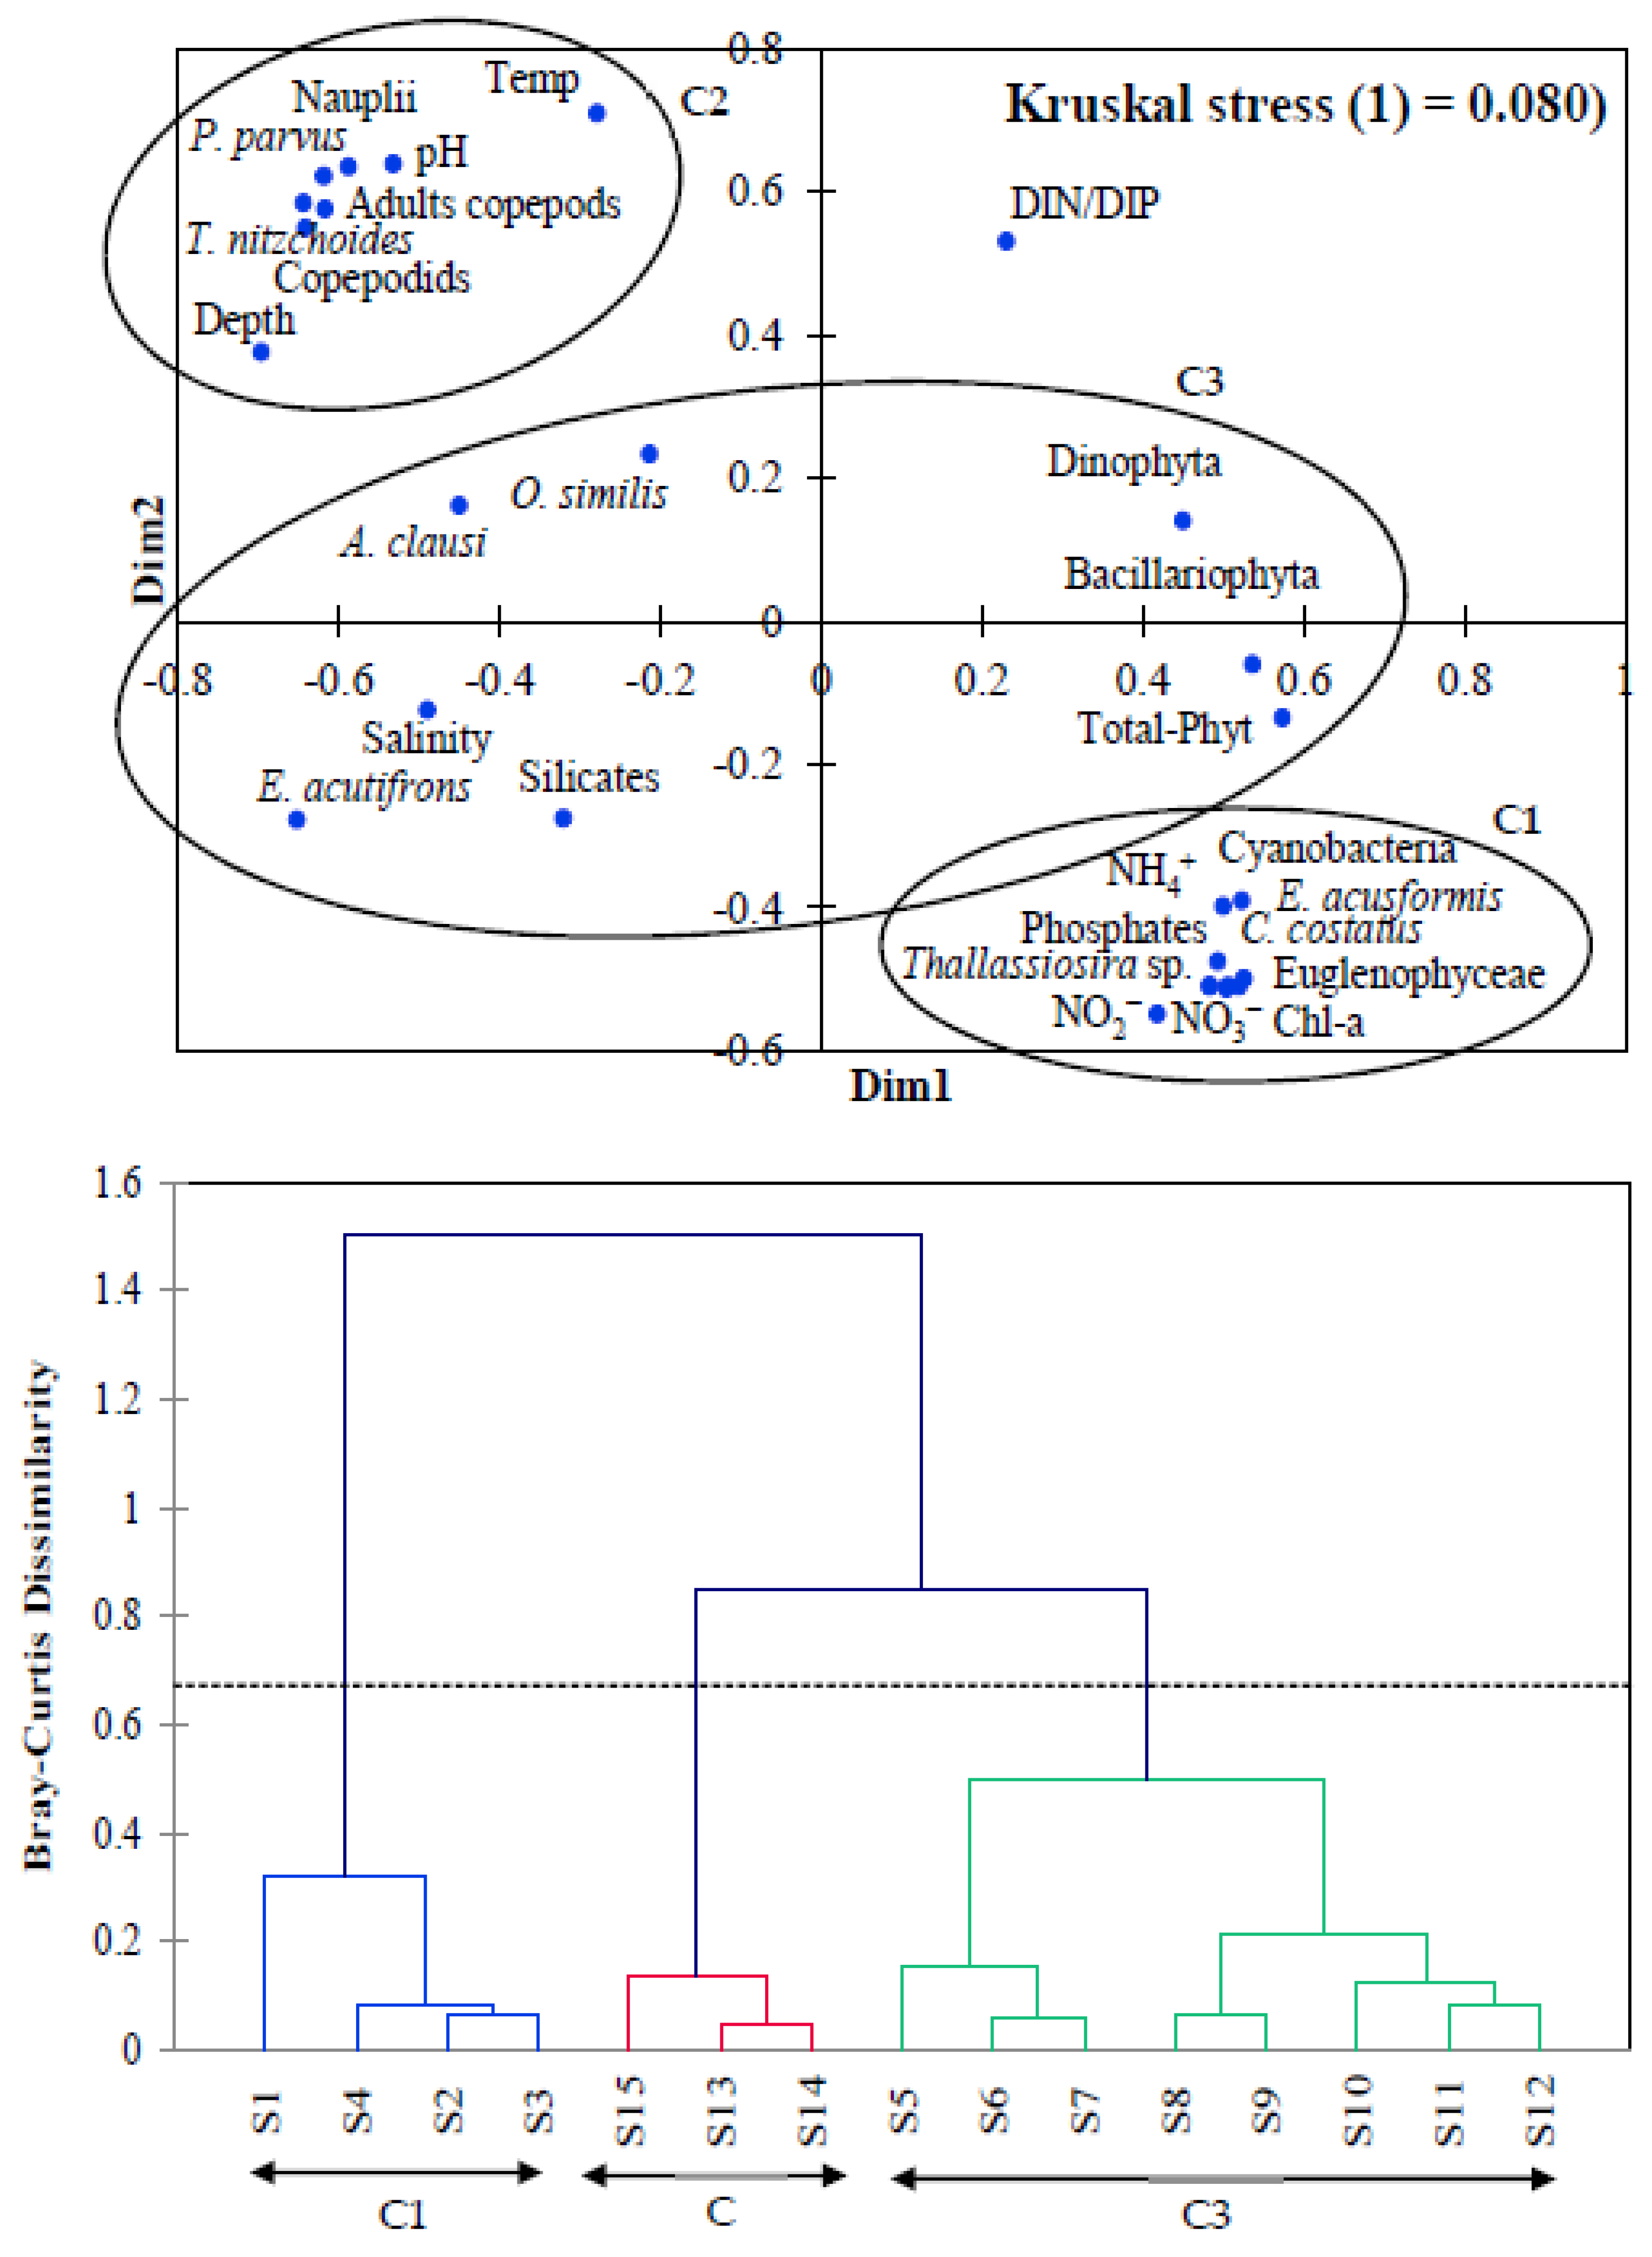
3.4. Copepods and Phytoplankton Relationship with Environmental Conditions
4. Discussion
5. Conclusions
Author Contributions
Funding
Acknowledgments
Conflicts of Interest
References
- Vollenweider, R.A. Coastal Marine Eutrophication: Principles and Control. In Marine Coastal Eutrophication; Elsevier: Amsterdam, The Netherlands, 1992; pp. 1–20. [Google Scholar]
- Nixon, S.W. Eutrophication and the Macroscope. In Eutrophication in Coastal Ecosystems; Springer: Berlin/Heidelberg, Germany, 2009; pp. 5–19. [Google Scholar]
- Malone, T.C.; Newton, A. The Globalization of Cultural Eutrophication in the Coastal Ocean: Causes and Consequences. Front. Mar. Sci. 2020, 7, 670. [Google Scholar] [CrossRef]
- Rabalais, N.N.; Turner, R.E.; Díaz, R.J.; Justić, D. Global Change and Eutrophication of Coastal Waters. ICES J. Mar. Sci. 2009, 66, 1528–1537. [Google Scholar] [CrossRef]
- McQuatters-Gollop, A.; Gilbert, A.J.; Mee, L.D.; Vermaat, J.E.; Artioli, Y.; Humborg, C.; Wulff, F. How Well Do Ecosystem Indicators Communicate the Effects of Anthropogenic Eutrophication? Estuar. Coast. Shelf Sci. 2009, 82, 583–596. [Google Scholar] [CrossRef]
- Marcus, N. An Overview of the Impacts of Eutrophication and Chemical Pollutants on Copepods of the Coastal Zone. Zool. Stud. 2004, 43, 211–217. [Google Scholar]
- Bužančić, M.; Gladan, Ž.N.; Marasović, I.; Kušpilić, G.; Grbec, B. Eutrophication Influence on Phytoplankton Community Composition in Three Bays on the Eastern Adriatic Coast. Oceanologia 2016, 58, 302–316. [Google Scholar] [CrossRef] [Green Version]
- Annabi-Trabelsi, N.; El-Shabrawy, G.; Goher, M.E.; Subrahmanyam, M.N.; Al-Enezi, Y.; Ali, M.; Ayadi, H.; Belmonte, G. Key Drivers for Copepod Assemblages in a Eutrophic Coastal Brackish Lake. Water 2019, 11, 363. [Google Scholar] [CrossRef] [Green Version]
- Reid, P.C.; Edwards, M. Long-Term Changes in the Pelagos, Benthos and Fisheries of the North Sea. Senckenbergiana Marit. 2001, 31, 107. [Google Scholar] [CrossRef]
- Perbiche-Neves, G.; Saito, V.S.; Previattelli, D.; Da Rocha, C.E.; Nogueira, M.G. Cyclopoid Copepods as Bioindicators of Eutrophication in Reservoirs: Do Patterns Hold for Large Spatial Extents? Ecol. Indic. 2016, 70, 340–347. [Google Scholar] [CrossRef] [Green Version]
- Siokou-Frangou, I.; Papathanassiou, E.; Lepretre, A.; Frontier, S. Zooplankton Assemblages and Influence of Environmental Parameters on Them in a Mediterranean Coastal Area. J. Plankton Res. 1998, 20, 847–870. [Google Scholar] [CrossRef] [Green Version]
- Uye, S. Replacement of Large Copepods by Small Ones with Eutrophication of Embayments: Cause and Consequence. In Proceedings of the Ecology and Morphology of Copepods, Baltimore, MA, USA, 6–13 June 1993; Ferrari, F.D., Bradley, B.P., Eds.; Springer: Dordrecht, The Netherlands, 1994; pp. 513–519. [Google Scholar]
- Zhang, G.-T.; Wong, C.K. Changes in the Planktonic Copepod Community in a Landlocked Bay in the Subtropical Coastal Waters of Hong Kong during Recovery from Eutrophication. Hydrobiologia 2011, 666, 277–288. [Google Scholar] [CrossRef]
- Belmonte, G.; Moscatello, S.; Hajdëri, E.; Vaglio, I.; Denitto, F. Composition and Spatial Distribution of Mesozooplankton along Confinement and Anthropogenic-Impact Gradients in the Gulf of Vlore (Albania). J. Coast. Res. 2018, 34, 174–184. [Google Scholar] [CrossRef]
- Belmonte, G.; Vaglio, I.; Rubino, F.; Alabiso, G. Zooplankton Composition along the Confinement Gradient of the Taranto Sea System (Ionian Sea, South-Eastern Italy). J. Mar. Syst. 2013, 128, 222–238. [Google Scholar] [CrossRef]
- Engström-Öst, J.; Brutemark, A.; Vehmaa, A.; Motwani, N.H.; Katajisto, T. Consequences of a cyanobacteria bloom for copepod reproduction, mortality and sex ratio. J. Plankton Res. 2015, 37, 388–398. [Google Scholar] [CrossRef] [Green Version]
- O’Neil, J.M.; Davis, T.W.; Burford, M.A.; Gobler, C.J. The rise of harmful cyanobacteria blooms: The potential roles of eutrophication and climate change. Harmful Algae 2012, 14, 313–334. [Google Scholar] [CrossRef]
- Krupa, E.G. Population densities, sex ratios of adults, and occurrence of malformations in three species of cyclopoid copepods in waterbodies with different degrees of eutrophy and toxic pollution. J. Mar. Sci. Technol. 2005, 13, 226–237. [Google Scholar]
- Bhagowati, B.; Ahamad, K.U. A Review on Lake Eutrophication Dynamics and Recent Developments in Lake Modeling. Ecohydrol. Hydrobiol. 2019, 19, 155–166. [Google Scholar] [CrossRef]
- El Zrelli, R.; Courjault-Radé, P.; Rabaoui, L.; Castet, S.; Michel, S.; Bejaoui, N. Heavy Metal Contamination and Ecological Risk Assessment in the Surface Sediments of the Coastal Area Surrounding the Industrial Complex of Gabes City, Gulf of Gabes, SE Tunisia. Mar. Pollut. Bull. 2015, 101, 922–929. [Google Scholar] [CrossRef] [PubMed]
- Darmoul, B.; SALEM, M.H.A. Effets Des Rejets Industriels de La Région de Gabès (Tunisie) Sur Le Milieu Marin Récepteur. In Bulletin de l’Institut National Scientifique et Technique d’Océanographie et de Pêche de Salammbô; INSTM: Tunis, Tunisie, 1980. [Google Scholar]
- Darmoul, B. Pollution Dans Le Golfe de Gabès (Tunisie). Bilan de Six Années de Surveillance (1976–1981). Bulletin De L’Institut National Scientifique Et Technique 1988, 15, 61–84. [Google Scholar]
- Ayadi, N.; Aloulou, F.; Bouzid, J. Assessment of Contaminated Sediment by Phosphate Fertilizer Industrial Waste Using Pollution Indices and Statistical Techniques in the Gulf of Gabes (Tunisia). Arab. J. Geosci. 2015, 8, 1755–1767. [Google Scholar] [CrossRef]
- Rabaoui, L.; Balti, R.; Zrelli, R.; Tlig-Zouari, S. Assessment of Heavy Metals Pollution in the Gulf of Gabes (Tunisia) Using Four Mollusk Species. Mediterr. Mar. Sci. 2014, 15, 45–58. [Google Scholar] [CrossRef] [Green Version]
- Kharroubi, A.; Gzam, M.; Jedoui, Y. Anthropogenic and Natural Effects on the Water and Sediments Qualities of Costal Lagoons: Case of the Boughrara Lagoon (Southeast Tunisia). Environ. Earth Sci. 2012, 67, 1061–1067. [Google Scholar] [CrossRef]
- Gargouri, D.; Gzam, M.; Kharroubi, A.; Jedoui, Y. Use of Sediment Quality Indicators for Heavy Metals Contamination and Ecological Risk Assessment in Urbanized Coastal Zones. Environ. Earth Sci. 2018, 77, 381. [Google Scholar] [CrossRef]
- Annabi-Trabelsi, N.; Kobbi-Rebai, R.; Al-Enezi, Y.; Ali, M.; Subrahmanyam, M.N.V.; Belmonte, G.; Ayadi, H. Factors affecting Oithona nana and Oithona similis along a salinity gradient. Mediterr. Mar. Sci. 2021, 22, 552–565. [Google Scholar] [CrossRef]
- Rabaoui, L.; El Zrelli, R.; Mansour, M.B.; Balti, R.; Mansour, L.; Tlig-Zouari, S.; Guerfel, M. On the Relationship between the Diversity and Structure of Benthic Macroinvertebrate Communities and Sediment Enrichment with Heavy Metals in Gabes Gulf, Tunisia. Marine Biological Association of the United Kingdom. J. Mar. Biol. Assoc. UK 2015, 95, 233. [Google Scholar] [CrossRef]
- Bejaoui, B.; Rais, S.; Koutitonsky, V. Modélisation de La Dispersion Du Phosphogypse Dans Le Golfe de Gabès. In Bulletin de l’Institut National Scientifique et Technique d’Océanographie et de Pêche de Salammbô; INSTM: Tunis, Tunisie, 2004. [Google Scholar]
- Rutherford, P.M.; Dudas, M.J.; Samek, R.A. Environmental Impacts of Phosphogypsum. Sci. Total Environ. 1994, 149, 1–38. [Google Scholar] [CrossRef]
- Ajmal, P.Y.; Bhangare, R.C.; Tiwari, M.; Sahu, S.K.; Pandit, G.G. External Gamma Radiation Levels and Natural Radioactivity in Soil around a Phosphate Fertilizer Plant at Mumbai. J. Radioanal. Nucl. Chem. 2014, 300, 23–27. [Google Scholar] [CrossRef]
- Correll, D.L. The Role of Phosphorus in the Eutrophication of Receiving Waters: A Review. J. Environ. Qual. 1998, 27, 261–266. [Google Scholar] [CrossRef] [Green Version]
- Rekik, A.; Denis, M.; Aleya, L.; Maalej, S.; Ayadi, H. Spring Plankton Community Structure and Distribution in the North and South Coasts of Sfax (Tunisia) after North Coast Restoration. Mar. Pollut. Bull. 2013, 67, 82–93. [Google Scholar] [CrossRef]
- Feki-Sahnoun, W.; Njah, H.; Barraj, N.; Mahfoudi, M.; Akrout, F.; Rebai, A.; Hassen, M.B.; Hamza, A. Influence of Phosphorus-Contaminated Sediments in The Abundance Of Potentially Toxic Phytoplankton Along The Sfax Coasts (Gulf of Gabes, Tunisia). J. Sediment. Environ. 2019, 4, 458–470. [Google Scholar] [CrossRef]
- Primpas, I.; Tsirtsis, G.; Karydis, M.; Kokkoris, G.D. Principal Component Analysis: Development of a Multivariate Index for Assessing Eutrophication According to the European Water Framework Directive. Ecol. Indic. 2010, 10, 178–183. [Google Scholar] [CrossRef]
- Trégouboff, G.; Rose, M. Manuel de Planctonologie Médierranéenne: Tome II, Planches; CNRS: Paris, France, 1978. [Google Scholar]
- Hasle, G.R.; Syvertsen, E.E.; Steidinger, K.A.; Tangen, K.; Tomas, C.R. Identifying Marine Diatoms and Dinoflagellates; Elsevier: Amsterdam, The Netherlands, 1996. [Google Scholar]
- Rose, M. Copépodes Pélagiques. Faune de La France, 26; Le Chevalier: Paris, France, 1933. [Google Scholar]
- Boxshall, G.A.; Halsey, S.H. An Introduction to Copepod Diversity; Ray Society: London, UK, 2004. [Google Scholar]
- Harris, R.; Wiebe, P.; Lenz, J.; Skjoldal, H.-R.; Huntley, M. ICES Zooplankton Methodology Manual; Elsevier: Amsterdam, The Netherlands, 2000. [Google Scholar]
- Shannon, C.E.; Weaver, W. The Mathematical Theory of Communication; University of Illinois Press: Urbana, IL, USA, 1962. [Google Scholar]
- Krebs, C.J. Ecological Methodology. Addison; Welsey Educational Publishers, Inc.: Menlo Park, CA, USA, 1999. [Google Scholar]
- Pielou, E.C. The measurement of diversity in different types of biological collections. J. Theor. Biol. 1966, 13, 131–144. [Google Scholar] [CrossRef]
- Amri, N.; Rahmouni, F.; Chokri, M.A.; Rebai, T.; Badraoui, R. Histological and Biochemical Biomarkers Analysis Reveal Strong Toxicological Impacts of Pollution in Hybrid Sparrow (Passer domesticus× Passer hispaniolensis) in Southern Tunisia. Environ. Sci. Pollut. Res. 2017, 24, 17845–17852. [Google Scholar] [CrossRef]
- Rabaoui, L.; El Zrelli, R.; Balti, R.; Mansour, L.; Courjault-Radé, P.; Daghbouj, N.; Tlig-Zouari, S. Metal Bioaccumulation in Two Edible Cephalopods in the Gulf of Gabes, South-Eastern Tunisia: Environmental and Human Health Risk Assessment. Environ. Sci. Pollut. Res. 2017, 24, 1686–1699. [Google Scholar] [CrossRef] [PubMed]
- Annabi, A.; El Mouadeb, R.; Herrel, A. Distinctive Accumulation Patterns of Heavy Metals in Sardinella aurita (Clupeidae) and Mugil cephalus (Mugilidae) Tissues. Environ. Sci. Pollut. Res. 2018, 25, 2623–2629. [Google Scholar] [CrossRef] [PubMed]
- El Zrelli, R.; Rabaoui, L.; Alaya, M.B.; Daghbouj, N.; Castet, S.; Besson, P.; Michel, S.; Bejaoui, N.; Courjault-Radé, P. Seawater Quality Assessment and Identification of Pollution Sources along the Central Coastal Area of Gabes Gulf (SE Tunisia): Evidence of Industrial Impact and Implications for Marine Environment Protection. Mar. Pollut. Bull. 2018, 127, 445–452. [Google Scholar] [CrossRef] [PubMed]
- Naifar, I.; Pereira, F.; Zmemla, R.; Bouaziz, M.; Elleuch, B.; Garcia, D. Spatial Distribution and Contamination Assessment of Heavy Metals in Marine Sediments of the Southern Coast of Sfax, Gabes Gulf, Tunisia. Mar. Pollut. Bull. 2018, 131, 53–62. [Google Scholar] [CrossRef]
- Ghribi, R.; Correia, A.T.; Elleuch, B.; Nunes, B. Testing the Impact of Contaminated Sediments from the Southeast Marine Coast of Tunisia on Biota: A Multibiomarker Approach Using the Flatfish Solea senegalensis. Environ. Sci. Pollut. Res. 2019, 26, 29704–29721. [Google Scholar] [CrossRef]
- Amorri, J.; Geffroy-Rodier, C.; Boufahja, F.; Mahmoudi, E.; Aïssa, P.; Ksibi, M.; Amblès, A. Organic Matter Compounds as Source Indicators and Tracers for Marine Pollution in a Western Mediterranean Coastal Zone. Environ. Sci. Pollut. Res. 2011, 18, 1606. [Google Scholar] [CrossRef]
- El Kateb, A.; Stalder, C.; Rüggeberg, A.; Neururer, C.; Spangenberg, J.E.; Spezzaferri, S. Impact of Industrial Phosphate Waste Discharge on the Marine Environment in the Gulf of Gabes (Tunisia). PLoS ONE 2018, 13, e0197731. [Google Scholar] [CrossRef] [Green Version]
- Fourati, R.; Tedetti, M.; Guigue, C.; Goutx, M.; Zaghden, H.; Sayadi, S.; Elleuch, B. Natural and Anthropogenic Particulate-Bound Aliphatic and Polycyclic Aromatic Hydrocarbons in Surface Waters of the Gulf of Gabès (Tunisia, Southern Mediterranean Sea). Environ. Sci. Pollut. Res. 2018, 25, 2476–2494. [Google Scholar] [CrossRef]
- Simboura, N.; Pavlidou, A.; Bald, J.; Tsapakis, M.; Pagou, K.; Zeri, C.; Androni, A.; Panayotidis, P. Response of Ecological Indices to Nutrient and Chemical Contaminant Stress Factors in Eastern Mediterranean Coastal Waters. Ecol. Indic. 2016, 70, 89–105. [Google Scholar] [CrossRef]
- Ben Brahim, M.; Hamza, A.; Hannachi, I.; Rebai, A.; Jarboui, O.; Bouain, A.; Aleya, L. Variability in the Structure of Epiphytic Assemblages of Posidonia Oceanica in Relation to Human Interferences in the Gulf of Gabes, Tunisia. Mar. Environ. Res. 2010, 70, 411–421. [Google Scholar] [CrossRef] [PubMed] [Green Version]
- Sahraoui, I.; Grami, B.; Bates, S.S.; Bouchouicha, D.; Chikhaoui, M.A.; Mabrouk, H.H.; Hlaili, A.S. Response of Potentially Toxic Pseudo-Nitzschia (Bacillariophyceae) Populations and Domoic Acid to Environmental Conditions in a Eutrophied SW Mediterranean Coastal Lagoon (Tunisia). Estuar. Coast. Shelf Sci. 2012, 102, 95–104. [Google Scholar] [CrossRef]
- Ignatiades, L.; Karydis, M.; Vounatsou, P. A Possible Method for Evaluating Oligotrophy and Eutrophication Based on Nutrient Concentration Scales. Mar. Pollut. Bull. 1992, 24, 238–243. [Google Scholar] [CrossRef]
- Corsini, G.; Grasso, R.; Cipollini, P. Regional Bio-Optical Algorithms for the Alboran Sea from a Reflectance Model and in Situ Data. Geophys. Res. Lett. 2002, 29, 29-1–29-4. [Google Scholar] [CrossRef]
- Harmelin-Vivien, M.; Le Diréach, L.; Bayle-Sempere, J.; Charbonnel, E.; García-Charton, J.A.; Ody, D.; Pérez-Ruzafa, A.; Reñones, O.; Sánchez-Jerez, P.; Valle, C. Gradients of Abundance and Biomass across Reserve Boundaries in Six Mediterranean Marine Protected Areas: Evidence of Fish Spillover? Biol. Conserv. 2008, 141, 1829–1839. [Google Scholar] [CrossRef]
- Bel Hassen, M.; Drira, Z.; Hamza, A.; Ayadi, H.; Akrout, F.; Issaoui, H. Summer Phytoplankton Pigments and Community Composition Related to Water Mass Properties in the Gulf of Gabes. Estuar. Coast. Shelf Sci. 2008, 77, 645–656. [Google Scholar] [CrossRef]
- Rekik, A.; Ben Salem, Z.; Ayadi, H.; Elloumi, J. Spring Phytoplankton Variability along a South Coast of Sfax at the Water-Sediment Interface (Tunisia, Eastern Mediterranean Sea). J. Coast. Life Med. 2016, 4, 121–127. [Google Scholar] [CrossRef]
- DeManche, J.M.; Curl, H.C.; Lundy, D.W.; Donaghay, P.L. The Rapid Response of the Marine Diatom Skeletonema Costatum to Changes in External and Internal Nutrient Concentration. Mar. Biol. 1979, 53, 323–333. [Google Scholar] [CrossRef]
- Drira, Z.; Hamza, A.; Belhassen, M.; Ayadi, H.; Bouaïn, A.; Aleya, L. Dynamics of Dinoflagellates and Environmental Factors during the Summer in the Gulf of Gabes (Tunisia, Eastern Mediterranean Sea). Sci. Mar. 2008, 72, 59–71. [Google Scholar]
- Ninčević-Gladan, Ž.; Bužančić, M.; Kušpilić, G.; Grbec, B.; Matijević, S.; Skejić, S.; Marasović, I.; Morović, M. The Response of Phytoplankton Community to Anthropogenic Pressure Gradient in the Coastal Waters of the Eastern Adriatic Sea. Ecol. Indic. 2015, 56, 106–115. [Google Scholar] [CrossRef] [Green Version]
- Collos, Y.; Vaquer, A.; Bibent, B.; Slawyk, G.; Garcia, N.; Souchu, P. Variability in Nitrate Uptake Kinetics of Phytoplankton Communities in a Mediterranean Coastal Lagoon. Estuar. Coast. Shelf Sci. 1997, 44, 369–375. [Google Scholar] [CrossRef] [Green Version]
- Lagus, A.; Suomela, J.; Weithoff, G.; Heikkilä, K.; Helminen, H.; Sipura, J. Species-Specific Differences in Phytoplankton Responses to N and P Enrichments and the N: P Ratio in the Archipelago Sea, Northern Baltic Sea. J. Plankton Res. 2004, 26, 779–798. [Google Scholar] [CrossRef] [Green Version]
- Livingston, R.J. Eutrophication Processes in Coastal Systems: Origin and Succession of Plankton Blooms and Effects on Secondary Production in Gulf Coast Estuaries; CRC Press: Boca Raton, FL, USA, 2000. [Google Scholar]
- Gouda, R.; Panigrahy, R.C. Ecology of Phytoplankton in Coastal Waters off Gopalpur, East Coast of India. Indian J. Mar. Sci. 1996, 25, 81–84. [Google Scholar]
- Rajasegar, M.; Srinivasan, M.; Rajaram, R. Phytoplankton Diversity Associated with the Shrimp Farm Development in Vellar Estuary, South India. Seaweed Res. Utiln 2000, 22, 125–213. [Google Scholar]
- Saravanakumar, A.; Rajkumar, M.; Serebiah, J.S.; Thivakaran, G.A. Seasonal Variations in Physico-Chemical Characteristics of Water, Sediment and Soil Texture in Arid Zone Mangroves of Kachchh-Gujarat. J. Environ. Biol. 2008, 29, 725–732. [Google Scholar]
- Perumal, N.V.; Rajkumar, M.; Perumal, P.; Rajasekar, K.T. Seasonal Variations of Plankton Diversity in the Kaduviyar Estuary, Nagapattinam, Southeast Coast of India. J. Environ. Biol. 2009, 30, 1035–1046. [Google Scholar]
- Ben Ltaief, T.; Drira, Z.; Hannachi, I.; Hassen, M.B.; Hamza, A.; Pagano, M.; Ayadi, H. What Are the Factors Leading to the Success of Small Planktonic Copepods in the Gulf of Gabes, Tunisia? J. Mar. Biol. Assoc. UK 2015, 95, 747. [Google Scholar] [CrossRef]
- Gubanova, A.D.; Prusova, I.Y.; Niermann, U.; Shadrin, N.V.; Polikarpov, I.G. Dramatic change in the Copepod Community in Sevastopol Bay (Black Sea) during two decades (1976–1996). Senckenberg. Marit. 2001, 31, 17–27. [Google Scholar] [CrossRef]
- Volkmann-Rocco, B. The Effect of Delayed Fertilization in Some Species of the Genus Tisbe (Copepoda, Harpacticoida). Biol. Bull. 1972, 142, 520–529. [Google Scholar] [CrossRef]
- Gusmão, L.F.M.; McKinnon, A.D.; Richardson, A.J. No Evidence of Predation Causing Female-Biased Sex Ratios in Marine Pelagic Copepods. Mar. Ecol. Prog. Ser. 2013, 482, 279–298. [Google Scholar] [CrossRef] [Green Version]


| T1 | T2 | T3 | T4 | T5 | F-Values (d.f) | p-Values | |
|---|---|---|---|---|---|---|---|
| Physical parameters | |||||||
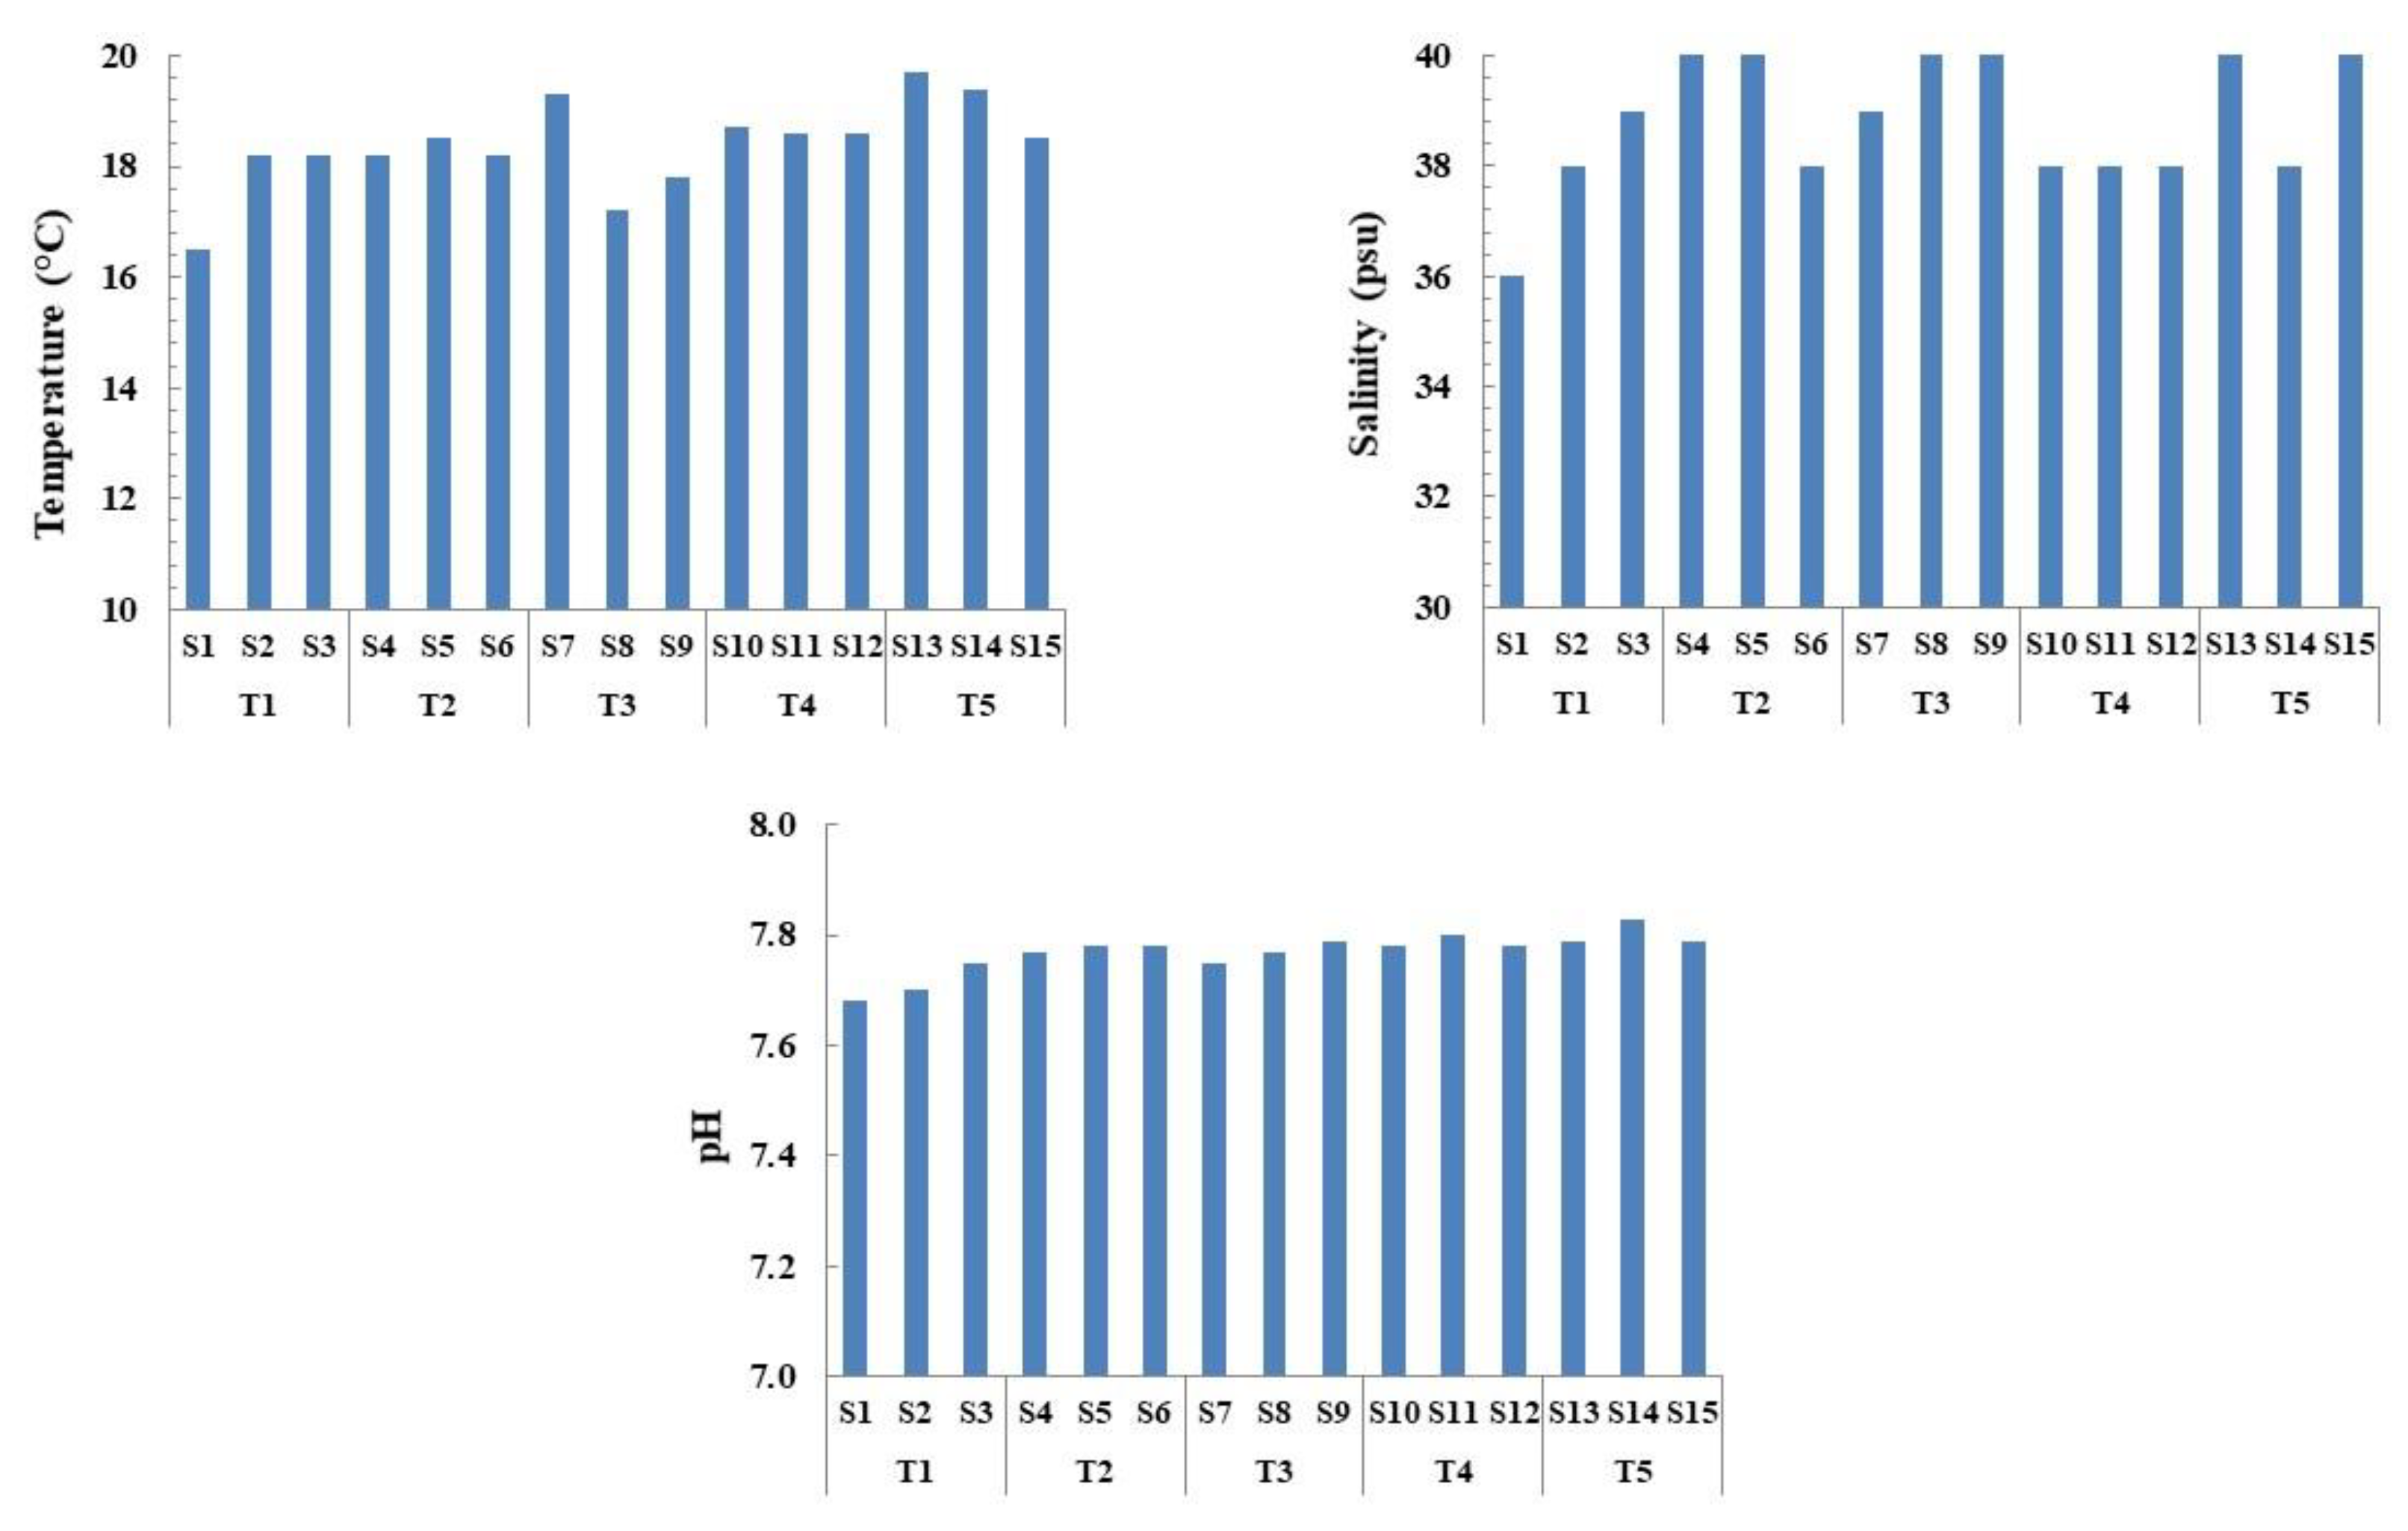
| Temperature | 17.63 (±0.98) a | 18.30 (±0.17) a | 18.10 (±1.08) a | 18.63 (±0.06) a | 19.20 (±0.62) a | 2.022(14) | 0.167 |
| Salinity | 37.67 (±1.53) a | 39.33 (±1.15) a | 39.67 (±0.58) a | 38.00 (±0.00) a | 39.33 (±1.15) a | 2.281(14) | 0.132 |
| pH | 7.71 (±0.04) a | 7.78 (±0.01) b | 7.77 (±0.02) ab | 7.79 (±0.01) b | 7.80 (±0.02) b | 7.861(14) | 0.004 ** |
| Chemical parameters | |||||||
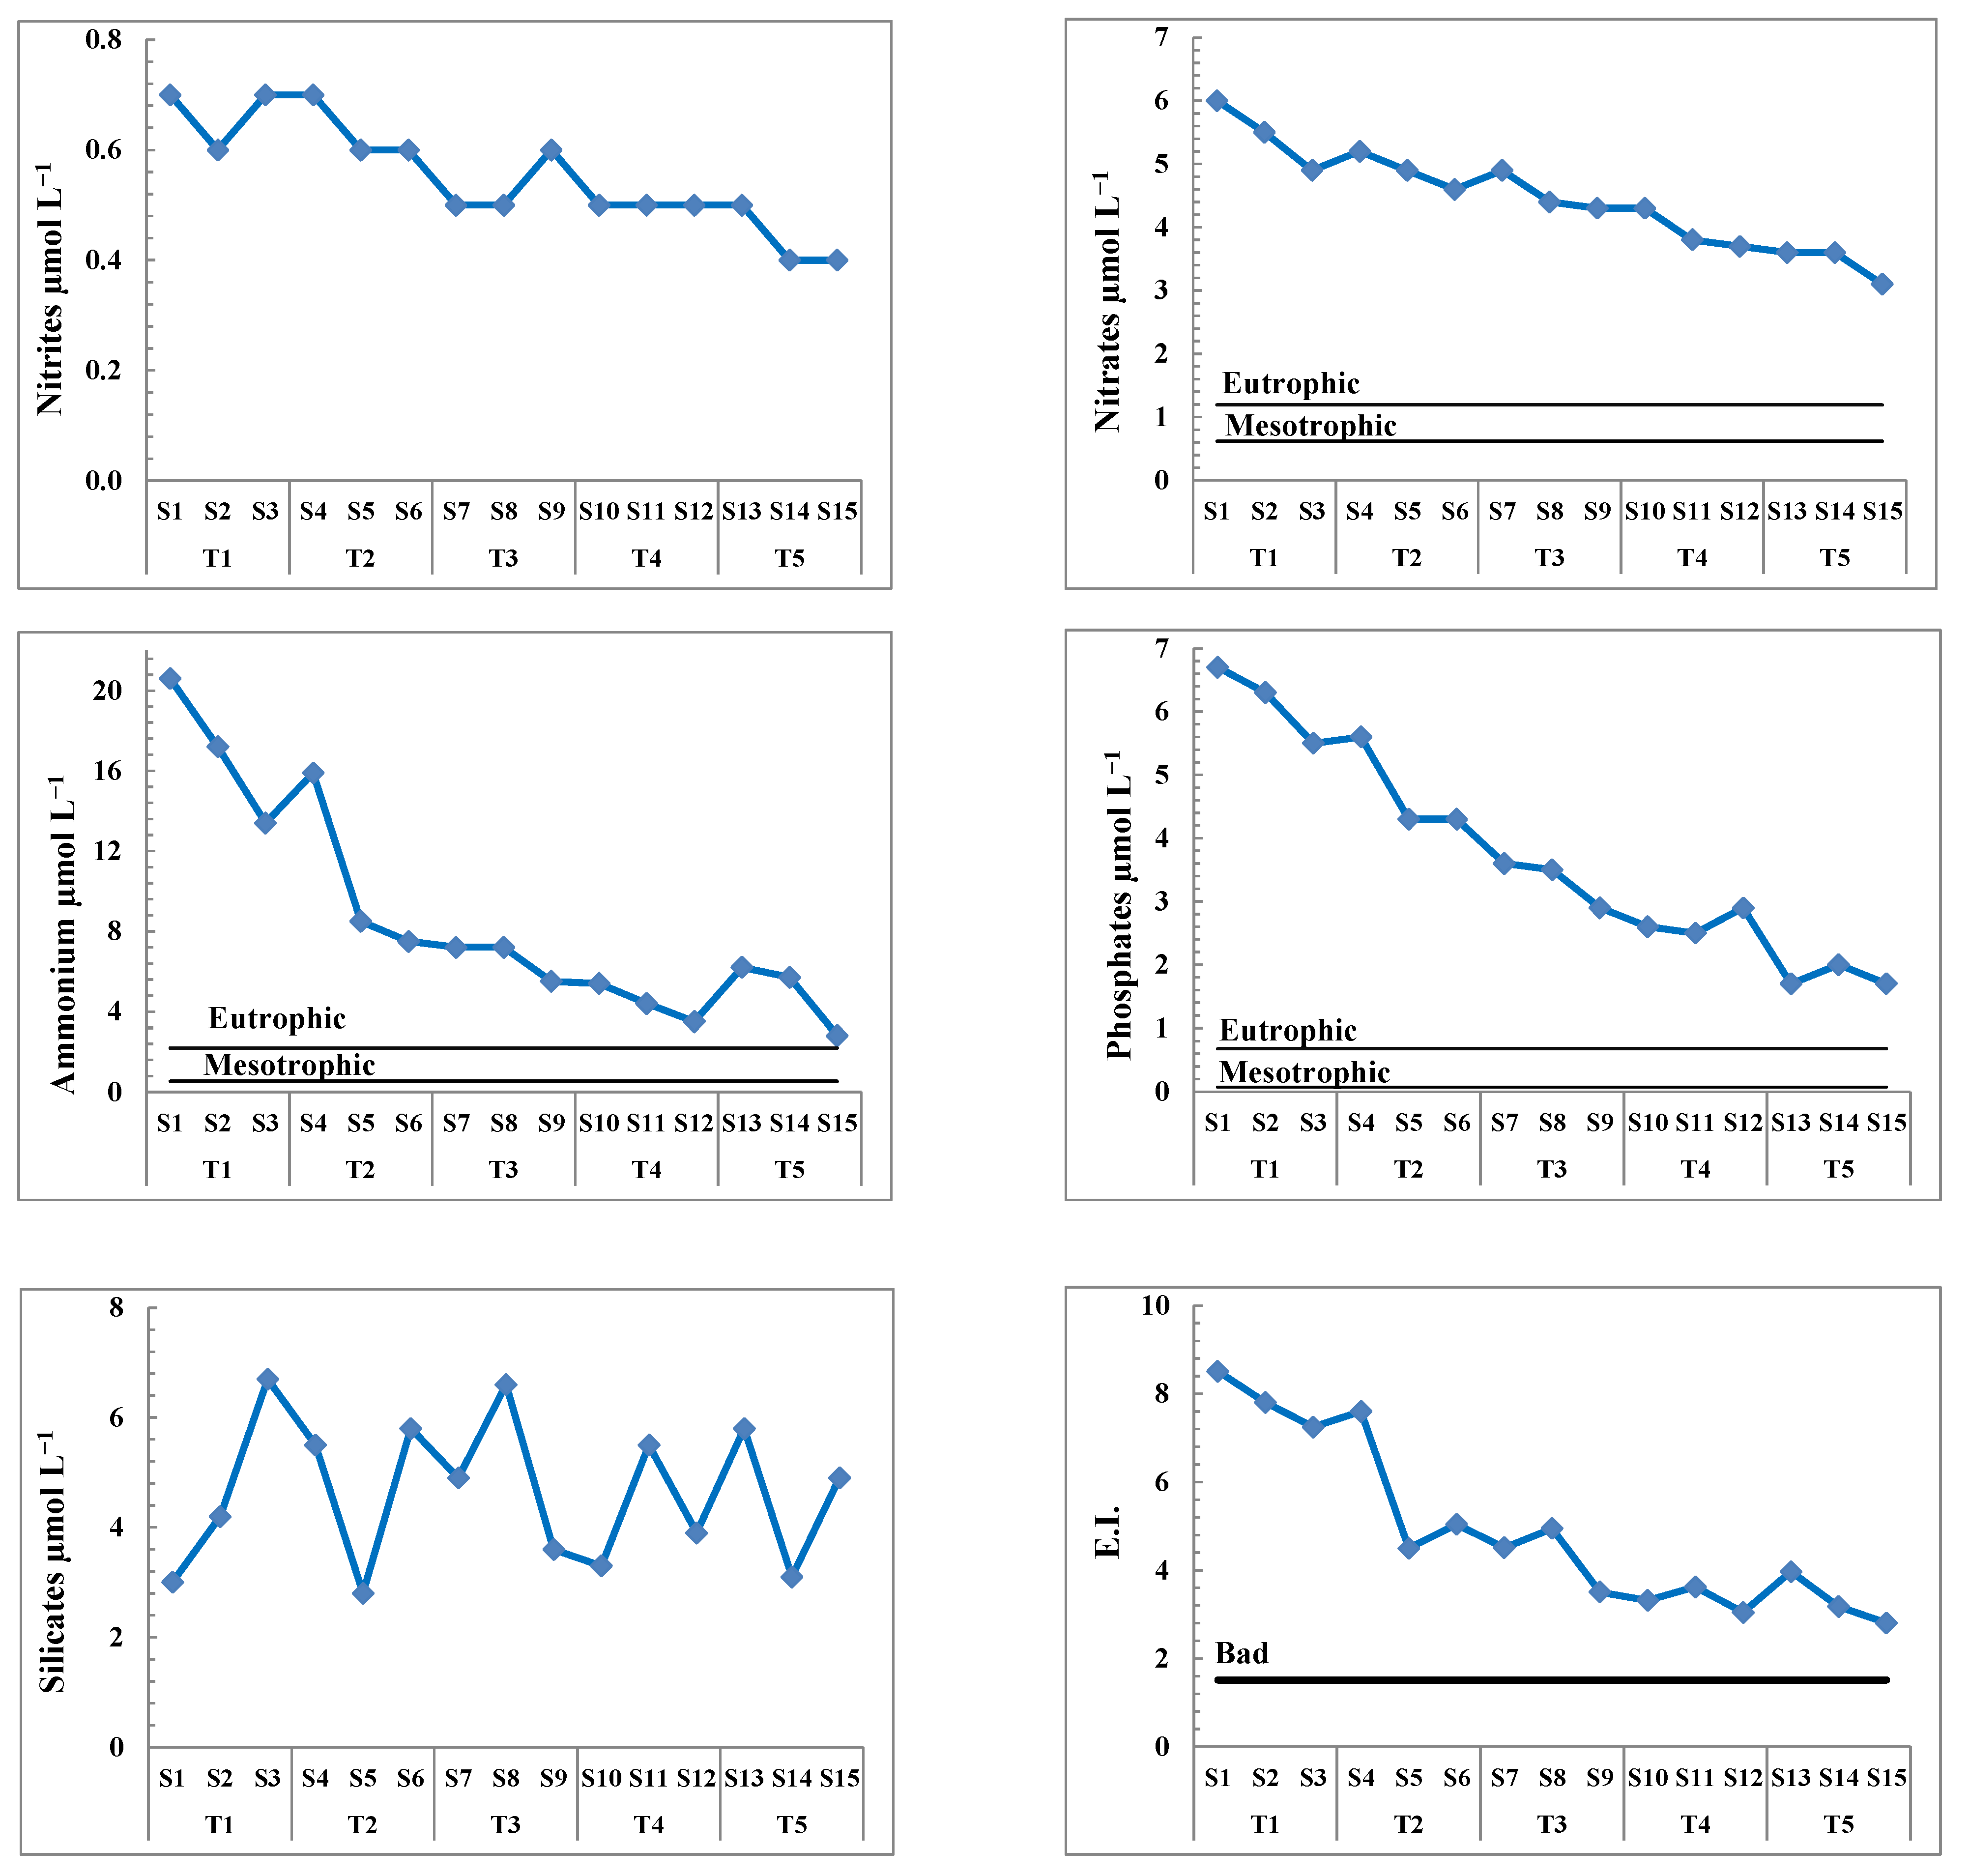
| Nitrites | 0.67 (±0.06) a | 0.63 (±0.06) ab | 0.53 (±0.06) abc | 0.50 (±0.00) bc | 0.43 (±0.06) c | 10.375(14) | 0.001 ** |
| Nitrates | 5.47 (±0.55) a | 4.90 (±0.30) ab | 4.53 (±0.32) ab | 3.93 (±0.32) bc | 3.43 (±0.29) c | 13.959(14) | 0.000 *** |
| Ammonium | 17.07 (±3.60) a | 10.63 (±4.59) ab | 6.63 (±0.98) b | 4.43 (±0.95) b | 4.90 (±1.84) b | 0.001 ** | |
| Phosphates | 6.17 (±0.61) a | 4.73 (±0.75) b | 3.33 (±0.38) c | 2.67 (±0.21) cd | 1.80 (±0.17) d | 38.876(14) | <0.0001 *** |
| Silicates | 4.63 (±1.89) a | 4.70 (±1.65) a | 5.03 (±1.50) a | 4.23 (±1.14) a | 4.60 (±1.37) a | 0.104(14) | 0.979 |
| E.I. | 7.85 (±0.63) ab | 5.71 (±1.66) ab | 4.32 (±0.74) b | 3.33 (±0.29) b | 3.32 (±0.60) b | 13.333(14) | 0.001 ** |
| Biological parameters | |||||||
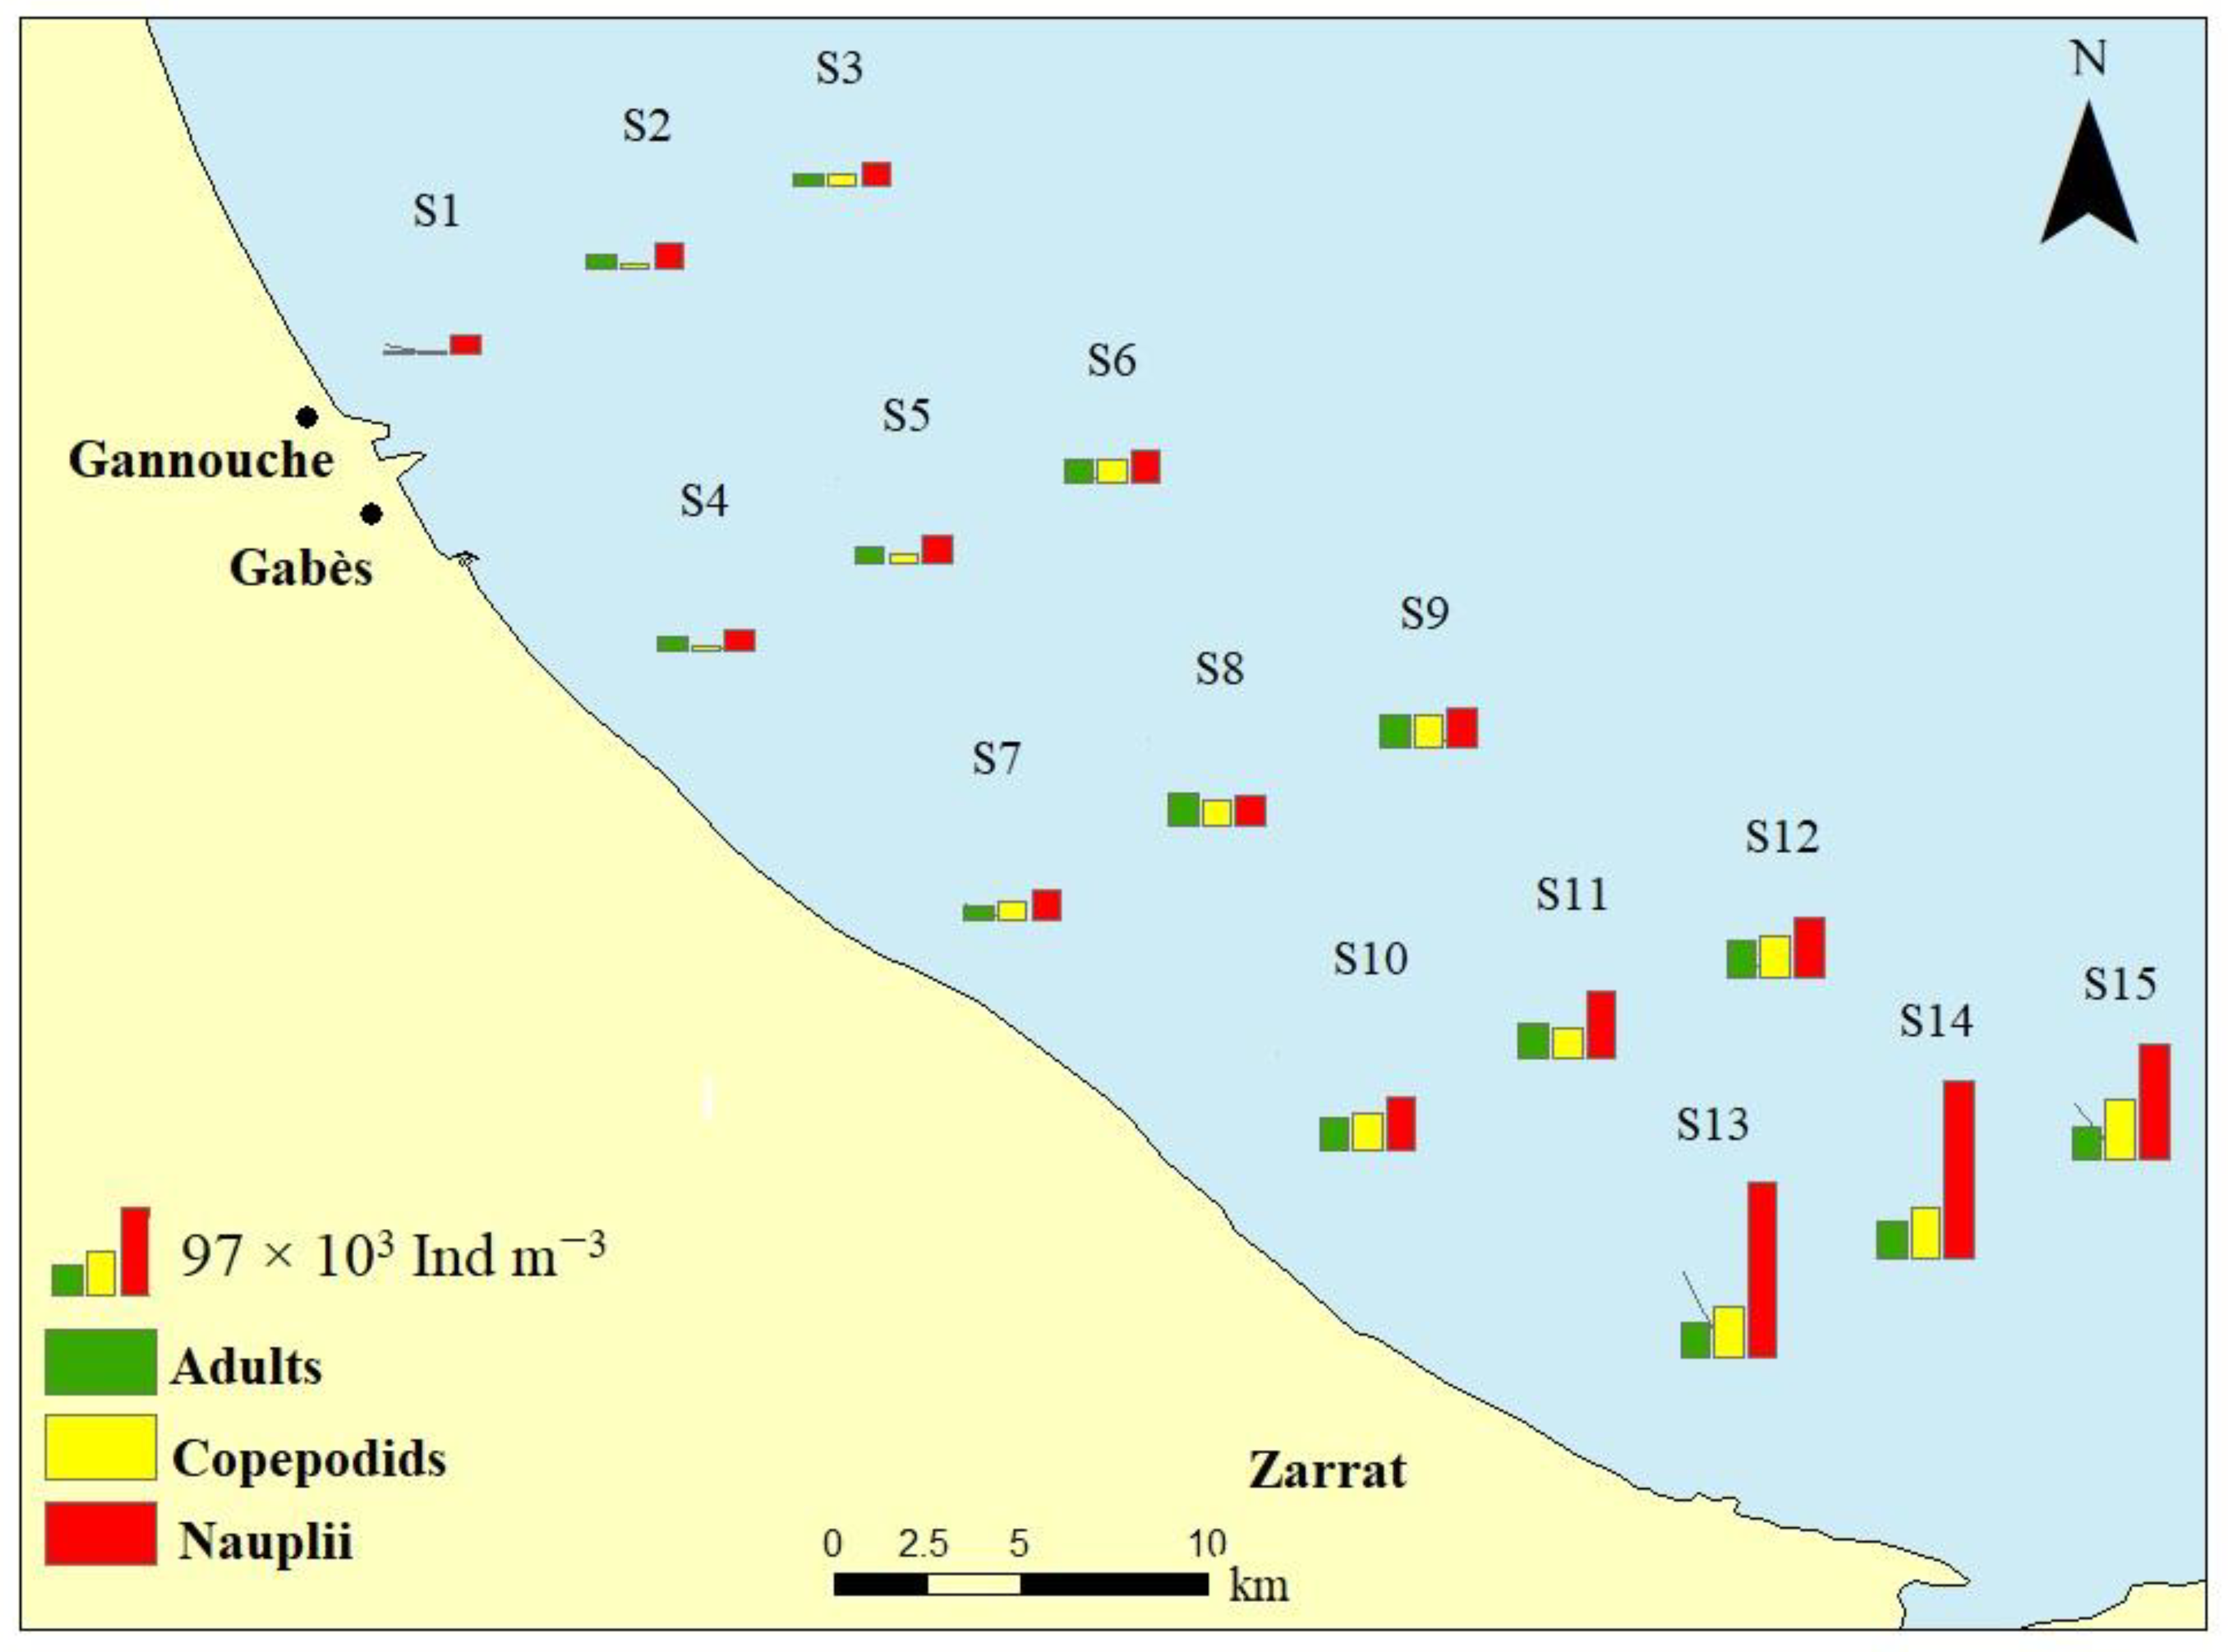
| Total-copepods | 40.22 (±9.43) a | 59.17 (±7.82) ab | 95.56 (±15.27) bc | 144.75 (±8.07) c | 265.82 (±32.81) d | 79.984(14) | <0.0001 *** |
| Adults | 11.32 (±6.75) a | 15.26 (±1.16) a | 30.90 (±6.43) b | 38.05 (±2.43) b | 37.63 (±1.25) b | 24.808(14) | <0.0001 *** |
| Copepodids | 4.84 (±1.12) a | 14.31 (±5.87) ab | 28.05 (±4.83) bc | 40.12 (±7.30) c | 57.67 (±6.06) d | 43.923(14) | <0.0001 *** |
| Nauplii | 24.06 (±2.80) a | 29.60 (±3.43) a | 36.61 (±5.60) a | 66.58 (±6.77) a | 170.52 (±37.63) b | 36.866(14) | <0.0001 *** |
| H’ copepoda | 2.15 (±0.42) a | 2.55 (±0.05) ab | 2.63 (±0.18) ab | 2.74 (±0.12) ab | 2.91 (±0.16) b | 4.838(14) | 0.020 * |
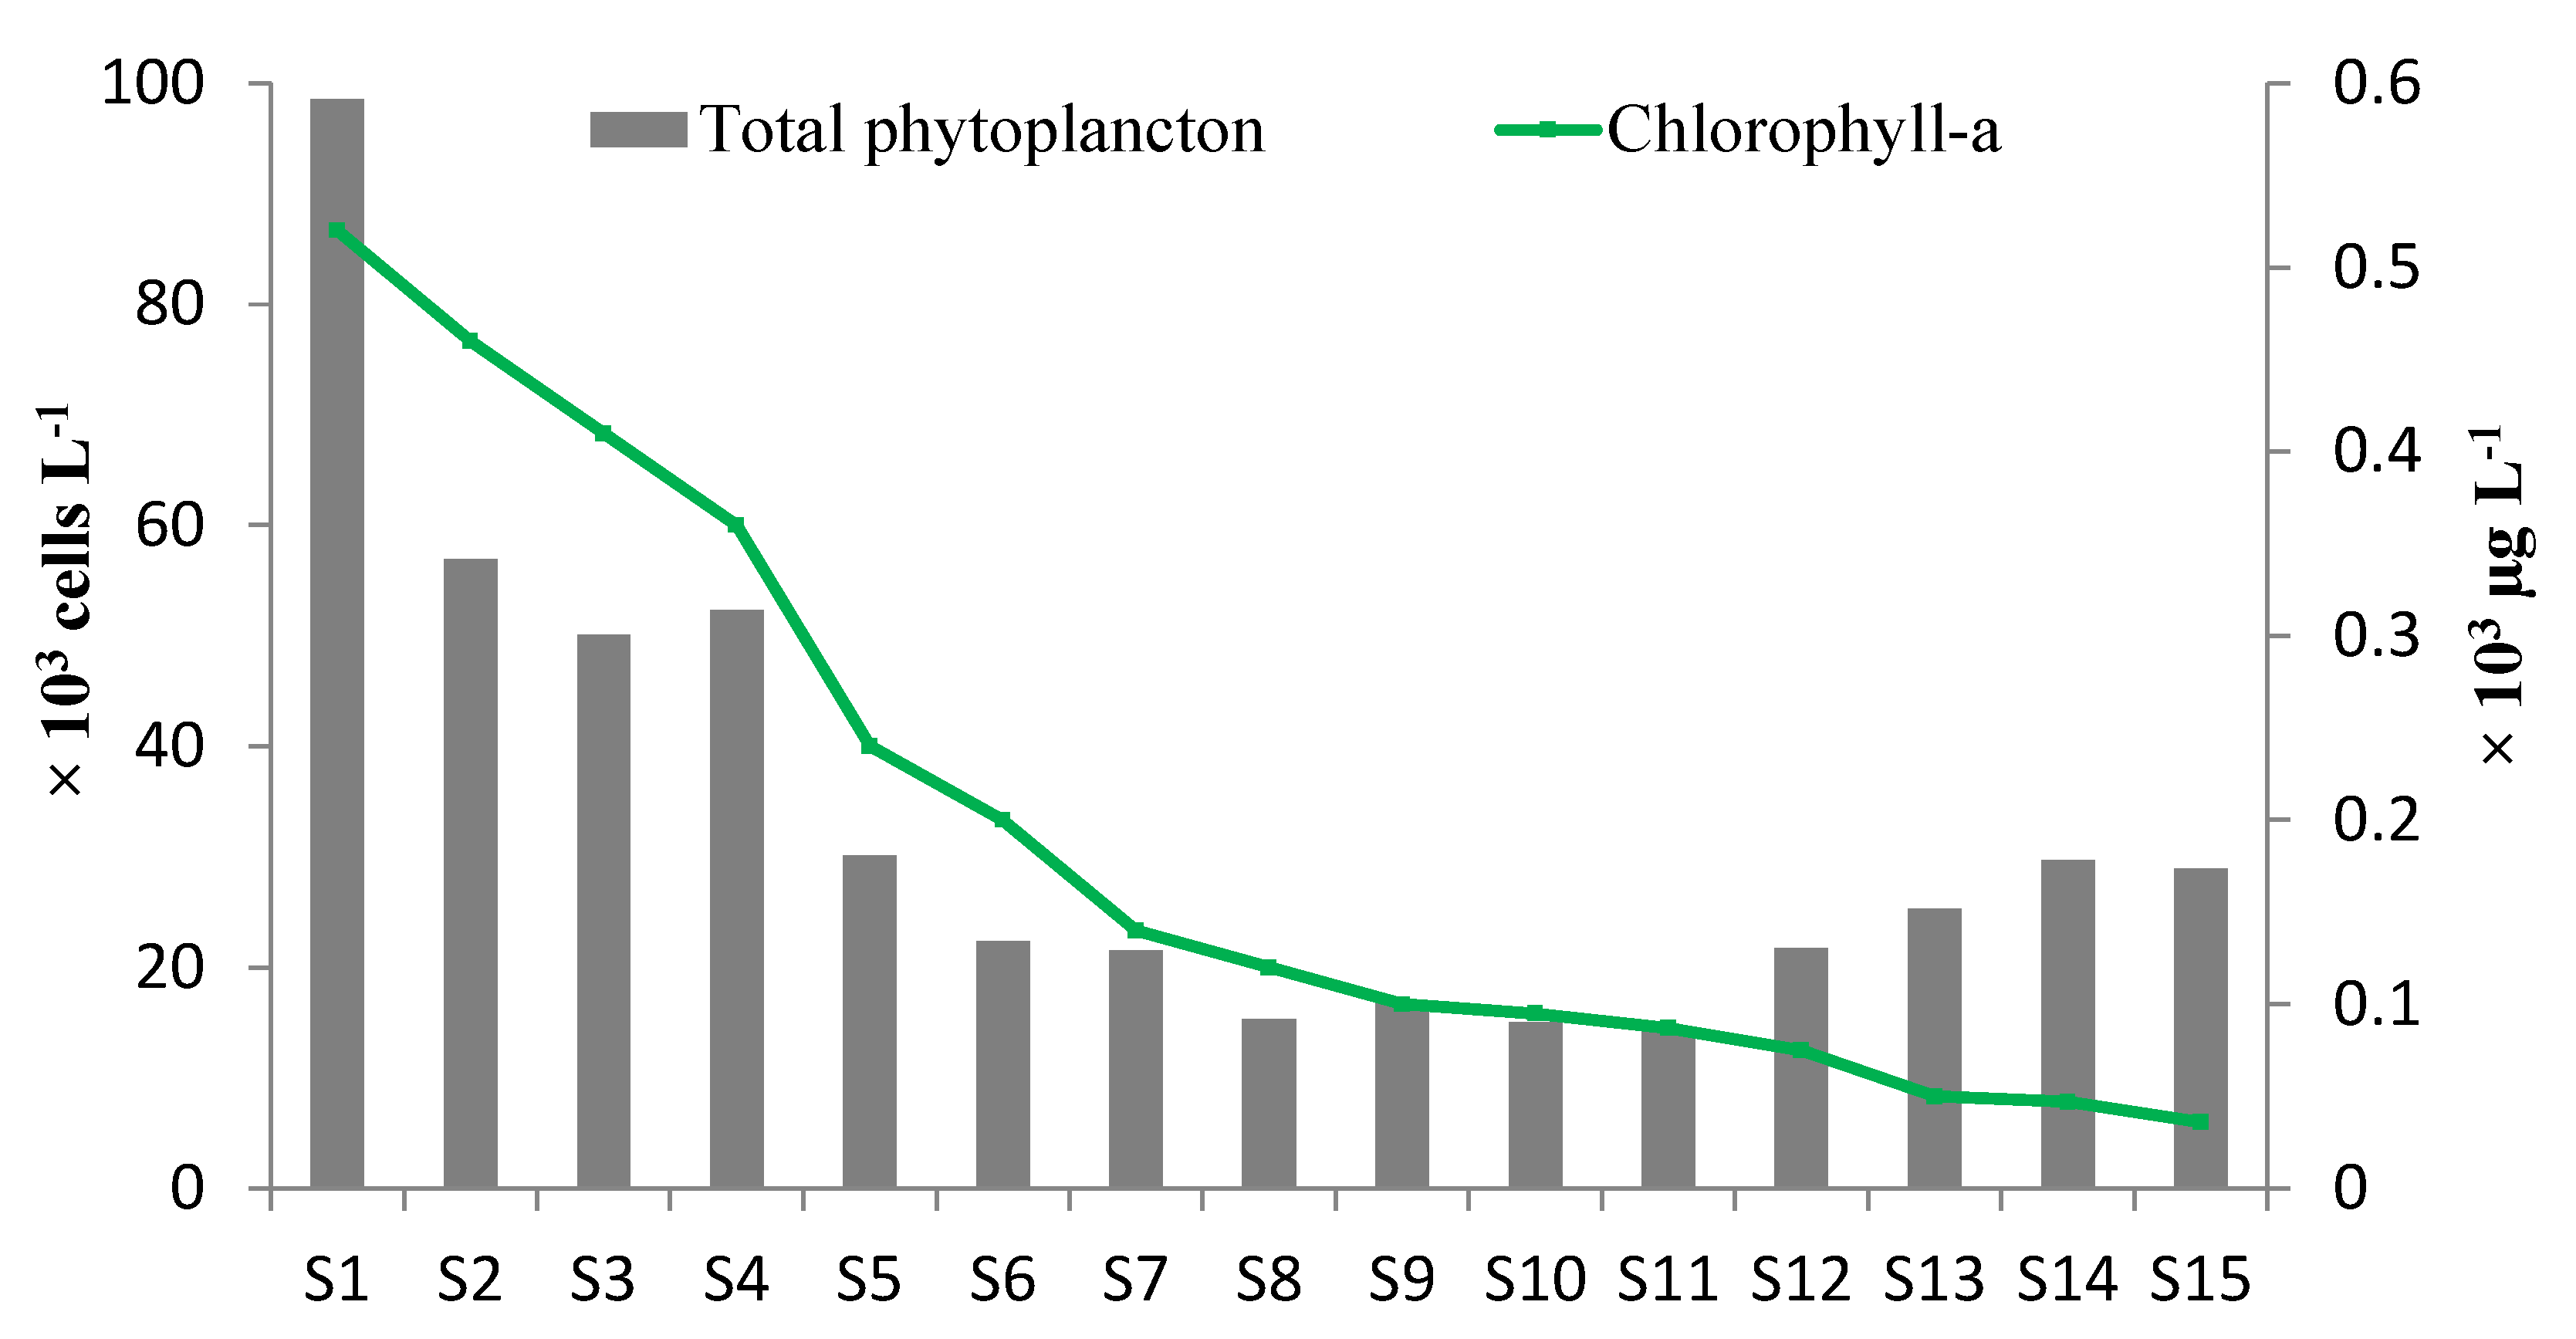
| Total-Phytoplankton | 117.67 (±41.70) a | 58.63 (±26.80) ab | 27.17 (±6.44) b | 23.60 (±6.15) b | 36.60 (±3.91) b | 8.839(14) | 0.003 ** |
| Bacillariophyta | 48.30 (±17.53) a | 24.50 (±9.73) ab | 14.23 (±2.65) b | 14.37 (±4.46) b | 23.87 (±2.36) ab | 6.677(14) | 0.007 ** |
| Dinophyta | 5.33 (±2.29) a | 2.00 ± (0.61) ab | 1.77 (±0.15) b | 1.57 (±0.55) b | 3.57 (±0.81) ab | 5.824(14) | 0.011 * |
| Euglenophyceae | 11.87 (±7.08) a | 4.23 (±1.91) ab | 1.47 (±0.42) b | 1.13 (±0.25) b | 0.53 (±0.35) b | 6.130(14) | 0.009 ** |
| Cyanobacteria | 3.00 (±0.52) a | 4.20 (±3.82) a | 0.40 (±0.69) a | 0.00 (0.00) a | 0.00 (0.00) a | 3.735(14) | 0.041 * |
| H’ Phytoplankton | 2.87 (±0.10) a | 2.92 (±0.19) a | 3.34 (±0.30) ab | 3.52 (±0.23) b | 3.24 (±0.11) ab | 5.816(14) | 0.011 * |
| Class | Order | Species |
|---|---|---|
| Bacillariophyta | Centric | Coscinodiscus sp. |
| Skeletonema costatum | ||
| Thalassiosira sp. | ||
| Rhizosolenia styliformis | ||
| Leptocylindrus sp. | ||
| Hemiaulus sp. | ||
| Chaetoceros costatus | ||
| Pennates | Grammatophora sp. | |
| Licmophora sp. | ||
| Thalassionema nitzchoides | ||
| Rhabdonema sp. | ||
| Navicula sp. | ||
| Pinnularia sp. | ||
| Pleurosigma simonsenii | ||
| Amphiprora sp. | ||
| Coccneis sp. | ||
| Nitzchia sp. | ||
| Pseudonitzchia sp.* | ||
| Dinophyta | Gymnodiniales | Gymnodinium sp |
| Dinophysiales | Amphidinium carterae * | |
| Dinophysis caudata * | ||
| Prorocentrales | Prorocentrum compressum | |
| Prorocentrum gracile | ||
| Prorocentrum lima * | ||
| Prorocentrum micans | ||
| Prorocentrum minimum * | ||
| Prorocentrum triestinum | ||
| Peridiniales | Neocerartium candelabrum | |
| Neocerartium furca | ||
| Neocerartium lineatum | ||
| Neocerartium tripos | ||
| Neocerartium setaceum | ||
| Ostreopsis ovata | ||
| Scrippsiella trochoidae | ||
| Peredinium sp. | ||
| Protoperedinium minatum | ||
| Protoperedinium depressum | ||
| Protoperedinium ovum | ||
| Euglenophyceae | Euglenales | Euglena acusformis |
| Cyanobacteria | Nostocales | Anabena flosaquae |
| Hormogonales | Tichodesmium erythraeum | |
| Dictyochophyceae | Dictyochales | Dictyocha fibula |
| Order | Family | Species |
|---|---|---|
| Calanoida | Acartiidae | Acartia clausi |
| Acartia italica | ||
| Acartia longiremis | ||
| Acartia discaudata | ||
| Acartia danae | ||
| Acartia bifilosa | ||
| Paracartia latisetosa | ||
| Centropagidae | Centropages typicus | |
| Centropages kroyeri | ||
| Centropages chierchiae | ||
| Temoridae | Temora longicornis | |
| Temora stylifera | ||
| Paracalanidae | Paracalanus parvus | |
| Paracalanus aculeatus | ||
| Cyclopoida | Oithonidae | Oithona nana |
| Oithona similis | ||
| Oithona plumifera | ||
| Oithona helgolandica | ||
| Corycaeidae | Corycaeus ovalis | |
| Corycaeus specious | ||
| Corycaeus lotus | ||
| Oncaeidae | Oncaea conifera | |
| Harpacticoida | Euterpinidae | Euterpina acutifrons |
| Clytemnestridae | Clytemnestra scutellata |
Publisher’s Note: MDPI stays neutral with regard to jurisdictional claims in published maps and institutional affiliations. |
© 2022 by the authors. Licensee MDPI, Basel, Switzerland. This article is an open access article distributed under the terms and conditions of the Creative Commons Attribution (CC BY) license (https://creativecommons.org/licenses/by/4.0/).
Share and Cite
Annabi-Trabelsi, N.; Guermazi, W.; Leignel, V.; Al-Enezi, Y.; Karam, Q.; Ali, M.; Ayadi, H.; Belmonte, G. Effects of Eutrophication on Plankton Abundance and Composition in the Gulf of Gabès (Mediterranean Sea, Tunisia). Water 2022, 14, 2230. https://doi.org/10.3390/w14142230
Annabi-Trabelsi N, Guermazi W, Leignel V, Al-Enezi Y, Karam Q, Ali M, Ayadi H, Belmonte G. Effects of Eutrophication on Plankton Abundance and Composition in the Gulf of Gabès (Mediterranean Sea, Tunisia). Water. 2022; 14(14):2230. https://doi.org/10.3390/w14142230
Chicago/Turabian StyleAnnabi-Trabelsi, Neila, Wassim Guermazi, Vincent Leignel, Yousef Al-Enezi, Qusaie Karam, Mohammad Ali, Habib Ayadi, and Genuario Belmonte. 2022. "Effects of Eutrophication on Plankton Abundance and Composition in the Gulf of Gabès (Mediterranean Sea, Tunisia)" Water 14, no. 14: 2230. https://doi.org/10.3390/w14142230