1. Introduction
Nuclear industries use several quantities of nitric acid as chemical reagent to dissolve metals and oxides (Uranium Mining, UO
2 production and PUREX pure reprocessing) [
1,
2] and chemical compounds for complex radioactive elements [
3]. Consequently, the process generates effluents with high load of nitrate, COD and radioactive elements that have to be treated following the requirement of zero-liquid discharge (ZLD) [
4].
On the one hand, physicochemical methods such as sedimentation and membrane separation [
5] have been shown to be ineffective in completely removing nitrates [
6]. On the other hand, electrocoagulation [
7], heterogeneous catalysis, electrochemical [
8] and bioelectrochemical [
9] methods were sufficiently efficient at laboratory scales. However, applying them in a complex medium as blended real nuclear wastewater (BRNW) seems difficult.
There are a wide number of sustainable biological processes: wetlands, lagoons, low anaerobic as UASBs or Anaerobic MBR [
10], together with alternative methods such as Anammox [
11,
12,
13] autotrophic denitrification [
14] as CANON process [
15]. These technologies have attracted a great deal of attention due to the ability to efficiently remove nitrate [
16] with low energy consumption. However, the performance of these new technologies presents limitations to be applied on BNRW due to the presence of a diversity of pollutants and radioactive elements.
Denitrification proceeds through a stepwise reduction in intermediate forms: NO
3− → NO
2−→ NO + N
2O → N
2. The process is an oxide/reduction catalysis; therefore, electrons are transferred from organic carbon compounds to nitrogen oxide reductases, including nitrate reductase (NAR), nitrite reductase (NIR), nitric oxide reductase (NOR) and nitrous oxide reductase (N
2O), to reduce the corresponding nitrogen oxides forms. Nevertheless, N
2O gas could be accumulated and emitted into the atmosphere due to incomplete denitrification [
17].
It has been proved that the production of N
2O gas is caused by low levels of dissolved oxygen (DO), increasing nitrite concentrations that is a metabolic inhibitor [
18,
19]. However, the inhibition of functional enzymes has been frequently observed in the environment, with different physiological and metabolic characteristics [
20]. There are different electron donors that favor the development of different genera of bacteria, which have
NirK o
NirS genes [
21,
22,
23].
Under equilibrium conditions, the modified-Nernst equation has been widely used to describe the relationship between the oxidation–reduction potential (ORP) and the concentrations of reduced and oxidized chemical species [
24,
25]. Denitrification is influenced by electrons extracted from carbon–hydrogen bonds and transferred to an electron transport chain. In a synthetic medium with methanol (MeOH) as a donor, the reactions are as follows.
The denitrification reaction can be monitored by pH and ORP parameters, correlated with the consumption of N-NO
3− [
26].
Kinetic Nitrate removal (k) is generally quantified by using a single first-order rate coefficient, which simplifies all relevant factors. The advantage of using constant k is that it provides an approximation of the overall nitrogen removal capacity of a system [
27]. The disadvantage is that k cannot be used to compare removal rates because it depends on the media’s physical and biochemical characteristics [
28]. An alternative approach for quantifying nitrate removal is modeled by Monod [
29], obtaining the following kinetic constants: maximum velocity (Vmax) and substrate affinity constant (K
COD).
There are many considerations to take into account when comparing denitrification rates. It is difficult to quantify factors that affect nitrate removal rates. Largely due to the multitude and complexity that each individual factor (physical and biochemical) has in the general nitrogen removal process [
23,
30]. Regarding the optimal conditions to promote denitrification, it has been observed that biofilm has advantages over planktonic cells, one of the most important being resistance to toxicity and biomass separation using carriers in different types of reactors [
10,
31].
The purposes of this were to remove nitrate, uranium and COD from nuclear wastewater to recycle the water. The process was carried out with a mixture of current from nuclear process and domestical wastewater mixture. The process was controlled by ORP relative to the physicochemical parameter and a Monod model, comparing the values from empirical and simulated data from of denitrification process to adapt, finetune, control and model the denitrification process in a real nuclear wastewater effluent (BRNW). The study includes the determination of kinetic constants V max and KCOD that occur in the Monod equation under ORP-controlled conditions and the determination of NosZ gene expression to verify N2O emissions.
2. Materials and Methods
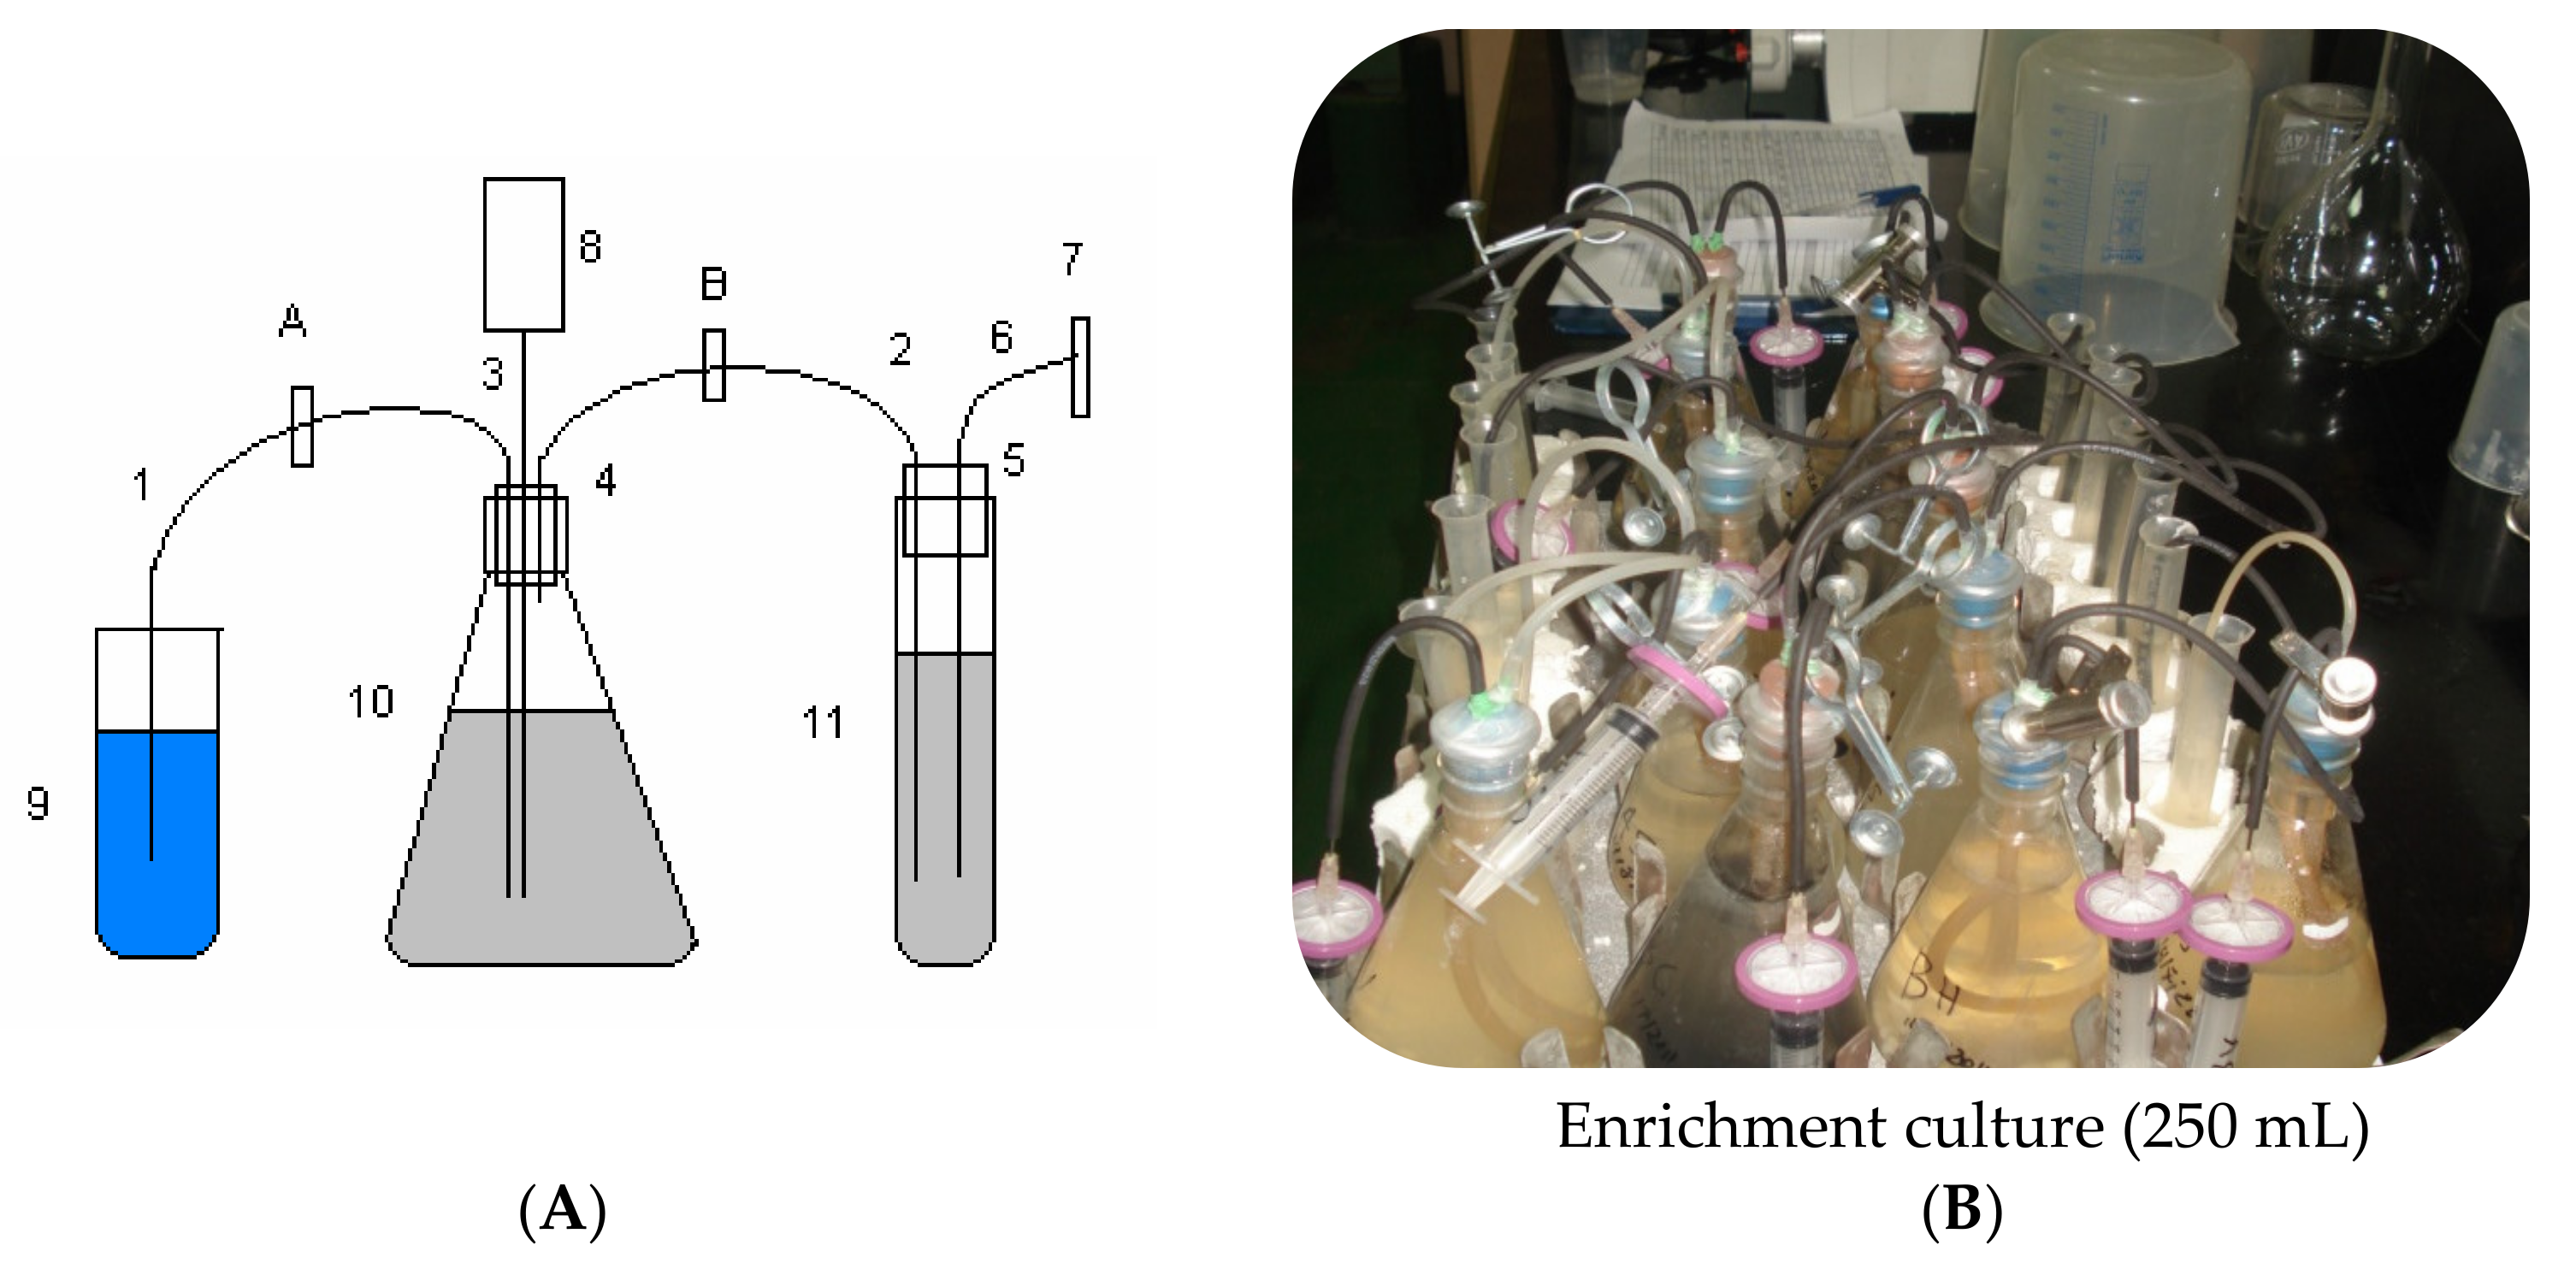
2.1. The Enrichment and Culture Media
The composition of the synthetic nuclear waste water was as follows: KNO
3 10 g, K
2PO4 0.5 g, MgSO
4 0.2 g (per liter), and CH
3OH 1% (
v/
v). Enrichment medium: Sodium Acetate 10 g, KNO
3 10 g, K
2PO
4 0.5 g and MgSO
4 0.2 g per liter. Inoculum utilized was at 10%
v/
v of medium.
Figure 1A, B shows a diagram and a photo describing the denitrification setup.
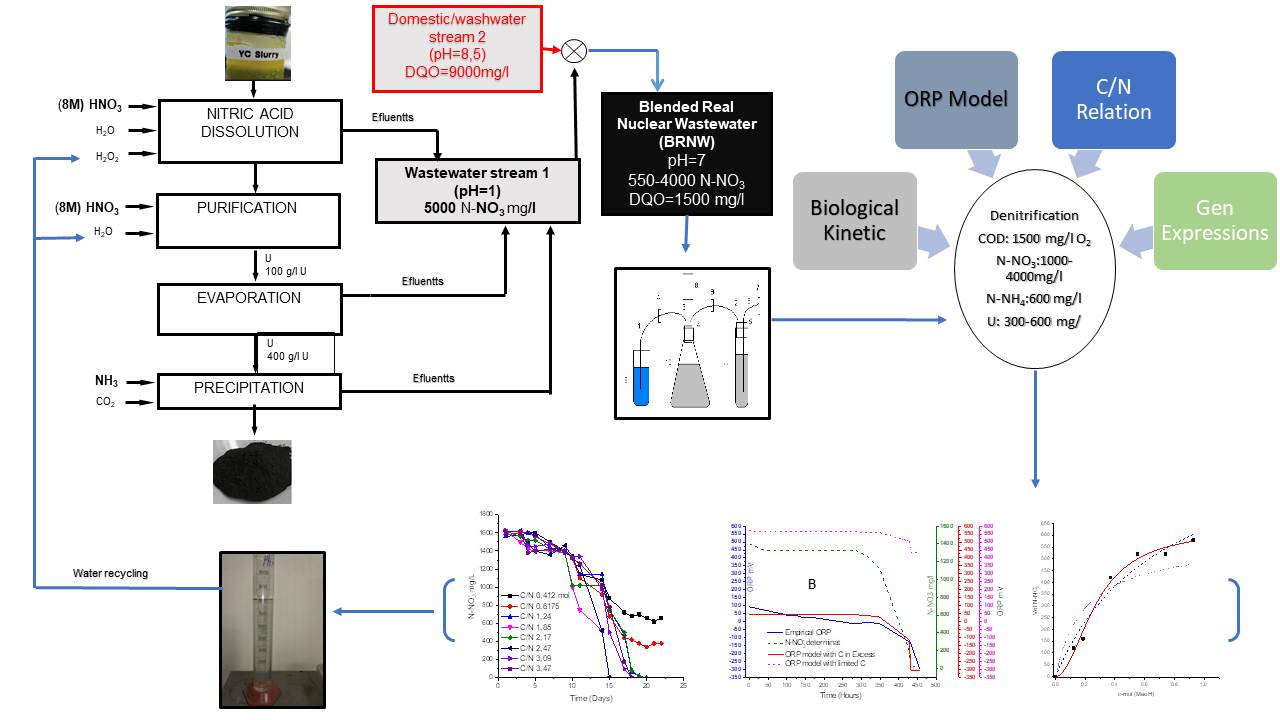
2.2. Blended Real Nuclear Wastewater (BRNW)
Real nuclear wastewater samples consisted of mixing effluent streams from an Argentinian uranium conversion facility. This Blended Effluent from Real Nuclear Wastewater, named as BRNW, comprised a mix of different discharge flows to neutralize and dilute nitrogen concentrations.
The first (1) stream was current processing characterized by a pH = 1 and a concentration of nitrogen that varied between 1000 ± 10 and 4000 ± 63 mg/L N-NO3−, with methanol addition (COD 1500 ± 70 mg O2/L). The second (2) stream came from an industrial washing equipment effluent with a pH = 9 and 2700 mg/L of total organic nitrogen and 13,000 mg/L of COD with small quantities of tributylphosphate (TBP) and detergent. Both effluents were mixed in such a relationship as to ensure that the final parameters were as follows: COD 1500 mg O2/L, N-NO3− 550–4000 ± 63 mg/L and N-NH4+ 600–1400 ± 37 mg/L (around 1(stream 1)/10(stream 2)). The selected values of the parameters were obtained from the Monod maximum velocity (Vmax) and ORP determination, with the final pH adjusted to pH = 7.
2.3. Bacterial Acclimation
Table 1 shows that there were three different periods for acclimation. Strategies were carried out in three stages for 40 days each: Stage 1, a synthetic media; Stage 2, was a first stream; and the final step consisted of an adaptation of the culture to BRNW reaching a pH, nitrogen content and COD relative to the optimal growth of bacteria.
2.4. Nernst Equation
The Nernst equation was developed based on a relationship for each chemical reaction based on a 1:1 stoichiometric ratio. The main biological denitrification to convert nitrate to nitrogen gas under anoxic conditions is heterotrophic, and it is expressed by the following generic stoichiometric equation:
The purpose of this study was to use ORP as a quantitative real-time process control parameter in a real wastewater sample.
To apply the Nernst equation, the assumption was that the substrate’s concentration was constant and in excess. Thus, the Nernst equation takes the following form:
Mirror Model by ORP (Chang 2004)
Chang Modification: a″ = i′ + 2.3 × 14 × m; b′ = −2.3 × m; c′ = 2.3 × K″ y d′= 2.3 × j′.
Multiple regression analyses were used to fit the empirical ORP and the data obtained, setting the ORP curve to the proposed ORP equation, according to Chang 2004 [
25].
2.5. Kinetic Growth
Denitrification rate comprises kinetics constants: the maximum rate of denitrification Vmax, (N-NO3 mg/L·day) and Ks constant for organic matter expressed in C-Mol (CH3 OH)—KC-Mol. To obtain these parameters, the hyperbolic function of Monod was compared to the Hill Model. In order to perform this, Monod was converted into a linear form using the Hofstee–Eadie linearization method. The Hill equation is commonly used to study the kinetics of reactions that exhibit a sigmoidal behavior. The rate of catalyzed reactions was analyzed by the Hill equation. The number of sites were defined as n = 2 (CH3OH and NO3−).
When n = 1, the expressions follow the Monod model.
Equation (2) describes the Hill model, where V = denitrification rate (c-Mol mg/L·day), Vmax = Maximun velocity (C-Mol mg/L·day), Sc-mol = Substrate carbon source and Ks is the affinity constant, n = active sites.
The measurements included were COD in relation with the nitrate. To perform this, sigmoidal and asymptotic fittings were compared using n as the number of competitors of a ligand for binding receptor (competitive binding assays). The minimum nitrate concentration was studied using the minimum dose–response curve by applying a graphical tool (Origin Pro 8.5).
Equation (3) describes the minimum dose–response curve, where Y = Bacterial Response (Catalyzer), A1 is concentration that produces a 50% maximal response over N-NO3−, A2 saturation of bacterial and Log x is the center of the curve with Hill slopes.
Denitrification rates with increasing carbon in C-Mol and N-NO3− concentrations were analyzed with nonlinear regression using sigmoidal and asymptotic curves (Origin Microcal 8.0). Hill coefficients provide information on the number of interacting sites; if n = 1, the sigmoidal curve changed to asymptotic curve (Monod).
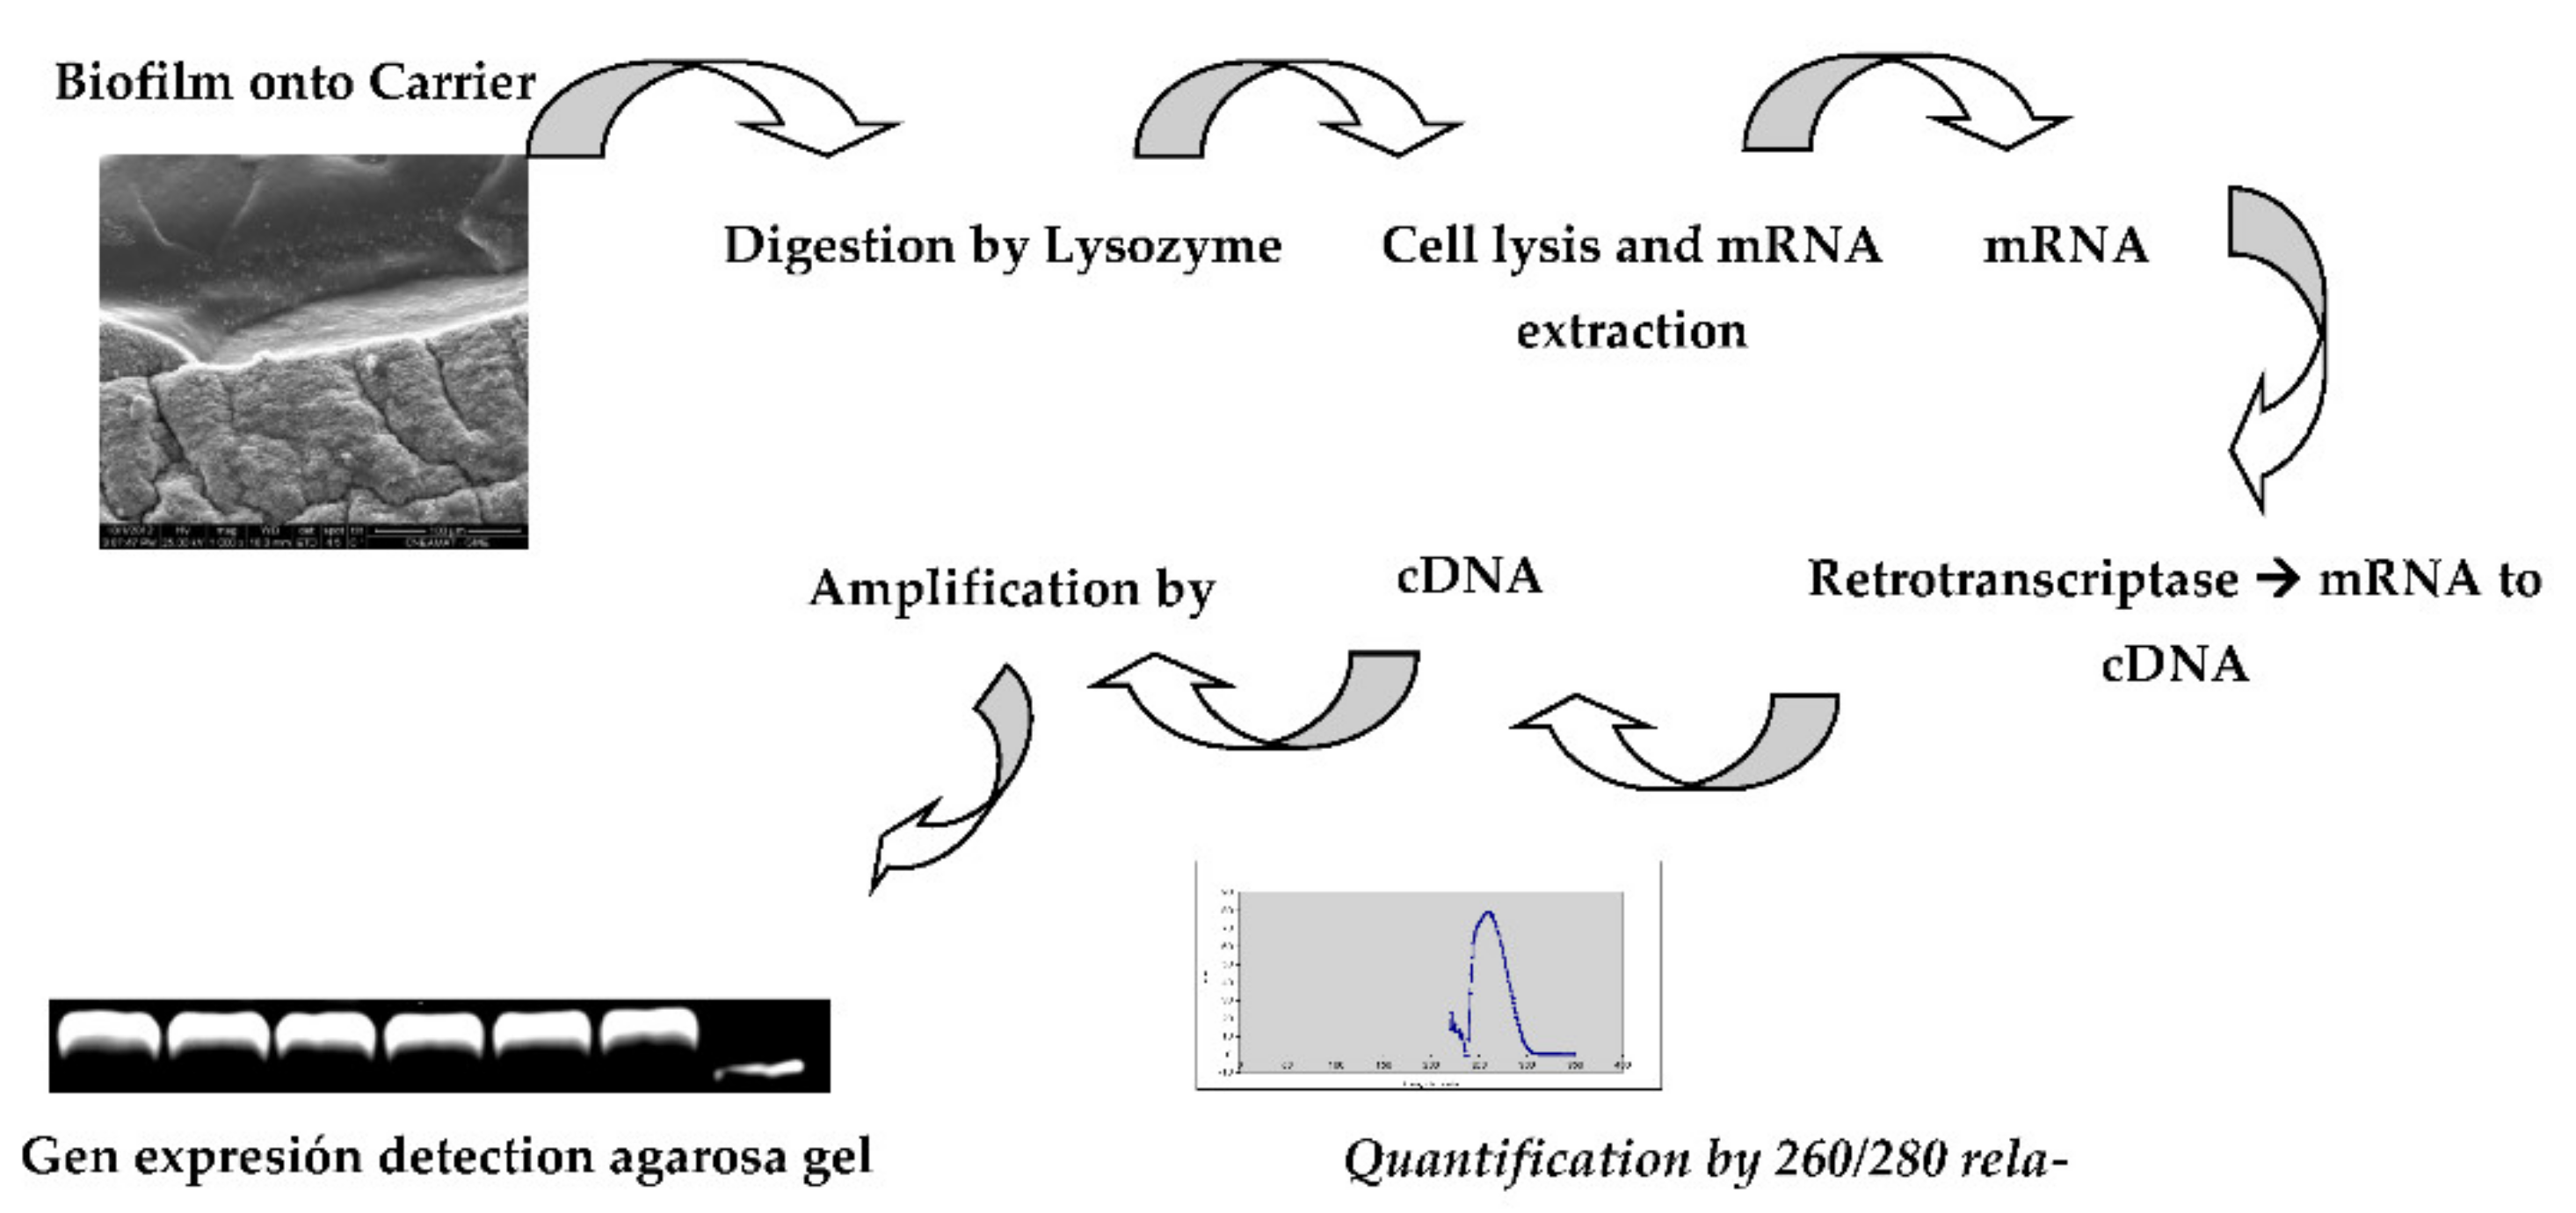
2.6. Bacterial Gene Expression
The gene expression of the main enzymes involved were studied by the extraction of mRNA to obtain data about enzyme activity to characterize bacterial gene expression [
26]. A schematic description the procedure is presented in
Figure 2.
The protocol was as follows:
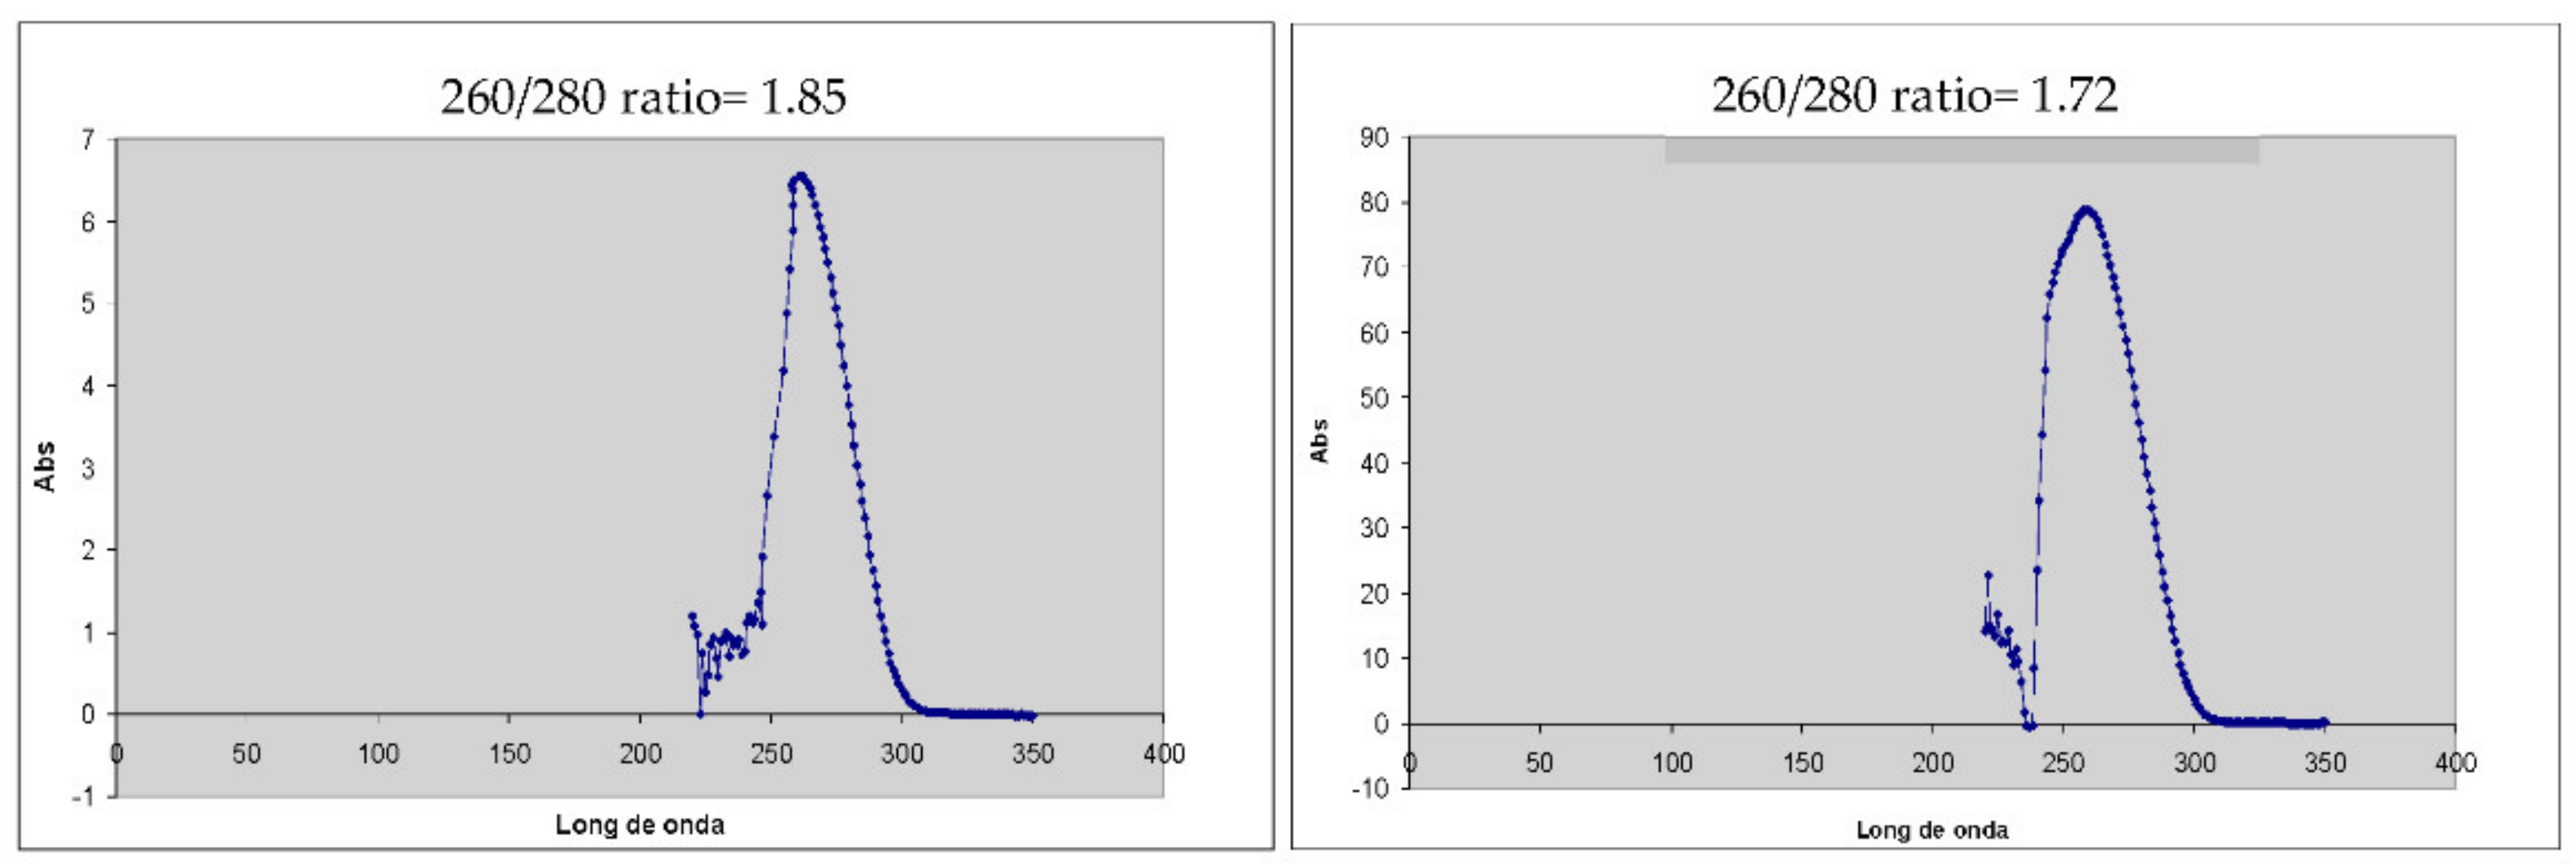
RNA samples were acquired from effluents before being treated and from bioreactors on planktonic and attached cells. Samples were incubated in an extraction buffer (100 mM PBS, 10 mM SDS, 100 mM EDTA, 3 mM beta-mercaptoethanol) in the presence of 10 mg/mL lysozyme for 12 h at 37 °C. After enzymatic digestion, the samples were homogenized and then incubated in the presence of proteinase K at 60 °C for 50 min to stop digestion by lysozyme. The pellet was processed on illustra™ RNAspin Mini RNA Isolation Kit. Once RNA was obtained, it was quantified using a Nanodrop in the 260/280 nm band.
cDNAs were synthetized once the total RNAs contained in the denitrifying bacteria were obtained. The next step was to isolate only those that code for enzymes that amplify gene involved in NirK, NirS, and NosZ expressions. To perform this, it was necessary to transcribe mRNA to DNA, which was used as strands of DNA. Previously DNA was removed by DNAase (included in the purification kit). The mRNAs’ DNA, 1 μL of Primers (hexamers) 0.5 μg/μL, 1 μL of 10 mM dNTPs and water were added to a volume of 14 μL. The tubes were incubated at 50 °C for 5 min. The ice samples were collected and incubated for 1 min. To the cold samples, the following was added: 4 μL of 4X First Strand Buffer (Invitrogen), 1 μL of 0.1 M TDT (Invitrogen) and 1 μL of SuperScript III Reverse Transcriptase (Invitrogen), and the tubes were incubated at 50 °C for 60 min, 55 °C for 15 min and 70 °C for 15 min. The cDNA obtained was used as a template for PCR reaction.
The genes for determining the bacterial population were nitrite reductases
NirS and
NirK gene, and for nitrous oxide reductase, it was the
NosZ gene. As a control, the
rpoD “housekeeping” genes were used, which are shown in
Table 2. To select the definitive gene sequence, the specificities of the primers were checked using the BLAST algorithm (
http://blast.ncbi.nlm.nih.gov/Blast.cgi) with verification corresponding to the target sequence.
The amplifications in the PCR mix was performed, as shown in
Table 3; the PCR program cycles were carried out as displayed in
Table 3.
2.7. Identification of Cultivable Bacterial by API
Culture samples were cultivated in nutritive agar and EMB (Levine). The colonies were stained by Gram Tinction and then were analyzed using API strips. The API-20E system consists of a strip with 20 plastic wells containing dehydrated biochemical substrates: 0-nitrophenyl P-galactopyranoside (ONPG), arginine dihydrolase, lysine and ornithine, decarboxylases, citrate, hydrogen sulfide, urease, tryptophan deaminase, indole, Voges-Proskauer reagents, gelatin, glucose, mannitol, inositol, rhamnose, sucrose, melibiose, amygdalin and arabinose. The strips were inoculated as instructed by the manufacturer and incubated overnight at 35 °C. The reagents were added, and biochemical tests were recorded. If three reactions were not positive, the strips were incubated another 24 h at 35 °C before reading. The biochemical profile was determined according to the manufacturer’s protocol, and the API-20E analytical profile index was consulted for bacterial identification.
In order to confirm bacterial identification, a biochemical test was performed: king A and B medium, motility and TSI test.
2.8. Methanol Addition and the C/N Relation
A series of kinetics experiments was performed by culturing with several concentrations of substrates to investigate the kinetics and limitations of the denitrification process.
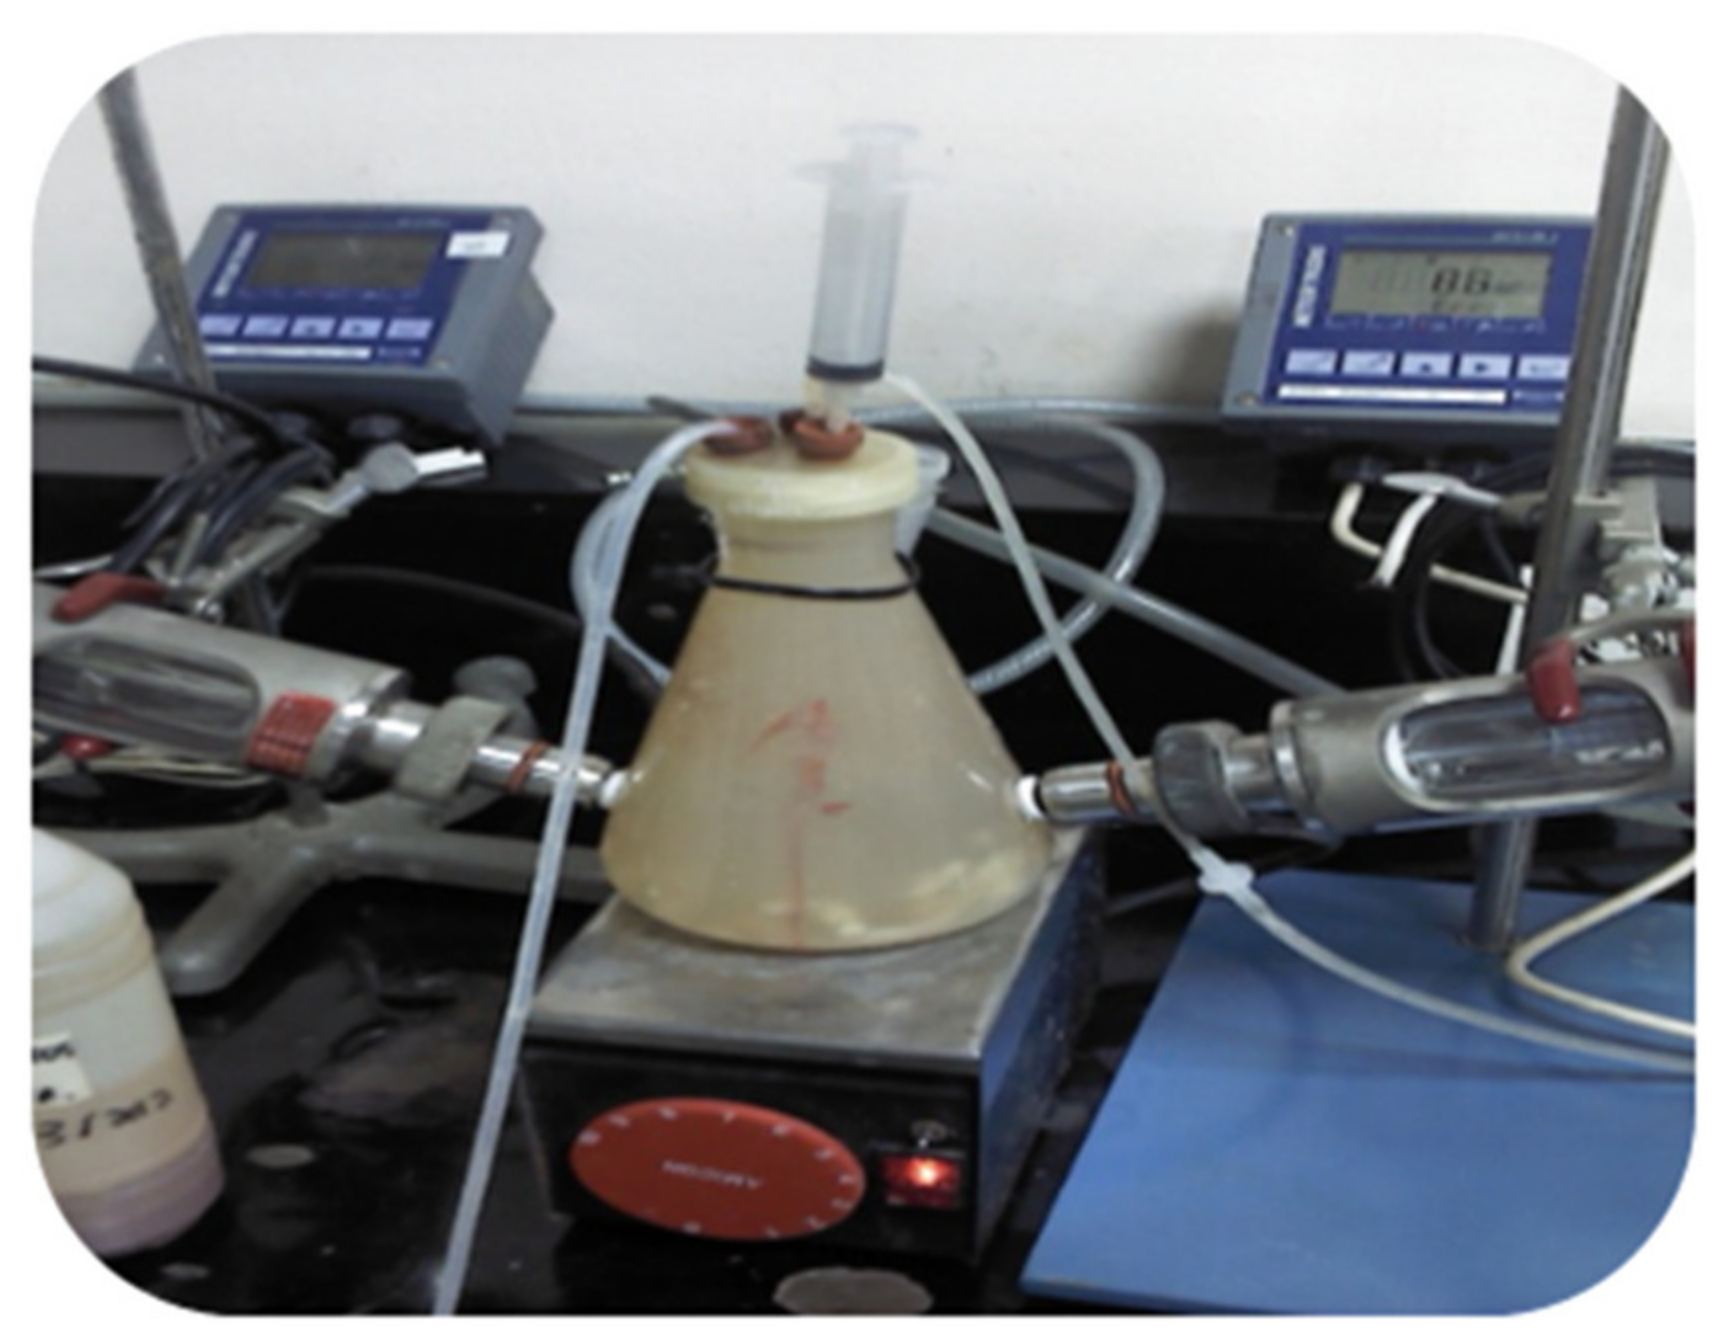
2.9. Denitrification Process
The process was developed in a 2L Erlenmeyer flask filled with wastewater from a nuclear facility with 4000 ± 63 mg N-NO3/L 600 ± 37 mg/L of Uranium and 1500 ± 72 mg of COD. Real wastewater and the external organic carbon source (1–3% v/v MeOH) were adjusted to obtain an optimum relation of C/N. The process was performed at room temperature, with a pH between 6.5 and 8 and ORP control. The values were acquired by using pH 2100 and the ORP probe.
2.10. Chemical Analysis
The system was monitored using chemical and physical analyses based on the procedures described by
Standard Methods for the Examination of Water and Wastewater [
27]. The analyzed parameters were as follows: pH (4500-H B); Chemical Oxygen Demand (COD-5220 D); Nitrite N-NO
2− (4500 B-FIA); Nitrate N-NO
3− (4500 A); and N-NH
4+ (4500-NH
3 FB) by spectrophotometric determination.
2.11. Carriers
To produce carriers, Hydro Ethyl Methacrylate (HEMA) were incorporated in an ELISA plate; then, they were irradiated at 25.0 kGy by 60Co gamma-irradiation sources at the Semi-Industrial Irradiation Plant in Argentina. The irradiated HEMA carriers were hydrated at 35 °C up to reach a stable weigh. The shape was cylindrical, with an average size of 0.6 cm in diameter and 1.5 cm in height.
2.12. Uranium Determination by TFRX on Solid Phase
The quantification of uranium was performed in 5 μL of sample with a Benchtop TXRF Spectrometer S2 Picofox (Bruker AXS Microanalysis GmbH, Berlin, Germany), equipped with an microfocus X-ray tube (Mo anode, 50 kV and 750 μA). The treatments of X-ray spectra and the calculations were performed using SPECTRA 5, 3e FRXRT S2 Picofox of BRUKER software. The accuracy of the measurements was calculated by determining the concentrations of the elements in a standard solution (ICP Multi-Element Standards Certipur® IV, Traceable to NIST). The lower limit detection (LLD) was calculated as recommended by the manufacturer (Bruker Nano GmbH, 2011).
3. Results and Discussion
3.1. Application of Hill and Monod Model on Denitrification Kinetics
The denitrification kinetic has been long studied based on the velocity of nitrate elimination (N-NO
3− mg/L·day). However, researchers do not agree with the model and parameters involved. For example, Dhamole [
28] and De Filippis [
29] considered the denitrification as a first-order kinetic, where velocity is proportional to N-NO
3− concentration. One major drawback of this approach is to consider bacteria as a chemical catalyzer, regardless of variability of microbiological metabolic activity. In the zero order, the kinetic is independent of the reactant concentration (V = k), presenting limitations that may not be optimal for this kind of process.
The biological Monod model considers a substrate–ligand and the relation with bacterial growth, assuming that Vmax and Ks [
23] are dependent on substrate affinity, inhibition factor and substrate concentration. However, denitrification requires special considerations on electron donors (carbon source) and acceptors (nitrate). There are certain similarities between Monod and Hill models, and the difference consists in the numerical potential factor (
) that is considered n = 2 in the present study, and the function takes a sigmoidal curve.
The velocities obtained were fitted by software under Hill parameters
, and the results are shown in
Figure 3. The maximum velocity obtained was 528 ± 28 N-NO
3− mg/L·day. Similar results were obtained by Kopec (567 N-NO
3− mg/L·day) [
23]; however, in the above-mentioned case the parameters were obtained by the Monod equation.
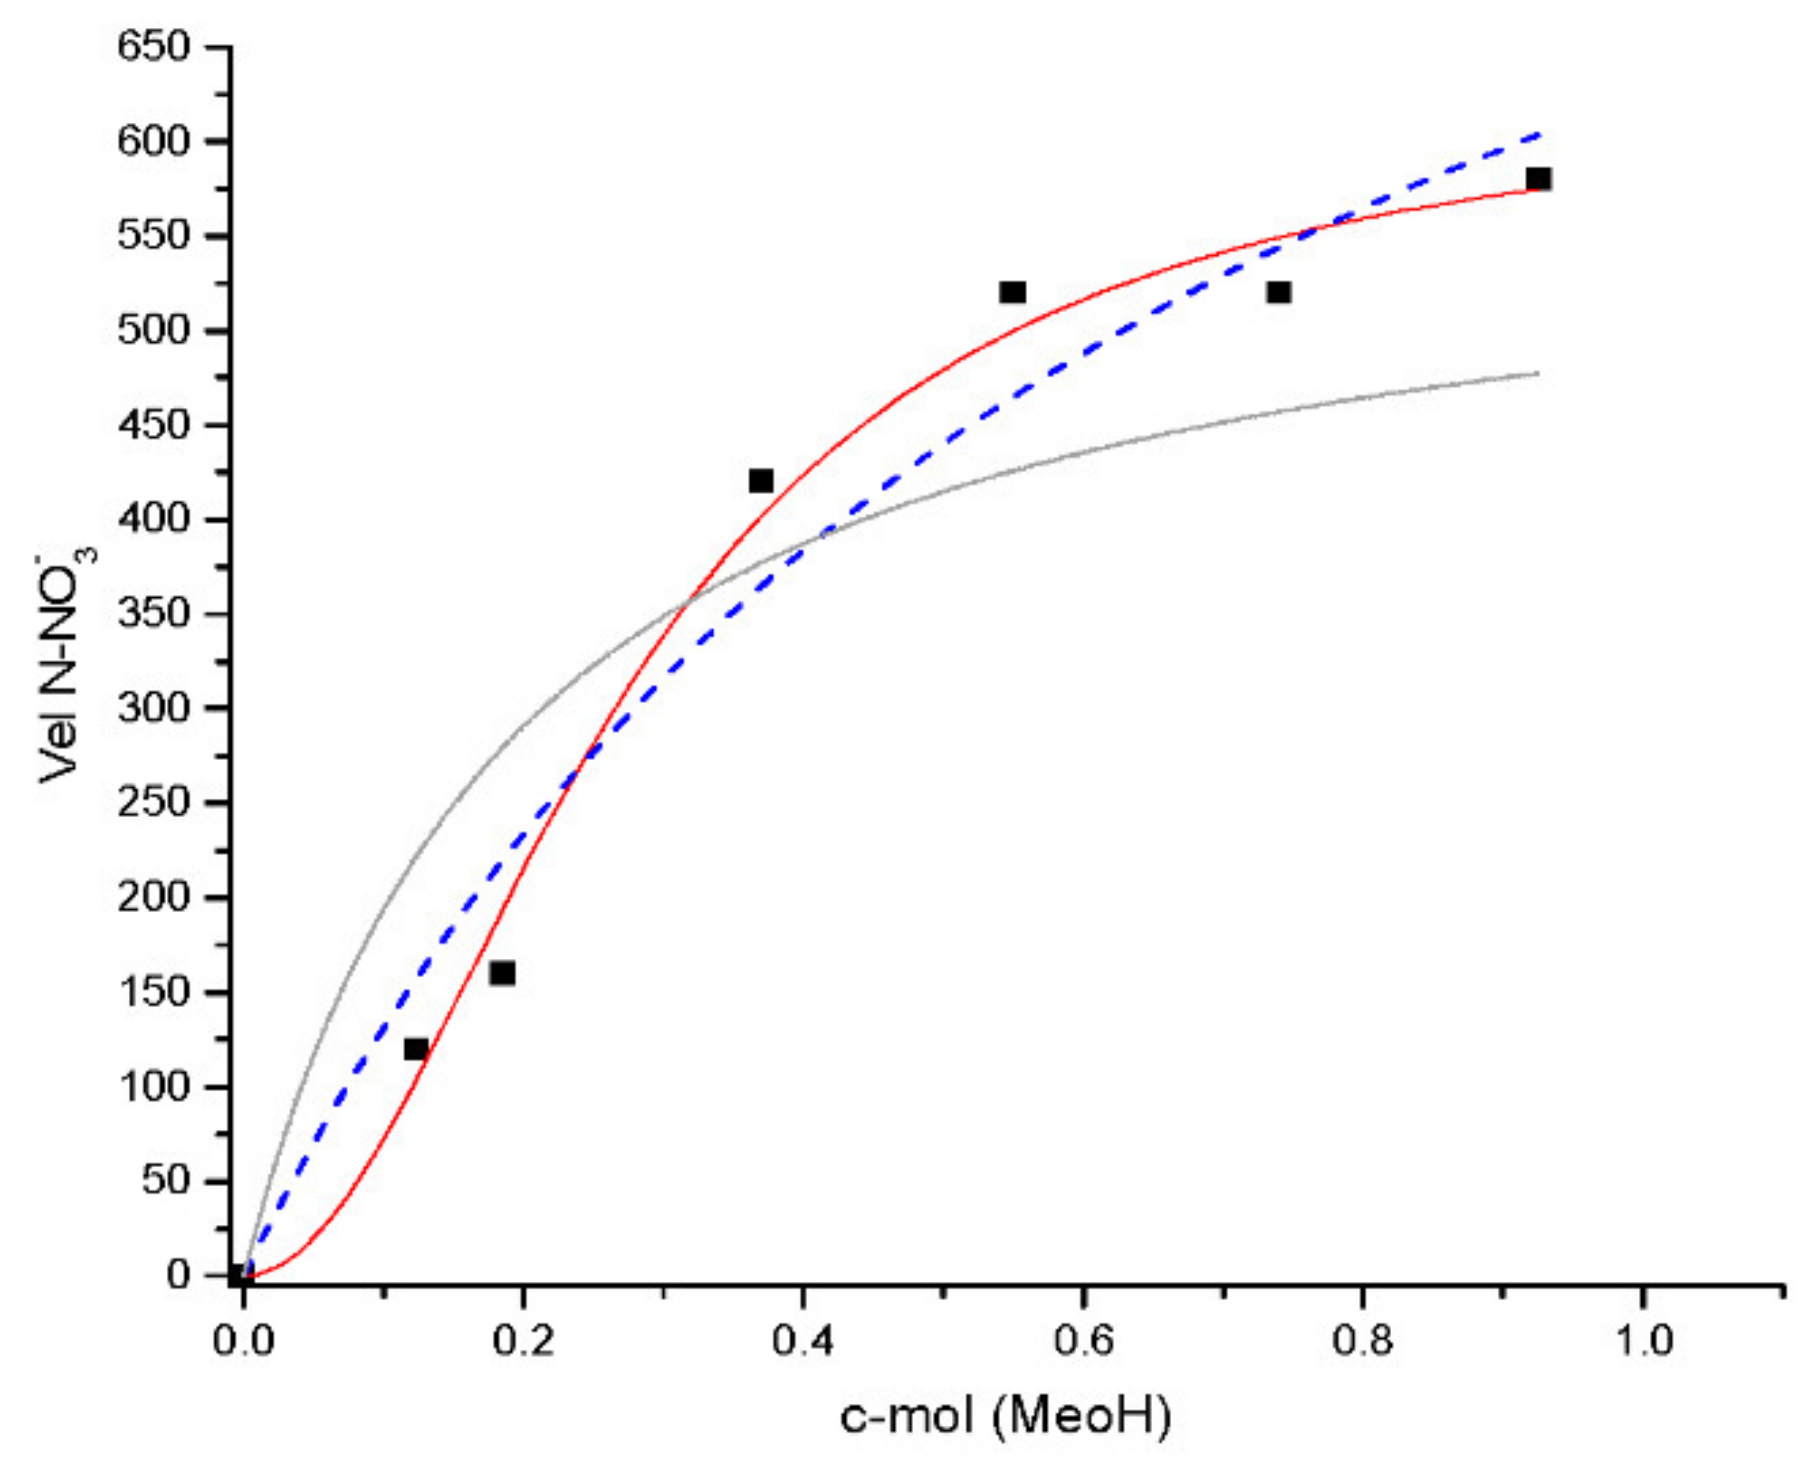
Figure 4 shows three types of fitting: One of them was adjusted by the Hill model, which reveals a sigmoidal type with the best adjustment. The other two fittings reflected a classical Monod function with lower R
2. According to this, these results could be interpreted as a catalyzer with two ligands: nitrate and carbon.
In the present analysis, the linearization of the sigmoidal curve revealed that a Ks constant was 0.24 C-mol/N-NO
3− mg/L (data not shown), different from authors that use n = 1 in their models: Kopec 16.97 K
COD [
23]. In addition, a possible explanation might be the environmental conditions and the different substrates used that obtain different electron transport capacities. Other authors used K
N-NO3, obtaining the following: Schipper (2.1 N-NO
3− mg/L), McCrackin (4.1 N-NO
3− mg/L) and Laverman (2.8–11.2 N-NO
3− mg/L) [
31].
According to the values obtained in this work combined by the Mirror Model [
25], the kinetic equation is described as follows:
where V = denitrification velocity N-NO
3− mg/L·day, V
max = 528 ± 23 N-NO
3− mg/L, C
mol = [MeOH] as C-mol and K
mol = 0.24. The potential factor takes a value of (n = 1) when COD is in excess, and pH was maintained between 7 and 8.5.
3.2. Modeling and Monitoring Using ORP
In general, the effect of ORP on biological denitrification rates in batch operations is used as reductive potential relationship produced by NO3− and anaerobic respiration. In this work, ORP was used to describe the electron flow between bacteria and oxidant/reductive elements present in the effluent.
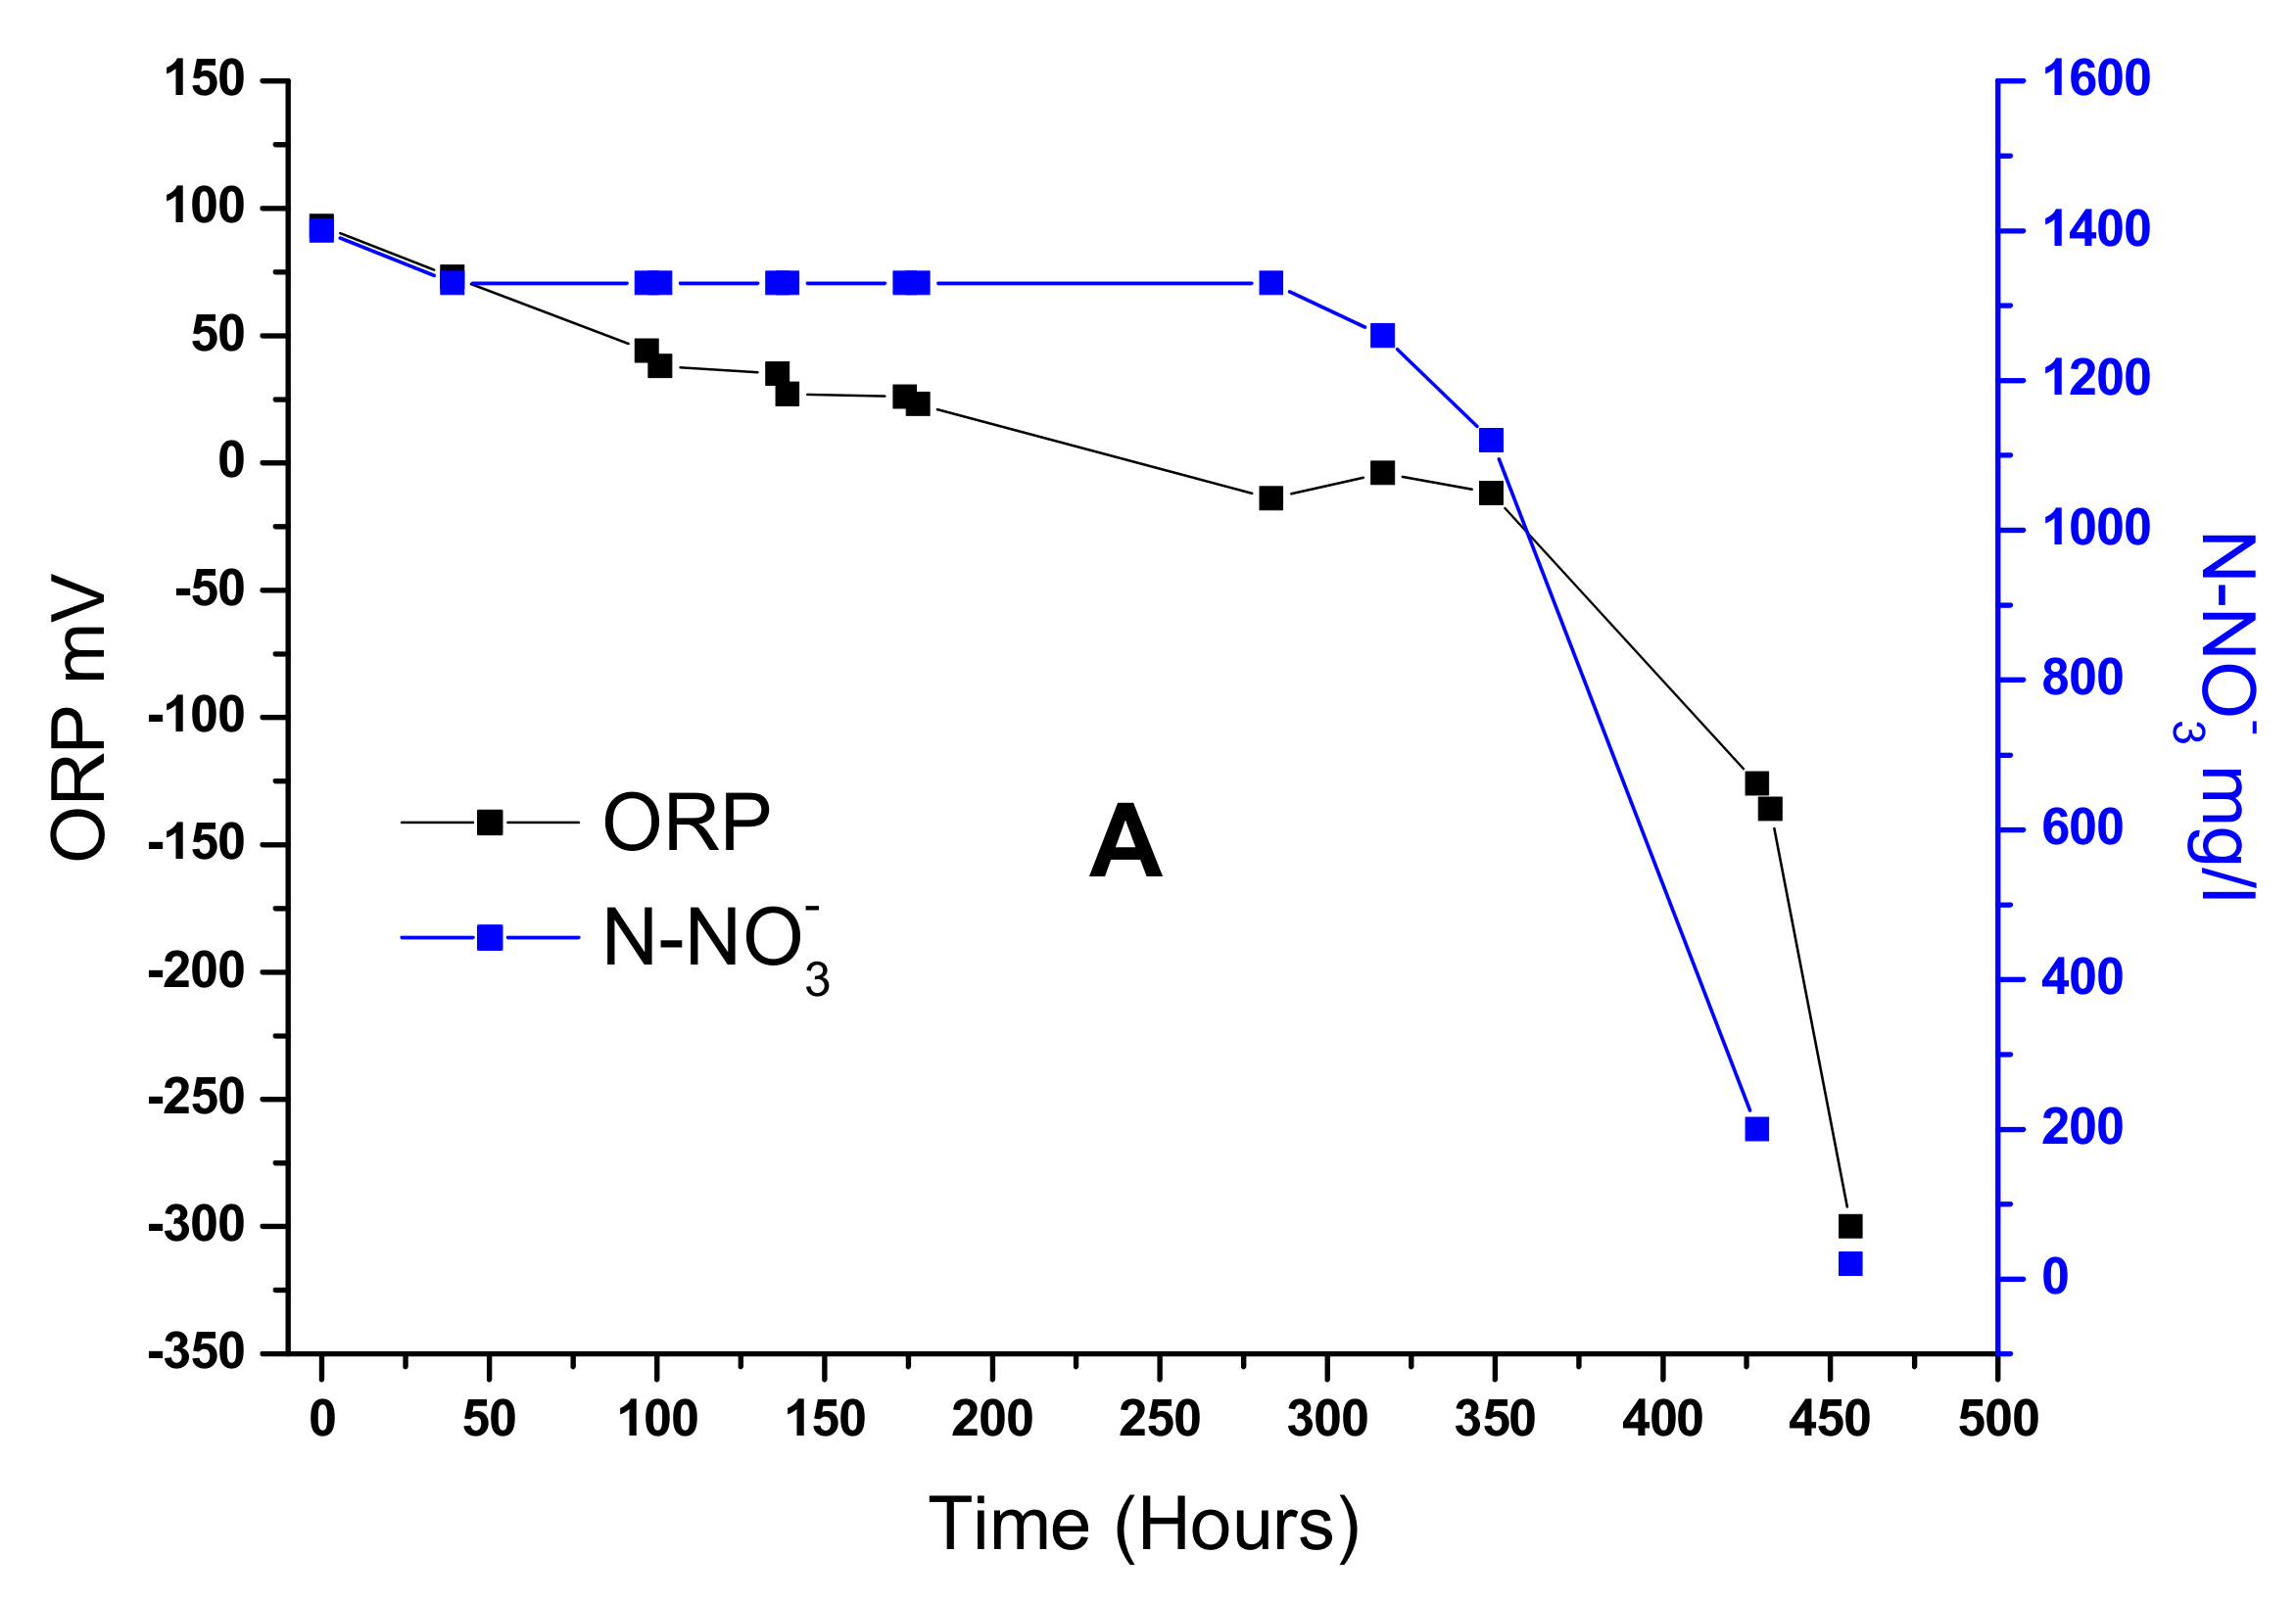
Figure 5A shows the relation between ORP and nitrate consumption, the black line shows ORP (mV), which declines gently from 100 to 0 mV; after that, it drops sharply to −300 mV simultaneously with nitrate consumption (N-NO
3−). The model proposed to describe the potential reduction rate catalyzed by bacteria follows the following equation.
The above equation reflects the conditions according to the model provided by Cheng [
31].
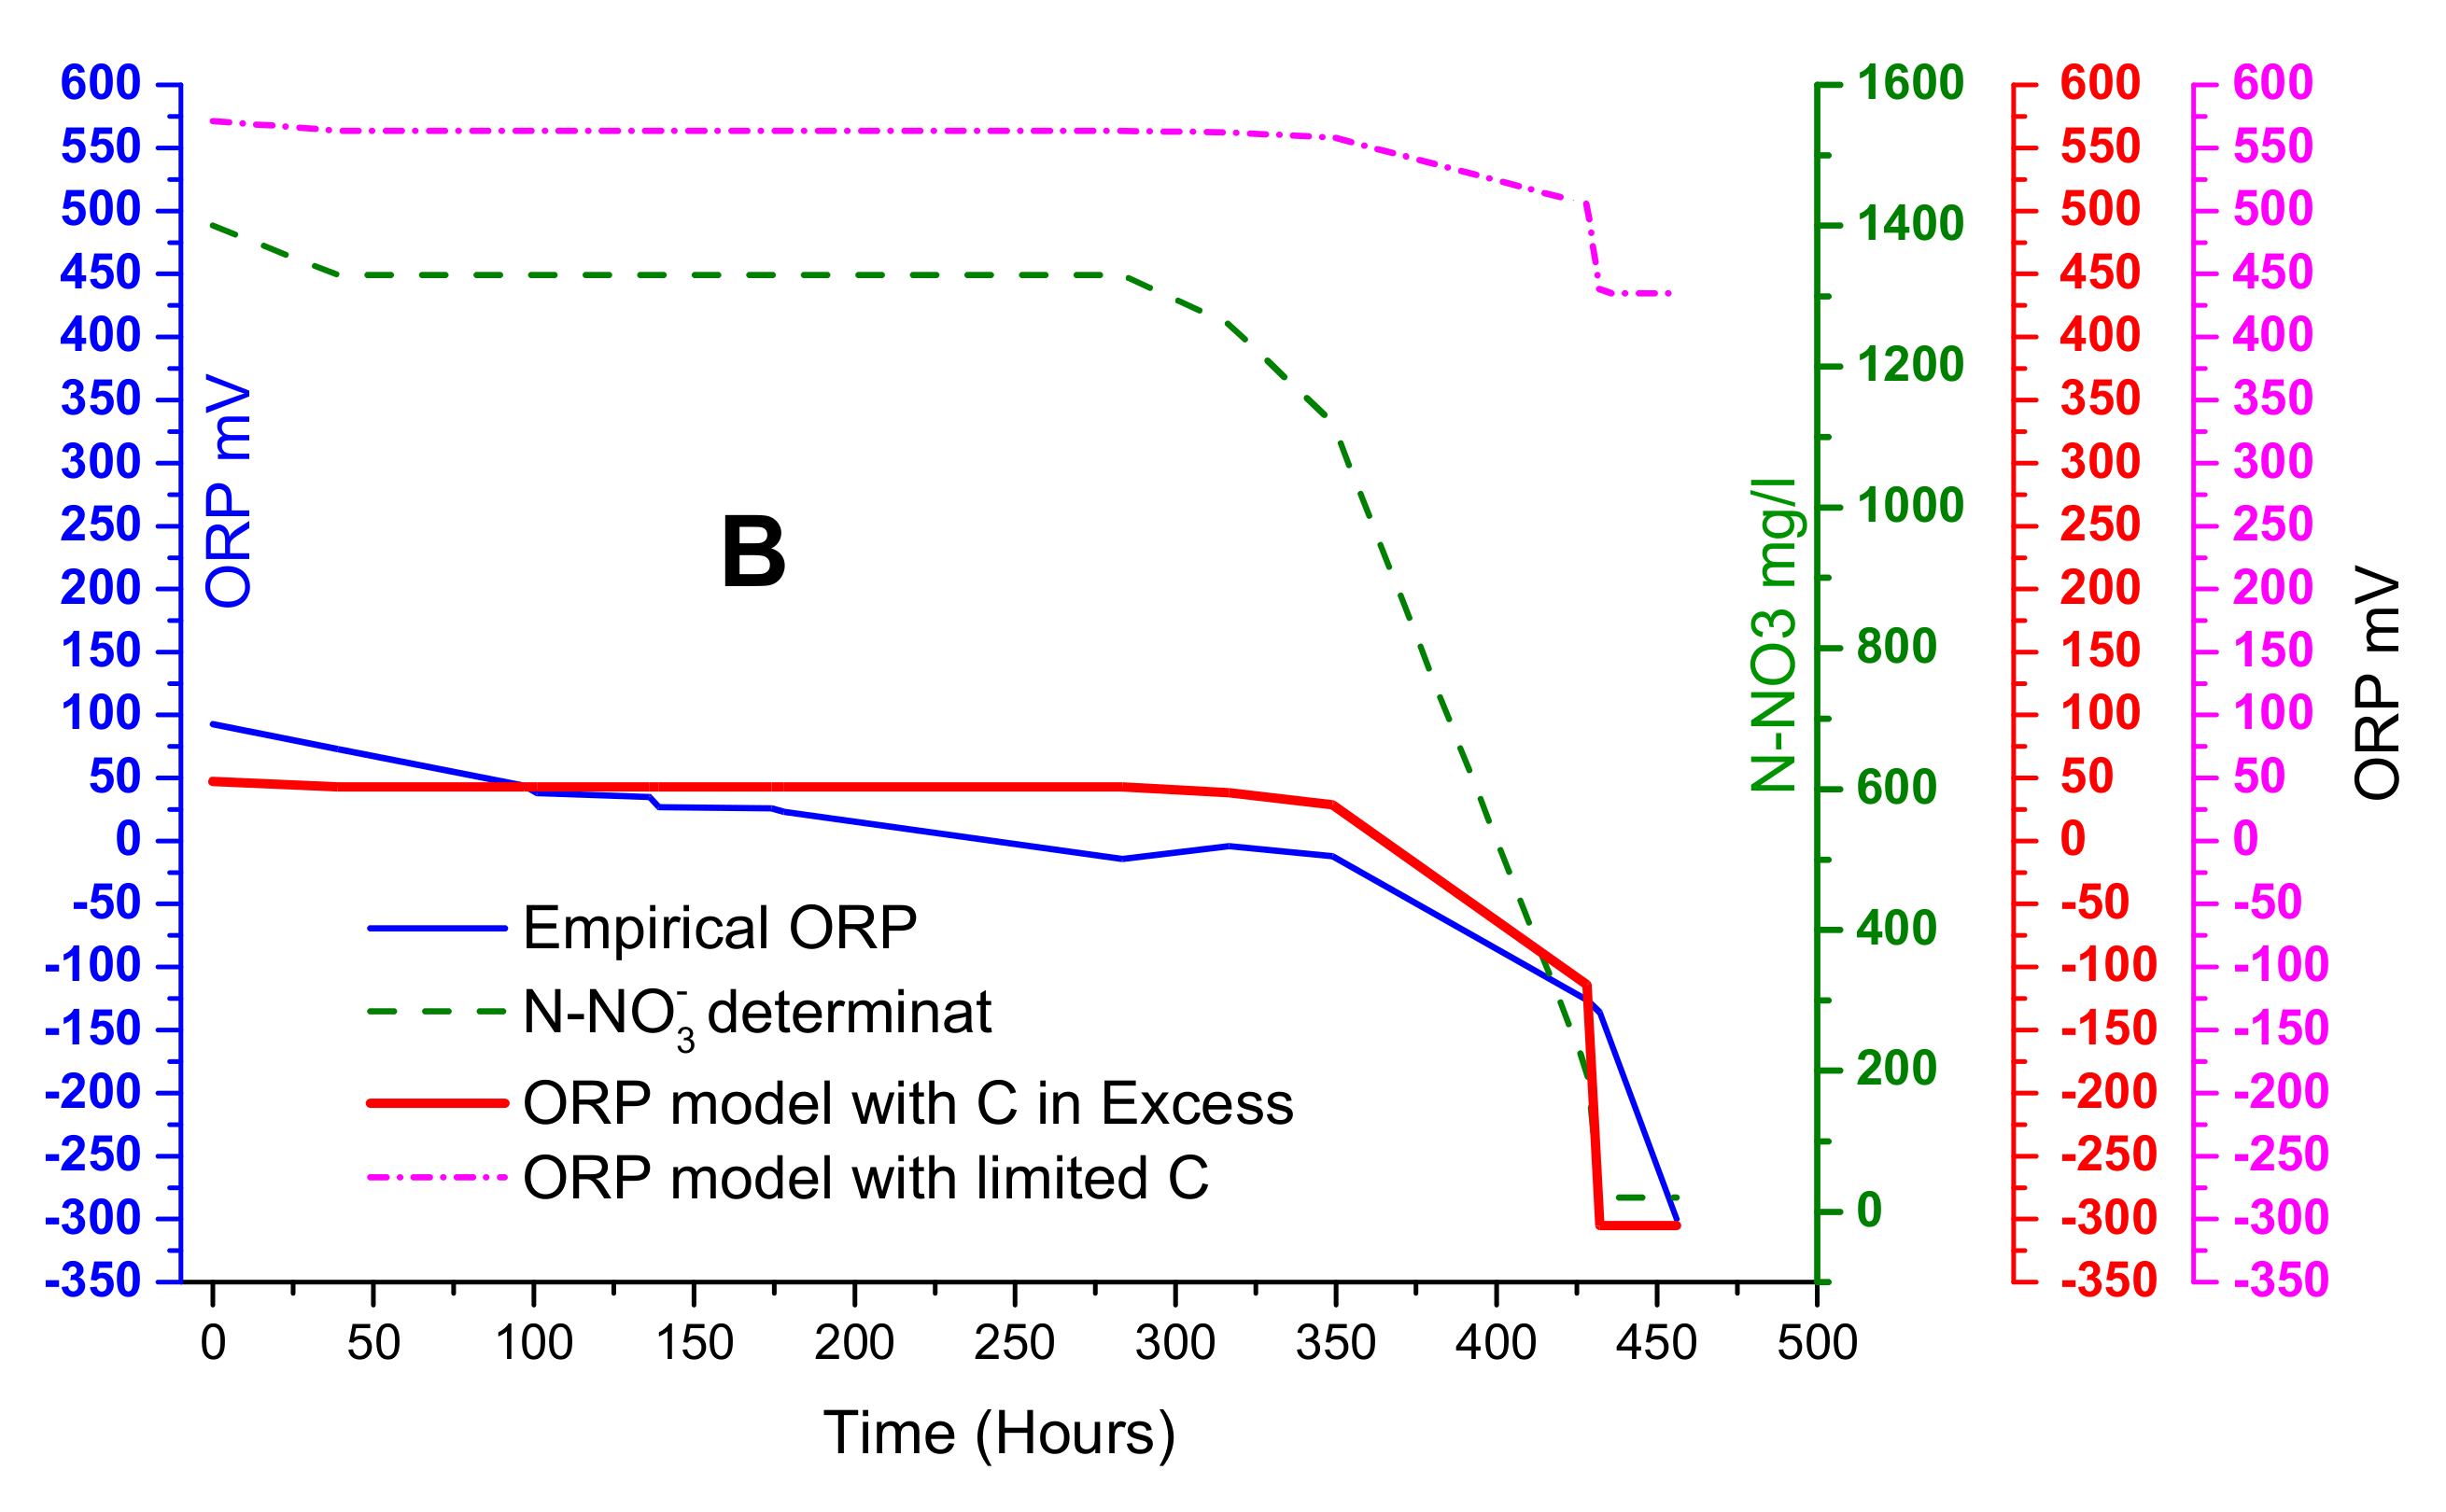
Figure 5B shows the condition using an excess of carbon (red line) and limited carbon source (dotted pink line). By using Equation (1), denitrifying activity was simulated and begin at 350 h, verifying that nitrate concentrations continuously decrease. In the case of carbon excess assays, they tend to have greater declines than the limited carbon source model. These results were similar to Cheng [
31], indicating that the excess carbon source condition was the best adjustment. The comparison between excess and limited carbon source conditions shows significant differences. This could be caused by C/N relations, which were relatively high, demonstrating that the weight of the equation term d″log
10[CH
3OH] is insignificant and could be removed. Thus, the adopted model for the next assays was as follows.
This adopted model refers to using a synthetic medium; however, in real effluents, the conditions are more complex and stressful for bacteria. Nevertheless, this proposed model can be applied in real effluents where electroactive species exchange electrons in an equilibrium state. In addition, the former equation can be used to monitor the process as the reaction rate indicator and, simultaneously, to estimate nitrogen concentrations.
3.3. Setup of C/N Relation with Methanol Addition
Methanol addition showed an immediate consumption of carbon source at the beginning of the denitrification process. The thermodynamic efficiency of growth closely related to the degree of reduction in the substrate used as the energy source [
32]. The degree of reduction in an organic compound (COD) can be defined as the number of electrons involved in oxidation to CO
2, H
2O and the reduction of NO
3− to N
2. According to the bibliography, the composition of biomass is CH
2O
0.5N
0.2; therefore, in theory, for each mole of CH
3OH, only 0.2 moles of NO
3− is reduced, and it becomes biomass. Regarding electron balance, forming one mole of biomass requires 4e-, which is 5/4 moles of NO
3− representing an almost 1:1 C/N ratio.
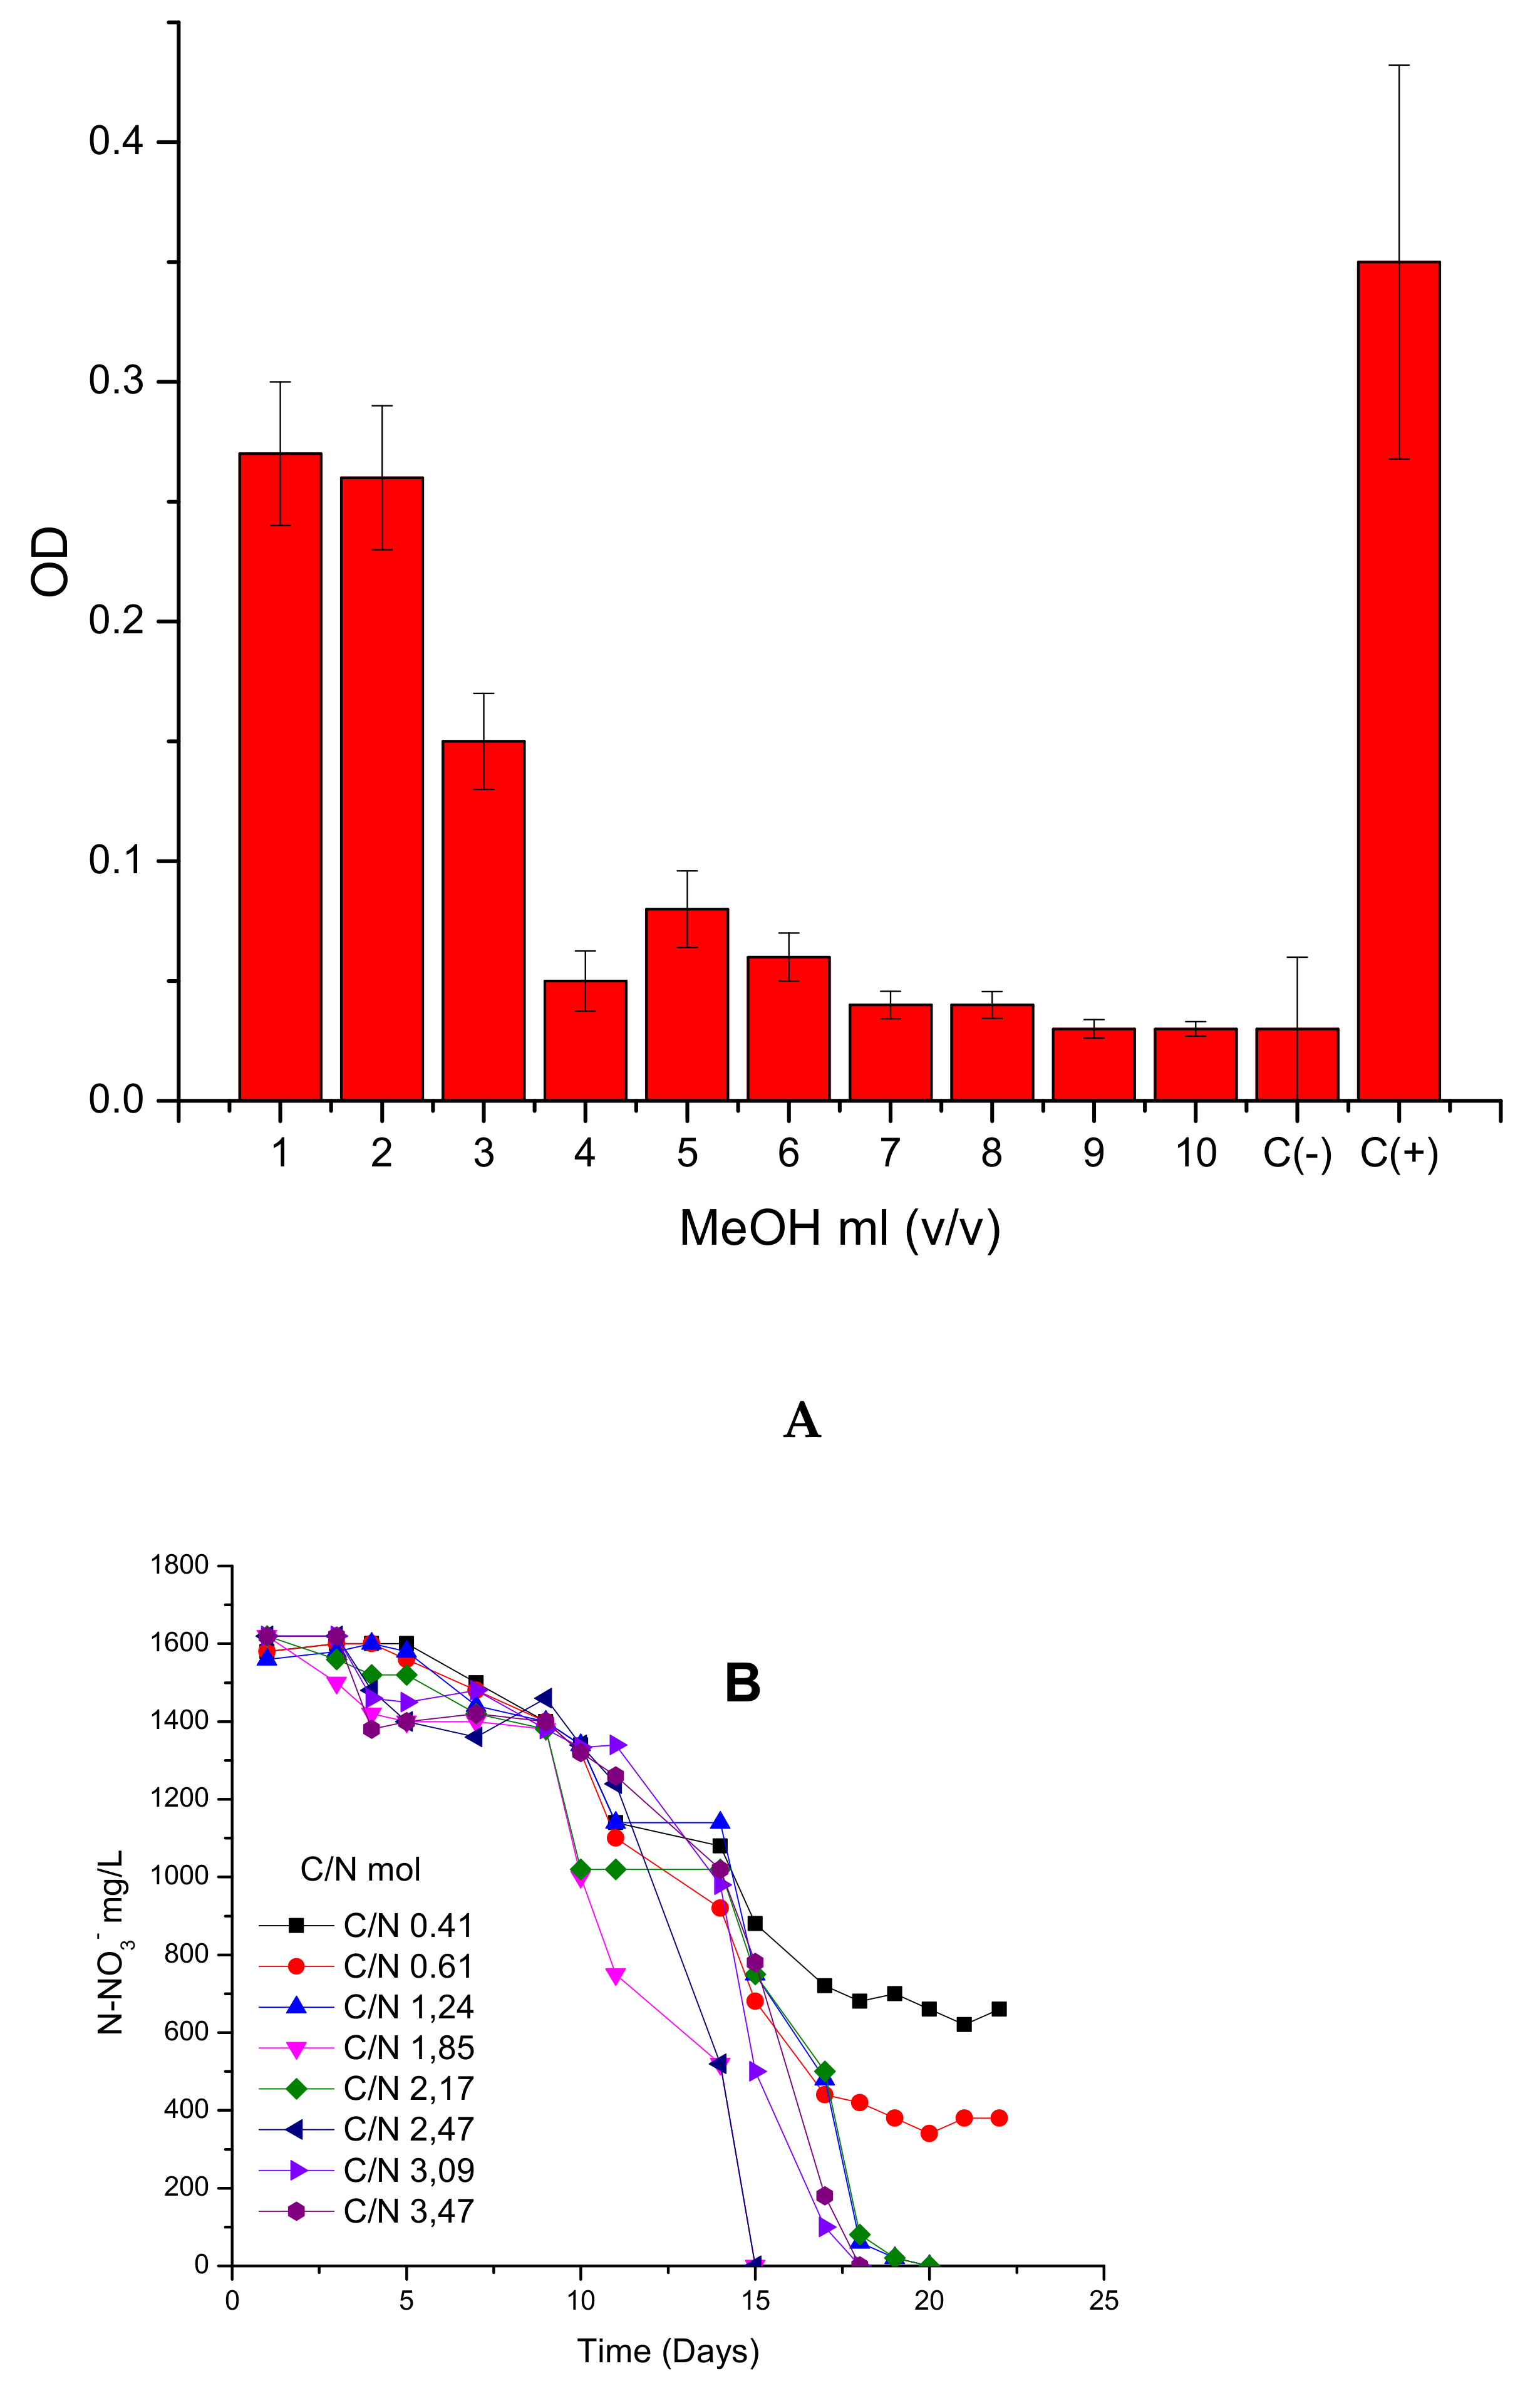
To verify the maximum tolerated load of MeOH, experiments were performed using increasing concentrations. To perform the experiment, the toxicity of methanol was studied relative to inhibition growth levels and the carbon limitations conditions (C/N) on the denitrification process (
Figure 6A,B).
Figure 6A demonstrated that, in up to 3% of MeOH, the development of bacteria was not inhibited considerably. This value was stated as the maximum tolerant concentration of methanol. As observed in
Figure 6B, the black line corresponding to a molar ratio of 0.412 C/N and red line corresponding to 0.617 C/N reached a denitrification dead point after day 17, showing incomplete denitrification. The rest of the trials reached zero values of N-NO
3−, indicating that denitrification was complete. Molar relations in the range of 1.85 and 2.47 C/N showed complete denitrification on day 15, while the other molar ratios showed complete denitrification on day 17. In all cases, it was observed that the initial stage or lag phase is about 10 days and is not influenced by C/N relations.
Regarding these results, the denitrification process should be operated up to 3% of methanol and with a C/N greater than 1.24 mol/mol to prevent carbon limitations.
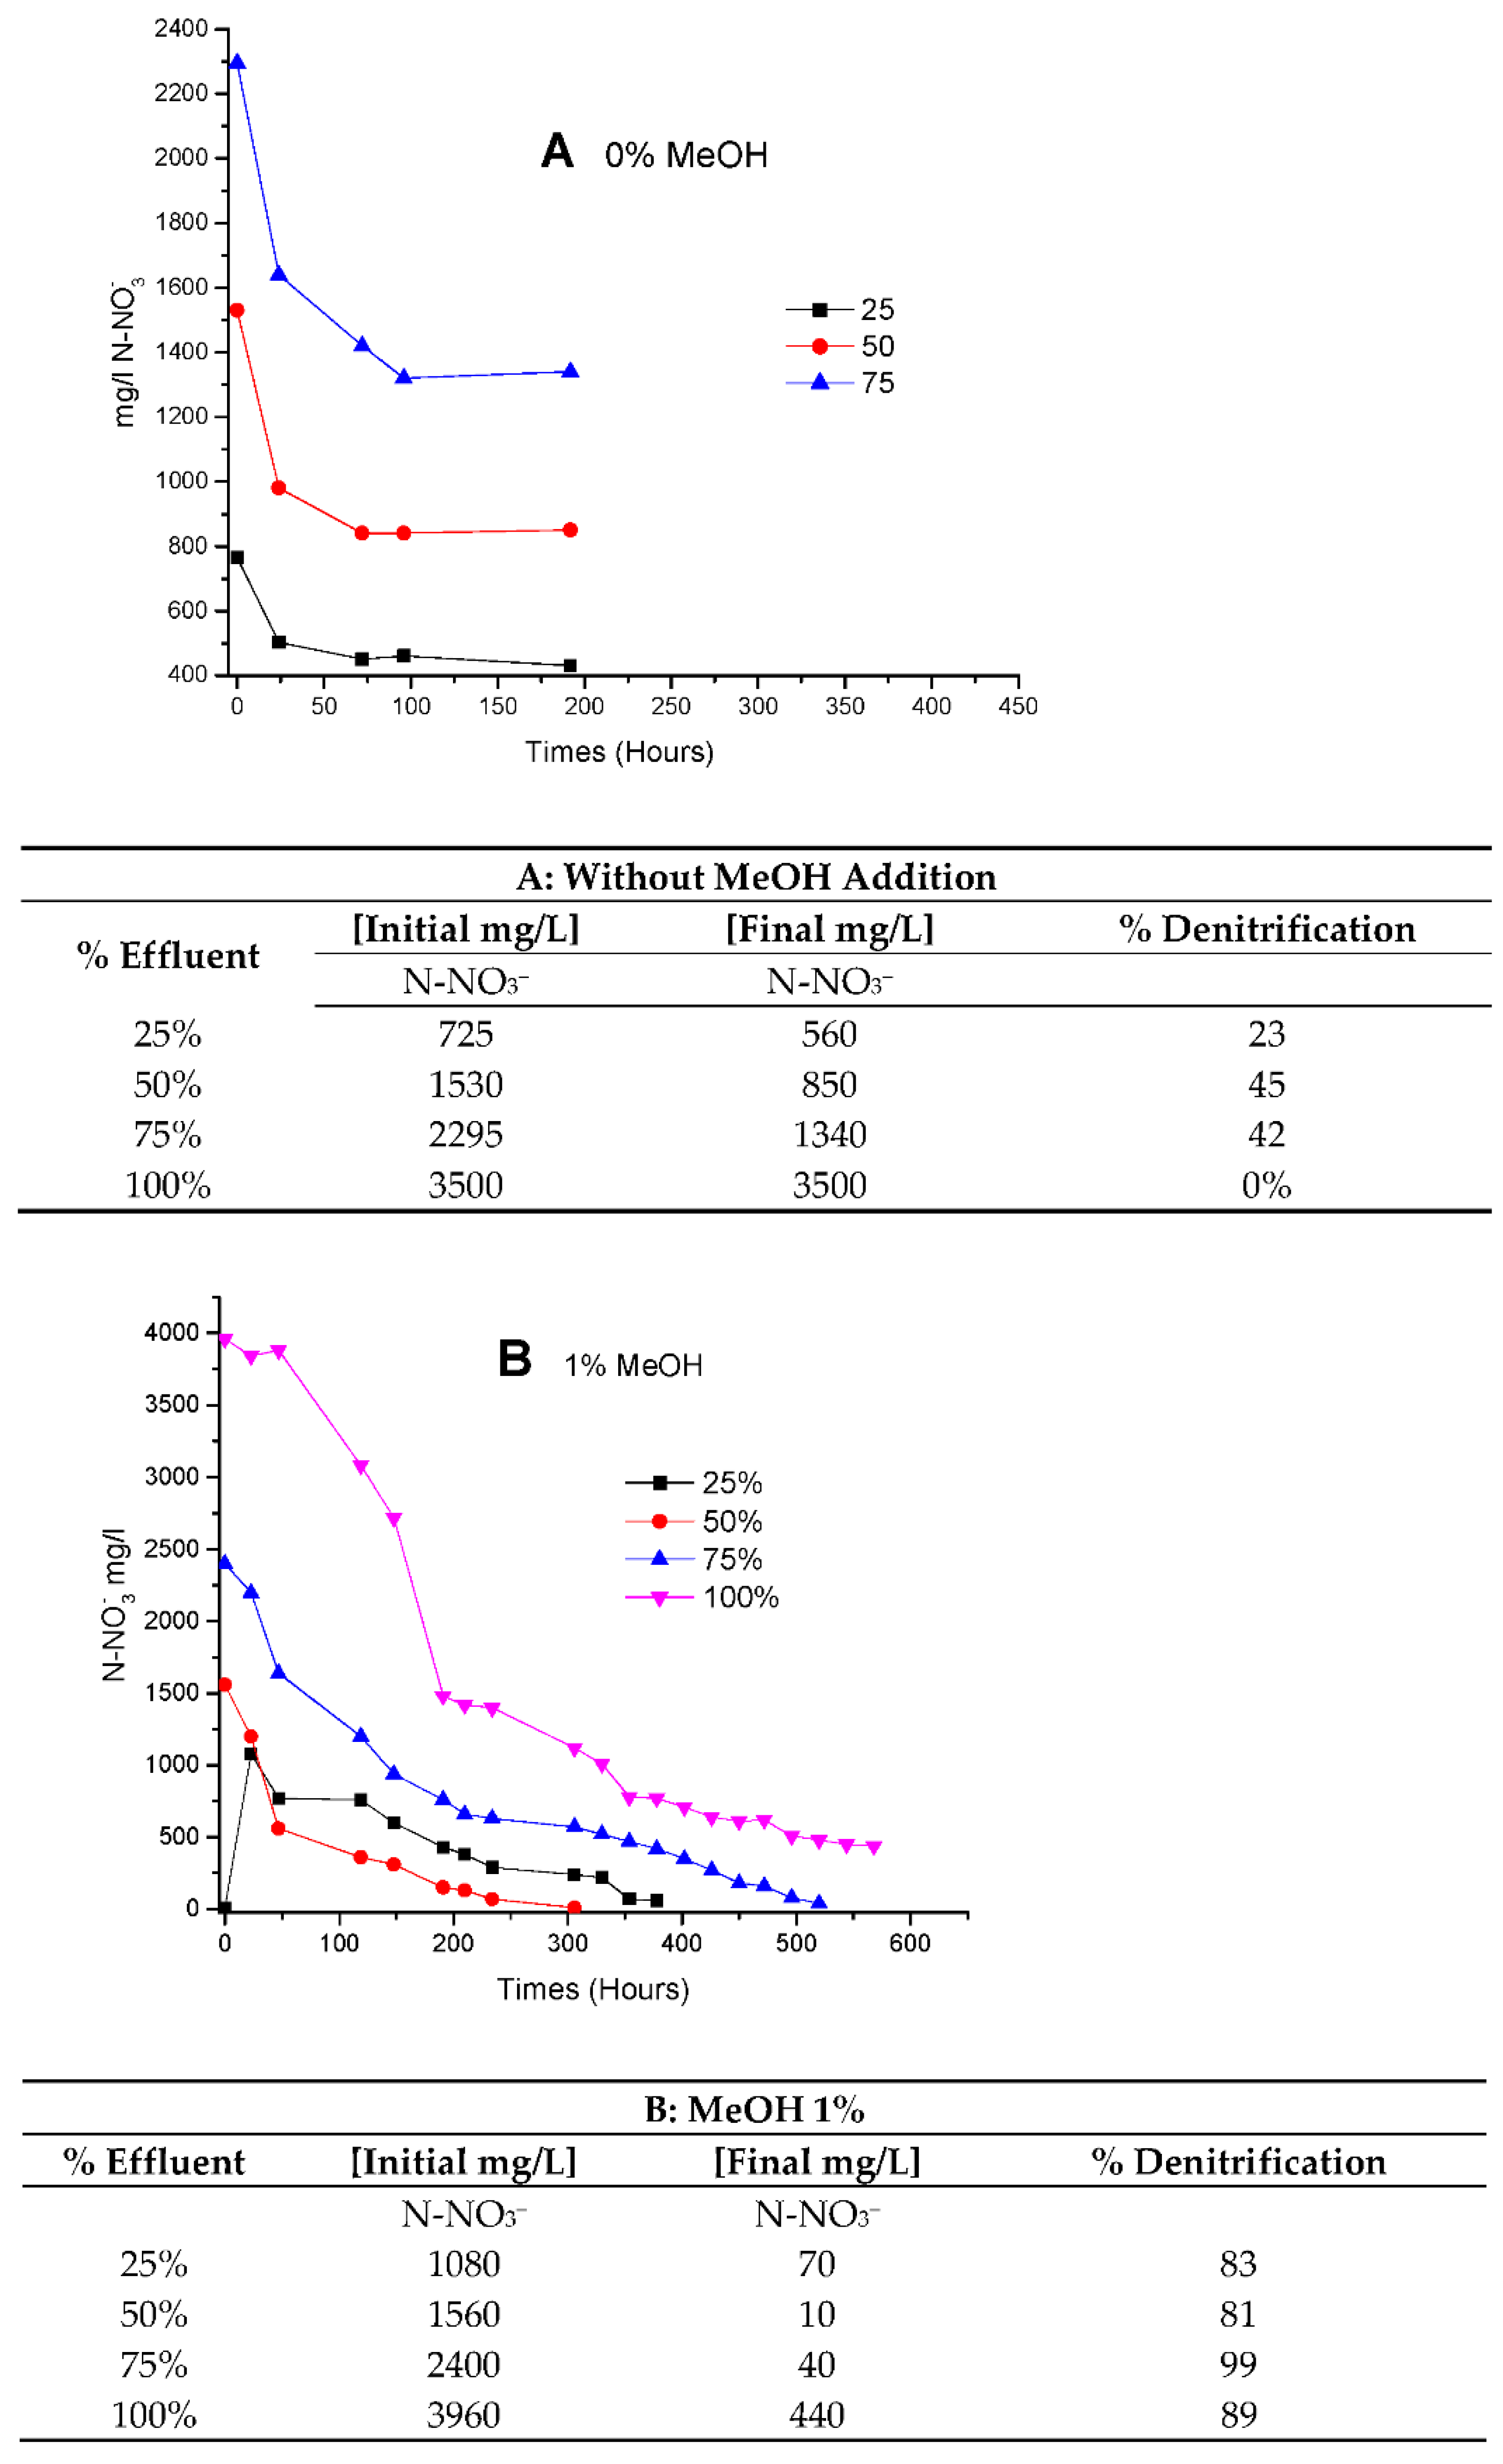
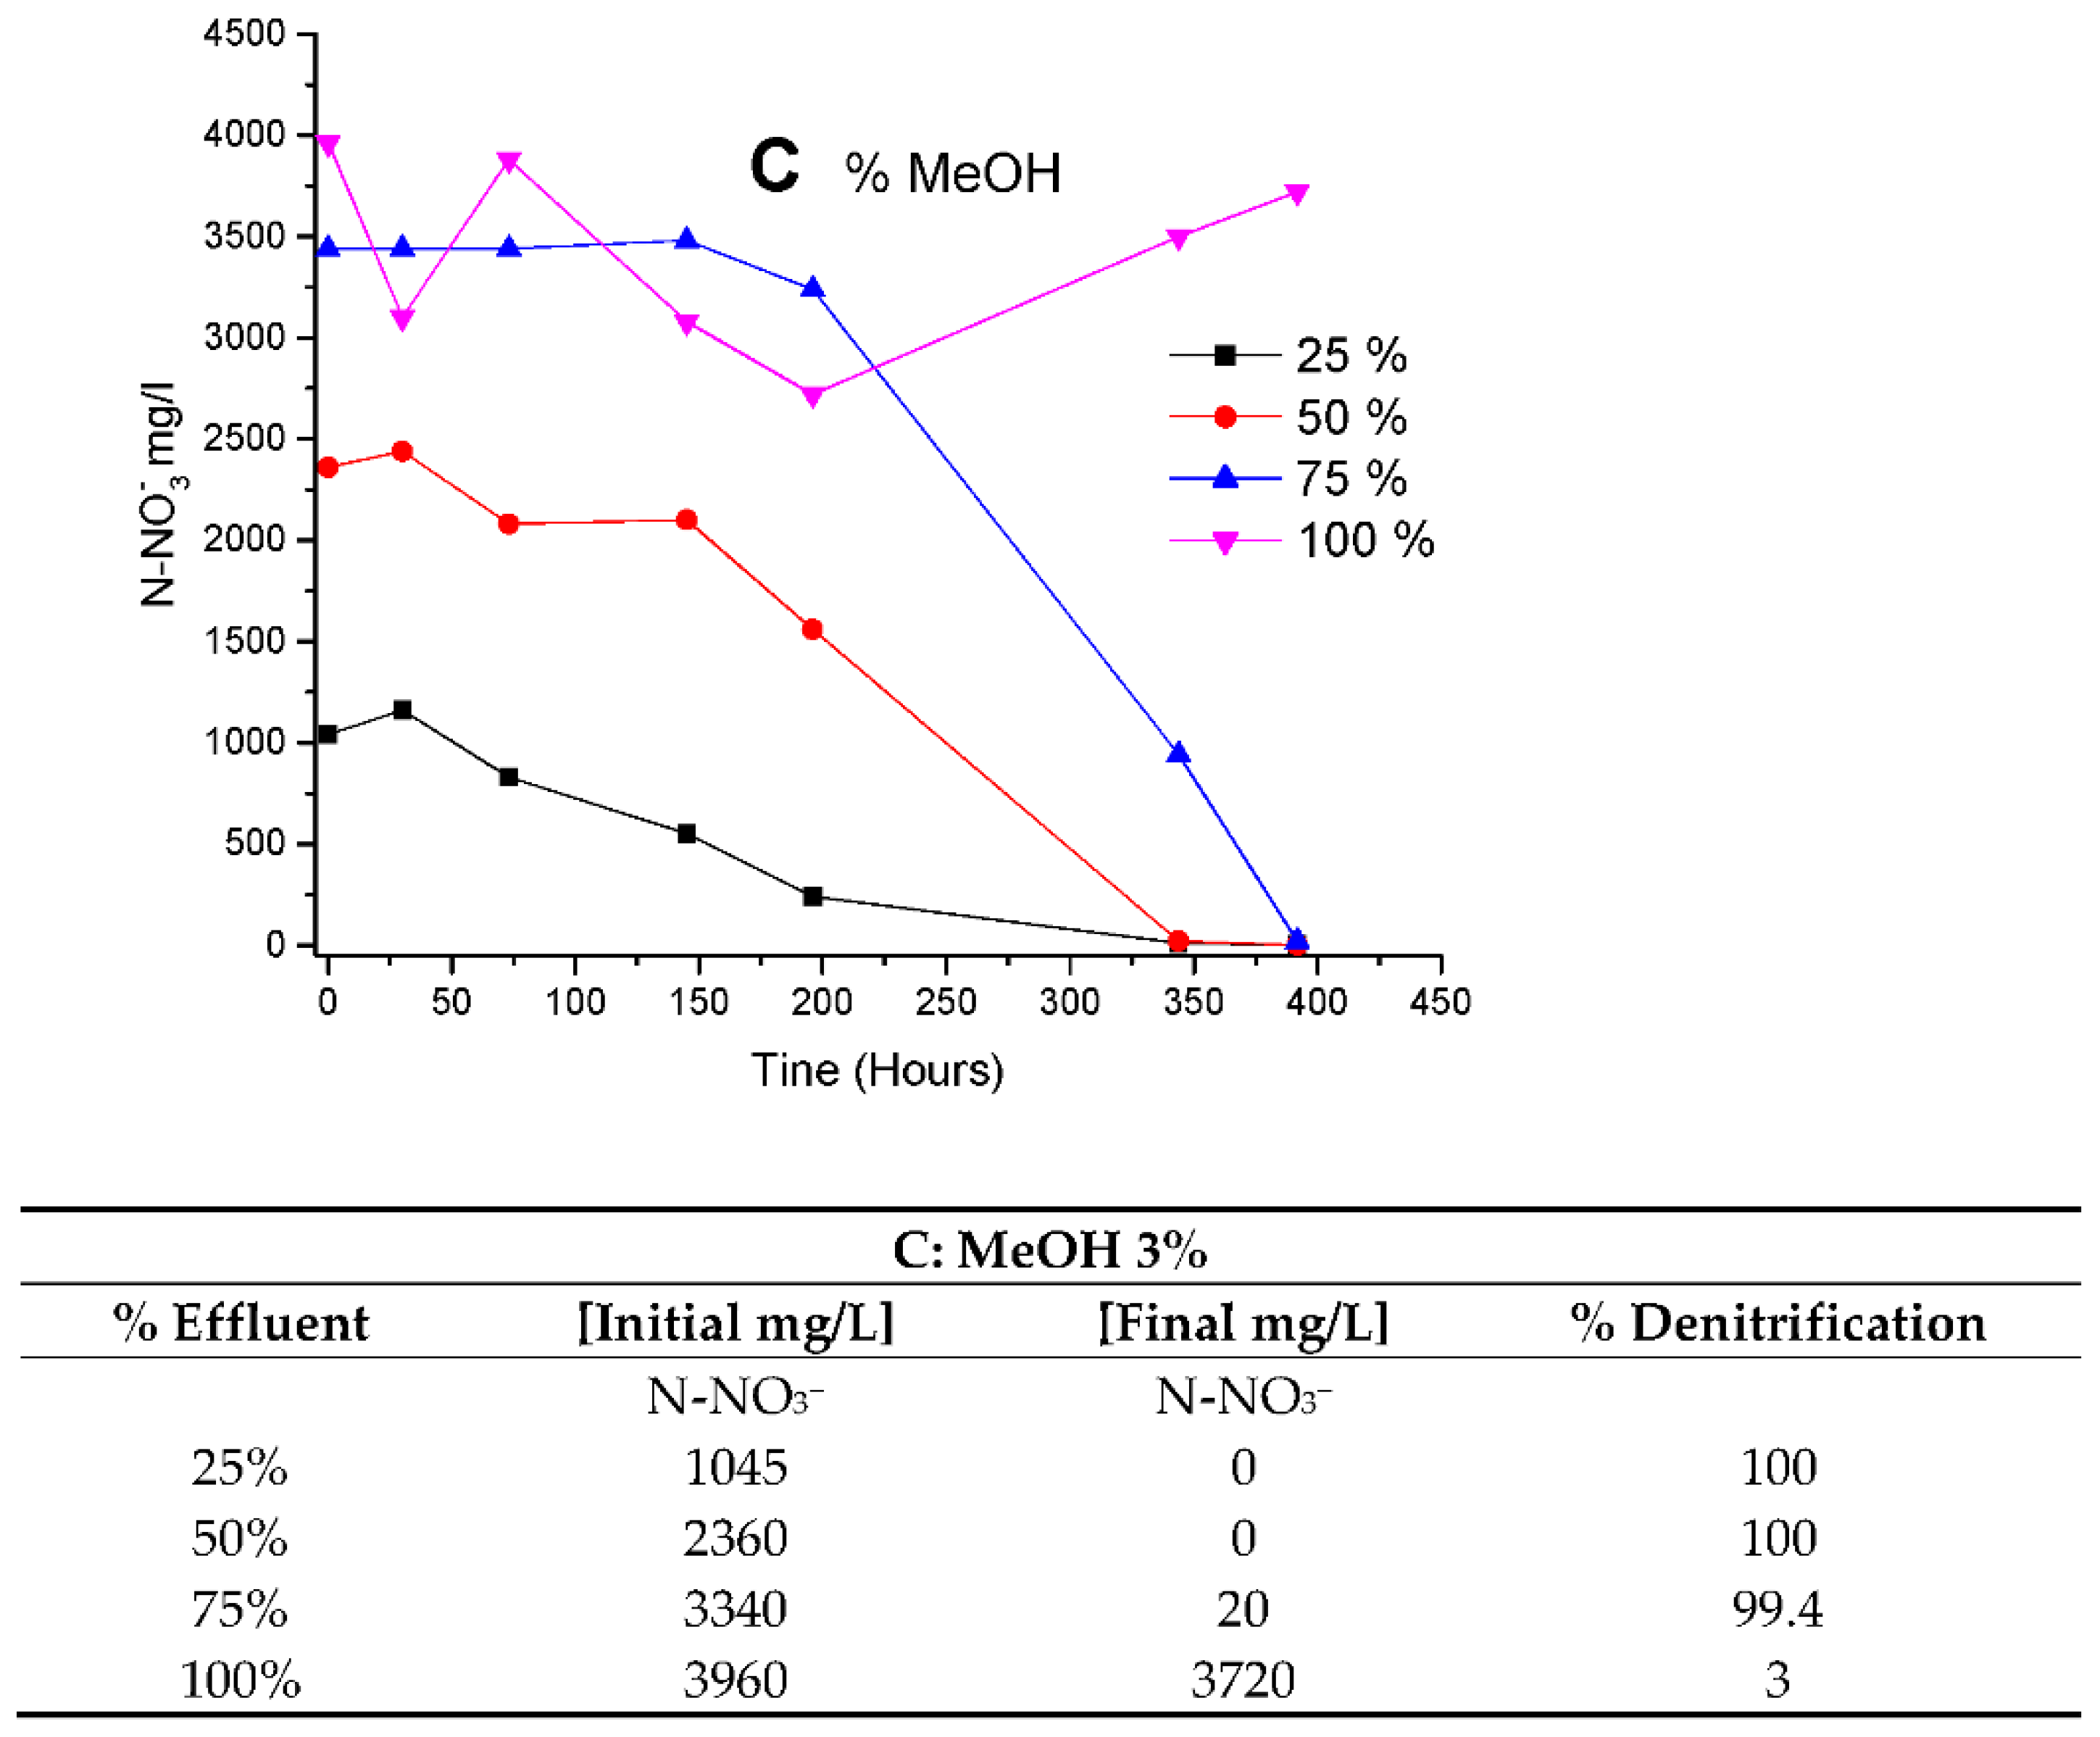
In
Figure 7, culture behavior was studied under different concentrations of BRNW. Denitrification was evaluated under different amounts of MeOH addition (0, 1 and 3% of methanol) (
Figure 7A–C, respectively).
In
Figure 7A, the limitation of carbon sources was observed at 25, 75 and 200 h for 25%, 50% and 75% of BRNW, respectively. In
Figure 7B, the same limitation was observed at 200 h in 75% and 100% and 50 y 100 h in 25% and 50%. In
Figure 7C, the limitations in carbon source were not observed.
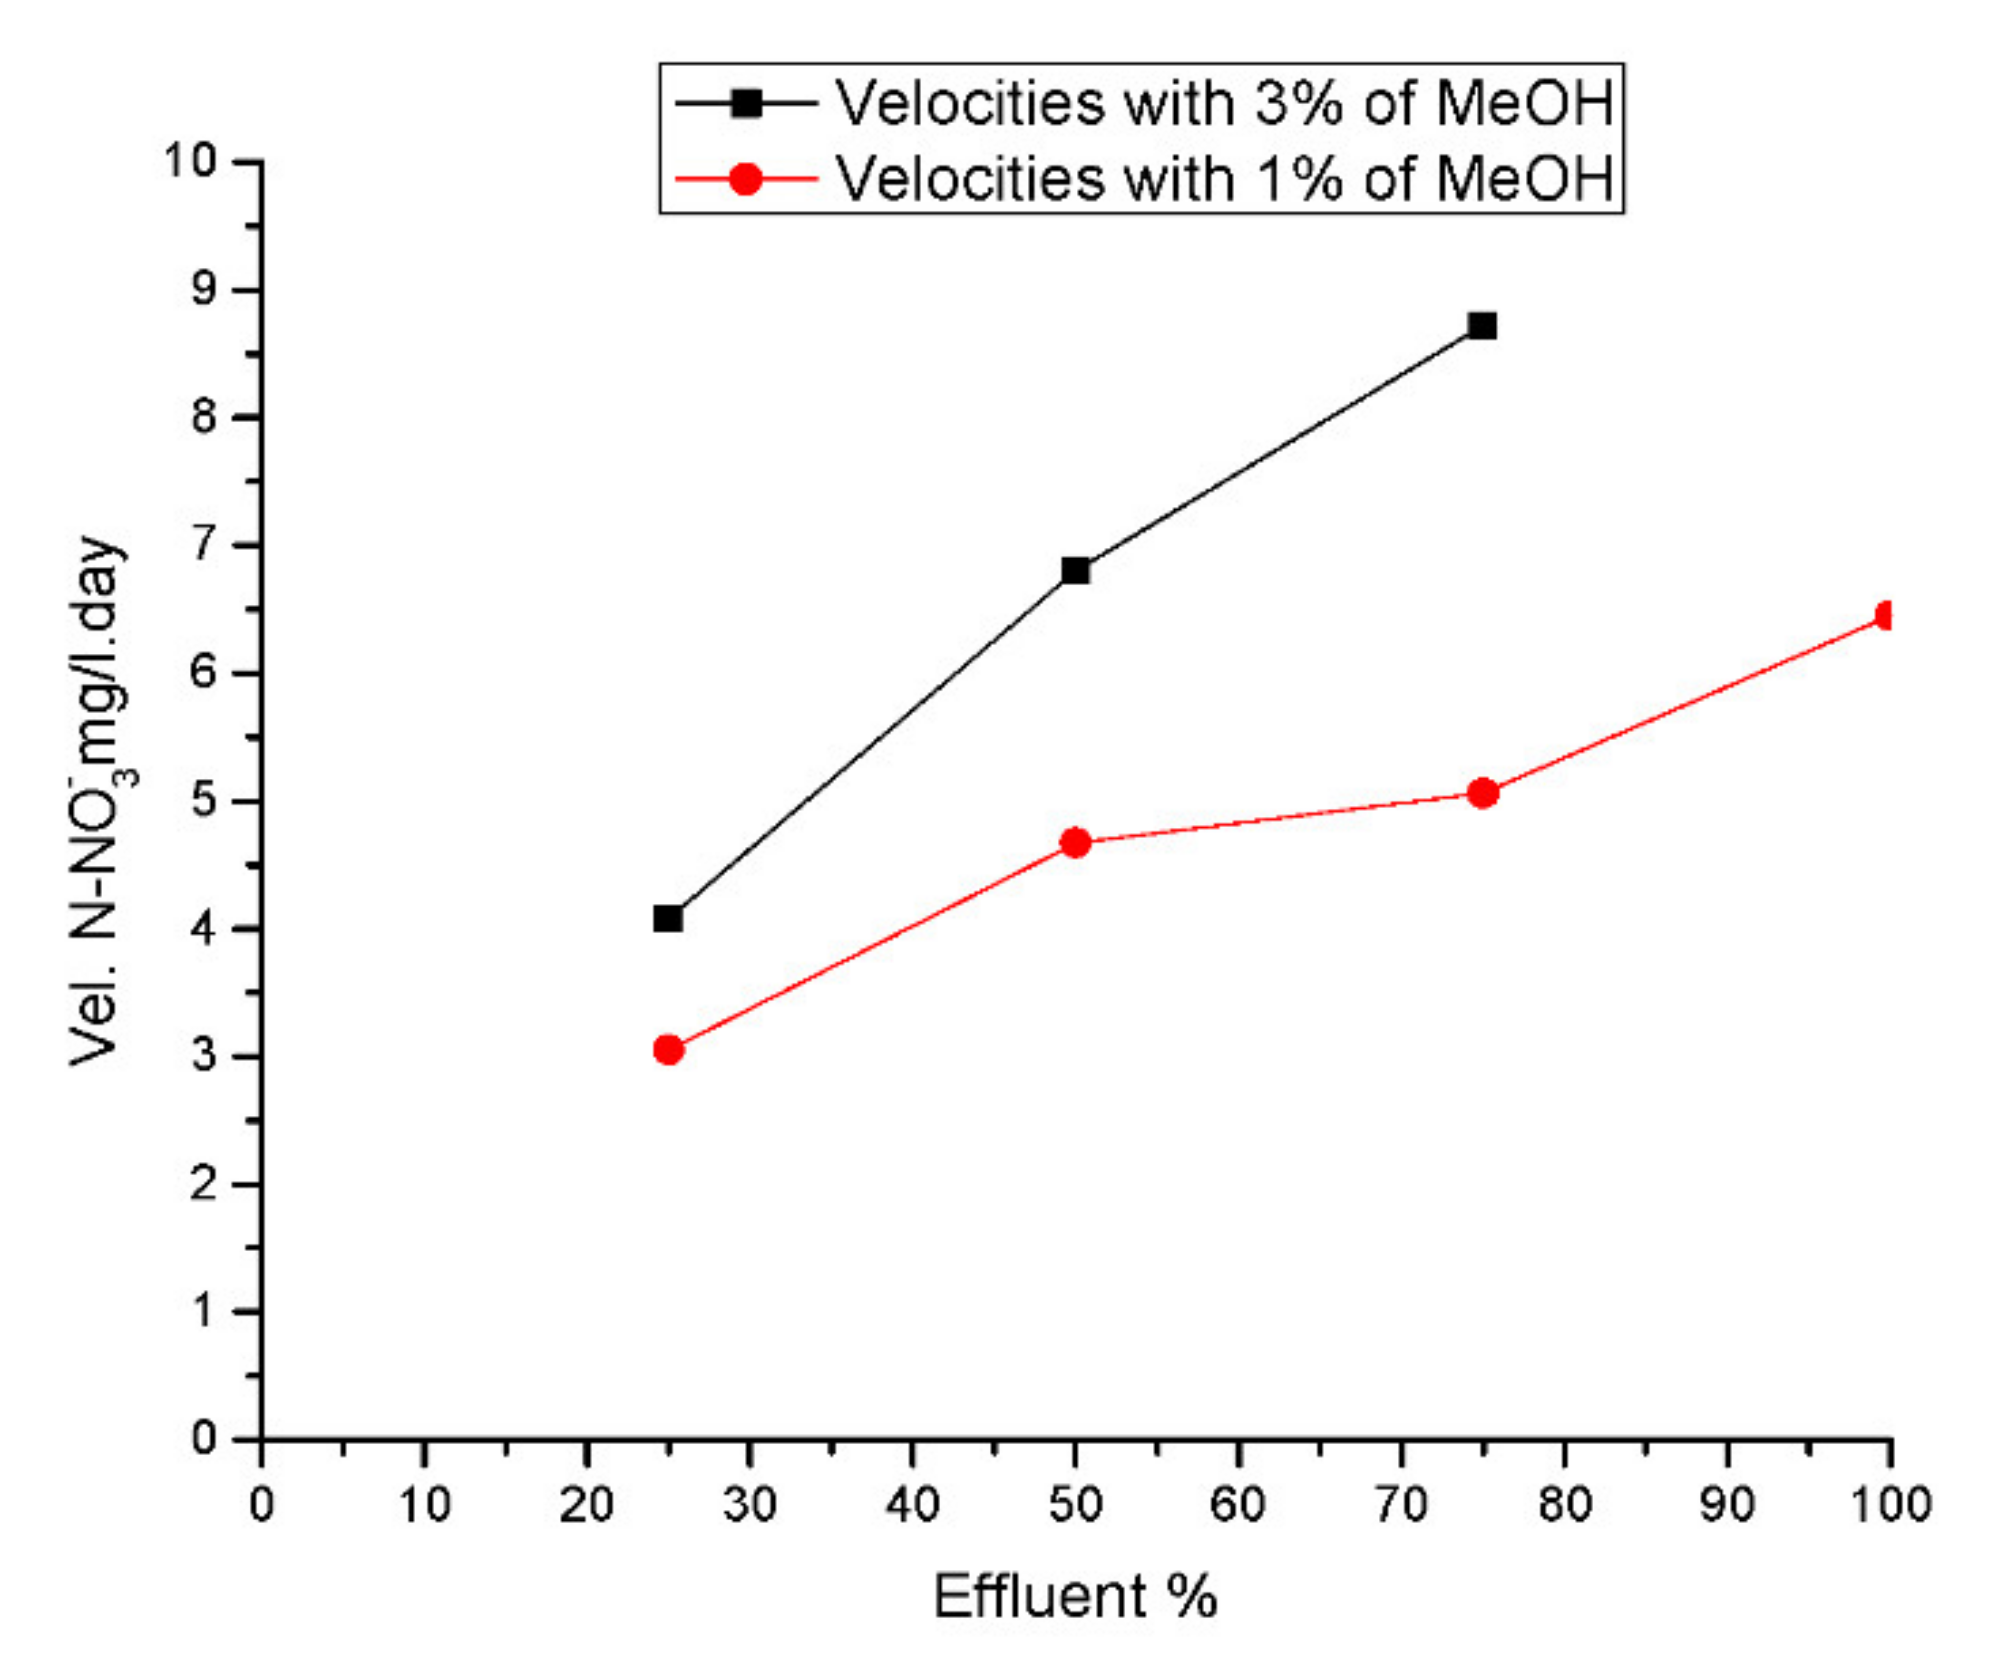
The velocities obtained were fitted as a function of the percentage of methanol and the percentage of BRNW. The results showed that the 1% MeOH (
Figure 6B) addition increased denitrification with effluents up to 75%. However, the best performance was obtained 3% MeOH addition in a 75% maximum concentration of the effluent.
Figure 8 shows the velocity comparison obtained with the addition of 1% and 3% MeOH, showing that the rate was twice as high 1% with the addition of 3% methanol measured on the nitrate removal rate.
3.4. Model Verification under Real Wastewater Using 3% MeOH
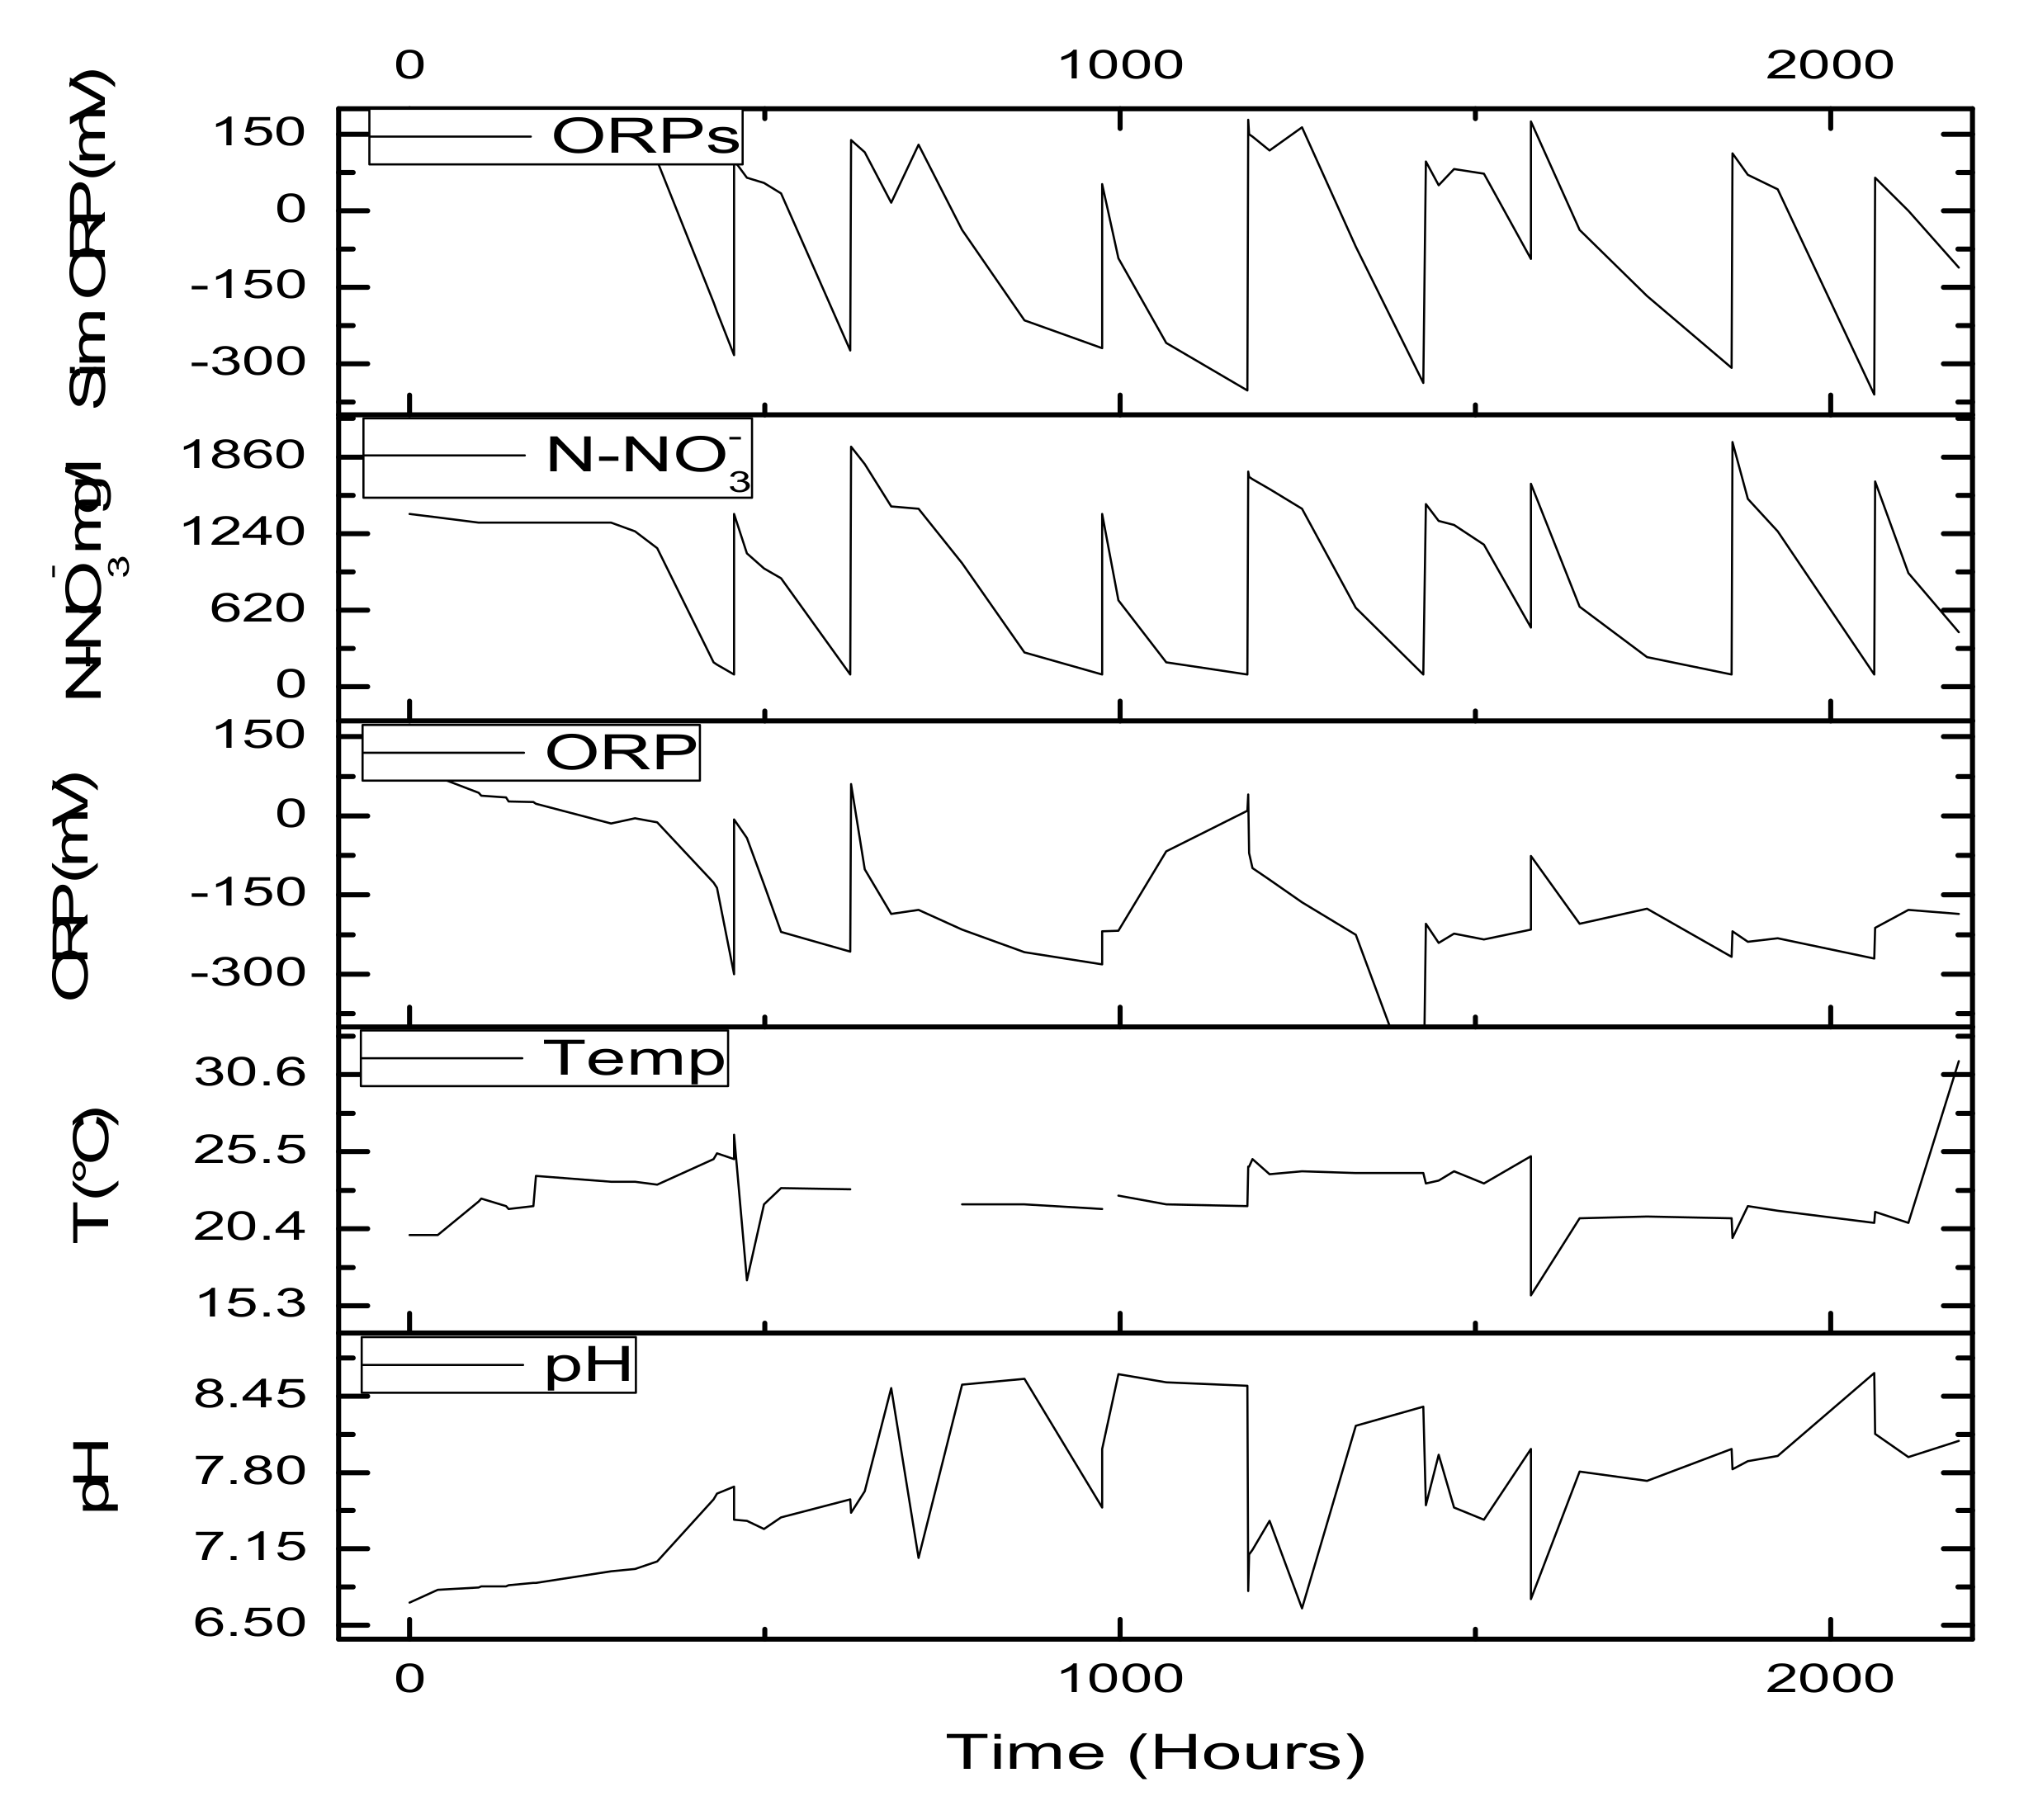
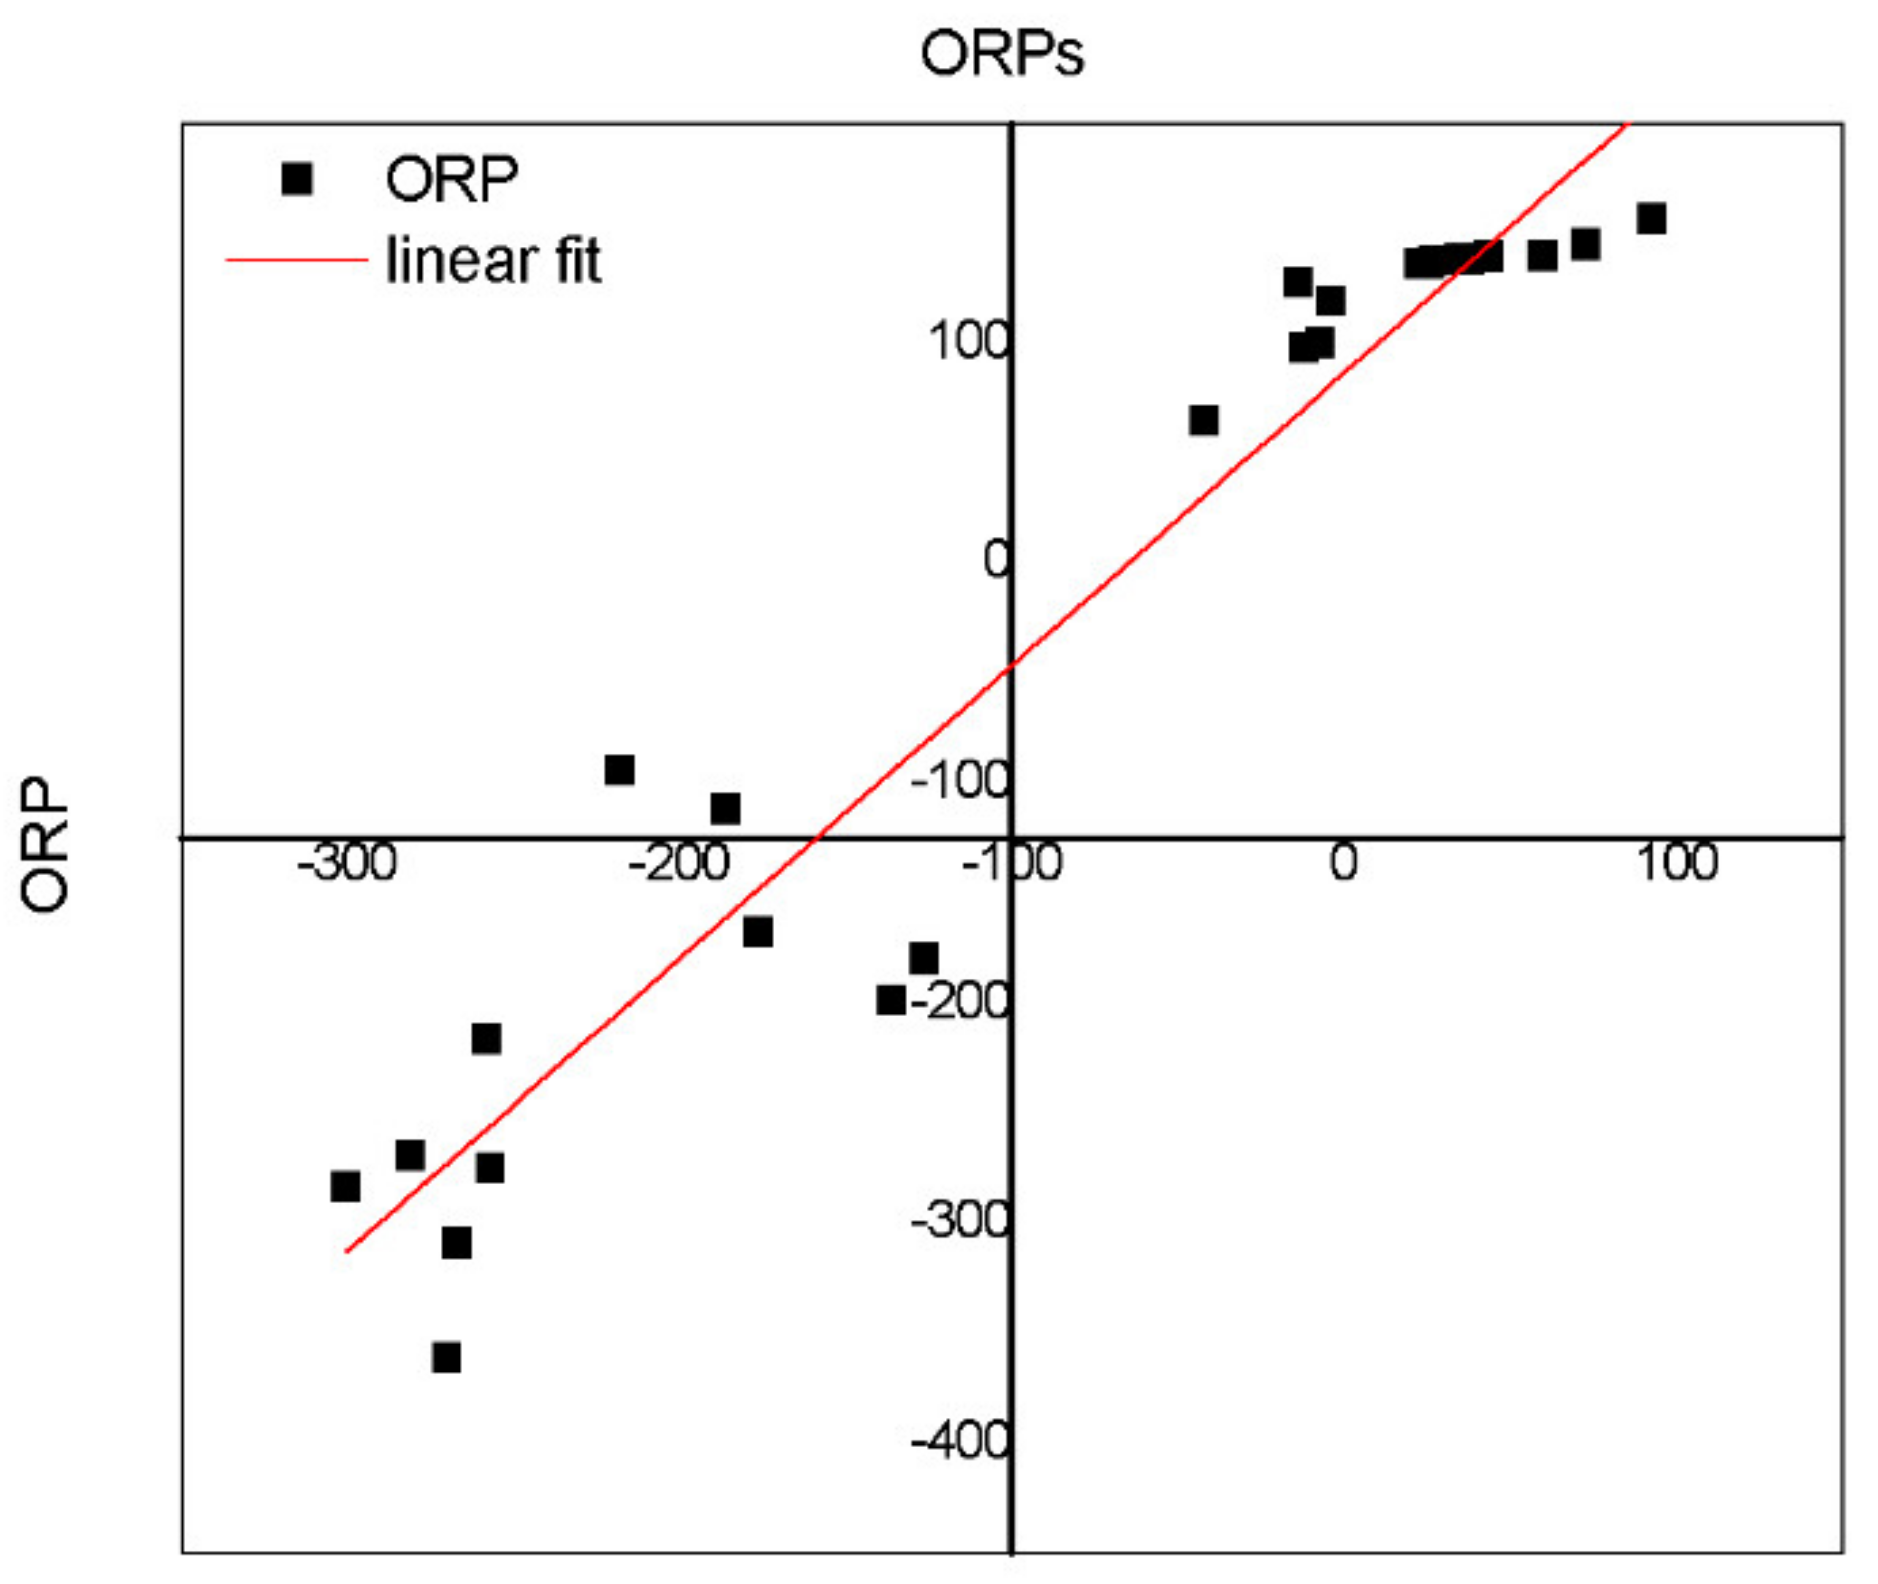
The influence of temperature and pH on denitrification is shown in
Figure 9. A variation between empirical and simulated ORP (ORPs) was observed, and it could be due high pH values (pH = 8.5). However, the model (
a″
) proved to be an adequate tool for monitoring denitrification processes and an interesting complement of the ORP regulation system.
The equation and parameters obtained were verified by comparing empirical and modeled ORP data (
Figure 10).
After N-NO3− removal, the pH signal showed an abrupt decrease caused by an absence of the production of OH− ions observed during denitrification. The ORP signal did not indicate the end of denitrification in any tests because of the higher organic substrate concentrations present in the media and the absence of nitrogen (C >> N).
The fitted experimental data (ORP) vs. simulated (ORPs) data revealed that the values are close (
Figure 9), indicating that model is capable of simulating data. However, better linearization was observed in the positive values than in the negative values. This is coincident with the data acquired during the final process (+1500 days); in this period, the biomass had great development, which could be an interference in the data acquired given that only COD was incorporated in the equation.
The optimal regulation system should record, simultaneously, both signals related to pH and ORP. Therefore, the end of denitrification should be indicated by both signals or at least by one of them. ORP and pH signals significantly depend on wastewater composition, which might differ day-by-day. As the regulation is not based on the evaluation of absolute values, both signals can be recommended for monitoring denitrification in wastewater treatment processes.
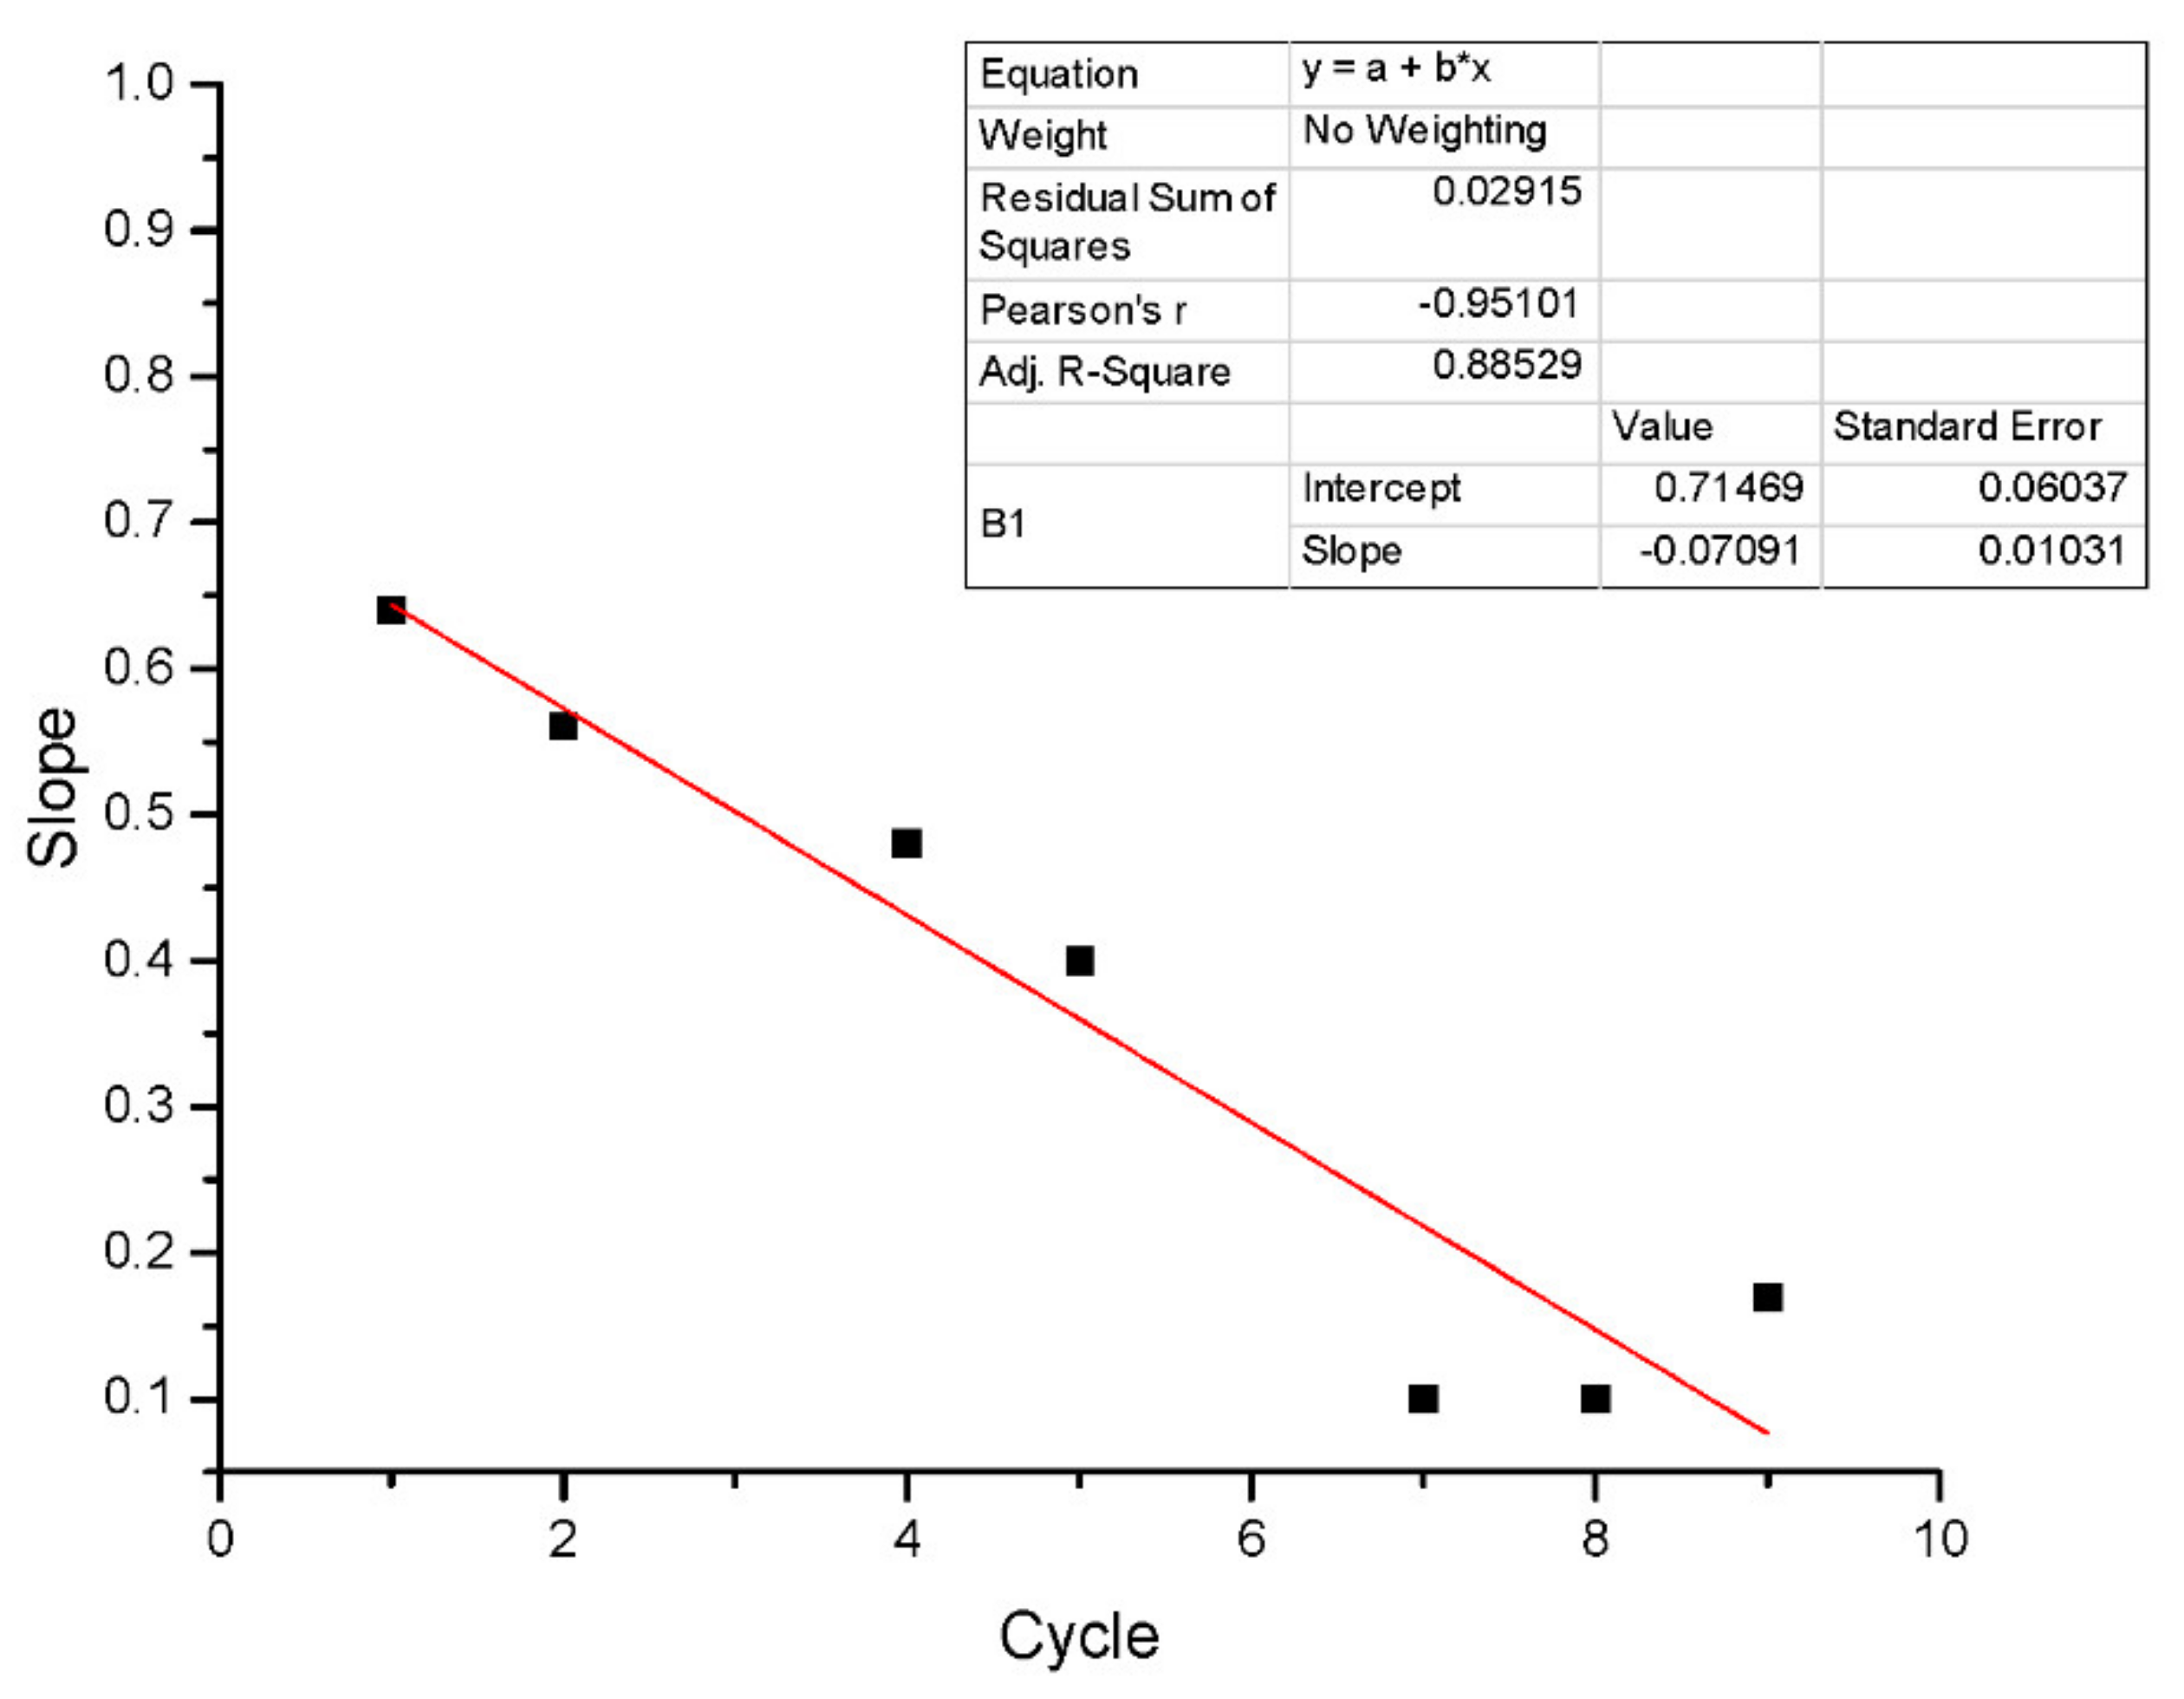
Figure 11 shows performances at different cycles. In the first cycle, the model had responded with an adjustment of 0.94 R
2 and a slope of 0.64. However, in subsequent cycles, the performance of denitrification decreased according to the effluent’s batch load. This could be due to uranium and other effluent component accumulations.
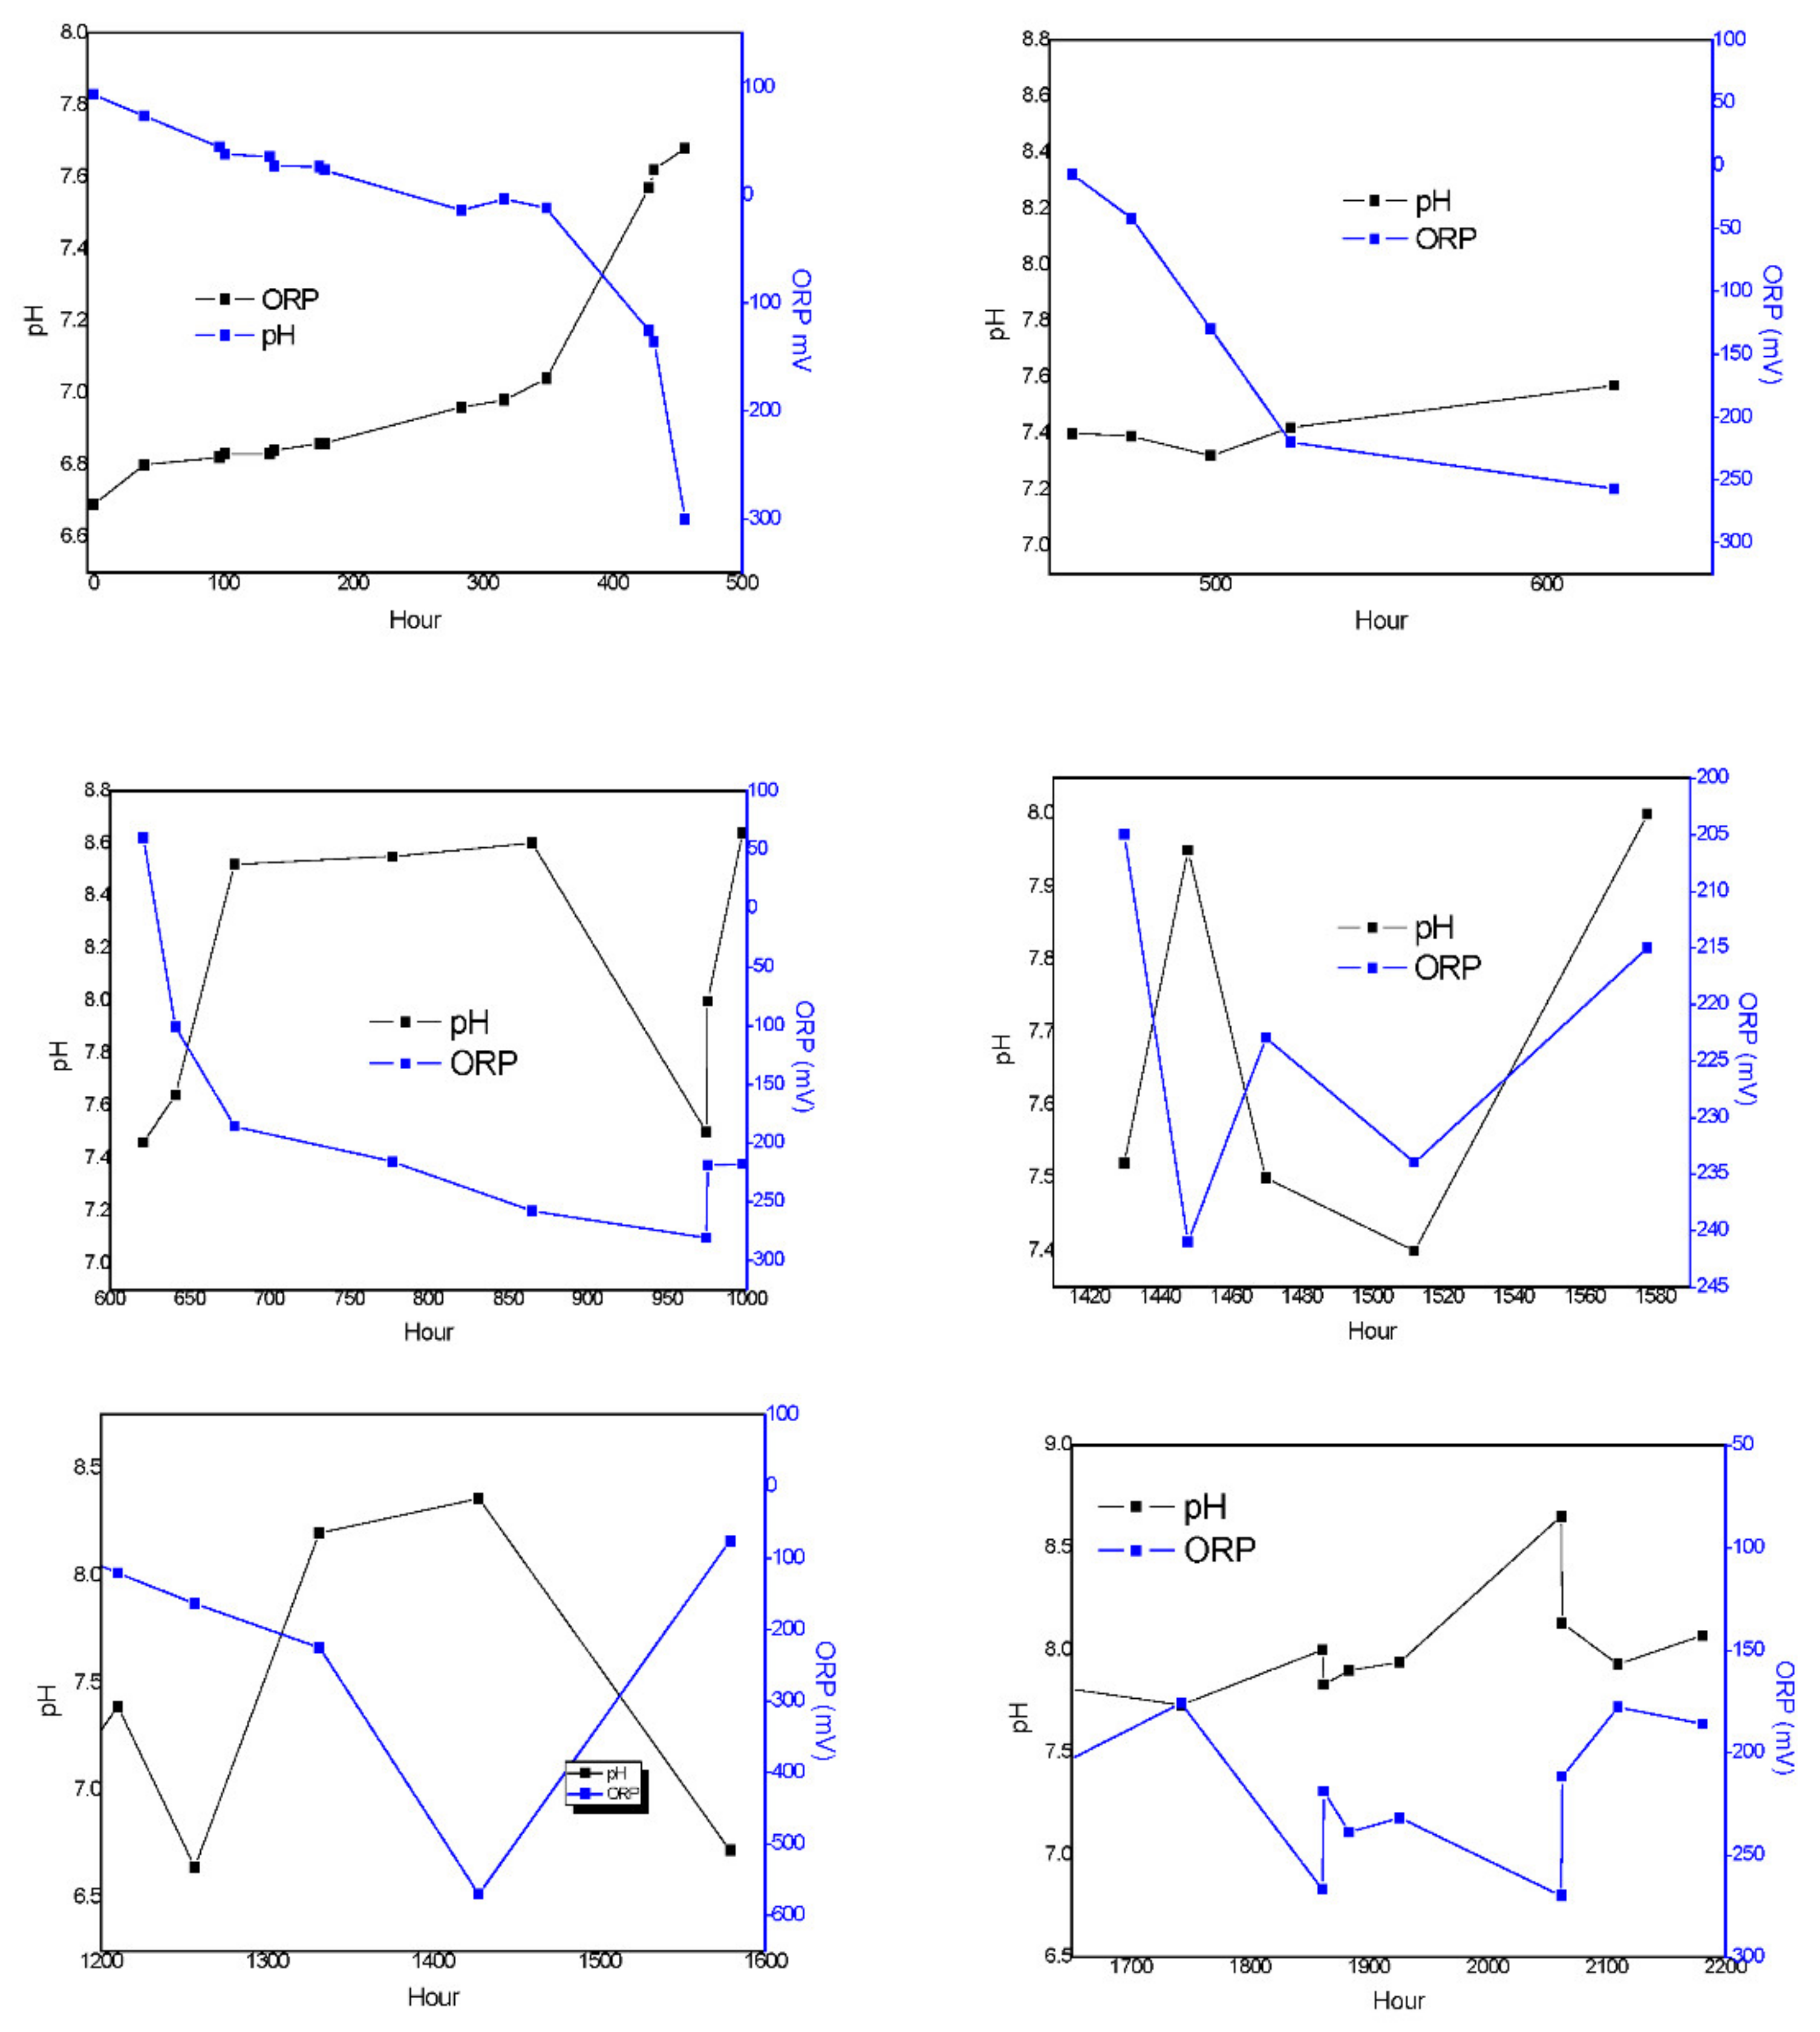
The denitrification model is mostly related (
Figure 5) to N-NO
3− concentrations; this means that the parameters could be determined with great accuracy. The pH could be estimated from the model in addition to the relationship between pH and ORP profiles during the biological process. This means that there is a possibility to achieve important information about denitrification by monitoring pH and ORP trends in anaerobic processes (
Figure 12). In particular, ORP characterizes typical operational transitions between two different conditions due to variable t COD/N ratios in the influent, and it can detect whether operational conditions are changing. The proposed methodology is a promising method to control denitrification and can add external organic carbon if the COD/N ratio is too low. However, the model’s limitations are related to when nitrate concentrations are low or when COD/biomass increases to significant values.
The functions used so far are empirical and have been calibrated for our own studies. In that sense, it is impossible to conclude what function needs to be used in future studies. The transferability of the parameters to real effluents is questionable. Detailed process descriptions of denitrification require much more input, and input is not always easy to collect.
Similar results were obtain by Luccarini [
33]: When nitrate is in excess, ORP takes positive values; the optimal relation of C/N occurs between +50 and −200 MV; and, finally, if −350 MV is measured, this means that nitrates and nitrite concentrations are insignificant. Similarly, our model showed that the model did not work in low C/N ratios and values of ORP below −200 mV.
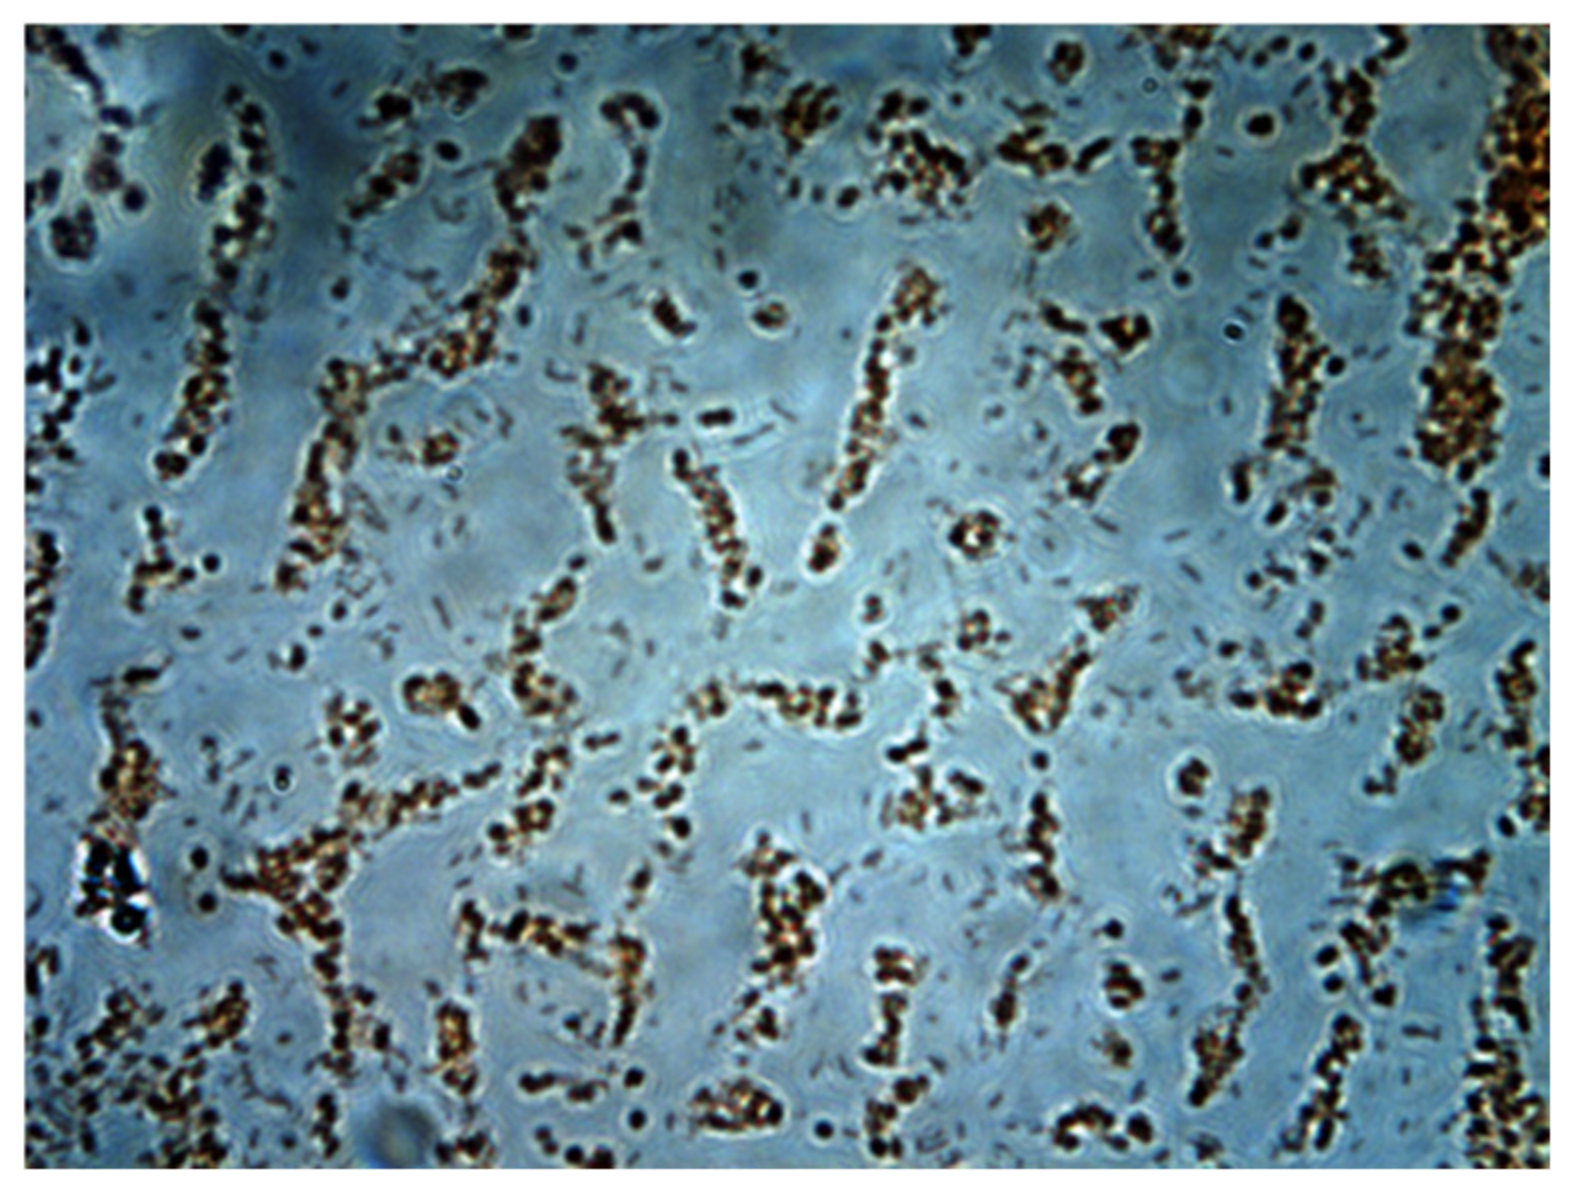
3.5. Bacterial Population Analysis
Figure 13 shows a sample taken from biofilm adhering on hydrogel carriers that were used in bacterial analysis. A gram stain of cultivable bacteria showed two morphologies. Once bacteria were isolated on the plate (EMB), the colonies were identified by biochemical test API. The API-20E multitest system identified
Pseudomonas aeuriginosa (CODE: 1-353-575) with a high identification scope and (CODE:1-000-477) compatible with
Xylosoxydans denitrificans. Additional tests, such as acetamide reactions, growth at 42 °C, the oxidative (OF) glucose test and the production of pyocyanin pigment, support the speciation of
P. aeruginosa. 3.6. Gene Expressions of NirS, NirK and NosZ
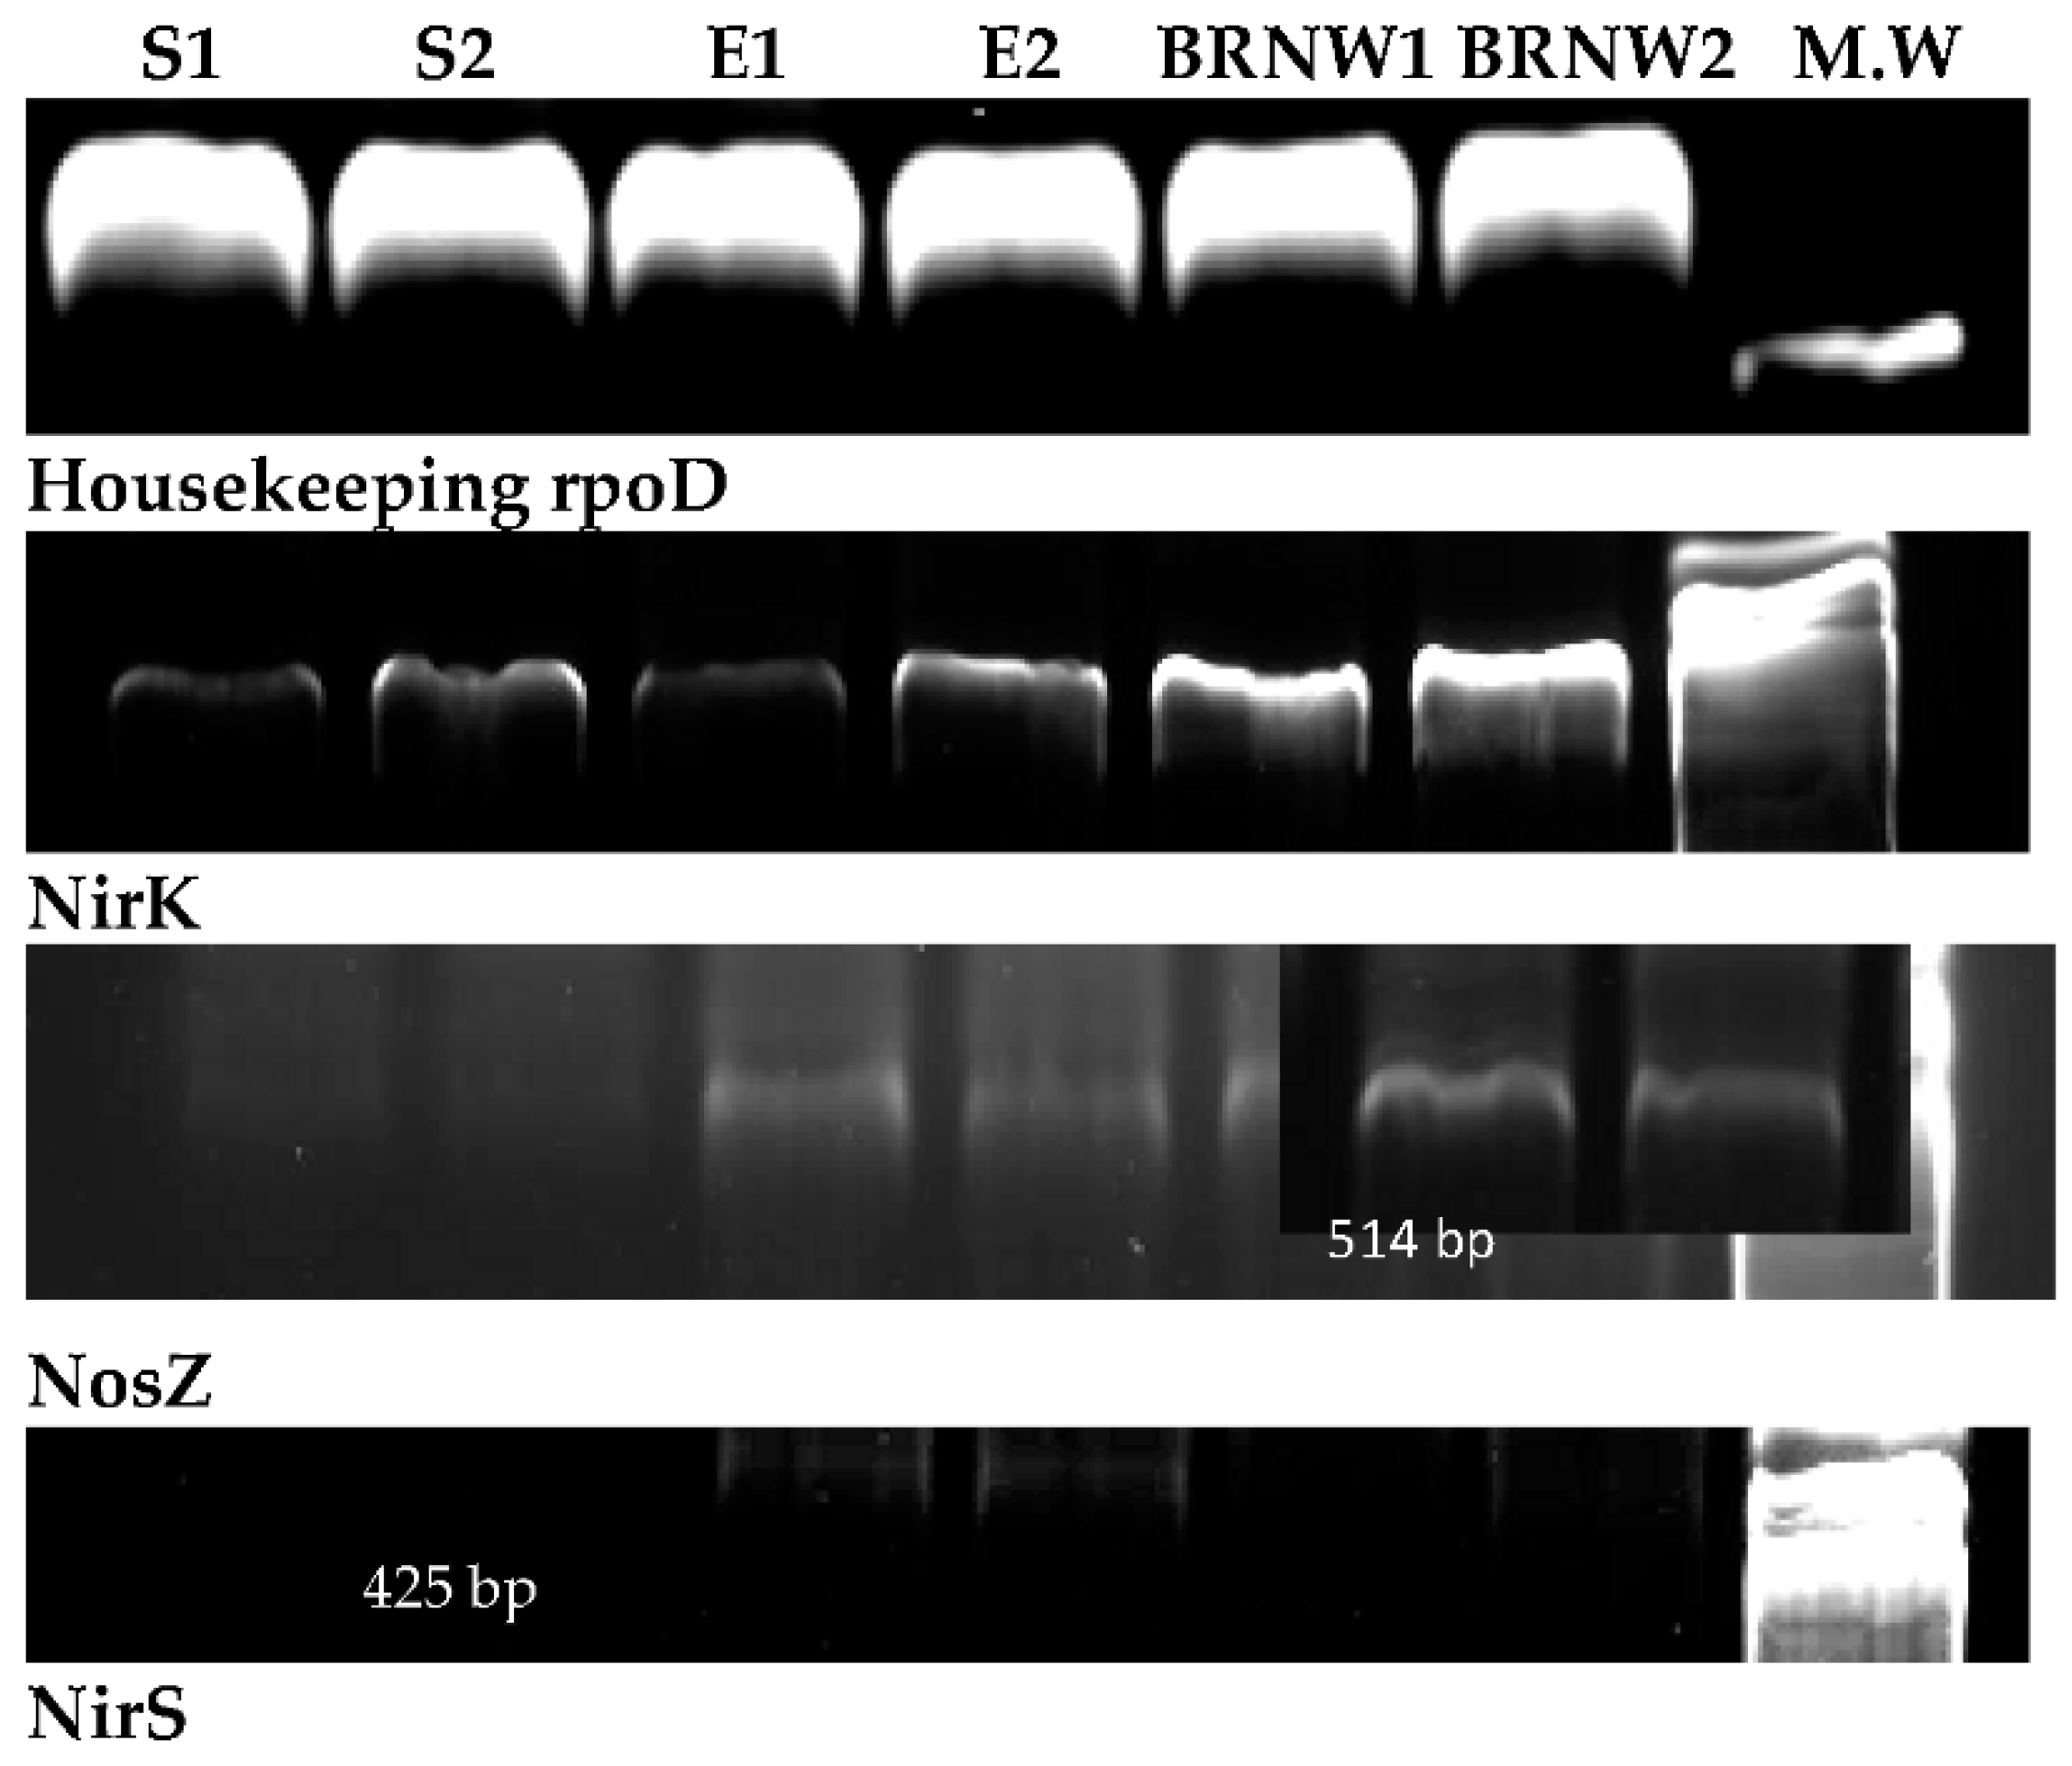
Six samples were taken and analyzed. Samples labeled as S1 and S2 correspond to samples from a synthetic medium in the presence of MeOH as the carbon source. E1 and 2 correspond to samples obtained from effluents before treatment, and BRNW 1 and 2 correspond to samples obtained from a culture in Erlenmeyer.
The extraction of mRNA for the synthesis of cDNA has been obtained in the order of 2 ug/L. This was verified by using a ratio of 260/280 nm, which guarantees a good quality cDNA that allows the amplification of the sequences of interest. It is important to mention that these methodologies are innovative for verifying the viability of bacteria present in the biofilm and the expression of the
NosZ gene. Contrarily, the differentiation of
NirK and
NirS confirms the bacterial genera. The quality and quantity of cDNA extracted are showed in
Figure 14.
The gene expression profiles for
NirK are shown in
Figure 15. A higher expression proved that bacterial cultures grew with a high yield of the denitrification process, and they were associated with
Pseudomonas spp. activities.
NosZ expression levels were similar to
NirK profiles for each of the three different samples studied. Enzyme production from
NosZ is one of the limiting processes that involved gaseous emissions (NO) in the denitrification pathway. The expression of two genes indicates that the activity of the transformation of nitric oxide to molecular nitrogen was not inhibited, avoiding the emission of greenhouse gases.
NirS was not amplificated in synthetic (S1 and S2) samples; however, it was detected in effluent (E1 and E2) samples. These negative results observed in synthetic medium (S1 and S2) could be due to Pseudomonas spp. (NirK), and it has opportunistic strategies in axenic media. However, samples from effluent contained an endogenous consortium probably from NirS. Nonetheless, Psedomonaceae did not decrease its expressions (NirK).
3.7. Uranium Determination
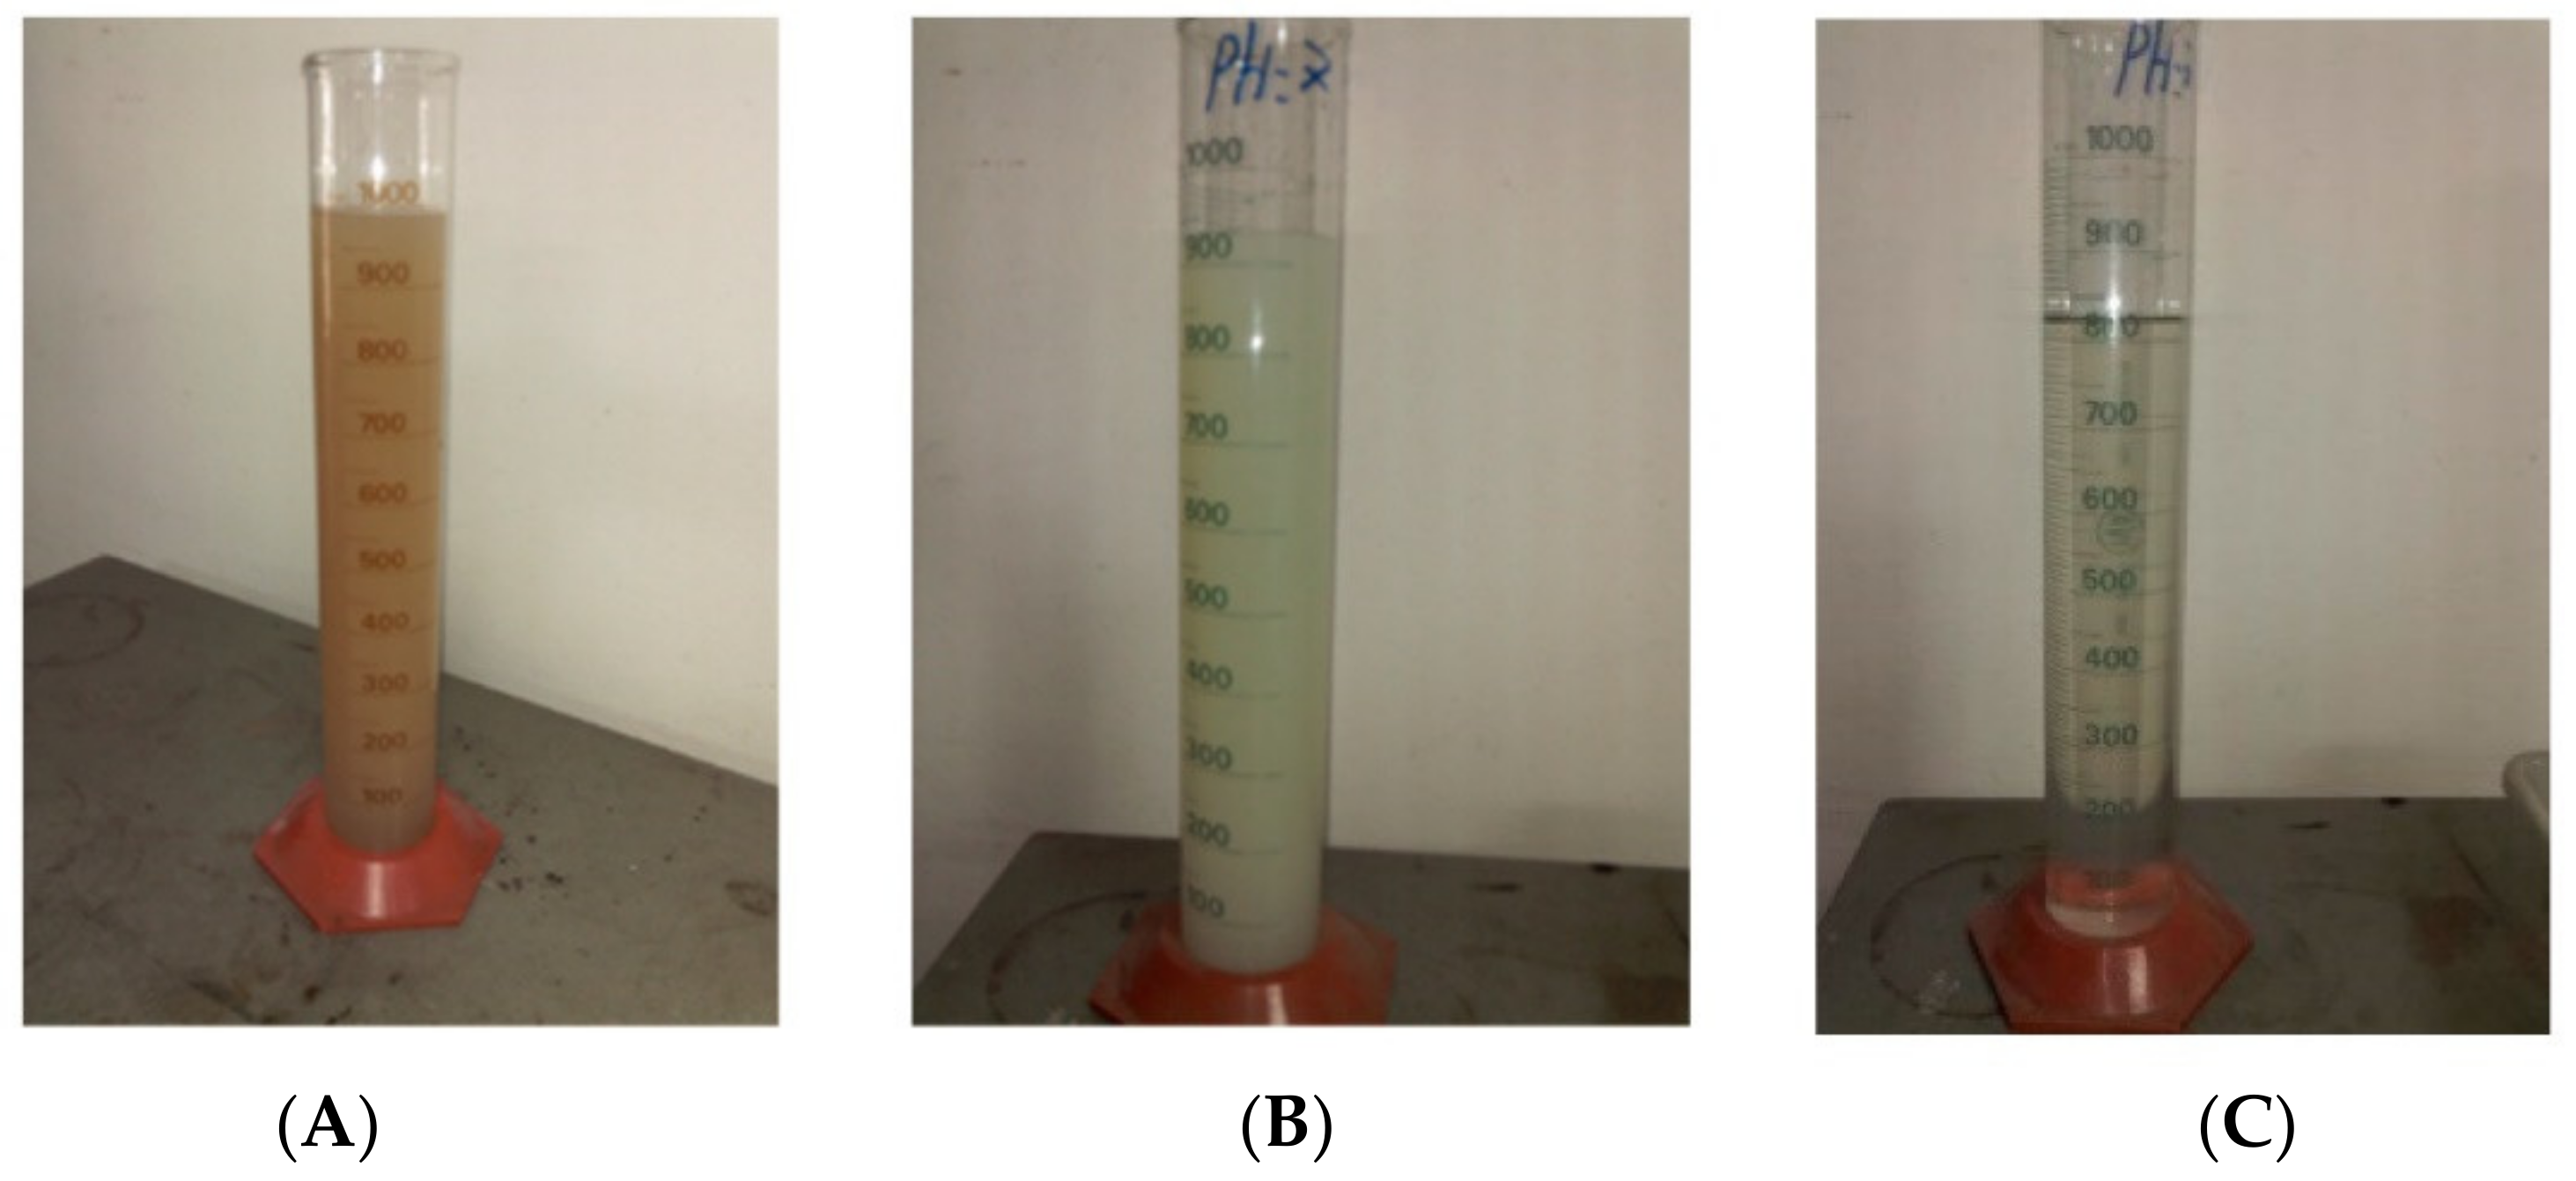
Uranium was determined at the final batch process (40 days) after biomass was precipitated using FeCl
3 (
Figure 16). The precipitated biomass was compressed in a solidified sample and then analyzed by TFRX. The effluent precipitation effect can be seen in
Figure 16, and FTRX results are shown in
Table 4.
According to the bibliography, under anaerobic conditions, the accumulation of uranium on exopolysaccharides (EPS) constitutes a defense mechanism suggesting that
Pseudomonas, in the absence of oxygen, could be capable of binding anionic hexavalent uranium complexes through EPS [
34]. Uranium interacts with the cytochromes involved in the denitrification pathway in the step of nitrate reduction. UO
2+4 reduction by bacteria is not catalyzed by specialized reductases but by redox enzymes that are normally involved in other cellular processes. Uranyl toxicity affects the synthesis of exopolysaccharide, which is correlated by two gene expressions involved in the synthesis of UDP-glucose, a building block needed to form polysaccharide glycogens.
The objective of this work was to apply a denitrification model in uranium-containing nuclear wastewater; therefore, isothermal studies and other types of techniques should be incorporated for safer treatments, and an in-depth investigation should be conducted to better understand adsorption and desorption mechanisms.
4. Conclusions
The result of the denitrification of real nuclear wastewater showed a well thought-out performance relative to nitrate removal. The model applied in this study by ORP had an acceptable relationship with empirical data, and the Hill curve showed better fit than the Monod model. This could be explained by the fact that the bacteria have two active sites, in anaerobic conditions, for nitrogen and for carbon, and the initial relation C/N changes throughout the process. This is different with respect to the aerobic culture’s condition, where one of the sites is fixed due to an excess of oxygen and the other one will change the carbon source. These results demonstrated to be good model for monitoring and controlling the process.
The mixture of the two effluent streams allowed saving steps in the entire process of effluent treatment, which represents possible cost-benefit alternative method by reducing time and cutting the cost in neutralization with chemicals (NaOH).
The quantification of NosZ expression by cDNA resulted in an interesting method to verify the lack of inhibition of this gene expression that represents greenhouse emission reductions. Bacterial identification showed that Pseudomonas was the dominant Genera Knowing that this type of bacteria has strong adaptation capacities and growth under different stress conditions, it is a promising alternative to scale up the process in order to remove nitrate from complex effluents with uranium from nuclear facilities.


