
The Effect of Rough Rigid Apron on Scour Downstream of Sluice Gates
by
 , , , and
Mohammad Aamir
1,* ,
,
Zulfequar Ahmad
2,
Manish Pandey
3 ,
,
Mohammad Amir Khan
4,
Ali Aldrees
5 and
Abdullah Mohamed
6 1
Department of Civil Engineering, Chaitanya Bharathi Institute of Technology, Hyderabad 500075, India
2
Department of Civil Engineering, Indian Institute of Technology Roorkee, Roorkee 247667, India
3
Department of Civil Engineering, National Institute of Technology Warangal, Warangal 506004, India
4
Department of Civil Engineering, Galgotias College of Engineering and Technology, Greater Noida 201306, India
5
Department of Civil Engineering, College of Engineering, Prince Sattam Bin Abdulaziz University, Al-Kharj 16273, Saudi Arabia
6
Research Centre, Future University in Egypt, New Cairo 11835, Egypt
*
Author to whom correspondence should be addressed.
Water 2022, 14(14), 2223; https://doi.org/10.3390/w14142223
Submission received: 31 May 2022
/
Revised: 30 June 2022
/
Accepted: 6 July 2022
/
Published: 14 July 2022
(This article belongs to the Special Issue Advances in Experimental Hydraulics, Coast and Ocean Hydrodynamics)
Abstract
:Presented in this paper is an experimental study on scour downstream of rough and smooth stiff aprons under the influence of wall jets. The effect of various parameters on asymptotic scour depth is studied. The analysis of data reveals that maximum scour depth reduces with increasing sediment size, sluice opening, and apron length. It is directly proportional to densimetric Froude number. Maximum equilibrium scour depth initially decreases with increasing tailwater level (up to a minimum), but thereafter an increase is observed. The effect of roughness of stiff apron on scour is studied and quantification of decline in maximum scour depth due to roughness is carried out. Scour profiles and their temporal variation are also studied. A regression-based equation to predict equilibrium scour depth under smooth and rough apron is proposed, which conforms to experimental data. Based on the conclusions of this study, it is recommended to use roughness over the surface of stiff apron to confine scour under-wall jets.
1. Introduction
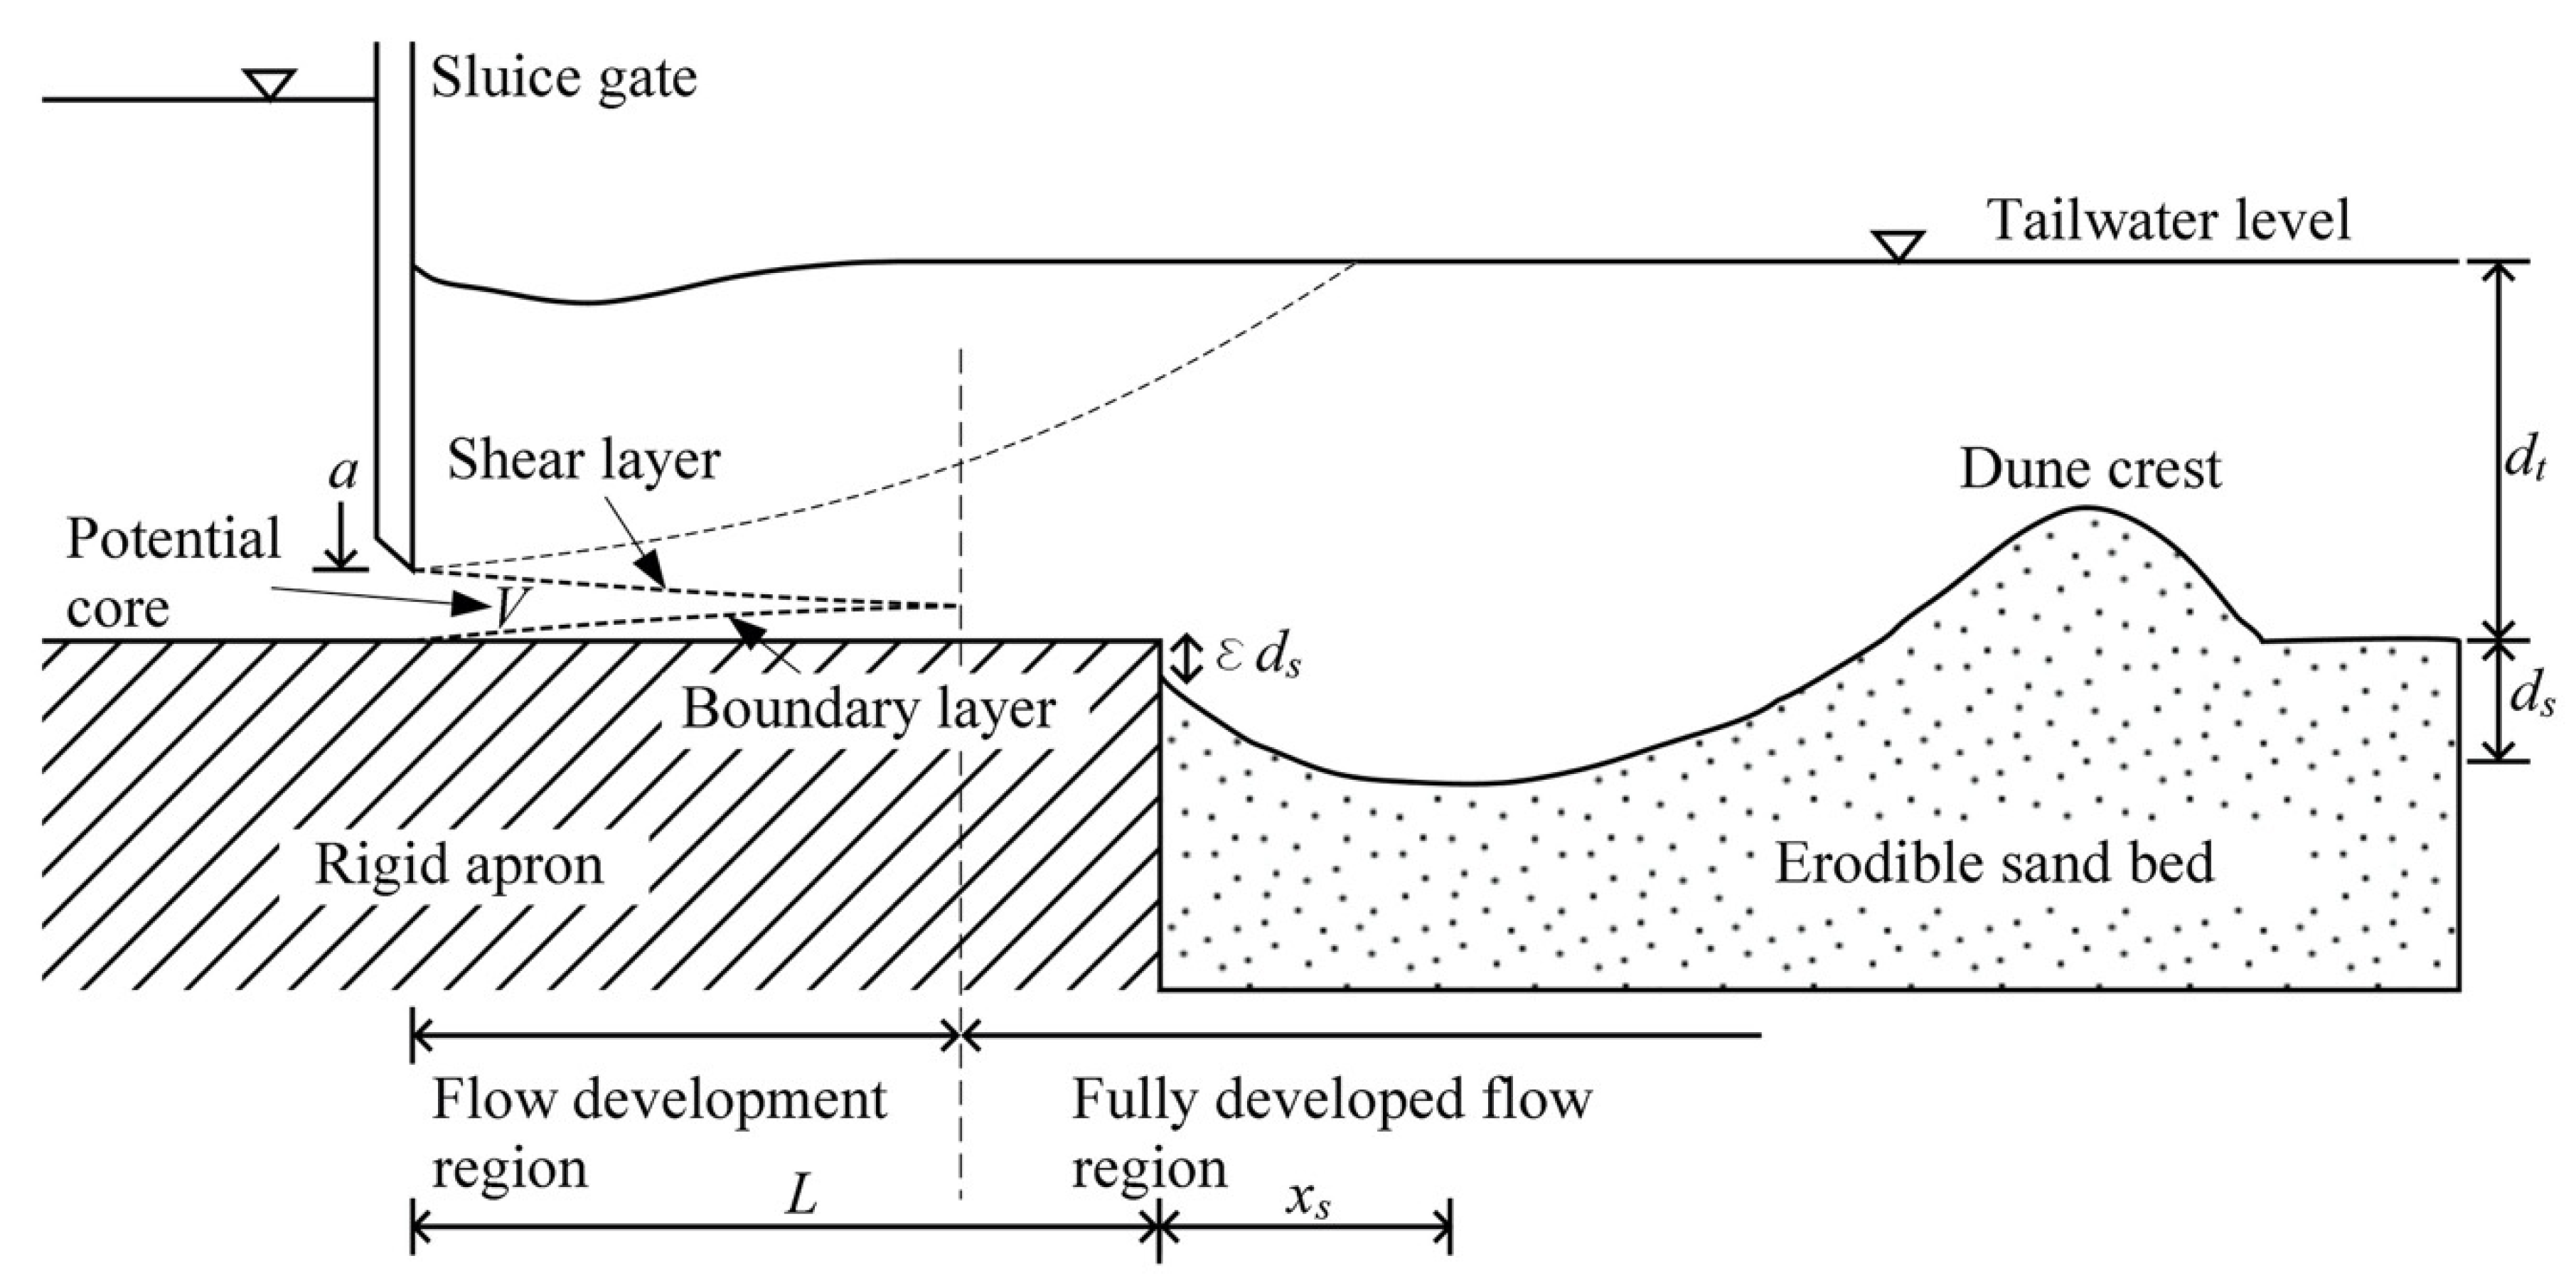
Scour around hydraulic structures exposes their foundation, thereby risking the life of the structure as exposed foundations are prone to damage and failure. Wall jets are 2D jets with a high breadth to depth ratio and develop when the flow passes through a sluice opening or downstream of a slab culvert. In most of the cases, a stiff or rigid apron is constructed immediately on the downstream side of the sluice gate, over which the jet travels prior to meeting the removable sediment bed, over which the erosion process is initiated. In some cases, a launching apron is provided as a protection measure against scour. A scour hole is developed adjacent to the stiff apron, followed by a ridge development as the scouring capacity of the jet diminishes as it moves away from the sluice gate. Figure 1 illustrates a schematic of the scour hole and ridge development beneath a two-dimensional wall jet developed from the opening of a sluice gate. In Figure 1, V represents the issuing jet velocity, which is the average velocity of the jet as it emerges from the slit of the sluice gate; x and y are streamwise and vertical distances, respectively, from the downstream end of the stiff apron; a is the slit or opening of the sluice gate; L is the span of the stiff apron from the sluice opening; ds is the equilibrium scour depth; dt is the tailwater depth; and xs is the extent from the end of the stiff apron to the equilibrium scour depth.
After pioneering investigations by Rouse [1], a number of researchers have investigated scour due to wall jets [2,3,4]. Carstens [5] examined the data obtained experimentally by Laursen [2] on scour under-wall jets and proposed an equation for the rate of sediment transport. Scour caused by 2D horizontal submerged jets and plane turbulent jets has also been investigated experimentally [6,7,8,9]. The distributions of velocity inside of an inflexible model of scour hole were also investigated experimentally [10]. Ali and Lim [11] theoretically obtained the distributions of velocity within the scour holes. The influence of gradation of sediment and corrugated apron on scour have been studied, and the reduction in the maximum depth of scour by the coarsened apron due to corrugation have been investigated [12,13,14]. The minimum decline in the depth of scour caused by a corrugated apron was 59% for the highest value of densimetric Froude number (Fd = 12.78) and the lowest value of roughness (ks = 1 mm) [13]. For the highest value of roughness (ks = 5 mm), the least drop in the depth of scour was 93%, in comparison with a smooth apron. The average values of decrease in the length of the scour hole and the maximum scour depth for fine sand were 30.2% and 63.4%, respectively; whereas for coarse sand, these values were 44.2% and 20.6%, respectively [14]. Average decrease in the value of maximum scour depth under a launching apron was calculated to be 39%, having a minimum of 16.2% and a maximum of 57.3% [15]. Empirical equations were obtained for characteristic lengths of scour hole in non-uniform and uniform sediments, and guidelines were provided for designing a launching apron [16]. Aamir and Ahmad [17,18] investigated experimentally the characteristics of submerged jets causing scour downstream of an apron and developed an empirical equation for the prediction of equilibrium scour depth. Recently, researchers used soft-computing techniques to predict scour downstream of sluice gates and other hydraulic structures [19,20,21,22,23,24]. Aamir and Ahmad [25] put forth a review of scour under plane two-dimensional wall jets. Muller and Chanson [26] compared air entrapment in vertical plunging jets with that in the horizontal hydraulic jump. Aamir and Ahmad [27] investigated the flow characteristics of 2D horizontal jets and subsequent scour, and analyzed the effect of roughness of stiff apron on such characteristics. Studies have also been carried out to study the flow pattern and scour around other hydraulic structures [28,29,30,31,32,33]. It is quite evident that the primary emphasis of investigation has been the examination of flow characteristics and derivation of empirical equations for different parameters related to scour under 2D horizontal jets. However, the constriction of scour to avert damage to the foundation, and hence stability, of the hydraulic structure, especially in the case of wall jets, is a huge concern for engineers [34], which largely remains untouched.
The present work investigates the pattern and magnitude of scour downstream of a stiff apron under the influence of 2D horizontal jets and provides a solution to the existing problem of persistent scouring by creating roughness over the stiff apron, which has not been addressed extensively in previous studies. A prediction equation for maximum equilibrium scour depth downstream of a smooth and rough apron is developed using dimensional analysis and experimental data from the present study.
2. Materials and Methods
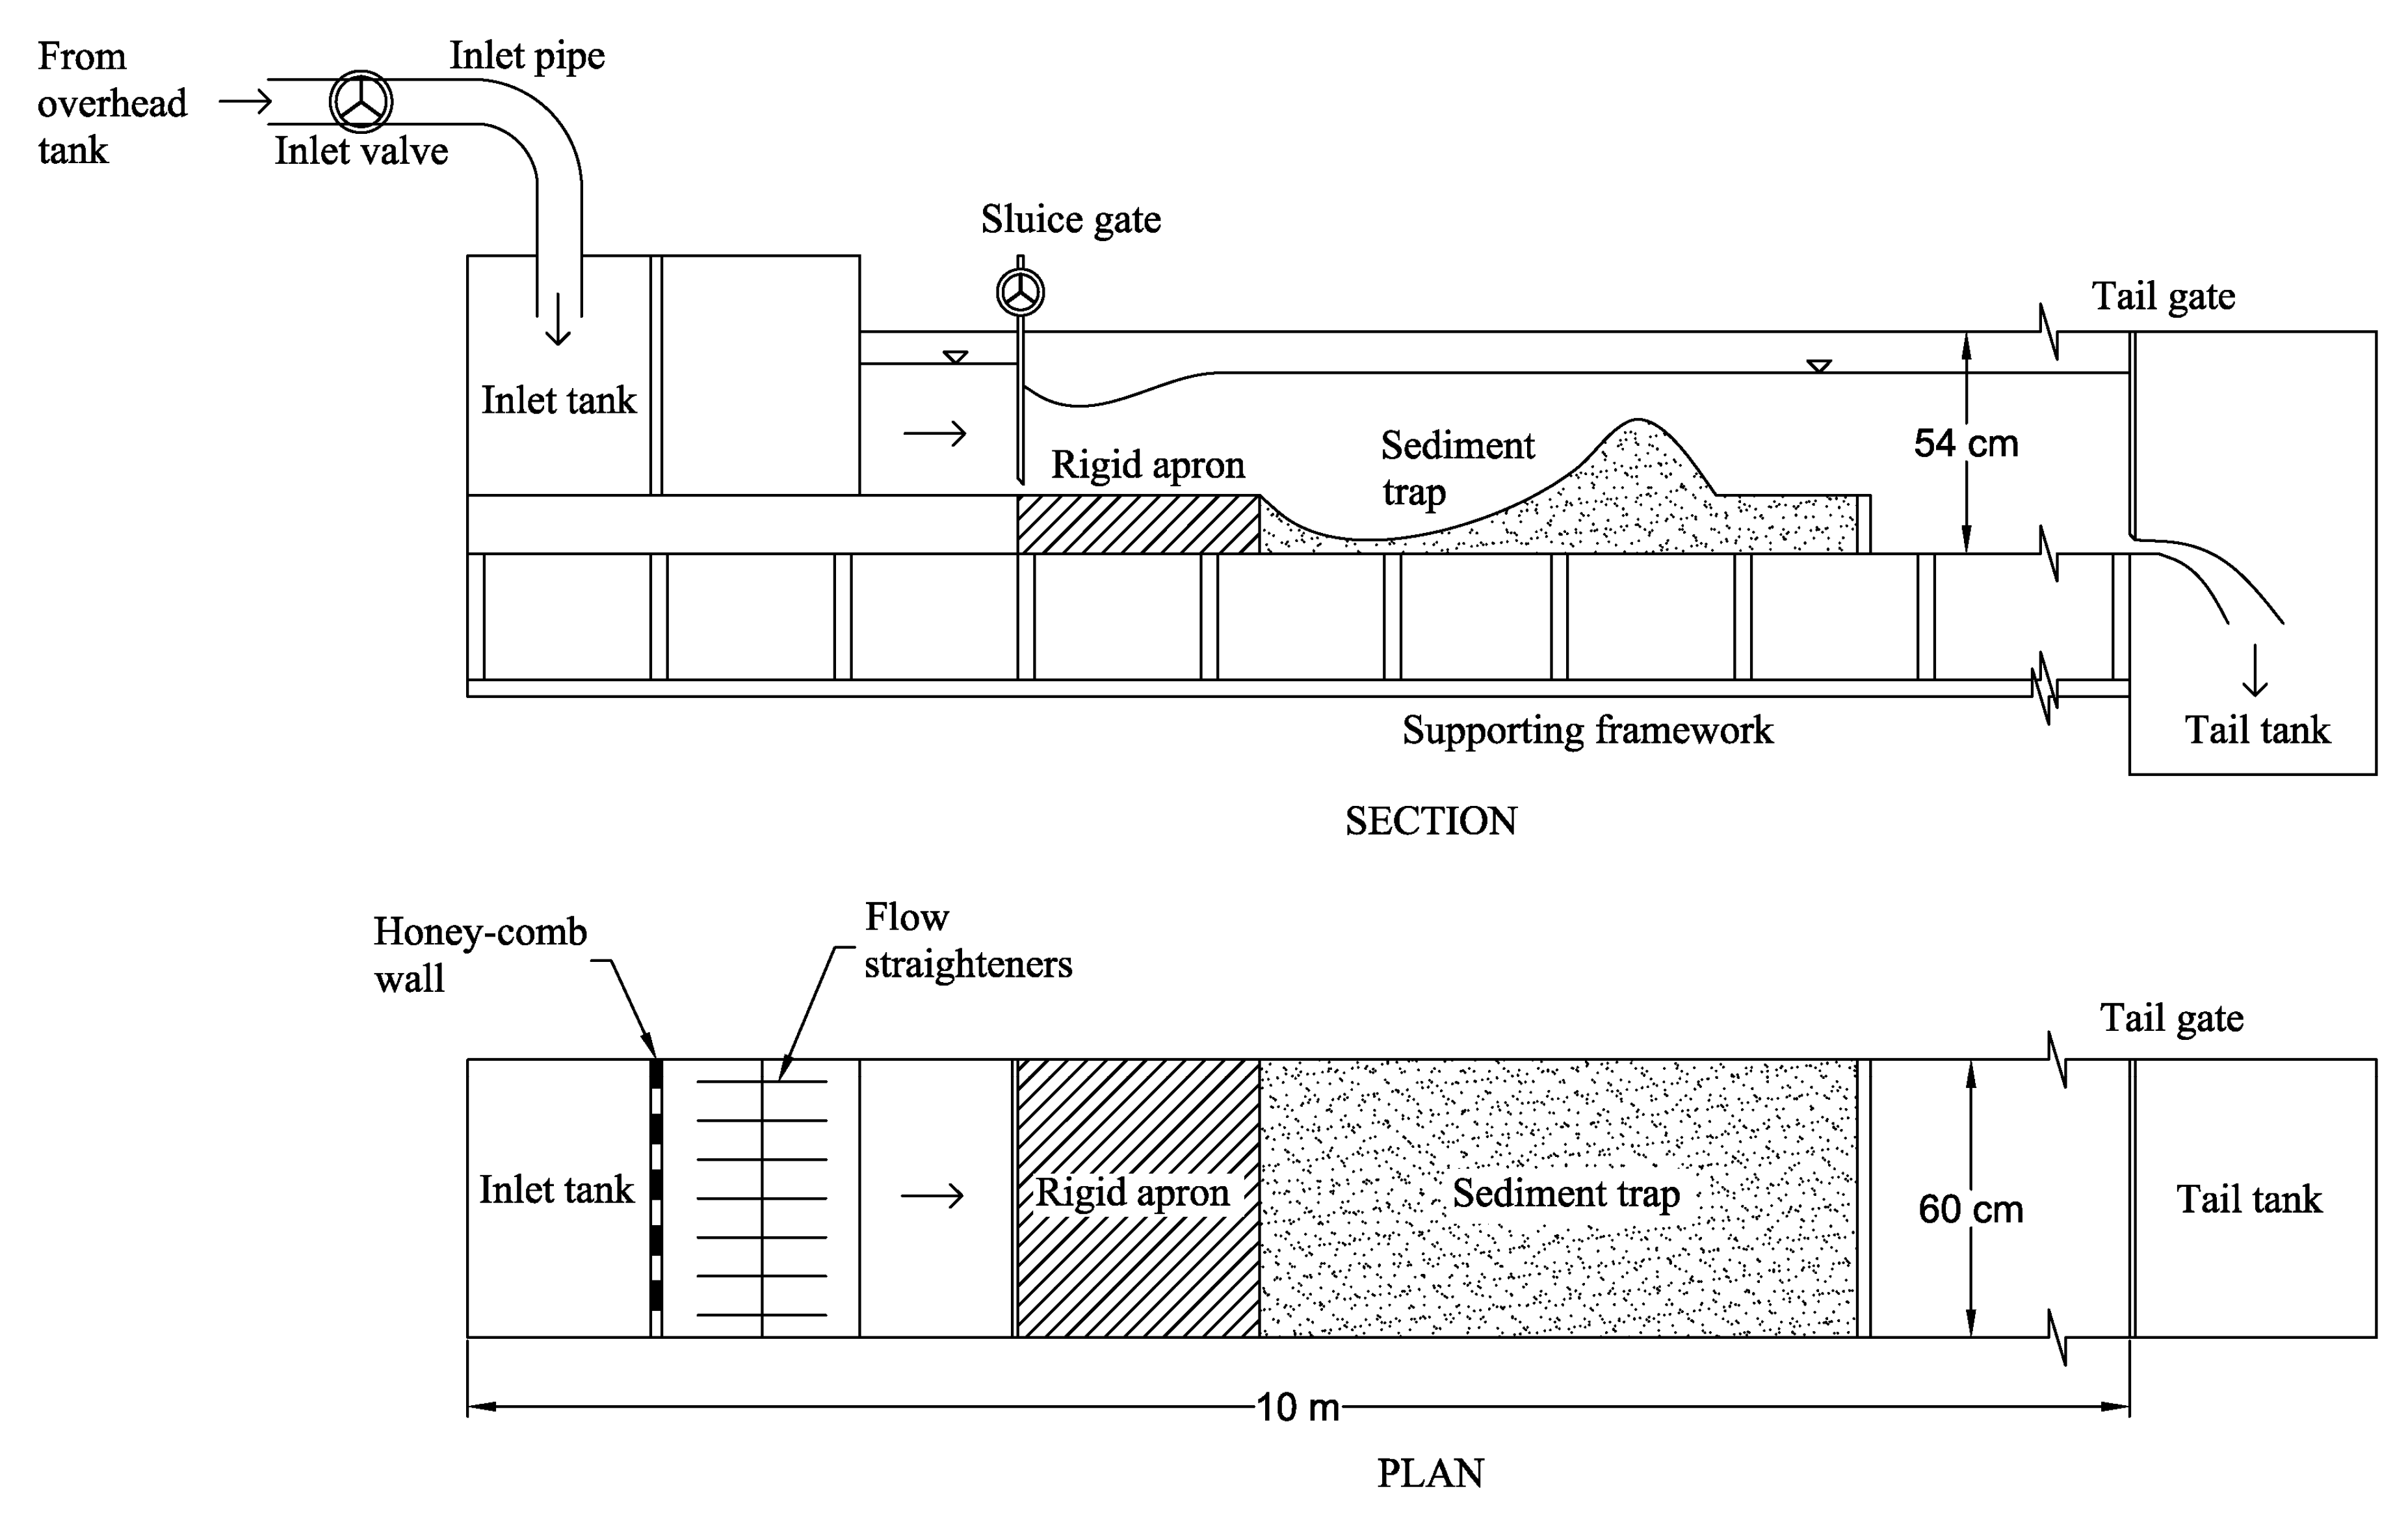
A 10-m-long tilting flume was used for performing experiments, with a width of 0.6 m and a depth of 0.54 m. The bed slope of the flume was maintained as 0.005. Figure 2 shows the plan and section of the experimental setup. The experiments were performed at the Hydraulics Laboratory of Civil Engineering Department at IIT Roorkee, India.
At a span of 2 m from the upstream end, a sluice gate was fitted with the flume. A stiff apron made of cement concrete, having a thickness of 0.2 m from the bed of the flume and variable length L = 0.5, 0.4, and 0.3 m from the sluice opening, was erected, with a neat finished layer of cement to function as a smooth apron. Rough apron was prepared by fabricating an acrylic sheet to the dimensions of the stiff apron, fixing the sediment of the required roughness height on its surface, and placing this sheet over the concrete apron. Three different sediments were used to create roughness over the apron, having ks = 1.00 mm, 1.79 mm, and 3.40 mm.
A sediment retreat 2 m long and 0.2 m deep was built downstream of the stiff apron to act as an erodible bed of sediment. The properties of sediments used as an erodible bed re given in Table 1. Towards the downstream end of the flume, a tail gate was mounted to maintain tailwater level dt. The measurement of tailwater level and surface profile of water was carried out using a pointer gauge having an accuracy of ±1.0 mm.
A main concern in the case of Froude scaled models is the possibility for scale effects produced by viscous forces. In the present study, the viscous scale effects were minimized by taking the model flow parameters such that the flow was fully turbulent. The minimum value of Reynolds number was kept much higher than the threshold value for a turbulent flow, thus minimizing the scale effects. The range of Froude number was taken from 1.45 to 12.04, while that of Reynolds number was from 8.3 × 10³ to 1.3 × 10⁴.
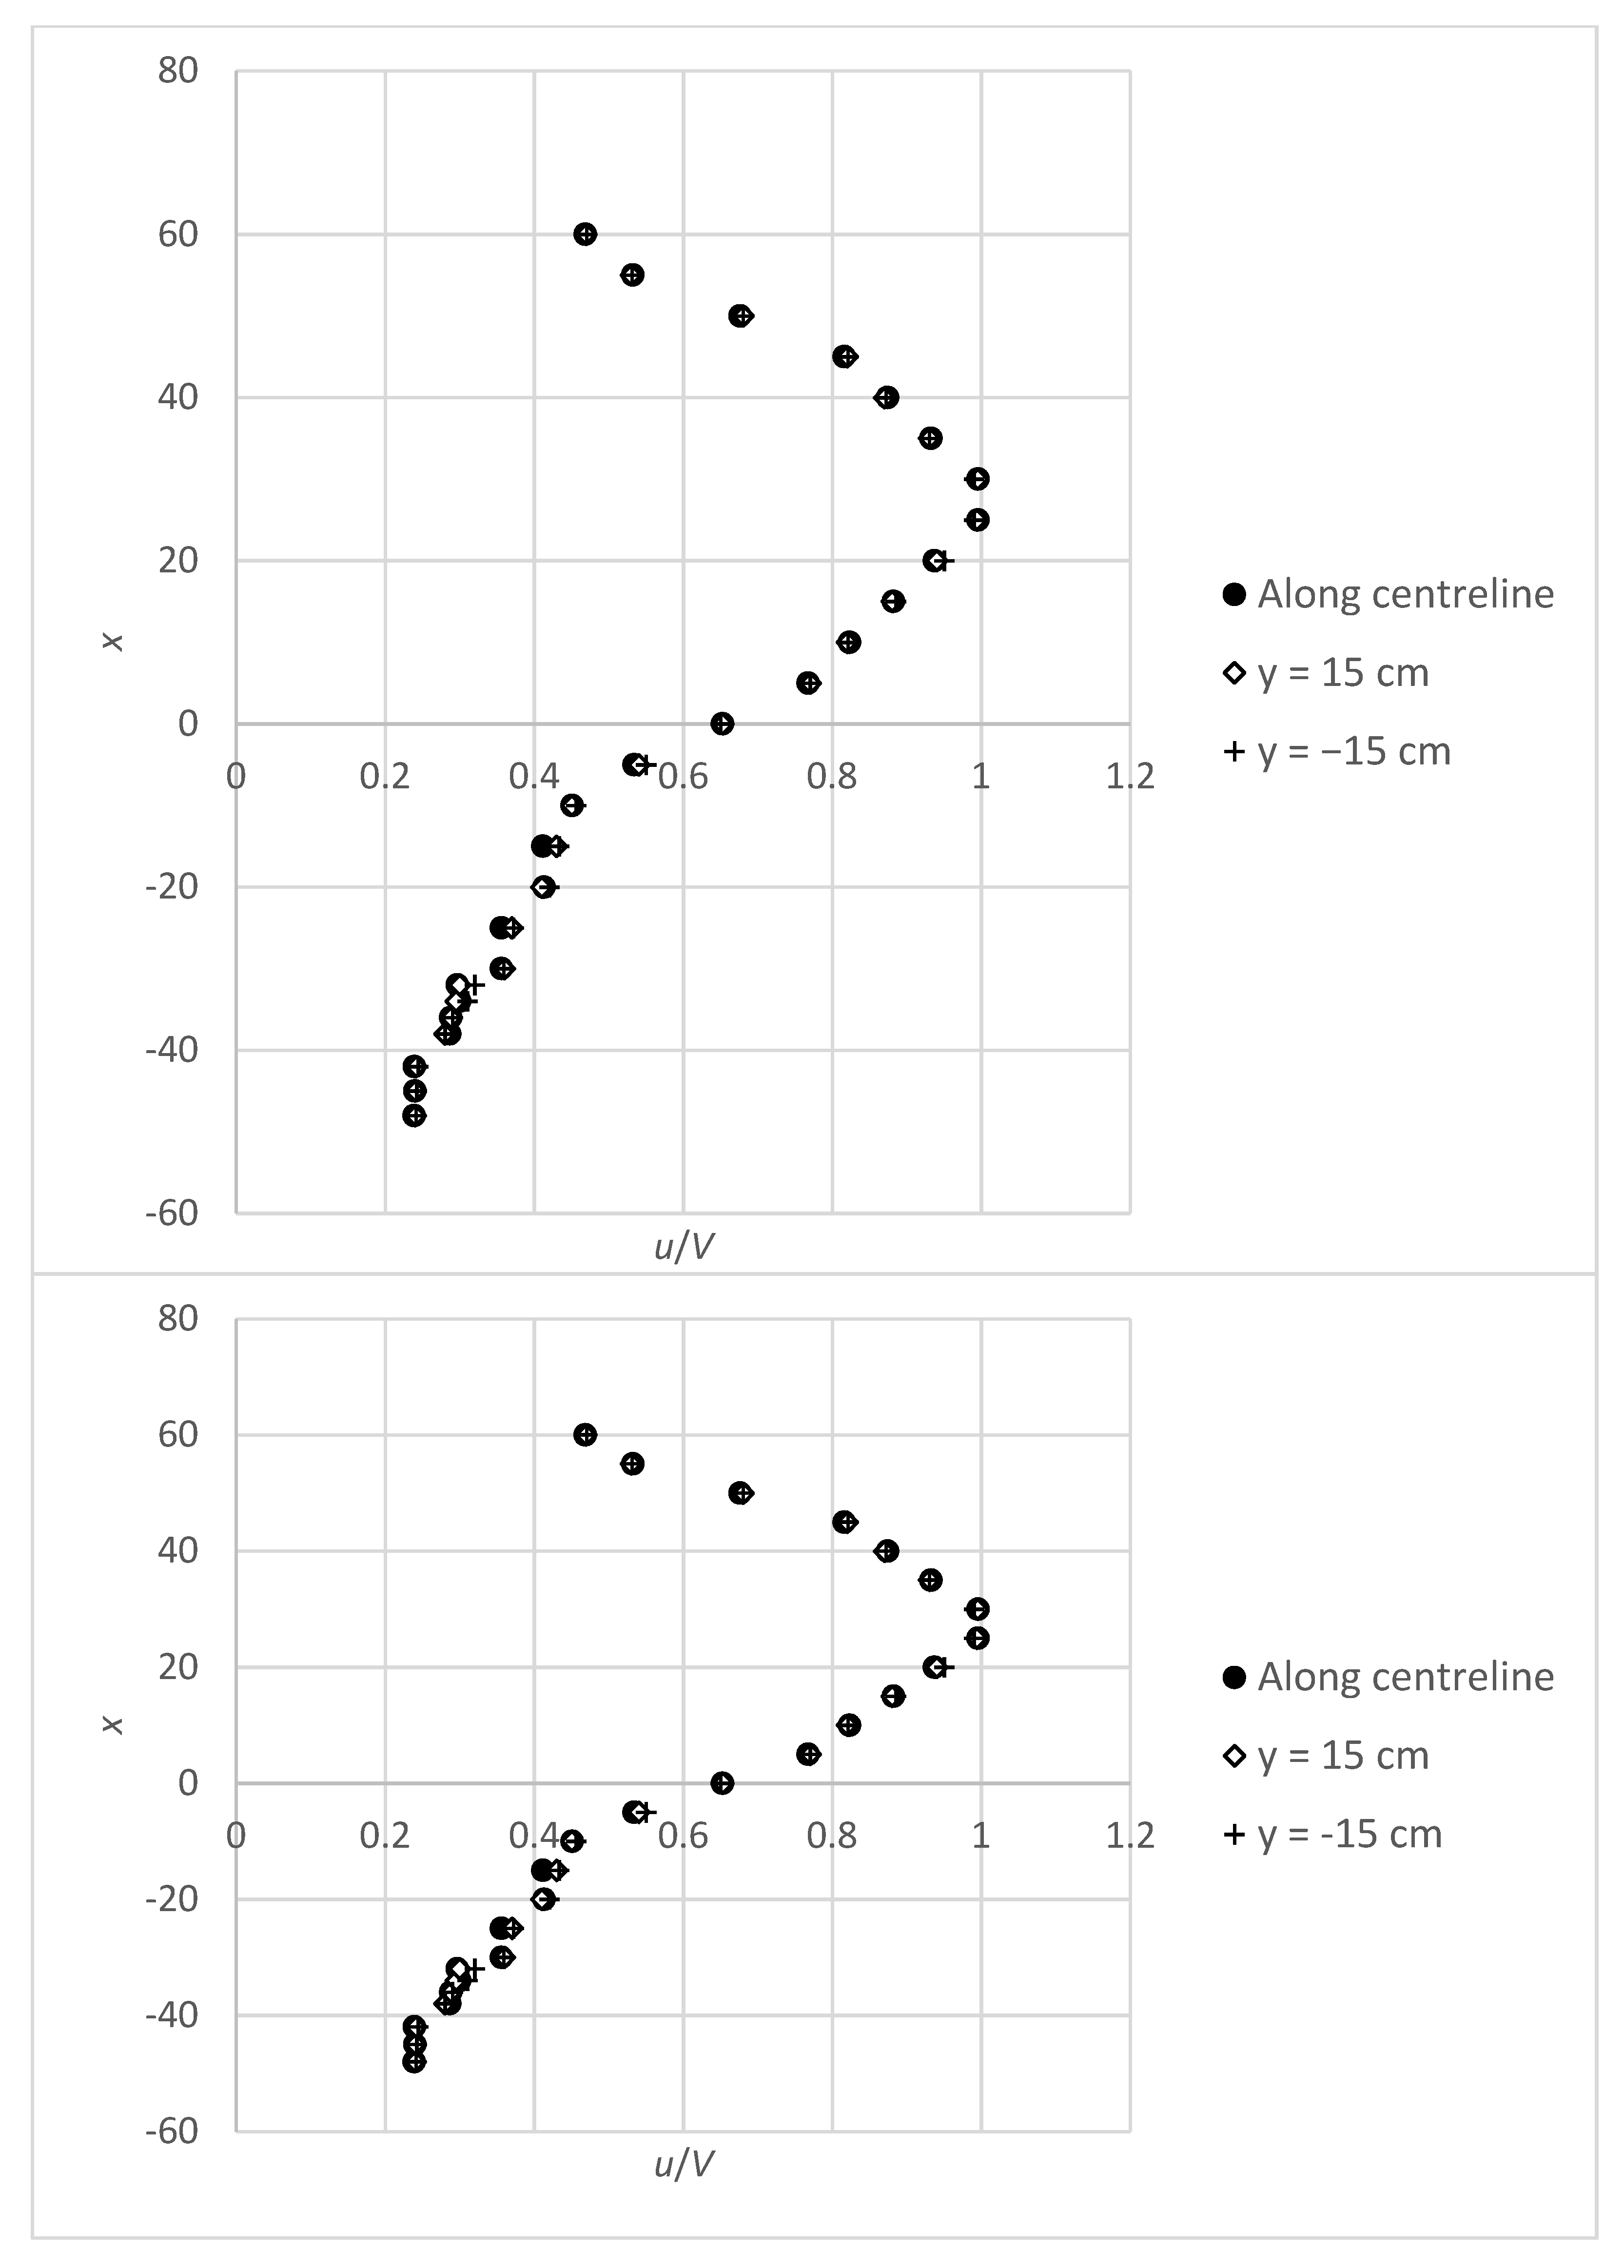
The experimental flume was made of glass side walls, which served the purpose of not only visualizing the scour hole formation, but also spatial and temporal measurement of the pattern of scour, by attaching a sheet of tracing graph paper, having major and minor grids of 1 × 1 cm2 and 1 × 1 mm2, respectively. The geometry of the scour hole that was traced along the transparent side wall of the flume was maintained at every longitudinal section of the flume, i.e., the flow, and hence, the scour profile was two-dimensional. To ensure this, some measurements of velocity profiles were made using a Nortek made Acoustic Doppler Velocimeter (ADV) at a number of x-y planes at distinct locations from the side wall (Figure 3), which revealed insignificant difference in the velocity distribution, signifying that the velocity profiles were constant at every transverse section of the flume, which validates the two-dimensional property of the flow. Measurement of the scour profiles at different vertical sections of the channel confirmed the two-dimensional property of the scour profile. The 2D property was also verified with the help of the in-built “bottom check” function of the ADV and matching this depth with that measured through the glass side walls. There was a negligible difference between the two, negating the existence of potential wall effects.
A constant discharge was sustained by regulating the inlet pipe valve and measuring using an Ultrasonic flow meter. Submerged condition was maintained while carrying out all the experiments, such that the depth of tailwater was greater than the conjugate depth of a free hydraulic jump , where F represents the Froude number of the incoming jet, obtained as F = V/(ga)0.5; g = gravitational acceleration. Clear-water scour condition was maintained during the experiments. Table 2 presents the range of experimental data collected in this study.
3. Dimensional Analysis
Dimensional analysis is used as a classical tool to identify the variables affecting the equilibrium scour depth. The functional form of equilibrium scour depth downstream of a stiff apron (smooth and rough) under submerged wall jets can be written as
where ν = kinematic viscosity of water; σg = geometric standard deviation of sediments; ρ = mass density of water; and ρs = mass density of sediments. For a two-phase flow phenomenon involving sediment-water interaction, the terms g, ρ, and ρs can appropriately be grouped as one independent parameter Δg in functional representation of ds; where Δ = s − 1; s = relative density of sediments; g = acceleration due to gravity. Also, since the flow is turbulent, the effect of kinematic viscosity ν on maximum scour depth is negligible (Rajaratnam, 1981). σg also has a negligible effect upon maximum scour depth (Aamir and Ahmad, 2019). Using the Buckingham π theorem, the following is obtained:
If the non-dimensional entities are represented as = ds/a; = L/a; = ks/a; = dt/a; and = d50/a, then the functional form can be written as
4. Results and Discussion
4.1. Effect of Different Parameters on Maximum Scour Depth
Appendix A presents the experimental data obtained from this investigation, which is used to perform the subsequent analyses.
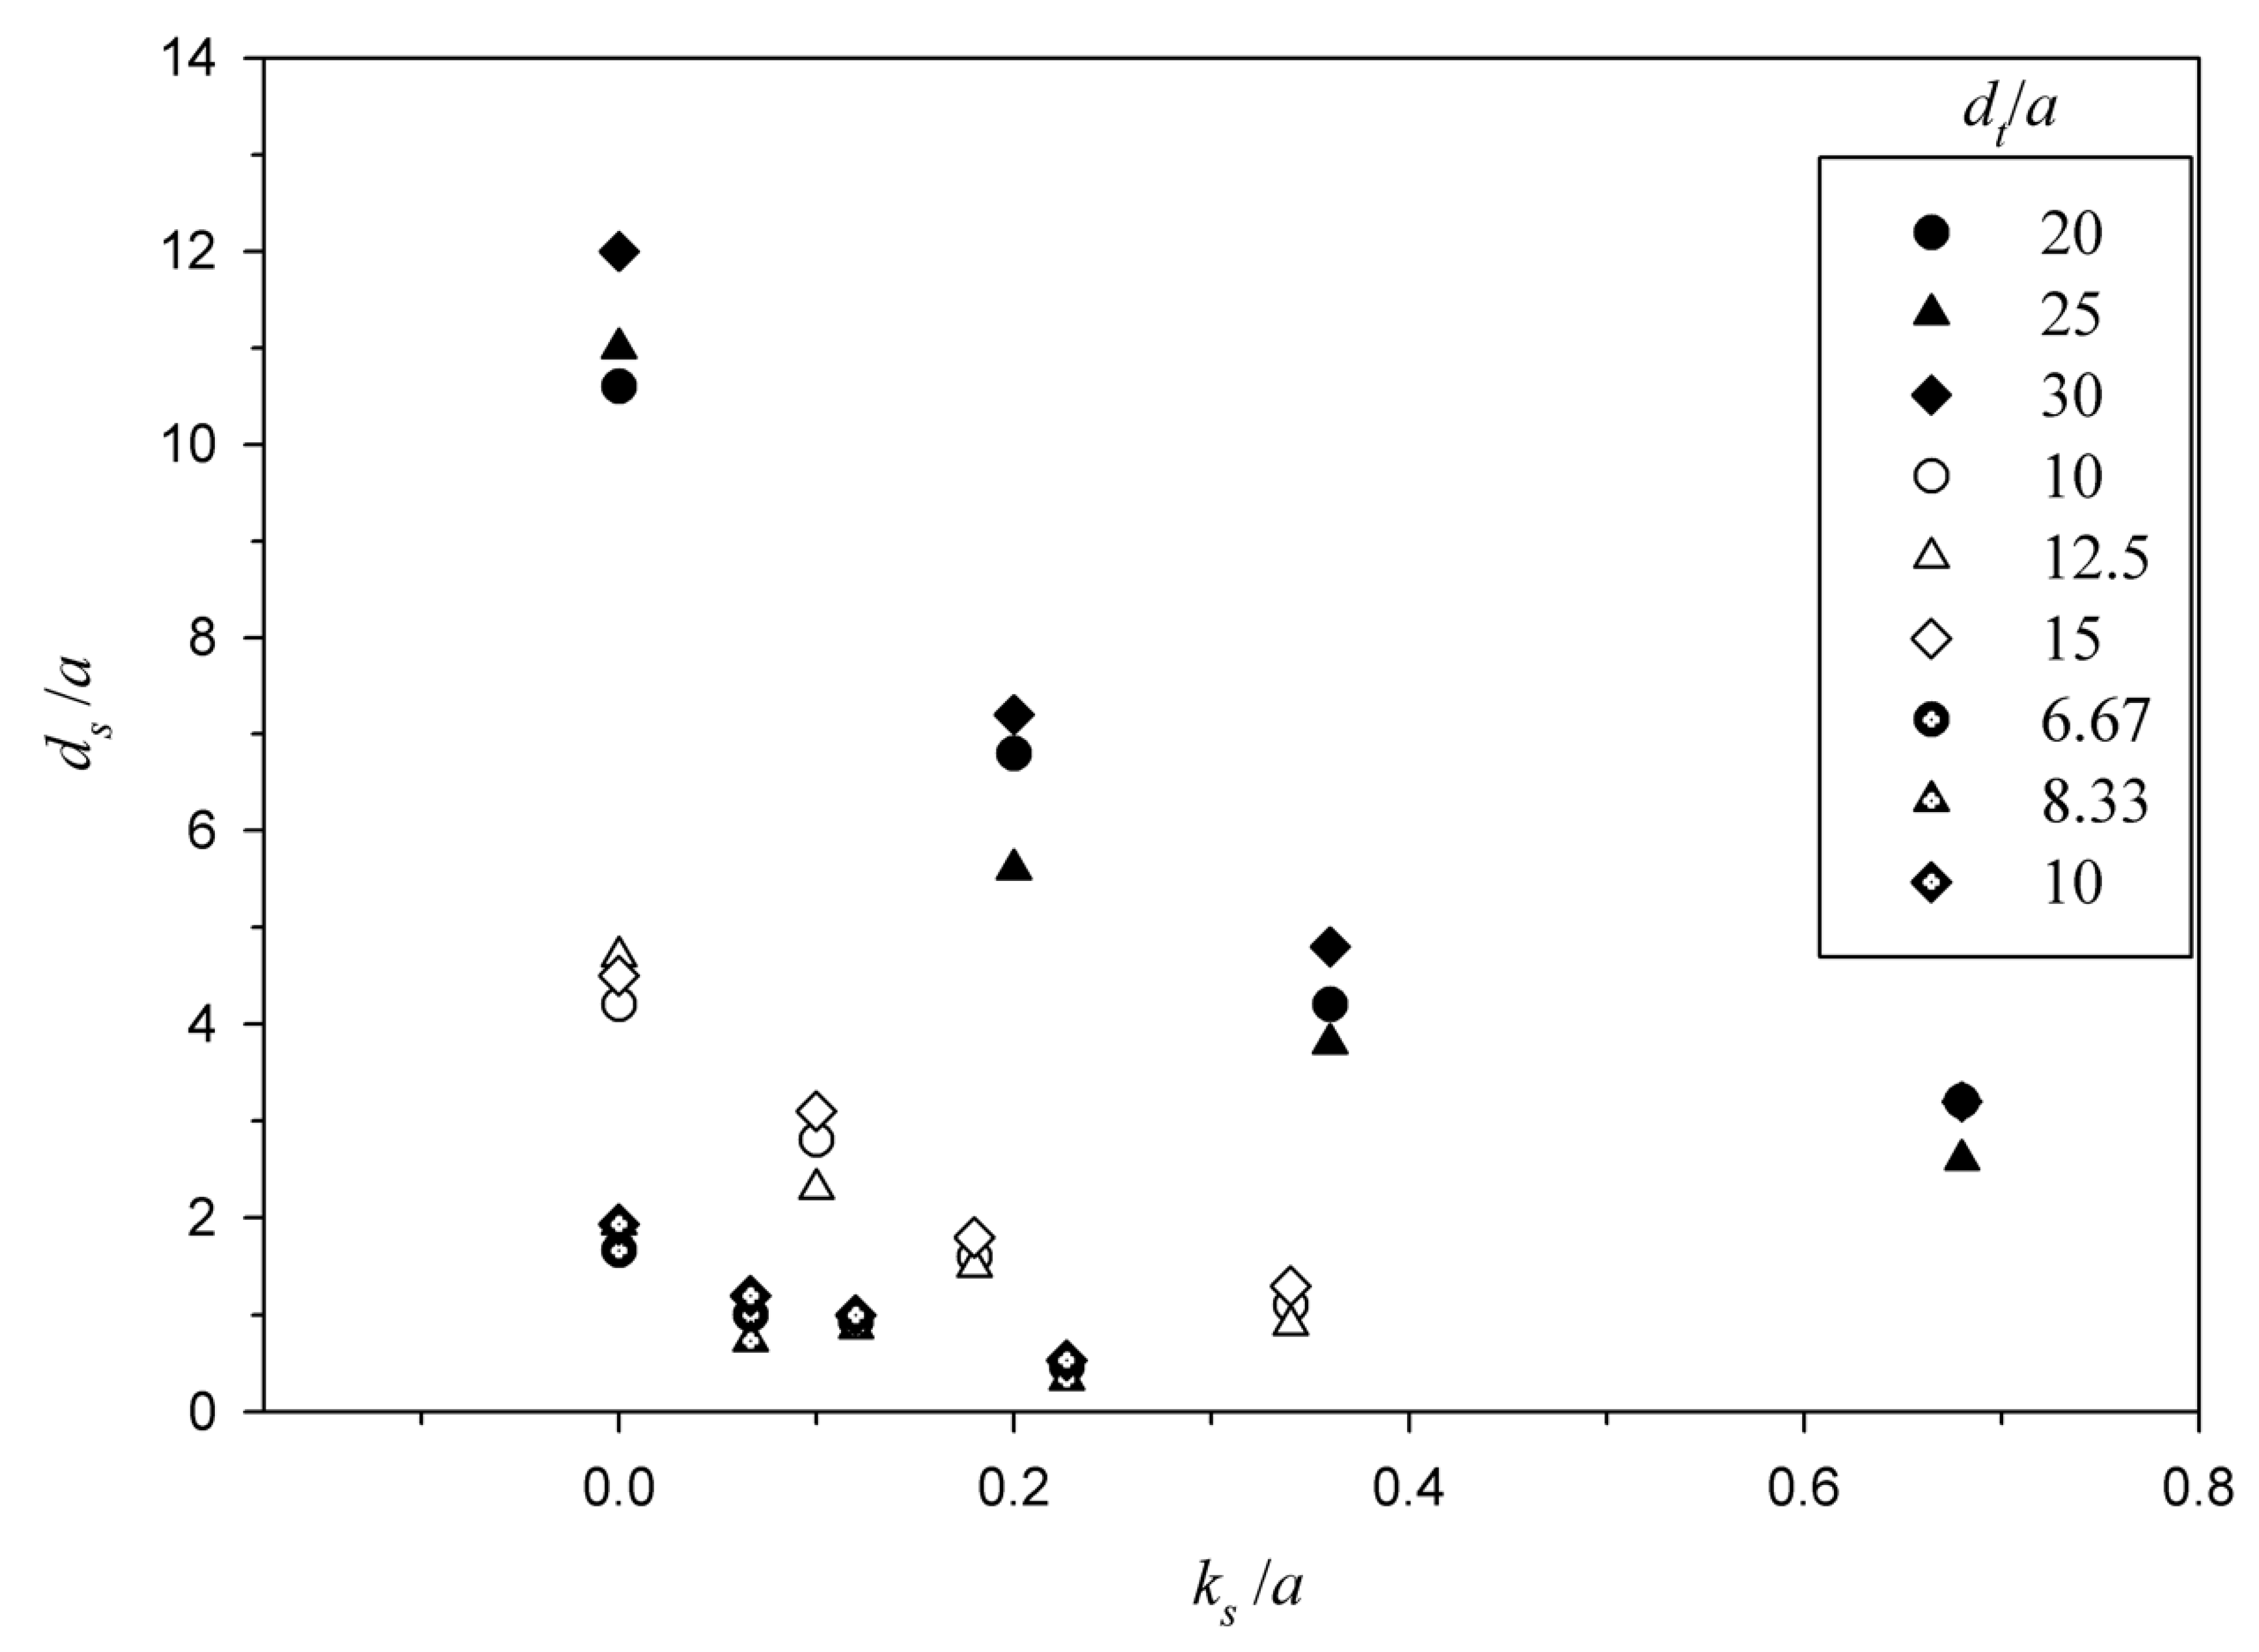
Figure 4 illustrates the dependency of non-dimensional maximum scour depth ds/a on apron roughness/sluice opening ratio ks/a, for different values of sluice opening a and tailwater level dt. It is clearly evident from the figure that the equilibrium depth of scour decreases considerably with an increase in roughness height of the apron. Also, there is a sharp decrease in maximum scour depth for ks/a < 0.2. For values of ks/a > 0.2, the effect of apron roughness on equilibrium scour depth diminishes gradually. The maximum reduction in scour depth occurs for the run c17C (a = 15 mm, ks = 3.40 mm, and dt = 0.125 m), while the minimum value is observed for run a15C (a = 10 mm, ks = 1.00 mm, and dt = 0.15 m), with average reduction being in the range of 70–83%.
The primary reason for reduction in the equilibrium depth of scour is a decline in the erosive power of the jet while it travels over the stiff apron. The potential core of the jet is exhausted at a much shorter length due to the increased roughness over the apron, as the boundary layer is completely developed at a shorter distance (Figure 1). Distance to maximum equilibrium depth of scour from the end of the stiff apron was also reduced, which is a direct consequence of a decline in the erosive power of the jet. Since the jet in this condition (having traversed the rough apron) has much reduced energy due to early development of the boundary layer, it is not able to cause much scour when it moves over the sediment bed and since it cannot traverse a larger distance (in contrast with smooth apron), the distance to maximum equilibrium depth of scour from the stiff apron gets reduced. A reduction in length of the scour hole and height of ridge crest was also observed. In other words, a considerable shift towards the apron was observed in the complete scour profile for a rough apron, along with a reduction in the maximum equilibrium depth of scour.
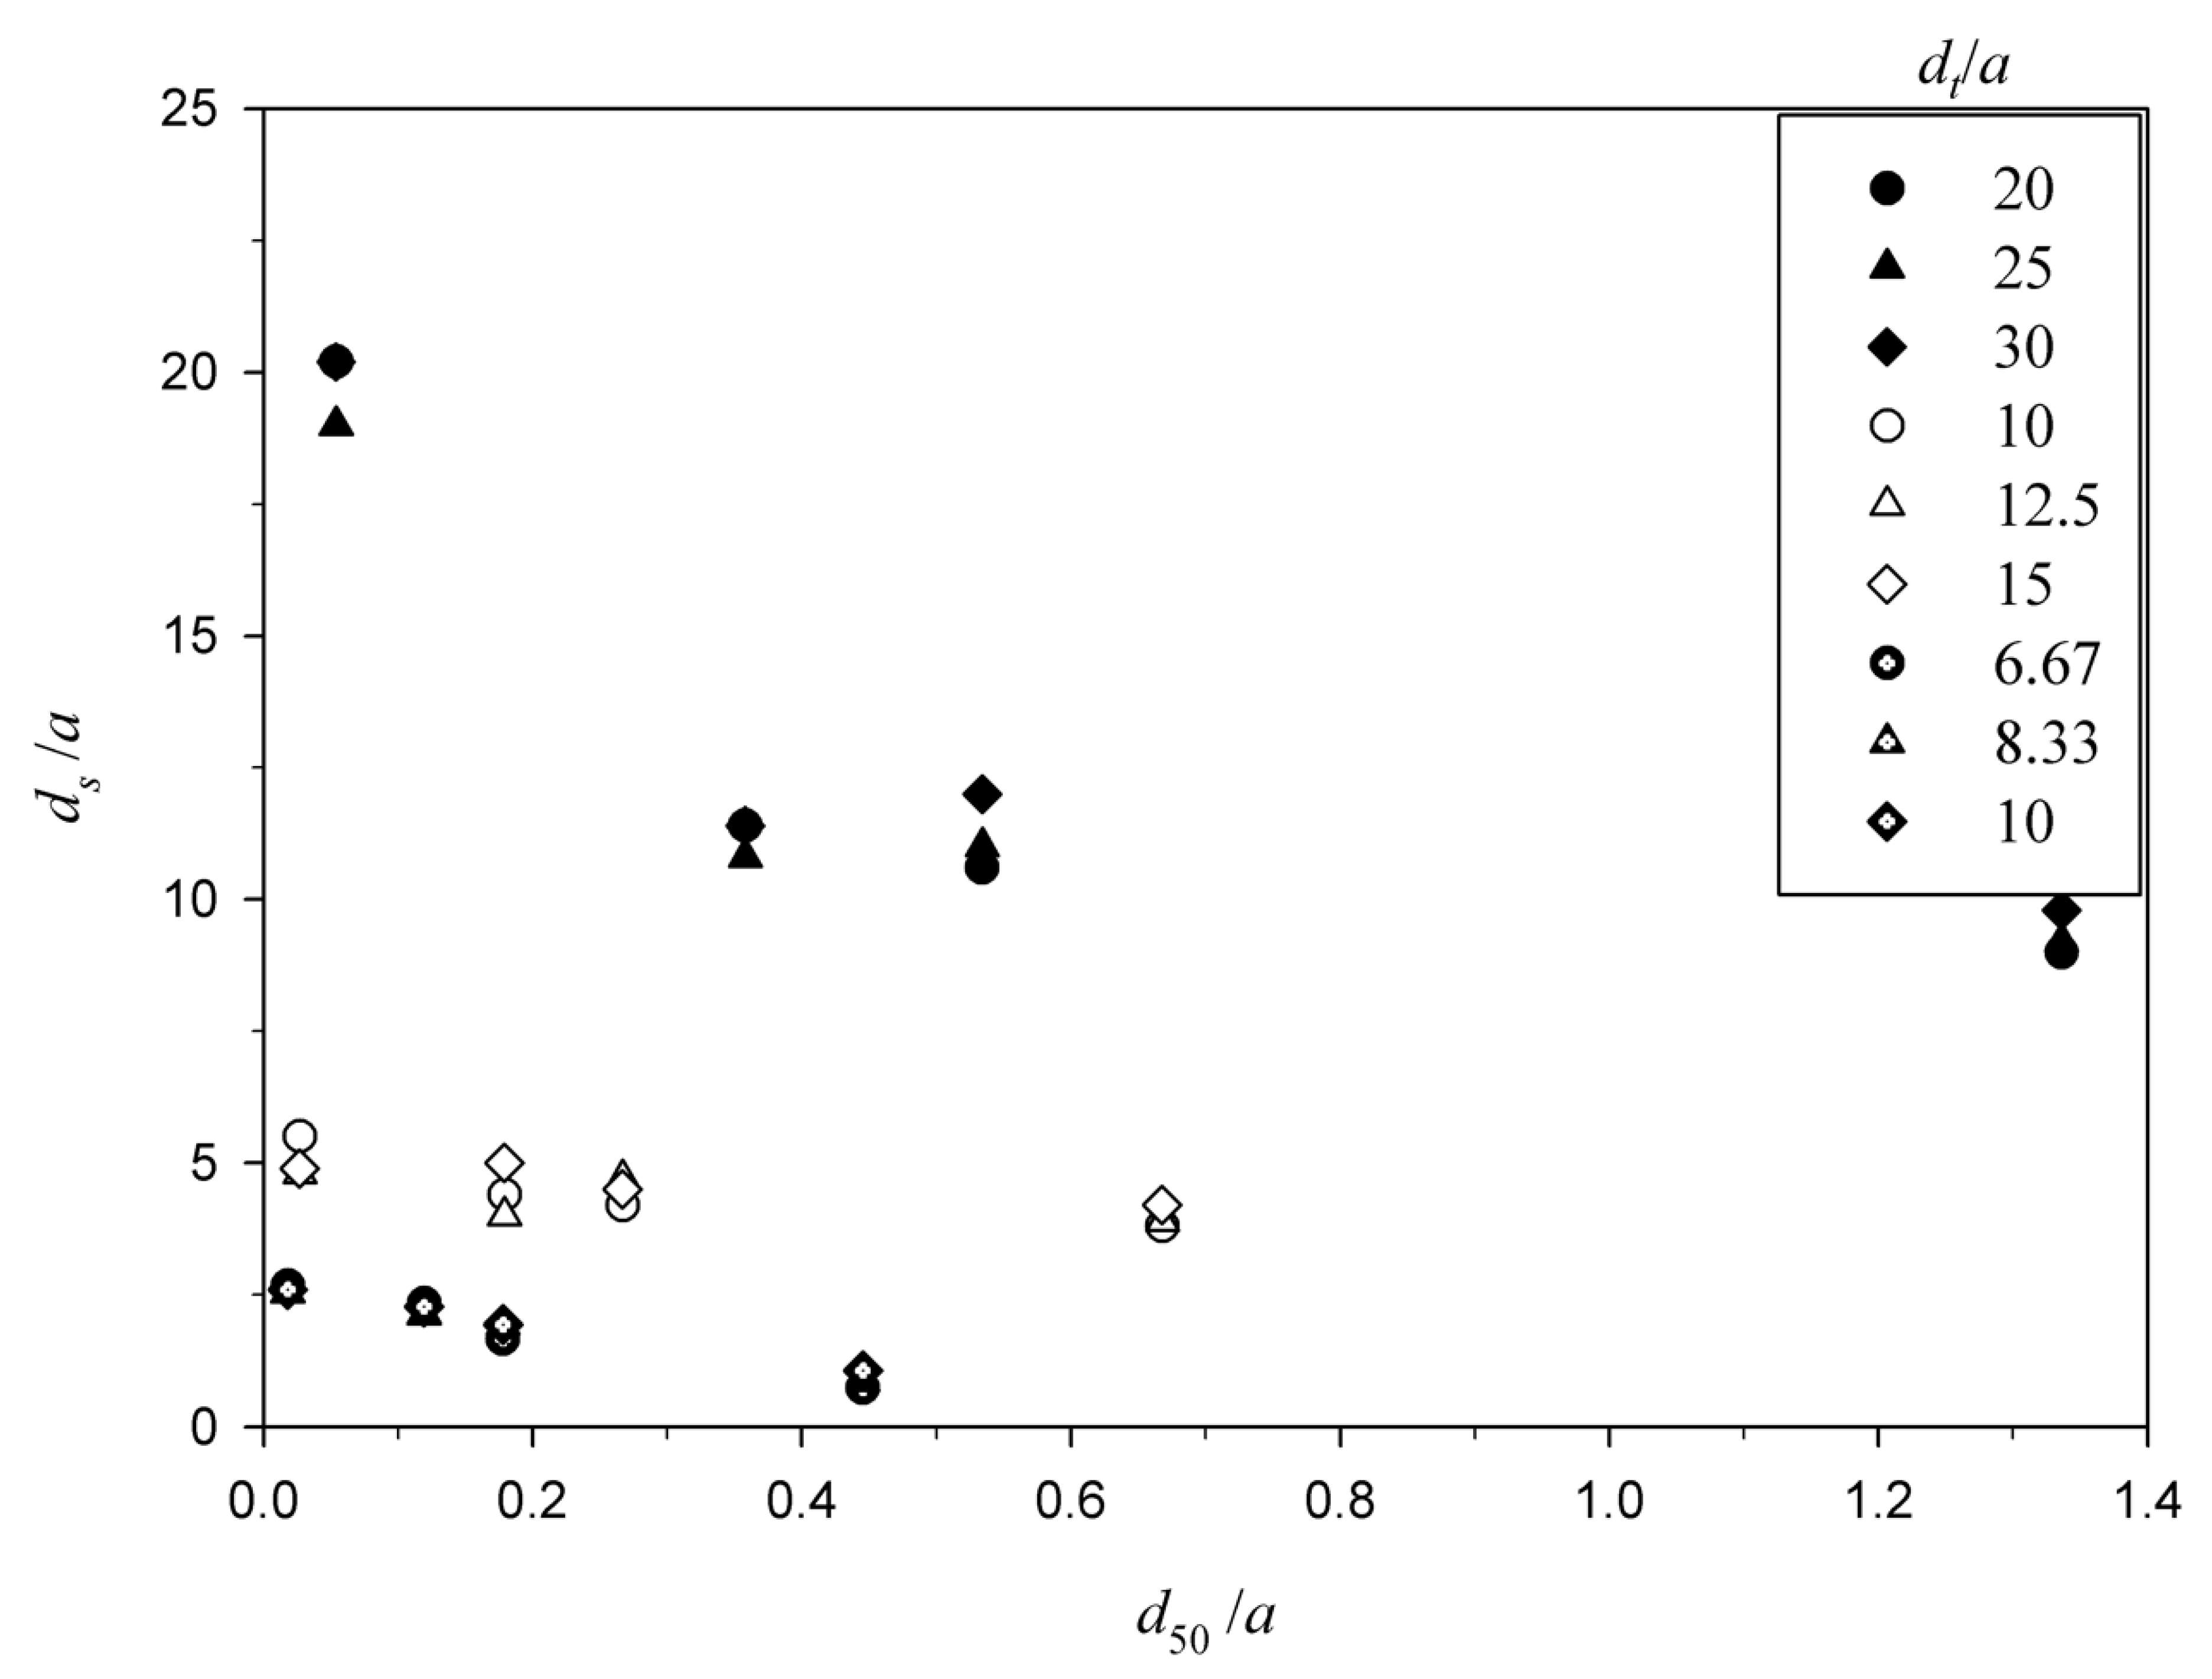
Figure 5 presents the dependency of normalized equilibrium depth of scour ds/a with the ratio of sediment size and sluice opening d50/a for different values of sluice opening a and tailwater level dt. It is manifest from the figure that the maximum depth of scour decreases with increasing sediment size, which implies that the value of ds is lower for coarser sediment. This decrease in ds can be attributed to the reduction in the shear stress of the bed influencing the scour hole as the scour hole develops. Therefore, the equilibrium condition of scour is achieved at a lesser scour depth ds for sediments having coarser grain size, which require relatively larger critical shear stress to begin motion. On the other hand, an increase in sluice opening a reduces the issuing jet velocity V, as a consequence of which, the jet possesses lower scour potential (or lesser energy) at larger values of a. An interesting feature observed is that there is a sharp decrease in ds/a for d50/a < 0.15. Then, there is a considerable fall in the rate of reduction of ds/a, which becomes almost independent of d50/a for d50/a > 0.5.
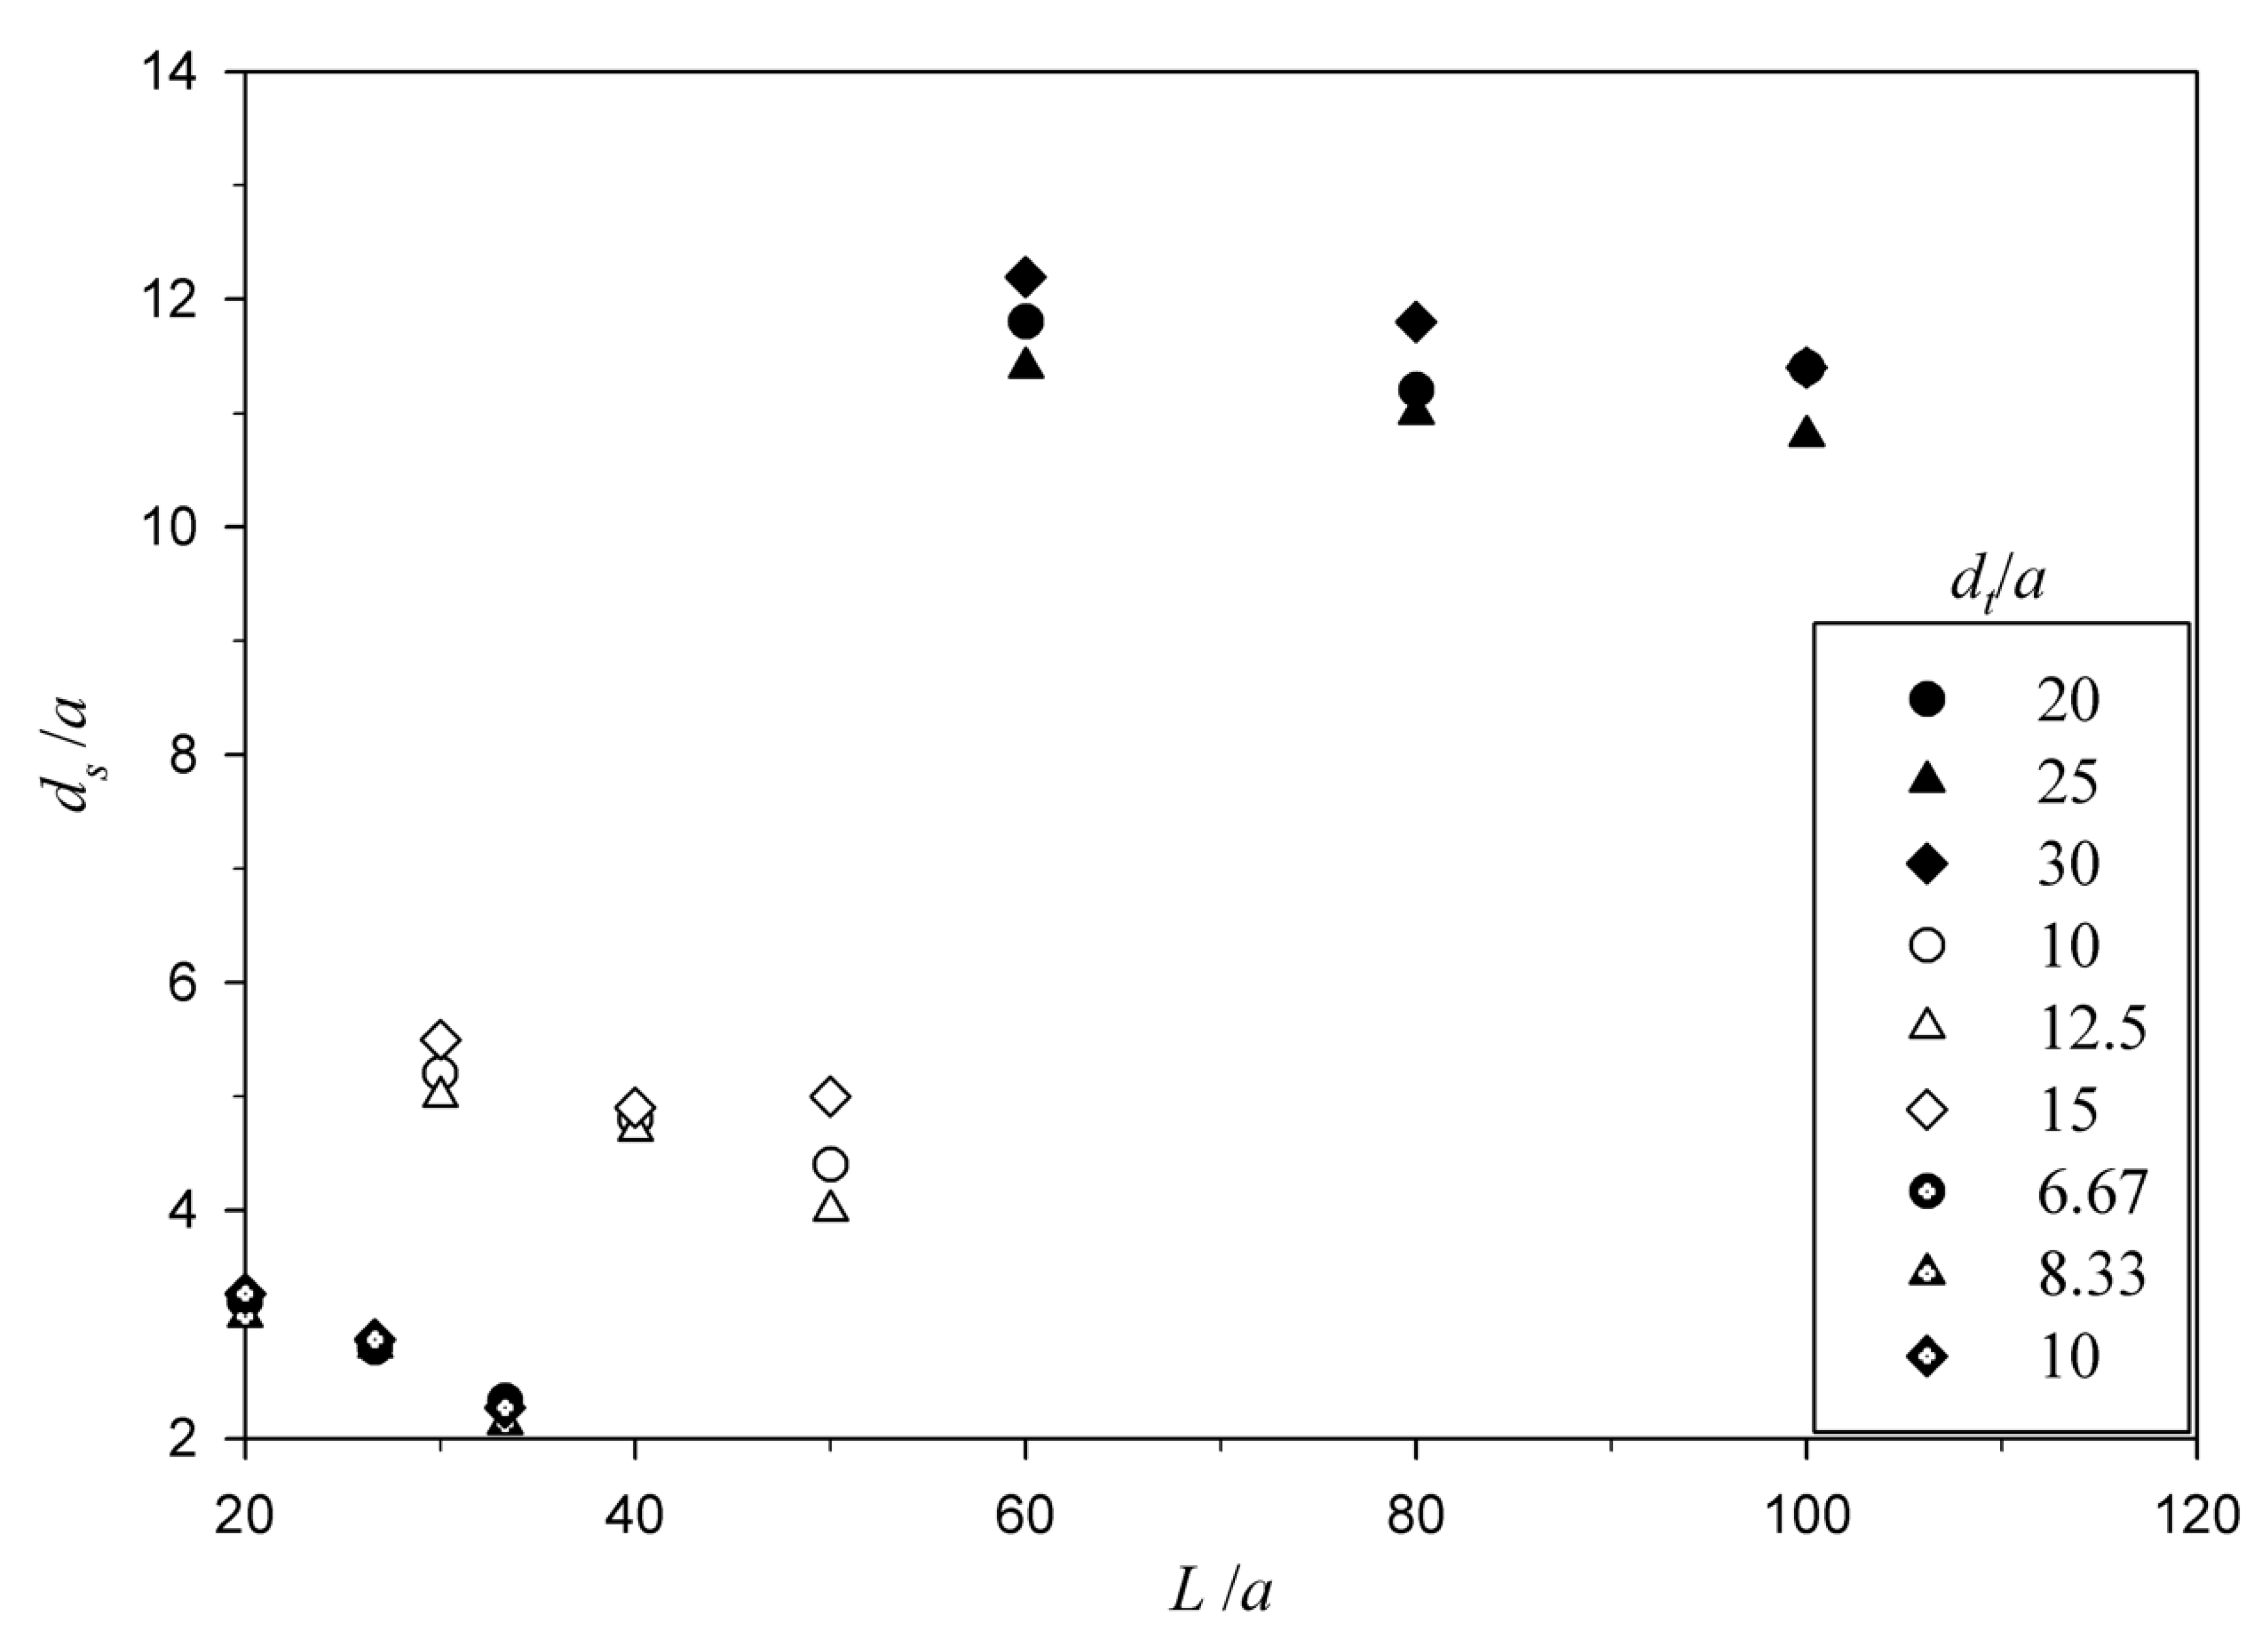
Figure 6 shows the dependency of ds/a on L/a for different sluice openings a and tailwater levels dt. It is evident that there is a decrease in ds/a with an increase in L/a. However, this reduction is rather small, having a maximum reduction of 12.2% and an average of 7.8%. Diffusion of the submerged jet over the stiff apron prior to encountering the sediment bed reduces its erosive capacity. The jet is diffused more as it travels a longer length over the apron, hence reducing its erosive capacity as it exerts a lesser amount of shear stress over the sediment bed, causing a decrease in ds. A comparison between different sluice openings indicates a reduction in ds for larger a.
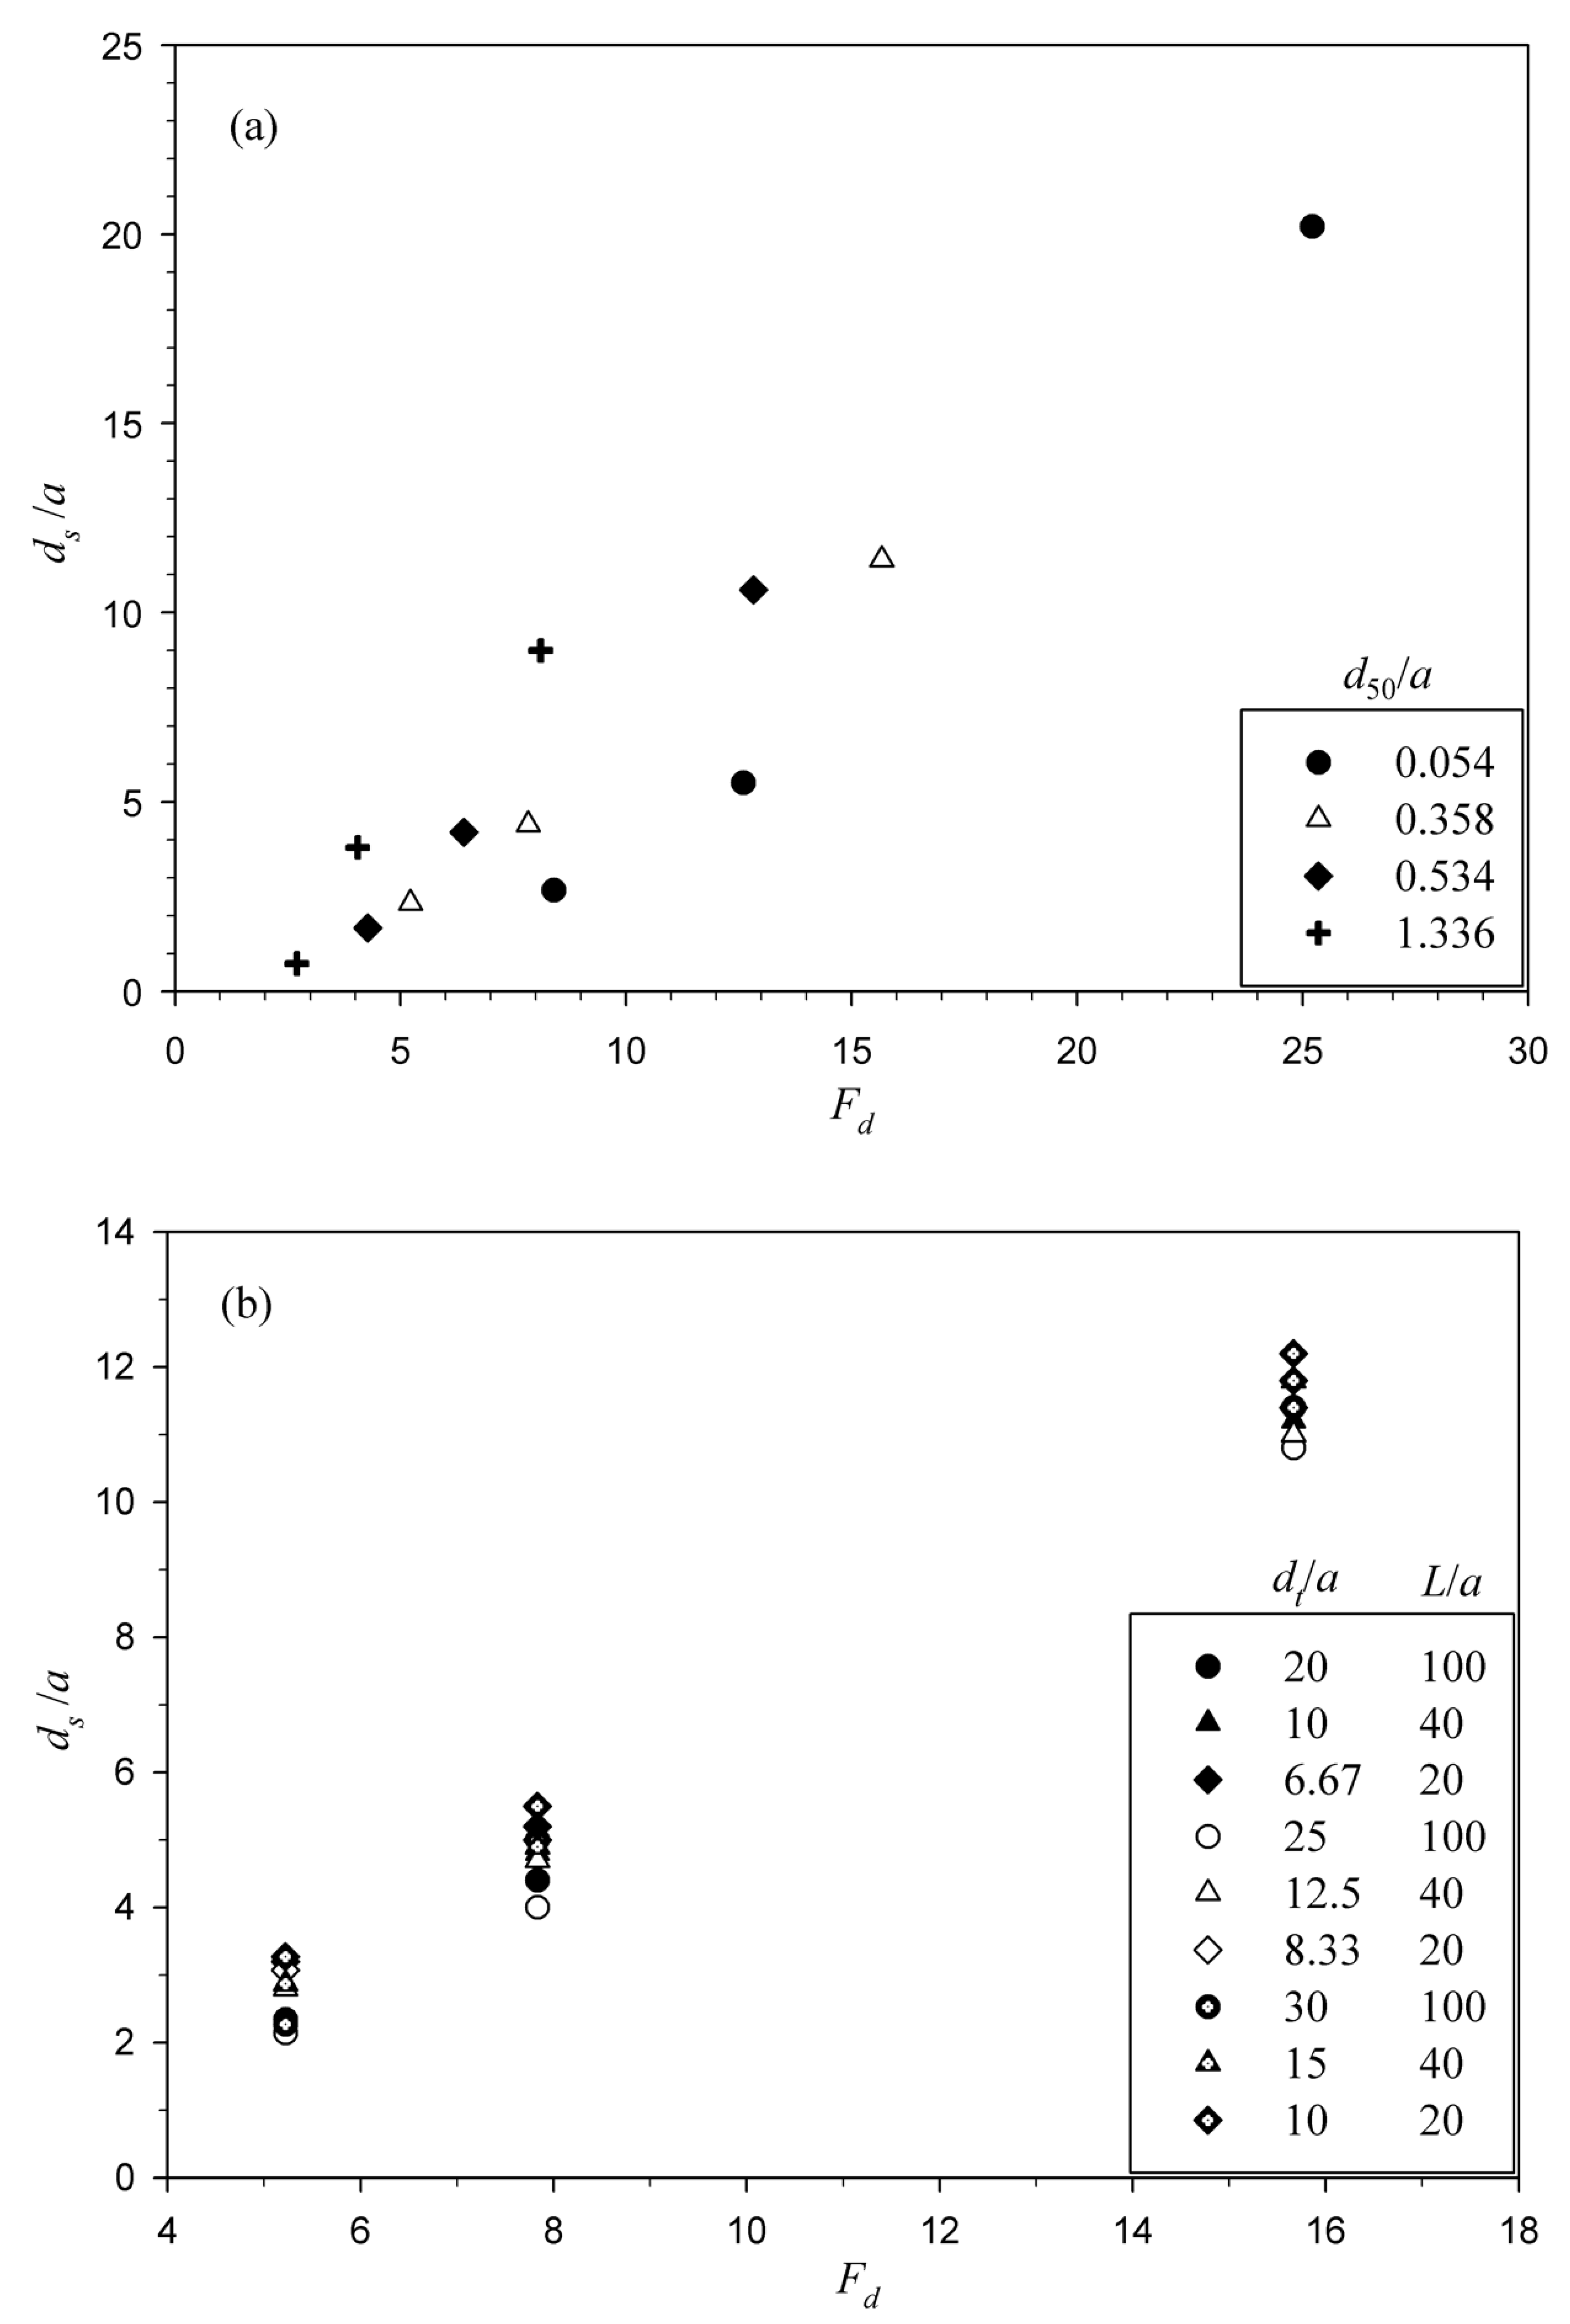
Figure 7a,b shows the variation of densimetric Froude number Fd [=V/(Δgd50)0.5] on normalized maximum scour depth ds/a for different sediment sizes, tailwater levels, and apron lengths. It is apparent from the figures that the maximum depth of scour ds increases as densimetric Froude number Fd increases. Densimetric Froude number is a property of inertial force as well as sediment size. When the inertial force is more (i.e., the value of V is increased in response to a decrease in the sluice opening), the value of Fd also increases. Since Fd is a function of d50, hence it is also evident in Figure 7a that Fd is inversely proportional to the square root of d50. Therefore, ds increases with a decrease in d50, since a higher amount of energy is required by the incoming jet to move particles of larger size. The influence of length of stiff apron L on maximum scour depth ds is also apparent from this figure, which shows that there is an increase in ds with decreasing L.
Figure 8 shows the variation of normalized equilibrium scour depth ds/a on tailwater level/sluice opening ratio dt/a for different Froude numbers F and sediment sizes d50. A drooping nature is seen for the variation of ds/a with dt/a. It shows that a critical level of tailwater exists corresponding to the minimum ds/a [11,15]. A comparison between different Froude numbers F indicates that ds/a increases with an increase in Froude number F. This sagging nature can be partly ascribed to the change in the flow field and the scouring process with changing tailwater levels. At higher tailwater levels, reversal of flow is more prominent as compared to lower tailwater levels. Thus, this reversed flow, which develops into a roller, causes a further increase in the equilibrium depth of scour at higher tailwater levels. This effect, however, diminishes as the tailwater level is increased further and the maximum scour depth becomes independent of tailwater level at very high tailwater depths.
4.2. Estimation of Maximum Scour Depth
Many empirical equations are available in the literature to predict the maximum depth of scour around piers and under wall jets [35,36,37]. Aamir and Ahmad [38] compared the performance of the existing equations using the available laboratory data and concluded that the equation proposed by Dey and Sarkar [15] is superior to others. However, that equation does not account for roughness of the stiff apron and is applicable only to smooth aprons. Taking this into account, a regression analysis of the experimental data furnished in the Appendix A was performed in the present study, and the following equation was proposed for the equilibrium depth of scour downstream of a stiff apron (smooth and rough) under the influence of submerged wall jets:
This equation is applicable for 1.45 ≤ Fd ≤ 12.04, 20 ≤ L/a ≤ 100, 6.67 ≤ dt/a ≤ 40, and ks/a ≤ 0.23. Data acquired from the present study was utilized to calculate the maximum depth of scour from Dey and Sarkar (2006) equation for comparison. Figure 9 shows the comparison of experimental ds/a with that computed using Dey and Sarkar [15] equation. The equation proposed by Dey and Sarkar [15] mostly under-predicts maximum scour depth for present data. Also, this equation cannot be used for equilibrium scour depth prediction in rough aprons.
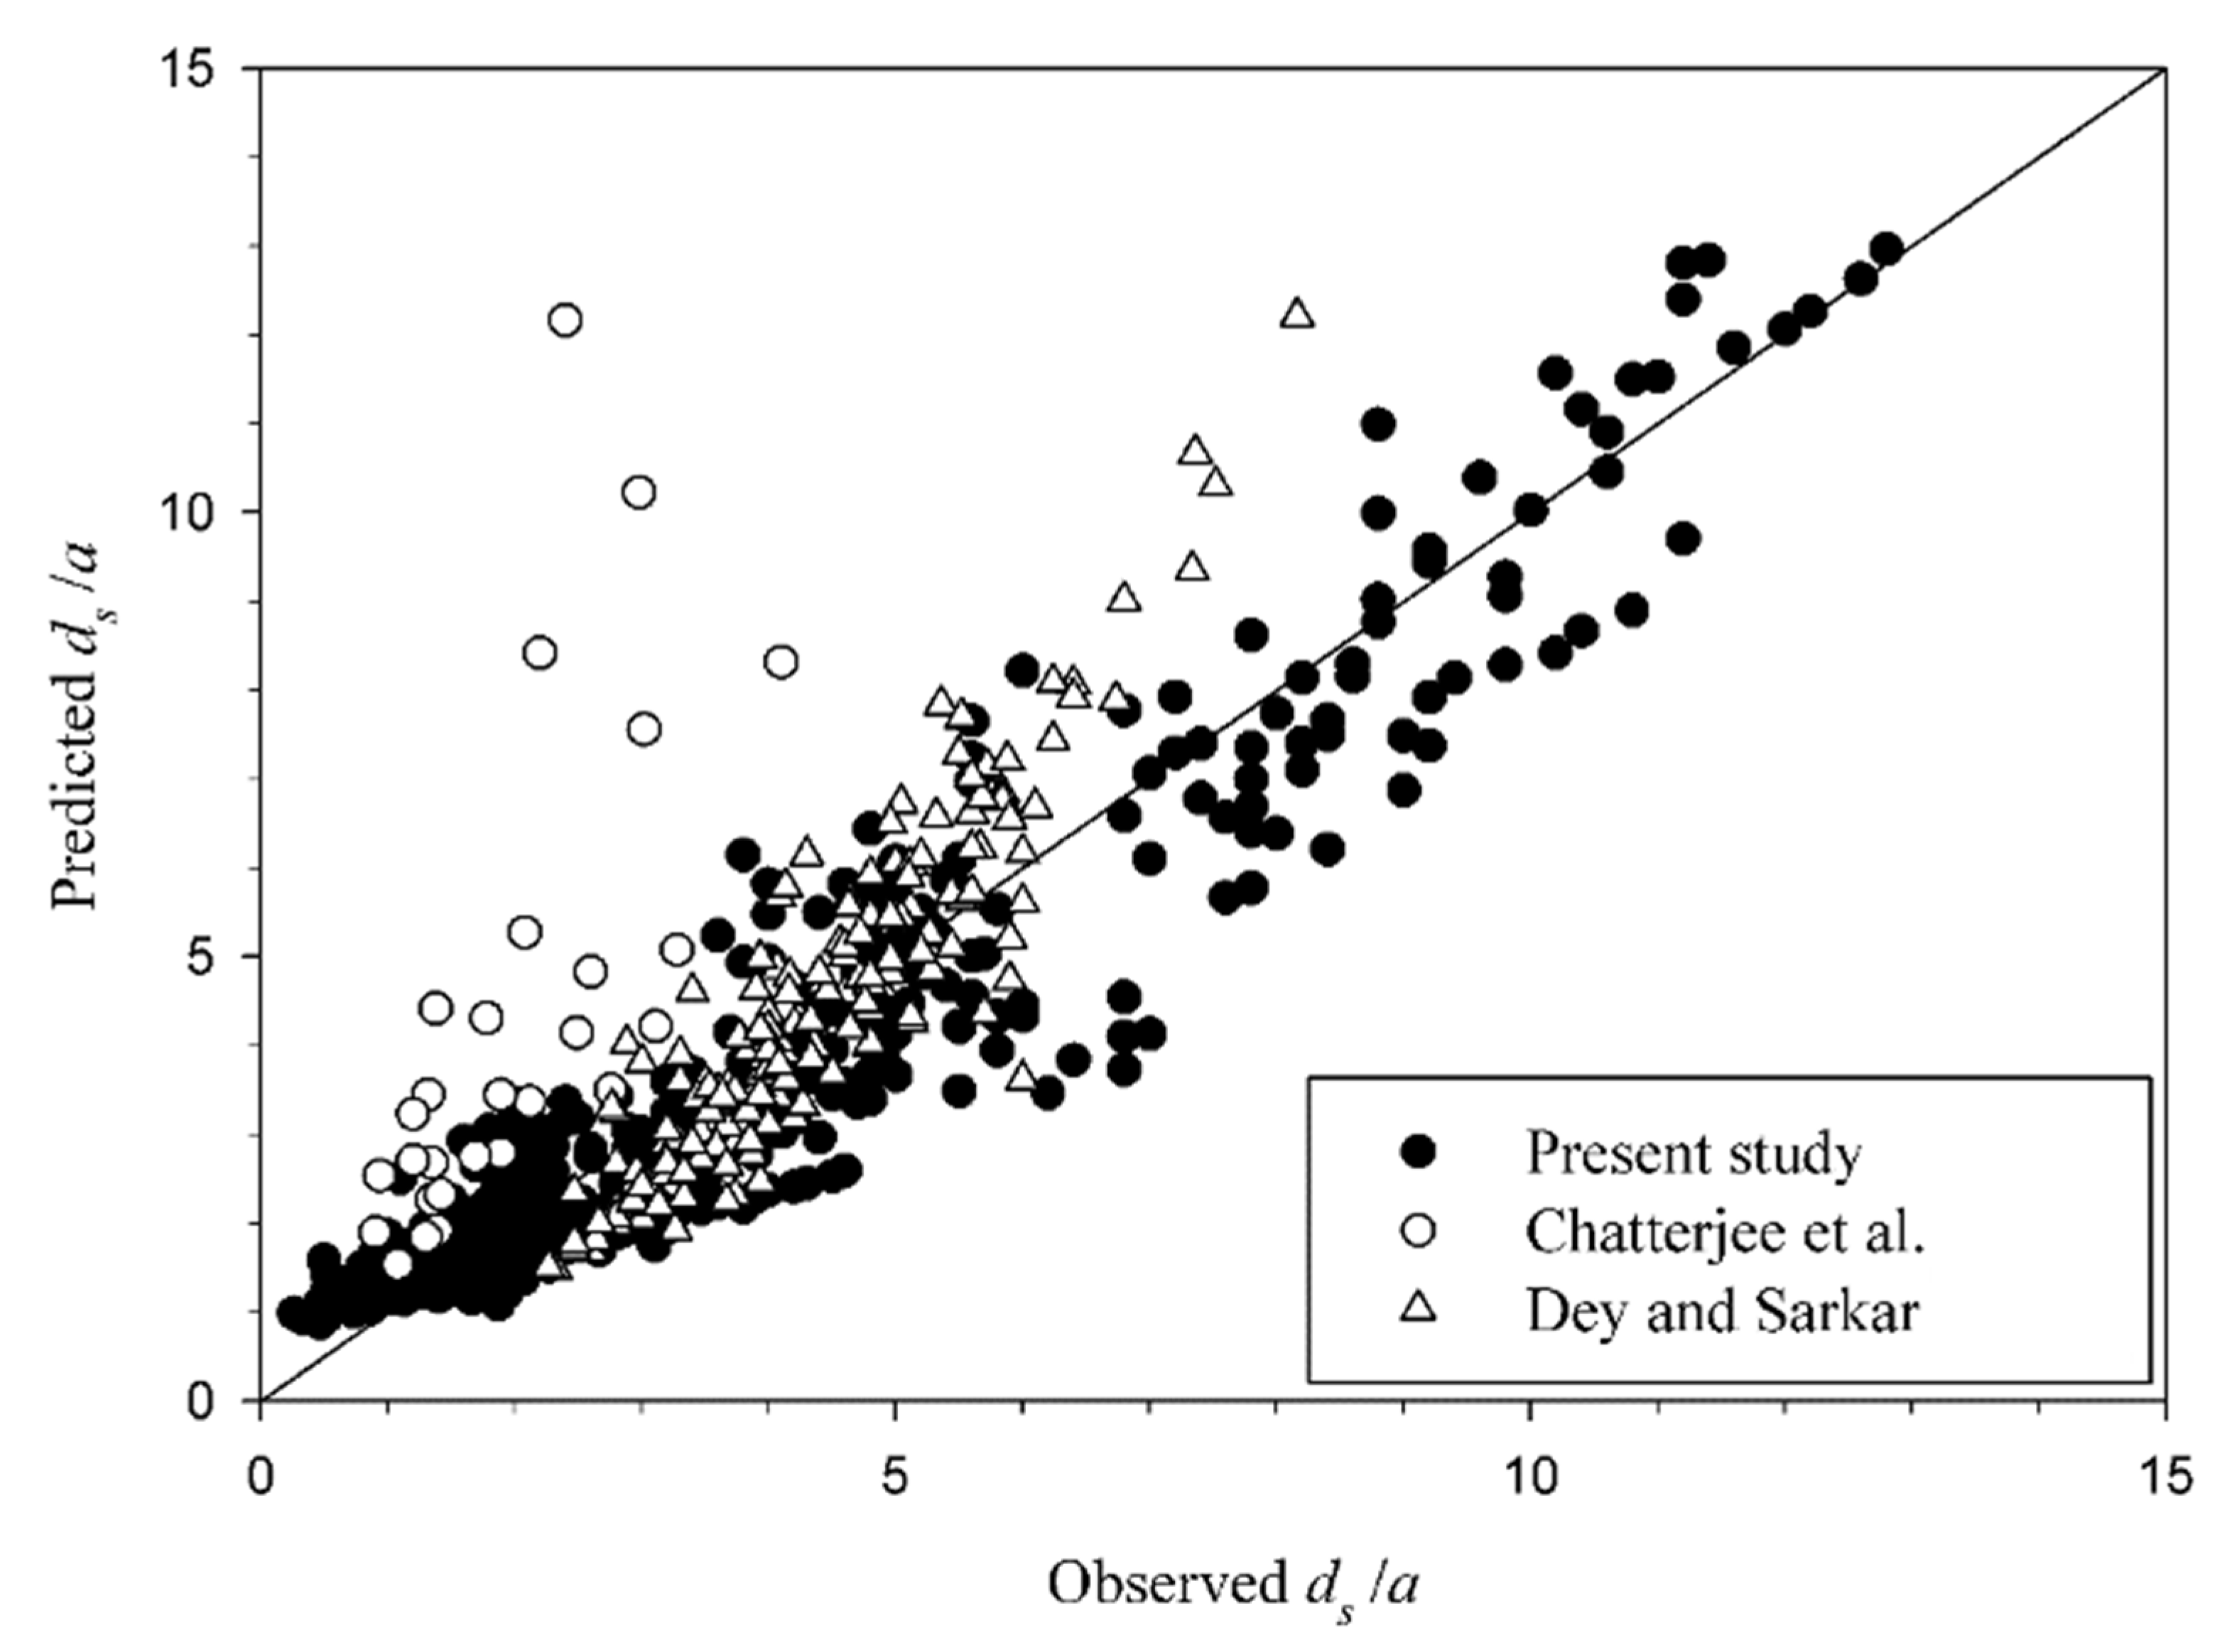
Equation (4) can be used to predict maximum scour depth for both smooth and rough aprons under wall jets. Figure 10 shows the comparison of experimental ds/a with that computed using Equation (4). The coefficient of regression between the computed and observed maximum scour depths is 0.92. This indicates that the computed maximum scour depth is in conformity with the observed maximum scour depth. Other statistical parameters were found to be as follows: RMSE = 0.09, MAPE = 0.32, and Scatter Index = 0.24. The experimental data of Chatterjee et al. [7] and Dey and Sarkar [15] were also used to calculate the maximum depth of scour using Equation (4) and plotted in the same figure for comparison. The equation fairly predicts the maximum depth of scour for the experimental data of Dey and Sarkar [15], while over-predictions are observed for the data of Chatterjee et al. [7].
The reason attributable to these over-predictions is the fact that the experimental runs performed by Chatterjee et al. [7] were carried out for shorter durations (0.2–4.7 h), which inhibited the development of the equilibrium scour hole. The methods employed by Dey and Sarkar [15] for scour depth measurements were same as used in this study, i.e., visual observations from the side wall of the flume.
4.3. Scour Profiles
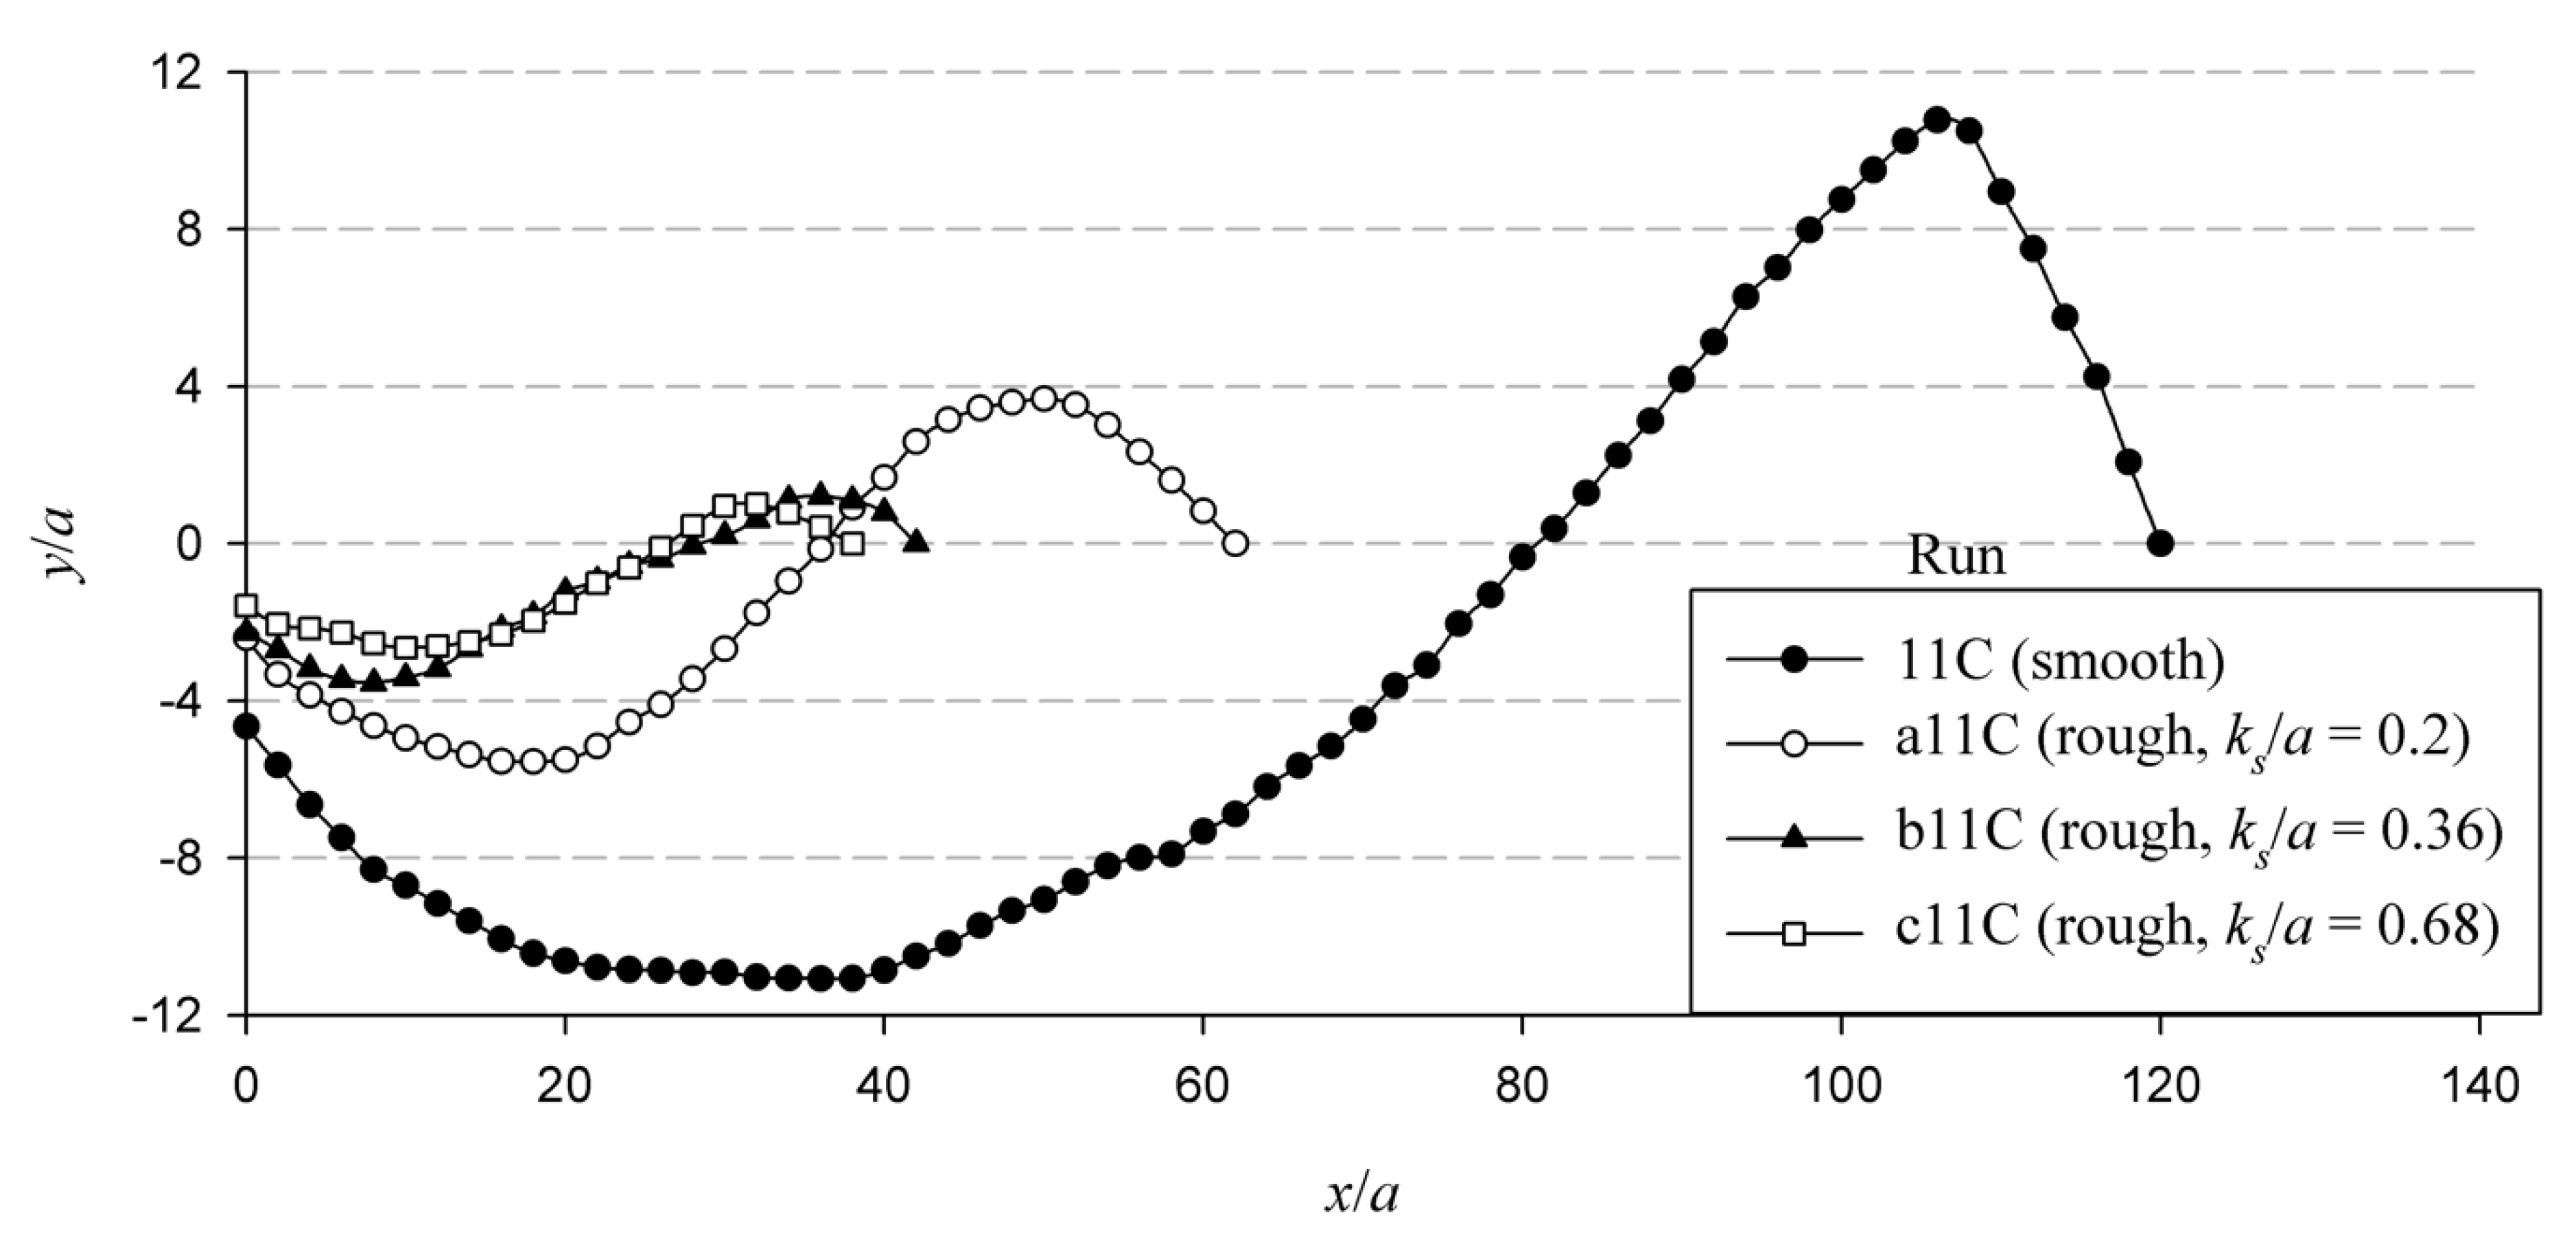
Temporal change in the scour profiles was measured for all experimental runs performed using rough and smooth aprons. Figure 11 shows the equilibrium scour profiles for some experimental runs over smooth and rough aprons. The normalized scour profiles can be represented by a combination of two polynomials as [15]:
where , , m0−3 and n0−3 = coefficients. A small amount of sediment was washed out at the edge of the apron due to flow-reversal, resulting in exposure of a small vertical portion of the apron, having a depth ɛdst, where ɛ is a parameter with a value less than 1. Scour profile characteristics and boundary conditions can be used to determine the coefficients m0, m1, m2, and m3, and n0, n1, n2, and n3.
A number of temporal variations of scour profiles for each experimental run were measured. An investigation of non-dimensional profiles of different runs provided in the Appendix A gives the values of the coefficients as m0 = −0.15, m1 = −0.58, m2 = 0.114, m3 = −0.005, n0 = 0.934, n1 = −0.561, n2 = 0.077, and n3 = −0.003. Figure 12 shows that the normalized scour profiles are in good agreement with those computed from Equations (5) and (6).
The volume of scour hole per unit width ξs and deposition of sediment as ridge ξd can be obtained as:
It is concluded from the above evaluation that 22.4% volume of sediment is washed away with the flow.
4.4. Temporal Variation of Scour Depth
Sumer et al. [39] represented the functional form of instantaneous scour depth dst at any time t as:
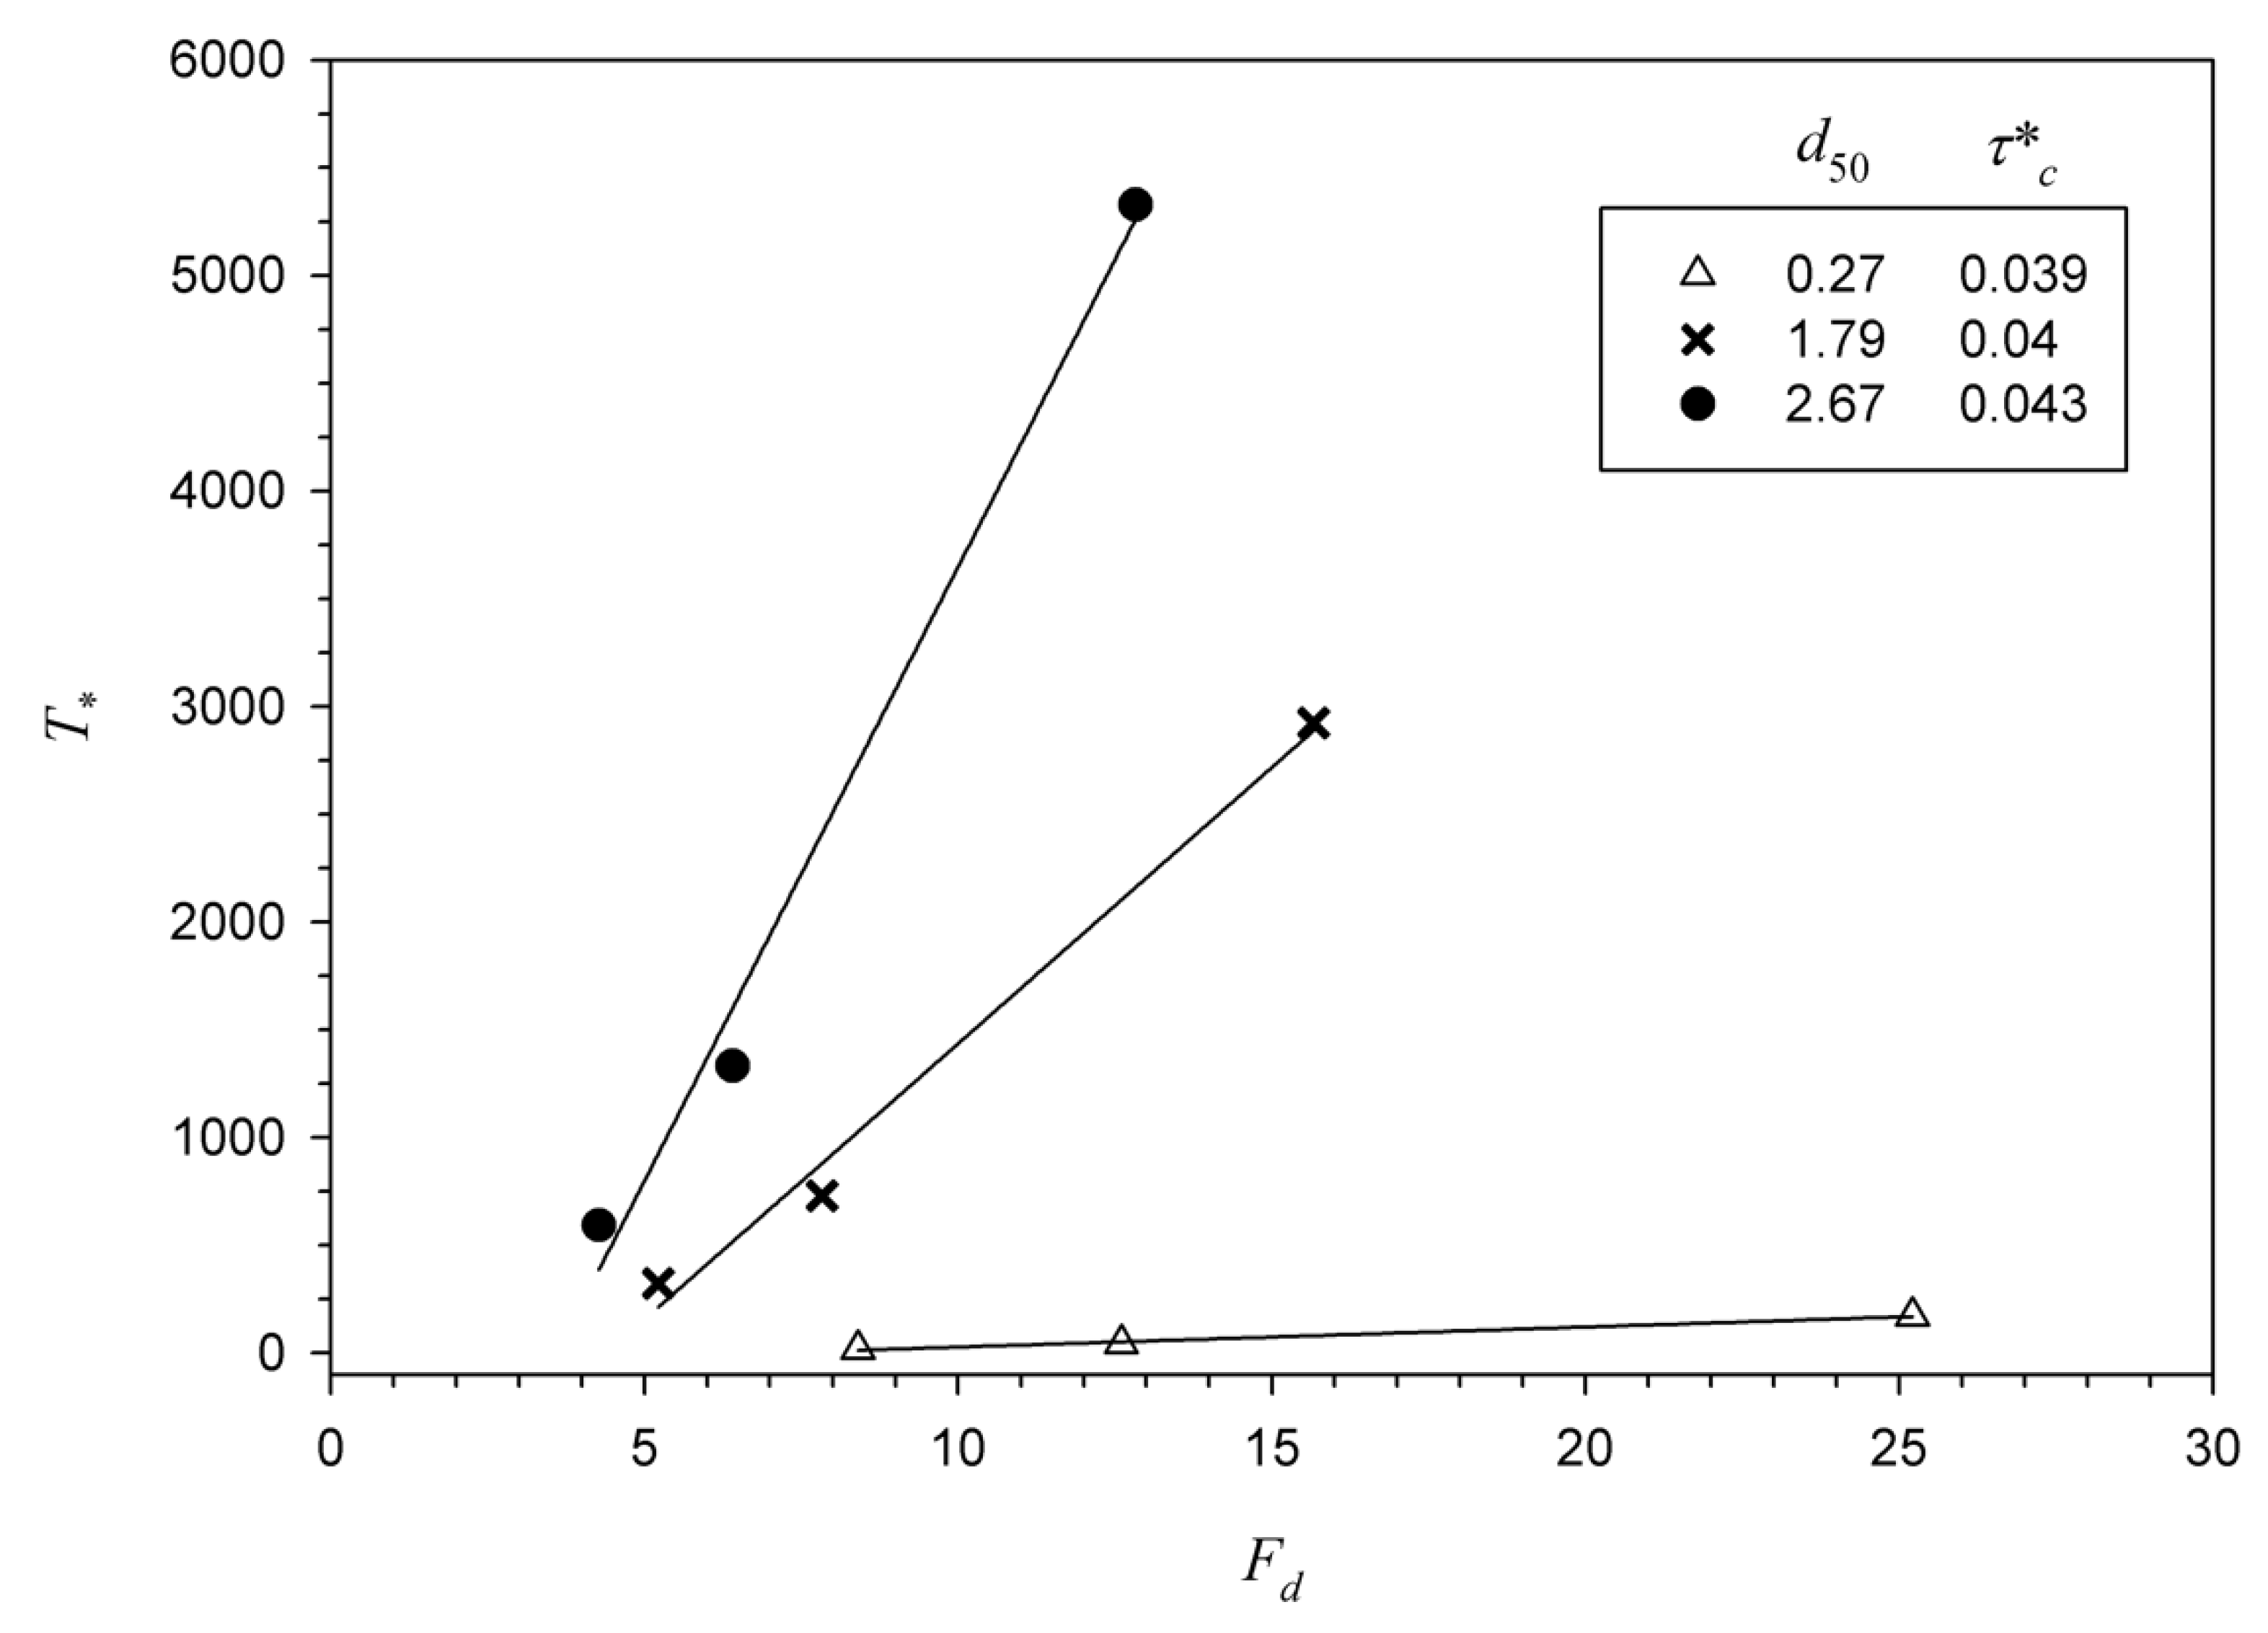
where T = time scale, which denotes the time to reach equilibrium condition. In normalized form, time scale can be represented as ; d50 = median particle size of sediment. In functional form, the normalized time scale can be written as:
where = Shields parameter [=τc/(Δρgd50)]; τc = threshold value of shear stress on horizontal bed; and ρ = mass density of water. Figure 13 shows the variation of with Fd for different d50 and . It is evident that the non-dimensional time scale increases linearly with Fd. For coarser sediments, the variation of with Fd is relatively steeper. From the present study, it was revealed that equilibrium scour condition was reached at 6 h time for fine sediments, however, for coarser sediments, this time was even further reduced. However, some experiments were carried out for 10 h, but the equilibrium scour depths obtained after this time were similar to those obtained after 6 h. Therefore, equilibrium scour time was taken as 8 h in this study.
5. Conclusions
The assessment of equilibrium scour depths for rough and smooth aprons shows that there is considerable decline in the maximum equilibrium depth of scour because of the increasing decay rate of the submerged jet over rough aprons. Important findings of the influence of roughness of the stiff apron on equilibrium scour and other features of submerged wall jets are abridged below:
- The maximum scour depth reduces significantly with a rise in the roughness of stiff apron. Further, equilibrium scour depth decreases with increasing sediment size. It is more for a shorter length of the stiff apron than for longer aprons. Also, the maximum depth of scour is higher for smaller slit size of sluice gate a. An increase in the maximum scour depth is observed with increasing densimetric Froude number.
- The influence of depth of tailwater level on maximum scour depth is such that there exists a critical tailwater level conforming with the minimum value of maximum scour depth. Thereafter, an increase in the maximum scour depth is seen with an increase in tailwater level.
- A new empirical equation for the prediction of maximum scour depth under smooth and rough apron is proposed. The proposed equation takes into account the influence of apron roughness on maximum scour depth, while the existing equations do not account for this parameter. Polynomial equations are also proposed for scour profiles under smooth and rough aprons.
- The maximum scour depth predicted using the proposed equation, which is applicable to both smooth and rough aprons, is in conformity with that obtained experimentally.
- The temporal scour profiles at distinct intervals of time obey a particular resemblance in geometry, both in the case of rough and smooth aprons. The scour profiles can be obtained from the proposed polynomial equations, which are satisfactory. The time variation of depth of scour was scaled by an exponential law. There is a linear increase in the time scale with densimetric Froude number.
- There is a significant reduction observed in the maximum scour depth due to roughness, which is in the range of 70–83%.
Although much research has been carried out on the hydraulics of flow under the influence of wall jets (including the present study), some grey areas still remain to be investigated for delivering reasonable solutions for the decline of scour downstream of a stiff apron, for example the influence of friction blocks constructed over the stiff apron to confine scour under wall jets, performance of jets over cohesive sediment beds, and flow characteristics over a mixture of cohesive sediments of different grain sizes. Also, numerical modeling of the wall jet problem, simulating the development of the scour profile using CFD, is expected to receive more attention in the near future.
Author Contributions
M.A.: data collection, composing, drafting and preparation of the manuscript, reviewing, and modifying; Z.A.: composing, data collection, preparation of the manuscript, reviewing, and modifying; M.P.: modifying and editing; M.A.K.: reviewing, modifying, and editing; A.A.: reviewing, and funding; A.M.: reviewing, and modifying. All authors have read and agreed to the published version of the manuscript.
Funding
This publication was supported by the Deanship of Scientific Research at Prince Sattam bin Abdulaziz University, Alkharj, Saudi Arabia.
Institutional Review Board Statement
Not applicable.
Informed Consent Statement
Not applicable.
Data Availability Statement
All the data used in this study are available from the corresponding author upon request.
Conflicts of Interest
The authors declare no conflict of interest.
Appendix A

Table A1.
Experimental data used in this study.
| Run | d50 (mm) | a (mm) | ks (mm) | dt (m) | V (m/s) | L (m) | ds (cm) |
|---|---|---|---|---|---|---|---|
| 1A | 0.27 | 5 | 0 | 0.1 | 1.67 | 0.5 | 10.1 |
| 2A | 0.27 | 5 | 0 | 0.125 | 1.67 | 0.5 | 9.5 |
| 3A | 0.27 | 5 | 0 | 0.15 | 1.67 | 0.5 | 10.1 |
| 4A | 0.27 | 10 | 0 | 0.1 | 0.83 | 0.5 | 5.5 |
| 5A | 0.27 | 10 | 0 | 0.125 | 0.83 | 0.5 | 4.8 |
| 6A | 0.27 | 10 | 0 | 0.15 | 0.83 | 0.5 | 4.9 |
| 7A | 0.27 | 15 | 0 | 0.1 | 0.56 | 0.5 | 4.0 |
| 8A | 0.27 | 15 | 0 | 0.125 | 0.56 | 0.5 | 3.8 |
| 9A | 0.27 | 15 | 0 | 0.15 | 0.56 | 0.5 | 3.9 |
| 10B | 6.70 | 5 | 0 | 0.1 | 2.67 | 0.5 | 4.5 |
| 10B1 | 6.70 | 5 | 0 | 0.11 | 2.67 | 0.5 | 4.2 |
| 11B | 6.70 | 5 | 0 | 0.125 | 2.67 | 0.5 | 4.6 |
| 11B1 | 6.70 | 5 | 0 | 0.14 | 2.67 | 0.5 | 4.7 |
| 12B | 6.70 | 5 | 0 | 0.15 | 2.67 | 0.5 | 4.9 |
| 12B1 | 6.70 | 5 | 0 | 0.16 | 2.67 | 0.5 | 5.1 |
| 12B2 | 6.70 | 5 | 0 | 0.18 | 2.67 | 0.5 | 5.2 |
| 12B3 | 6.70 | 5 | 0 | 0.20 | 2.67 | 0.5 | 5.4 |
| 13B | 6.70 | 10 | 0 | 0.1 | 1.33 | 0.5 | 3.8 |
| 13B1 | 6.70 | 10 | 0 | 0.11 | 1.33 | 0.5 | 3.6 |
| 14B | 6.70 | 10 | 0 | 0.125 | 1.33 | 0.5 | 3.9 |
| 14B1 | 6.70 | 10 | 0 | 0.14 | 1.33 | 0.5 | 4.0 |
| 15B | 6.70 | 10 | 0 | 0.15 | 1.33 | 0.5 | 4.2 |
| 15B1 | 6.70 | 10 | 0 | 0.16 | 1.33 | 0.5 | 4.3 |
| 15B2 | 6.70 | 10 | 0 | 0.18 | 1.33 | 0.5 | 4.5 |
| 15B3 | 6.70 | 10 | 0 | 0.20 | 1.33 | 0.5 | 4.6 |
| 16B | 6.70 | 15 | 0 | 0.1 | 0.89 | 0.5 | 1.1 |
| 16B1 | 6.70 | 15 | 0 | 0.11 | 0.89 | 0.5 | 1.0 |
| 17B | 6.70 | 15 | 0 | 0.125 | 0.89 | 0.5 | 1.3 |
| 17B1 | 6.70 | 15 | 0 | 0.14 | 0.89 | 0.5 | 1.5 |
| 18B | 6.70 | 15 | 0 | 0.15 | 0.89 | 0.5 | 1.6 |
| 18B1 | 6.70 | 15 | 0 | 0.16 | 0.89 | 0.5 | 1.7 |
| 18B2 | 6.70 | 15 | 0 | 0.18 | 0.89 | 0.5 | 1.9 |
| 18B3 | 6.70 | 15 | 0 | 0.20 | 0.89 | 0.5 | 2.0 |
| 10C | 2.67 | 5 | 0 | 0.1 | 2.67 | 0.5 | 5.3 |
| 10C1 | 2.67 | 5 | 0 | 0.11 | 2.67 | 0.5 | 5.2 |
| 11C | 2.67 | 5 | 0 | 0.125 | 2.67 | 0.5 | 5.5 |
| 11C1 | 2.67 | 5 | 0 | 0.14 | 2.67 | 0.5 | 5.8 |
| 12C | 2.67 | 5 | 0 | 0.15 | 2.67 | 0.5 | 6.0 |
| 12C1 | 2.67 | 5 | 0 | 0.16 | 2.67 | 0.5 | 6.1 |
| 12C2 | 2.67 | 5 | 0 | 0.18 | 2.67 | 0.5 | 6.3 |
| 12C3 | 2.67 | 5 | 0 | 0.20 | 2.67 | 0.5 | 6.4 |
| 13C | 2.67 | 10 | 0 | 0.1 | 1.33 | 0.5 | 4.2 |
| 13C1 | 2.67 | 10 | 0 | 0.11 | 1.33 | 0.5 | 4.1 |
| 14C | 2.67 | 10 | 0 | 0.125 | 1.33 | 0.5 | 4.7 |
| 14C1 | 2.67 | 10 | 0 | 0.14 | 1.33 | 0.5 | 4.5 |
| 15C | 2.67 | 10 | 0 | 0.15 | 1.33 | 0.5 | 4.5 |
| 15C1 | 2.67 | 10 | 0 | 0.16 | 1.33 | 0.5 | 4.6 |
| 15C2 | 2.67 | 10 | 0 | 0.18 | 1.33 | 0.5 | 4.8 |
| 15C3 | 2.67 | 10 | 0 | 0.20 | 1.33 | 0.5 | 4.9 |
| 16C | 2.67 | 15 | 0 | 0.1 | 0.89 | 0.5 | 2.5 |
| 16C1 | 2.67 | 15 | 0 | 0.11 | 0.89 | 0.5 | 2.4 |
| 17C | 2.67 | 15 | 0 | 0.125 | 0.89 | 0.5 | 2.9 |
| 17C1 | 2.67 | 15 | 0 | 0.14 | 0.89 | 0.5 | 2.8 |
| 18C | 2.67 | 15 | 0 | 0.15 | 0.89 | 0.5 | 2.9 |
| 18C1 | 2.67 | 15 | 0 | 0.16 | 0.89 | 0.5 | 3.0 |
| 18C2 | 2.67 | 15 | 0 | 0.18 | 0.89 | 0.5 | 3.2 |
| 18C3 | 2.67 | 15 | 0 | 0.20 | 0.89 | 0.5 | 3.3 |
| 10D | 1.79 | 5 | 0 | 0.1 | 2.67 | 0.5 | 5.7 |
| 10D1 | 1.79 | 5 | 0 | 0.11 | 2.67 | 0.5 | 5.5 |
| 11D | 1.79 | 5 | 0 | 0.125 | 2.67 | 0.5 | 5.4 |
| 11D1 | 1.79 | 5 | 0 | 0.14 | 2.67 | 0.5 | 5.6 |
| 12D | 1.79 | 5 | 0 | 0.15 | 2.67 | 0.5 | 5.7 |
| 12D1 | 1.79 | 5 | 0 | 0.16 | 2.67 | 0.5 | 5.8 |
| 12D2 | 1.79 | 5 | 0 | 0.18 | 2.67 | 0.5 | 6.1 |
| 12D3 | 1.79 | 5 | 0 | 0.20 | 2.67 | 0.5 | 6.3 |
| 13D | 1.79 | 10 | 0 | 0.1 | 1.33 | 0.5 | 4.4 |
| 13D1 | 1.79 | 10 | 0 | 0.11 | 1.33 | 0.5 | 4.2 |
| 14D | 1.79 | 10 | 0 | 0.125 | 1.33 | 0.5 | 4.0 |
| 14D1 | 1.79 | 10 | 0 | 0.14 | 1.33 | 0.5 | 4.3 |
| 15D | 1.79 | 10 | 0 | 0.15 | 1.33 | 0.5 | 5.0 |
| 15D1 | 1.79 | 10 | 0 | 0.16 | 1.33 | 0.5 | 5.5 |
| 15D2 | 1.79 | 10 | 0 | 0.18 | 1.33 | 0.5 | 5.8 |
| 15D3 | 1.79 | 10 | 0 | 0.20 | 1.33 | 0.5 | 6.0 |
| 16D | 1.79 | 15 | 0 | 0.1 | 0.89 | 0.5 | 3.5 |
| 16D1 | 1.79 | 15 | 0 | 0.11 | 0.89 | 0.5 | 3.3 |
| 17D | 1.79 | 15 | 0 | 0.125 | 0.89 | 0.5 | 3.2 |
| 17D1 | 1.79 | 15 | 0 | 0.14 | 0.89 | 0.5 | 3.3 |
| 18D | 1.79 | 15 | 0 | 0.15 | 0.89 | 0.5 | 3.4 |
| 18D1 | 1.79 | 15 | 0 | 0.16 | 0.89 | 0.5 | 3.5 |
| 18D2 | 1.79 | 15 | 0 | 0.18 | 0.89 | 0.5 | 4.8 |
| 18D3 | 1.79 | 15 | 0 | 0.20 | 0.89 | 0.5 | 5.2 |
| 19D | 1.79 | 5 | 0 | 0.1 | 2.67 | 0.4 | 5.6 |
| 20D | 1.79 | 5 | 0 | 0.125 | 2.67 | 0.4 | 5.5 |
| 21D | 1.79 | 5 | 0 | 0.15 | 2.67 | 0.4 | 5.9 |
| 22D | 1.79 | 10 | 0 | 0.1 | 1.33 | 0.4 | 4.8 |
| 23D | 1.79 | 10 | 0 | 0.125 | 1.33 | 0.4 | 4.7 |
| 24D | 1.79 | 10 | 0 | 0.15 | 1.33 | 0.4 | 4.9 |
| 25D | 1.79 | 15 | 0 | 0.1 | 0.89 | 0.4 | 4.2 |
| 26D | 1.79 | 15 | 0 | 0.125 | 0.89 | 0.4 | 4.2 |
| 27D | 1.79 | 15 | 0 | 0.15 | 0.89 | 0.4 | 4.3 |
| 28D | 1.79 | 5 | 0 | 0.1 | 2.67 | 0.3 | 5.9 |
| 29D | 1.79 | 5 | 0 | 0.125 | 2.67 | 0.3 | 5.7 |
| 30D | 1.79 | 5 | 0 | 0.15 | 2.67 | 0.3 | 6.1 |
| 31D | 1.79 | 10 | 0 | 0.1 | 1.33 | 0.3 | 5.2 |
| 32D | 1.79 | 10 | 0 | 0.125 | 1.33 | 0.3 | 5.0 |
| 33D | 1.79 | 10 | 0 | 0.15 | 1.33 | 0.3 | 5.5 |
| 34D | 1.79 | 15 | 0 | 0.1 | 0.89 | 0.3 | 4.8 |
| 35D | 1.79 | 15 | 0 | 0.125 | 0.89 | 0.3 | 4.6 |
| 36D | 1.79 | 15 | 0 | 0.15 | 0.89 | 0.3 | 4.9 |
| a10C | 2.67 | 5 | 1.00 | 0.1 | 2.67 | 0.5 | 3.4 |
| a11C | 2.67 | 5 | 1.00 | 0.125 | 2.67 | 0.5 | 2.8 |
| a12C | 2.67 | 5 | 1.00 | 0.15 | 2.67 | 0.5 | 3.6 |
| a13C | 2.67 | 10 | 1.00 | 0.1 | 1.33 | 0.5 | 2.8 |
| a14C | 2.67 | 10 | 1.00 | 0.125 | 1.33 | 0.5 | 2.3 |
| a15C | 2.67 | 10 | 1.00 | 0.15 | 1.33 | 0.5 | 3.1 |
| a16C | 2.67 | 15 | 1.00 | 0.1 | 0.89 | 0.5 | 1.5 |
| a17C | 2.67 | 15 | 1.00 | 0.125 | 0.89 | 0.5 | 1.1 |
| a18C | 2.67 | 15 | 1.00 | 0.15 | 0.89 | 0.5 | 1.8 |
| b10C | 2.67 | 5 | 1.79 | 0.1 | 2.67 | 0.5 | 2.1 |
| b11C | 2.67 | 5 | 1.79 | 0.125 | 2.67 | 0.5 | 1.9 |
| b12C | 2.67 | 5 | 1.79 | 0.15 | 2.67 | 0.5 | 2.4 |
| b13C | 2.67 | 10 | 1.79 | 0.1 | 1.33 | 0.5 | 1.6 |
| b14C | 2.67 | 10 | 1.79 | 0.125 | 1.33 | 0.5 | 1.5 |
| b15C | 2.67 | 10 | 1.79 | 0.15 | 1.33 | 0.5 | 1.8 |
| b16C | 2.67 | 15 | 1.79 | 0.1 | 0.89 | 0.5 | 1.4 |
| b17C | 2.67 | 15 | 1.79 | 0.125 | 0.89 | 0.5 | 1.3 |
| b18C | 2.67 | 15 | 1.79 | 0.15 | 0.89 | 0.5 | 1.5 |
| c10C | 2.67 | 5 | 3.40 | 0.1 | 2.67 | 0.5 | 1.6 |
| c11C | 2.67 | 5 | 3.40 | 0.125 | 2.67 | 0.5 | 1.3 |
| c12C | 2.67 | 5 | 3.40 | 0.15 | 2.67 | 0.5 | 1.6 |
| c13C | 2.67 | 10 | 3.40 | 0.1 | 1.33 | 0.5 | 1.1 |
| c14C | 2.67 | 10 | 3.40 | 0.125 | 1.33 | 0.5 | 0.9 |
| c15C | 2.67 | 10 | 3.40 | 0.15 | 1.33 | 0.5 | 1.3 |
| c16C | 2.67 | 15 | 3.40 | 0.1 | 0.89 | 0.5 | 0.7 |
| c17C | 2.67 | 15 | 3.40 | 0.125 | 0.89 | 0.5 | 0.5 |
| c18C | 2.67 | 15 | 3.40 | 0.15 | 0.89 | 0.5 | 0.8 |
References
- Rouse, H. Criteria for similarity in transportation of sediment. In Proceedings of the 1st Hydraulic Conference, Iowa City, IA, USA, 12–15 June 1939; pp. 33–49. [Google Scholar]
- Laursen, E.M. Observations of the Nature of Scour. In Proceedings of the 5th Hydraulic Conference, University of Iowa, Iowa City, IA, USA, 9–12 June 1952; pp. 179–197. [Google Scholar]
- Tarapore, Z.S. Scour below a submerged sluice gate. Master’s Thesis, University of Minnesota, Minneapolis, MN, USA, 1956. [Google Scholar]
- Hogg, A.J.; Huppert, H.E.; Dade, W.B. Erosion by planar turbulent wall jets. J. Fluid Mech. 1997, 338, 317–340. [Google Scholar] [CrossRef] [Green Version]
- Carstens, M.R. Similarity laws for localized scour. J. Hydraul. Div. 1966, 92, 13–36. [Google Scholar] [CrossRef]
- Chatterjee, S.S.; Ghosh, S.N. Submerged horizontal jet over erodible bed. J. Hydraul. Div. 1980, 106, 1765–1782. [Google Scholar] [CrossRef]
- Chatterjee, S.S.; Ghosh, S.N.; Chatterjee, M. Local scour due to submerged horizontal jet. J. Hydraul. Eng. 1994, 120, 973–992. [Google Scholar] [CrossRef]
- Rajaratnam, N. Erosion by plane turbulent jets. J. Hydraul. Res. 1981, 19, 339–358. [Google Scholar] [CrossRef]
- Rajaratnam, N.; Macdougall, R.K. Erosion by plane wall jets with minimum tail water. J. Hydraul. Eng. 1983, 109, 1061–1064. [Google Scholar] [CrossRef]
- Hassan, N.M.K.N.; Narayanan, R. Local scour downstream of an apron. J. Hydraul. Eng. 1985, 111, 1371–1385. [Google Scholar] [CrossRef]
- Ali, K.H.M.; Lim, S.Y. Local scour caused by submerged wall jets. Proc. Inst. Civ. Eng. 1986, 81, 607–645. [Google Scholar]
- Aderibigbe, O.; Rajaratnam, N. Effect of sediment gradation on erosion by plane turbulent wall jets. J. Hydraul. Eng. 1998, 124, 1034–1042. [Google Scholar] [CrossRef]
- Hamidifar, H.; Omid, M.H.; Nasrabadi, M. Scour downstream of a rough rigid apron. World Appl. Sci. J. 2011, 14, 1169–1178. [Google Scholar]
- Ali, H.M.; El Gendy, M.M.; Mirdan, A.M.H.; Ali, A.A.M.; Abdelhaleem, F.S.F. Minimizing downstream scour due to submerged hydraulic jump using corrugated aprons. Ain Shams Eng. J. 2014, 5, 1059–1069. [Google Scholar] [CrossRef] [Green Version]
- Dey, S.; Sarkar, A. Scour downstream of an apron due to submerged horizontal jets. J. Hydraul. Eng. 2006, 132, 246–257. [Google Scholar] [CrossRef]
- Sarkar, A.; Dey, S. Scour downstream of aprons caused by sluices. Proc. Inst. Civ. Eng. Water Manag. 2005, 158, 55–64. [Google Scholar] [CrossRef]
- Aamir, M.; Ahmad, Z. Estimation of scour depth downstream of an apron under 2D horizontal jets. In Proceedings of the HYDRO 2015 International—20th International Conference on Hydraulics, Water Resources and River Engineering, Indian Institute of Technology, Roorkee, India, 17–19 December 2015. [Google Scholar]
- Aamir, M.; Ahmad, Z. Prediction of local scour depth downstream of an apron under wall jets. In Development of Water Resources in India; Garg, V., Singh, V., Raj, V., Eds.; Water Science and Technology Library; Springer: Cham, Switzerland, 2017; Volume 75, pp. 375–385. [Google Scholar]
- Azamathulla, H.M.; Ahmad, Z. Gene-expression programming for transverse mixing coefficient. J. Hydrol. 2012, 434–435, 142–148. [Google Scholar] [CrossRef]
- Azamathulla, H.M.; Deo, M.C.; Deolalikar, P.B. Neural networks for estimation of scour downstream of a ski-jump bucket. J. Hydraul. Eng. 2005, 131, 898–908. [Google Scholar] [CrossRef]
- Azamathulla, H.M.; Deo, M.C.; Deolalikar, P.B. Estimation of scour below spillways using neural networks. J. Hydraul. Res. 2006, 44, 61–69. [Google Scholar] [CrossRef]
- Azamathulla, H.M.; Ghani, A.A.; Zakaria, N.A.; Guven, A. Genetic programming to predict bridge pier scour. J. Hydraul. Eng. 2010, 136, 165–169. [Google Scholar] [CrossRef] [Green Version]
- Bashiri, H.; Sharifi, E.; Singh, V.P. Prediction of local scour depth downstream of sluice gates using harmony search algorithm and artificial neural networks. J. Irrig. Drain. Eng. 2018, 144, 06018002. [Google Scholar] [CrossRef]
- Najafzadeh, M.; Oliveto, G. More reliable predictions of clear-water scour depth at pile groups by robust artificial intelligence techniques while preserving physical consistency. Soft Comput. 2021, 25, 5723–5746. [Google Scholar] [CrossRef]
- Aamir, M.; Ahmad, Z. Review of literature on local scour under plane turbulent wall jets. Phys. Fluids 2016, 28, 105102. [Google Scholar] [CrossRef]
- Muller, L.; Chanson, H. Singular air entrapment at vertical and horizontal supported jets: Plunging jets versus hydraulic jumps. Environ. Fluid Mech. 2020, 20, 1075–1100. [Google Scholar] [CrossRef]
- Aamir, M.; Ahmad, Z. Effect of apron roughness on flow characteristics and scour depth under submerged wall jets. Acta Geophys. 2021; in press. [Google Scholar] [CrossRef]
- Asadollahi, M.; Vaghefi, M.; Akbari, M. Effect of the position of perpendicular pier groups in a sharp bend on flow and scour patterns: Numerical simulation. J. Braz. Soc. Mech. Sci. Eng. 2020, 42, 422. [Google Scholar] [CrossRef]
- Bhave, S.; Kumar, S.; Singh, U.K.; Pandey, M.; Ahmad, Z. Experimental investigation of a trench weir with T-shaped bars. J. Braz. Soc. Mech. Sci. Eng. 2020, 42, 535. [Google Scholar] [CrossRef]
- Dehghan, D.; Vaghefi, M.; Ghodsian, M. Experimental study of the effect of the length-to-width ratio and skewness angles of the pier installed at the bend on scour pattern. J. Braz. Soc. Mech. Sci. Eng. 2021, 43, 150. [Google Scholar] [CrossRef]
- Pandey, M.; Oliveto, G.; Pu, J.H.; Sharma, P.K.; Ojha, C.S.P. Pier scour prediction in non-uniform gravel beds. Water 2020, 12, 1696. [Google Scholar] [CrossRef]
- Vaghefi, M.; Faraji, B.; Akbari, M.; Eghbalzadeh, A. Numerical investigation of flow pattern around a T-shaped spur dike in the vicinity of attractive and repelling protective structures. J. Braz. Soc. Mech. Sci. Eng. 2018, 40, 93. [Google Scholar]
- Vaghefi, M.; Solati, S.; Chooplou, C.H. The effect of upstream T-shaped spur dike on reducing the amount of scouring around downstream bridge pier located at a 180° sharp bend. Int. J. River Basin Manag. 2021, 19, 307–318. [Google Scholar] [CrossRef]
- Bestawy, A.; Eltahawy, T.; Alsaluli, A.; Almaliki, A.; Alqurashi, M. Reduction of local scour around a bridge pier by using different shapes of pier slots and collars. Water Supply 2020, 20, 1006–1015. [Google Scholar] [CrossRef]
- Chavan, R.; Kumar, B. Prediction of scour depth and dune morphology around circular bridge piers in seepage affected alluvial channels. Environ. Fluid Mech. 2018, 18, 923–945. [Google Scholar] [CrossRef]
- Keshavarzi, A.; Shrestha, C.K.; Melville, B.; Khabbaz, H.; Ranjbar-Zahedani, M.; Ball, J. Estimation of maximum scour depths at upstream of front and rear piers for two in-line circular columns. Environ. Fluid Mech. 2018, 18, 537–550. [Google Scholar] [CrossRef]
- Pandey, M.; Sharma, P.K.; Ahmad, Z.; Singh, U.K. Experimental investigation of clear-water temporal scour variation around bridge pier in gravel. Environ. Fluid Mech. 2018, 18, 871–890. [Google Scholar] [CrossRef]
- Aamir, M.; Ahmad, Z. Estimation of maximum scour depth downstream of an apron under submerged wall jets. J. Hydroinformatics 2019, 21, 523–540. [Google Scholar] [CrossRef]
- Sumer, B.M.; Christiansen, N.; Fredsoe, J. Influence of cross section on wave scour around piles. J. Waterw. Port Coast. Ocean. Eng. 1993, 119, 477–495. [Google Scholar] [CrossRef]
Figure 1.
Scour hole under a wall jet.

Figure 2.
Plan and section of the experimental setup.

Figure 3.
Velocity profiles at different longitudinal sections within the scour hole.

Figure 4.
ds/a variation with ks/a for various a and dt.

Figure 5.
ds/a variation with d50/a for various a and dt.

Figure 6.
ds/a variation with L/a for various a and dt.

Figure 7.
ds/a variation with Fd for various (a) d50, and (b) dt, and L.

Figure 8.
For various F and d50, the variation of ds/a with dt/a.


Figure 10.
The maximum scour depths ds/a calculated using Equation (4) is compared with the experimental data (Chatterjee [7] and Dey and Sarkar [15]).

Figure 11.
The profiles of equilibrium scour for smooth and rough aprons for various runs.

Figure 12.
Non-dimensional scour profiles for different runs at (a) t = 1 h and (b) t = 8 h.

Figure 13.
Variation of with Fd for different d50 and .

Table 1.
Sediment properties used in the tests are displayed.
| Median Size d50 (mm) | Geometric Standard Deviation σg | Relative Density s | Angle of Repose ϕ (Degree) | Shields Parameter |
|---|---|---|---|---|
| 0.27 | 1.45 | 2.65 | 29 | 0.039 |
| 1.79 | 1.14 | 2.65 | 31.5 | 0.04 |
| 2.67 | 1.11 | 2.65 | 33 | 0.043 |
| 6.70 | 1.26 | 2.65 | 37.5 | 0.055 |
Table 2.
Range of collected experimental data.
| No. of Experimental Runs | d50 (mm) | a (mm) | ks (mm) | dt (m) | V (m/s) | L (m) | ds (cm) |
|---|---|---|---|---|---|---|---|
| 126 | 0.27–6.70 | 5–15 | 0–3.40 | 0.1–0.2 | 0.56–2.67 | 0.3–0.5 | 0.5–10.1 |
Publisher’s Note: MDPI stays neutral with regard to jurisdictional claims in published maps and institutional affiliations. |
© 2022 by the authors. Licensee MDPI, Basel, Switzerland. This article is an open access article distributed under the terms and conditions of the Creative Commons Attribution (CC BY) license (https://creativecommons.org/licenses/by/4.0/).
Share and Cite
MDPI and ACS Style
Aamir, M.; Ahmad, Z.; Pandey, M.; Khan, M.A.; Aldrees, A.; Mohamed, A. The Effect of Rough Rigid Apron on Scour Downstream of Sluice Gates. Water 2022, 14, 2223. https://doi.org/10.3390/w14142223
AMA Style
Aamir M, Ahmad Z, Pandey M, Khan MA, Aldrees A, Mohamed A. The Effect of Rough Rigid Apron on Scour Downstream of Sluice Gates. Water. 2022; 14(14):2223. https://doi.org/10.3390/w14142223
Chicago/Turabian StyleAamir, Mohammad, Zulfequar Ahmad, Manish Pandey, Mohammad Amir Khan, Ali Aldrees, and Abdullah Mohamed. 2022. "The Effect of Rough Rigid Apron on Scour Downstream of Sluice Gates" Water 14, no. 14: 2223. https://doi.org/10.3390/w14142223
Note that from the first issue of 2016, this journal uses article numbers instead of page numbers. See further details here.