
Key Factors Dominating the Groundwater Chemical Composition in a Grain Production Base: A Case Study of Muling–Xingkai Plain, Northeast China

Abstract
:1. Introduction
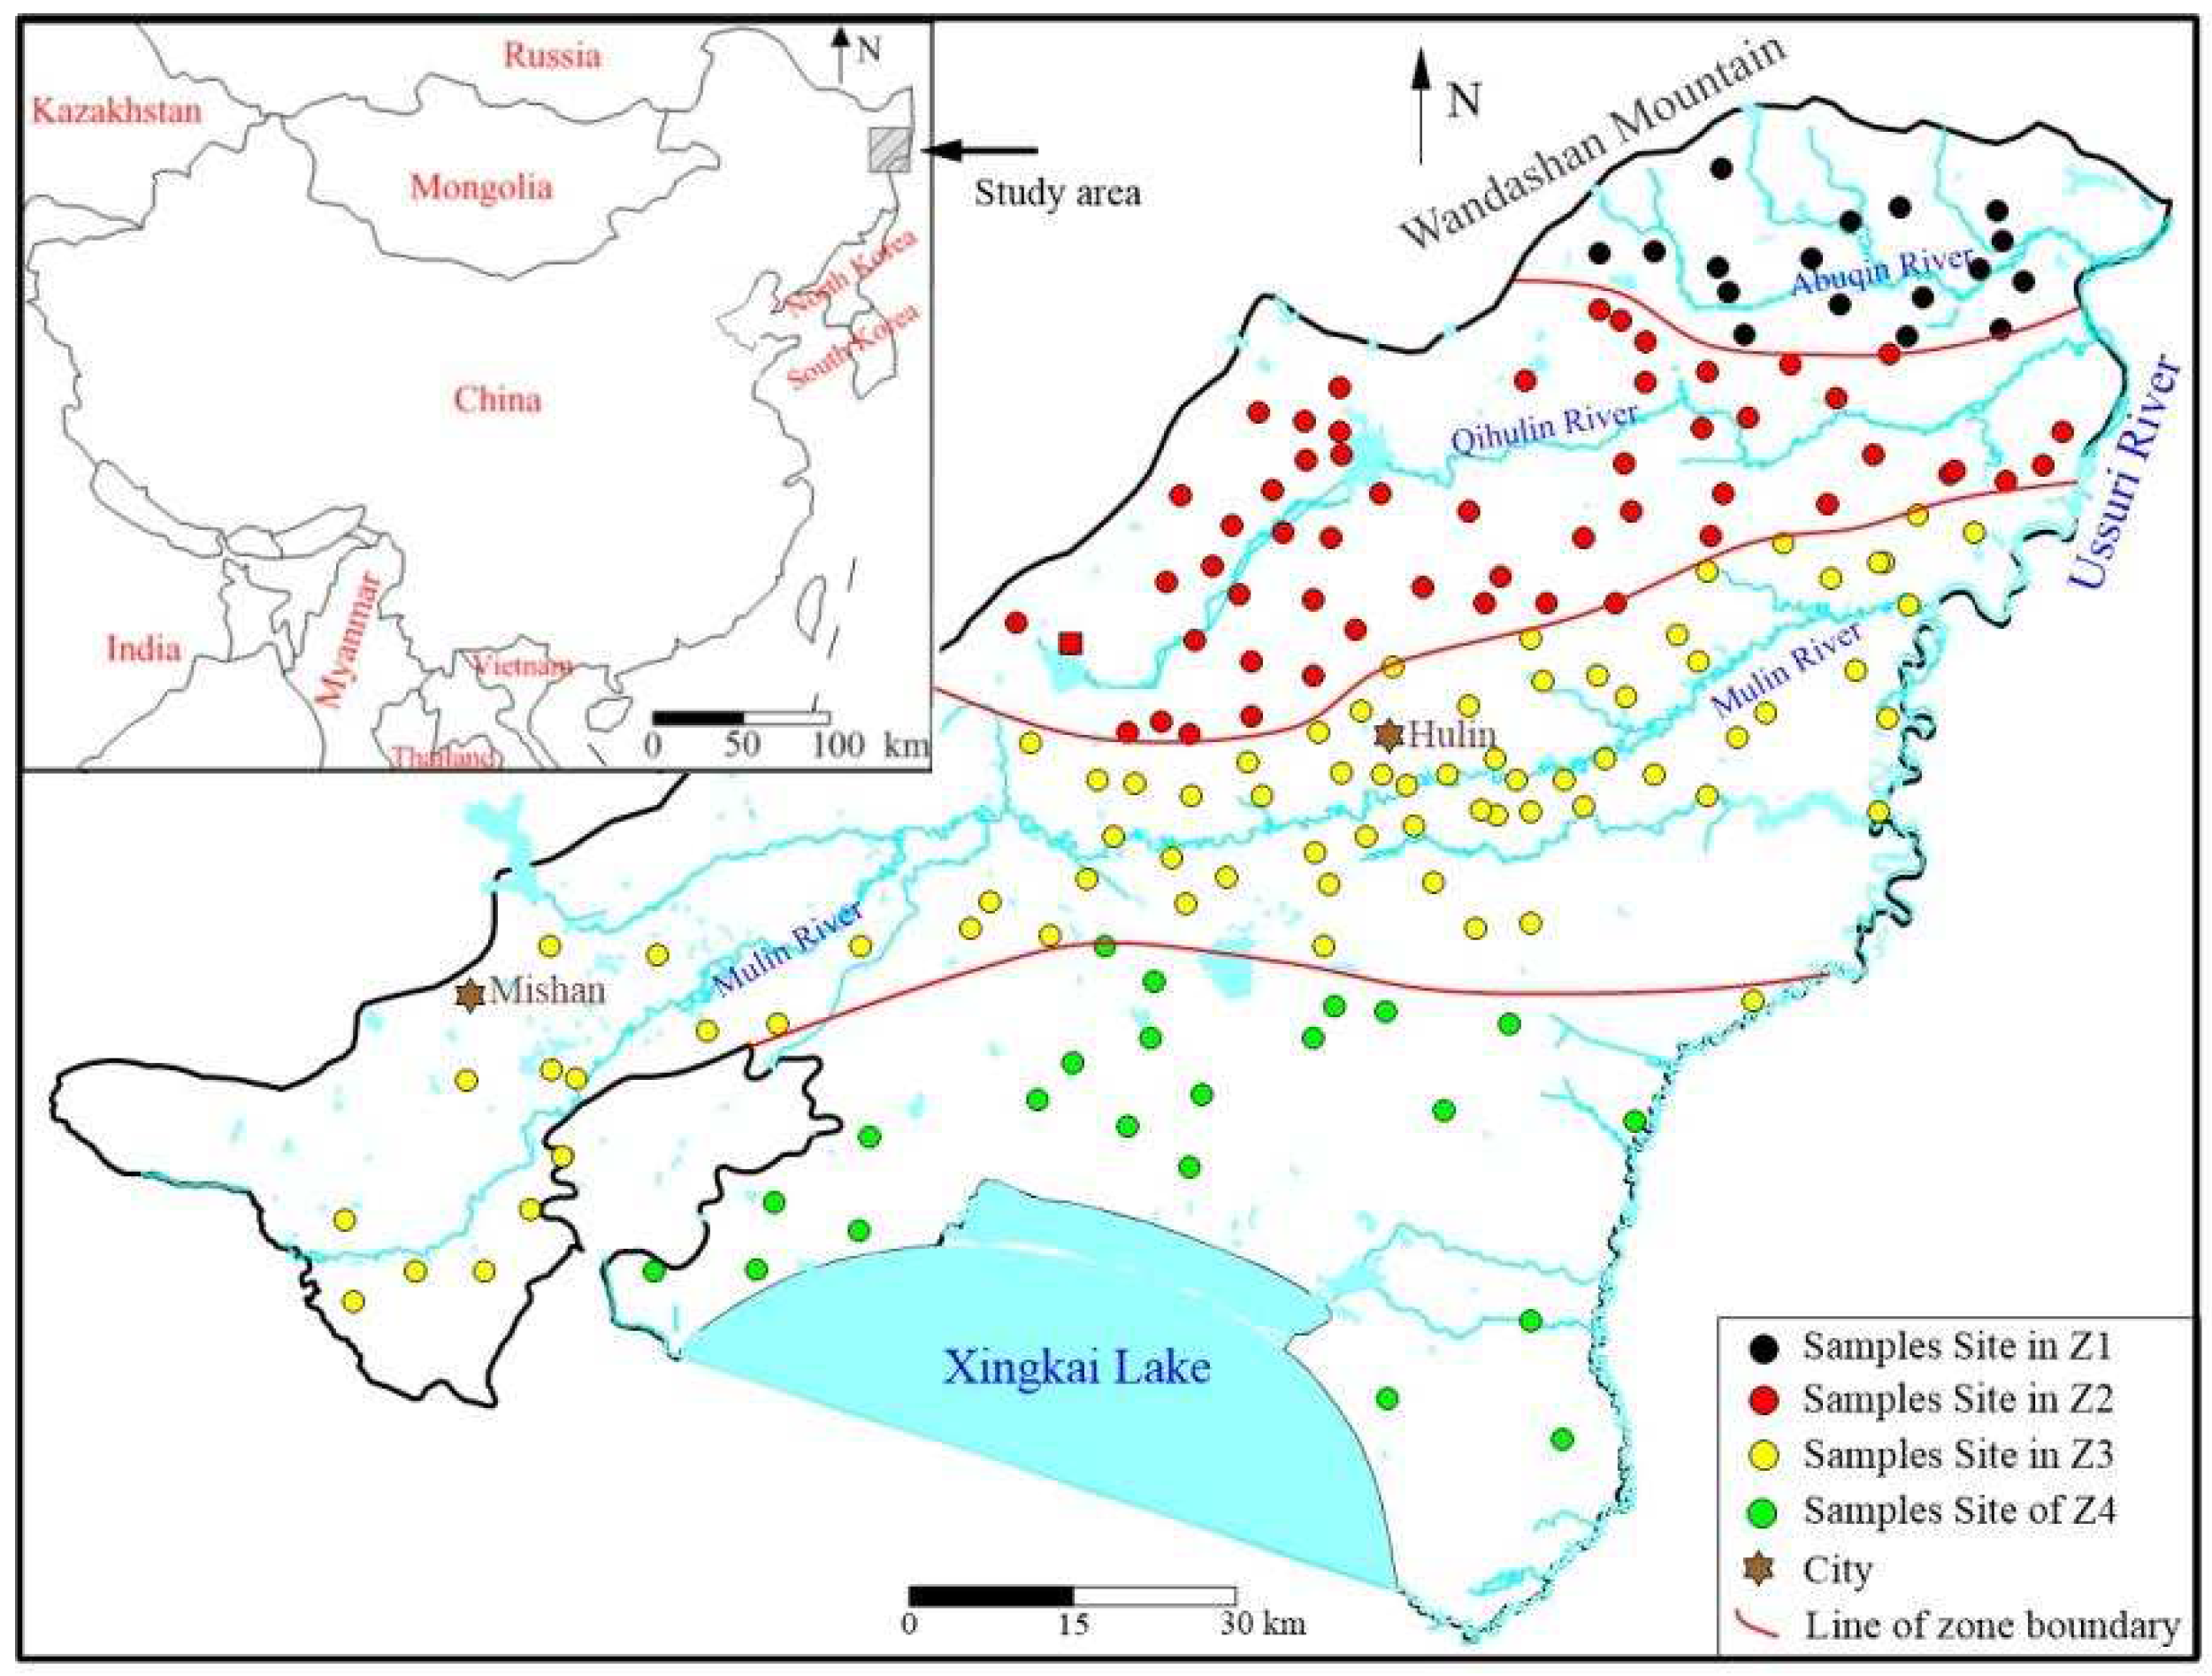
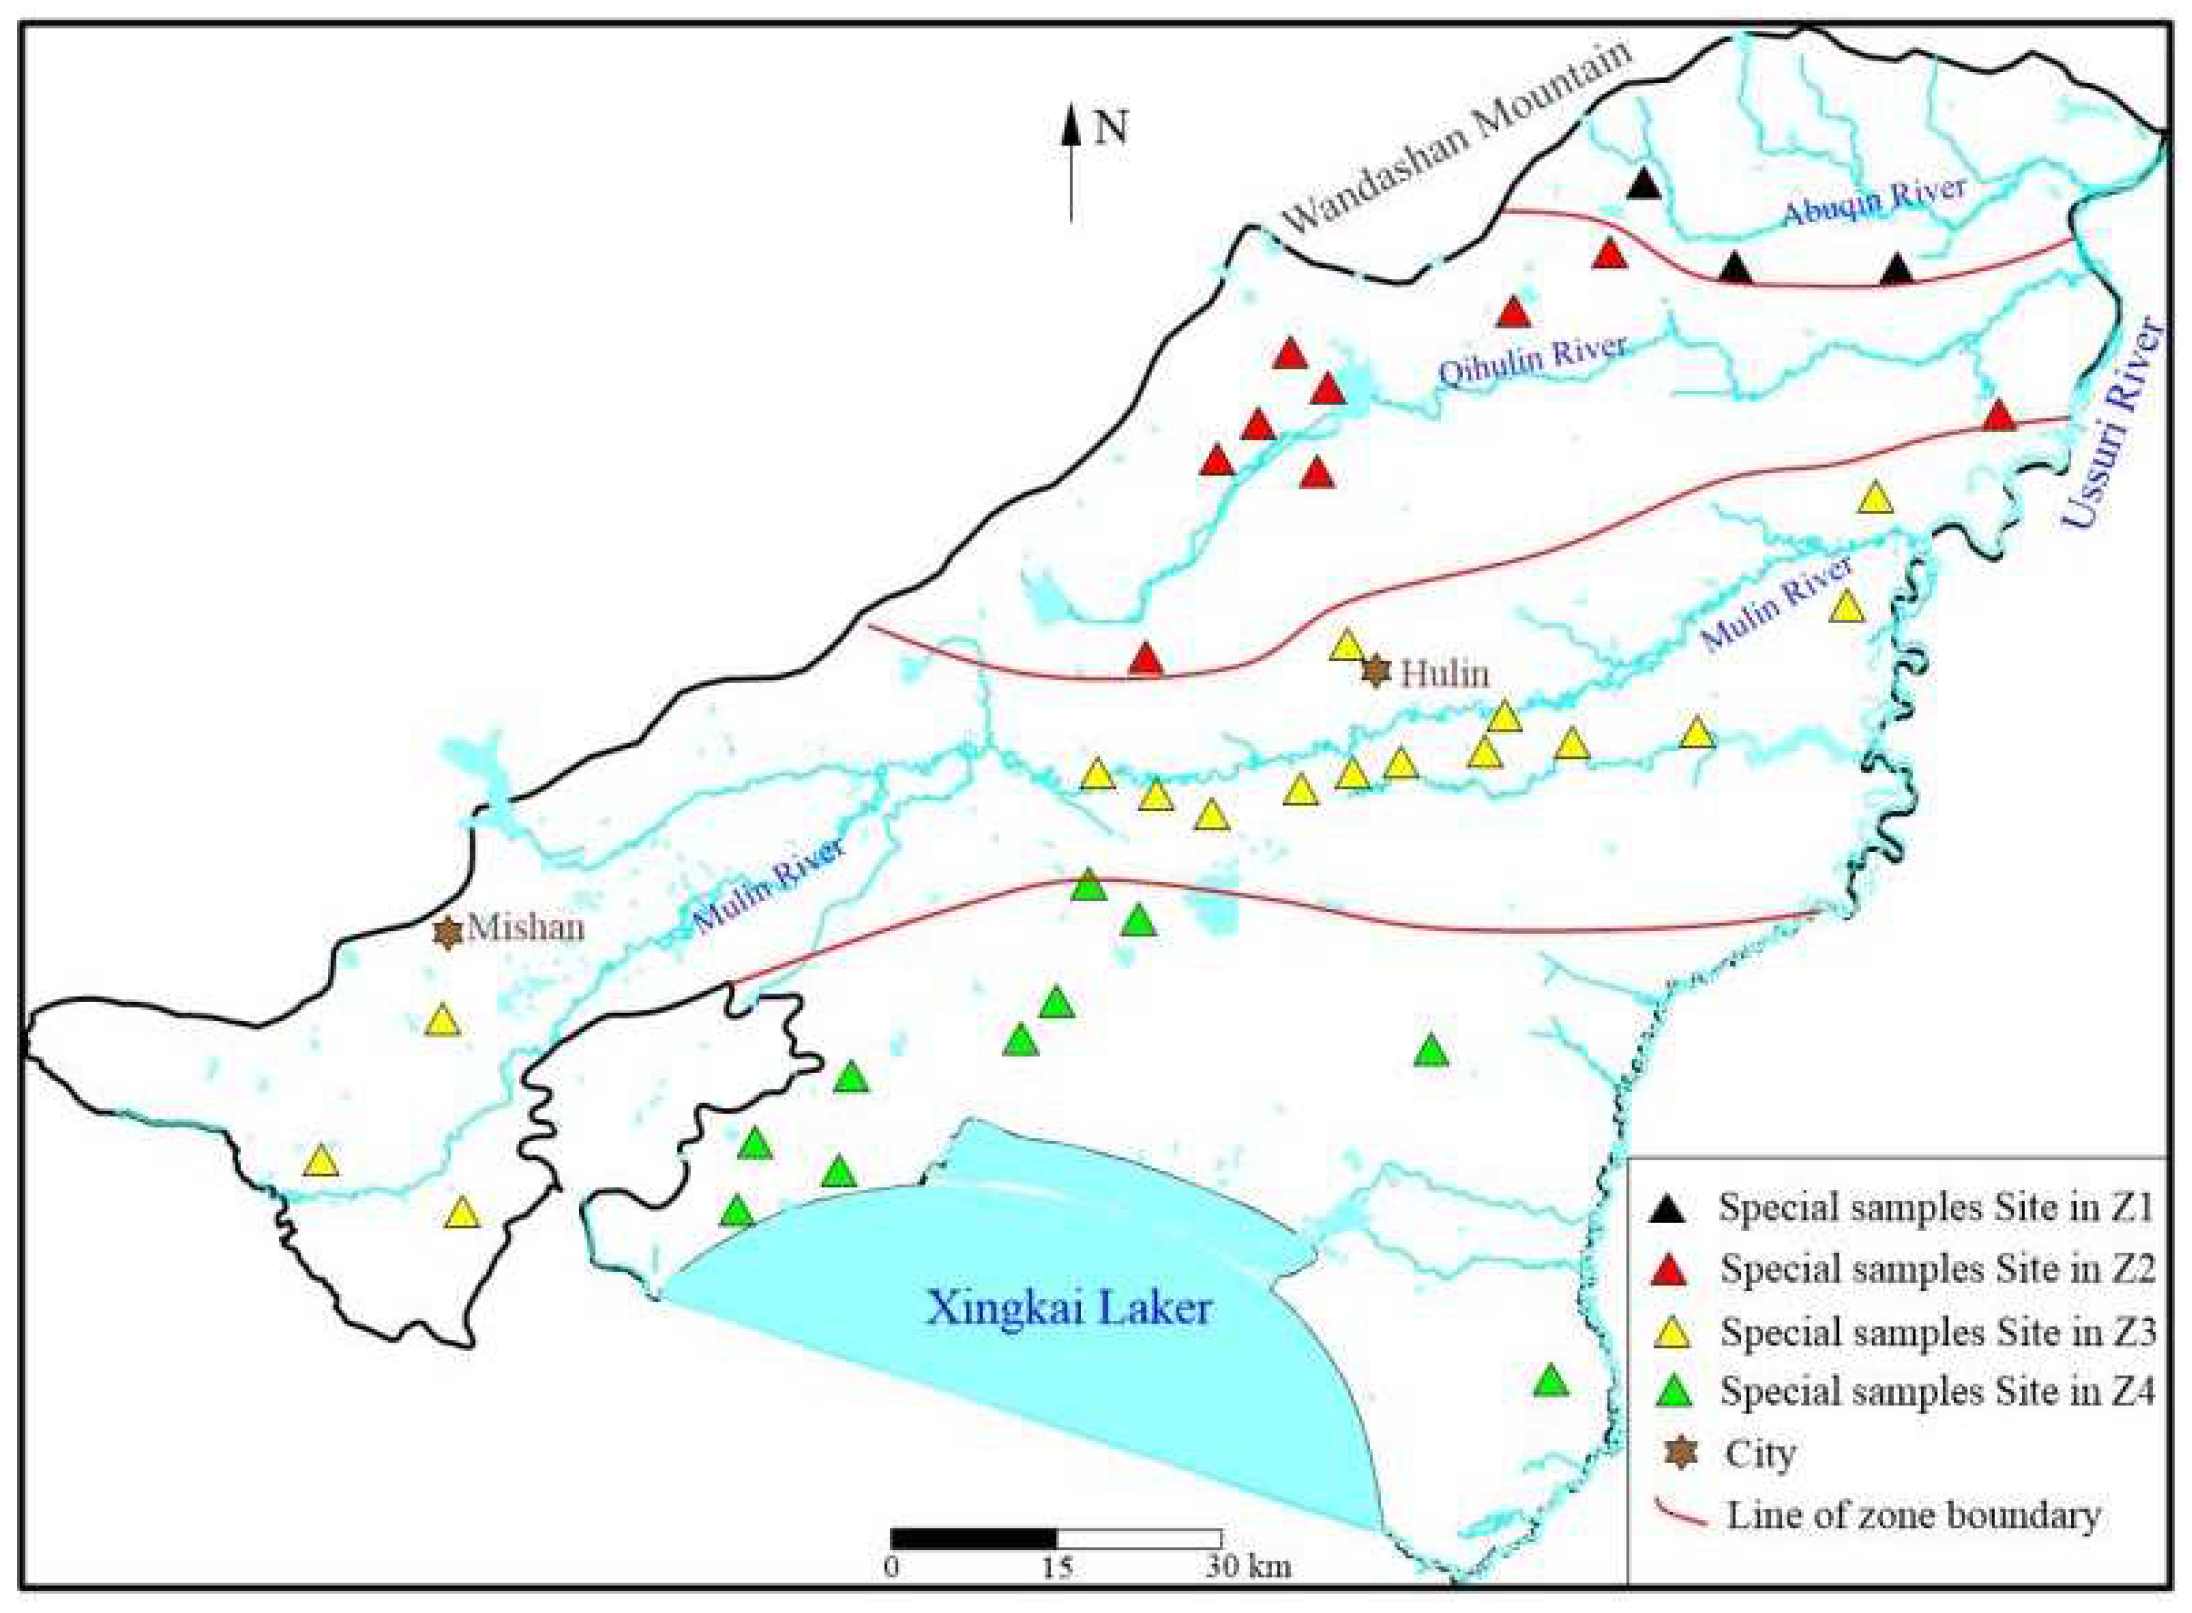
2. Description of Study Area
2.1. Geographical Conditions
2.2. Hydrogeological Setting
2.3. Land Uses and Human Activities
3. Materials and Methods
4. Results and Discussion
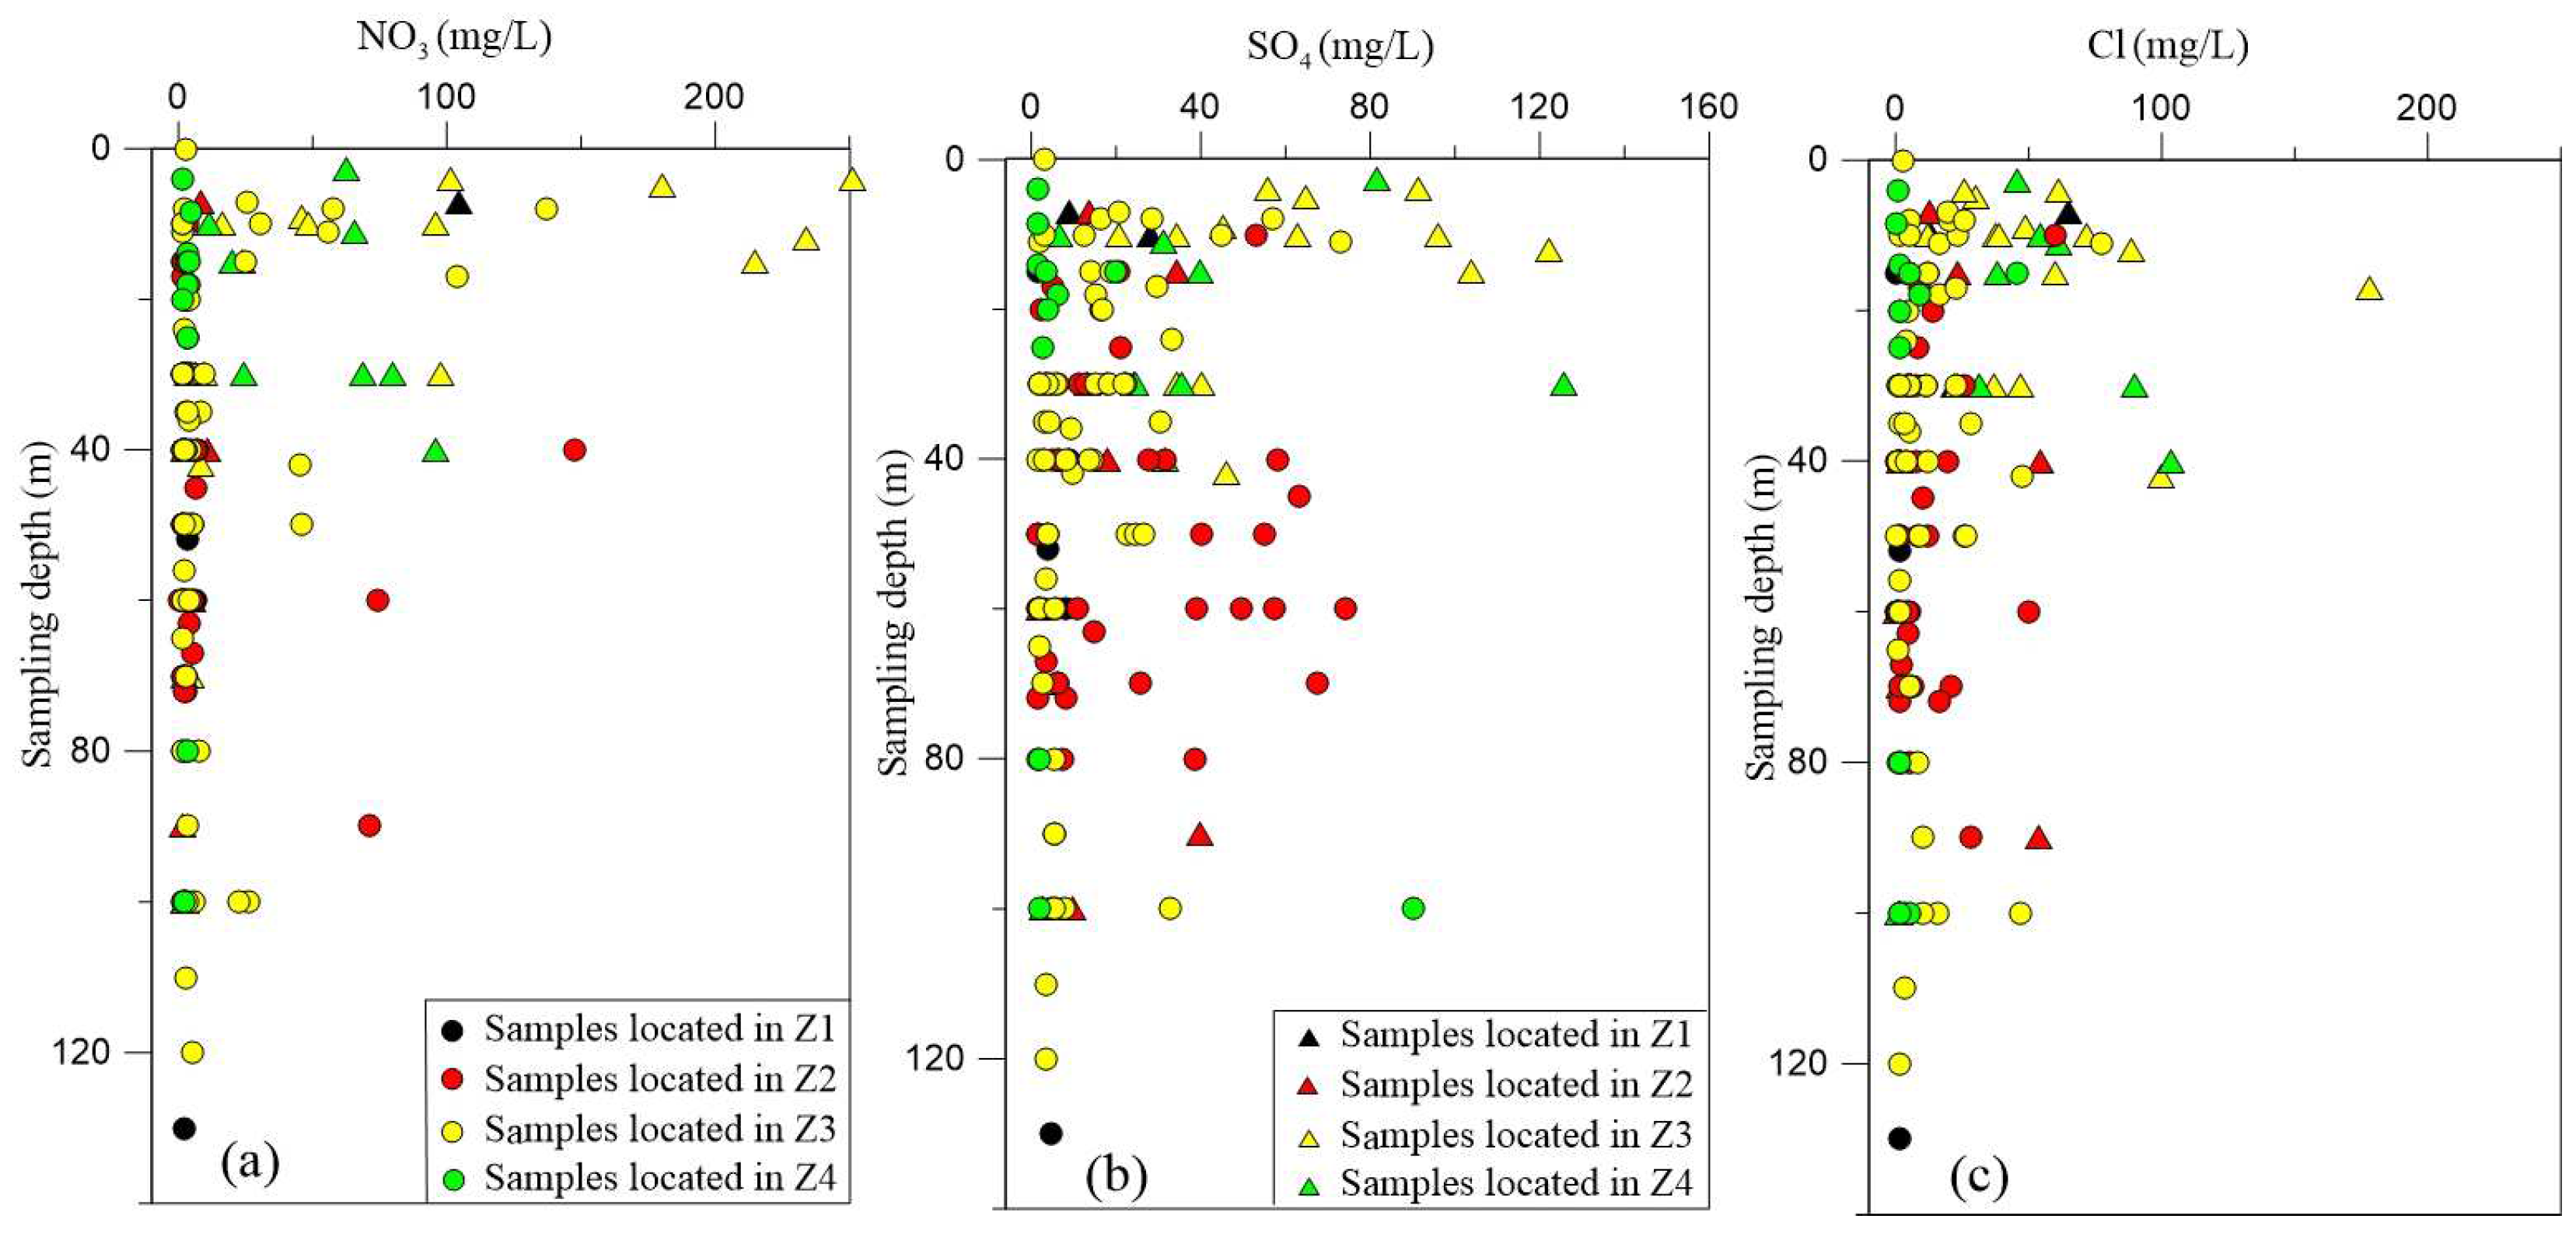
4.1. Chemical Characteristics
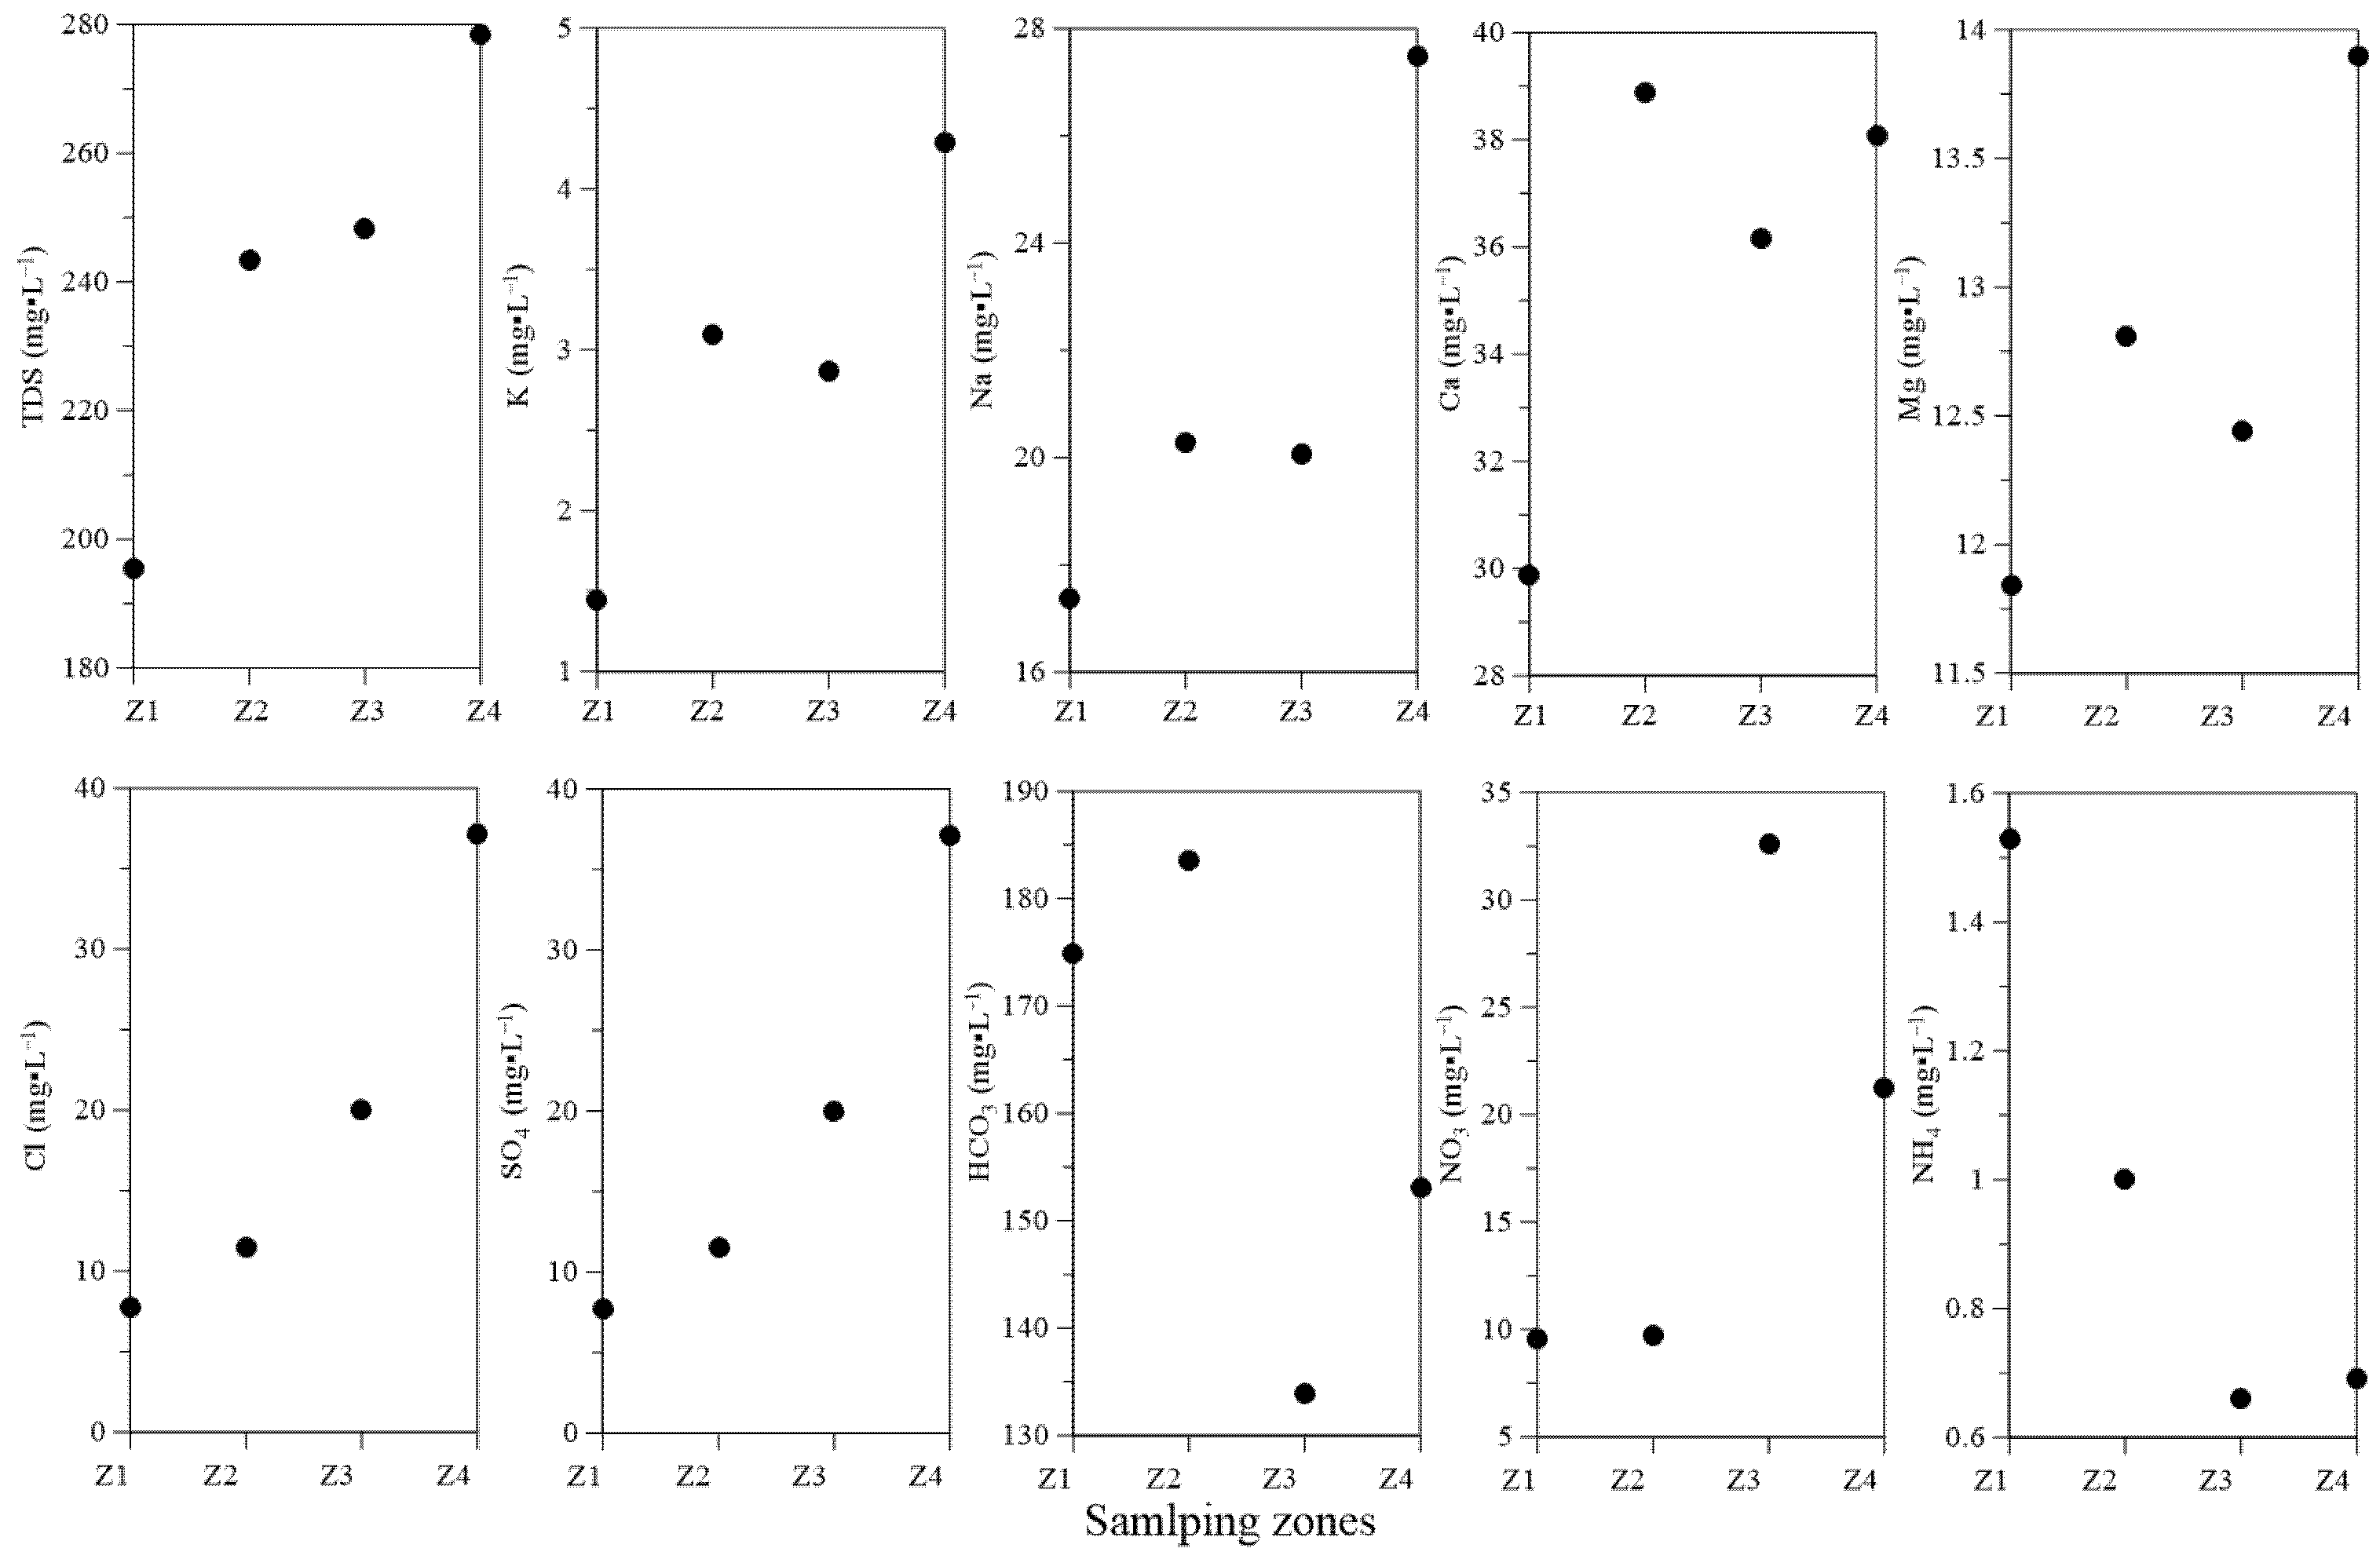
4.1.1. General Chemistry
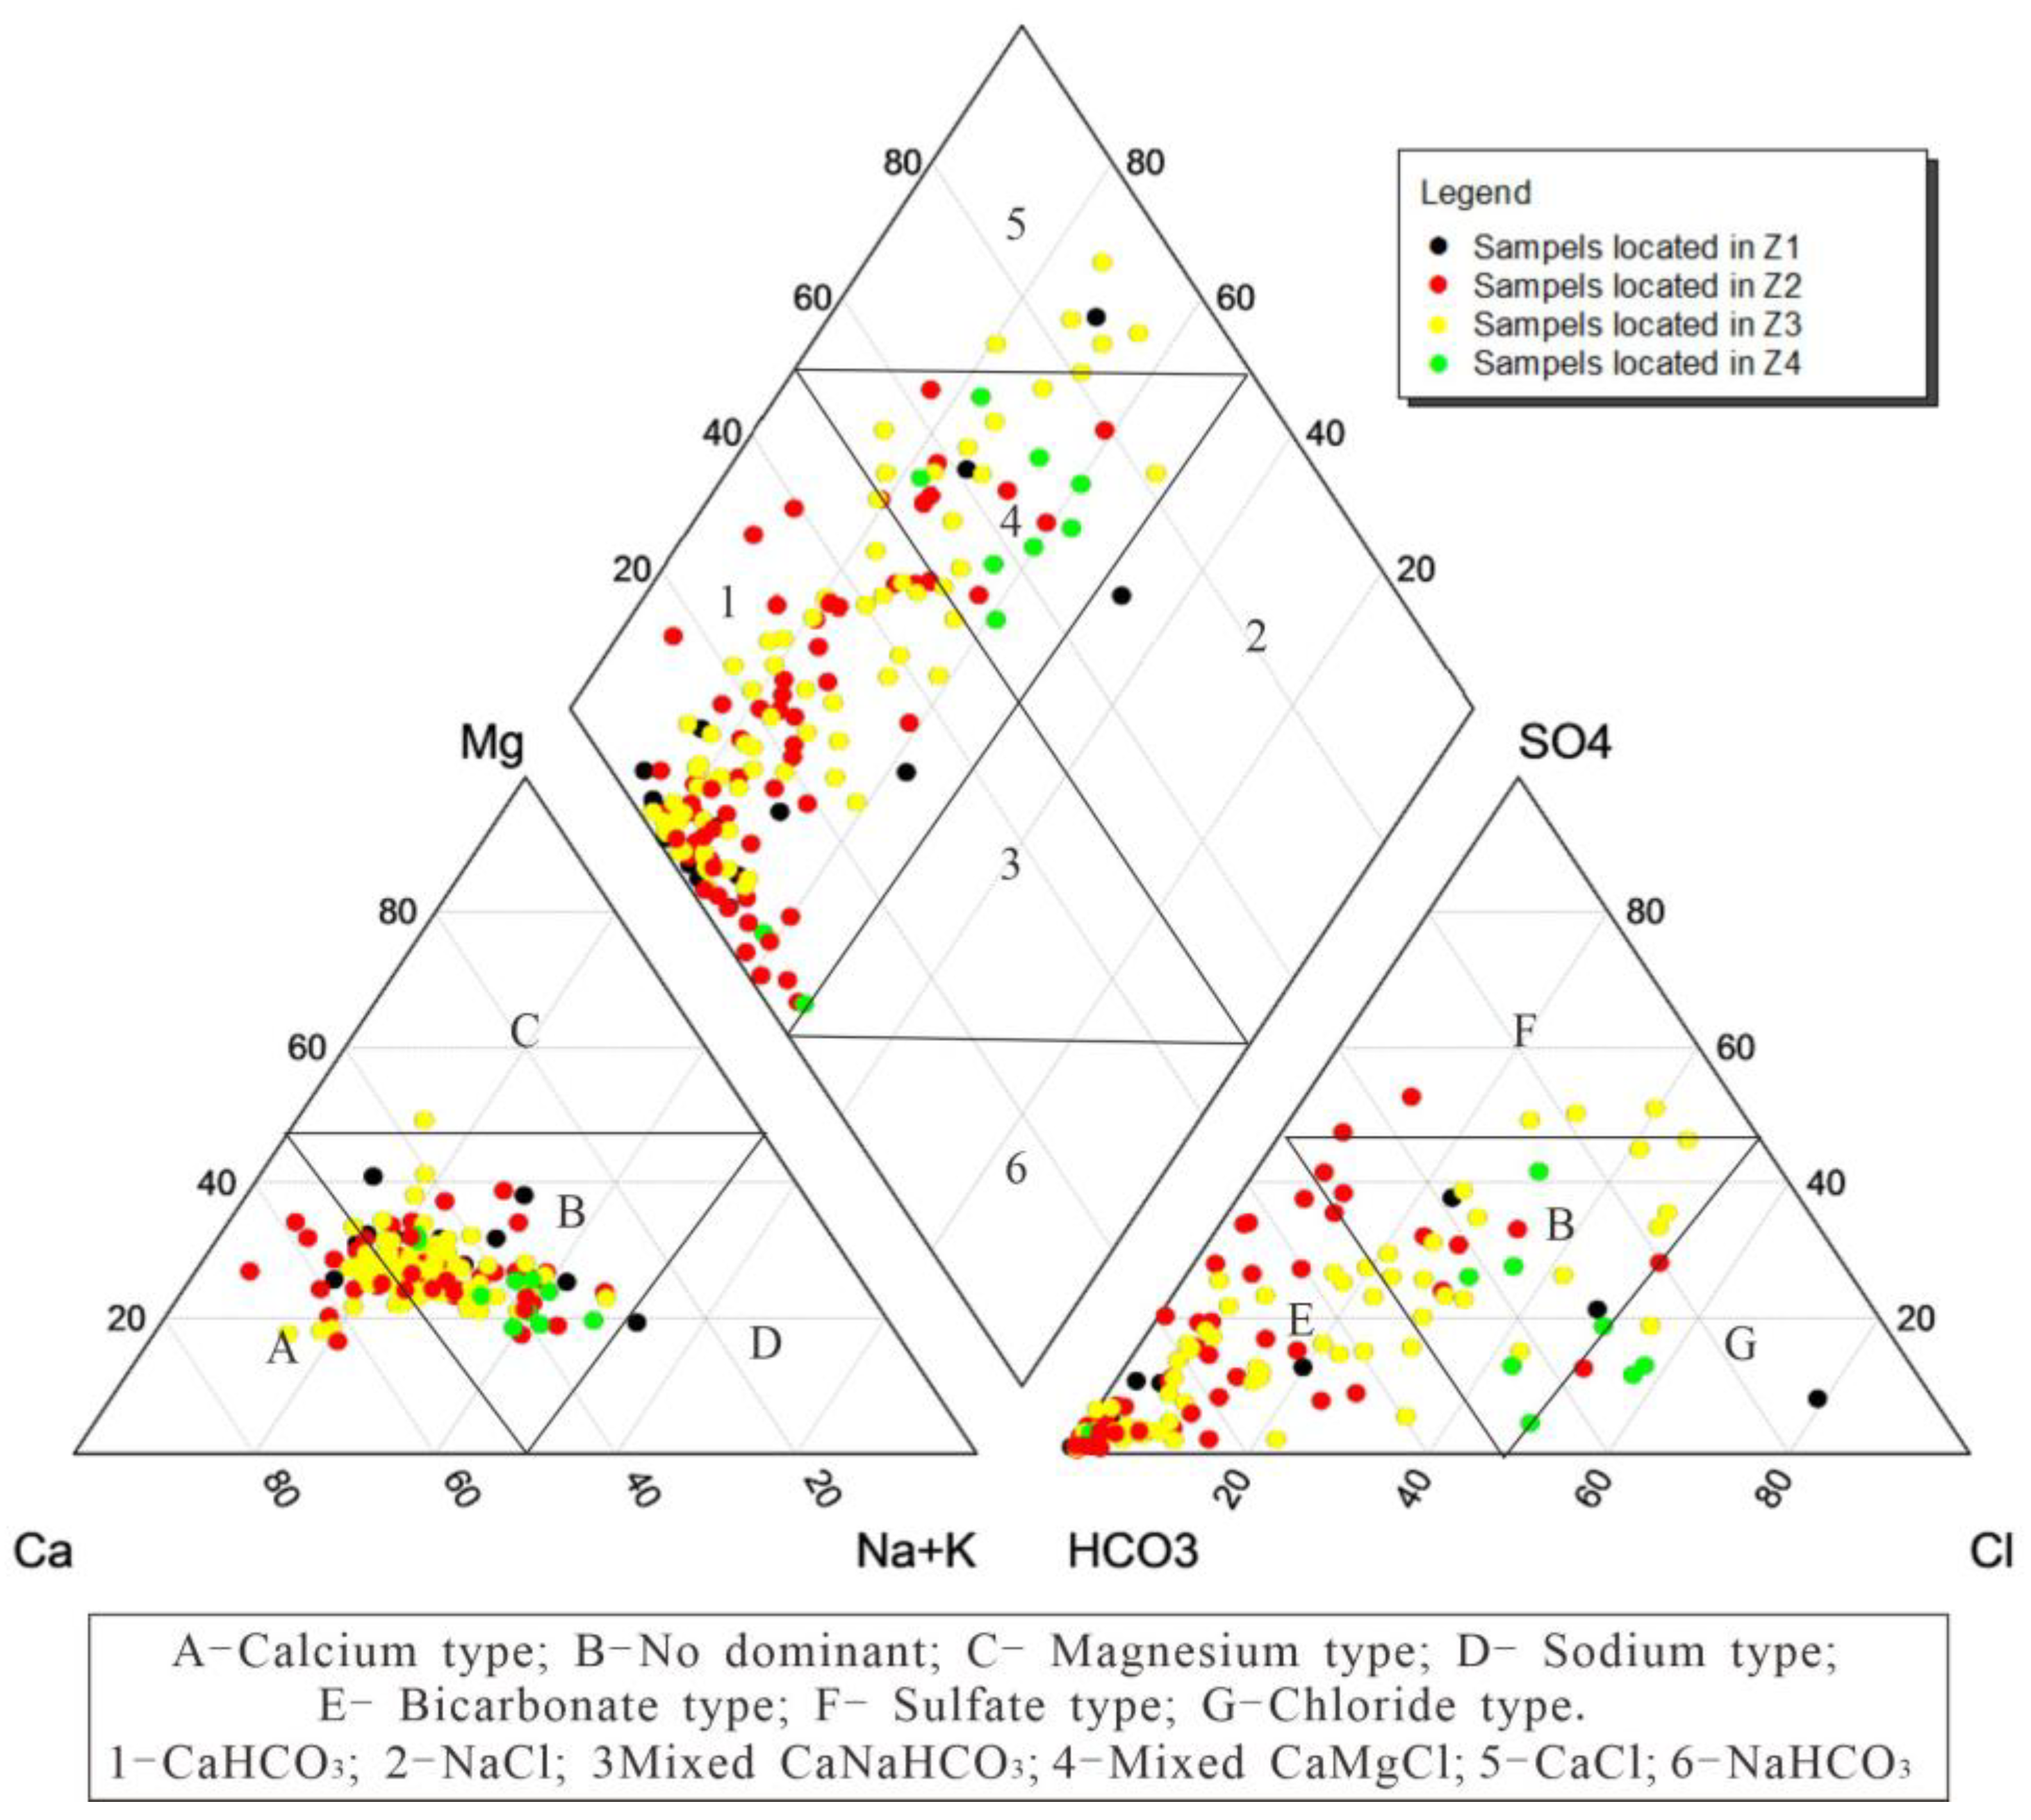
4.1.2. Groundwater Types
4.2. Hydrochemical Evolution Process
4.2.1. Chemical Ion Analysis
- (1)
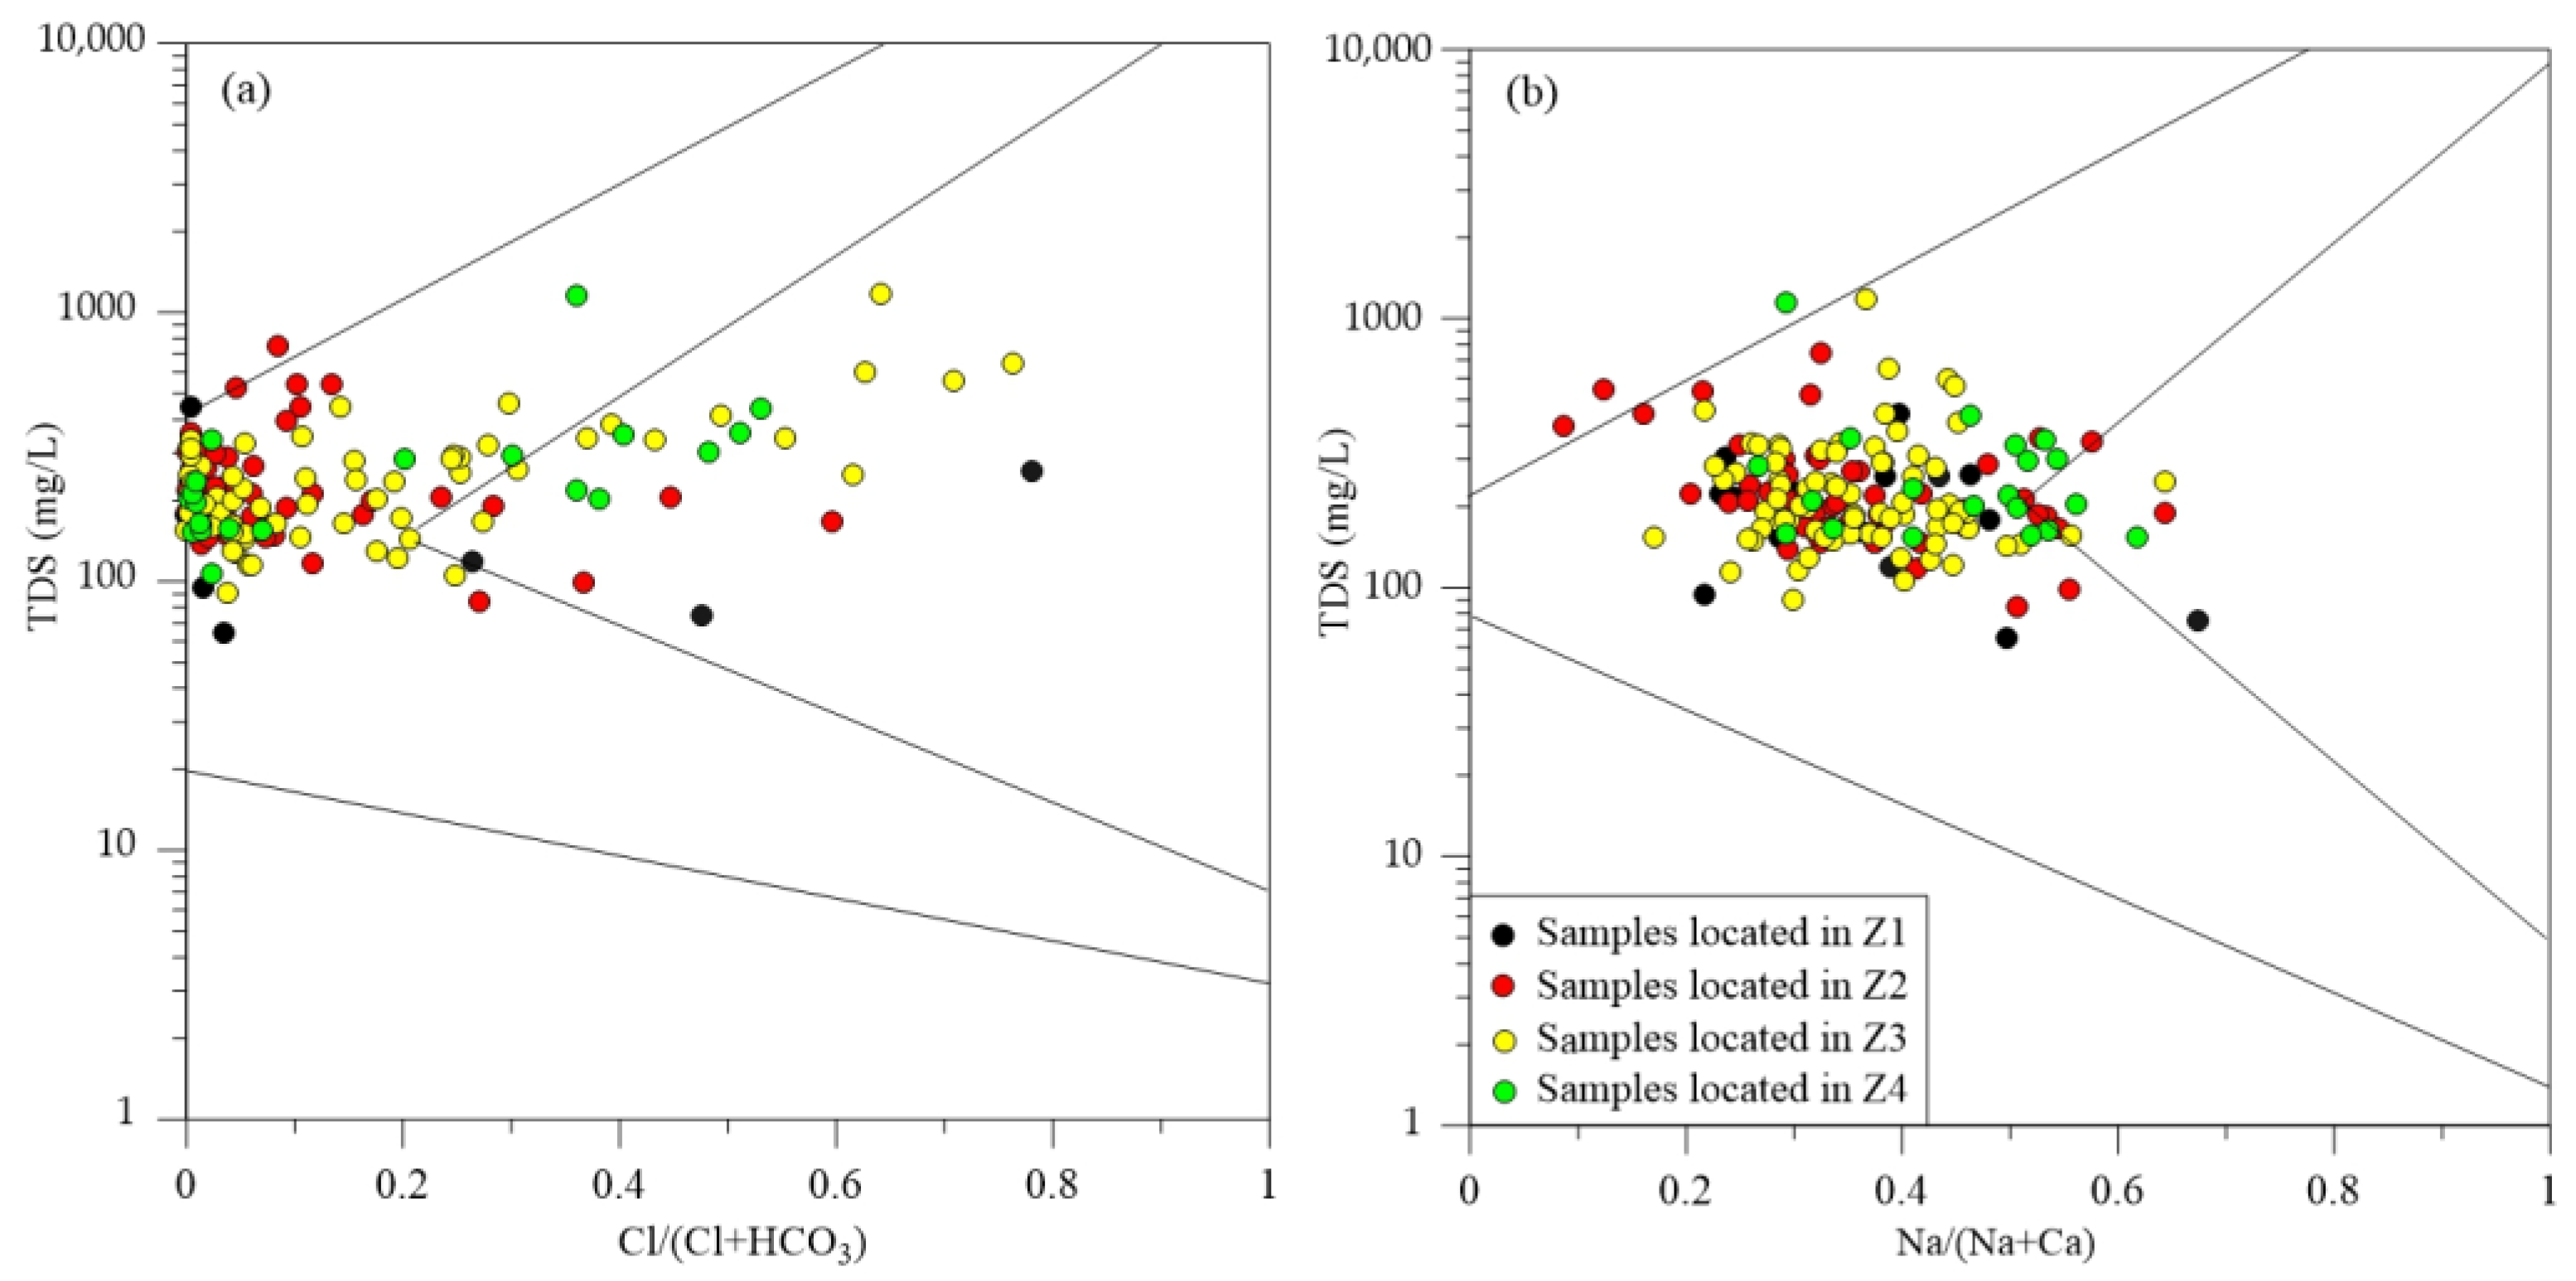
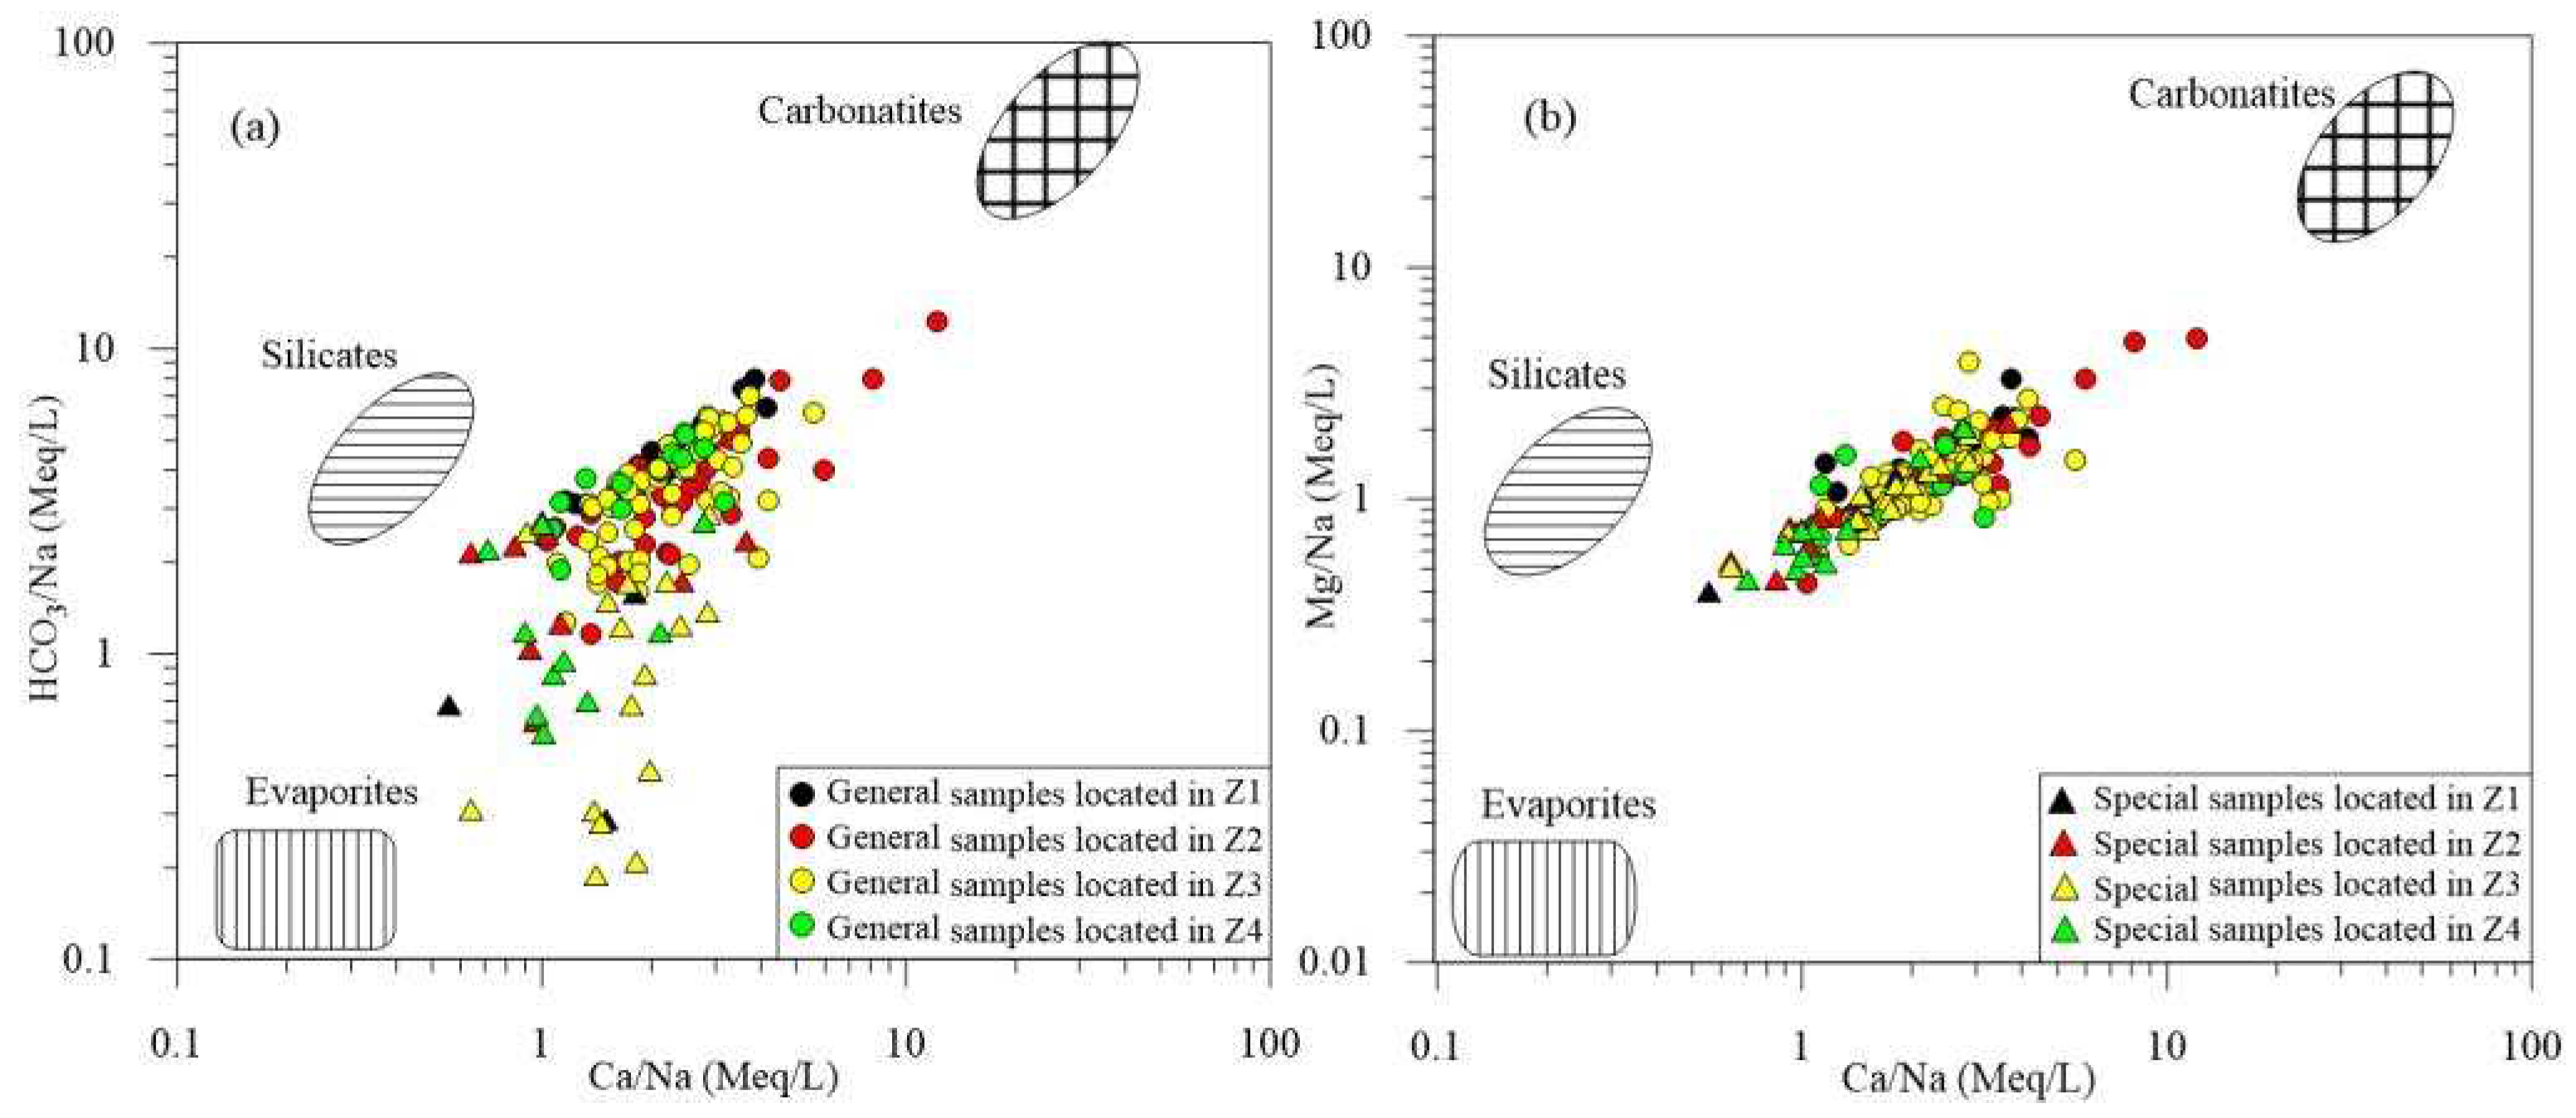
- Gibbs Plot
- (2)
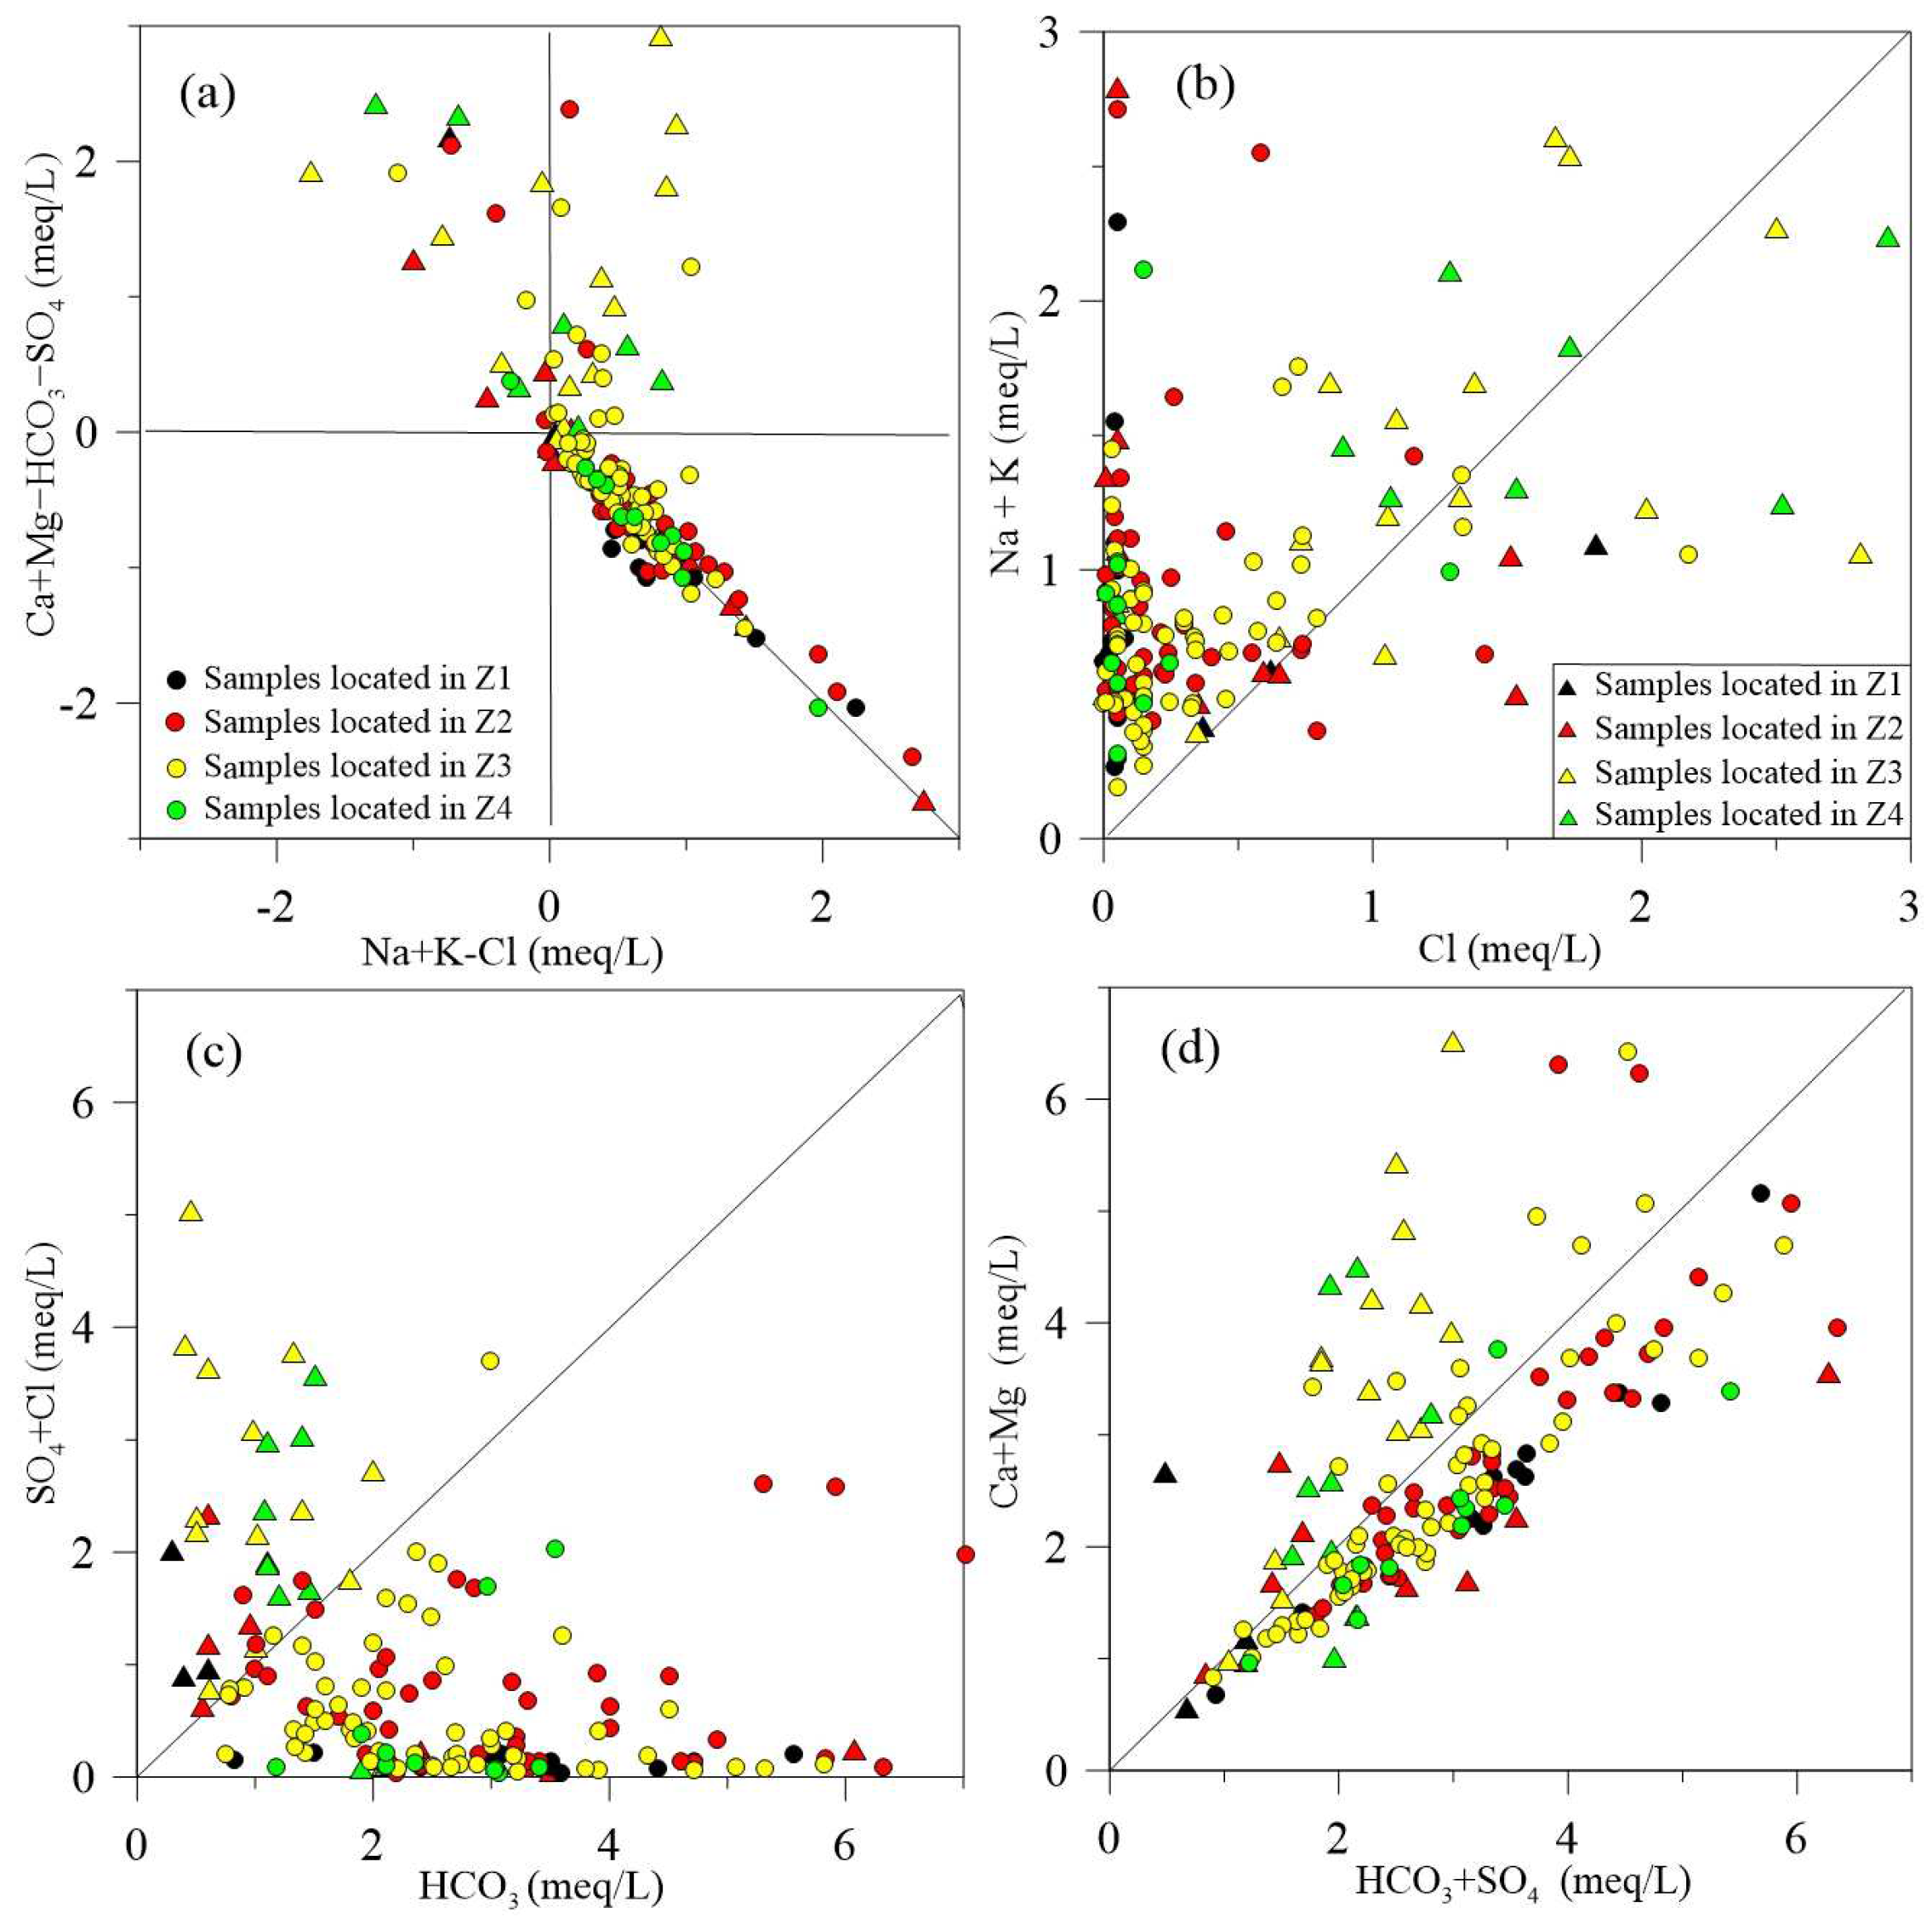
- Mixing diagram
- (3)
- Ionic ratios
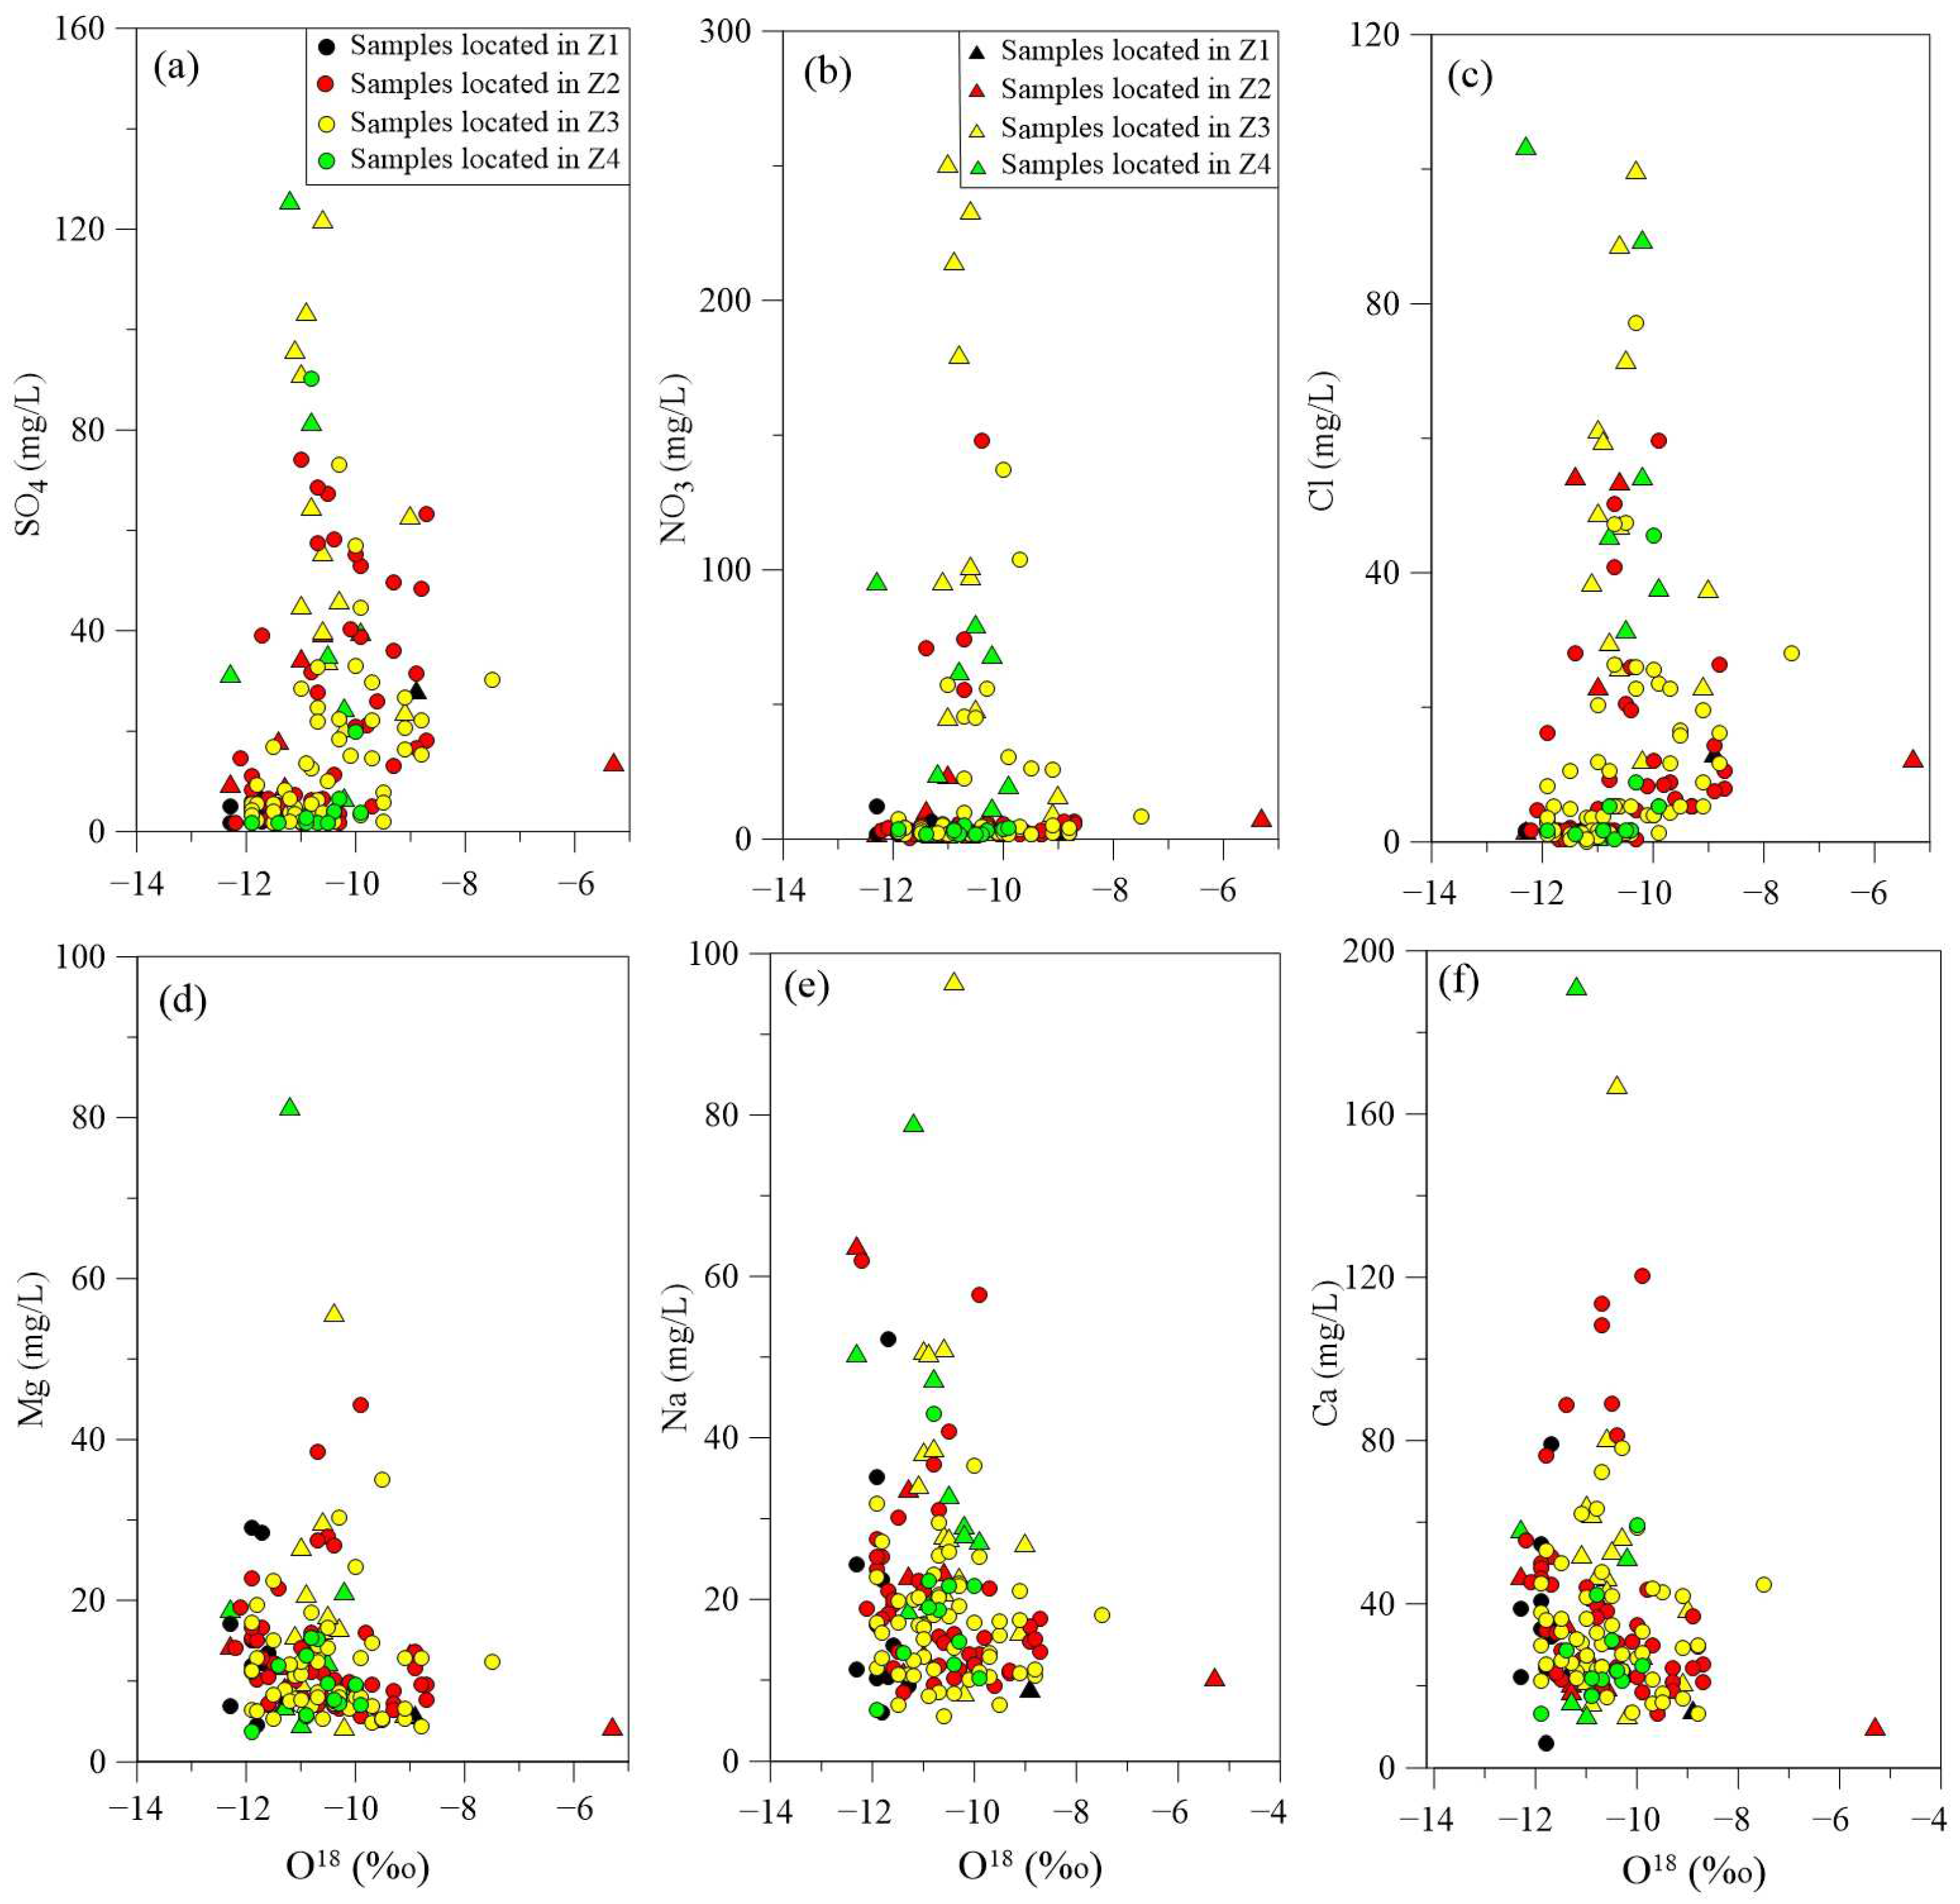
4.2.2. Stable Isotope Analysis
4.2.3. PCA
- (1)
- Z1
- (2)
- Z2
- (3)
- Z3
- (4)
- Z4
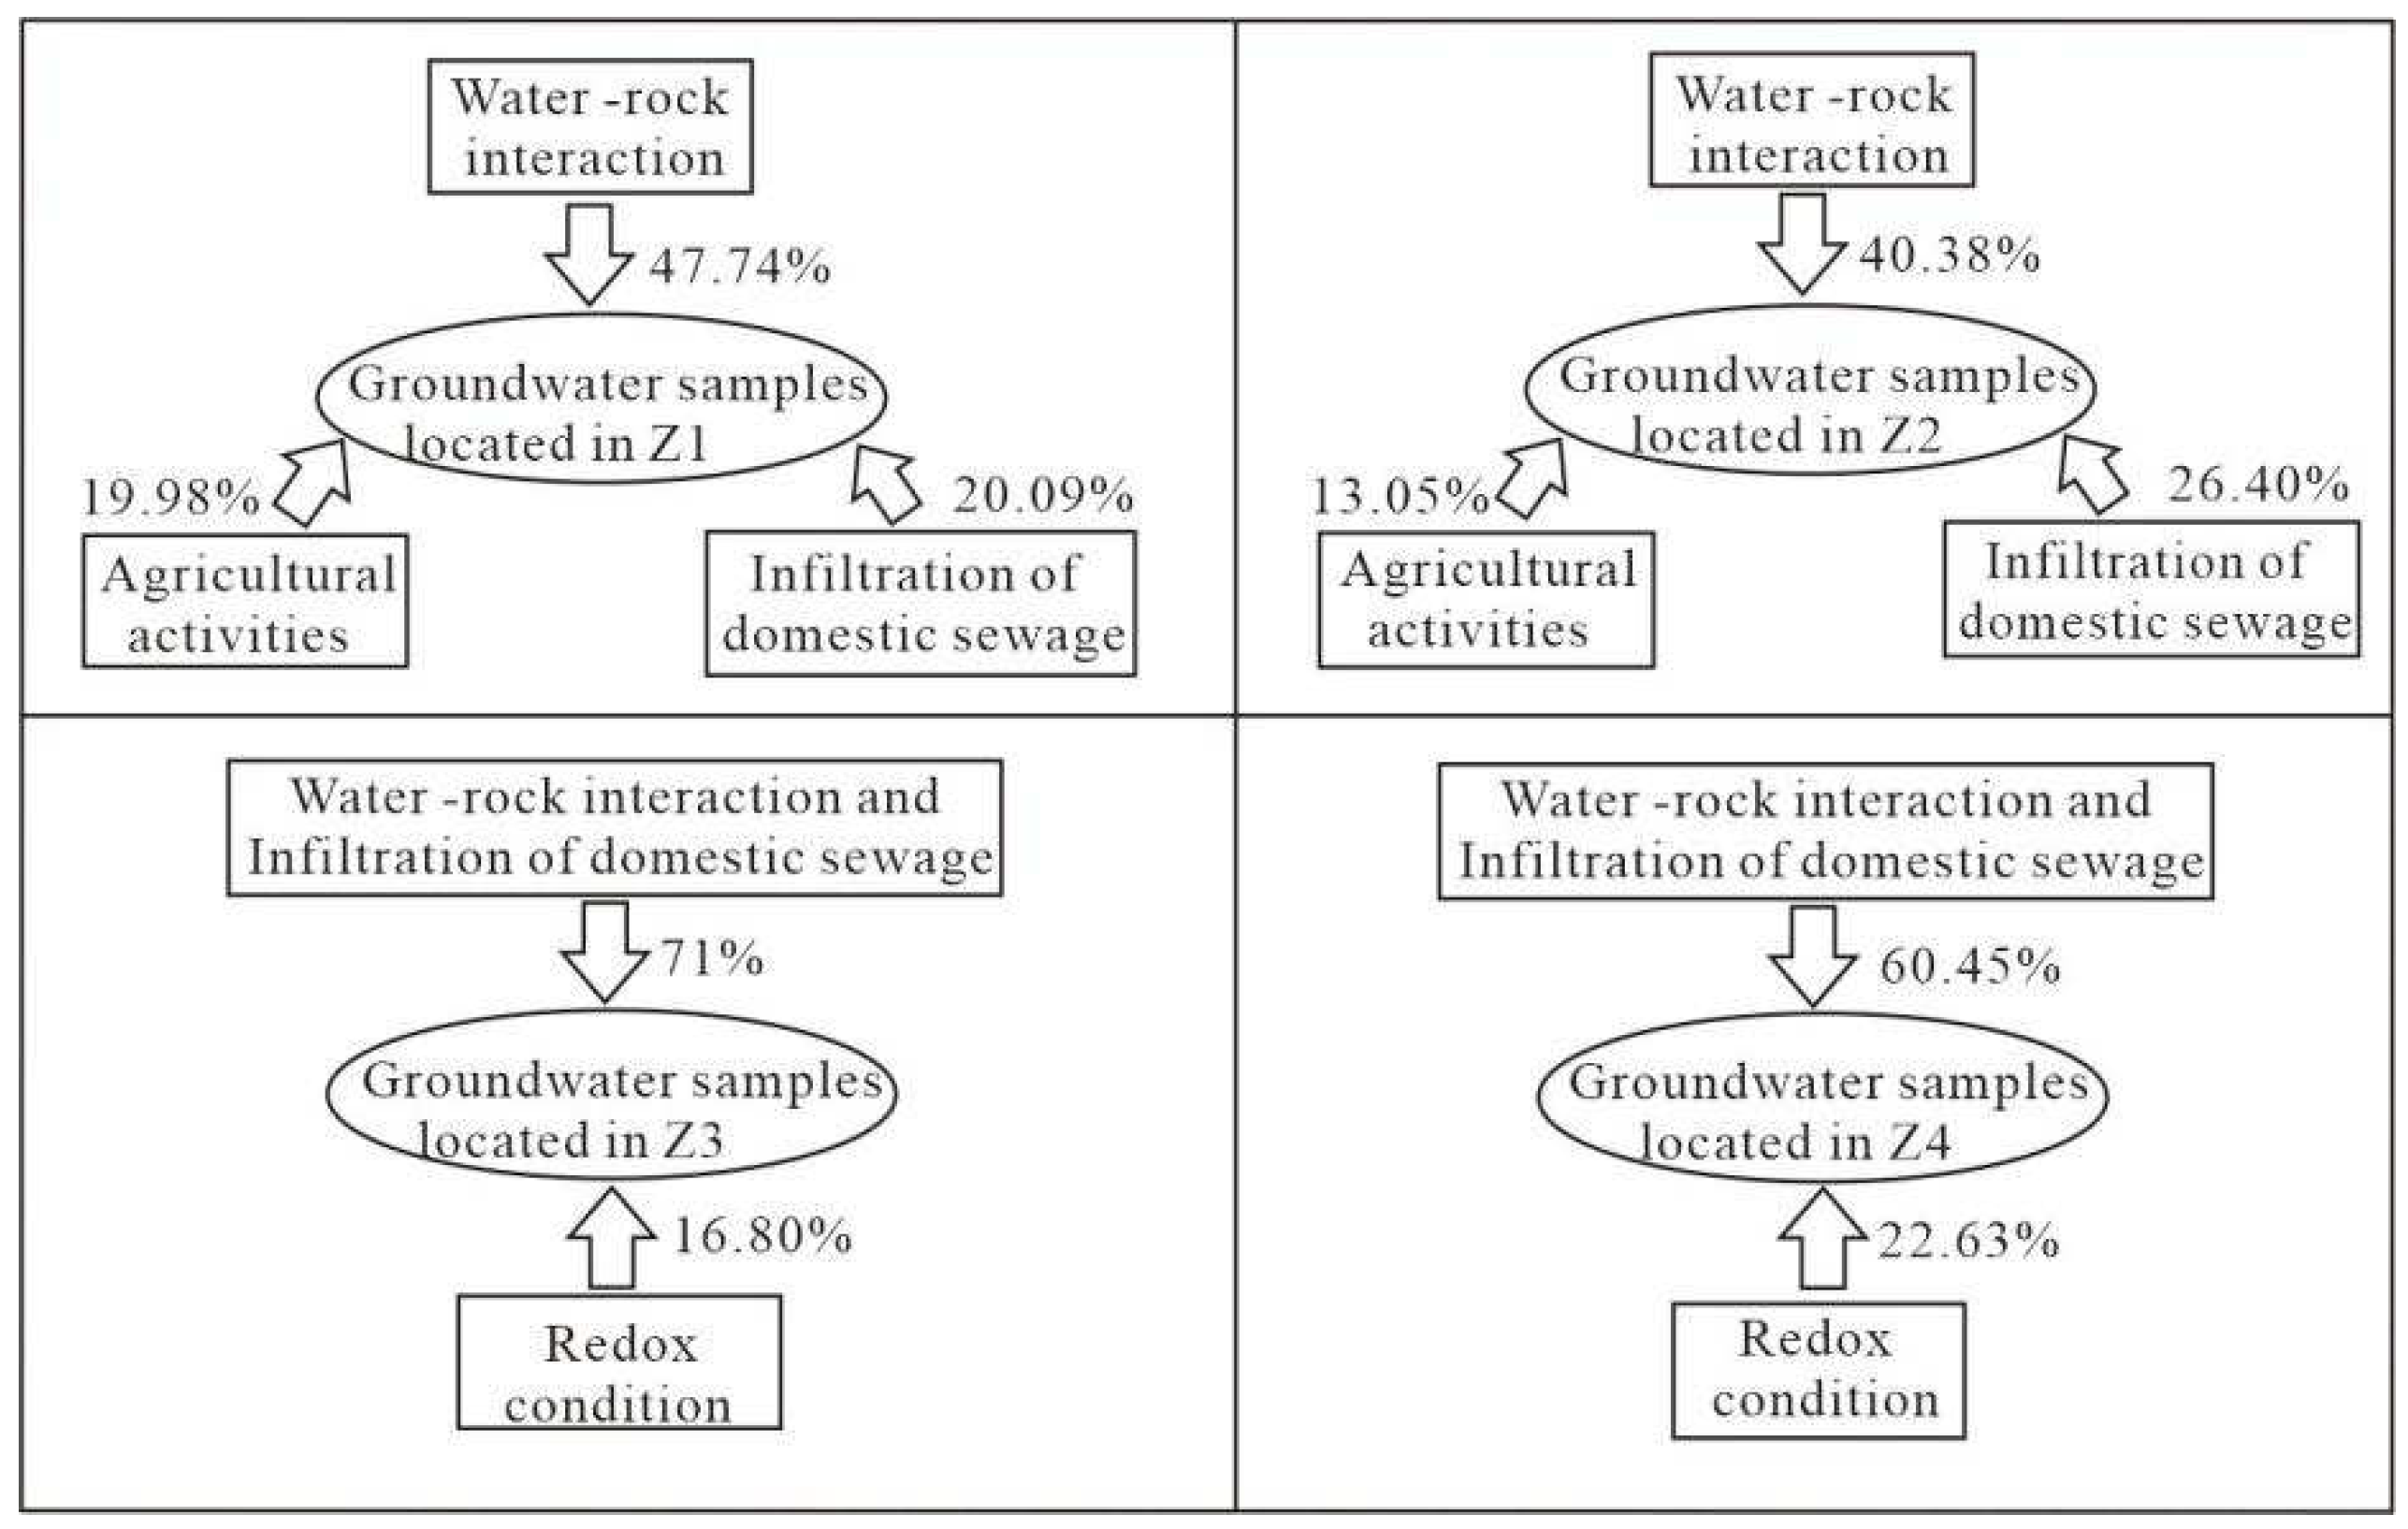
4.3. Factors Dominating the Groundwater Chemical Characteristics
5. Suggestions for Groundwater Management
6. Conclusions
- (1)
- Dissolution of silicate minerals and carbonate minerals is the most important factor dominating the chemical composition of groundwater in MXP. Groundwater in MXP is predominantly Ca-HCO3 in composition. Human activities have significantly influenced the chemical composition of groundwater in the residential zone near rivers. Thus, the NO3 type and SO4 type exist.
- (2)
- Agricultural activities only slightly influence the chemical composition of groundwater in the northern plain, and human activities have significantly influenced the chemical composition of groundwater in the southern area. Groundwater in the southern plain is characterized by a high level of NH4+, which is related to the decomposition of organic matters in a reduction condition. The samples in the northern plain are characterized by a high level of NH4+, and it is necessary to avoid the transformation of a reduction condition into an oxidation environment.
- (3)
- Due to the widespread distribution of thick black soils in MXP, agricultural non-point-source pollution does not occur. The discharge of domestic sewage mainly influenced the chemical composition of shallow groundwater. So, deep groundwater with a depth of more than 80 m is the best choice for water supply. In addition, shallow groundwater far away from river channels should be used as irrigation water.
- (4)
- Government agencies should adopt some strategies to protect groundwater resources. These strategies include regulating the amount and type of fertilizers applied to farmland, constructing sewage disposal systems in rural areas, and strengthening the supervision of the discharge of wastewater and construction of deep wells.
Author Contributions
Funding
Institutional Review Board Statement
Informed Consent Statement
Data Availability Statement
Conflicts of Interest
References
- Foster, S.; Garduno, H.; Evans, R. Quaternary Aquifer of the North China Plain? Assessing and achieving groundwater resource sustainability. Hydrogeol. J. 2004, 12, 81–93. [Google Scholar] [CrossRef]
- Turhan, A.; Ozmen, N. Influence of Chloride on Growth, Fruit Yield and Quality Parameters of Processing Pepper. J. Agric. Nat. 2021, 24, 1139–1144. [Google Scholar] [CrossRef]
- Wang, Y.X.; Zheng, C.M.; Ma, R. Review: Safe and sustainable groundwater supply in China. Hydrogeol. J. 2018, 26, 1301–1324. [Google Scholar] [CrossRef]
- Zhang, Y.; Wu, J.; Xu, B. Human health risk assessment of groundwater nitrogen pollution in Jinghui canal irrigation area of the loess region, northwest China. Environ. Earth Sci. 2018, 77, 273. [Google Scholar] [CrossRef]
- Deng, L.; Xu, B.; Yang, X.T.; Hu, A.Y. Water quality and health risk assessment based on hydrochemical characteristics of tap and large-size bottled water from the main cities and towns in Guanzhong Basin, China. Environ. Earth Sci. 2021, 80, 139. [Google Scholar] [CrossRef]
- Li, P.; Tian, R.; Xue, C.; Wu, J. Progress, opportunities, and key fields for groundwater quality research under the impacts of human activities in China with a special focus on western China. Environ. Sci. Pollut. R. 2017, 24, 13224–13234. [Google Scholar] [CrossRef] [PubMed]
- Huang, G.X.; Liu, C.Y.; Sun, J.C.; Zhang, M.; Jing, J.H.; Li, L.P. A regional scale investigation on factors controlling the groundwater chemistry of various aquifers in a rapidly urbanized area: A case study of the Pearl River Delta. Sci. Total Environ. 2018, 625, 510–518. [Google Scholar] [CrossRef]
- Yin, Z.Y.; Luo, Q.K.; Wu, J.F.; Xu, S.H.; Wu, J.C. Identification of the long-term variations of groundwater and their governing factors based on hydrochemical and isotopic data in a river basin. J. Hydrol. 2021, 597, 125604. [Google Scholar] [CrossRef]
- Shi, X.; Wang, Y.; Jiao, J.J.; Zhong, J.; Wen, H.; Dong, R. Assessing major factors affecting shallow groundwater geochemical evolution in a highly urbanized coastal area of Shenzhen City, China. J. Geochem. Explor. 2018, 184, 17–27. [Google Scholar] [CrossRef]
- El Alfy, M.; Alharbi, T.; Mansour, B. Integrating geochemical investigations and geospatial assessment to understand the evolutionary process of hydrochemistry and groundwater quality in arid areas. Environ. Monit. Assess. 2018, 190, 277. [Google Scholar] [CrossRef]
- Hassen, I.; Hamzaoui-Azaza, F.; Bouhlila, R. Application of multivariate statistical analysis and hydrochemical and isotopic investigations for evaluation of groundwater quality and its suitability for drinking and agriculture purposes: Case of Oum Ali-Thelepte aquifer, central Tunisia. Environ. Monit. Assess. 2016, 188, 135. [Google Scholar] [CrossRef] [PubMed]
- Liu, C.Q.; Li, S.L.; Lang, Y.C.; Xiao, H.Y. Using δ15N- and δ18O-values to identify nitrate sources in Karst ground water, Guiyang, Southwest China. Environ. Sci. Technol. 2006, 40, 6928–6933. [Google Scholar] [CrossRef] [PubMed]
- Wang, H.; He, P.; Shen, C.; Wu, Z. Effect of irrigation amount and fertilization on agriculture non-point source pollution in the paddy field. Environ. Sci. Pollut. R. 2019, 26, 10363–10373. [Google Scholar] [CrossRef]
- Mohammed, A.M.; Refaee, A.; El-Din, G.K.; Harb, S. Hydrochemical characteristics and quality assessment of shallow groundwater under intensive agriculture practices in arid region, Qena, Egypt. Appl. Water Sci. 2022, 12, 92. [Google Scholar] [CrossRef]
- Lwimbo, Z.D.; Komakech, H.C.; Muzuka, A.N. Impacts of emerging agricultural practices on groundwater quality in kahe catchment, Tanzania. Water 2019, 11, 2263. [Google Scholar] [CrossRef] [Green Version]
- Pulido-Bosch, A.; Rigol-Sanchez, J.P.; Vallejos, A.; Andreu, J.M.; Ceron, J.C.; Molina-Sanchez, L. Impacts of agricultural irrigation on groundwater salinity. Environ. Earth Sci. 2018, 77, 197. [Google Scholar] [CrossRef] [Green Version]
- Ledesma-Ruiz, R.; Pastén-Zapata, E.; Parra, R.; Harter, T.; Mahlknecht, J. Investigation of the geochemical evolution of groundwater under agricultural land: A case study in northeastern Mexico. J. Hydrol. 2015, 521, 410–423. [Google Scholar] [CrossRef] [Green Version]
- Van Geldern, R.; Schulte, P.; Mader, M.; Baier, A.; Barth, J.A.C.; Juhlke, T.R. Insights into agricultural influences and weathering processes from major ion patterns. Hydrol. Process. 2018, 32, 891–903. [Google Scholar] [CrossRef] [Green Version]
- Merz, C.; Lischeid, G. Multivariate analysis to assess the impact of irrigation on groundwater quality. Environ. Earth Sci. 2019, 78, 274. [Google Scholar] [CrossRef]
- Li, C.X.; Li, G.Z. Impact of China’s water pollution on agricultural economic growth: An empirical analysis based on a dynamic spatial panel lag model. Environ. Sci. Pollut. R. 2020, 28, 6956–6965. [Google Scholar] [CrossRef]
- Feng, W.; Lu, H.W.; Yao, T.C.; Guan, Y.L.; Xue, Y.X.; Yu, Q. Water environmental pressure assessment in agricultural systems in Central Asia based on an Integrated Excess Nitrogen Load Model. Sci. Total Environ. 2022, 803, 149912. [Google Scholar] [CrossRef] [PubMed]
- Ayotte, J.D.; Szabo, Z.; Focazio, M.J.; Eberts, S.M. Effects of human-induced alteration of groundwater flow on concentrations of naturally-occurring trace elements at water-supply wells. Appl. Geochem. 2011, 26, 747–762. [Google Scholar] [CrossRef] [Green Version]
- Wang, L.H.; Dong, Y.H.; Xie, Y.Q.; Song, F.; Wei, Y.Q.; Zhang, J.Y. Distinct groundwater recharge sources and geochemical evolution of two adjacent sub-basins in the lower Shule River Basin, northwest China. Hydrogeol. J. 2016, 24, 1967–1979. [Google Scholar] [CrossRef]
- Xiao, Y.; Hao, Q.C.; Zhang, Y.H.; Zhu, Y.C.; Yin, S.Y.; Qin, L.M.; Li, X.H. Investigating sources, driving forces and potential health risks of nitrate and fluoride in groundwater of a typical alluvial fan plain. Sci. Total Environ. 2022, 802, 149909. [Google Scholar] [CrossRef] [PubMed]
- Cao, Y.J.; Tang, C.Y.; Song, X.F.; Liu, C.M.; Zhang, Y.H. Characteristics of nitrate in major rivers and aquifers of the Sanjiang Plain. J. Environ. Monit. 2012, 14, 2624. [Google Scholar] [CrossRef]
- Cui, X.S.; Zheng, Z.X.; Cheng, Z.S.; Su, C. Hydrochemical distribution characteristic and formation mechanism of shallow groundwater in the north of Muling-Xingkai Plain. South-toNorth Water Transf. Water Sci. Technol. 2018, 16, 146–153. (In Chinese) [Google Scholar]
- Su, C.; Zhang, F.E.; Cui, X.S.; Cheng, Z.Y.; Zheng, Z.X. Source characterization of nitrate in groundwater using hydrogeochemical and multivariate statistical analysis in the muling-xingkai plain, northeast china. Environ. Monit. Assess. 2020, 192, 456. [Google Scholar] [CrossRef]
- Xue, Y.Q.; Wu, J.C.; Ye, S.J.; Zhang, Y.X. Hydrogeological and hydrogeochemical studies for salt water intrusion the south coast of Laizhou Bay, China. Groundwater 2000, 38, 38–45. [Google Scholar] [CrossRef]
- Beal, L.K.; Wong, C.I.; Bautista, K.K.; Jenson, J.W.; Banner, J.L.; Lander, M.A.; Gingerich, S.B.; Partin, J.W.; Hardt, B.; van Oort, N.H. Isotopic and geochemical assessment of the sensitivity of groundwater resources of Guam, Mariana Islands, to intra- and inter-annual variations in hydroclimate. J. Hydrol. 2019, 568, 174–183. [Google Scholar] [CrossRef]
- Shuai, G.Y.; Shao, J.L.; Cui, Y.L.; Zhang, Q.L.; Guo, Y.T. Hydrochemical Characteristics and Quality Assessment of Shallow Groundwater in the Xinzhou Basin, Shanxi, North China. Water 2021, 13, 1993. [Google Scholar] [CrossRef]
- Newman, B.D.; Havenor, K.C.; Longmire, P. Identification of hydrochemical facies in the Roswell Artesian Basin, New Mexico (USA), using graphical and statistical methods. Hydrogeol. J. 2016, 24, 819–839. [Google Scholar] [CrossRef]
- Liu, J.T.; Hao, Y.J.; Gao, Z.J.; Wang, M.; Liu, M.X.; Wang, Z.Y.; Wang, S. Determining the factors controlling the chemical composition of groundwater using multivariate statistics and geochemical methods in the Xiqu coal mine, North China. Environ. Earth Sci. 2019, 78, 36. [Google Scholar] [CrossRef]
- Blarasin, M.; Matiatos, I.; Cabrera, A.; Lutri, V.; Giacobone, D.; Becher Quinodoz, F.; Matteoda, E.; Eric, C.; Felizzia, J.; Giuliano Albo, J. Characterization of groundwater dynamics and contamination in an unconfined aquifer using isotope techniques to evaluate domestic supply in an urban area. J. S. Am. Earth. Sci. 2021, 110, 103360. [Google Scholar] [CrossRef]
- Hakimi, Y.; Orban, P.; Deschamps, P.; Brouyere, S. Hydrochemical and isotopic characteristics of groundwater in the Continental Intercalaire aquifer system: Insights from Mzab Ridge and surrounding regions, North of the Algerian Sahara. J. Hydrol. Reg. Stud. 2021, 34, 100791. [Google Scholar] [CrossRef]
- Yang, Q.C.; Li, Z.J.; Ma, H.Y.; Wang, L.C.; Martín, J.D. Identification of the hydrogeochemical processes and assessment of groundwater quality using classic integrated geochemical methods in the Southeastern part of Ordos basin, China. Environ. Pollut. 2016, 218, 879–888. [Google Scholar] [CrossRef] [PubMed]
- Güler, C.; Kurt, M.A.; Alpaslan, M.; Akbulut, C. Assessment of the impact of anthropogenic activities on the groundwater hydrology and chemistry in Tarsus coastal plain (Mersin, SE Turkey) using fuzzy clustering, multivariate statistics and GIS techniques. J. Hydrol. 2012, 414–415, 435–451. [Google Scholar] [CrossRef]
- Liu, S.; Tang, Z.H.; Gao, M.S.; Hou, G.H. Evolutionary process of saline-water intrusion in Holocene and late Pleistocene groundwater in southern Laizhou Bay. Sci. Total Environ. 2017, 607–608, 586–599. [Google Scholar] [CrossRef]
- Liu, C.W.; Lin, K.H.; Kuo, Y.M. Application of factor analysis in the assessment of groundwater quality in the blackfoot disease area in Taiwan. Sci. Total Environ. 2003, 313, 77–89. [Google Scholar] [CrossRef]
- Peng, L.; Shi, Q.D.; Wan, Y.B.; Shi, H.B.; Kahaer, Y.J.; Abudu, A. Impact of Flooding on Shallow Groundwater Chemistry in the Taklamakan Desert Hinterland: Remote Sensing Inversion and Geochemical Methods. Water 2022, 14, 483. [Google Scholar] [CrossRef]
- Marandi, A.; Shand, P. Groundwater chemistry and the Gibbs Diagram. Appl. Geochem. 2018, 97, 209–212. [Google Scholar] [CrossRef]
- Gaillardet, J.; Dupré, B.; Louvat, P.; Allègre, C.J. Global silicate weathering and CO2 consumption rates deduced from the chemistry of large rivers. Chem. Geol. 1999, 159, 3–30. [Google Scholar] [CrossRef]
- Rehman Qaisar, F.U.; Zhang, F.; Pant, R.R.; Wang, G.; Khan, S.; Zeng, C. Spatial variation, source identification, and quality assessment of surface water geochemical composition in the Indus River Basin, Pakistan. Environ. Sci. Pollut. R. 2018, 25, 12749–12763. [Google Scholar] [CrossRef] [PubMed]
- Lang, Y.C.; Liu, C.Q.; Zhao, Z.Q.; Li, S.L.; Han, G.L. Geochemistry of surface and ground water in Guiyang city, China: Water/rock interaction and pollution in a karst hydrological system. Appl. Geochem. 2006, 21, 887–903. [Google Scholar] [CrossRef]
- Ahmed, A.; Clark, I. Groundwater flow and geochemical evolution in the Central Flinders Ranges, South Australia. Sci. Total Environ. 2016, 572, 837–851. [Google Scholar] [CrossRef] [PubMed]
- Carrasco-Cantos, F. Application of stable isotopes (δ34S-SO4, δ18O-SO4, δ15N-NO3, δ18O-NO3) to determine natural background and contamination sources in the Guadalhorce River Basin (southern Spain). Sci. Total Environ. 2015, 506–507, 46–57. [Google Scholar] [CrossRef]


| Parameter | Unit | Z1 (n = 17) | Z2 (n = 54) | Z3 (n = 75) | Z4 (n = 22) | ||||||||||||||||
|---|---|---|---|---|---|---|---|---|---|---|---|---|---|---|---|---|---|---|---|---|---|
| Min. | Max. | Mean | SD | CV (%) | Min. | Max. | Mean | SD | CV (%) | Min. | Max. | Mean | SD | CV (%) | Min. | Max. | Mean | SD | CV (%) | ||
| PH | Standard | 5.87 | 7.80 | 6.63 | 0.52 | 8 | 6.09 | 7.60 | 6.74 | 0.38 | 6 | 5.92 | 7.46 | 6.74 | 0.31 | 5 | 6.38 | 7.15 | 6.77 | 0.23 | 3 |
| TDS | mg·L−1 | 64.70 | 442.40 | 195.48 | 93.35 | 48 | 84.59 | 746.10 | 243.40 | 122.94 | 51 | 90.05 | 1179.00 | 248.20 | 154.13 | 62 | 106.00 | 1154.00 | 278.58 | 208.11 | 75 |
| K+ | mg·L−1 | 0.52 | 2.61 | 1.45 | 0.60 | 41 | 0.22 | 49.69 | 3.09 | 7.50 | 243 | 0.33 | 22.92 | 2.87 | 3.96 | 138 | 0.48 | 42.57 | 4.29 | 8.54 | 199 |
| Na+ | mg·L−1 | 5.40 | 52.17 | 17.37 | 11.46 | 66 | 8.42 | 63.79 | 20.27 | 12.36 | 61 | 3.75 | 96.68 | 20.07 | 13.32 | 66 | 6.21 | 79.05 | 27.50 | 16.17 | 59 |
| Ca2+ | mg·L−1 | 6.01 | 79.08 | 29.87 | 17.57 | 59 | 10.07 | 120.40 | 38.87 | 25.36 | 65 | 8.79 | 167.20 | 36.17 | 22.15 | 61 | 12.65 | 191.40 | 38.09 | 36.05 | 95 |
| Mg2+ | mg·L−1 | 2.78 | 29.10 | 11.84 | 7.34 | 62 | 4.37 | 44.26 | 12.81 | 7.89 | 62 | 4.27 | 55.84 | 12.44 | 8.14 | 65 | 3.72 | 81.35 | 13.90 | 15.36 | 111 |
| Cl− | mg·L−1 | -- | 64.93 | 7.76 | 15.41 | 198 | 0.35 | 59.72 | 11.51 | 14.91 | 129 | -- | 184.30 | 20.03 | 29.04 | 145 | 0.35 | 308.90 | 37.09 | 66.53 | 179 |
| SO42− | mg·L−1 | 1.61 | 28.21 | 6.90 | 6.24 | 90 | 1.62 | 74.18 | 22.91 | 21.07 | 92 | 1.70 | 181.30 | 24.24 | 31.56 | 130 | 1.64 | 125.80 | 23.59 | 33.24 | 141 |
| HCO3− | mg·L−1 | 18.23 | 504.40 | 174.93 | 125.42 | 72 | 33.63 | 642.00 | 183.49 | 115.47 | 63 | 24.46 | 354.60 | 133.93 | 72.41 | 54 | 66.03 | 550.30 | 153.16 | 104.06 | 68 |
| NH4+ | mg·L−1 | 0.02 | 7.70 | 1.53 | 2.52 | 165 | 0.01 | 7.00 | 1.00 | 1.63 | 163 | 0.02 | 5.30 | 0.66 | 1.31 | 198 | 0.02 | 3.90 | 0.69 | 1.27 | 185 |
| NO3− | mg·L−1 | 1.75 | 104.30 | 9.58 | 23.83 | 249 | 0.20 | 147.70 | 9.74 | 24.17 | 248 | 1.75 | 399.00 | 32.61 | 68.66 | 211 | 1.78 | 95.68 | 21.24 | 29.95 | 141 |
| EC | ms·cm−1 | 0.13 | 2.05 | 0.50 | 0.40 | 80 | |||||||||||||||
| Eh | mv | −164.00 | 135.00 | 10.58 | 80.16 | 758 | |||||||||||||||
| Zones | Total Samples | Number of Special Samples | C (%) |
|---|---|---|---|
| Z1 | 17 | 3 | 17.65 |
| Z2 | 54 | 9 | 16.67 |
| Z3 | 71 | 16 | 22.53 |
| Z4 | 22 | 10 | 45.45 |
| Chemical Parameter | Z1 | Z2 | Z3 | Z4 | |||||||
|---|---|---|---|---|---|---|---|---|---|---|---|
| PC1 | PC2 | PC3 | PC1 | PC2 | PC3 | PC1 | PC2 | PC3 | PC1 | PC2 | |
| PH | 0.820 | −0.390 | −0.037 | 0.860 | −0.272 | −0.301 | −0.115 | 0.957 | −0.084 | 0.228 | 0.775 |
| TDS | 0.965 | 0.140 | 0.131 | 0.819 | 0.559 | 0.036 | 0.995 | −0.011 | 0.029 | 0.996 | −0.040 |
| K+ | −0.210 | −0.108 | 0.913 | 0.482 | 0.448 | 0.589 | 0.684 | −0.211 | 0.016 | 0.943 | 0.213 |
| Na+ | 0.845 | 0.136 | −0.271 | 0.771 | −0.069 | 0.215 | 0.935 | −0.069 | −0.044 | 0.881 | −0.253 |
| Ca2+ | 0.969 | 0.000 | 0.108 | 0.777 | 0.563 | −0.111 | 0.943 | 0.185 | 0.096 | 0.982 | 0.049 |
| Mg2+ | 0.952 | −0.033 | −0.003 | 0.779 | 0.576 | −0.046 | 0.922 | 0.228 | 0.068 | 0.978 | 0.063 |
| HCO3− | 0.920 | −0.350 | 0.136 | 0.969 | 0.114 | 0.180 | −0.015 | 0.760 | 0.420 | 0.783 | 0.587 |
| SO42− | −0.428 | 0.128 | −0.624 | −0.075 | 0.826 | 0.026 | 0.866 | −0.331 | −0.273 | 0.823 | −0.140 |
| Cl− | −0.117 | 0.953 | −0.234 | 0.129 | 0.804 | 0.018 | 0.861 | −0.212 | −0.232 | 0.944 | −0.235 |
| NH4+ | 0.016 | −0.091 | 0.892 | 0.037 | 0.019 | 0.700 | −0.068 | −0.003 | 0.979 | −0.012 | 0.669 |
| NO3− | 0.019 | 0.976 | −0.060 | 0.177 | 0.566 | −0.042 | 0.896 | −0.253 | −0.476 | 0.262 | −0.835 |
| EC | 0.981 | −0.014 | |||||||||
| Eh | 0.127 | −0.812 | |||||||||
| Eigenvalue | 5.25 | 2.21 | 2.20 | 4.44 | 2.90 | 1.44 | 6.39 | 1.85 | 1.53 | 7.86 | 2.94 |
| Explained variance (%) | 47.74 | 20.09 | 19.98 | 40.38 | 26.40 | 13.05 | 58.06 | 16.80 | 13.88 | 60.45 | 22.63 |
| Cumulative % of variance | 47.74 | 67.83 | 87.81 | 40.38 | 66.77 | 79.83 | 58.06 | 74.86 | 88.74 | 60.45 | 83.08 |
| Saturation Index | Z1 | Z2 | Z3 | Z4 | ||||||||
|---|---|---|---|---|---|---|---|---|---|---|---|---|
| Max | Min | Mean | Max | Min | Mean | Max | Min | Mean | Max | Min | Mean | |
| SI (Calcite) | 0.37 | −3.34 | −1.95 | 0.26 | −2.49 | −1.25 | 0.08 | −2.79 | −1.56 | 0.44 | −1.78 | −1.45 |
| SI (Dolomite) | 0.58 | −5.52 | −2.24 | 0.29 | −5.2 | −2.64 | −0.15 | −4.52 | −3.02 | 0.75 | −3.84 | −2.56 |
| SI (Gypsum) | 2.61 | −3.75 | −3.23 | −0.61 | −3.65 | −2.74 | −1.91 | −3.56 | −2.75 | −1.31 | −3.85 | −2.85 |
| SI (Halite) | −7.25 | −9.62 | −8.35 | −7.29 | −9.68 | −8.89 | −6.91 | −9.54 | −8.51 | −6.23 | −9.7 | −8.88 |
Publisher’s Note: MDPI stays neutral with regard to jurisdictional claims in published maps and institutional affiliations. |
© 2022 by the authors. Licensee MDPI, Basel, Switzerland. This article is an open access article distributed under the terms and conditions of the Creative Commons Attribution (CC BY) license (https://creativecommons.org/licenses/by/4.0/).
Share and Cite
Su, C.; Li, Z.; Wang, W.; Cheng, Z.; Zheng, Z.; Chen, Z. Key Factors Dominating the Groundwater Chemical Composition in a Grain Production Base: A Case Study of Muling–Xingkai Plain, Northeast China. Water 2022, 14, 2222. https://doi.org/10.3390/w14142222
Su C, Li Z, Wang W, Cheng Z, Zheng Z, Chen Z. Key Factors Dominating the Groundwater Chemical Composition in a Grain Production Base: A Case Study of Muling–Xingkai Plain, Northeast China. Water. 2022; 14(14):2222. https://doi.org/10.3390/w14142222
Chicago/Turabian StyleSu, Chen, Zhuang Li, Wenzhong Wang, Zhongshuang Cheng, Zhaoxian Zheng, and Zongyu Chen. 2022. "Key Factors Dominating the Groundwater Chemical Composition in a Grain Production Base: A Case Study of Muling–Xingkai Plain, Northeast China" Water 14, no. 14: 2222. https://doi.org/10.3390/w14142222