
Examining How a Smart Rainwater Harvesting System Connected to a Green Roof Can Improve Urban Stormwater Management

1
Department of Civil and Environmental Engineering, The Citadel, The Military College of South Carolina, 171 Moultrie Street, 208 LeTellier Hall, Charleston, SC 29409, USA
2
Department of Civil, Architectural, and Environmental Engineering, Center for Water and the Environment, University of Texas at Austin, 301 E. Dean Keeton St, Austin, TX 78712, USA
3
Department of Civil Engineering and Engineering Mechanics, Columbia University, 500 West 120th Street, 610 Mudd, New York, NY 10027, USA
4
Department of Civil and Environmental Engineering and Earth Sciences, University of Notre Dame, 257 Fitzpatrick Hall of Engineering, Notre Dame, IN 46556, USA
*
Author to whom correspondence should be addressed.
Water 2022, 14(14), 2216; https://doi.org/10.3390/w14142216
Submission received: 14 June 2022
/
Revised: 10 July 2022
/
Accepted: 13 July 2022
/
Published: 14 July 2022
(This article belongs to the Special Issue Green Infrastructure as a Technology for Rainwater Retention)
Abstract
:This study quantified how a smart rainwater harvesting cistern that collected stormwater runoff from a green roof reduced stormwater flow into a combined sewer system (CSS) during wet-weather flow. The studied smart rainwater harvesting cistern collected runoff from a green roof located in Bronx, New York City; it used the Continuous Monitoring and Adaptive Control (CMAC) smart sensor provided by OptiRTC, Inc., to regulate the water flow from the cistern. The cistern collected stormwater runoff from the roof, usually draining completely after 24 h of dry weather. However, the smart sensor used weather forecasting data, and if additional rainfall was predicted immediately following another storm, the cistern only drained a specific amount, calibrated to mitigate the CSO. Five years of data from the cistern system were used to understand the role of the cistern’s smart sensor in reducing stormwater flow into the CSS during storms. The study results demonstrate that connecting the smart cistern system to the green-roof maximized stormwater collection (compared with the green roof alone) for storm sizes between 2 mm and 25 mm and for antecedent dry-weather periods greater than 2 days. The total of 65.2% of rainfall retained over the monitoring period by the green roof alone increased to 75.6% when considering the total stormwater retained and detained together by the green roof and cistern, thus yielding a 10% improvement. The study results also demonstrate that the smart sensor’s use of weather forecasting data failed to improve system performance.
1. Introduction
One of the greatest water pollution concerns for older cities, including nearly 860 US cities, is combined sewer overflow (CSO) [1], where as little as three millimeters per hour of rainfall intensity overwhelms the sewer system, causing a mix of raw sewage and rainfall to discharge directly into nearby waterbodies [2]. To offset the CSO, cities are increasingly turning to green infrastructure measures that capture and retain rainfall, including green roofs [3] and rainwater-harvesting systems [4]. Rainwater harvesting (RWH), a practice that dates back to prehistoric times [5], is defined as harvesting rainwater from rooftops with the purpose of providing water for domestic or other usage [6]. RWH systems both conserve water and reduce stormwater runoff to sewer systems, by using or temporarily detaining collected precipitation [7,8].
RWH systems for stormwater management are only effective when the harvested rainwater is used or released between rainfall events, freeing capacity within the cisterns for storing the next rainfall event. One challenge involved with the implementation of RWH is cistern overflow. When cisterns remain full from prior storms, they are more likely to overflow during the following rain event [8,9]. This undermines any intended stormwater management benefit. Despite widespread use throughout urbanized areas in the US, RWH systems typically provide negligible mitigation of stormwater runoff due to cistern overflow [10].
Real-time control (RTC) technologies, often referred to as “smart” technologies, can allow more stormwater to be captured than traditional RWH systems via controlled releases of water from the system that lower tank water levels between rainfall events [11]. RTC improves the effectiveness of existing infrastructure by using it in a more dynamic, flexible way [12] and, as an added bonus, with a much smaller footprint and using little space [13]. This may be performed by emptying the stormwater collected by the cistern a set time after each storm event, thereby reducing stormwater runoff at times when sewers are already flooded. Alternatively, however, smart sensors may be used to further refine the cistern’s RTC controlled release, by adapting its release schedule to forecast weather patterns. Despite the promising nature of these developments, prior research on RWHs and RTC has focused on water supply and has not extensively focused on stormwater management [13,14,15]. Thus, further work is needed to benchmark the performance of RTC in stormwater systems [13,16].
To respond to this need, we monitored the performance of a rainwater harvesting cistern with RTC collecting stormwater runoff from a green roof over a period close to five years (58 months). We quantified the additional stormwater management benefits provided by the cistern beyond that of the green roof and examined how it changed for varying storm sizes and antecedent dry-weather periods.
2. Materials and Methods
2.1. Green Roof
The green roof was installed in October 2012 in Bronx, New York City, at 40°50′50′′ N, 73°52′13′′ W, on the second-floor roof of the Bronx headquarters of New York City’s Department of Parks and Recreation. The green roof, with a total area of 638 m2, was divided into four quadrants, three planted and the fourth left bare as a control. Each quadrant drained a separate area, with a 1.0% slope toward each quadrant’s drain. The vegetated quadrants were planted with grasses, forbs, and shrubs native to New York State [17]. The roof was irrigated during summer and early fall under dry conditions. Because the vegetated quadrants had nearly identical runoff patterns [18], this study focused on data associated with a single quadrant. This quadrant was 180 m2 in area and had a 127 mm deep substrate medium blend provided by American Hydrotech Inc. known as Litetop, with a reported organic content of 3–6% and a maximum water retention of 38%. Rainfall data were measured with an Onset Hobo U30 weather station connected to a TR-525i Texas Electronics tipping bucket rain gage with a five-minute logging frequency located on the nearby non-vegetated quadrant.
2.2. Cistern with Real-Time Control
Through a pipe, stormwater drained down from the green-roof quadrant into a cistern located on the ground level of the building. The cistern had a nominal capacity of 1893 L (500 gallons), a volume effectively sized to store an 8 mm depth storm over the quadrant area. This 8 mm storm depth is referred to in this paper as the normalized cistern water level, i.e., rainfall depth converted to total water volume falling on a given surface area. In other words, if all rainfall went directly into the cistern, then the cistern would store 8 mm of rainfall.
An HRXL-Max-Sonar-WR #MB7360 MaxBotix, Inc., acoustical sensor recorded the water level, with a one-minute logging frequency, allowing the determination of stormwater flows to be performed during storms based on the change in the cistern’s water level. Overflow from the cistern into the local combined sewer system (CSS) was measured with a V-notch weir.
The cistern controller had real-time control (smart) sensors that communicated with local weather forecasts [16] using Continuous Monitoring and Adaptive Control (CMAC) technology provided by OptiRTC, Inc. (Opti, Boston, MA, USA; www.optirtc.com (accessed on 13 June 2022)). The cistern was programmed to either (1) drain completely 24 h after a storm event ended or (2) partially empty if a subsequent storm was forecast. This smart decision-making process reduced combined sewer overflows by decreasing flow into the CSS at times when the system might have been approaching capacity during a storm event. This is because the goal was to minimize water flow into the sewer system right before or during storm events, as during storms the sewer system was likely to be overwhelmed. For back-to-back storms, it was preferable to only release the minimal volume of water from the cistern to make space for the upcoming rain. Thus, the system avoided flooding excess water into the sewer system when it was due to become overloaded during storm events. This mechanism functioned as explained below.
Weather was predicted using the National Weather Service’s Quantitative Precipitation Forecast (QPF) and Probability of Precipitation (POP) forecast models. If dry weather was expected—meaning there was no projected rainfall in the immediate, upcoming six-hour window that exceeded the QPF and POP thresholds (1.3 mm and 60%, respectively)—the 24 h post-storm period began. After 24 h of dry weather, the water detained in the cistern was drained from the cistern into the CSS. However, if a storm was forecast during the 24 h post-storm period that exceeded the QPF and POP thresholds, the controller estimated the expected stormwater volume that would enter the tank (based on the anticipated volume of precipitation). This was performed by multiplying the rainfall depth by the area of the roof quadrant (180 m2) and by a runoff coefficient (0.3). The cistern drained ahead of storms to make room for just this calculated volume: if the anticipated volume of runoff was less than the cistern’s volume, the cistern would only partly drain.
2.3. Analysis
Rainfall and cistern water-level volumes were monitored between 22 February 2013 and 16 December 2017, a period of 58 months. The rainfall depth of each recorded storm was calculated using a minimum 24 h dry period to separate storm events. This separation period was selected due to the CMAC programming of the cistern to drain completely 24 h after a storm. This storm separation resulted in 358 storms during the study period. Storms were eliminated for which blank sensor readings indicated sensor errors (9 storms); when freezing temperatures indicated that precipitation could be in the form of snow (61 storms); and when the runoff depth exceeded the rainfall depth (85 storms), an error occurring when peak runoff rates resulted in unreliable readings due to turbulence generated within the cistern. These elimination criteria resulted in 203 storms that were considered suitable for analysis (Table 1). Furthermore, there were 43 back-to-back storm events, defined as two separate storm events with an antecedent dry-weather period of one–two days that accordingly made use of the RTC smart sensor to partially empty the cistern.
The green-roof retention for each storm was calculated based on the rainfall, the increase in cistern volume, and any measured overflow:
Total onsite green roof retention + cistern detention was determined by subtracting cistern overflow from total rainfall volume, as all other rainfall was retained by the green roof or detained by the cistern:
It should be noted that detention and retention are not equivalent, as water retained by the green roof is ultimately evapotranspired and does not enter the sewer system at all, while water detained by the cistern is later released into the sewer system, after the sewer system is no longer overloaded due to a storm. However, for the purposes of CSO reduction, retention and detention are interchangeable, because in both cases water does not enter the sewer system when the system is overloaded.
The non-parametric Wilcoxon rank-sum test [19] was conducted in R v. 3.1.3 (The R Project for Statistical Computing, 2015) to compare retention + detention between the roof alone and the roof and cistern together and to compare normalized cistern water-level heights for different storm sizes and antecedent dry-weather periods.
3. Results and Discussion
3.1. Percentage of Water Detained by Cistern Affected by Rain Depth and by Length of Antecedent Dry-Weather Period
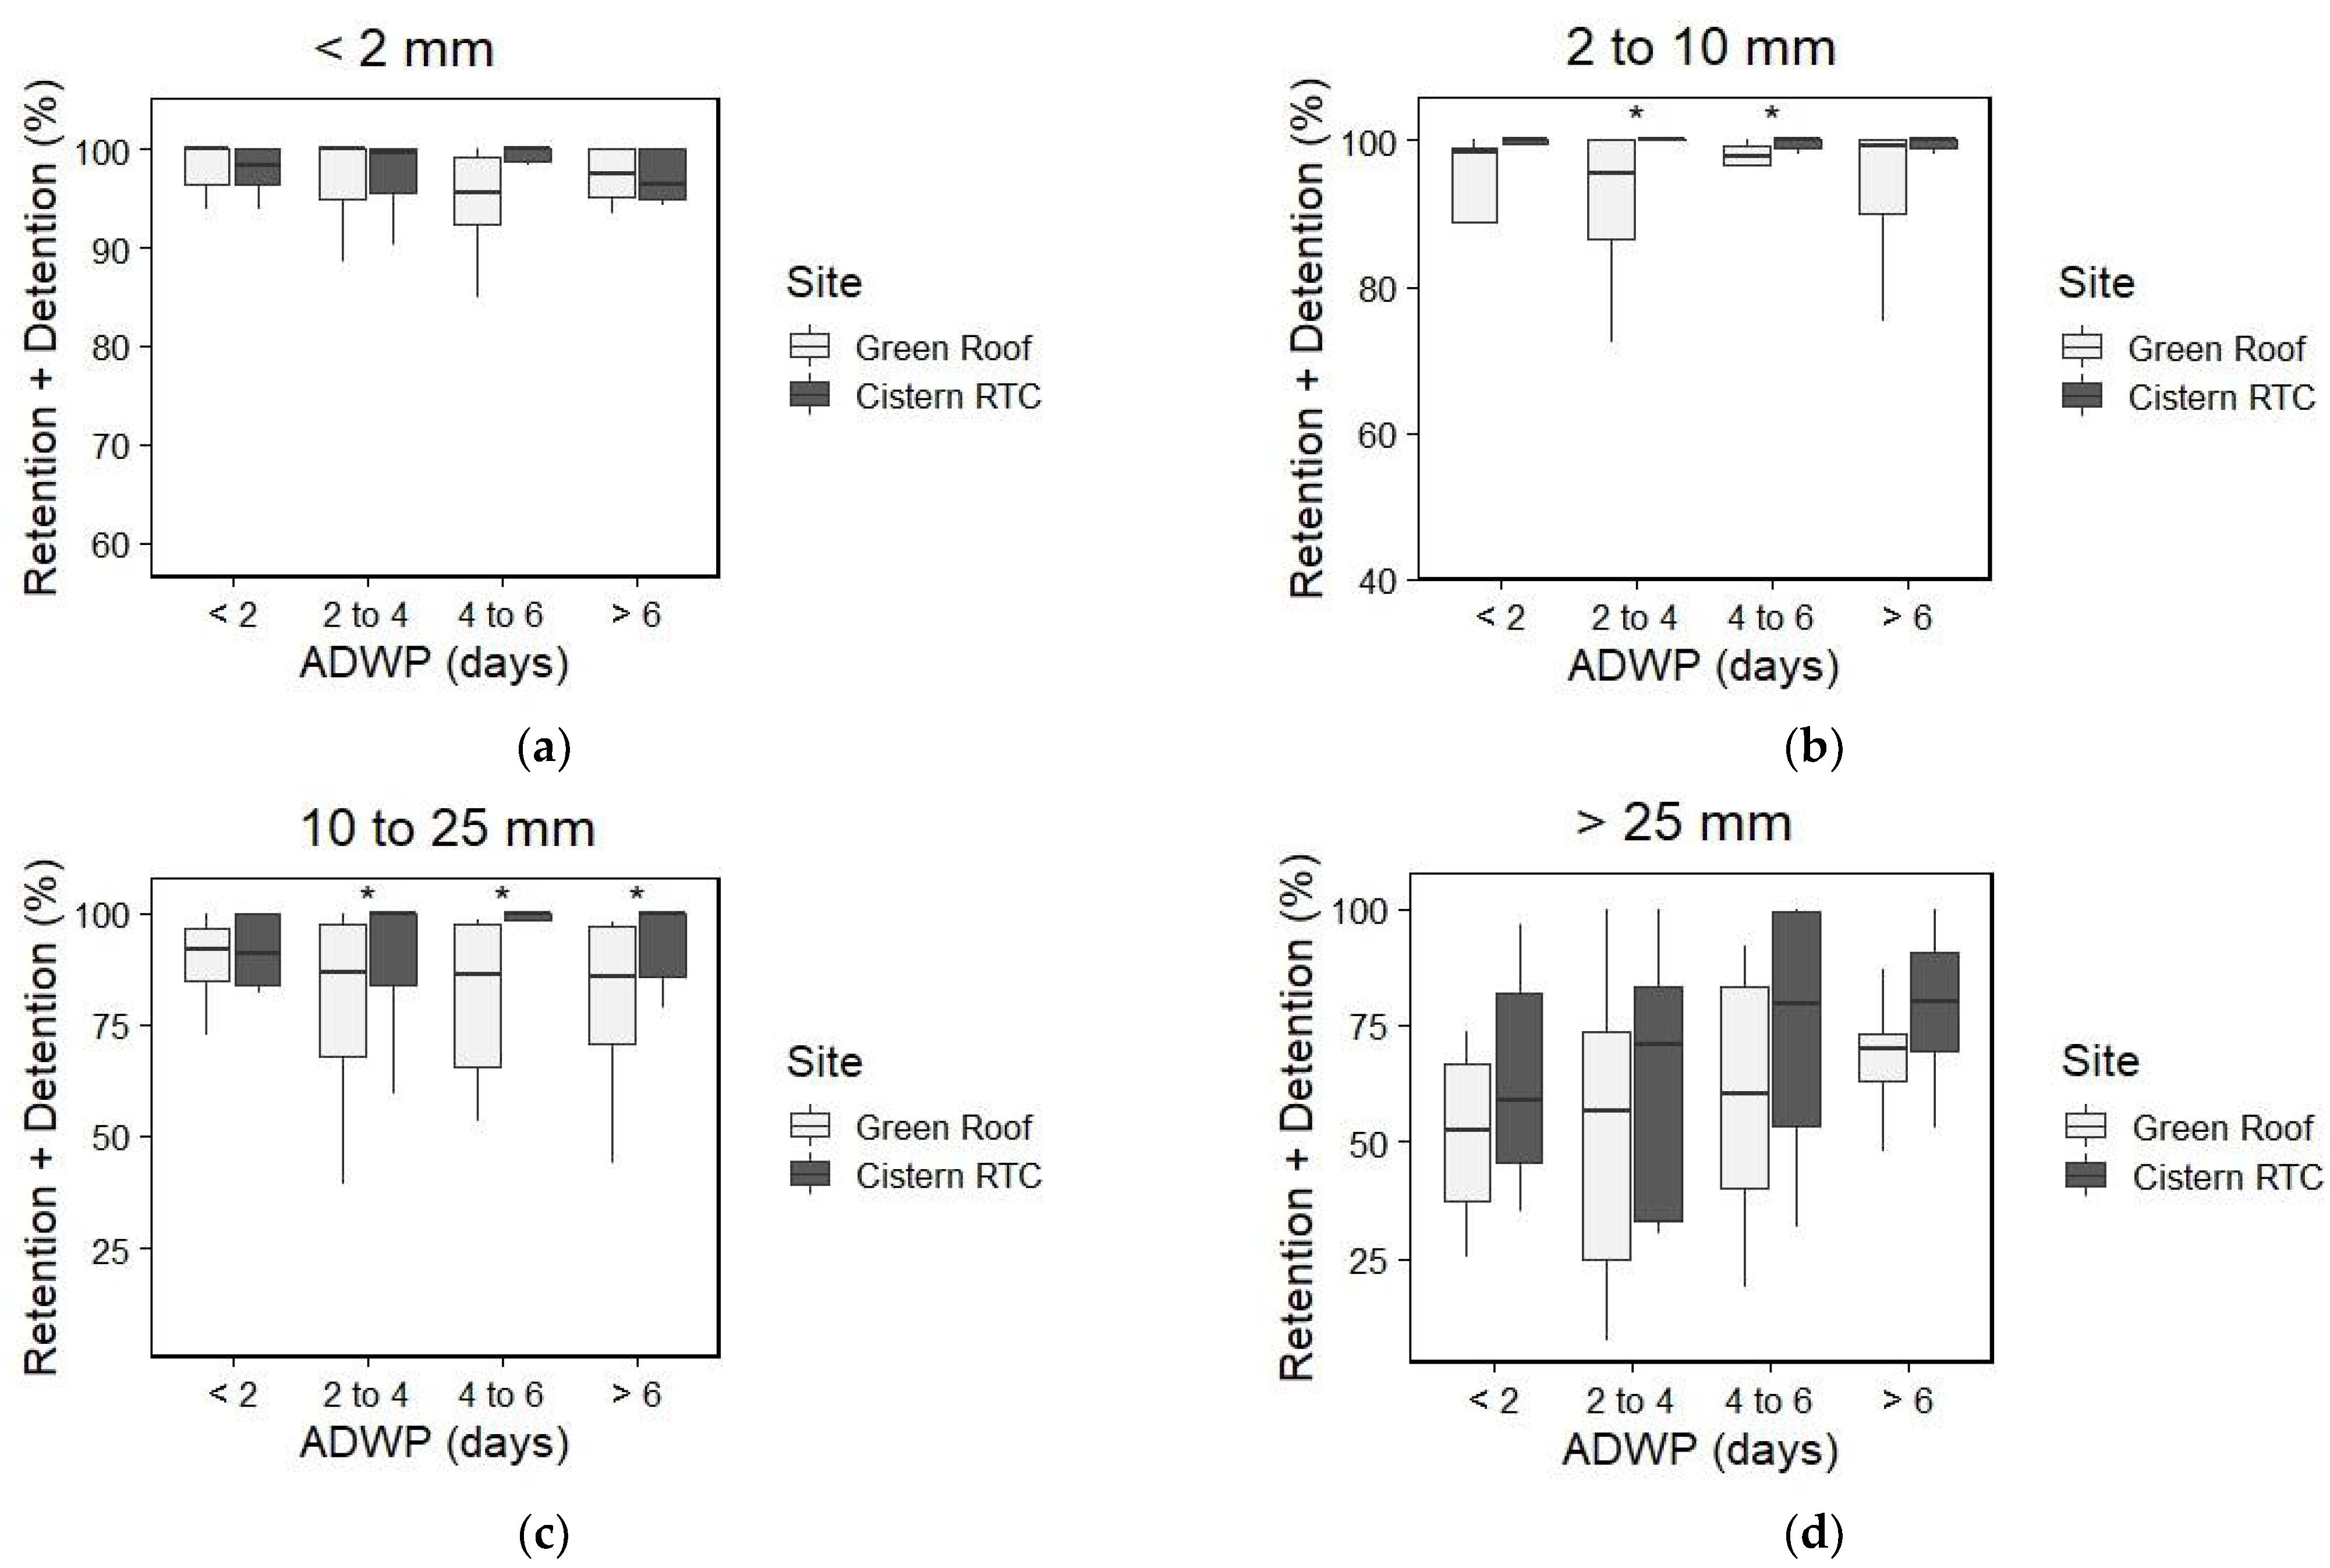
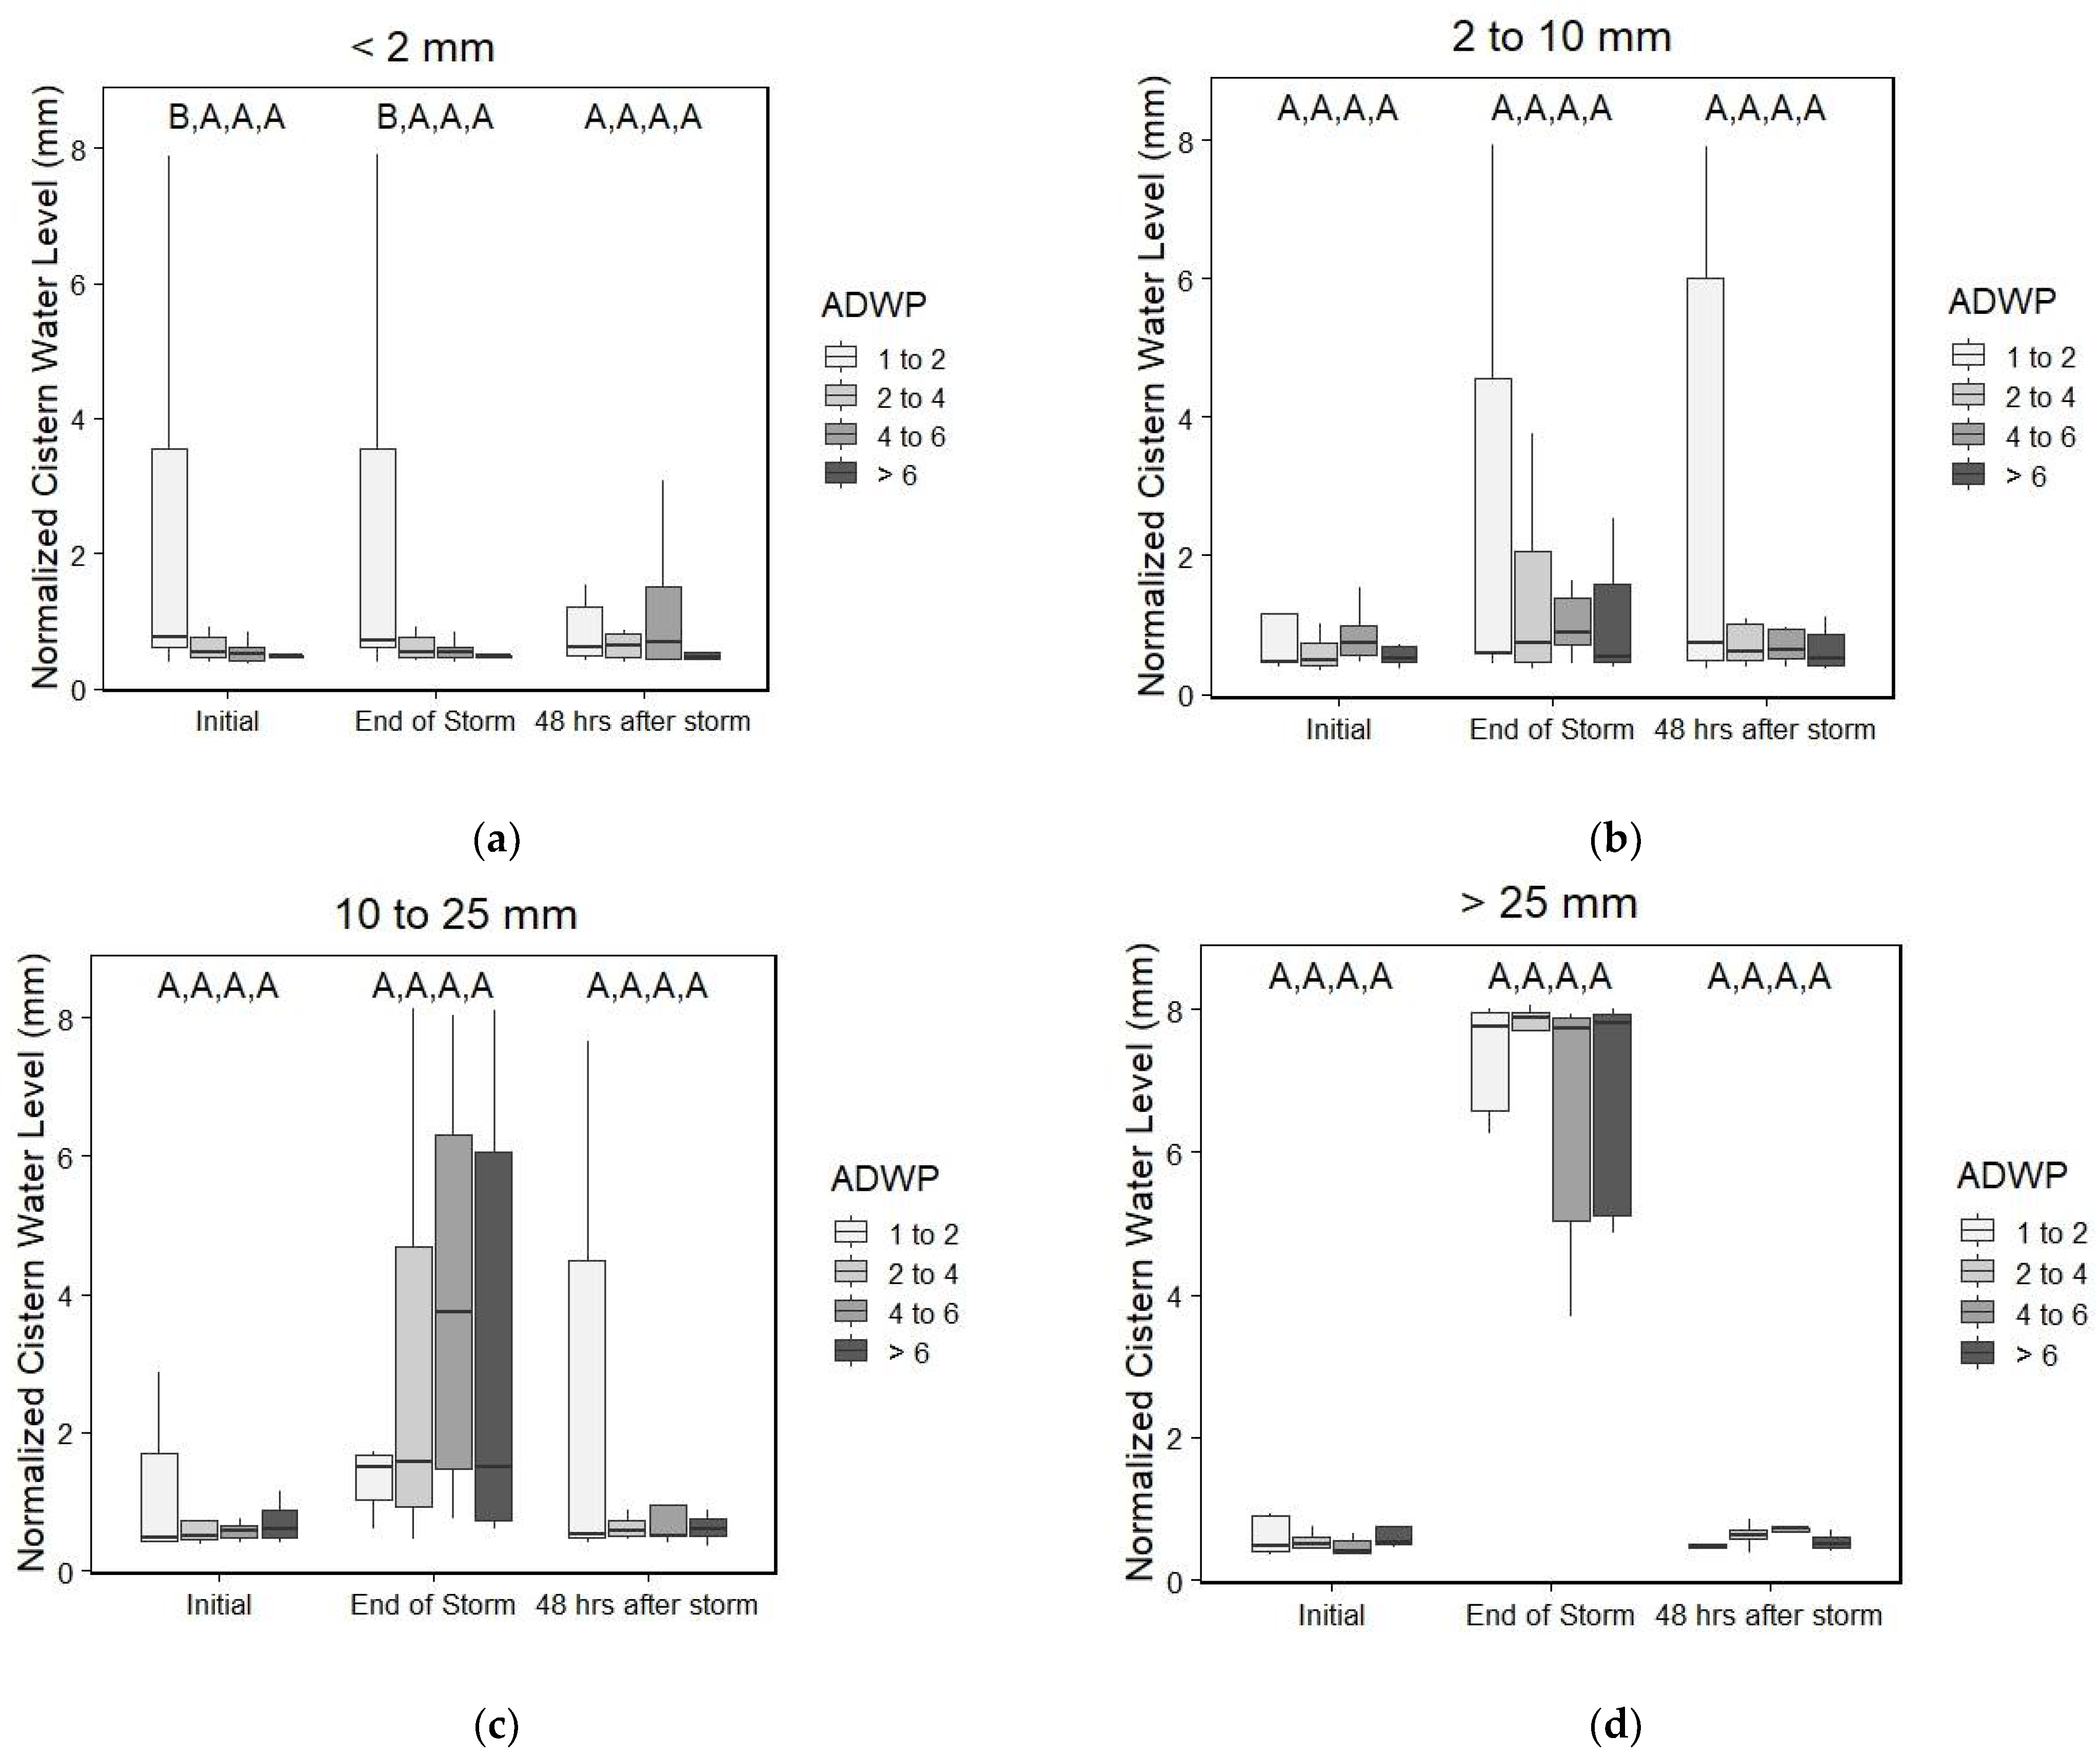
As was anticipated, this RTC smart sensor increased the green roof + cistern system’s water capture for all storms. However, for the smallest rainfall events (<2 mm), there were no statistically significant differences (p < 0.05) between the percent of rainfall retained on the green roof and the total water retained by the green roof and detained by the cistern (Figure 1a). For small storms, the retention rates were already nearly 100% for the green roof, as frequently reported in the literature [20], so the cistern provided few additional benefits. The cistern provided the largest advantage for larger storms, statistically greater than that of the green roof alone for storms with rainfall depths from 2 to 10 mm and from 10 to 25 mm (Figure 1b,c). However, the cistern did not provide a statistically significant advantage for storms greater than 25 mm (Figure 1d), as the cistern had a maximum effective capacity of 8 mm green-roof runoff depth, filling and overflowing when the green-roof runoff depth exceeded 8 mm (Figure 2d). After storms > 10 mm, the cistern water levels were also more variable (Figure 2c), due to the higher variability of the stormwater retention capacity of the green roof for rain depths > 10 mm (this variability was largely independent of the RTC system features).
The other major factor that affected the cistern water level following storm events was the length of the antecedent dry-weather period (ADWP). Due to the minimum 24 h dry period used to separate storms, one day was the smallest ADWP. For all storm-size groupings, the dual cistern–green roof system had statistically greater stormwater capture than the green roof alone for longer ADWP periods (>2 days), namely, when there were no back-to-back storms. Figure 2 illustrates that the variation in the cistern water level at all times (initial, end of storm, 48 h after storm) was generally the greatest for ADWPs < 2. For ADWPs > 2, the cisterns were generally empty before and after storm events (Figure 2). It was only for short-ADWP storms that the initial cistern water level was affected, as it was here that the smart sensor was designed to communicate with weather forecasting, and potentially declined to empty in anticipation of a subsequent storm that was due to overwhelm the sewer system (see Section 3.2 for discussion). Improving the accuracy of weather forecasts could reduce this variability and improve the stormwater performance of the RTC system.
3.2. Smart Sensor’s Weather Forecasts
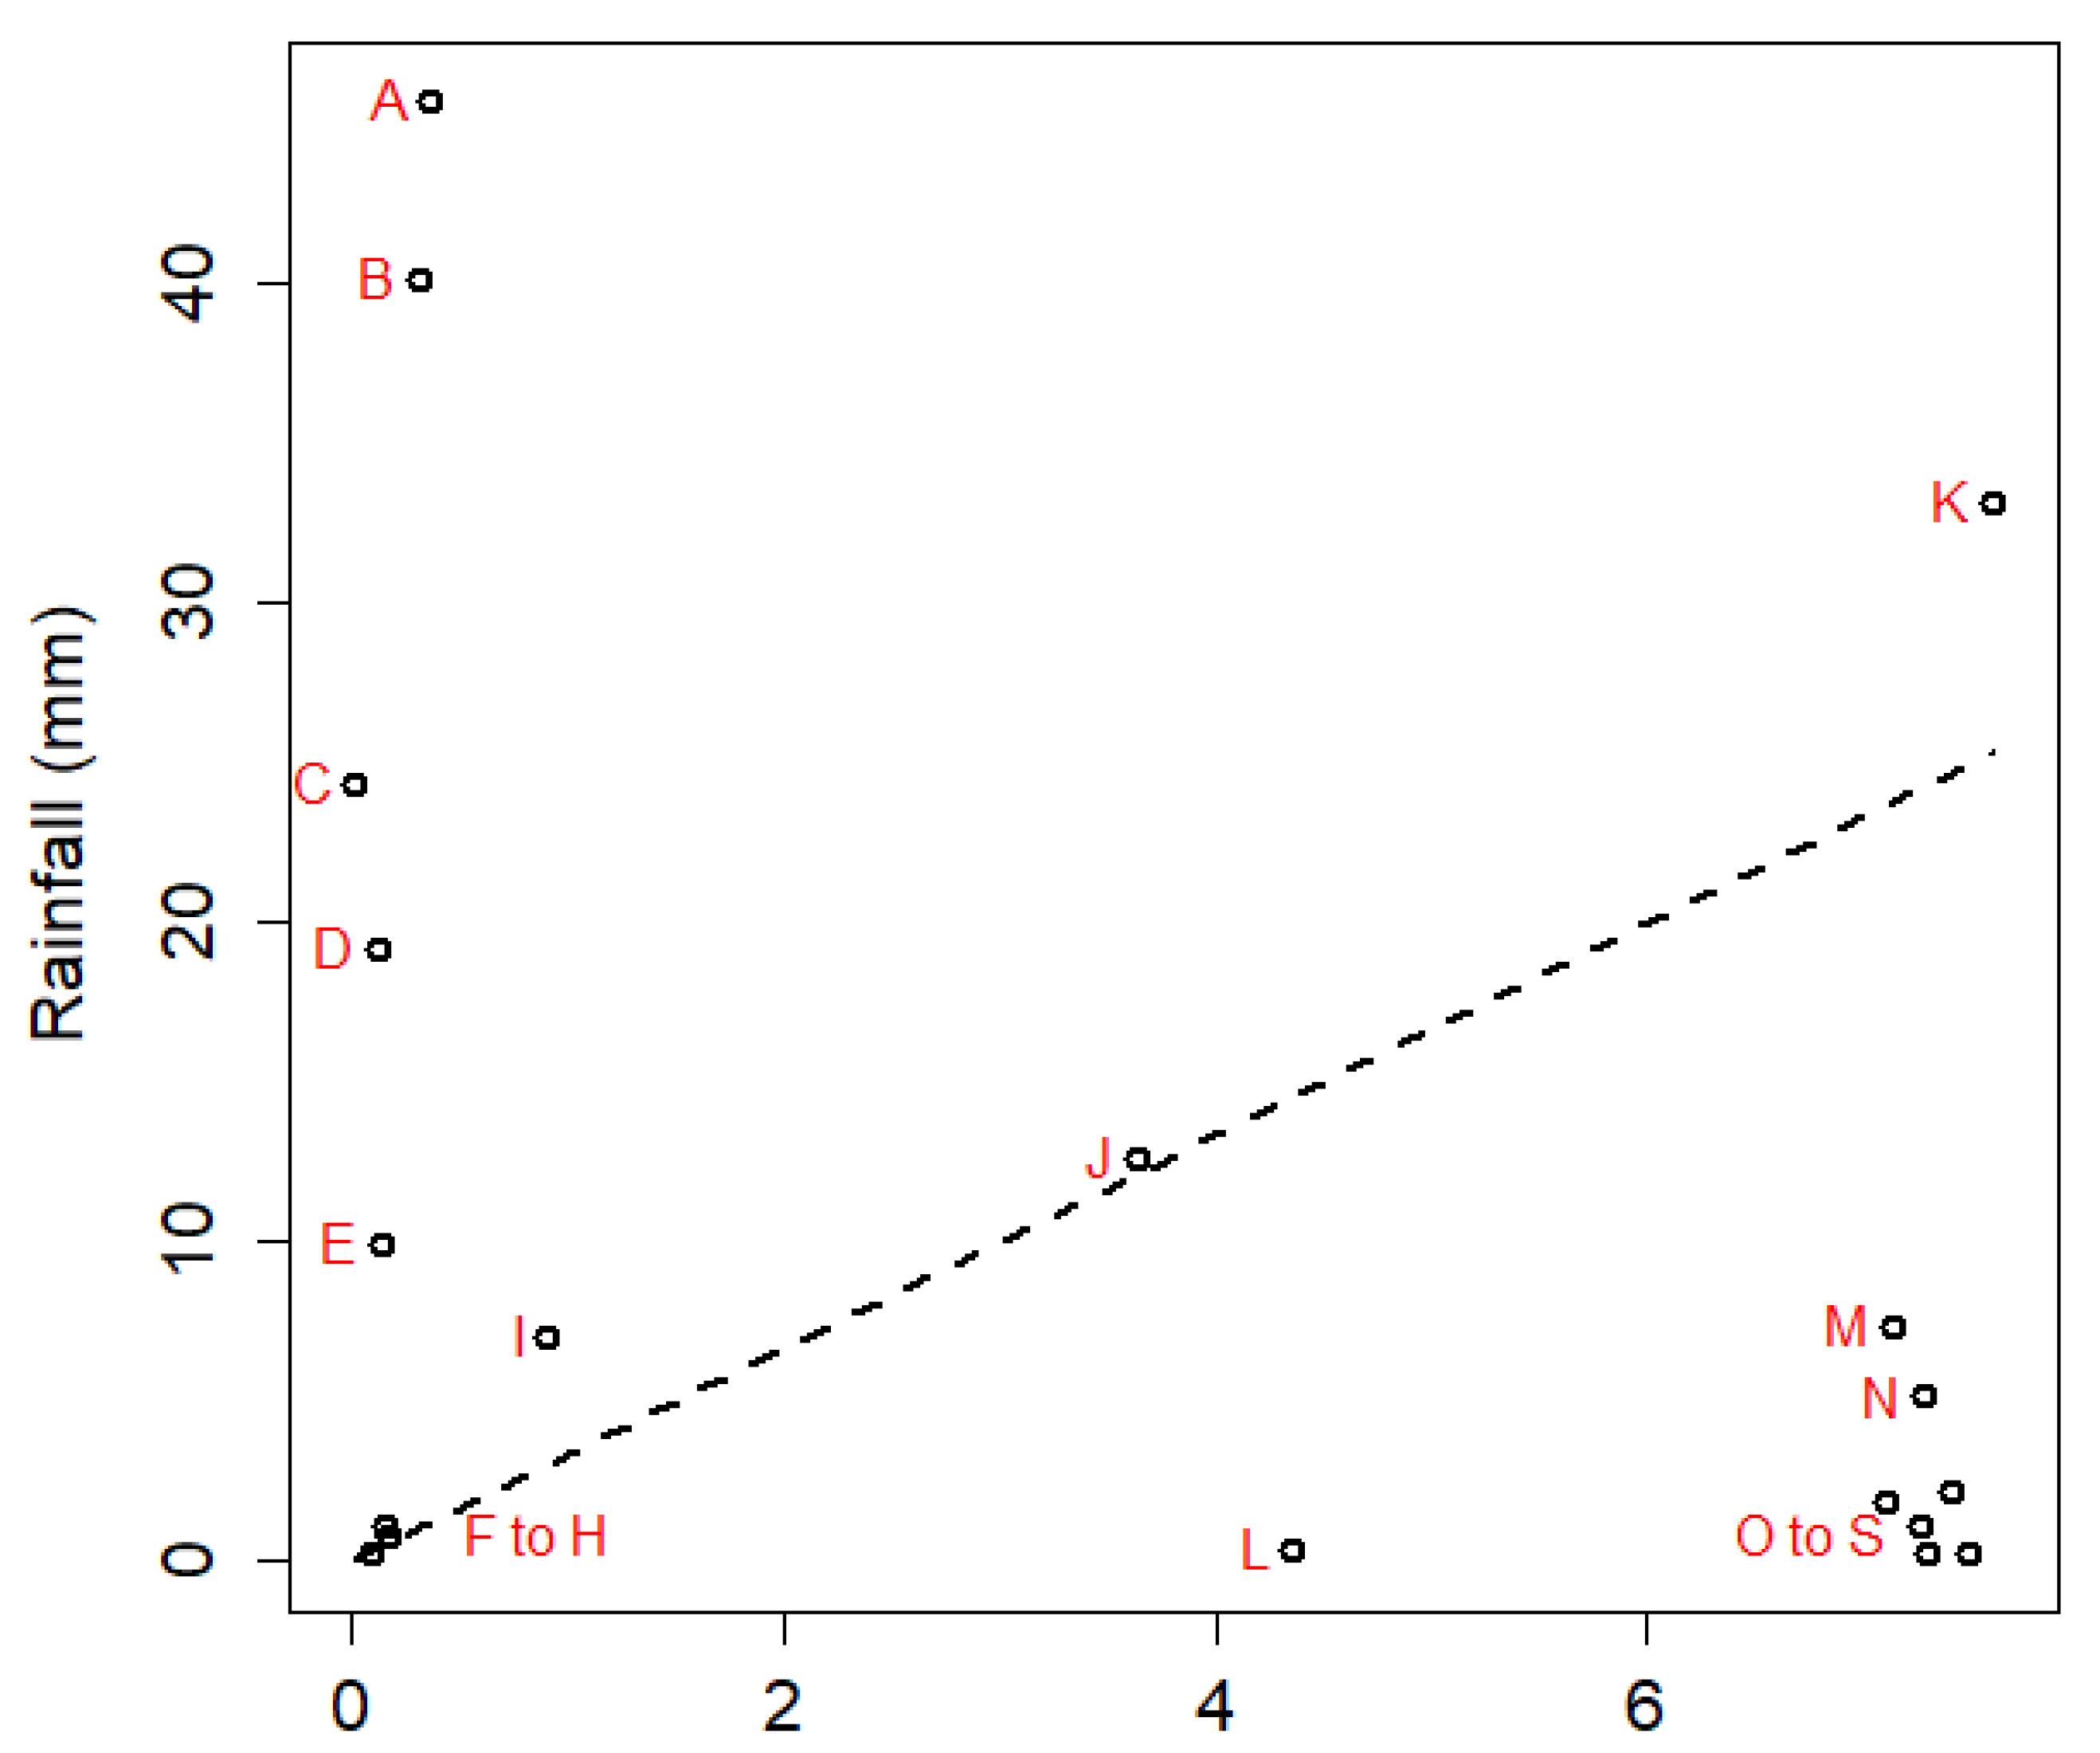
Out of all 358 weather events recorded in this study, 73, or 20%, had an ADWP of only one–two days, meaning they followed on the back of another storm. It is for these storms that the smart sensor’s weather forecasting abilities came into play and could potentially decrease the system’s total rainfall detention. Of these 73 events, 19 occurred when the water level was 7 mm or higher and thus when the smart-sensor emptying was the most important. For these 19 storms, the smart sensor underanticipated the coming storm and did not empty when it should have 26% of the time (five times: storms from A to E in Figure 3). These five storms constituted failures of the smart technology, as these storms each represented up to 500 gallons of water (the cistern’s volume) that the system could have potentially detained and did not due to inaccurate forecasting. Further, the smart sensor sometimes also overanticipated coming storms and emptied the cistern when it was not necessary. This was the case for eight storms (storms from L to S in Figure 3). This overprediction also worsened the cistern system’s detention performance, as it potentially increased the CSO triggered by the prior storm. Using a relationship between the duration of rainfall leading to a CSO and the minimum cumulative depth of rainfall causing a CSO, as determined for the Gowanus neighborhood of Brooklyn, New York City [2], we could estimate that, for example, a 15.4 mm storm over 24 h would cause a CSO, and a 28.4 mm storm over 48 h would cause a CSO. With this relationship and known storm depths, durations, and ADWPs, we estimated that, in fact, in seven out of these eight storms that the smart sensor overpredicted (all but storm N), the cistern emptied during a CSO event, thus unnecessarily increasing the CSO by up to 500 gallons.
The dotted line in Figure 3 traces what would have been optimal performance of the cistern’s smart sensor, assuming the sensor 100% accurately predicted storms and, in the case of an ADWP of 1–2 days, emptied the cistern accordingly (given a green-roof runoff coefficient of 0.3, as discussed in Section 2.2). Six storms (storms from F to K) did actually conform to this optimal performance. However, as three of these storms (from F to H) did not in fact produce significant rainfall, only three storms (from I to K) constituted a true success of the smart sensor system. The dotted line thus remains a benchmark to work towards in the future. For the time being, the inaccuracy of the smart sensor’s weather forecasting function means that, for an ADWP of 1–2 days, the addition of the Cistern RTC to the green-roof set-up did not materially improve stormwater retention (refer to Figure 1).
3.3. An Example of the Storm Sensor Handling Back-to-Back Storm Events
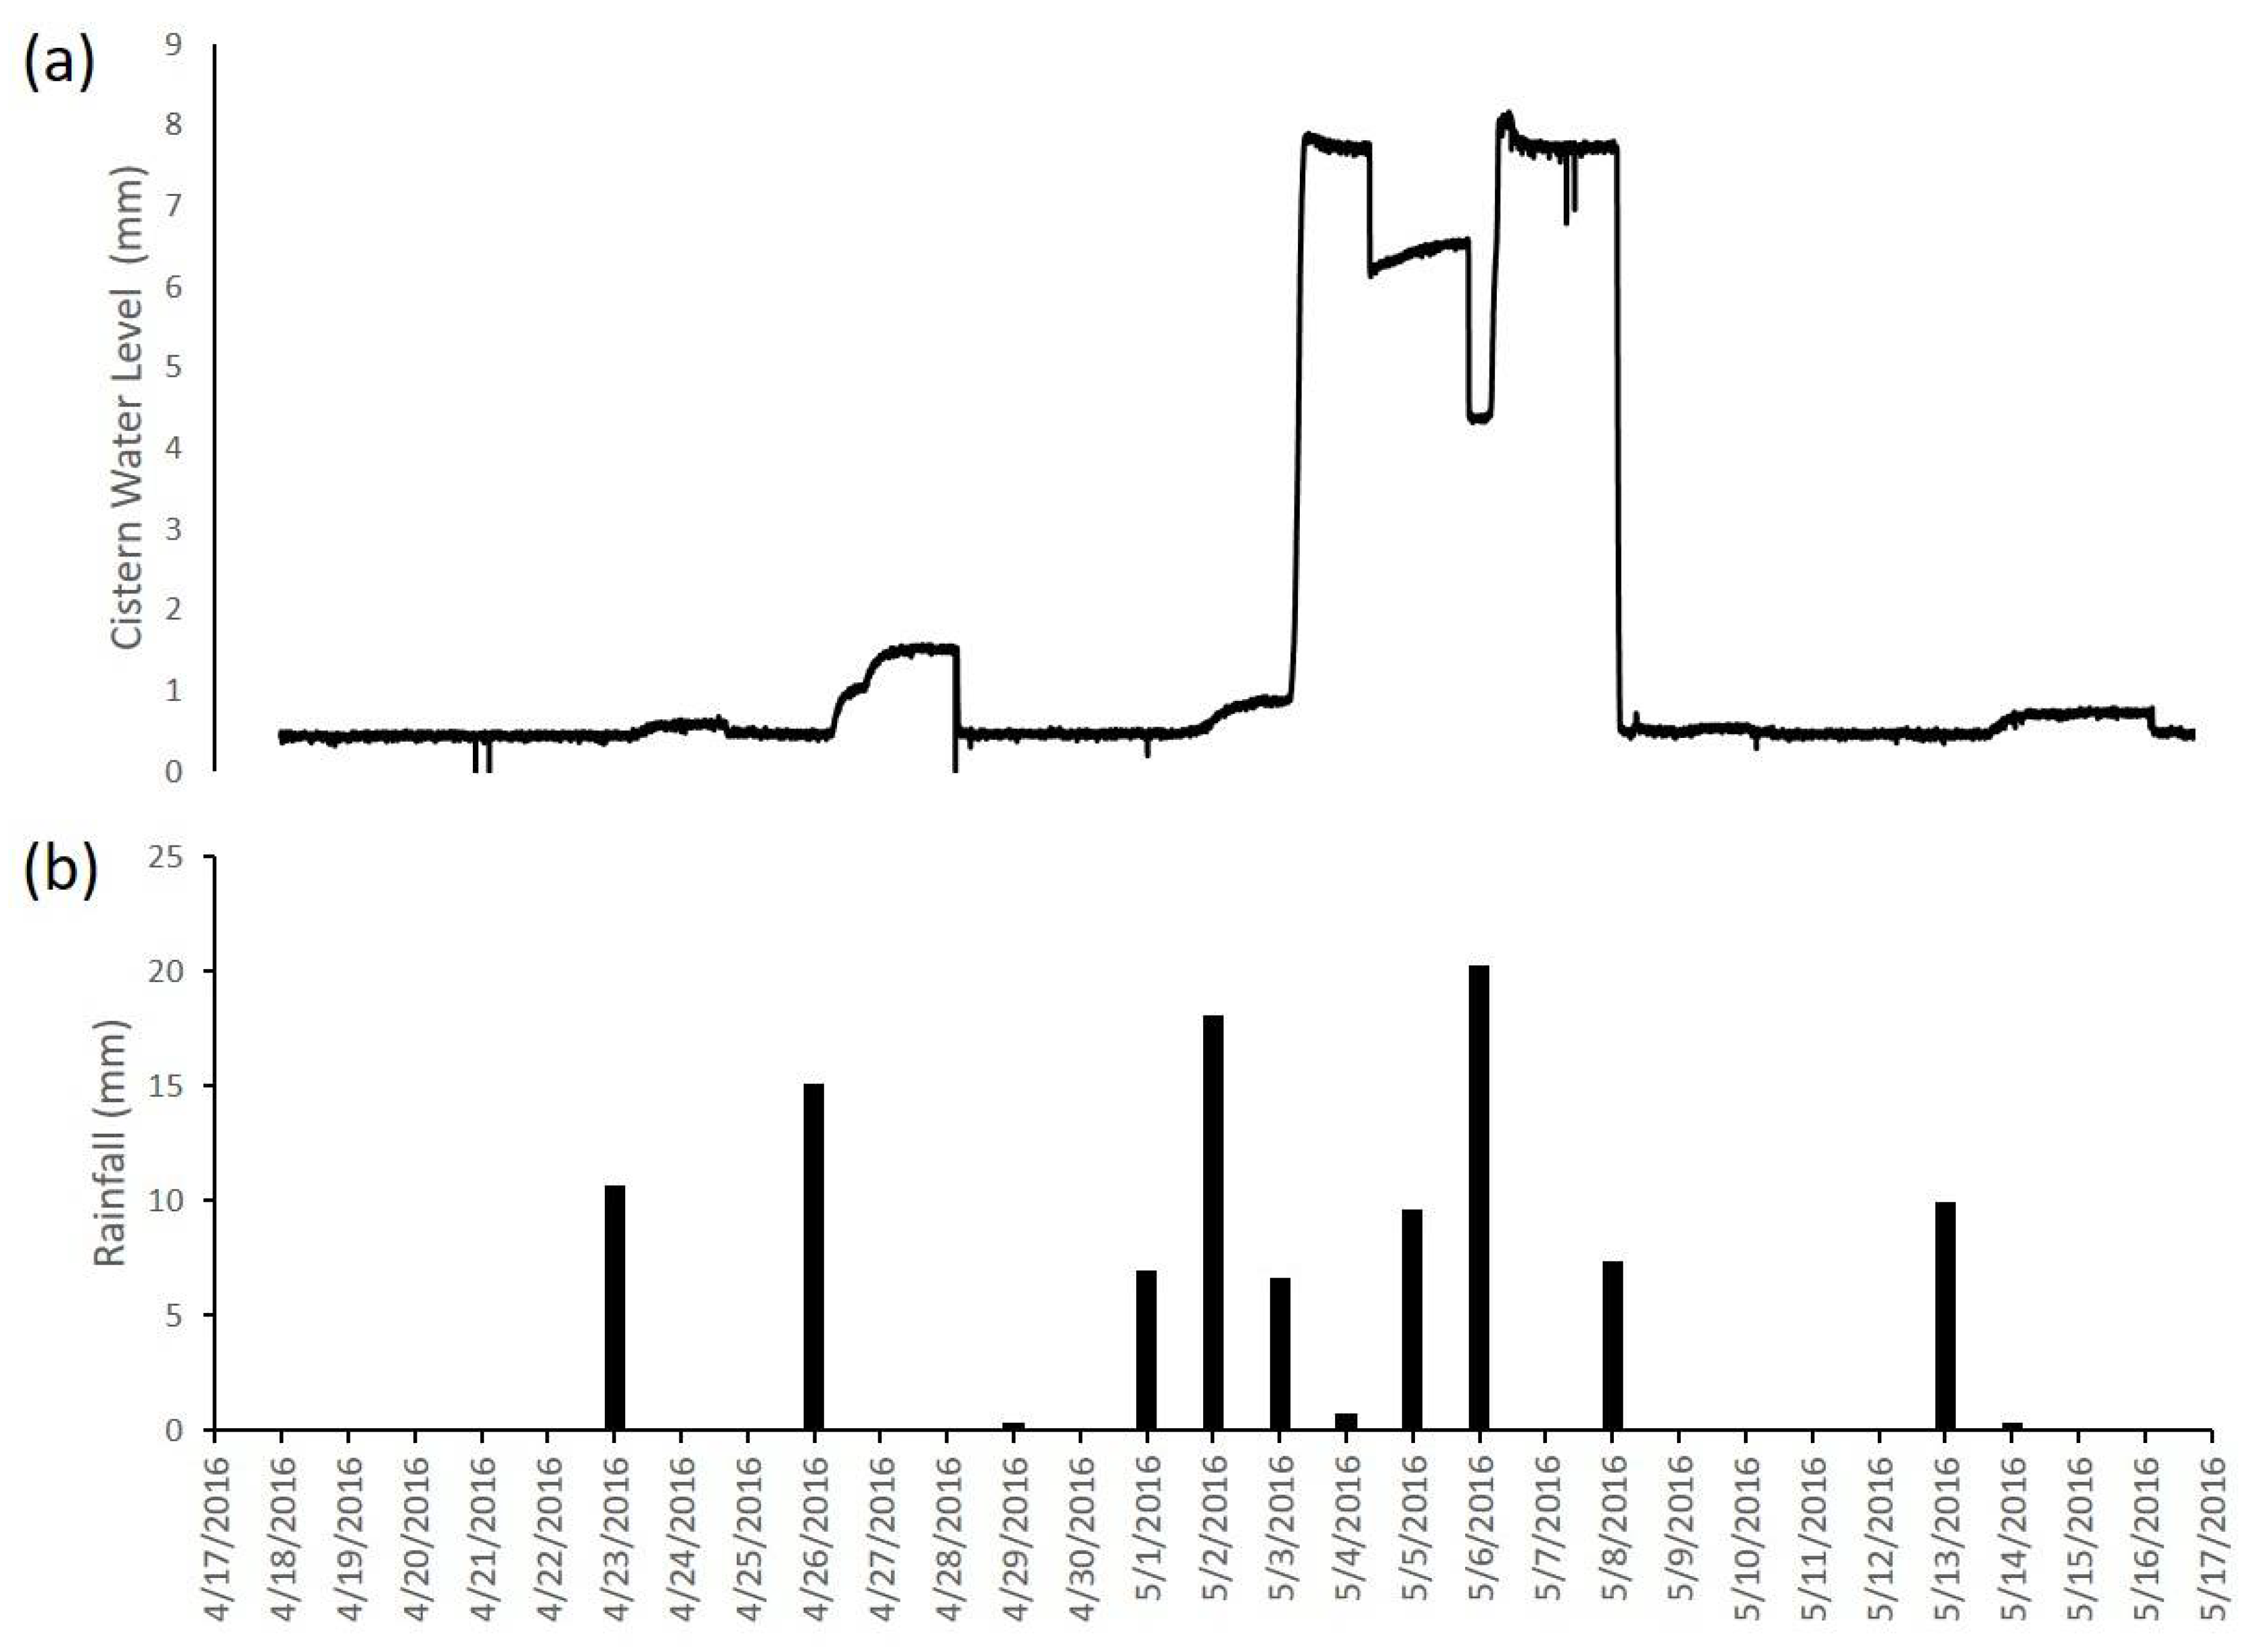
As discussed in Section 2.2, the smart system estimated the water entering into the cistern during an upcoming storm with weather forecast data and only decrease the water level by that volume. An example of the smart system operation is provided in Figure 4, which shows (a) the normalized cistern water level and (b) the daily rainfall amount for a one-month period, from 4/17/16 to 5/17/16. During the first four storms of this period, those on 4/23, 4/26, 4/29, and 5/1, respectively, most of the rainfall was retained by the green roof, causing the normalized water level in the cistern to increase by less than two mm, before draining completely 24 h later. However, a storm that began on 5/2 caused the cistern to overflow on 5/3. The cistern remained full until the storm ended on 5/4. Instead of remaining full for a 24 h period, the cistern controller forecast an incoming storm on 5/5 and drained the cistern’s water level from 8 mm to 6 mm. However, the forecast overestimated the storm depth, because this storm was largely retained on the green roof and only increased the depth of the cistern by 0.5 mm. Again, after this storm, instead of retaining the water, the cistern drained 2.2 mm, from 6.5 to 4.3 mm, due to another storm forecast on 5/6. In contrast to the storm on 5/5, here, the forecast underestimated the rainfall depth, and the cistern overflowed on 5/6. The cistern then retained the water and remained full for 24 h before draining. The system connected to the cistern appears to have either not known of the storm on 5/8 or accurately predicted that it would be completely retained by the green roof. Finally, the storm on 5/13 was nearly all retained on the green roof, only causing a minor increase in the water-level depth before the cistern drained 24 h later.
The overestimates and underestimates of the storms on 5/5 and 5/6, respectively, highlight the typical challenges of uncertainties caused by inaccurate rainfall forecasts [21]. Likewise, Xu et al. also found that the forecast rainfall both underestimated [22] and overestimated [11] the actual rainfall. One source of forecast inaccuracy may be that RTC systems rely on non-localized rainfall forecasts despite actual rainfall being highly variable based on local conditions and topography [13]. This often results in errors in forecasting rainfall intensity [22].
The incorporation of high-resolution rainfall-forecasting methods into RTC systems [23] should be considered as a step to improve their stormwater-detention behavior. Xu et al. also suggested [22] that using a longer window than an upcoming 6 h window, such as 24 h or 48 h, to forecast a future precipitation amount could help to rectify the smart sensor’s accuracy. Whether or not a longer window would greatly improve accuracy over the current 6 h window would depend on the accuracy of the longer forecast window itself.
3.4. Our Study Compared to Other Findings
Over the monitoring period, the green roof retained 65.2% of the total rainfall on the roof, while the roof and cistern together retained and detained 75.6% of the total rainfall. This performance is poorer than those reported in other studies that quantified the effect of real-time control sensors using the technology provided by OptiRTC, Inc., including the 77% annual retention modeled by Roman et al. for a cistern sized to store 38 mm that released rooftop runoff into a rain garden [10], as well as the 83% and 98% retentions monitored by Braga et al. for cisterns sized to store 25 mm and 56 mm that provided rooftop stormwater for a firehouse [24]. Our results are comparable, however, to Hardin et al.’s, who modeled that a cistern sized to store 25 mm improved a green roof’s 43% water retention to 69% when the cistern was used for irrigation of the green roof [15]. Our results exceeded the 17–30% retention simulated by Quinn et al. for cisterns sized for 16 mm storms [13]. Lower retention rates were found by Quinn et al. because the cisterns in that study were used for water supply and households did not use all of the available water, thus reducing the retention capacity for stormwater capture during rain events [13].
Our results are specific to a cistern sized to store 8 mm of rooftop runoff, which is smaller than the systems researched in most other studies, including those listed above. In addition, Xu et al. modeled five rainwater harvesting systems sized to store storm sizes from 13 mm to 100 mm [22], and Burns et al. found that cisterns sized to capture from 80 to 90 mm had far greater stormwater retention than cisterns sized to store from 28 to 70 mm [14]. Our cistern surpassed, however, the 6 mm size selected for a modeling study by Oberascher et al. [7].
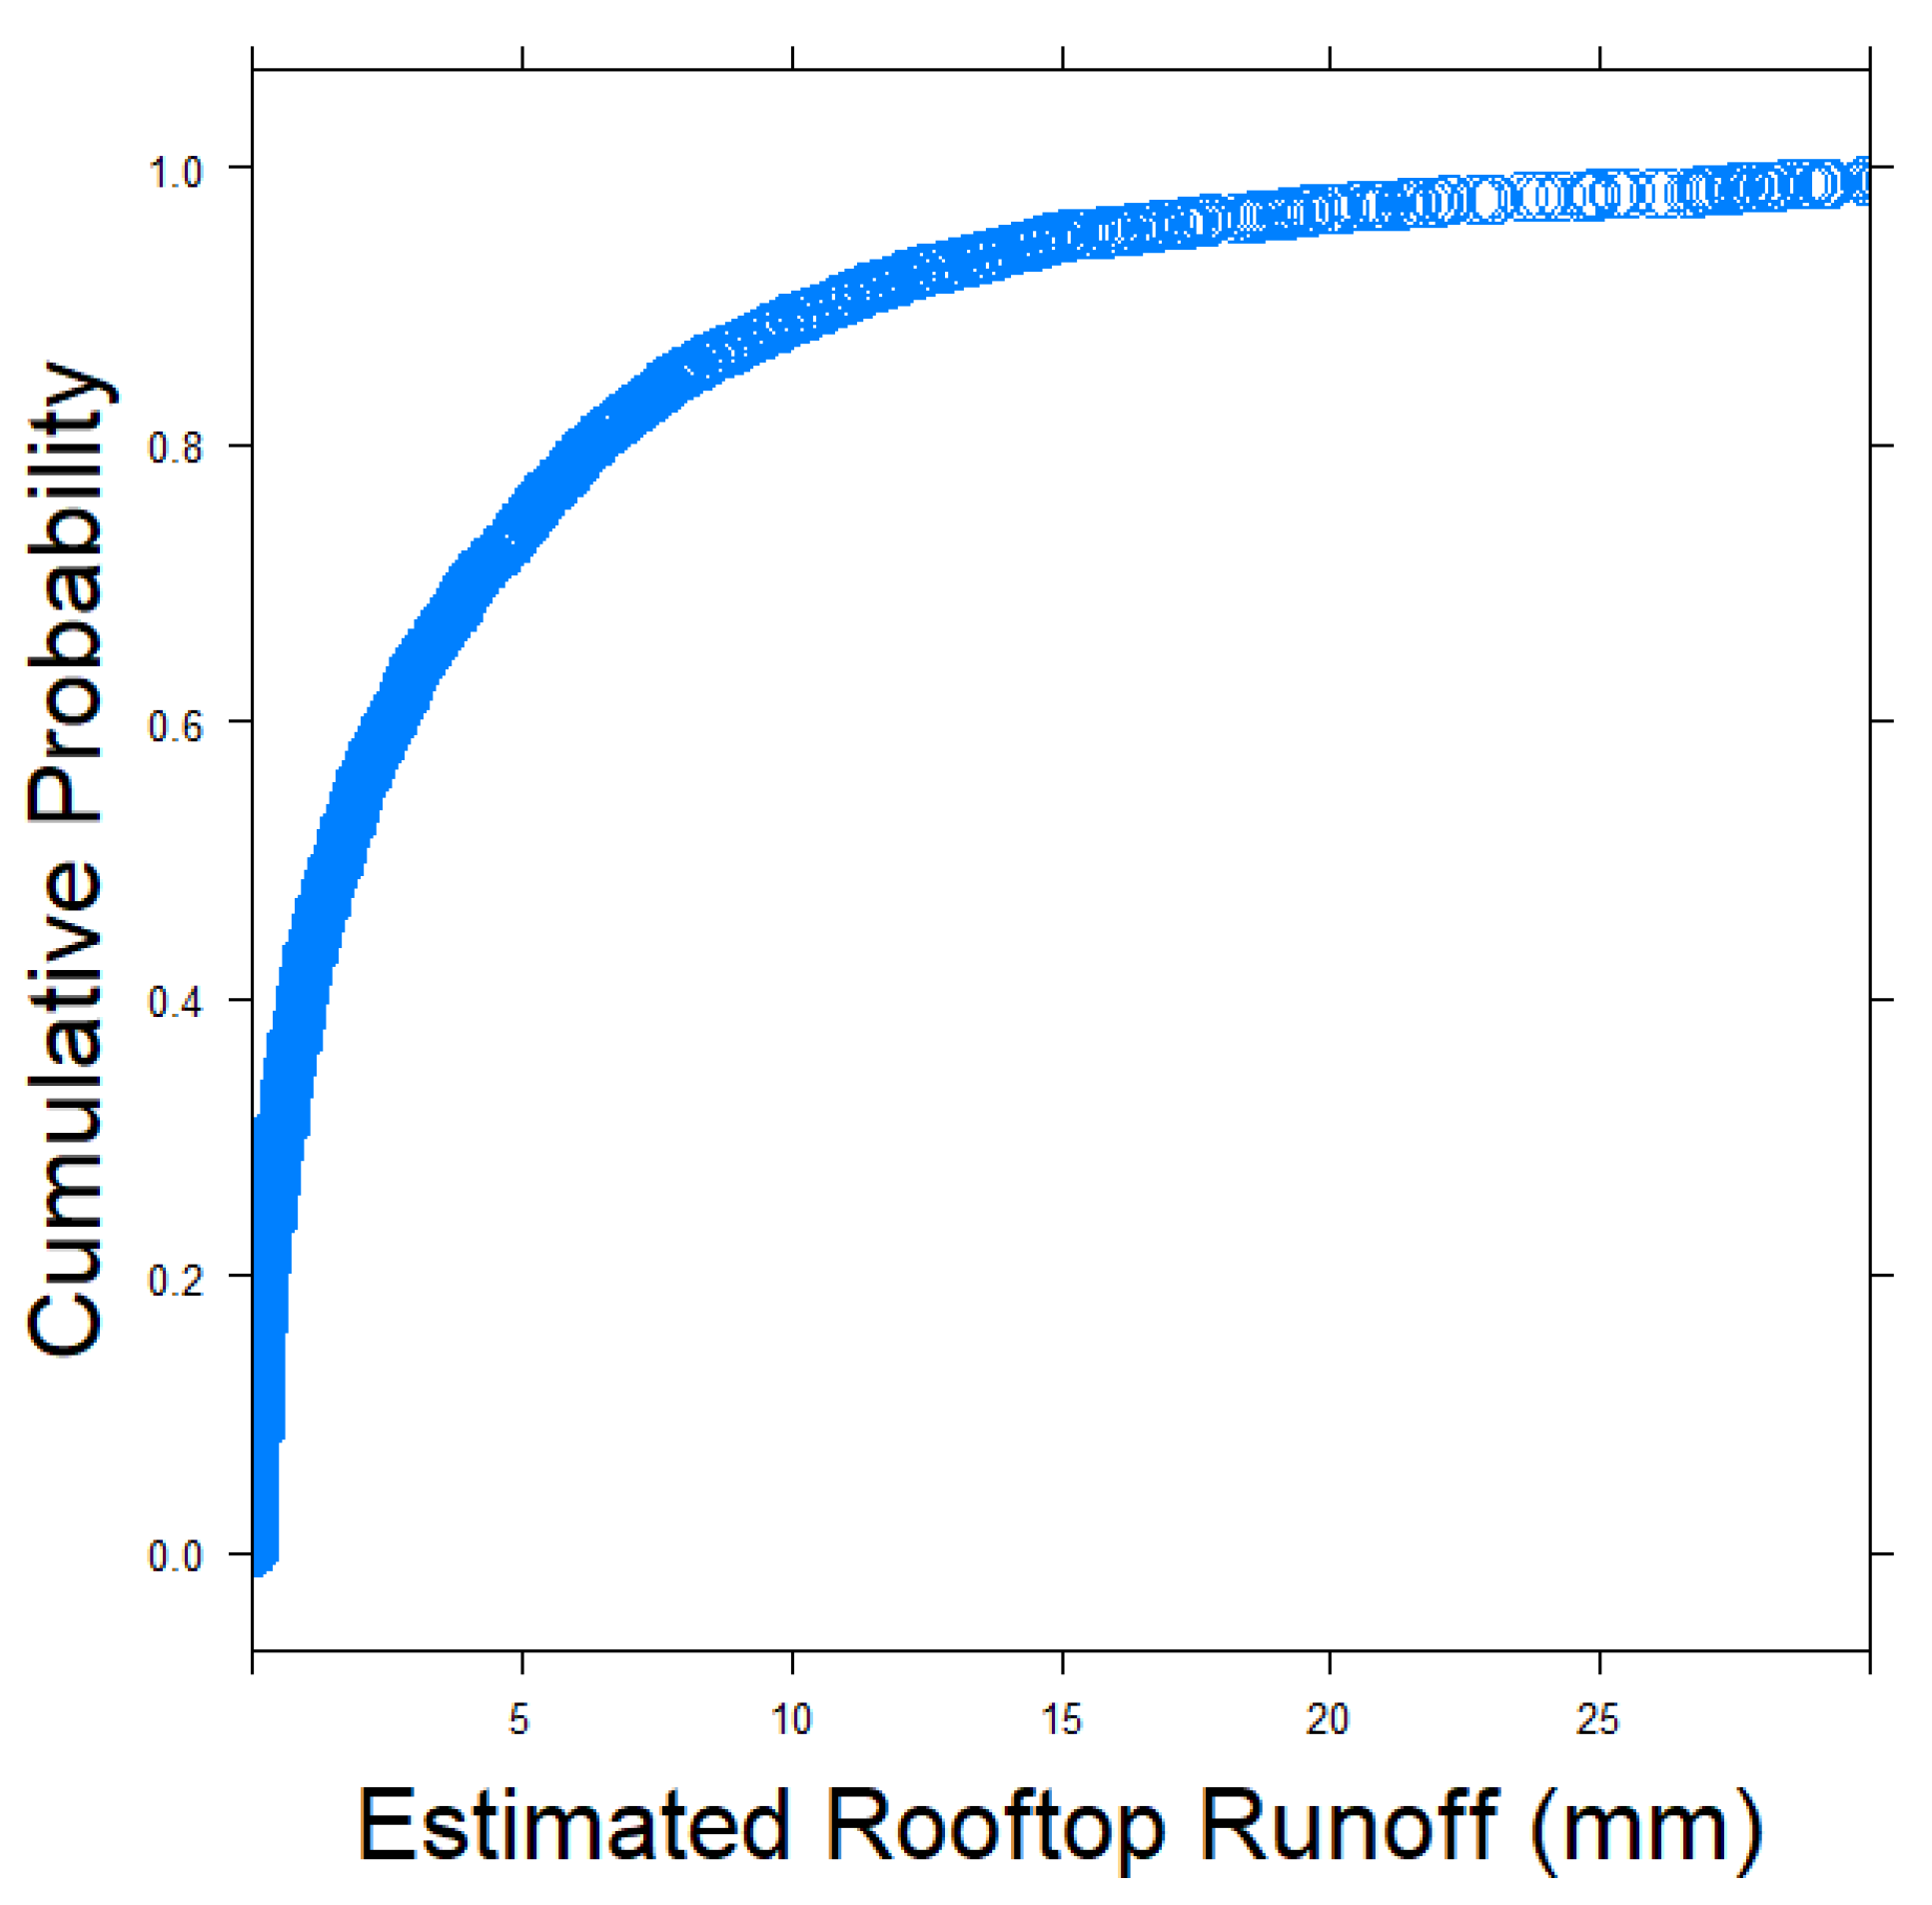
The limited size of the studied cistern, storing just 8 mm of roof runoff, was chosen to accommodate logistical space concerns, because the cistern was located inside a busy auto garage beneath the green roof of New York City’s Department of Parks and Recreation (see photos in Supplementary Materials). The 8 mm size, however, managed most storms, as can be seen in Figure 5. Forty years (from March 1977 to March 2017) of historical rainfall data recorded at LaGuardia International Airport, located approximately 10 km from the studied green roof and cistern, were downloaded from the National Oceanic and Atmospheric Administration’s National Climate Data Center website (www.ncdc.noaa.gov (accessed on 13 June 2022)). Probabilities were calculated by ranking the storm sizes for the 4121 storms in ascending order [25]. Of the 4121 total storms found over the 40 years, 3496 (85%) had estimated roof runoff of less than 8 mm, given a rooftop runoff coefficient of 0.3 (Section 2.2).
In contrast, the cumulative probability that estimated rooftop runoff was less than 25 mm was 98% (Figure 5). While a cistern with the capacity to store 25 mm would, therefore, allow the detention of nearly all storms to be achieved, such a large cistern is not feasible at the studied site. The 8 mm effective capacity of the studied cistern lies on the “knee of the curve,” thus optimizing the amount detained, while accommodating the existing uses of the study location. Given that cisterns are typically the costliest components of RWH systems, approximately 30% of the total cost [6], our study on a modestly sized cistern may provide useful performance data for systems where costs are an important consideration or when space is a constraint, as may be the case in dense urban areas.
The studied cistern with real-time control improved the 65.2% retention of the green roof alone to 75.6% total on-site retention + detention over the monitoring period. This 10.4% increase amounts to an average of 2.15 mm detained per storm, equivalent to 1.37 m3 storage volume per storm provided for the entire green roof. Given that investment costs for CSOs are on average from 600 to 3600 EUR/ m3 [7], the real-time control technology provides New York City with EUR 822–4932 in CSO abatement, which is similar to the annual subscription for the Opti technology. However, real-time technology is more cost efficient in larger applications due to the smaller contribution of fixed costs associated with control and communication components [11], so increased cost effectiveness can be expected if stormwater systems with real-time control grow in popularity and more are installed in the future. Cost effectiveness could also improve if weather forecasting became more accurate. Thus, the system pays for itself, given the cost of the annual subscription for the OptiRTC, Inc., technology and typical abatement costs for combined sewer overflows. Additionally, there is much potential for greater cost effectiveness in the future, as more systems are constructed and rainfall forecasting improves. Finally, the improved optimization of the RTC program itself could also increase cost-effectiveness by increasing the cistern’s stormwater detention performance. For example, the programming could be specific to the characteristics of the local CSS, which might enable tank emptying in time periods shorter than 24 h or even during storms themselves if the intensity of rainfall is low enough not to overwhelm the CSS.
4. Conclusions
Given that 20% of the storms studied during this 58-month period in NYC were ”back-to-back,” meaning occurring within a one–two day ADWP, the usefulness of this smart cistern system can only increase going forward. The major challenge to address is the inaccuracy of the technology’s current methods for predicting future rainfall. Its reliance on the non-localized weather forecasts, for example, that it uses for determining how much water to empty from the cistern led to underperformance. This study’s results suggest that changes in the weather forecasting methodology could improve performance. RTC systems may consider the use of high-resolution rainfall forecasting methods in order to improve stormwater detention behavior.
Supplementary Materials
The following supporting information can be downloaded at: https://www.mdpi.com/article/10.3390/w14142216/s1.
Author Contributions
Conceptualization, N.S.; methodology, N.S. M.W., and R.E.; investigation, N.S. M.W., and R.E.; writing—original draft preparation, N.S.; writing—review and editing, P.C.; funding acquisition, P.C. All authors have read and agreed to the published version of the manuscript.
Funding
This work was funded, in part, by National Science Foundation grant CMMI-1325676, Environmental Protection Agency contract EP-15-C-000016, and South Carolina Sea Grant 2004324.
Institutional Review Board Statement
Not Applicable.
Informed Consent Statement
Not Applicable.
Data Availability Statement
The data presented in this study are available in the Supplementary Materials.
Acknowledgments
The authors wish to thank New York City’s Department of Parks and Recreation for constructing and monitoring the green roof and cistern through a grant from National Fish and Wildlife Foundation and New York State Office of the Attorney General. Any opinions, findings, and conclusions expressed in this paper are those of the authors and not meant to represent the views of any supporting institution.
Conflicts of Interest
The authors declare no conflict of interest. The funders had no role in the design of the study; in the collection, analyses, or interpretation of data; in the writing of the manuscript; or in the decision to publish the results.
References
- US EPA Combined Sewer Overflows (CSOs). Available online: https:/www.epa.gov/npdes/combined-sewer-overflows-csos (accessed on 8 March 2021).
- Montalto, F.; Behr, C.; Alfredo, K.; Wolf, M.; Arye, M.; Walsh, M. Rapid assessment of the cost-effectiveness of low impact development for CSO control. Landsc. Urban Plan. 2007, 82, 117–131. [Google Scholar] [CrossRef]
- Li, Y.; Babcock, R.W. Green roof hydrologic performance and modeling: A review. Water Sci. Technol. 2014, 69, 727–738. [Google Scholar] [CrossRef]
- Campisano, A.; Modica, C. Rainwater harvesting as source control option to reduce roof runoff peaks to downstream drainage systems. J. Hydroinform. 2016, 18, 23–32. [Google Scholar] [CrossRef] [Green Version]
- Velasco-Munoz, J.F.; Aznar-Sanchez, J.A.; Batiles-delaFuente, A.; Fidelibus, M.D. Rainwater harvesting for agricultural irrigation: An analysis of global research. Water 2019, 11, 1320. [Google Scholar] [CrossRef] [Green Version]
- Semaan, M.; Day, S.D.; Garvin, M.; Ramakrishnan, N.; Pearce, A. Optimal sizing of rainwater harvesting systems for domestic water usages: A systematic literature review. Resour. Conserv. Recycl. 2020, 6, 100033. [Google Scholar] [CrossRef]
- Oberascher, M.; Kinzel, C.; Kastlunger, U.; Kleidorfer, M.; Zingerle, C.; Rauch, W.; Sitzenfrei, R. Integrated urban water management with micro storages developed as an IoT-based solution—The smart rain barrel. Environ. Model. Softw. 2021, 139, 105028. [Google Scholar] [CrossRef]
- Shannak, S.A.; Jaber, F.H.; Lesikar, B.J. Modeling the effect of cistern size, soil type, and irrigation scheduling on rainwater harvesting as a stormwater control measure. Water Resour. Manag. 2014, 28, 4219–4235. [Google Scholar] [CrossRef]
- Debusk, K.M.; Hunt, W.; Quigley, M.; Jeray, J.; Bedig, A. Rainwater harvesting: Integrating water conservation and stormwater management. World Environ. Water Resour. Congr. 2012, 3703–3710. [Google Scholar] [CrossRef]
- Roman, D.; Braga, A.; Shetty, N.; Culligan, P. Design and modeling of an adaptively controlled rainwater harvesting system. Water 2017, 9, 974. [Google Scholar] [CrossRef] [Green Version]
- Xu, W.D.; Fletcher, T.D.; Duncan, H.P.; Bergmann, D.J.; Breman, J.; Burns, J.M. Improving the multi-objective performance of rainwater harvestign systems using real-time control technology. Water 2018, 10, 147. [Google Scholar] [CrossRef] [Green Version]
- Muschalla, D.; Vallet, V.; Anctil, F.; Lessard, P.; Pelletier, G.; Vanrolleghem, P.A. Ecohydraulic-driven real-time control of stormwater basins. J. Hydrol. 2014, 511, 82–91. [Google Scholar] [CrossRef] [Green Version]
- Quinn, R.; Melville-Shreeve, P.; Butler, D.; Stovin, V. A critical evaluation of the water supply and stormwater management performance of retrofittable domestic rainwater harvesting systems. Water 2020, 12, 1184. [Google Scholar] [CrossRef] [Green Version]
- Burns, M.J.; Fletcher, T.D.; Duncan, H.P.; Hatt, B.E.; Ladson, A.R.; Walsh, C.J. The performance of rainwater tanks for stormwater retention and water supply at the household scale: An empirical study. Hydrol. Process. 2015, 160, 152–160. [Google Scholar] [CrossRef]
- Hardin, M.; Wanielista, M.; Chopra, M. A mass balance model for designing green roof systems that: Incorporate a cistern for re-use. Water 2012, 4, 914–931. [Google Scholar] [CrossRef]
- Kerkez, B.; Gruden, C.; Lewis, M.; Montestruque, L.; Quigley, M.; Wong, B.; Bedig, A.; Kertesz, R.; Braun, T.; Cadwalader, O.; et al. Smarter stormwater systems. Environ. Sci. Technol. 2016, 50, 7267–7273. [Google Scholar] [CrossRef] [PubMed]
- Shetty, N.H.; Elliott, R.M.; Wang, M.; Palmer, M.I.; Culligan, P.J. Comparing the hydrological performance of an irrigated native vegetation green roof with a conventional Sedum spp. green roof in New York City. PLoS ONE 2022, 17, 1–20. [Google Scholar] [CrossRef]
- Shetty, N.H. New York City’s Green Infrastructure: Impacts on Nutrient Cycling and Improvements in Performance. Ph.D. Thesis, Columbia University, New York, NY, USA, 2018. [Google Scholar]
- Helsel, D.R.; Hirsch, R.M. Statistical Methods in Water Resources; Elsevier: New York, NY, USA, 2002; Volume 4. [Google Scholar]
- Carson, T.B.; Marasco, D.E.; Culligan, P.J.; McGillis, W.R. Hydrological performance of extensive green roofs in New York City: Observations and multi-year modeling of three full-scale systems. Environ. Res. Lett. 2013, 8, 024036. [Google Scholar] [CrossRef]
- Shen, P.; Deletic, A.; Bratieres, K.; McCarthy, D.T. Real time control of biofilters delivers stormwater suitable for harvesting and reuse. Water Res. 2020, 169, 115257. [Google Scholar] [CrossRef]
- Xu, W.D.; Fletcher, T.D.; Burns, M.J.; Cherqui, F. Real time control of rainwater harvesting systems: The benefits of increasing rainfall forecast window. Water Resour. Res. 2020, 56, e2020WR027856. [Google Scholar] [CrossRef]
- Gainguly, A.R. A hybrid approach to improving rainfall forecasts. Comput. Sci. Eng. 2002, 4, 14–21. [Google Scholar] [CrossRef]
- Braga, A.; O’Grady, H.; Dabak, T.; Lane, C. Performance of two advanced rainwater harvesting systems in Washington DC. Water 2018, 10, 13. [Google Scholar] [CrossRef] [Green Version]
- Behera, P.K.; Adams, B.J.; Li, J.Y. Runoff quality analysis of urban catchments with analytical probabilistic models. J. Water Resour. Plan. Manag. 2005, 132, 4–14. [Google Scholar] [CrossRef]
Figure 1.
Total on-site retention + detention for different storm sizes (a–d) and antecedent dry-weather periods (ADWPs). Green Roof denotes retention calculated with the green-roof runoff alone (Equation (1)). Cistern RTC denotes total onsite green roof retention + cistern detention (Equation (2)). The * at the top denotes groups where the difference between Cistern RTC and Green Roof was statistically significant (p < 0.05).

Figure 2.
Normalized cistern water level for different storm sizes (a–d) and antecedent dry-weather periods (ADWPs) (days). Normalized cistern water level denotes the water volume normalized per green-roof area. The letters at the top denote statistical significance—two groups that share a letter were not statistically different from one another (p > 0.05). Here, A denotes statistically equivalent results, while B denotes statistically different results.

Figure 3.
Normalized cistern water level drained before rainfall. Storms (n = 19) include all events with an antecedent dry-weather period of one–two days when the cistern was already full. Dotted line traces perfect forecasting. Storms A–E represent the smart sensor underanticipating the coming storm; storms L–S denote the smart sensor overestimating the storm; and storms F–K represent accurate predictions.

Figure 4.
Time series of normalized cistern water level (a) and daily rainfall amount (b) for a one-month period, from 17 April 2016 to 17 May 2016.
Figure 4.
Time series of normalized cistern water level (a) and daily rainfall amount (b) for a one-month period, from 17 April 2016 to 17 May 2016.

Figure 5.
Cumulative probability that rooftop runoff was less than the estimated depth (mm).


Table 1.
Number of studied storm events by rainfall size grouping (rows) and antecedent dry-weather period (columns).
Table 1.
Number of studied storm events by rainfall size grouping (rows) and antecedent dry-weather period (columns).
| Antecedent Dry-Weather Period (Days) | |||||
|---|---|---|---|---|---|
| 1 to 2 | 2 to 4 | 4 to 6 | >6 | Total | |
| <2 mm | 17 | 19 | 10 | 5 | 51 |
| From 2 to 10 mm | 9 | 23 | 19 | 19 | 70 |
| From 10 to 25 mm | 7 | 16 | 9 | 9 | 41 |
| >25 mm | 10 | 13 | 6 | 12 | 41 |
| Total | 43 | 71 | 44 | 45 | 203 |
Publisher’s Note: MDPI stays neutral with regard to jurisdictional claims in published maps and institutional affiliations. |
© 2022 by the authors. Licensee MDPI, Basel, Switzerland. This article is an open access article distributed under the terms and conditions of the Creative Commons Attribution (CC BY) license (https://creativecommons.org/licenses/by/4.0/).
Share and Cite
MDPI and ACS Style
Shetty, N.; Wang, M.; Elliott, R.; Culligan, P. Examining How a Smart Rainwater Harvesting System Connected to a Green Roof Can Improve Urban Stormwater Management. Water 2022, 14, 2216. https://doi.org/10.3390/w14142216
AMA Style
Shetty N, Wang M, Elliott R, Culligan P. Examining How a Smart Rainwater Harvesting System Connected to a Green Roof Can Improve Urban Stormwater Management. Water. 2022; 14(14):2216. https://doi.org/10.3390/w14142216
Chicago/Turabian StyleShetty, Nandan, Mark Wang, Robert Elliott, and Patricia Culligan. 2022. "Examining How a Smart Rainwater Harvesting System Connected to a Green Roof Can Improve Urban Stormwater Management" Water 14, no. 14: 2216. https://doi.org/10.3390/w14142216
Note that from the first issue of 2016, this journal uses article numbers instead of page numbers. See further details here.