Article

Comprehensive Assessment of Soil Conservation Measures by Rough Set Theory: A Case Study in the Yanhe River Basin of the Loess Plateau

1
College of Resources & Environment and History & Culture, Xianyang Normal University, Xianyang 712000, China
2
China Institute of Water Resources and Hydropower Research, International Research and Training Center on Erosion and Sedimentation, Beijing 100048, China
3
Yellow River Institute of Hydraulic Research, Yellow River Conservation Commission, Zhengzhou 450003, China
*
Author to whom correspondence should be addressed.
Water 2022, 14(14), 2213; https://doi.org/10.3390/w14142213
Submission received: 8 June 2022 / Revised: 7 July 2022 / Accepted: 11 July 2022 / Published: 13 July 2022

Abstract

:
At present, much attention has been paid to the ecology, economics, and social benefits of erosion control projects: however, the evaluation of an erosion control technology itself has been neglected. This study selected six soil conservation measures applied to the Loess Plateau, and a comprehensive evaluation model was developed considering the maturity of the technology, application difficulty of the technology, technology efficiency, and the potential of technology promotion. The relation between a condition attribute and a decision attribute is evaluated using rough set theory, and the decision attribute is completely dependent on the condition attribute, which indicates that the index system can better evaluate the soil conservation measures applied to the Loess Plateau. Rough set theory was used to determine the weights of evaluation indexes, which overcomes the limitation of relying only on expert opinions or index data to determine the weights. According to the comprehensive scores, the six soil conservation measures can be grouped into three levels: the first level includes economic forests, check dams, and terraces; the second level includes afforestation and conversion to grassland, and the third level includes enclosures. The results can provide a scientific basis for the promotion and application of the high-ranking soil conservation measures in the Loess Plateau. However, the comprehensive evaluation of the soil conservation measures applied to the Loess Plateau is a very complex problem. To maximize the eco-environmental benefits, land use patterns should be rationally adjusted, and corresponding soil conservation measures could be suitable for meeting the regional development goals.

1. Introduction

The Loess Plateau is among one of the areas that extensively suffers from soil erosion and land degradation [1,2]. Soil erosion is particularly severe in the hilly and gully regions [3,4]. As a result, the Loess Plateau annually loses about 16 million tons of soil. The Chinese government has applied, successively, a series of erosion control projects in this area since the 1980s, such as key projects on soil and water conservation, the small watershed comprehensive management project, a conversion of agricultural areas to forest and grass project, construction of silt dams, and a comprehensive regulation of farming on high-slope lands, which have played an important role in soil erosion control and ecological reconstruction. Terraces [5], check dams [6], afforestation [7], and grassland restoration [8] are widely used for vegetation restoration and construction in many parts of the world. Thus, there is a growing interest in evaluating the effects of soil and water conservation technologies on soil quality [9], water availability [10,11], crop yield [12], surface runoff [13,14], and sediment yield [15,16]. However, quantitative assessments of the effects of soil and water conservation technologies are not sufficiently comprehensive [17,18,19]. To fully assess the implementation effects of different soil and water conservation technologies, some typical indexes were selected to build a model for testing and screening the technologies with development potential [20,21]. Then, a comprehensive assessment of the effectiveness of soil conservation measures also needs to consider the temporal and spatial variations of the effectiveness of an erosion control technology [22,23].
Due to the drawbacks of traditional evaluation methods, the qualitative evaluation method represented by the item-by-item evaluation method, weighted evaluation method, and expert scoring method, often are used in assessment research [24,25,26]. Experts will use their own experience to select indicators and determine the index weight, which although simple and easy to use, results in greater subjectivity [27]. Rough set theory is a data analysis tool that does not need to provide any prior information beyond the set of problems being studied, which composes a multi-index comprehensive evaluation method that is data-driven [28]. Rough set theory can eliminate redundant indicators and calculate the weight of each index according to the law of the data itself, which can effectively overcome the need for weight determination in the existing evaluation model, so that the results of the evaluation are more objective [28].
The comprehensive evaluation of soil conservation measures applied to the Loess Plateau is not only helpful to understand the state of erosion control technology in specific regions, but also has important guiding significance for technology development [29,30,31]. For the purposes of this paper, a large number of field investigations on soil and water conservation technologies were applied to the Loess Plateau. There was more detailed data obtained about soil erosion control in the Yanhe River basin, and the process applied rough set theory to establish a model for comprehensive analysis to focus on providing the basis for technology optimization and promotion. The specific objectives of this paper are to (1) screen the indexes that affect the effectiveness of soil conservation measures applied to the Loess Plateau, China, (2) set up an evaluation model on the effectiveness of different soil conservation measures, and (3) test the effectiveness of an erosion control technology evaluation model through some important indexes that were reported in previous experimental studies (i.e., magnitude of runoff and soil loss, soil quality, soil water content, soil organic matter, crop yield, and the consecutive years of erosion control technology application).

2. Materials and Methods
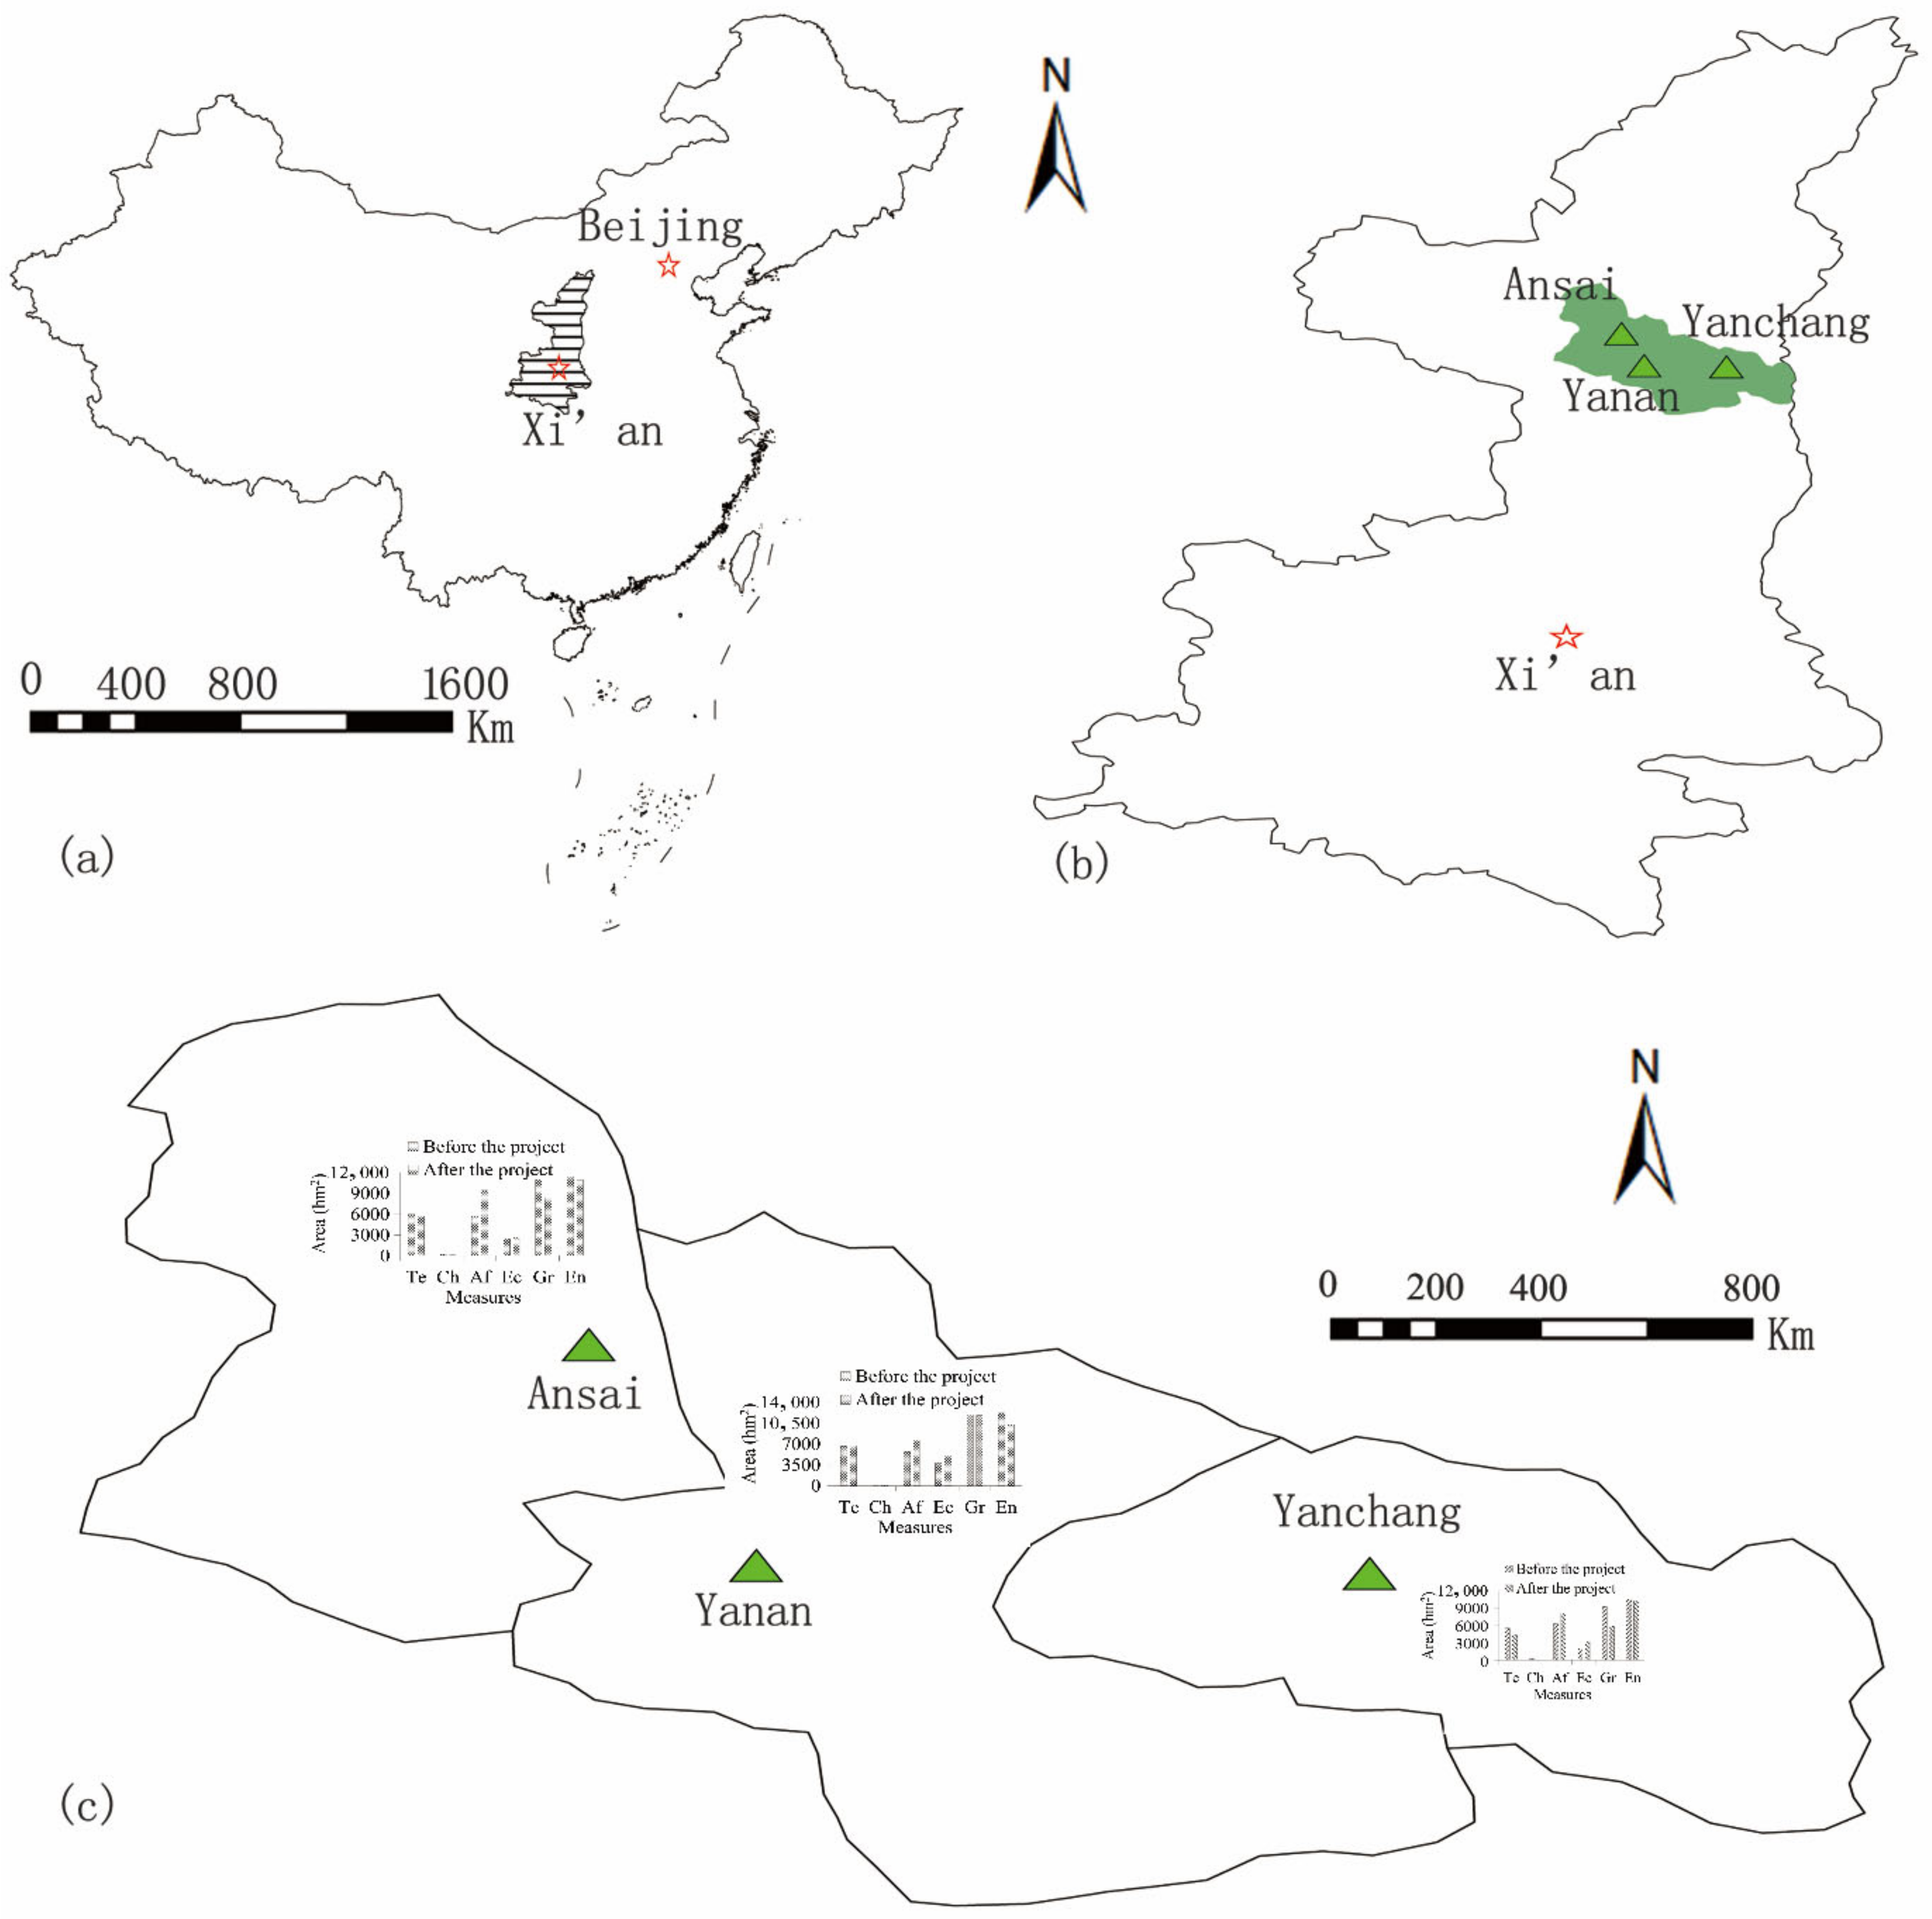
2.1. Study Areas

The study area belongs to one part of a World Bank Loan Project. The second phase of a World Bank Loan Project was located in the upstream, northern, and southeastern parts of the Yanhe River Basin, occupying 30.94% of the total watershed. The Yanhe River is the first tributary of the Yellow River, with a total area of 7725 km2. The study area covers 19 townships and 296 administrative villages in Ansai, Yanan, and Yanchang counties, with a total population of 121,000, including an agricultural population of 111,000. Comparing the situation before and after the project, the areas of afforestation and economic forest in these regions have increased, while the areas of terrace, check dam, grassland restoration, and enclosure have decreased, which shows that the national policy of returning farmland to forest has achieved remarkable results (Figure 1). The average annual precipitation in the project area is 520 mm. Rainfall has a trend of increasing from upstream to downstream. The annual precipitation varies greatly, and the annual distribution is extremely uneven. The precipitation in the wet season (June to September) accounts for more than 60% of the total annual precipitation resulting from many rainstorms. With complicated terrain and low vegetation cover, the gully density of the Yanhe River basin reached 3 to 5 km/km2. The soil is mainly Loess soil. As a result of deforestation and overgrazing, not many natural forests remain. The annual soil erosion modulus is 10,400 t/km2, which indicates extremely severe erosion. Terraces, check dams, afforestation, economic forests, grassland restoration, and enclosures are commonly used in this region (Table 1).

2.2. Rough Set Theory

Rough set theory (RST), a new achievement of intelligent information processing technology, was first proposed by Professor Z. Pawlak [32]. RST is a new method of analyzing, reasoning, learning, and discovering incomplete data. The RST method does not need additional information or prior knowledge, and deletes irrelevant or unimportant attributes on the premise that the information is not lost and the classification ability of the knowledge base remains unchanged. RST effectively reduces the decision system, and the obtained knowledge is described in the form of rules without affecting its original functions. Fuzzy sets can better deal with discrete attributes in information systems than other methods. When the data have continuous attributes, the fuzzy method is used to discretize the data and construct the decision system. Then, the knowledge of decision rules is obtained (Table 2). Knowledge reduction is one of the core aspects of rough set theory. The so-called knowledge reduction involves deleting irrelevant or unimportant knowledge while maintaining the classification ability of the knowledge base.

3. Establishment of Evaluation Index System

The effectiveness of a comprehensive evaluation model largely depends on the selection of the evaluation indicators. Which standard is used to select predictive variables is the primary problem that needs to be solved to establish the model. To fully reflect the overall status of each technology, as many indicators as possible are often selected in the building of the evaluation system, but there may be redundant information, which will not only increase the complexity of the problem, but also affect the accuracy of the evaluation. In this paper, rough set theory is used to screen the evaluation indicators in the function of attribute reduction. Indicator screening is the process of attribute reduction [32]. Due to the advantages of rough set theory, the adverse effects caused by the foregoing problem can be effectively solved. Based on the status quo and development trend of erosion control technology, this paper considers technology maturity, the difficulty of technology application, technology efficiency, and the potential of technology promotion as the evaluation objects, and it uses rough set theory to establish a technology evaluation index system (Table 3). The description of each of the three-level normative indicators is as follows.
Technology structure. This refers to the integrity of the technical elements. The technology is graded by 0–4 grades, with or without the main technology, and the 0–4 points correspond to the integrity of supporting technology. The specific scoring is: 0: No supporting technologies; 1: The supporting technologies are not complete; 2: The supporting technologies have some functionality; 3: The supporting technologies are relatively complete; 4: The supporting technologies are complete.
Preservation rate. This is the preservation rate used to evaluate the stability of various technologies. After the deployment of an erosion control technology, due to the influence of natural factors (rainfall, tillage, etc.), soil conservation measures have different degrees of damage. By the end of the project, the preservation rate of each erosion control technology is obtained according to the following formula.
P r   =   A 0 A   ×   100 %
where Pr is the preservation rate of an erosion control technology; A0 is the existing area in which an erosion control technology is applied (hm2); and A is the original application area of an erosion control technology (hm2).
Professional demand. This refers to the skill level of the personnel required for each erosion control technology. The lower the technology level, the lower the technology application difficulty. According to whether professional and technical personnel are required or not, the specific 0–4 score is: 0: No professional technicians; 1: Few professional technicians are required; 2: A moderate number of professional technicians are required; 3: More professional technicians are needed; 4: A large number of professional technicians is needed.
Setup cost. This refers to the construction investment cost needed for various erosion control measures, and only the investment directly used for the measures is considered in the analysis of individual measures, which includes material cost, labor cost, and maintenance cost in project implementation (unit: CNY 10,000).
Soil moisture content. This is also affected by soil quality, evapotranspiration, vegetation, land use patterns, slope direction, and slope gradient, in addition to rainfall. Also, soil water content is different under various land use patterns. Soil water affects crop yield and vegetation restoration, so soil water content is one of the important indicators to evaluate the effects of different soil conservation measures. Soil moisture content was measured by the drying method.
Organic matter content. As the basis of forming water-stable aggregates and the main source of various nutrients, especially nitrogen and phosphorus, soil organic matter is an effective index for evaluating soil fertility. Studying the soil organic matter content under different soil conservation measures plays a key role in evaluating the effect of these technologies. Organic matter was measured by the potassium dichromate method.
Vegetation coverage. Vegetation has the functions of intercepting rainfall, slowing down runoff, soil conservation, and soil consolidation, and plays a decisive role in soil and water loss in arid and semi-arid areas. The level of vegetation cover has a significant impact on soil erosion, and the analysis of changes in vegetation cover is the basis for accurately predicting the effects of different soil conservation measures. Different soil conservation measures applied to the Loess Plateau also can lead to variations in vegetation coverage by affecting soil moisture and fertility. Studying the response of vegetation coverage to different soil conservation measures can reveal whether the erosion control technology is conducive to restoration of vegetation in the region, which is of great significance to formulating reasonable erosion control technology and management countermeasures. The Yanhe River Basin in the middle of the Loess Plateau is selected to analyze the vegetation coverage under different soil conservation measures. Forest canopy density was monitored by the crown projection method. The grassland coverage was monitored by acupuncture [33]. The foregoing indicators are monitored twice a year for five years, and their average values are taken as the comparison values.
Output per unit land. This refers to the total benefit at the end of the project, in units of CNY 10,000 per hectare. This indicator is suitable for evaluating the economic effects of different soil conservation measures. The larger the value, the better the economic effect. The unit output of each technology is determined based on monitoring data of typical peasant households and plots in the project area, combined with the results of many years of statistics and surveys by economic and statistical departments.
Runoff and sediment yield. By analyzing the changes of hydrological factors before and after the implementation of an erosion control technology, the effects of different soil conservation measures on runoff and sediment yield can be studied. The runoff is directly measured according to the scale line marked in the collecting pool, and the sediment yield is determined by the sampling method.
Relevance correlation. The degree of demand for each erosion control technology in future economic and social development of this region is determined by the relevance correlation. The higher the demand, the better the soil conservation measures. According to the correlation between technology and future development, a 0–4 score is assigned. The specific scoring is: 0: This technology is not related to future development; 1: This technology is less related to future development; 2: This technology has a certain relevance to future development; 3: This technology is more related to future development; and 4: This technology is completely suitable for future development.
Public acceptance. The better the effect of an erosion control technology on environmental protection, the higher the public acceptance. According to public acceptance, a technology is graded according to the 0–4 scores. The specific scoring is: 0: The public is reluctant to accept this technology; 1: The public has a lower recognition of this technology; 2: The public has a certain degree of recognition for this technology; 3: The public has a greater recognition of this technology; and 4: The public is very willing to accept the technology.

4. Soil Conservation Measures Evaluation in the Loess Plateau

4.1. Data Sources

Six soil conservation measures were selected as research objects, and the technology evaluation index system was used to carry out a comprehensive technology evaluation and analysis. The six selected technologies were terraces, check dams, afforestation, economic forests, grassland restoration, and enclosures. Using the data from World Bank Loan for Soil and Water Conservation Governance Project in the Yanhe River Basin of the Loess Plateau, and previously published research, the evaluations were obtained for various soil conservation measures (Table 4). By issuing questionnaires to 120 experts in the field of soil and water conservation technology, a total of 112 valid questionnaires were collected, and the criteria scores for technology structure, professional demand, relevance correlation, and public acceptance were determined.

4.2. Evaluation of Soil Conservation Measures in the Loess Plateau Based on Rough Set Theory

The raw data was dimensionless by using Equations (2) and (3) to divide into 5-4, 4-3, 3-2, 2-1, and 1-0 (Table 5). According to the upper limit exclusion method, the corresponding values are 5, 4, 3, 2, and 1. The basic principles of the quantification processing are: (1) the medians of the data change within a certain range, and the index values greater than 5 are recorded as 5; (2) for the indexes that are difficult to quantify, such as technology maturity and technology promotion potential, according to the expert scoring, the corresponding score is given by the mean value; and (3) for the technology application cost and other indicators, the data are determined according to the actual project implementation [32].
Table 5 lists an information system, K = {U, I, V, P}, where K is the knowledge representation system of soil conservation measures; U is the set of the research objects, i.e., six soil conservation measures, {U1, U2, U3, U4, U5, U6}; I is the set of guideline indexes, i.e., {I1, I2, I3, I4}, corresponding to 12 sub-indexes, i.e., {{i1, i2}, {i3, i4}, {i5, i6, i7, i8, i9, i10}, and {i11, i12}}; V is the range of evaluation indicators. This study adopts the five-point evaluation method, i.e., {1, 2, 3, 4, 5}, and P is an information function, reflecting the complete information on soil conservation measures, U, in the knowledge representation system, K.
According to the rough set theory, the similar attributes are reduced. For the technology maturity index,
U/ind(I1-{i1}) = {{U1, U2, U6},{U3, U4, U5}}
U/ind(I1-{i2}) = {{U1, U2, U6},{U3, U4, U5}}
where U/ind(I1) represents the indiscernibility relation under the attribute I1; U/ind(I1-{i1}) refers to the indiscernibility relation under the attribute I1 without the index i1; U/ind(I1-{i2}) refers to the indiscernibility relation under the attribute I1 without the index i2.
Equations (2) and (3) shows that either without index i1 or i2, the indiscernibility relation is both equal to that under the attribute I1, so indicators i1 and i2 play the same role in attribute set I1. Therefore, there are two reductions, {i1} and {i2}, under the technology maturity index.
For the difficulty of technology application, the classification of the six ecological technologies under the professional demand, and the setup cost of two indexes, is consistent (Equations (4) and (5)), indicating that for all technologies, the greater the professional demand, the higher the setup cost. Therefore, there are two factors about {I3} and {I4} in the difficulty of technical application.
U/ind(I2-{i3}) = {{U1},{U2, U5, U6},{U3, U4}}
U/ind(I2-{i4}) = {{U1},{U2, U5, U6},{U3, U4}}
Under the technology efficiency, the classification of the soil organic matter index and vegetation coverage index is consistent (Equations (6) and (7)), so they are regarded as equivalent indexes. For runoff and sediment yield, the classification of the six ecological technologies is consistent too (Equations (8) and (9)), indicating that they are equivalent indexes. Therefore, there are four technology efficiency impairments, {i5, i6, i8, i9}, {i5, i6, i8, i10}, {i5, i7, i8, i9}, and {i5, i7, i8, i10}. In this study, soil organic matter and sediment reduction were constituted by the evaluation index system.
U/ind(I3-{i6}) = {{U1, U2},{U3, U6},{U4, U5}}
U/ind(I3-{i7}) = {{U1, U2},{U3, U6},{U4, U5}}
U/ind(I3-{i9}) = {{U1, U2},{U3, U4, U5},{U6}}
U/ind(I3-{i10}) = {{U1, U2},{U3, U4, U5},{U6}}
Similarly, two reductions, {i11} and {i12}, under the index of technology popularization potential also are available (Equations (10) and (11)).
U/ind(I4-{i11}) = {{U1,U2,U6},{U3,U4},{U5}}
U/ind(I4-{i12}) = {{U1,U2,U6},{U3,U4},{U5}}
Combined with the importance degree of the index in soil and water conservation engineering, the reduced index set of the soil conservation measures applied to the Loess Plateau is given as {i2, i4, i5, i6, i8, i9, i11}. After the attribute reduction, 5 out of 12 original indexes are eliminated, retaining 7 indexes such as preservation rate, setup cost, soil moisture content, organic matter content, runoff reduction, output per unit land, and relevance correlation, which constitutes a new evaluation system together with four first-level indexes for the soil conservation measures applied to the Loess Plateau (Table 6).
The weight of each index is generally given by experts in the existing evaluation methods, which leads to the evaluation results having a certain subjectivity. To avoid this problem and make the results more realistic, this paper transforms the weights into the calculation of the attribute importance in the rough set theory, thus, avoiding the interference of some subjective factors. The importance of evaluation index represents the ability of the evaluation index to classify evaluation system. If an index is deleted from the evaluation index system, the greater the classification ability of the system, and the more important the evaluation index. Conversely, the smaller the change, the less important the evaluation index. Under the technology maturity index, the importance of index i2 to attribute set I1 is as follows:
s i g i 2 , I 1 , U   =   p o s I N D I 1     i 2 U     p o s I N D I 1 U p o s I 1 U   =   γ I 1     i 2 U     γ I 1 U
where sig(i2, I1, U) refers to the significance between i2 and U; posIND(I1 ∪ {i2})(U) and posIND(I1)(U) refer to the positive regions of the indiscernibility relations i2, I1, and U; γ(I1 ∪ {i2})(U) and γ(I1)(U) refer to the correlation of i2, I1, and U.
The importance of the other attributes may be deduced by analogy. Finally, the calculation results are {0.167, 0.167, 0.5, 0.5, 0.5, 0.5, 0.167}. Considering the correlation of evaluation indexes on the evaluation results, the relation between the condition attribute (raw evaluation indexes) and the decision attribute (evaluation indexes after attribute reduction) is judged by a rough set, and the decision attribute is completely dependent on the condition attribute, which indicates that the index system can better evaluate the erosion control technology in the Loess Plateau.
According to Table 7, the comprehensive rank of the six soil conservation measures is economic forests (11.67) > check dams (11.17) > terraces (11.0) > grassland restoration (9.67) > afforestation (9.17) > enclosures (8.67). The comparative results of six ecological technologies under different first-level indexes are as follows.
(1)
For the technology maturity, the preservation rate and the technology structure are equivalent indexes. This study selected the preservation rate of technologies to obtain the survey data. The preservation rates of various soil conservation measures were not very different; all of them are above 85%, which indicates that all soil conservation measures meet the engineering standards and construction requirements.
(2)
For the difficulty of technology application, the skill level needed and the cost of technology application are equivalent indicators. The actual cost of each technology was selected as the evaluation index; terraces cost the most, followed by check dams, enclosures, and economic forests. Less expensive options are afforestation and grassland restoration, mainly because the amount of land alteration for terraces is relatively large, while afforestation and grassland restoration only require seedling fees.
(3)
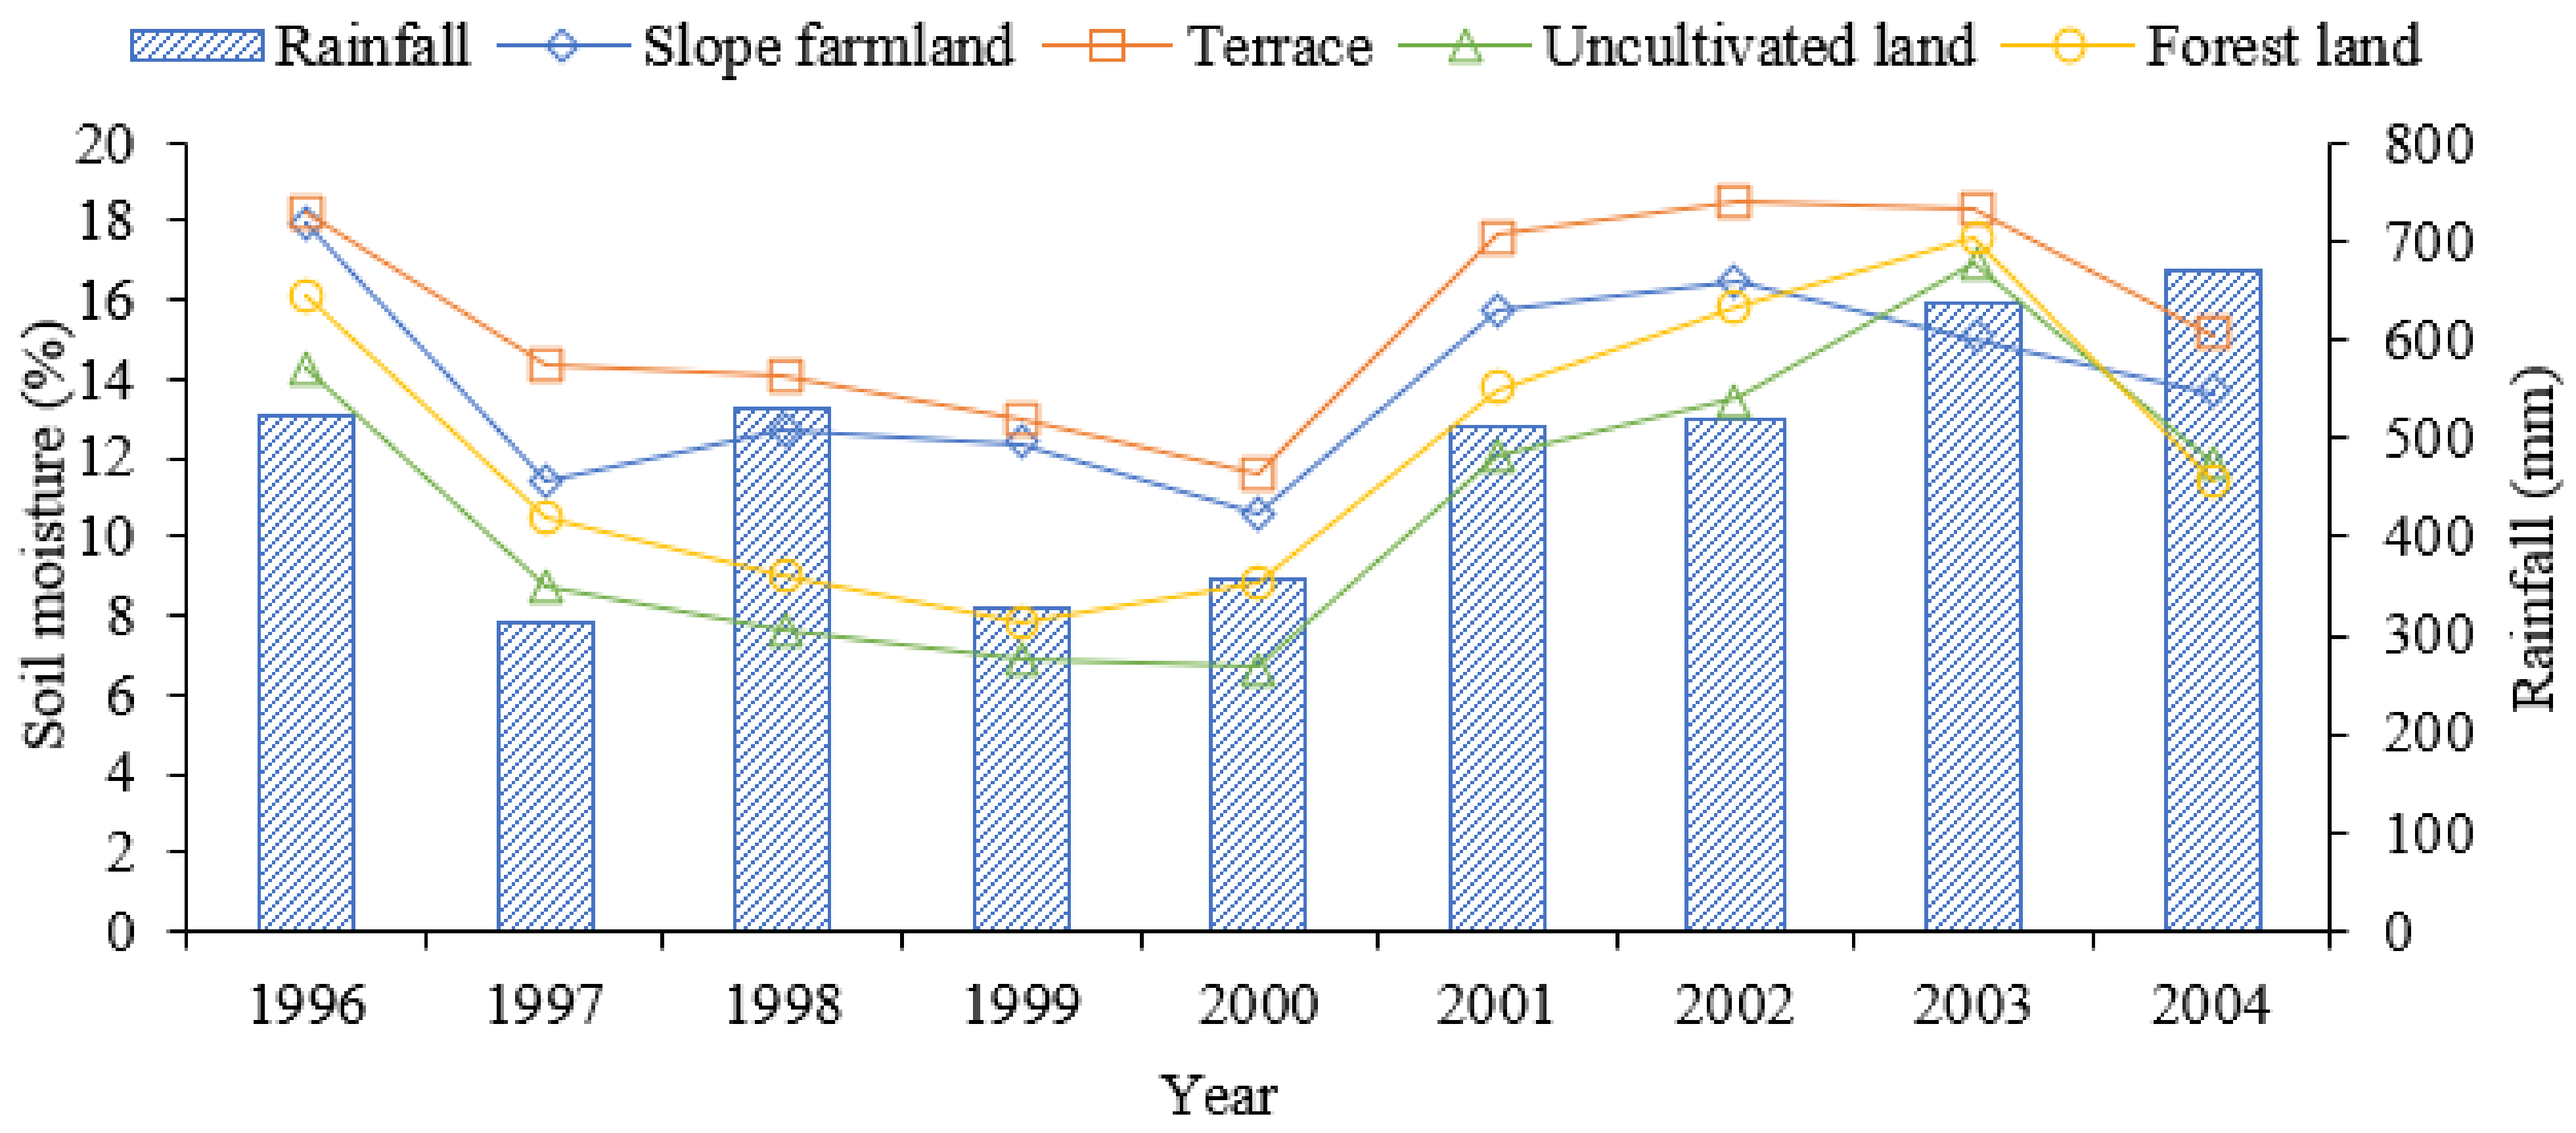
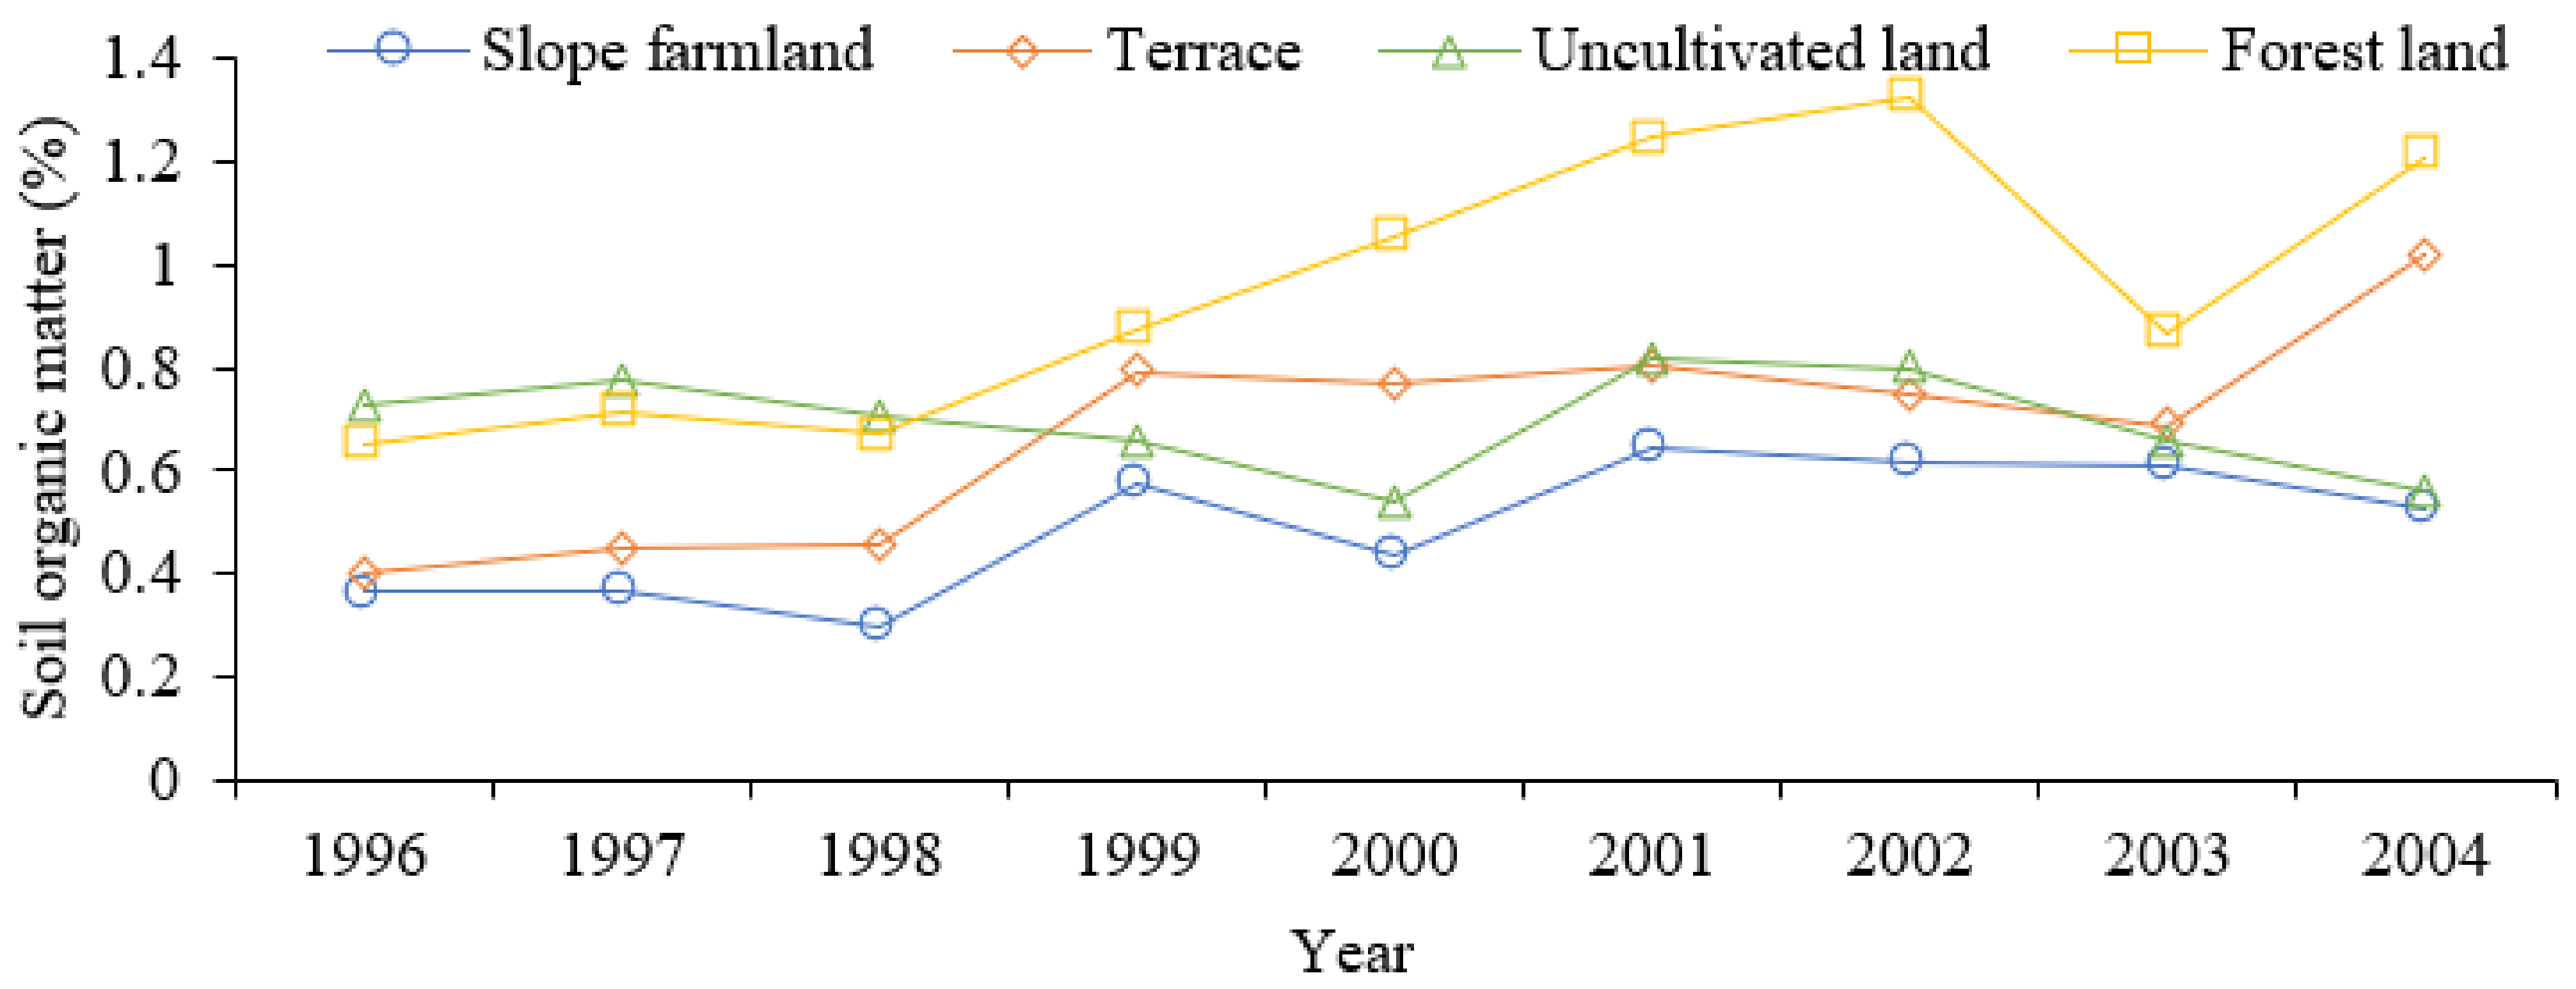
For the indicators of technology benefit, the soil water content, soil organic matter content, vegetation coverage, production per unit land, runoff, and sediment yield explain the benefits of different technologies from the angle of ecological, economic, and social benefit. Through attribute reduction, the soil water content, soil organic matter content, production per unit land, runoff, and sediment yield were the equivalent indicators. Following is an analysis of the effects of terraces and afforestation on soil moisture and soil organic matter in the Yanhe River Basin of the Loess Plateau from 1996 to 2004; all data are from the World Bank Loan for Soil and Water Conservation Governance Project.
Figure 2 takes the terraces and forest land as examples and compares the soil moisture changes with those for slope farmland and uncultivated land. It can be seen that the soil moisture of the terrace is higher than that of the slope farmland in both the wet and dry years. From the perspective of technology benefit, terrace and afforestation are both effective measures to improve soil moisture. This is consistent with the findings of Sun [34]. The soil moisture of the forest land is higher than that of the uncultivated land, indicating that terraces improve the soil moisture by increasing the soil thickness and improving the soil structure, and the forest land enhances the soil moisture by increasing the surface coverage and reducing the evaporation.
Figure 3 shows the variation of soil organic matter in terraces and forest lands. Liu [35] found that with the implementation of different ecological control technologies, the soil erosion intensity decreased year by year from 2000 to 2010, and the soil nutrients were improved. It can be seen that the soil organic matter of terraces is higher than that of the slope farmland. The soil organic matter of the forest land is higher than that of the uncultivated land, indicating that the terraces reduce the loss of soil organic matter by reducing soil and water loss, while the forest land increases the soil organic matter content by accumulating litter. Therefore, from the point of technology benefit, terrace and forest land can help to improve soil organic matter.
(4)
From the perspective of technology promotion potential, the correlation with the future and public acceptance are equivalent indicators. The higher the relevance to the future, the greater the willingness of the public to accept a technology. Conversely, the higher the degree of public acceptance, the correlation between technology and the future is not necessarily high. For example, if forestry and animal husbandry are the main development goals in a certain region, afforestation and grassland restoration are needed more in the future, and then land uses should be given priority to plant trees and grasses.

5. Conclusions

Based on the previous research of soil conservation measures applied to the Loess Plateau, six soil conservation measures are taken as the research objects, and the key factors affecting the soil conservation measures applied to the Loess Plateau are retained based on rough set theory. The main conclusions of this study are as follows. An evaluation index system of soil conservation measures was constructed, which consisted of 4 first-level indexes and 12 second-level indexes. Then, the weights of the second-level indicators were calculated by the attribute importance principle according to the information granularity, and the attribute reduction guarantees to maintain as few indicators as possible. Finally, the comprehensive evaluation results of the six soil conservation measures are obtained as follows: economic forests (11.67) > check dams (11.17) > terraces (11.0) > grassland restoration (9.67) > afforestation (9.17) > enclosures (8.67). According to the comprehensive evaluation results, the soil conservation measures applied to the Loess Plateau can be divided into three levels: (1) check dams, economic forests, and terraces; (2) afforestation and grassland restoration; and (3) enclosures. These technologies not only promote social and economic coordination but also have certain improvements on the ecological environment, and the selection and application of ecological control technologies are related to regional planning and production needs. Therefore, by adjusting the land use pattern and promoting the rational use of erosion control technology, the optimization of eco-environment benefits in this region can be realized.

Author Contributions

Conceptualization, X.L. and X.D.; methodology, X.D.; software, X.D.; validation, X.L., G.L., P.X. and X.D.; formal analysis, X.D.; investigation, R.L., Z.G., Y.Z.; resources, X.D.; data curation, X.D.; writing—original draft preparation, X.D.; writing—review and editing, X.D.; visualization, X.D.; supervision, G.L.; project administration, X.L.; funding acquisition, P.X. All authors have read and agreed to the published version of the manuscript.

Funding

This research was funded by the Influence and Effect of Soil and Water Conservation Measures Configuration on the Water and Sediment Process in the Watershed Program (Grant No. U2243210).

Institutional Review Board Statement

Not applicable.

Informed Consent Statement

Informed consent was obtained from all subjects involved in the study.

Data Availability Statement

The data supporting reported results can be found on the National Earth System Science Data Center (http://www.geodata.cn/ (accessed on 10 July 2022)).

Acknowledgments

The authors would like to thank the National Earth System Science Data Center for providing data for this study.

Conflicts of Interest

The authors declare no conflict of interest.

References

  1. Cheng, Y.T.; Li, P.; Xu, G.C.; Li, Z.B.; Gao, H.D.; Zhao, B.H.; Wang, T.; Wang, F.C.; Cheng, S.D. Effects of soil erosion and land use on spatial distribution of soil total phosphorus in a small watershed on the Loess Plateau, China. Soil Tillage Res. 2018, 184, 142–152. [Google Scholar] [CrossRef]
  2. Xu, Y.; Yang, B.; Tang, Q.; Liu, G.B.; Liu, P.L. Analysis of comprehensive benefits of transforming slope farmland to terraces on the Loess Plateau: A case study of the Yangou Watershed in Northern Shaanxi Province, China. J. Mt. Sci. 2011, 8, 448–457. [Google Scholar] [CrossRef]
  3. Fu, B.J.; Zhao, W.W.; Chen, L.D.; Zhang, Q.J.; Lü, Y.H.; Gulinck, H.; Poesen, J. Assessment of soil erosion at large watershed scale using RUSLE and GIS: A case study in the Loess Plateau of China. Land Degrad. Dev. 2005, 16, 73–85. [Google Scholar] [CrossRef]
  4. Wei, Y.H.; He, Z.; Li, Y.J.; Jiao, J.Y.; Zhao, G.J.; Mu, X.M. Sediment yield deduction from check-dams deposition in the weathered sandstone watershed on the north Loess Plateau, China. Land Degrad. Dev. 2016, 28, 217–231. [Google Scholar] [CrossRef]
  5. Kosmowski, F. Soil water management practices (terraces) helped to mitigate the 2015 drought in Ethiopia. Agric. Water Manag. 2018, 204, 11–16. [Google Scholar] [CrossRef]
  6. Bu, C.F.; Cai, Q.G.; Ng, S.L.; Chau, K.C.; Ding, S.W. Effects of hedgerows on sediment erosion in Three Gorges Dam area, China. Int. J. Sediment Res. 2008, 23, 119–129. [Google Scholar] [CrossRef]
  7. Panigrahi, P.; Srivastava, A.K.; Panda, D.K.; Huchche, A.D. Rainwater, soil and nutrients conservation for improving productivity of citrus orchards in a drought prone region. Agric. Water Manag. 2017, 185, 65–77. [Google Scholar] [CrossRef]
  8. Keesstra, S.; Pereira, P.; Novara, A.; Azorin-Molina, C.; Parras-Alcántara, L.; Jordán, A.; Cerdà, A. Effects of soil management techniques on soil water erosion in apricot orchards. Sci. Total Environ. 2016, 551–552, 357–366. [Google Scholar] [CrossRef] [Green Version]
  9. Tu, A.; Xie, S.; Yu, Z.; Li, Y.; Nie, X. Long-term effect of soil and water conservation measures on runoff, sediment and their relationship in an orchard on sloping red soil of southern China. PLoS ONE 2018, 13, e0203669. [Google Scholar] [CrossRef]
  10. Wei, W.; Feng, X.; Yang, L.; Chen, L.D.; Feng, T.J.; Chen, D. The effects of terracing and vegetation on soil moisture retention in a dry hilly catchment in China. Sci. Total Environ. 2019, 647, 1323–1332. [Google Scholar] [CrossRef]
  11. Wolka, K.; Mulder, J.; Biazin, B. Effects of soil and water conservation technologies on crop yield, runoff and soil loss in Sub-Saharan Africa: A review. Agric. Water Manag. 2018, 207, 67–79. [Google Scholar] [CrossRef]
  12. Xiong, M.Q.; Sun, R.H.; Chen, L.D. Effects of soil conservation technologies on water erosion control: A global analysis. Sci. Total Environ. 2018, 645, 753–760. [Google Scholar] [CrossRef] [PubMed]
  13. Zokaib, S.; Naser, G. Impacts of land uses on runoff and soil erosion: A case study in Hilkot watershed, Pakistan. Int. J. Sediment Res. 2011, 26, 343–352. [Google Scholar] [CrossRef]
  14. Fang, H.Y. Impact of land use change and dam construction on soil erosion and sediment yield in the black soil region, northeastern China. Land Degrad. Dev. 2017, 28, 1482–1492. [Google Scholar] [CrossRef]
  15. Fang, T.J.; Wei, W.; Chen, L.D.; Saskia, D.K.; Yu, Y. Effects of land preparation and plantings of vegetation on soil moisture in a hilly loess catchment in China. Land Degrad. Dev. 2017, 29, 1427–1441. [Google Scholar] [CrossRef]
  16. Musiyiwa, K.; Harris, D.; Filho, W.L.; Gwenzi, W.; Nyamangara, J. An assessment of smallholder soil and water conservation practices and perceptions in contrasting agro-ecological regions in Zimbabwe. Water Resour. Rural Dev. 2017, 9, 1–11. [Google Scholar] [CrossRef] [Green Version]
  17. Bargiel, D.; Herrmann, S.; Jadczyszyn, J. Using high-resolution radar images to determine vegetation cover for soil erosion assessments. J. Environ. Manag. 2013, 124, 82–90. [Google Scholar] [CrossRef]
  18. Diyabalanage, S.; Samarakoon, K.K.; Adikari, S.B.; Hewawasam, T. Impact of soil and water conservation measures on soil erosion rate and sediment yields in a tropical watershed in the Central Highlands of Sri Lanka. Appl. Geogr. 2017, 79, 103–114. [Google Scholar] [CrossRef] [Green Version]
  19. Fan, J.; Yan, L.J.; Zhang, P.; Zhang, G. Effects of grass contour hedgerow systems on controlling soil erosion in red soil hilly areas, southeast China. Int. J. Sediment Res. 2015, 30, 107–116. [Google Scholar] [CrossRef]
  20. Jemberu, W.; Baartman, J.E.M.; Fleskens, L.; Ritsema, C.J. Participatory assessment of soil erosion severity and performance of mitigation measures using stakeholder workshops in Koga catchment, Ethiopia. J. Environ. Manag. 2018, 207, 230–242. [Google Scholar] [CrossRef] [PubMed]
  21. Lemann, T.; Zeleke, G.; Amsler, C.; Giovanoli, L.; Suter, H.; Roth, V. Modelling the effect of soil and water conservation on discharge and sediment yield in the upper Blue Nile basin, Ethiopia. Appl. Geogr. 2016, 73, 89–101. [Google Scholar] [CrossRef]
  22. Li, Z.J.; Li, X.B.; Xu, Z.M. Impacts of water conservancy and soil conservation measures on annual runoff in the Chaohe River basin during 1961–2005. J. Geogr. Sci. 2010, 20, 947–960. [Google Scholar] [CrossRef]
  23. Maetens, W.; Poesen, J.; Vanmaercke, M. How effective are soil conservation technologies in reducing plot runoff and soil loss in Europe and the Mediterranean? Earth Sci. Rev. 2012, 115, 21–36. [Google Scholar] [CrossRef] [Green Version]
  24. Lin, C.W.; Tu, S.H.; Huang, J.J.; Chen, Y.B. The effect of plant hedgerows on the spatial distribution of soil erosion and soil fertility on sloping farmland in the purple-soil area of China. Soil Tillage Res. 2009, 105, 307–312. [Google Scholar] [CrossRef]
  25. Maetens, W.; Vanmaercke, M.; Poesen, J.; Jankauskas, B.; Jankauskiene, G.; Ionita, I. Effects of land use on annual runoff and soil loss in Europe and the Mediterranean. Prog. Phys. Geogr. 2012, 36, 599–653. [Google Scholar] [CrossRef]
  26. Mango, N.; Makate, C.; Tamene, L.; Mponela, P.; Ndengu, G. Awareness and adoption of land, soil and water conservation practices in the Chinyanja Triangle, Southern Africa. Int. Soil Water Conserv. Res. 2017, 5, 122–129. [Google Scholar] [CrossRef]
  27. Hu, X.N.; Si, M.Z.; Luo, H.; Guo, M.C.; Wang, J.J. The method and model of ecological technology evaluation. Sustainability 2019, 11, 886. [Google Scholar] [CrossRef] [Green Version]
  28. Nekhay, O.; Arriaza, M.; Boerboom, L. Evaluation of soil erosion risk using Analytic Network Process and GIS: A case study from Spanish mountain olive plantations. J. Environ. Manag. 2009, 90, 3091–3104. [Google Scholar] [CrossRef]
  29. Okeyo, A.I.; Mucheru-Muna, M.; Mugwe, J.; Ngetich, K.F.; Mugendi, D.N.; Diels, J.; Shisanya, C.A. Effects of selected soil and water conservation technologies on nutrient losses and maize yields in the central highlands of Kenya. Agric. Water Manag. 2014, 137, 52–58. [Google Scholar] [CrossRef]
  30. Paroissien, J.B.; Darboux, F.; Couturier, A.; Devillers, B.; Mouillot, F.; Raclot, D.; Le Bissonnais, Y. A method for modeling the effects of climate and land use changes on erosion and sustainability of soil in a Mediterranean watershed (Languedoc, France). J. Environ. Manag. 2015, 150, 57–68. [Google Scholar] [CrossRef] [Green Version]
  31. Schönbrodt-Stitt, S.; Behrens, T.; Schmidt, K.; Shi, X.; Scholten, T. Degradation of cultivated bench terraces in the Three Gorges Area: Field mapping and data mining. Ecol. Indic. 2013, 34, 478–493. [Google Scholar] [CrossRef]
  32. Pawlak, Z. Rough sets. Int. J. Comput. Inf. Sci. 1982, 11, 341–356. [Google Scholar] [CrossRef]
  33. Zhang, C.B.; Li, J.L.; Zhang, Y.; Zhou, W.; Qian, Y.R.; Yang, F. A quantative analysis method for measureing grassland coverage based on the RGB model. Acta Prataculturae Sin. 2013, 22, 220–226. [Google Scholar]
  34. Sun, J. Impacts of Different Land Use Types on Soil and Water Conservation in Yanhe River Drainage Area on the Loess Plateau. Master’s Thesis, Hunan Agricultural University, Changsha, China, 2008. Available online: https://kns.cnki.net/KCMS/detail/detail.aspx?dbname=CMFD2009&filename=2009091151.nh (accessed on 10 July 2022).
  35. Liu, Y.X. Evolution of Land Use Pattern and Its Soil Environment Effects in Loess Hilly Region. Master’s Thesis, Northwest A&F University, Xianyang, China, 2013. Available online: https://kns.cnki.net/KCMS/detail/detail.aspx?dbname=CMFD201401&filename=1013344658.nh (accessed on 10 July 2022).
Figure 1. Location of Shaanxi Province in China (a), the World Bank Loan Project area in the Yanhe River basin (b), and the land use before and after the project in the study area (c). Tr refers to terraces; Ch represents check dams; Af refers to afforestation; Ec represents economic forests; Gr refers to grassland restoration; En represents enclosures.
Water 14 02213 g001
Figure 2. Soil water status under different land use patterns.
Water 14 02213 g002
Figure 3. Soil organic matter under different land use patterns.
Water 14 02213 g003
Table 1. Soil conservation measures used in the Yanhe River Basin of the Loess Plateau.
MeasuresDefinitionSupporting TechnologiesReferences
TerracesStepped farmlands built along contour lines on slopes. It is an effective measure to control soil and water loss on sloping farmland, and has a significant effect on water storage, soil conservation, and crop yield increase.Level terrace
Zig terrace
Slope-separated terrace
Slope terrace
Fanya juu terrace
Half-moon terrace
[2,5,31]
Check damsThe dam is built to retain stand mud and sediment in all levels of ditches. Dams can create favorable conditions for the development of agriculture, forestry, and animal husbandry in mountainous areas by intercepting sediment, improving top soil, and turning waste ditches into good fields.Flood control dam
Mud retaining dam
[4,6]
AfforestationThe process of establishing new forests on barren hills, barren land, logging land, burned land, beach land, sandy wasteland, and mining areas which are suitable for afforestation.Contour planting
Returning topsoil to tree pits
Vegetation barrier
[11,12]
Economic forestsThe forest, whose main purpose is to produce fruits, edible oils, raw industrial materials, and medicinal materials.Selective breeding
Yield increase
Quality improvement
[7,8]
Grassland restorationUsing the herbaceous plants to control soil erosion, for grazing or to improve the benefits of other erosion control measures.Contour hedgerow
Vegetation strip
[8,19]
EnclosuresTo prevent human activities from destroying the ecological region and restore natural vegetation; a grazing ban is a measure to prohibit grazing in areas with fragile ecology, serious soil erosion, and degradation of grassland, which relieves the pressure of grazing on vegetation, improves plant
Growth, and restores vegetation.
Natural regeneration
Artificial promotion
[11,12]
Table 2. Steps of comprehensive evaluation based on rough set theory.
StepMethods
Data preprocessingIncluding the quantification of qualitative indexes, the uniformity of evaluation results, and evaluation indexes.
Data discretizationThe continuous data is converted into discrete data by the upper limit exclusion method.
Screening evaluation indexesCalculating the correlation of each index in the index system, and removing the redundant indexes according to the attribute reduction principle; After screening and adjusting the evaluation indexes, a more scientific and reasonable index system can be obtained.
Determining weight coefficientThe index weight is obtained by calculating the importance of each index.
Constructing evaluation modelAn evaluation model is constructed, and evaluation coefficients are calculated, and then the evaluation object is compared and sorted.
Analysis of evaluation resultsThe evaluation model is used to comprehensively assess the technologies for soil and water conservation, and the evaluation results are analyzed.
Table 3. Evaluation index system of soil conservation measures.
GuidelinesIndexSub-IndexNature
Maturity of the technologyTechnology integrityTechnology structure (i1)Qualitative index
Technology stabilityPreservation rate (i2)Quantitative index
Difficulty of technology applicationSkill level neededProfessional demand (i3)Qualitative index
Technology application costSetup cost (i4)Quantitative index
Technology efficiencyEcological benefitsSoil water content (i5)Quantitative index
Soil organic matter (i6)Quantitative index
Vegetation coverage (i7)Quantitative index
Economic benefitsOutput per unit land (i8)Quantitative index
Social benefitsRunoff (i9)Quantitative index
Sediment yield (i10)Quantitative index
Potential of technology promotionDemand for erosion control constructionRelevance correlation (i11)Qualitative index
Technology substitutabilityPublic acceptance (i12)Qualitative index
Table 4. Basic data for soil conservation measures.
IndexesSoil Conservation Measures
TerracesCheck DamsAfforestationGrassland RestorationEnclosuresEconomic Forests
Technology structure (i1)4.504.453.503.253.754.20
Preservation rate (i2)95%90%81.04%80.8%81.7%90.7%
Professional demand (i3)5.002.782.001.752.423.00
Setup cost (i4)13,600.34105.82579.12312.93339.74240.5
Soil water content (i5)15.64%22.05%12.31%13.71%10.95%15.66%
Soil organic matter (i6)4.914.9911.998.058.7512.20
Vegetation coverage (i7)27%26%65.5%46.25%42.67%68.3%
Output per unit land (i8)3.534.82.274.833.084.81
Runoff (i9)284.75361.25170127.5170212.5
Sediment yield (i10)96.11169.2950.6550.5250.7870.78
Relevance correlation (i11)4.784.783.783.592.594.39
Public acceptance (i12)4.634.663.663.592.534.76
Table 5. Information system table after discretizing the evaluation index.
GuidelinesSub-IndexesSoil Conservation Measures
Terraces U1Check Dams U2Afforestation U3Grassland Restoration U4Enclosures U5Economic Forests U6
Technology maturity I1Technology structure (i1)4.504.453.503.253.754.20
Preservation rate (i2)4.474.243.823.803.854.27
Difficulty of technology application I2Professional demand (i3)5.002.782.001.752.423.00
Setup cost (i4)8.732.631.651.482.142.72
Technology efficiency I3Soil water content (i5)4.135.823.253.622.894.13
Soil organic matter (i6)2.232.275.463.663.985.55
Vegetation coverage (i7)2.262.175.473.863.575.71
Output per unit land (i8)3.594.882.314.913.134.89
Runoff (i9)4.956.282.962.222.963.69
Sediment yield (i10)4.277.532.252.252.263.15
Potential of technology promotion I4Relevance correlation (i11)4.784.783.783.592.594.39
Public acceptance (i12)4.634.663.663.592.534.76
Table 6. Information system after attribute reduction.
IndexesEcological Control Technologies
TerracesCheck DamsAfforestationGrassland RestorationEnclosuresEconomic Forests
Preservation rate (i2)554445
Setup cost (i4)532233
Soil moisture content (i5)554435
Organic matter content (i6)335445
Runoff reduction (i8)453545
Output per unit land (i10)553334
Relevance correlation (i11)554435
Table 7. Evaluation results of reduced technology indicators.
Ecological Control Technologies
TerracesCheck DamsAfforestationGrassland RestorationEnclosuresEconomic Forests
Evaluation coefficient11.011.179.179.678.6711.67
Rank325461
Publisher’s Note: MDPI stays neutral with regard to jurisdictional claims in published maps and institutional affiliations.

