
Adsorption of Tannic Acid and Macromolecular Humic/Fulvic Acid onto Polystyrene Microplastics: A Comparison Study


1
School of Environment, Nanjing Normal University, Nanjing 210023, China
2
Jiangsu Province Engineering Research Center of Environmental Risk Prevention and Emergency Response Technology, Jiangsu Engineering Lab of Water and Soil Eco-Remediation, Nanjing 210023, China
3
Jiangsu Center for Collaborative Innovation in Geographical Information Resource Development and Application, Nanjing 210023, China
*
Author to whom correspondence should be addressed.
Water 2022, 14(14), 2201; https://doi.org/10.3390/w14142201
Submission received: 9 June 2022
/
Revised: 8 July 2022
/
Accepted: 11 July 2022
/
Published: 12 July 2022
(This article belongs to the Special Issue Advances in Wastewater Treatment: Adsorption Mechanism, Isotherms, Kinetics and Reusability)
Abstract
:Dissolved organic matter (DOM) has been widely reported to influence the environmental behavior of microplastics (MPs), but little is known about the properties and mechanisms of interaction between specific DOM components and MPs. Here, we studied the adsorption of three representative DOM components (humic acid, HA; fulvic acid, FA; and tannic acid, TA) on polystyrene (PS) MPs in batch adsorption experiments. Results revealed that HA/FA adsorption was greater under acidic conditions, while higher TA adsorption on PS was found at pH 4 and 6. The divalent cation (Ca2+) exerted a more prominent role in enhancing HA, FA, and TA adsorption on PS than did monovalent ones (K+ and Na+). The adsorption process fitted well with the Freundlich isotherm model and the pseudo-second-order kinetics model. The adsorption site heterogeneity was evaluated using the site energy distribution analysis based on the Freundlich model. The greater binding ability of HA on the PS surface caused a more negatively charged surface than FA/TA, as reflected by Zeta potential values. The findings of this study not only provide valuable information about the adsorption behavior and interaction processes of various DOM components on PS MPs, but also aid our efforts to evaluate the environmental behaviors of MPs.
1. Introduction
Since the 1950s, the production of plastics has grown rapidly due to superb properties such as low cost, versatility, and durability, and they are widely used in human daily life [1]. Production of plastics has reportedly increased from 1.5 million metric tons (MT) in 1950 to 367 million MT in 2020 [2,3]. Nowadays, a large number of plastic wastes generated and disposed of through different routes have entered the environment by various pathways [4]. It is calculated that between 60 and 99 million MT of plastic garbage was produced globally in 2015 [5]. Currently, the world produces approximately 300 million tons of plastic waste per year based on world plastic waste statistics [6]; if the situation is not improved, production could reach 155–265 million MT by 2060 [5]. Once exposed to the environment, large items of plastic debris can be naturally fragmented and degraded slowly into smaller pieces as a consequence of various weathering processes [7]; the smaller plastic particles are typically defined as nanoplastics (1–1000 nm) and microplastics (MPs, 1 μm–5 mm), respectively [8].
Currently, MPs are considered as contaminants of emerging concern due to their widespread and potential risks to human health and the natural environment [9,10,11,12]. It has been shown that MPs have a variety of toxic effects on organisms (such as neurotoxicity, reproductive toxicity, growth inhibition, etc.) [13,14,15], and when ingested by organisms, the MPs may accumulate in the food chain, causing further damage to the organisms [16,17]. Besides its own toxicity, MPs can interact with other pollutants and act as vectors for pollutants to produce combined toxic effects on the environment [18,19,20].
Dissolved organic matter (DOM) is widely found in various environmental media, and it contains plenty of active functional groups (such as hydroxyl, carboxyl, and phenolic hydroxyl) [21]. Thus, the MPs released into the aquatic environment will inevitably interact with DOM [22]. For example, DOM was considered to interact with MPs and affect the toxicity, bioavailability, and environmental fate of MPs [23,24,25,26]. Chen et al. [27] firstly investigated the interaction between HA and PS MPs, and found that HA-PS interaction might change the environmental behavior of PS by increasing the roughness and oxygen content of PS. Meanwhile, the interaction of MPs with natural organisms could aggravate the toxicity of copper (Cu) in the liver and gut of zebrafish was reported by Qiao et al. [28]. Generally, MPs entering the aquatic environment will inevitably interact with DOM, affecting their transport and transformation in the environment or environmental toxicity. Therefore, it is important to study the interaction between MPs and DOM in order to understand the migration and transformation of MPs and DOM in the environment [24]. However, due to the complexity of the composition, structure, and environmental behavior of DOM, the influence of typical DOM (such as HA, FA, and TA) on the specific environmental behavior of PS MPs is not clear. Therefore, it is significant to study the adsorption behavior of specific DOM components onto MPs to evaluate the environmental behaviors of MPs.
Polystyrene (PS), which is among the most widely used plastics, has been frequently detected in the environment [29], and PS particles in aquatic ecosystems are intensely reported to interact with various pollutants [30,31]. This process can be influenced by several factors such as hydrochemical conditions as well as the DOM compound [27,32,33]. However, the research on the interaction mechanisms between PS MPs and DOM is still not fully understood [34].
Generally, the site energy distribution analysis is a useful tool to gain a better understanding of DOM adsorption behavior on solid surfaces in aquatic systems. In this work, the adsorption mechanism of PS MPs towards three representative DOM components (HA, FA, and TA) and the homogeneity of adsorption sites were analyzed by the average adsorption site energy and standard deviation of the site energy distribution. Furthermore, the adsorption behaviors of DOM on PS MPs were evaluated using corresponding models, such as adsorption kinetics, isotherms, and the site energy distribution. The findings of this work can provide more information for understanding the interaction mechanisms of PS MPs with DOM in an aquatic environment.
2. Materials and Methods
2.1. Materials
The PS MPs were supplied as powders by the Shengbang Plastic Materials Co., Ltd. (Dongguan, China). They were passed through a 300-mesh sieve and the <50 μm particle size fraction was used in experiments. The use of pure plastics is beneficial to explore the adsorption behaviors and mechanisms of DOM on MPs, due to the stable structure and free of impurities. Commercial HA was supplied by Sigma-Aldrich (St. Louis., MO, USA) and its molecular weight (MW) is 22.8 k Da. The FA and TA were obtained from Aladdin Reagent (Shanghai, China) Co., Ltd., their MW are 3.6 and 1.701 k Da, respectively [21]. The main physicochemical properties of HA, FA, and TA were shown in Table S1 in the Supplementary Material. All other chemicals were purchased from Sinopharm Chemical Reagent Co. (Shanghai, China). All the chemicals used in this study were of analytical reagent (AR) grade.
2.2. Materials Characterization
Fourier transform infrared spectroscopy (FTIR, Nicolet iS5, Germany) was used to characterize the functional groups of PS MPs before and after DOM adsorption. A microelectrophoresis apparatus (Nano-ZS, Malvern, UK) was used to analyze the zeta potential (ZP) of PS before and after DOM adsorption. The morphology and structure of PS MPs were observed on a Hitachi model SU8010 (Japan) scanning electron microscope (SEM).
2.3. Adsorption Experiments
The effects of initial pH value, contact time, ionic strength, and initial concentration of HA, FA, and TA on the adsorption properties were investigated. The system was adjusted to the desired pH by adding negligible volumes of 0.01–0.1 mol/L HCl, or 0.01–0.1 mol/L NaOH. Except for the adsorption kinetic experiments, all adsorption experiments were performed in 150 mL conical flasks containing 100 mg PS MPs and 50 mL HA, FA, or TA solution. The conical flasks were then shaken on the constant temperature oscillator at 200 rpm and 298 K for a certain time until the equilibrium was reached. At the end of the equilibrium time, the suspensions were collected and centrifuged at 10,000 rpm for 10 min, then filtered through 0.22 μm membrane filters. Finally, HA, FA, or TA concentrations in the filtrates were quantified using a UV/VIS spectrophotometer (UV-8000, Shanghai Metash Instruments Co., Ltd., China).
The amount of HA, FA, and TA adsorbed on the PS MPs was estimated by a difference between the initial concentration and the equilibrium concentrations. The equilibrium amount (qe) of HA, FA, and TA adsorption from the aqueous solution was calculated using the following equation:
where qe is the amount of HA, FA, and TA adsorbed at equilibrium (μg/g); m is the mass of MPs (g); V is the volume of solution (L); C0 and Ce are the initial and the equilibrium concentrations of HA, FA, and TA respectively (μg/L).
2.4. Adsorption Models
In order to study the adsorption mechanisms of DOM on PS MPs, the adsorption kinetics were described by the pseudo-first-order [35], pseudo-second-order [36], and Elovich [37] models. And the Langmuir [38], Freundlich [39], and Sips [40] models were adopted to study the adsorption isotherms of HA, FA, and TA on PS MPs. These models can be found in the Supplementary Material.
2.5. Approximate Site Energy Distribution Analysis
The site energy distribution study was performed to better understand the energetic features of interactions between HA, FA, TA and the PS MPs. The distribution of adsorption sites can be obtained by the isothermal adsorption model. Condensation approximation was used to determine the site energy distribution function [41].
The adsorption site energy distribution of PS MPs can be transformed into the following:
where qh (E, Ce) is the homogeneous isotherm over local sorption sites with sorption energy E, and F(E) is the site energy frequency distribution over a range of sites with homogeneous energies.
According to the “Cerofolini” approximation [42], the equilibrium liquid phase concentration (Ce) of HA, FA, and TA were related to the adsorption energy (E) can be presented as the follows:
where Cs was the maximum solubility of DOM in water; Es was the sorption energy corresponding to Ce = Cs; R is the universal gas constant; T is the absolute temperature (K).
For Freundlich isotherm, the site energy distribution (F(E*)) of HA, FA, and TA adsorption on PS MPs were calculated by the following equations:
The average site energy μ(E*) can be used to describe the strength of interaction between adsorbent and adsorbate, while the standard deviation (E*) can describe the heterogeneity of adsorption potential energy. Their expressions in the experimental concentration range are as follows:
where and are the minimum and maximum values of E* calculated by experimental equilibrium concentrations, respectively.
3. Results and Discussion
3.1. Characterization of PS MPs
3.1.1. SEM Observation
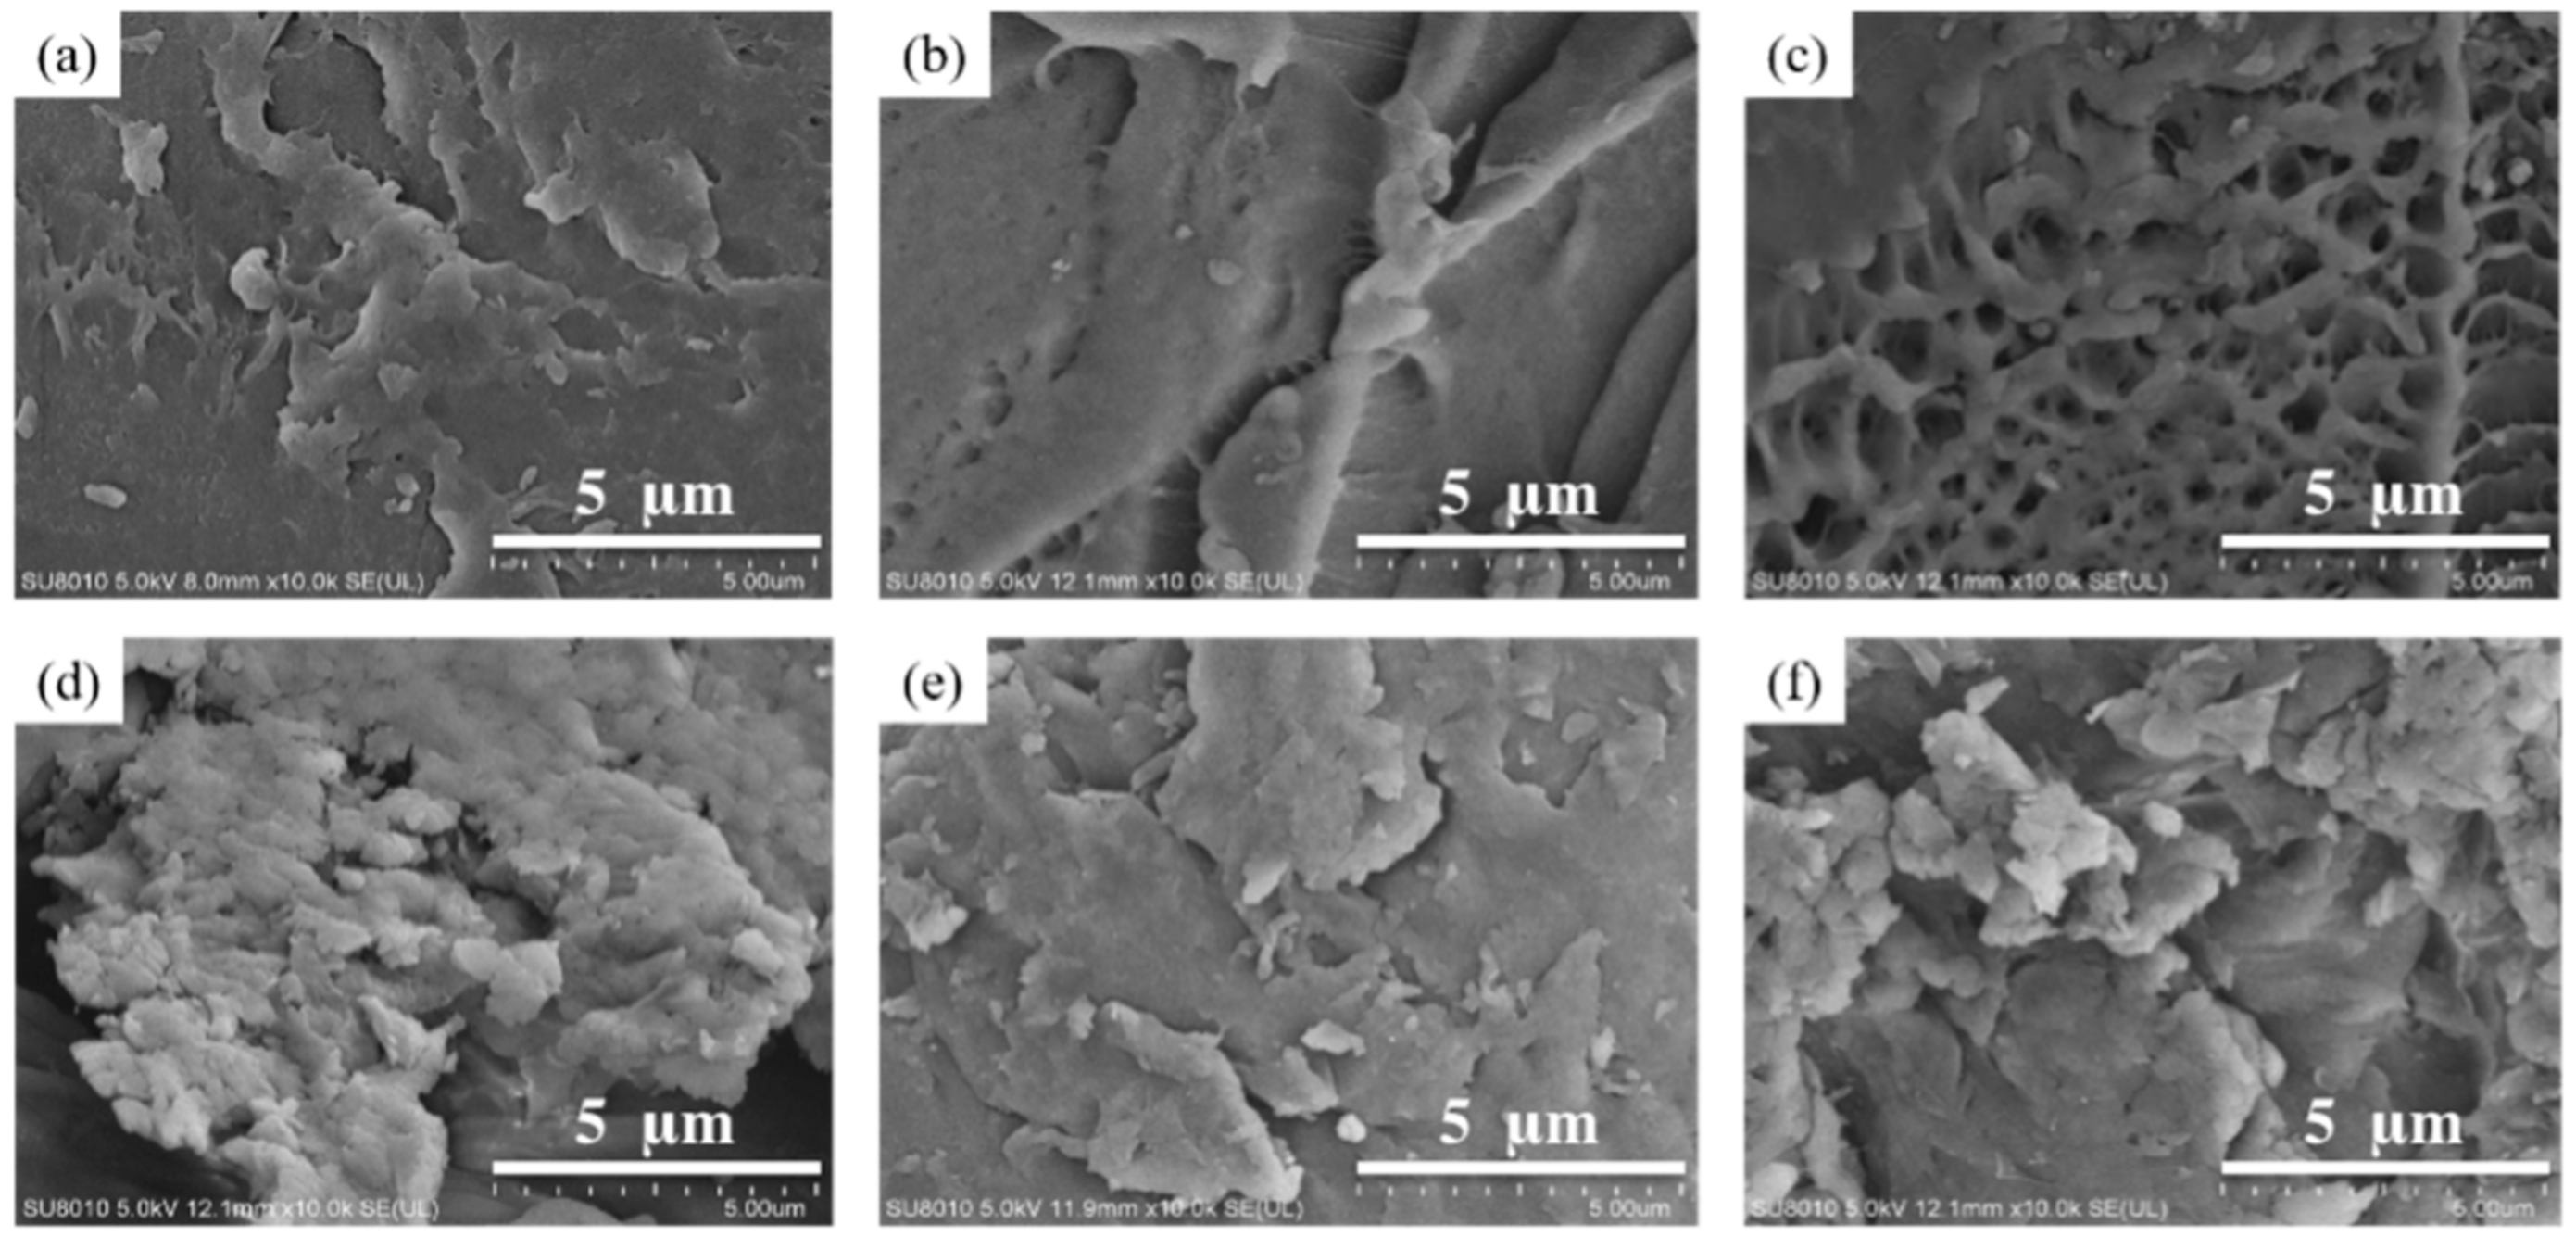
The SEM images in Figure 1 show the texture and porosity characteristics of PS before and after the adsorption of HA, FA, or TA. Clearly, the original PS MPs (Figure 1a–c) exhibited irregular shard-like shapes and rough surfaces, which were distributed with varying sizes of holes. Irregular pores and rough structure played an essential role in the adsorption process. The adsorption of DOM led to some changes in the morphology of PS. It was found that the DOM-loaded PS showed fewer surface pores and higher roughness compared with the virgin PS. Chen et al. [27] also reported the enhanced roughness of different sized MPs by HA. Furthermore, it was obvious that the adsorption of HA enhanced the roughness more significantly than that of FA/TA, since enriched bulges on PS surface appeared after HA binding, suggesting the greater adsorption capacity of HA on PS than FA/TA.
3.1.2. FT-IR Analysis
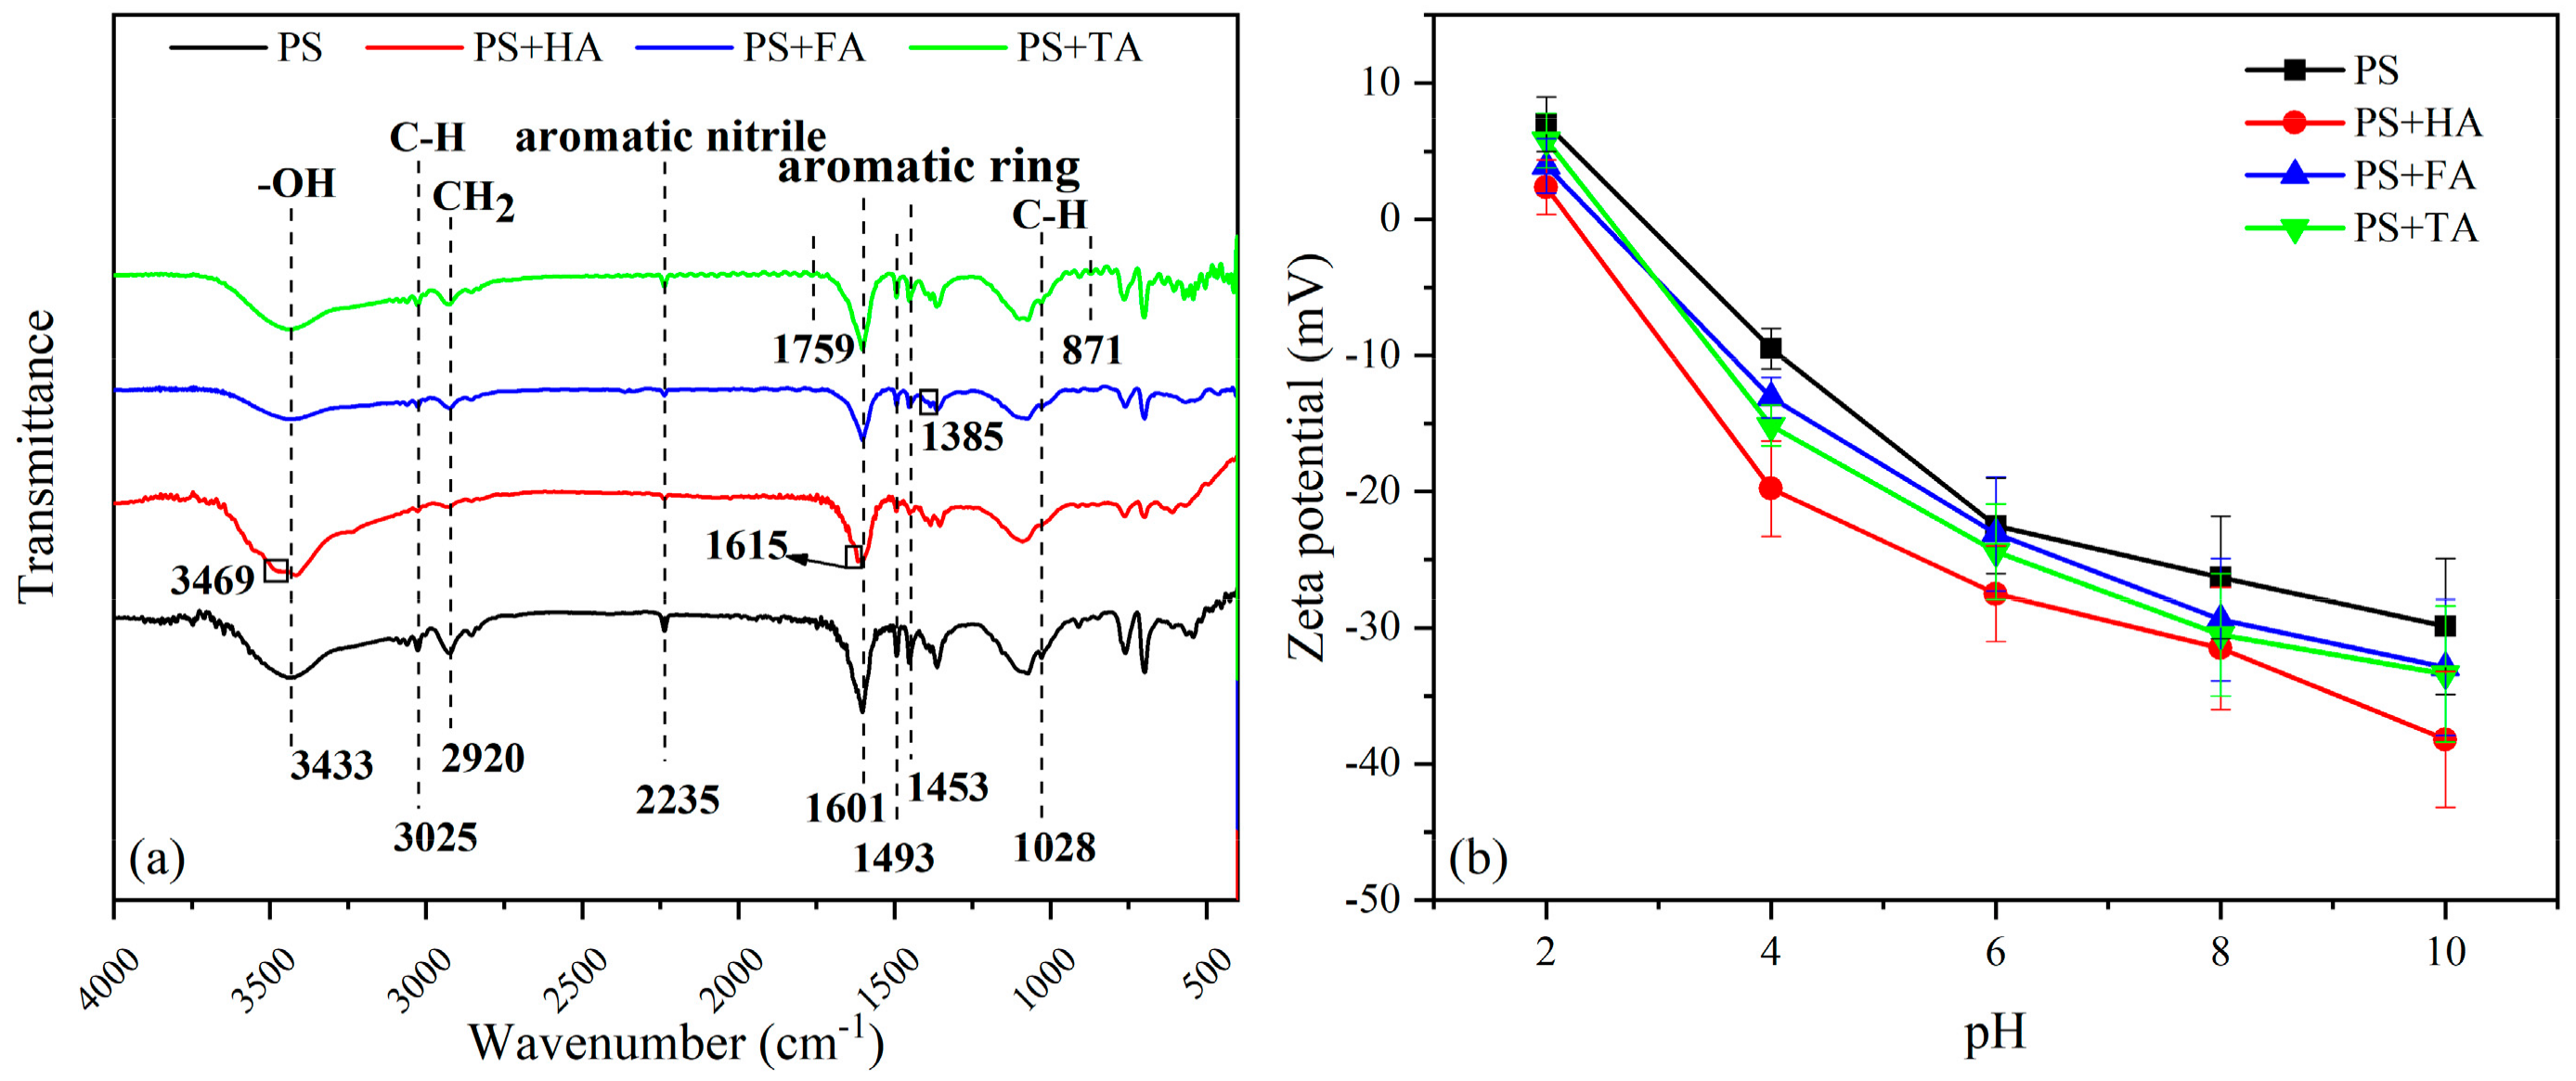
FT-IR spectroscopy was utilized to evaluate the changes in functional groups during the process to investigate the structural alterations of PS MPs produced by the interaction between various DOM and PS MPs (Figure 2). As shown by FT-IR spectrum in Figure 2a, the obvious absorption peaks were located in the regions of 1650–1000 cm−1 and 3500–2800 cm−1. The absorption band at 3433 cm−1 conformed to the stretching frequency of O-H. The adsorption peak at 3000 cm−1–3100 cm−1 was presumed to be the stretching vibration of the benzene ring = C-H bond, and the adsorption peak near 2920 cm−1 can be inferred as the asymmetric stretching vibration of -CH2 [43]. The peak values at 1601, 1493, and 1453 cm−1 belong to the stretching vibration of the aromatic ring [44,45]. Further, the fingerprint region of an infrared spectrum ranges from 1300 cm−1–400 cm−1 [29]. Overall, the FTIR spectrum of the PS MPs used in this study are similar to those reported in recent research, despite plasticizers or other additives that may cause the remaining peaks in PS MPs [46].
After HA was adsorbed by PS MPs, new peaks appeared at 3469 cm−1 and 1615 cm−1, which may be due to the presence of hydroxyl groups and the formation of aromatic C = C skeleton [47]. These results indicated that HA was loaded onto PS MPs. For PS MPs adsorbed FA, the peak at 1383 cm−1 moved to 1385 cm−1, corresponding to the symmetry stretching of the carboxyl O=C-O group [48]. The appearance of peaks between 2500 cm−1 and 2230 cm−1 was related to the carbon chain with -CH2- unit in FA [49]. After PS MPs adsorbs TA, the band at 871 cm−1 corresponds to the vibration of the C-H bond on the benzene ring [50], and a new peak was detected on PS MPs at 1759 cm−1; this new peak was also detected on TA [51]. The peak at 1453 cm−1 shifted to about 1455 cm−1 after PS MPs adsorbed DOM, which indicated that there might be hydrophobic interaction in the process of PS MPs adsorbing DOM [52].
3.1.3. Zeta Potentials Analysis
The adsorption rate and capacity of pollutants on MPs are affected by the change of surface charge. Figure 2b depicts the zeta potentials of PS MPs determined in water solutions at different pH levels. As pH increased from 2.0 to 10.0, the ZP of PS decreased from 6.99 mV to −29.9 mV. The ethylene structure was negatively charged by exposure to polystyrene [45], so the point of zero charge (PZC) of PS MPs was less than 7; PS MPs are usually negatively charged in marine or terrestrial water systems. These results are consistent with previous studies [29,53]. At the same time, the ZP of PS after HA, FA, and TA adsorption were measured under experimental conditions. PS MPs showed more negatively ZP after DOM adsorption and the pHPZC values were also decreased. This might be due to DOM containing several functional groups, such as carboxylic and phenolic, and the adsorption of these specific functional groups made the surface of PS MPs negatively charged so as to lower the pHPZC [48,54,55].
3.2. Effect of pH on HA, FA, and TA Adsorption by PS MPs
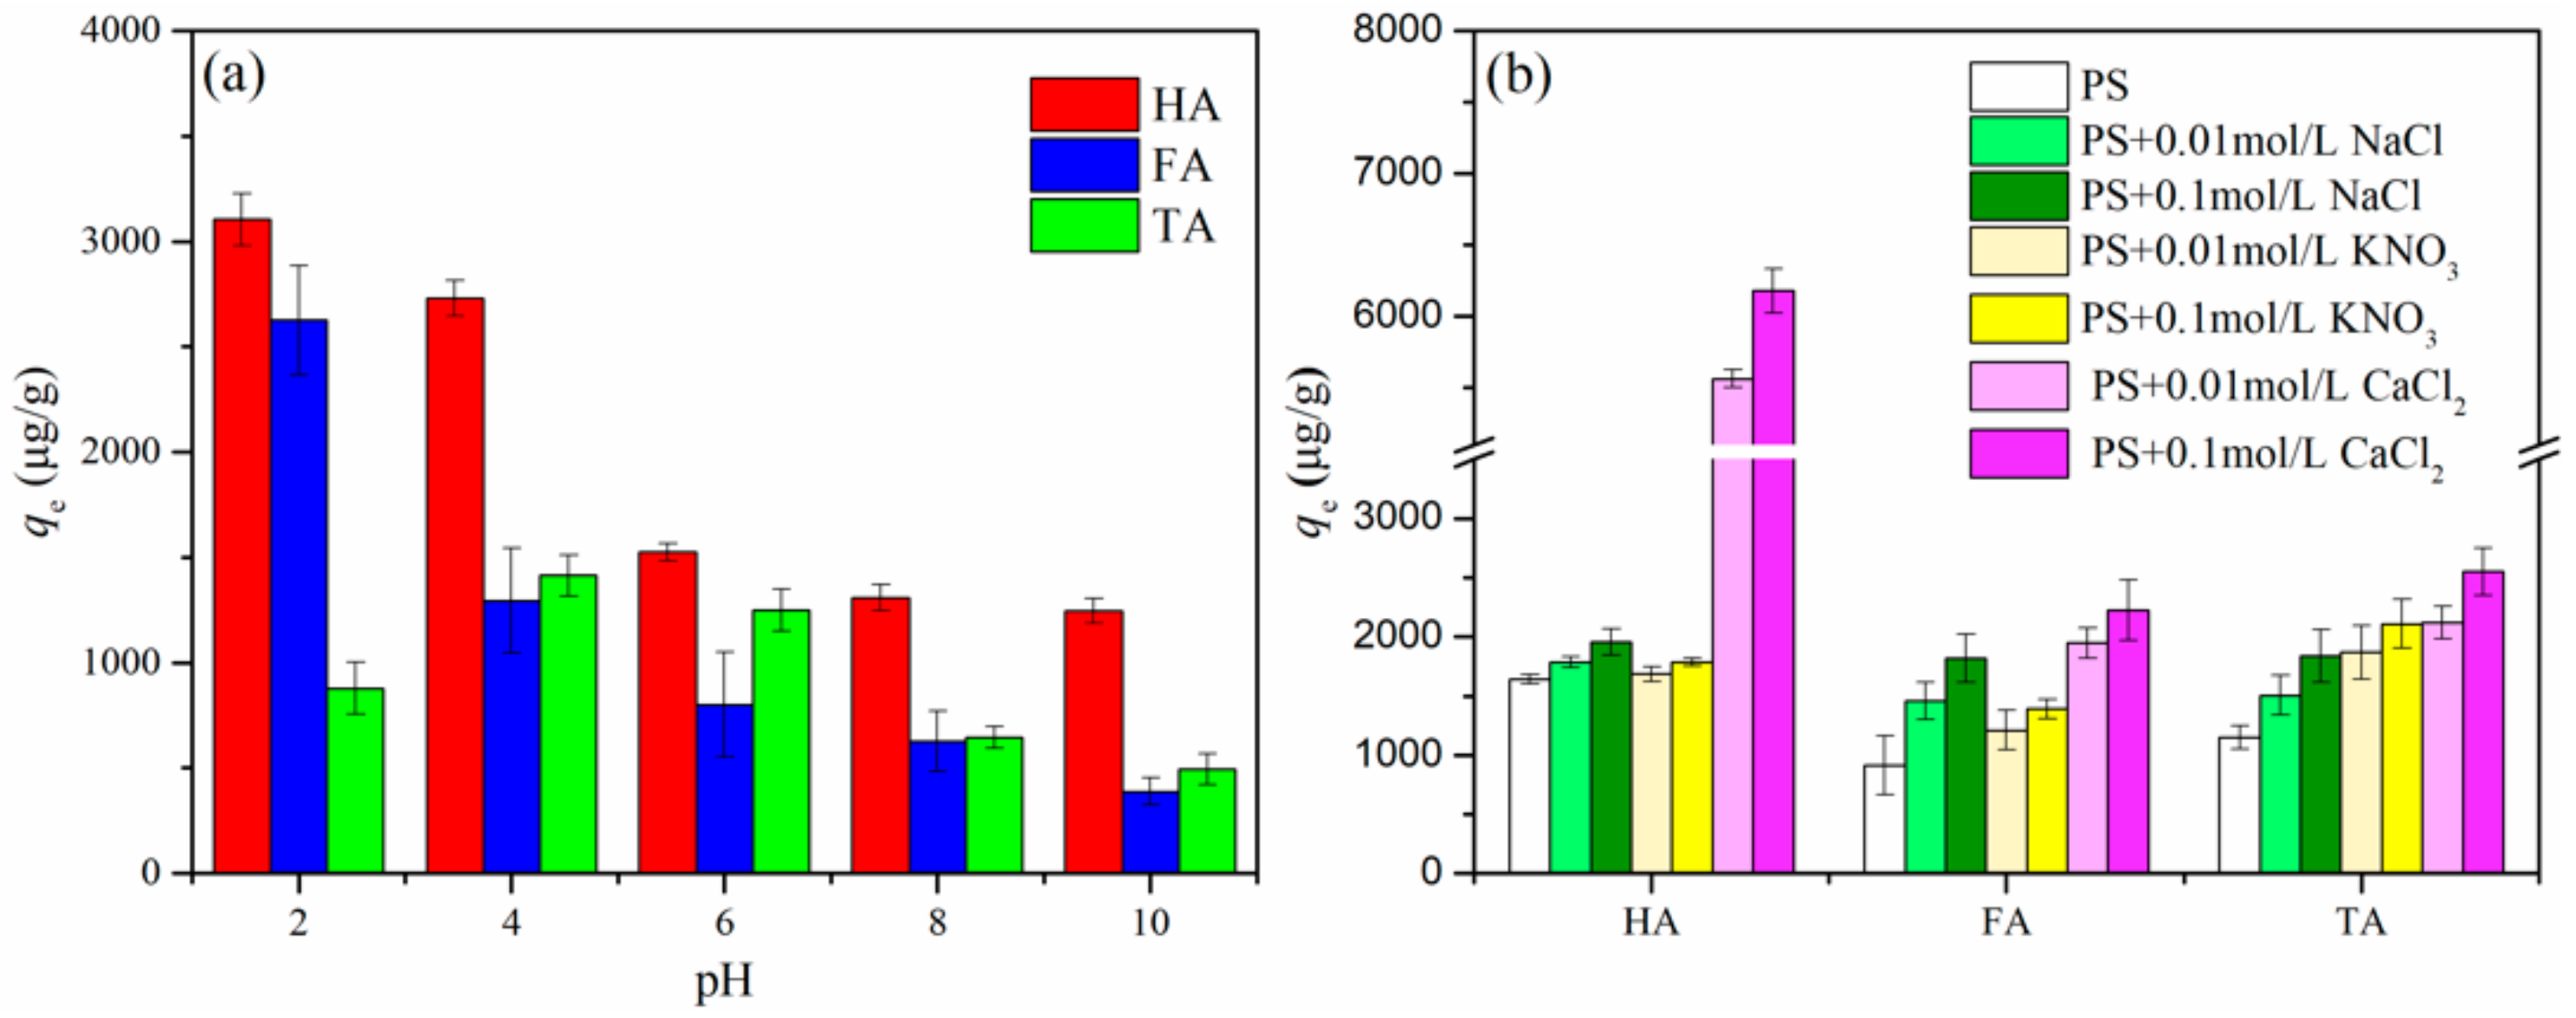
pH value is a key factor in the adsorption process, which affects not only the properties of the material but also the chemical species and properties of the target pollutants [56,57]. The effect of pH value on the adsorption of HA, FA, and TA by PS MPs was researched in the range of pH 2–10. As shown in Figure 3a, with the increase of pH value, the adsorption efficiency of HA and FA decreased significantly, while that of TA increased at first and then decreased. It was observed that when the pH value was from 2 to 10, the adsorption capacities of HA/FA progressively decreasing from 3104/2626 to 1245/389 μg/g, while higher TA adsorption on PS MPs was found at pH 4 and 6. This is similar to the study of adsorption trends of HA, FA, and TA on other materials [58,59,60].
Figure 2b shows that PS MPs carried positive charges at pH 2–3. When the pH was higher than pHPZC, the amount of negative charge on the surface of PS MPs increased as the pH value increased. Moreover, the zeta potentials of HA and FA were reported to be negative in the range of experimental pH values [57,61]. This suggests that electrostatic interactions play a significant role in the adsorption of HA and FA by PS MPs, and as the pH increases, both negatively charged species develop electrostatic repulsion. With the increase of pH, most of the oxygen-containing functional groups such as hydroxyl and carboxyl on humic substances would be deprotonated, which not only raises the negative charge of HA and FA, but also leads to reduce their hydrogen bond donors [59]. Meanwhile, FA has more carboxylic acid and hydroxyl functional groups than HA [62], therefore, the effect of electrostatic repulsion caused by pH on the adsorption of FA on PS may be more significant. It’s worth noting that the molecular surface charge of TA is almost zero when pH < 4.5 [63]. Therefore, when pH < 4.5, the adsorption ability of PS MPs to TA is less affected by the electrostatic interaction. While TA gradually dissociates and contains many negatively charged carboxyl and phenolic hydroxyl groups at pH > 4.5 [64], resulting in the electrostatic repulsion, which decreases the adsorption capacity of PS MPs to TA.
3.3. Effect of Salinity on HA, FA, and TA Adsorption by PS MPs
The cations Na+, K+, Ca2+ present in natural water may interact with HA, FA, and TA and affect the adsorption of them on the adsorbent. The effect of ionic strength on PS MPs adsorption of HA, FA, and TA is shown in Figure 3b. The presence of the studied ion concentration will promote the adsorption of HA, FA, and TA on PS MPs, especially Ca2 +, which has stronger electrostatic action and ion bridge effect [65,66]. Interestingly, the existence of Ca2+ has the greatest influence on the adsorption of HA by PS MPs. The reason may be that the solubility of HA is low under the higher strength of Ca2+ ions [52]. On the one hand, it is favorable for mass transfer of HA from solution phase to the solid phase of PS MPs; on the other hand, HA precipitates during centrifugal filtration. In general, DOM can be coagulation or precipitated to reduce the steric hindrance under high ionic strength in order to facilitate the adsorption of DOM [67,68]. Furthermore, in the presence of cations, the electrostatic double layers of the microplastics may be compressed, the surface negative charges neutralized, and the electrostatic repulsion between MPs and DOM reduced [69,70]. Furthermore, when the concentration of cations is high, the adsorption of DOM on MPs is promoted by the formation of cation bridges between DOM and cations [71].
3.4. Adsorption Kinetics Analysis
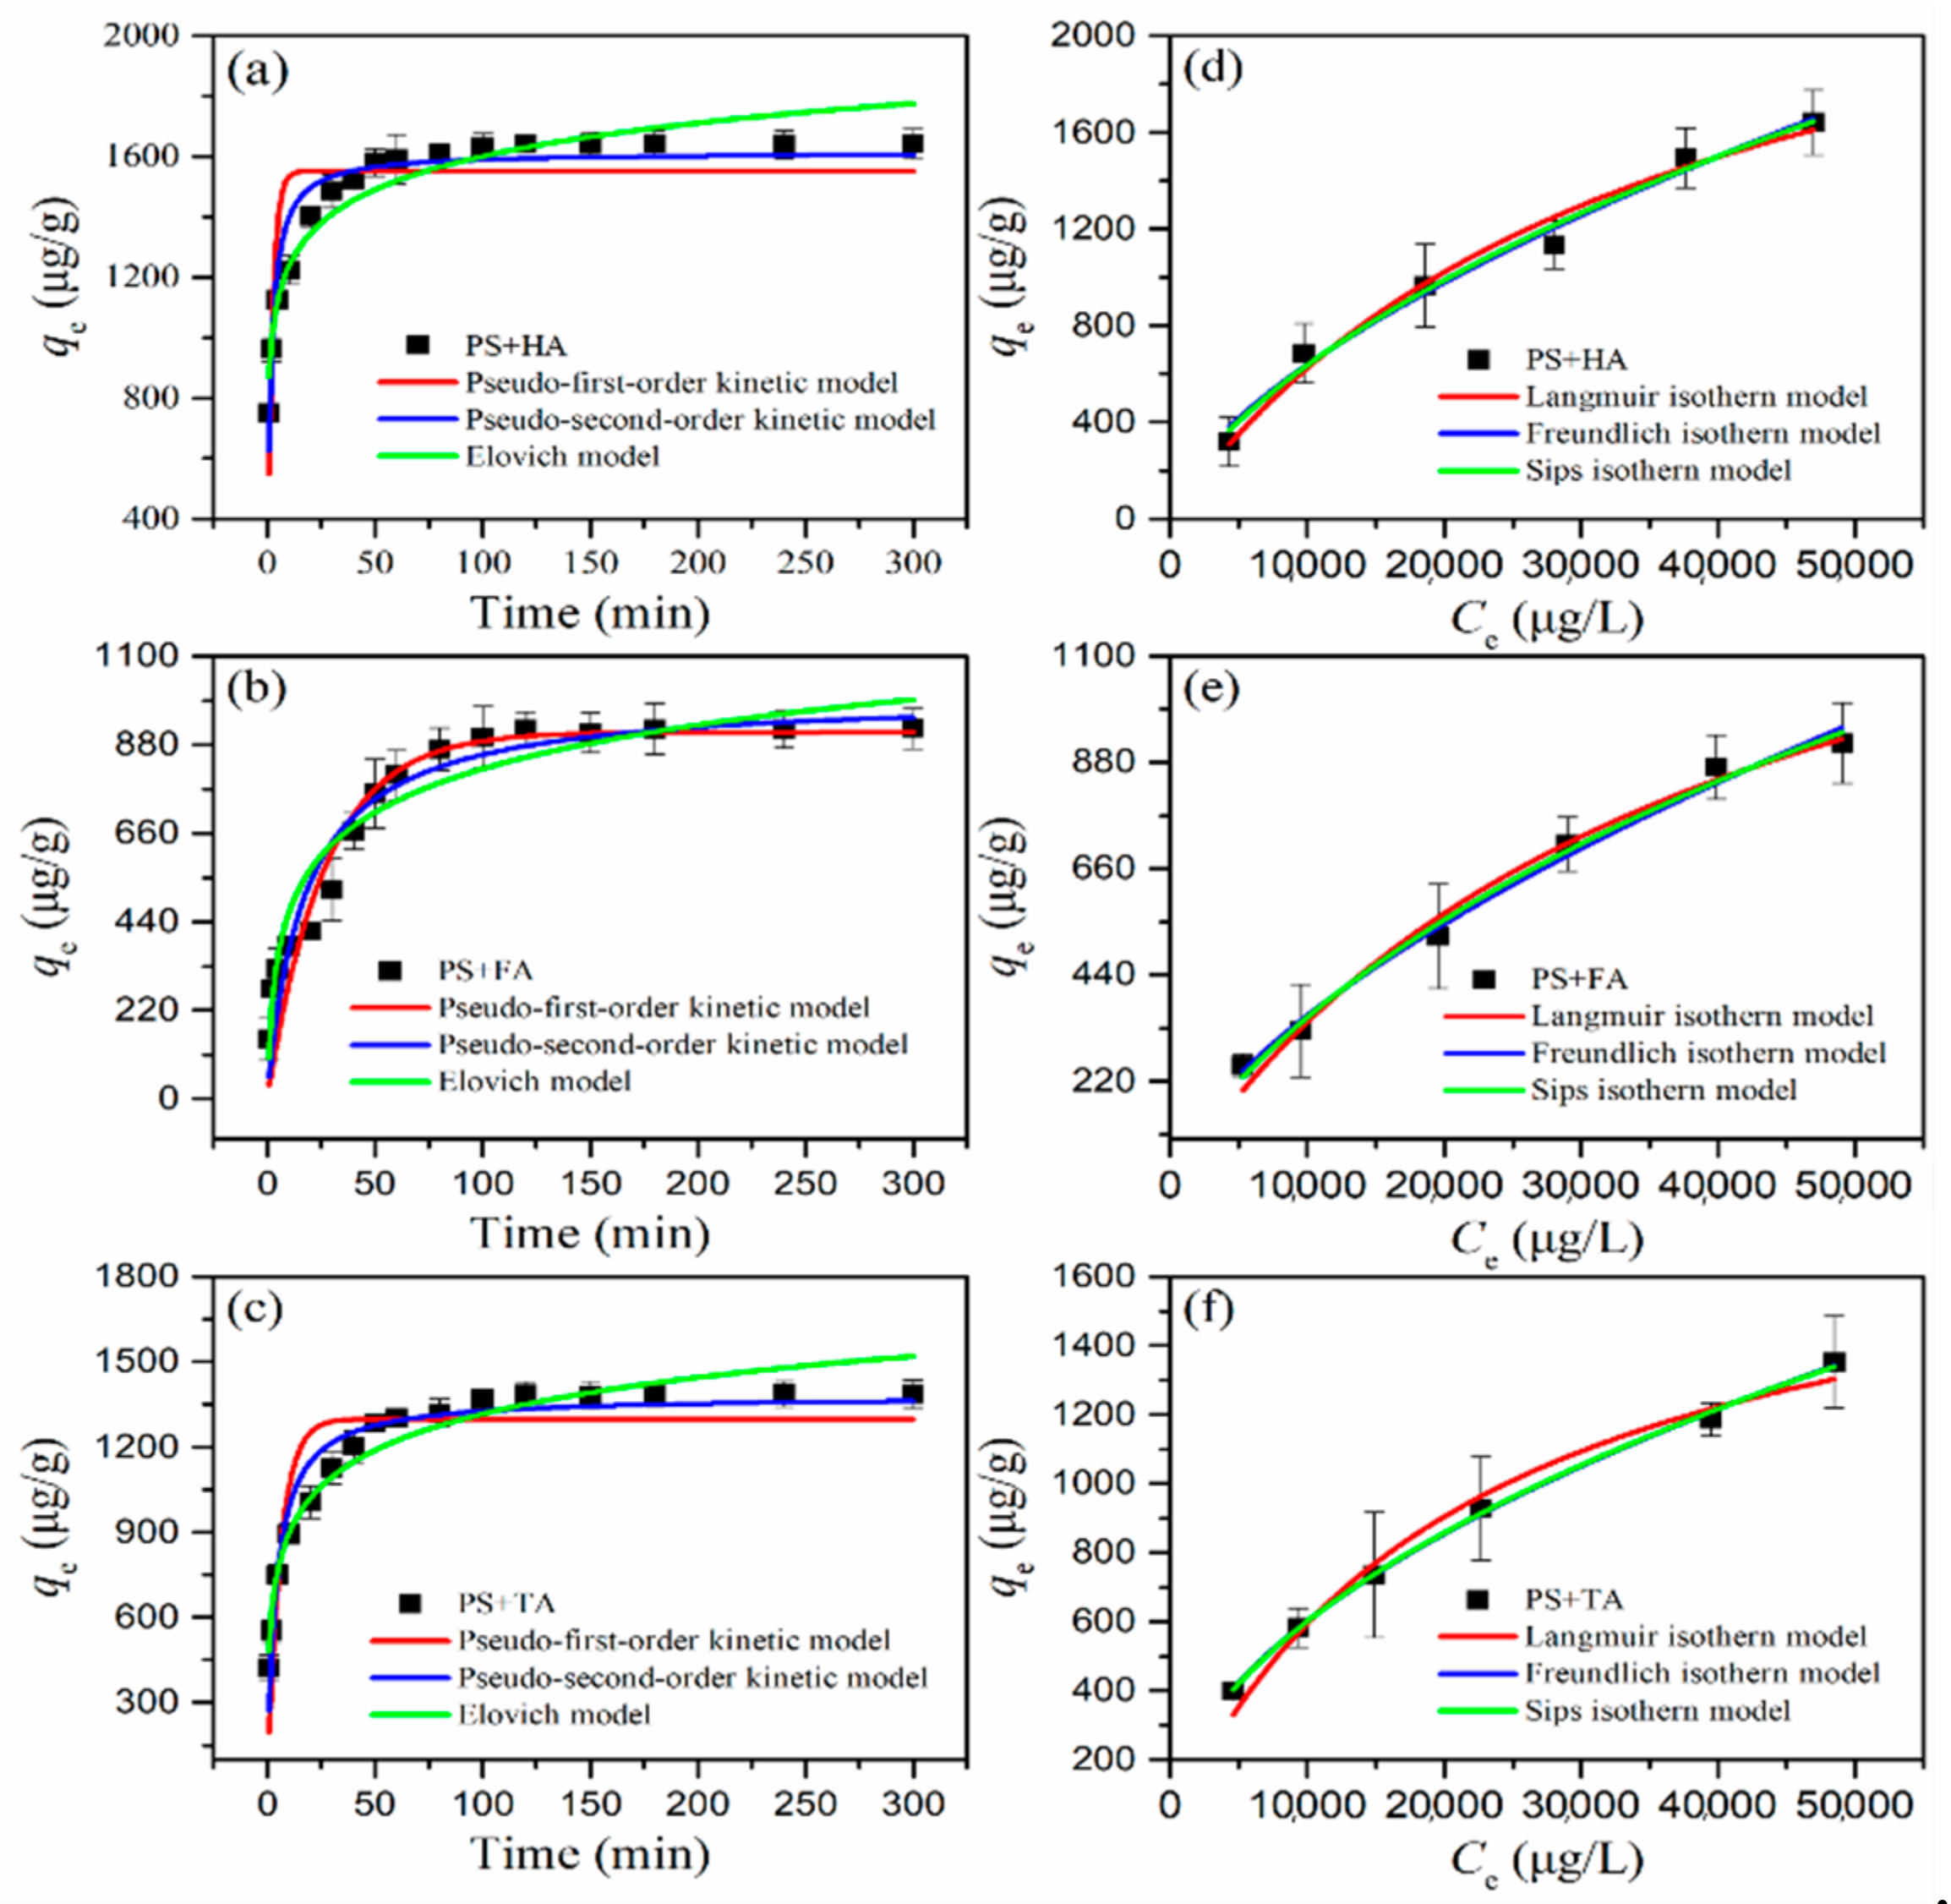
Figure 4a–c shows the adsorption kinetics of HA, FA, and TA on PS MPs, and PS MPs exhibit similar behaviors for them. From the whole adsorption process, the adsorption equilibrium of HA, FA, and TA on PS MPs was achieved within about 2 h. The adsorption process can be classified into three stages: rapid adsorption stage (the first 1 h), slow adsorption stage (the following 1 h), and the final equilibrium stage at 2 h. Furthermore, the adsorption capacity of HA on MPs was found to be greater than that of FA and TA, the adsorption amounts of HA, FA and TA onto PS MPs at equilibrium were 1614, 1003, and 1378 μg/g, respectively, which may be related to the species and structure of DOM.
In order to further research the adsorption kinetics process, the pseudo-first-order and pseudo-second-order and the Elovlich kinetic model were used to analyze the kinetic experimental data. The specific parameters are shown in Table 1. Under the experimental conditions, both the pseudo-second-order and the Elovlich kinetic model can be used to better fit the adsorption results of HA, FA, and TA onto PS MPs. The linear correlation coefficient R2 of their kinetic equations is greater than 0.9, and it is important that the pseudo-second-order saturable adsorption capacities qe,cal of HA, FA, and TA are close to the measured values qe,exp. The pseudo-second-order rate constants K2 of PS MPs to HA is greater than that for FA and TA, which indicates that HA has higher hydrophobicity than FA and TA [68], which is helpful for the adsorption capacity of PS MPs through hydrogen bonding [49]. In summary, the pseudo-second-order model refers to the valence potential formed by sharing or exchanging electrons in the form of covalent forces between the adsorbent and the adsorbate, and ion exchange, while the Elovlich model explains the chemisorption kinetics on heterogeneous surface adsorbents [72]. These results show that chemical adsorption plays an important role in the adsorption of HA, FA, and TA onto PS MPs, and the adsorption process is affected by many factors [73].
3.5. Adsorption Isotherms Analysis
Adsorption isotherms are usually used to show the distribution of contaminants in equilibrium between solid and liquid phases [74]. Figure 4d–f shows the adsorption isotherms under laboratory conditions. It was clear that the adsorption capacity of PS MPs with regard to HA, FA, and TA increased continuously until the maximum, as the concentration of contaminants was raised. In order to further study the adsorption isotherms process, the adsorption data were fitted by Freundlich, Langmuir, and Sips models and the related parameters were summarized in Table 2. In terms of the R2 values (>0.97), all three models had a good fit to the experimental data in the range of conditions tested. Since the adsorption process did not reach the saturation stage under the present experimental conditions and thus, it is not known if the selected isotherm model would accurately describe saturation conditions. According to the Freundlich model, the interaction between DOM and PS MPs was not only influenced by chemical adsorption, but also physical adsorption onto nonhomogeneous surfaces of PS MPs [75]. The Freundlich constant n indicated the binding affinity or nonuniformity of the surface of the adsorbate. The n values of Freundlich model were more than 1, indicating the adsorption was favorable for HA, FA, and TA, which meant that their adsorption could be enhanced with the increased amounts of DOM in the solution [75]. These results also implied a heterogeneous distribution of sorption sites energies [76]. The Sips model can also describe the adsorption equilibrium of PS MPs to DOMs, further indicating that PS MPs is heterogeneous [73].
3.6. Adsorption Site Energy Distribution Analysis
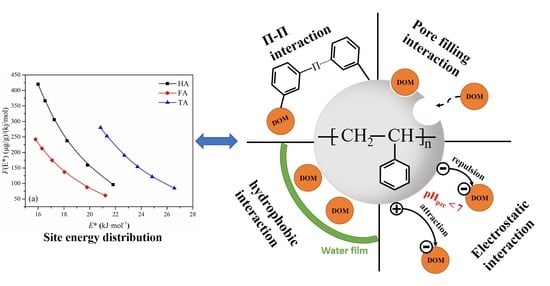
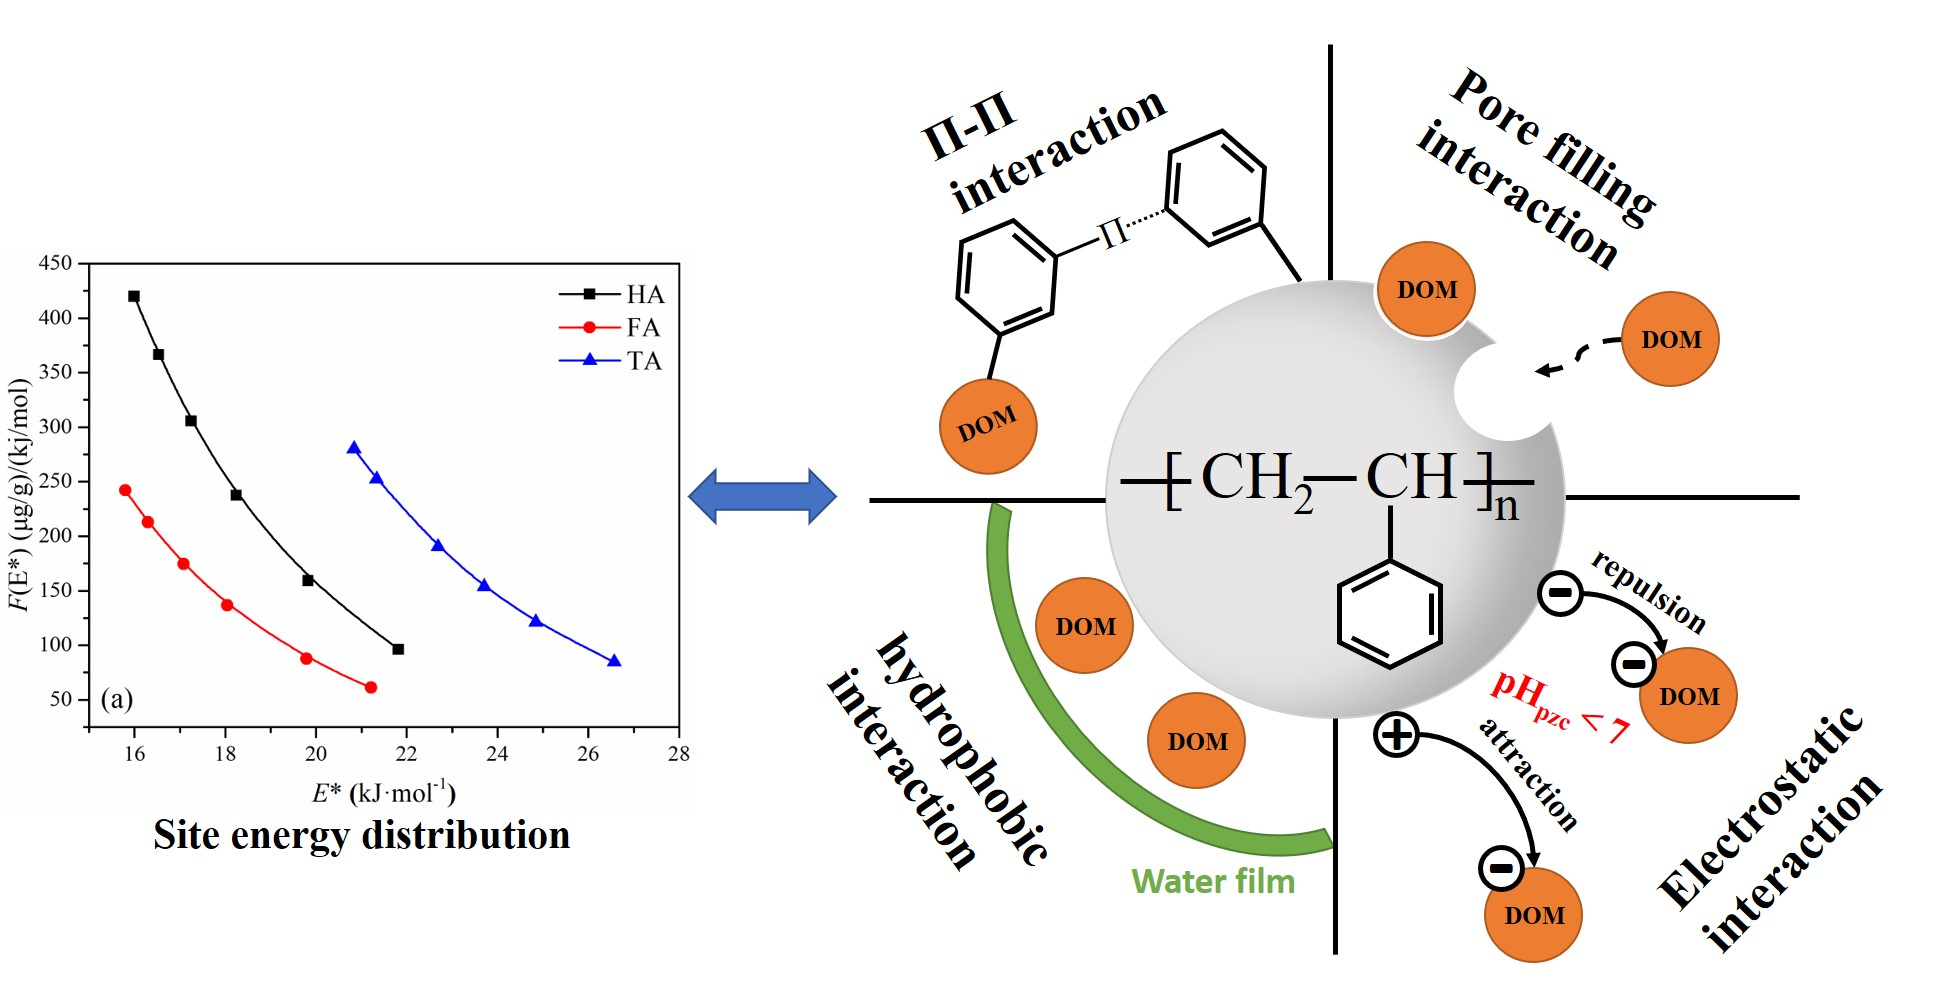
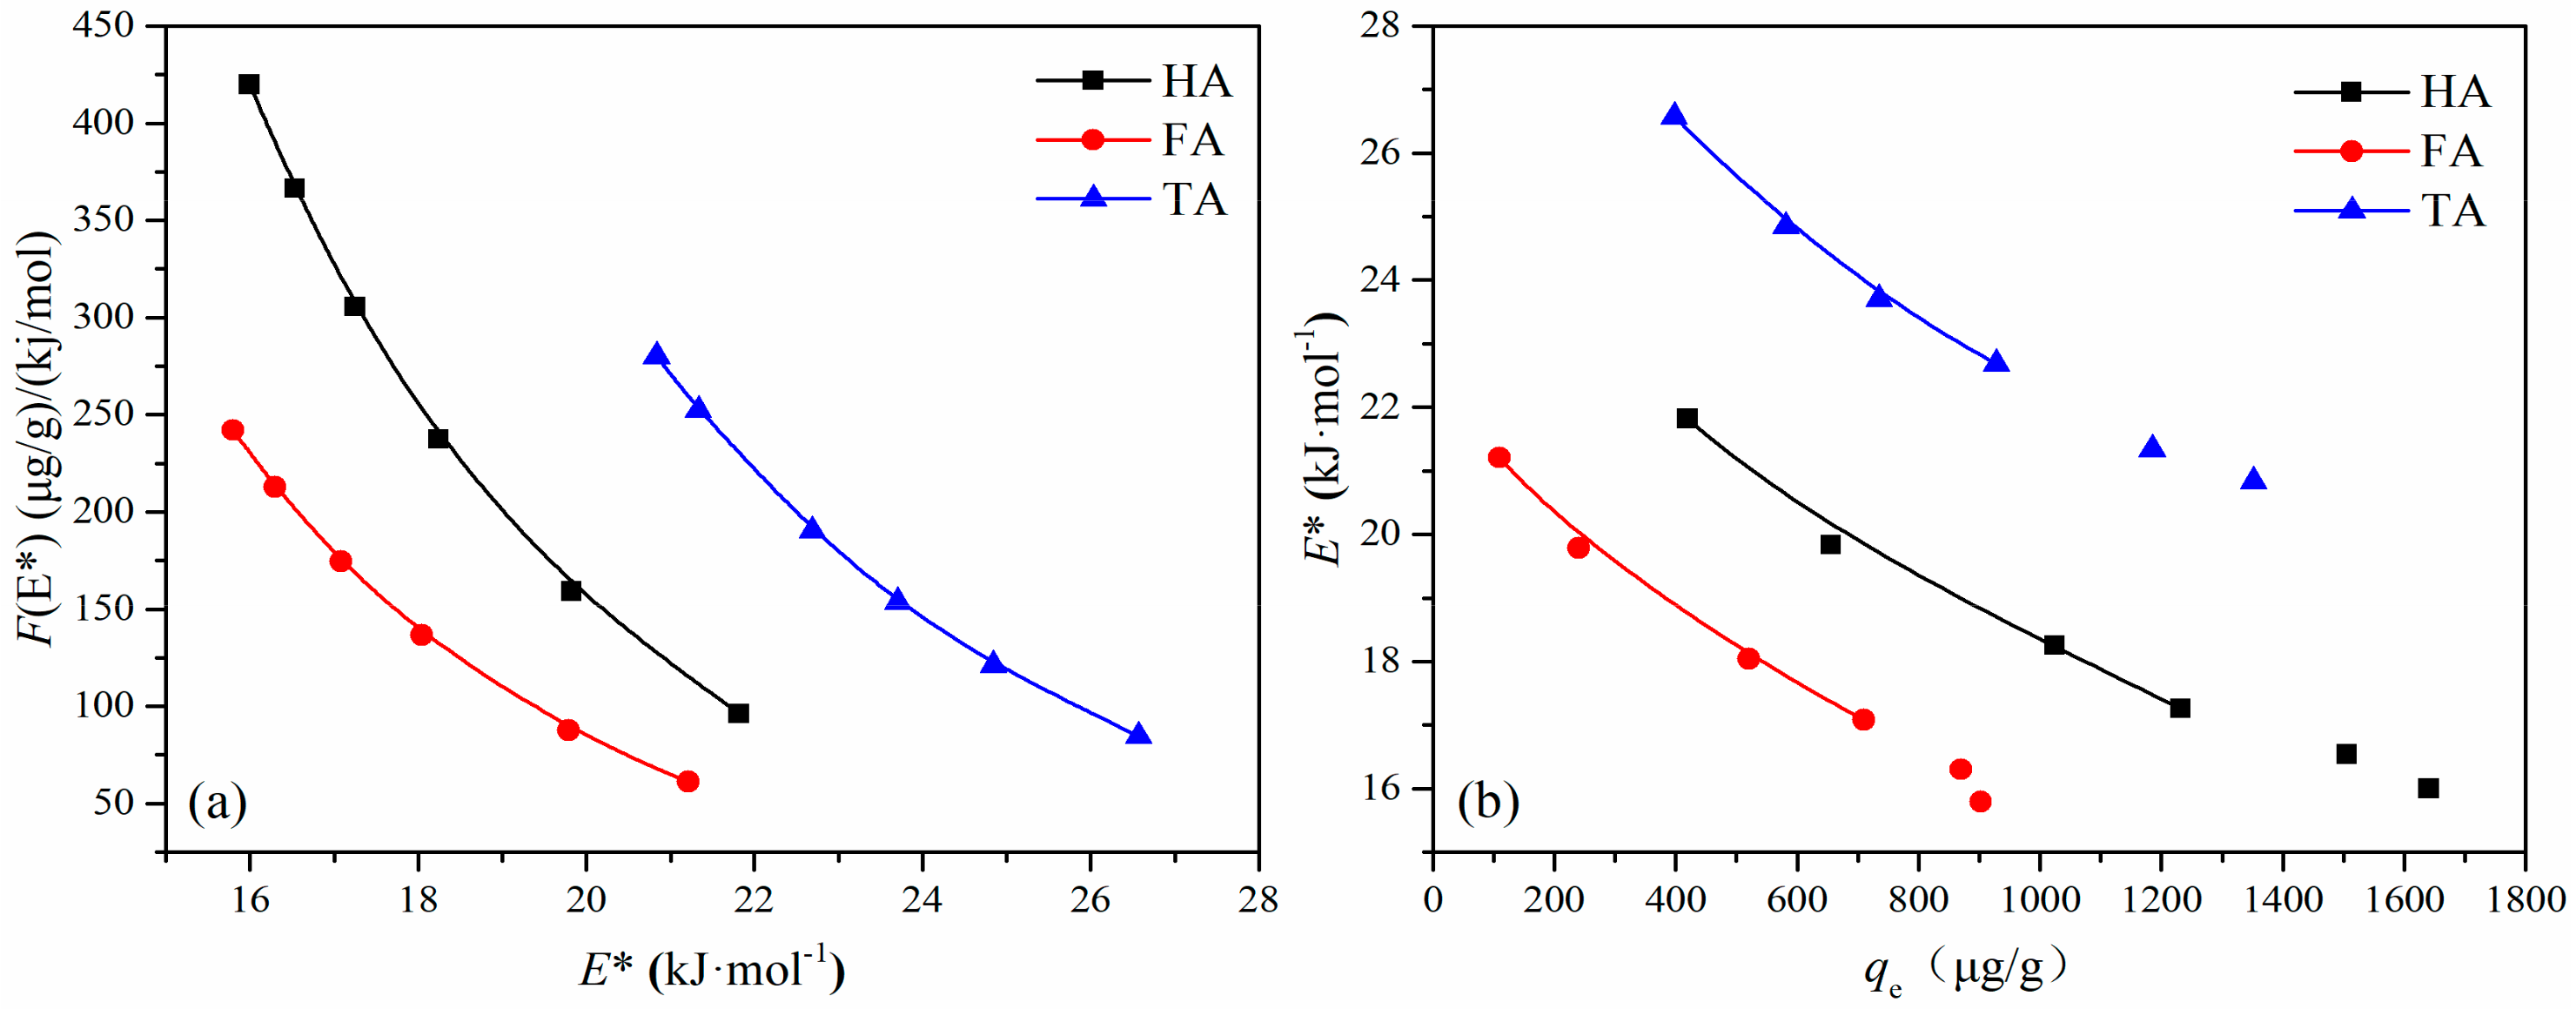
The adsorption site energy of HA, FA, and TA onto PS MPs was calculated by Freundlich isotherm, as shown in Figure 5. The site energy (E*) of HA, FA, and TA on PS MPs decreased with the increasing quantity of HA, FA, and TA, showing that high-energy adsorption sites on PS MPs were filled first by HA, FA, and TA, followed by low energy adsorption sites. This finding is consistent with DOM adsorption [68]. In order to explore the interface interaction of HA, FA, and Ta on PS, and to further elucidate the adsorption mechanism, the change of site energy distribution F (E*) was investigated. It is obvious that F (E*) of PS MPs is unimodal distribution. The results show that the value of F (E*) is negatively correlated with the value of E*, indicating that the high HA, FA, and TA concentrations may interact with the low energy adsorption sites of PS MPs, at low concentration of HA, FA, and TA, it is preferentially adsorbed on the high energy adsorption sites of PS MPs [59]. In a certain energy range, the area under the curves (Figure 5) can be regarded as the number of adsorption sites [77]. For F (E*), HA > TA > FA, therefore, the adsorption capacity of PS MPs to HA is greater than that of TA and FA. This is consistent with the adsorption results.
Under experimental conditions, the average site energy μ (E*) and the standard deviation (σe*) of HA, FA, and TA adsorbed by PSMPs are displayed in Table 3, and the values μ (E*) of HA, FA, and TA adsorbed by PS is 14.40, 13.98 and 17.72 kJ/mol, respectively. The weighted average value of site energy distribution can reflect the interaction affinity between adsorbent and adsorbent. However, the μ (E*) of PS MPs adsorbed TA was the highest, but the adsorption amount was slightly lower than that of HA. On the one hand, the adsorption behavior may be affected by the surface morphology effect [78], however, on the other hand, compared with HA and FA, the adsorption advantage of TA may be mainly in the very high energy area (e.g., >22 kJ/mol), while in the high to middle energy area (17–22 kJ/mol), HA has more adsorption sites than TA. The surface of PS MPs is nonuniform and mainly distributed in the high to middle energy area. The result is that the affinity of the strong DOM may show weak adsorption in some energy regions [79].
4. Conclusions
The present study demonstrated that different DOM (HA, FA, and TA) had different binding abilities to MPs and were influenced by environmental factors. HA exhibited higher adsorption capacity onto PS than that of FA and TA, owing to the stronger hydrophobic effect of HA and the charge characteristics at different pH values. It was found that the adsorption of DOM onto PS MPs was highly pH-dependent, which was mainly due to the electrostatic effect. With the increase of pH value, the adsorption capacity of HA and FA decreased gradually, while TA adsorption increased first and then decreased. In addition, the presence of cations, especially Ca2+, enhanced the adsorption capacity significantly. The adsorption data of HA, FA, and TA on PS MPs fitted well with the pseudo-second-order kinetic model and the Freundlich model. Based on the Freundlich model, the site energy distributions were measured under the present experimental conditions. Before diffusing to the low energy adsorption sites, HA, FA, and TA first occupied high energy adsorption sites of PS MPs. However, the adsorption amount of TA with higher affinity was lower than HA due to the adsorption advantage of TA in the high energy area, while HA had more adsorption sites in the high energy area. The binding affinity of DOM to PS MPs was mainly ascribed to aromatic, hydrophobic interactions. These findings can provide a better understanding of the interaction between DOM and PS MPs, thus aiding in assessing the environmental risks of MPs.
Supplementary Materials
Author Contributions
Conceptualization, J.L. and W.W.; methodology, W.W.; software, J.L. and S.M.; validation, J.L., S.M., X.L., and W.W.; formal analysis, W.W.; investigation, X.L.; resources, W.W.; data curation, W.W.; writing—original draft preparation, J.L.; writing—review and editing, W.W.; visualization, S.M.; supervision, X.L. and W.W.; project administration, W.W. All authors have read and agreed to the published version of the manuscript.
Funding
This work was sponsored by the National Natural Science Foundation of China (No. 41931292), Guangdong Provincial Key Laboratory of Soil and Groundwater Pollution Control (No. 2017B030301012), the Foundation for Talent Recommendation Program of Nanjing Normal University (2011105XGQ0247), and PAPD (a project funded by the Priority Academic Program Development of Jiangsu Higher Education Institutions, No. 164320H101).
Institutional Review Board Statement
Not applicable.
Informed Consent Statement
Not applicable.
Data Availability Statement
Not applicable.
Conflicts of Interest
The authors declare no conflict of interest.
References
- Zhang, Q.; Xu, E.G.; Li, J.; Chen, Q.; Ma, L.; Zeng, E.Y.; Shi, H. A review of microplastics in table salt, drinking water, and air: Direct human exposure. Environ. Sci. Technol. 2020, 54, 3740–3751. [Google Scholar] [CrossRef] [PubMed]
- Okoffo, E.D.; Donner, E.; McGrath, S.P.; Tscharke, B.J.; O’Brien, J.W.; O’Brien, S.; Ribeiro, F.; Burrows, S.D.; Toapanta, T.; Rauert, C.; et al. Plastics in biosolids from 1950 to 2016: A function of global plastic production and consumption. Water Res. 2021, 201, 117367. [Google Scholar] [CrossRef] [PubMed]
- Plastics Europe. Plastics: The Facts. Brussels, Belgium: Plastics Europe. 2021. Available online: https://plasticseurope.org/wp-content/uploads/2021/12/Plastics-the-Facts-2021-web-final.pdf (accessed on 8 July 2022).
- Meyers, N.; Catarino, A.I.; Declercq, A.M.; Brenan, A.; Devriese, L.; Vandegehuchte, M.; De Witte, B.; Janssen, C.; Everaert, G. Microplastic detection and identification by Nile red staining: Towards a semi-automated, cost- and time-effective technique. Sci. Total Environ. 2022, 823, 153441. [Google Scholar] [CrossRef] [PubMed]
- Lebreton, L.; Andrady, A. Future scenarios of global plastic waste generation and disposal. Palgrave Commun. 2019, 5, 6. [Google Scholar] [CrossRef] [Green Version]
- Plastic Waste Statistics. 2022. Available online: https://seedscientific.com/plastic-waste-statistics/ (accessed on 8 July 2022).
- Zhang, K.; Hamidian, A.H.; Tubic, A.; Zhang, Y.; Fang, J.K.H.; Wu, C.; Lam, P.K.S. Understanding plastic degradation and microplastic formation in the environment: A review. Environ. Pollut. 2021, 274, 116554. [Google Scholar] [CrossRef]
- Zhou, Y.; Yang, Y.; Liu, G.; He, G.; Liu, W. Adsorption mechanism of cadmium on microplastics and their desorption behavior in sediment and gut environments: The roles of water pH, lead ions, natural organic matter and phenanthrene. Water Res. 2020, 184, 116209. [Google Scholar] [CrossRef]
- Rillig, M.C.; de Souza Machado, A.A.; Lehmann, A.; Klumper, U. Evolutionary implications of microplastics for soil biota. Environ. Chem. 2019, 16, 3–7. [Google Scholar] [CrossRef] [Green Version]
- de Souza Machado, A.A.; Kloas, W.; Zarfl, C.; Hempel, S.; Rillig, M.C. Microplastics as an emerging threat to terrestrial ecosystems. Glob. Chang. Biol. 2018, 24, 1405–1416. [Google Scholar] [CrossRef] [Green Version]
- Galloway, T.S.; Lewis, C.N. Marine microplastics spell big problems for future generations. Proc. Natl. Acad. Sci. USA 2016, 113, 2331–2333. [Google Scholar] [CrossRef] [Green Version]
- Alimi, O.S.; Farner Budarz, J.; Hernandez, L.M.; Tufenkji, N. Microplastics and nanoplastics in aquatic environments: Aggregation, deposition, and enhanced contaminant transport. Environ. Sci. Technol. 2018, 52, 1704–1724. [Google Scholar] [CrossRef]
- de Souza Machado, A.A.; Lau, C.W.; Kloas, W.; Bergmann, J.; Bachelier, J.B.; Faltin, E.; Becker, R.; Görlich, A.S.; Rillig, M.C. Microplastics can change soil properties and affect plant performance. Environ. Sci. Technol. 2019, 53, 6044–6052. [Google Scholar] [CrossRef] [PubMed] [Green Version]
- Pannetier, P.; Morin, B.; Le Bihanic, F.; Dubreil, L.; Clerandeau, C.; Chouvellon, F.; Van Arkel, K.; Danion, M.; Cachot, J. Environmental samples of microplastics induce significant toxic effects in fish larvae. Environ. Int. 2020, 134, 105047. [Google Scholar] [CrossRef]
- Gu, L.; Tian, L.; Gao, G.; Peng, S.; Zhang, J.; Wu, D.; Huang, J.; Hua, Q.; Lu, T.; Zhong, L.; et al. Inhibitory effects of polystyrene microplastics on caudal fin regeneration in zebrafish larvae. Environ. Pollut. 2020, 266, 114664. [Google Scholar] [CrossRef] [PubMed]
- Huang, W.; Song, B.; Liang, J.; Niu, Q.; Zeng, G.; Shen, M.; Deng, J.; Luo, Y.; Wen, X.; Zhang, Y. Microplastics and associated contaminants in the aquatic environment: A review on their ecotoxicological effects, trophic transfer, and potential impacts to human health. J. Hazard. Mater. 2021, 405, 124187. [Google Scholar] [CrossRef] [PubMed]
- Okeke, E.S.; Okoye, C.O.; Atakpa, E.O.; Ita, R.E.; Nyaruaba, R.; Mgbechidinma, C.L.; Akan, O.D. Microplastics in agroecosystems-impacts on ecosystem functions and food chain. Resour. Conserv. Recycl. 2022, 177, 105961. [Google Scholar] [CrossRef]
- Munoz, M.; Ortiz, D.; Nieto-Sandoval, J.; de Pedro, Z.M.; Casas, J.A. Adsorption of micropollutants onto realistic microplastics: Role of microplastic nature, size, age, and NOM fouling. Chemosphere 2021, 283, 131085. [Google Scholar] [CrossRef] [PubMed]
- Huang, Y.; Ding, J.; Zhang, G.; Liu, S.; Zou, H.; Wang, Z.; Zhu, W.; Geng, J. Interactive effects of microplastics and selected pharmaceuticals on red tilapia: Role of microplastic aging. Sci. Total Environ. 2021, 752, 142256. [Google Scholar] [CrossRef]
- Yu, Y.; Mo, W.Y.; Luukkonen, T. Adsorption behaviour and interaction of organic micropollutants with nano and microplastics-A review. Sci. Total Environ. 2021, 797, 149140. [Google Scholar] [CrossRef]
- Wang, Y.; Li, Y.; Zhang, Y.; Wei, W. Effects of macromolecular humic/fulvic acid on Cd (II) adsorption onto reed-derived biochar as compared with tannic acid. Int. J. Biol. Macromol. 2019, 134, 43–55. [Google Scholar] [CrossRef]
- Chen, C.-S.; Le, C.; Chiu, M.-H.; Chin, W.-C. The impact of nanoplastics on marine dissolved organic matter assembly. Sci. Total Environ. 2018, 634, 316–320. [Google Scholar] [CrossRef]
- Kinigopoulou, V.; Pashalidis, I.; Kalderis, D.; Anastopoulos, I. Microplastics as carriers of inorganic and organic contaminants in the environment: A review of recent progress. J. Mol. Liq. 2022, 350, 118580. [Google Scholar] [CrossRef]
- Caruso, G. Microplastics as vectors of contaminants. Mar. Pollut. Bull. 2019, 146, 921–924. [Google Scholar] [CrossRef] [PubMed]
- Hakim, A.; Kobayashi, M. Aggregation and aggregate strength of microscale plastic particles in the presence of natural organic matter: Effects of ionic valence. J. Polym. Environ. 2021, 29, 1921–1929. [Google Scholar] [CrossRef]
- Corinaldesi, C.; Canensi, S.; Carugati, L.; Lo Martire, M.; Marcellini, F.; Nepote, E.; Sabbatini, S.; Danovaro, R. Organic enrichment can increase the impact of microplastics on meiofaunal assemblages in tropical beach systems. Environ. Pollut. 2022, 292, 118415. [Google Scholar] [CrossRef] [PubMed]
- Chen, W.; Ouyang, Z.-Y.; Qian, C.; Yu, H.-Q. Induced structural changes of humic acid by exposure of polystyrene microplastics: A spectroscopic insight. Environ. Pollut. 2018, 233, 1–7. [Google Scholar] [CrossRef]
- Qiao, R.; Lu, K.; Deng, Y.; Ren, H.; Zhang, Y. Combined effects of polystyrene microplastics and natural organic matter on the accumulation and toxicity of copper in zebrafish. Sci. Total Environ. 2019, 682, 128–137. [Google Scholar] [CrossRef]
- Dong, Y.; Gao, M.; Song, Z.; Qiu, W. As(III) adsorption onto different-sized polystyrene microplastic particles and its mechanism. Chemosphere 2020, 239, 124792. [Google Scholar] [CrossRef]
- Sighicelli, M.; Pietrelli, L.; Lecce, F.; Iannilli, V.; Falconieri, M.; Coscia, L.; Di Vito, S.; Nuglio, S.; Zampetti, G. Microplastic pollution in the surface waters of Italian Subalpine Lakes. Environ. Pollut. 2018, 236, 645–651. [Google Scholar] [CrossRef]
- Kukkola, A.; Krause, S.; Lynch, I.; Sambrook Smith, G.H.; Nel, H. Nano and microplastic interactions with freshwater biota–Current knowledge, challenges and future solutions. Environ. Int. 2021, 152, 106504. [Google Scholar] [CrossRef]
- Lu, S.; Zhu, K.; Song, W.; Song, G.; Chen, D.; Hayat, T.; Alharbi, N.S.; Chen, C.; Sun, Y. Impact of water chemistry on surface charge and aggregation of polystyrene microspheres suspensions. Sci. Total Environ. 2018, 630, 951–959. [Google Scholar] [CrossRef]
- Zhang, F.; Wang, Z.; Wang, S.; Fang, H.; Wang, D. Aquatic behavior and toxicity of polystyrene nanoplastic particles with different functional groups: Complex roles of pH, dissolved organic carbon and divalent cations. Chemosphere 2019, 228, 195–203. [Google Scholar] [CrossRef] [PubMed]
- Fu, L.; Li, J.; Wang, G.; Luan, Y.; Dai, W. Adsorption behavior of organic pollutants on microplastics. Ecotox. Environ. Saf. 2021, 217, 112207. [Google Scholar] [CrossRef] [PubMed]
- Lagergren, S.K. About the theory of so-called adsorption of soluble substances. Kung Svenska Vetenskap 1898, 24, 1–39. [Google Scholar]
- Ho, Y.S.; McKay, G. Pseudo-second order model for sorption processes. Process. Biochem. 1999, 34, 451–465. [Google Scholar] [CrossRef]
- Wu, F.C.; Tseng, R.L.; Juang, R.S. Characteristics of Elovich equation used for the analysis of adsorption kinetics in dye-chitosan systems. Chem. Eng. J. 2009, 150, 366–373. [Google Scholar] [CrossRef]
- Langmuir, I. The adsorption of gases on plane surfaces of glass, mica and platinum. J. Am. Chem. Soc. 1916, 40, 1361–1368. [Google Scholar]
- Freundlich, H.M.F. Over the adsorption in solution. Z. Phys. Chem. 1906, A57, 358–471. [Google Scholar]
- Sips, R. On the structure of a catalyst surface. J. Chem. Phys. 1948, 16, 490–495. [Google Scholar] [CrossRef]
- Carter, M.C.; Kilduff, J.E.; Weber, W.J. Site energy distribution analysis of preloaded adsorbents. Environ. Sci. Technol. 1995, 29, 1773–1780. [Google Scholar] [CrossRef]
- Cerofolini, G.F. Localized adsorption on heterogeneous surfaces. Thin Solid Film. 1974, 23, 129–152. [Google Scholar] [CrossRef]
- Lang, M.; Yu, X.; Liu, J.; Xia, T.; Wang, T.; Jia, H.; Guo, X. Fenton aging significantly affects the heavy metal adsorption capacity of polystyrene microplastics. Sci. Total Environ. 2020, 722, 137762. [Google Scholar] [CrossRef]
- Ding, L.; Mao, R.; Ma, S.; Guo, X.; Zhu, L. High temperature depended on the ageing mechanism of microplastics under different environmental conditions and its effect on the distribution of organic pollutants. Water Res. 2020, 174, 115634. [Google Scholar] [CrossRef] [PubMed]
- Dong, Y.; Gao, M.; Qiu, W.; Song, Z. Adsorption of arsenite to polystyrene microplastics in the presence of humus. Environ. Sci. Proc. Imp. 2020, 22, 2388–2397. [Google Scholar] [CrossRef] [PubMed]
- Nel, H.A.; Chetwynd, A.J.; Kelly, C.A.; Stark, C.; Valsami-Jones, E.; Krause, S.; Lynch, I. An untargeted thermogravimetric analysis-fourier transform infrared-gas chromatography-mass spectrometry approach for plastic polymer identification. Environ. Sci. Technol. 2021, 55, 8721–8729. [Google Scholar] [CrossRef]
- Yao, Y.; Mi, N.; He, C.; He, H.; Zhang, Y.; Zhang, Y.; Yin, L.; Li, J.; Yang, S.; Li, S.; et al. Humic acid modified nano-ferrous sulfide enhances the removal efficiency of Cr(VI). Sep. Purif. Technol. 2020, 240, 116623. [Google Scholar] [CrossRef]
- Yang, R.; Li, Z.; Huang, M.; Luo, N.; Wen, J.; Zeng, G. Characteristics of fulvic acid during coprecipitation and adsorption to iron oxides-copper aqueous system. J. Mol. Liq. 2019, 274, 664–672. [Google Scholar] [CrossRef]
- Ding, L.; Luo, Y.; Yu, X.; Ouyang, Z.; Liu, P.; Guo, X. Insight into interactions of polystyrene microplastics with different types and compositions of dissolved organic matter. Sci. Total Environ. 2022, 824, 153883. [Google Scholar] [CrossRef]
- Yin, L.; Mi, N.; Yao, Y.-R.; Li, J.; Zhang, Y.; Yang, S.-g.; He, H.; Hu, X.; Li, S.-Y.; Ni, L.-X. Efficient removal of Cr(VI) by tannic acid-modified FeS nanoparticles: Performance and mechanisms. Water Sci. Eng. 2021, 14, 210–218. [Google Scholar] [CrossRef]
- Zhu, B.; Zhang, Z.; Song, F.; Guo, Z.; Liu, B. Efficient removal of U(VI) ions from aqueous solutions by tannic acid/graphene oxide composites. Appl. Sci. 2020, 10, 8870. [Google Scholar] [CrossRef]
- Schmidt, P.; Dybal, J.; Trchová, M. Investigations of the hydrophobic and hydrophilic interactions in polymer–water systems by ATR FTIR and Raman spectroscopy. Vibrat. Spectr. 2006, 42, 278–283. [Google Scholar] [CrossRef]
- Dong, Y.; Gao, M.; Liu, X.; Qiu, W.; Song, Z. The mechanism of polystyrene microplastics to affect arsenic volatilization in arsenic-contaminated paddy soils. J. Hazard. Mater. 2020, 398, 122896. [Google Scholar] [CrossRef] [PubMed]
- Jayalath, S.; Wu, H.; Larsen, S.C.; Grassian, V.H. Surface adsorption of suwannee river humic acid on tio2 nanoparticles: A study of pH and particle size. Langmuir 2018, 34, 3136–3145. [Google Scholar] [CrossRef]
- Zhang, C.; Wei, S.; Hu, Y.; Tang, H.; Gao, J.; Yin, Z.; Guan, Q. Selective adsorption of tannic acid on calcite and implications for separation of fluorite minerals. J. Colloid Interf. Sci. 2018, 512, 55–63. [Google Scholar] [CrossRef] [PubMed]
- Huang, D.; Xu, Y.; Yu, X.; Ouyang, Z.; Guo, X. Effect of cadmium on the sorption of tylosin by polystyrene microplastics. Ecotox. Environ. Saf. 2021, 207, 111255. [Google Scholar] [CrossRef] [PubMed]
- Wei, W.; Yang, L.; Zhong, W.; Cui, J.; Wei, Z. Poorly crystalline hydroxyapatite: A novel adsorbent for enhanced fulvic acid removal from aqueous solution. Appl. Surface Sci. 2015, 332, 328–339. [Google Scholar] [CrossRef]
- Doulia, D.; Leodopoulos, C.; Gimouhopoulos, K.; Rigas, F. Adsorption of humic acid on acid-activated Greek bentonite. J. Colloid Interf. Sci. 2009, 340, 131–141. [Google Scholar] [CrossRef]
- Tang, S.; Lin, L.; Wang, X.; Sun, X.; Yu, A. Adsorption of fulvic acid onto polyamide 6 microplastics: Influencing factors, kinetics modeling, site energy distribution and interaction mechanisms. Chemosphere 2021, 272, 129638. [Google Scholar] [CrossRef]
- Wang, J.; Zheng, S.; Liu, J.; Xu, Z. Tannic acid adsorption on amino-functionalized magnetic mesoporous silica. Chem. Eng. J. 2010, 165, 10–16. [Google Scholar] [CrossRef]
- Yang, K.; Xing, B. Adsorption of fulvic acid by carbon nanotubes from water. Environ. Pollut. 2009, 157, 1095–1100. [Google Scholar] [CrossRef]
- Islam, M.A.; Morton, D.W.; Johnson, B.B.; Angove, M.J. Adsorption of humic and fulvic acids onto a range of adsorbents in aqueous systems, and their effect on the adsorption of other species: A review. Sep. Purif. Technol. 2020, 247, 116949. [Google Scholar] [CrossRef]
- Sun, C.; Xiong, B.; Pan, Y.; Cui, H. Adsorption removal of tannic acid from aqueous solution by polyaniline: Analysis of operating parameters and mechanism. J. Colloid Interf. Sci. 2017, 487, 175–181. [Google Scholar] [CrossRef]
- Wei, W.; Li, J.; Han, X.; Yao, Y.; Zhao, W.; Han, R.; Li, S.; Zhang, Y.; Zheng, C. Insights into the adsorption mechanism of tannic acid by a green synthesized nano-hydroxyapatite and its effect on aqueous Cu(II) removal. Sci. Total Environ. 2021, 778, 146189. [Google Scholar] [CrossRef] [PubMed]
- Brigante, M.; Zanini, G.; Avena, M. Effect of pH, anions and cations on the dissolution kinetics of humic acid particles. Colloids Surf. A Physicochem. Eng. Asp. 2009, 347, 180–186. [Google Scholar] [CrossRef]
- Capasso, S.; Salvestrini, S.; Coppola, E.; Buondonno, A.; Colella, C. Sorption of humic acid on zeolitic tuff: A preliminary investigation. Appl. Clay Sci. 2005, 28, 159–165. [Google Scholar] [CrossRef]
- Engel, M.; Chefetz, B. Adsorption and desorption of dissolved organic matter by carbon nanotubes: Effects of solution chemistry. Environ. Pollut. 2016, 213, 90–98. [Google Scholar] [CrossRef] [PubMed]
- Abdurahman, A.; Cui, K.; Wu, J.; Li, S.; Gao, R.; Dai, J.; Liang, W.; Zeng, F. Adsorption of dissolved organic matter (DOM) on polystyrene microplastics in aquatic environments: Kinetic, isotherm and site energy distribution analysis. Ecotox. Environ. Saf. 2020, 198, 110658. [Google Scholar] [CrossRef]
- Li, S.C.; Liu, H.; Gao, R.; Abdurahman, A.; Dai, J.; Zeng, F. Aggregation kinetics of microplastics in aquatic environment: Complex roles of electrolytes, pH, and natural organic matter. Environ. Pollut. 2018, 237, 126–132. [Google Scholar] [CrossRef]
- Hyung, H.; Kim, J.-H. Natural organic matter (NOM) adsorption to multi-walled carbon nanotubes: Effect of nom characteristics and water quality parameters. Environ. Sci. Technol. 2008, 42, 4416–4421. [Google Scholar] [CrossRef]
- Liang, L.; Luo, L.; Zhang, S. Adsorption and desorption of humic and fulvic acids on SiO2 particles at nano- and micro-scales. Colloids Surf. A Physicochem. Eng. Aspects. 2011, 384, 126–130. [Google Scholar] [CrossRef]
- Fan, S.; Wang, Y.; Li, Y.; Tang, J.; Wang, Z.; Tang, J.; Li, X.; Hu, K. Facile synthesis of tea waste/Fe3O4 nanoparticle composite for hexavalent chromium removal from aqueous solution. RSC Adv. 2017, 7, 7576–7590. [Google Scholar] [CrossRef] [Green Version]
- Yang, S.; Zhao, F.; Sang, Q.; Zhang, Y.; Chang, L.; Huang, D.; Mu, B. Investigation of 3-aminopropyltriethoxysilane modifying attapulgite for Congo red removal: Mechanisms and site energy distribution. Powder Technol. 2021, 383, 74–83. [Google Scholar] [CrossRef]
- Wang, T.; Yu, C.; Chu, Q.; Wang, F.; Lan, T.; Wang, J. Adsorption behavior and mechanism of five pesticides on microplastics from agricultural polyethylene films. Chemosphere 2020, 244, 125491. [Google Scholar] [CrossRef] [PubMed]
- Wu, P.; Cai, Z.; Jin, H.; Tang, Y. Adsorption mechanisms of five bisphenol analogues on PVC microplastics. Sci. Total Environ. 2019, 650, 671–678. [Google Scholar] [CrossRef] [PubMed]
- Zhang, J.; Chen, H.; He, H.; Cheng, X.; Ma, T.; Hu, J.; Yang, S.; Li, S.; Zhang, L. Adsorption behavior and mechanism of 9-Nitroanthracene on typical microplastics in aqueous solutions. Chemosphere 2020, 245, 125628. [Google Scholar] [CrossRef] [PubMed]
- Shen, X.; Guo, X.; Zhang, M.; Tao, S.; Wang, X. Sorption Mechanisms of Organic Compounds by Carbonaceous Materials: Site Energy Distribution Consideration. Environ. Sci. Technol. 2015, 49, 4894–4902. [Google Scholar] [CrossRef] [PubMed]
- Kim, T.-K.; Jang, M.; Hwang, Y.S. Adsorption of benzalkonium chlorides onto polyethylene microplastics: Mechanism and toxicity evaluation. J. Hazard. Mater. 2022, 426, 128076. [Google Scholar] [CrossRef] [PubMed]
- Huang, L.; Jin, Q.; Tandon, P.; Li, A.; Shan, A.; Du, J. High-resolution insight into the competitive adsorption of heavy metals on natural sediment by site energy distribution. Chemosphere 2018, 197, 411–419. [Google Scholar] [CrossRef]
Figure 1.
SEM images of PS MPs before (a–c) and after adsorption of HA (d), FA (e), and TA (f).

Figure 2.
FTIR spectra (a) and Zeta potentials (b) of PS MPs before and after adsorption of HA, FA, and TA.
Figure 2.
FTIR spectra (a) and Zeta potentials (b) of PS MPs before and after adsorption of HA, FA, and TA.

Figure 3.
Effect of pH (a) and ionic strength (b) on adsorption of HA, FA, and TA by PS MPs.

Figure 4.
Adsorption kinetics (a–c) and isotherms (d–f) of HA (a,d), FA (b,e), and TA (c,f) onto PS MPs.
Figure 4.
Adsorption kinetics (a–c) and isotherms (d–f) of HA (a,d), FA (b,e), and TA (c,f) onto PS MPs.

Figure 5.
Site energy distributions (a) and site energy (b) of HA, FA, and TA adsorption onto PS MPs.
Figure 5.
Site energy distributions (a) and site energy (b) of HA, FA, and TA adsorption onto PS MPs.


Table 1.
Parameters of three kinetic models for adsorption of HA, FA, and TA by PS MPs.
| Systems | qe, Exp (μg/g) | Pseudo-First-Order Model | Pseudo-Second-Order Model | Elovich Model | ||||||
|---|---|---|---|---|---|---|---|---|---|---|
| qe, Cal (μg/g) | k1 (1/min) | R2 | qe, Cal (μg/g) | k2 (g/(μg·min)) | R2 | α (g/μg) | β (μg/(g·min)) | R2 | ||
| PS + HA | 1641 | 1550 | 0.435 | 0.7430 | 1614 | 3.914 × 10⁻⁴ | 0.9254 | 3.719 × 10⁴ | 0.006 | 0.9308 |
| PS + FA | 918 | 910 | 0.037 | 0.8971 | 1003 | 5.751 × 10⁻⁵ | 0.9206 | 296.628 | 0.006 | 0.9238 |
| PS + TA | 1385 | 1297 | 0.164 | 0.8242 | 1378 | 1.7816 × 10⁻⁴ | 0.9440 | 2286.03 | 0.005 | 0.9583 |
Table 2.
Parameters of three isotherm models for adsorption of HA, FA, and TA by PS MPs.
| Systems | Langmuir | Freundlich | Sips | |||||||
|---|---|---|---|---|---|---|---|---|---|---|
| qm (μg/g) | KL (L/μg) | R2 | KF(μg/g (L/μg)1/n) | 1/n | R2 | qm (μg/g) | KS (L/μg) | 1/n | R2 | |
| PS + HA | 2813 | 2.848 × 10⁻⁵ | 0.9782 | 2.1594 | 0.617 | 0.9844 | 5810 | 3.826 × 10⁻⁶ | 0.671 | 0.9798 |
| PS + FA | 1654 | 2.607 × 10⁻⁵ | 0.9848 | 1.1785 | 0.619 | 0.9887 | 2603 | 6.497 × 10⁻⁶ | 0.715 | 0.9870 |
| PS + TA | 1885 | 4.601 × 10⁻⁵ | 0.9797 | 5.5315 | 0.508 | 0.9981 | 6908 | 9.154 × 10⁻⁷ | 0.519 | 0.9975 |
Table 3.
The site energy distribution parameters for adsorption of HA, FA, and TA by PS MPs.
| HA | FA | TA | |||
|---|---|---|---|---|---|
| μ (E*) | σe* | μ (E*) | σe* | μ (E*) | σe* |
| 14.40 | 11.28 | 13.98 | 11.28 | 17.72 | 14.98 |
Publisher’s Note: MDPI stays neutral with regard to jurisdictional claims in published maps and institutional affiliations. |
© 2022 by the authors. Licensee MDPI, Basel, Switzerland. This article is an open access article distributed under the terms and conditions of the Creative Commons Attribution (CC BY) license (https://creativecommons.org/licenses/by/4.0/).
Share and Cite
MDPI and ACS Style
Li, J.; Ma, S.; Li, X.; Wei, W. Adsorption of Tannic Acid and Macromolecular Humic/Fulvic Acid onto Polystyrene Microplastics: A Comparison Study. Water 2022, 14, 2201. https://doi.org/10.3390/w14142201
AMA Style
Li J, Ma S, Li X, Wei W. Adsorption of Tannic Acid and Macromolecular Humic/Fulvic Acid onto Polystyrene Microplastics: A Comparison Study. Water. 2022; 14(14):2201. https://doi.org/10.3390/w14142201
Chicago/Turabian StyleLi, Junsuo, Shoucheng Ma, Xinying Li, and Wei Wei. 2022. "Adsorption of Tannic Acid and Macromolecular Humic/Fulvic Acid onto Polystyrene Microplastics: A Comparison Study" Water 14, no. 14: 2201. https://doi.org/10.3390/w14142201
Note that from the first issue of 2016, this journal uses article numbers instead of page numbers. See further details here.