Article

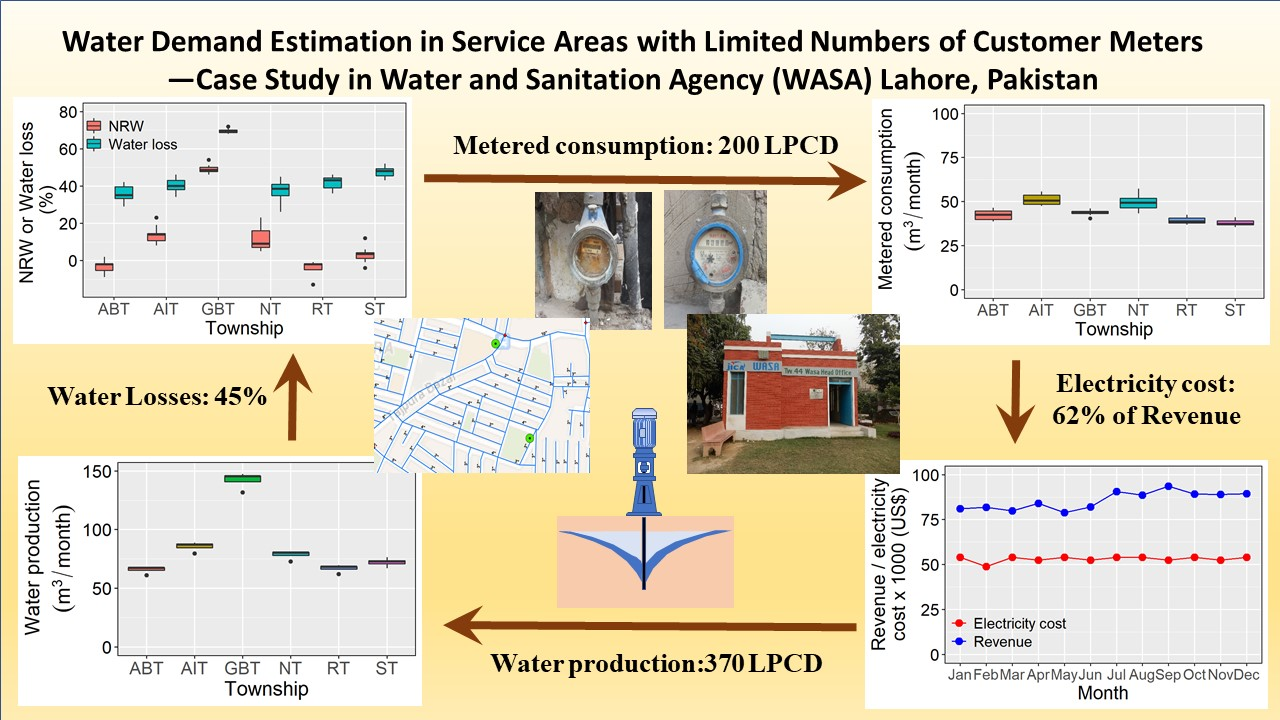
Water Demand Estimation in Service Areas with Limited Numbers of Customer Meters—Case Study in Water and Sanitation Agency (WASA) Lahore, Pakistan

Department of Urban Engineering, Graduate School of Engineering, The University of Tokyo, Bunkyo-Ku, Tokyo 113-8654, Japan
*
Author to whom correspondence should be addressed.
Water 2022, 14(14), 2197; https://doi.org/10.3390/w14142197
Submission received: 19 June 2022 / Revised: 8 July 2022 / Accepted: 8 July 2022 / Published: 11 July 2022
(This article belongs to the Section Water Use and Scarcity)

Abstract

:
The Water and Sanitation Agency (WASA) of Lahore, Pakistan, supplies water to 5.29 million people through 598 tube wells but faces difficulties in meeting rapidly increasing water demand, lowering groundwater table, high energy costs, and low water tariffs. However, the actual water consumption and water loss have never been estimated due to water meter outages. This study aimed to estimate the actual water consumption, production, and water losses for the WASA Lahore service area, using the limited number of working water meters and pump operation data. The actual water consumption was estimated by 14,030 working customer meters; the population census was 44.02 m3 per connection per month, or 200 L per capita per day, while the water production was 79.8 m3 per connection. The actual water loss was significantly higher than non-revenue water, with an average of 45.4% (ranging from 35.9–69.4%). Due to high electricity costs, WASA has had to cut their supply hours. Therefore, leakage reduction programs must be implemented in the high-water-loss townships found in this study in order to meet the increasing water demand, reduce electricity consumption, and alleviate groundwater table drawdown.

Graphical Abstract

1. Introduction

Water is an essential, life-sustaining element [1]. Access to a safe and adequate potable water supply is a basic human right, as human lives are greatly dependent on water [2,3]. Water, being one of the most important natural resources, is viewed as a key to prosperity and wealth [4]. Rapid population growth, changes in socio-economic activities, urbanization, and industrialization have greatly increased the risk of global water crisis [5,6]. Over the past century, annual blue water consumption use per capita has increased from 209 m3 per year in the 1900s to 230 m3 per year in the 2000s [7]. It is estimated that by 2050, over 40% of the world’s population will live in severely water-stressed river basins [8]. Freshwater scarcity and security have been identified as major global environmental problems of the 21st century [9]. Humans already appropriate over 50% of all available renewable freshwater, raising legitimate concerns that water shortages may limit agricultural and industrial production and human wellbeing in the future [6]. Sustainable Development Goal 6 states that the availability and sustainable management of water should be ensured for all [10]. However, over 2.5 billion people in the world have no access to quality drinking water [11]. Many countries in both the developed and developing world face serious problems in maintaining reliable water supplies [12,13].
Pakistan, once a water-surplus country, now faces serious water deficits [14]. Per capita water availability in Pakistan has decreased from 5260 m3 in 1951 to 1050 m3 in 2010 [15]. The water shortfall is expected to increase from 11% in 2004 to 31% by 2025, leading to a food shortage of about 70 million tons per year [16]. Pakistan’s rising water demands are met by the Indus River System, which supplies 180 billion m3 of water [17]. Pakistan is abstracting 61 billion m3 (50 million acre-foot; MAF) from the aquifers and has already crossed the sustainable limit of safe yield [18]. The Indus Basin aquifer is ranked as the second-most over-stressed ground-water reserve in the world. Over 60% of irrigation, 90% of urban water supply, and 100% of industry in the country depend on groundwater [19].
Dependence on groundwater for public and/or private water supply is a rapidly increasing phenomenon in developing cities [20]. At present, many cities, from across the EU and USA to Brazil, China, India, Mexico, Nigeria, Pakistan, and Vietnam, exhibit a high dependence on groundwater for urban water supply [21]. In Pakistan, the water supply to large metropolitan cities has become a challenge due to increasing water demands [22]. Lahore is the second-largest metropolitan area in Pakistan, with a population of 11.1 million [23]. The rapid increases in population, urbanization, and industrialization in Lahore have contributed to increasing water demand [24,25]. Lahore abstracts 6.31 million m3/d of groundwater for urban, industrial, and agricultural water supply [26]. Over-abstraction, land development, and reduced aquifer recharge have led to substantial groundwater table drawdown [27,28]. The groundwater table in the central part of the city has dropped below 40 m, with a current decline rate of 0.9 m per year [29,30]. The major sources of groundwater recharge for Lahore are rainfall (approximately 40%) and the Ravi River [24]; however, the river remains dry except during the monsoon season, and the entire municipal wastewater from Lahore City is discharged into the Ravi River without any treatment [28].
The Water and Sanitation Agency (WASA) is the city’s official water supply utility, covering 61.6% of the 11.1 million people in the city. In the WASA service area, 78% of the homes are connected to a piped water supply [31]. To provide more water to the residents, WASA has increased the number of tube wells in operation [32]. At present, WASA supplies water through 598 deep tube wells, installed in various areas of the city [24]. These tube wells abstract groundwater from a depth of more than 200 m, due to the high concentration of arsenic found above the depth of 30 m [28]. The falling groundwater table has increased the pumping costs [33], as pumping groundwater with electricity is about seven times more energy intensive than surface water abstraction [34]. WASA has kept their tariffs well below the cost-recovery level, instead relying on heavy loans and subsidies [35]. Depleting groundwater resources, ever-increasing water demand, and service area expansion pose serious challenges for WASA [36]. At the same time, WASA is facing financial constraints due to high energy costs and low water tariff rates, which has resulted in the reduction of supply hours by the tube wells from 14–18 h per day in 2013 to 10–11 h per day in 2020 [33,37].
This intermittent water supply has given rise to customer complaints due to water shortages across the city; however, the supply-side solution has become highly unsustainable for the aforementioned reasons [38,39,40]. Alternatively, WASA is considering water demand management through technical, financial, administrative, and social efforts in order to meet the needs of the 756,000 customer connections. This necessitates estimating the actual water consumption and water loss in the distribution networks; however, there are no accurate data on water supply and consumption in WASA due to a lack of flow meters installed on the groundwater pumps and customer water meter outages—97.99% of the customer connections are unmetered. The water consumption of unmetered households is billed based on the land area of their home. In addition, almost all of the tube wells do not have bulk flow meters. This makes it difficult to improve water supply efficiency and to reduce water demand based on actual water supply and consumption data. Therefore, in this study, we aim to develop a method for estimating the actual water supply and water consumption based on pump operational data and the limited number of working water meters at the consumer home, as well as to verify the estimation method using data obtained in the WASA Lahore service area.

2. Materials and Methods

2.1. Water Supply in Lahore

Pakistan, officially known as the Islamic Republic of Pakistan, is located in South Asia, bordering India to the east, Afghanistan to the west, China to the north, and the Arabian sea to the south. Pakistan has four provinces: Punjab, Sindh, Khyber-Pakhtunkhwa, and Baluchistan. Lahore is the second-largest city in Pakistan and is the capital of the Punjab province. Lahore has a semi-arid climate and five seasons, including foggy winter, pleasant spring, summer, rainy monsoon, and dry autumn. The hottest month is June, with atmospheric temperature exceeding 45 °C [26]. The annual precipitation is 636 mm, with the highest in July at 166 mm on average. Lahore is covered with surface water bodies, including the Ravi River to the north-west, the Bambawali–Ravi–Bedian Doab (BRBD) to the east, and the Lahore Canal in the center of city. The Indus Water Treaty, signed in 1960 with India, stipulates the proprietary rights to use the water from the Ravi River. After the construction of the Thein dam, the river flow decreased from 5097 m3/s in 1996 to 566 m3/s in 2013. In addition, wastewater from the city is disposed into the river without treatment, which has deteriorated the water quality.
The Lahore aquifer is unconfined alluvium with a thickness of about 400 m. Borehole logs show that the lenses of less-permeable material are neither thick nor continuous, and hence, the aquifer may be treated as a single unconfined layer. The bedrock in Lahore exists at 381–388 m depth. Groundwater is used to meet the water needs for residential, agricultural, and industrial sectors in Lahore. The Water and Sanitation Agency (WASA) Lahore, working under the Ministry of Housing, Urban Development and the Public Health Engineering Department (HUD & PHED), was established in 1976 under the Lahore Development Authority (LDA) act of 1975 and supplies water to about 756,000 households through 6000 km of the water supply network.

2.2. Study Area

This study focuses on the service areas of WASA Lahore, which are divided into eight townships: Allama Iqbal Town (AIT), Aziz Bhati Town (ABT), Gulberg Town (GT), Gunj Bux Town (GBT), Jubilee Town (JT), Nishter Town (NT), Ravi Town (RT), and Shalimar Town (ST) (Figure 1). However, for database management of customers and billing water consumption, Gulberg and Jubilee Townships are placed under Gunj Bux and Allama Iqbal Township, respectively. Hence, six townships—namely, Allama Iqbal Town (AIT), Aziz Bhati Town (ABT), Gunj Bux Town (GBT), Nishter Town (NT), Ravi Town (RT), and Shalimar Town (ST)—were selected for this study, in order to estimate water consumption, production, and losses. For ease of operation, maintenance, and service delivery, each township is further divided into 4–6 subdivisions. The Tajpura subdivision falling under the ABT Township was additionally selected for time-series analysis of water consumption, impacts on water losses, electricity cost, groundwater table, and customer survey.

2.3. Data Collection

In August–September 2021, customer database, water tariff, billed water consumption, and bill collection data were obtained from the Revenue Directorate of WASA. Data pertaining to static groundwater levels and electricity costs were obtained from the Hydrology and Electricity Directorates, respectively. The census data in 2017 from the Pakistan Bureau of Statistics were used for population estimation.

2.3.1. Water Consumption

The water consumption data were comprised of a customer account number (Registration ID), property number, address, tariff, and consumption billed (in gallons). To protect customer privacy, the data were processed using the account numbers, and only the aggregate numbers (e.g., totals and averages) are presented in this study. The water consumption was measured and billed bi-monthly to the customers until June 2019, then billed monthly afterwards. Hence, the monthly water consumption before June 2019 was calculated by dividing the bi-monthly water consumption equally. The customers were segregated, based on the tariff category, into residential (domestic), commercial (e.g., shops and hotels), charitable (e.g., mosques and churches), and industrial (e.g., small factories) consumers. The number of customers was counted at end of each month in order to obtain the number of monthly connections, among which 97.99% were unmetered and 2.01% were metered. Water bills to unmetered customers were charged as per-consumption slabs based on the land area of the property. These slabs were revised in July 2018 by adding a 25% increment in consumption to those customers having more than a single-story home (Table 1). Metered consumption was measured and billed based on the actual reading of working meters. The billed consumption of both metered and unmetered customers was summed to obtain the monthly billed consumption. The data on metered customers were collected for 11 years (between 2010 and 2020) in Tajpura and for one year (2020) in the six townships (Table 2).

2.3.2. Water Production

Water production data could not be obtained, as none of the tube wells were equipped with a bulk flow meter. Hence, water production was estimated using Equation (1). For this equation, data on the production capacity (Table 2) and daily supply hours of tube wells were collected for one year (in 2020) for the six townships. For Tajpura, data on tube well capacity were collected for 11 years (2010–2020), but supply hour data could not be obtained. Therefore, electricity consumption (kWh) and electric motor power (kW) data were obtained for 11 years (2010–2020), which were then used to estimate the pump operation hours. The supply hours were calculated by dividing the electricity consumption by the electric motor power.
W p = D × N × h × C ,    
where
Wp: water production (m3/month);
D: tube well capacity (m3/s);
N: number of days in month;
h: daily supply hours;
C: conversion factor (3600).

2.3.3. Electricity Consumption

Monthly electricity consumption data were collected for 9 years (2012–2020) for Tajpura. Lahore Electric Supply Company (LESCO) is an electric distribution company that supplies electricity to the tube wells. WASA Lahore has also established an Electricity Directorate for collection and verification of the electricity bills issued by LESCO. The reference number for each pump was used to determine monthly electricity consumption (in kilowatt-hours; kWh) and the corresponding cost (in Pakistani rupees; PKR). Monthly electricity consumption was computed through summation of electricity consumption of all tube wells in a particular month in order to determine the monthly electricity cost.

2.3.4. Static Groundwater Level

Static groundwater level data in Tajpura were obtained for 9 years (2012–2020) from the hydrology directorate of WASA. These static groundwater levels were monitored and recorded during the rest periods of the tube wells. The monthly static groundwater level was calculated by taking the average of static groundwater levels of 7–9 monitored tube wells to obtain a single monthly value.

2.3.5. Population

Population census data were obtained from the Pakistan Bureau of Statistics for different time periods. Since Pakistan’s independence, the population census has been held in 1951, 1961, 1972, 1981, 1998, and 2017. A growth rate of 3% was noted in the population between 1998 to 2017. For estimation of population and water demands, two assumptions were made: (1) A 3% annual population growth in the future; and (2) a household size of 7 people.

2.3.6. Water and Sewer Tariff and Customers Bill

Table 3 shows the water and sewer tariff, which has been applied since 2004. The sewer tariff has been kept at 70% of the water tariff, and the sanitation fee has been kept at 30% of the sewer tariff. The tariff is applied according to three consumptions slabs: up to 5000 gallons per month, from 5001 to 20,000 GPM, and more than 20,000 GPM. For a 3 Marla home, the consumption charge was 10,000 gallons per month before 2018 (Table 1). The water bill against this consumption is calculated by dividing 10,000 into two slabs. For the first 5000 gallons, the rate is 24.66 PKR per 1000 gallon and, for the next 5000 gallons, the rate is 39.93, giving a monthly bill of 343 PKR, which includes a monthly fixed charge of 20 PKR. To estimate the customer bill per connection, data on billing amounts were also obtained for the year 2020. The monthly billed amount was segregated with respect to metered and unmetered domestic (i.e., residential) consumers, which were summed to obtain the total monthly billed amount. This amount was divided by the respective number of customer connections in order to obtain the monthly amount per connection.

2.3.7. Customer Satisfaction Survey

A questionnaire survey was conducted in Tajpura in August–September 2021 in order to assess customer satisfaction regarding the water supply. The purpose of the survey was explained to the respondents, and their consent was obtained prior to the survey, following the Research Ethics Guideline of the University of Tokyo. The names of the customers were withheld to protect their privacy. A total of 294 responses on house size, persons per house, water source, water availability, supply hours, water quantity, and water quality were obtained from the consumers.

2.4. Data Analysis

The collected data were analyzed using R v.4.1.3. Water consumption data were examined to determine the leading consumption category among domestic (residential), commercial, charitable, and industrial consumers. The domestic category comprised 90–95% of the water consumption and, thus, was considered for further analysis. In the case of Tajpura, the time-series data of monthly billed and metered consumption were analyzed to determine consumption per connection, wherein billed consumption included both metered and unmetered consumption. Water losses were determined with respect to billed and metered consumption by subtracting them from the water production. The time-series data on billed consumption per connection, metered consumption per connection, water production per connection, unit electricity cost, static groundwater level, population, temperature, and water losses were plotted to investigate trends and variations over time. Based on the metered consumption per connection, the actual monthly water consumption for all domestic consumers was estimated for comparison with the monthly billed water consumption. The variations in billed and metered consumption, production, and water losses for the six townships were examined and compared in order to investigate the causes of variations.
The time-series data on electricity, static groundwater levels, population, and temperature were correlated, through regression analysis, with the estimated metered water consumption to examine their influence on water consumption. The monthly revenue was analyzed and compared with the monthly cost of electricity. The monthly bills for metered and unmetered consumers were compared to determine the difference between them.

3. Results

3.1. Water Demand Estimation

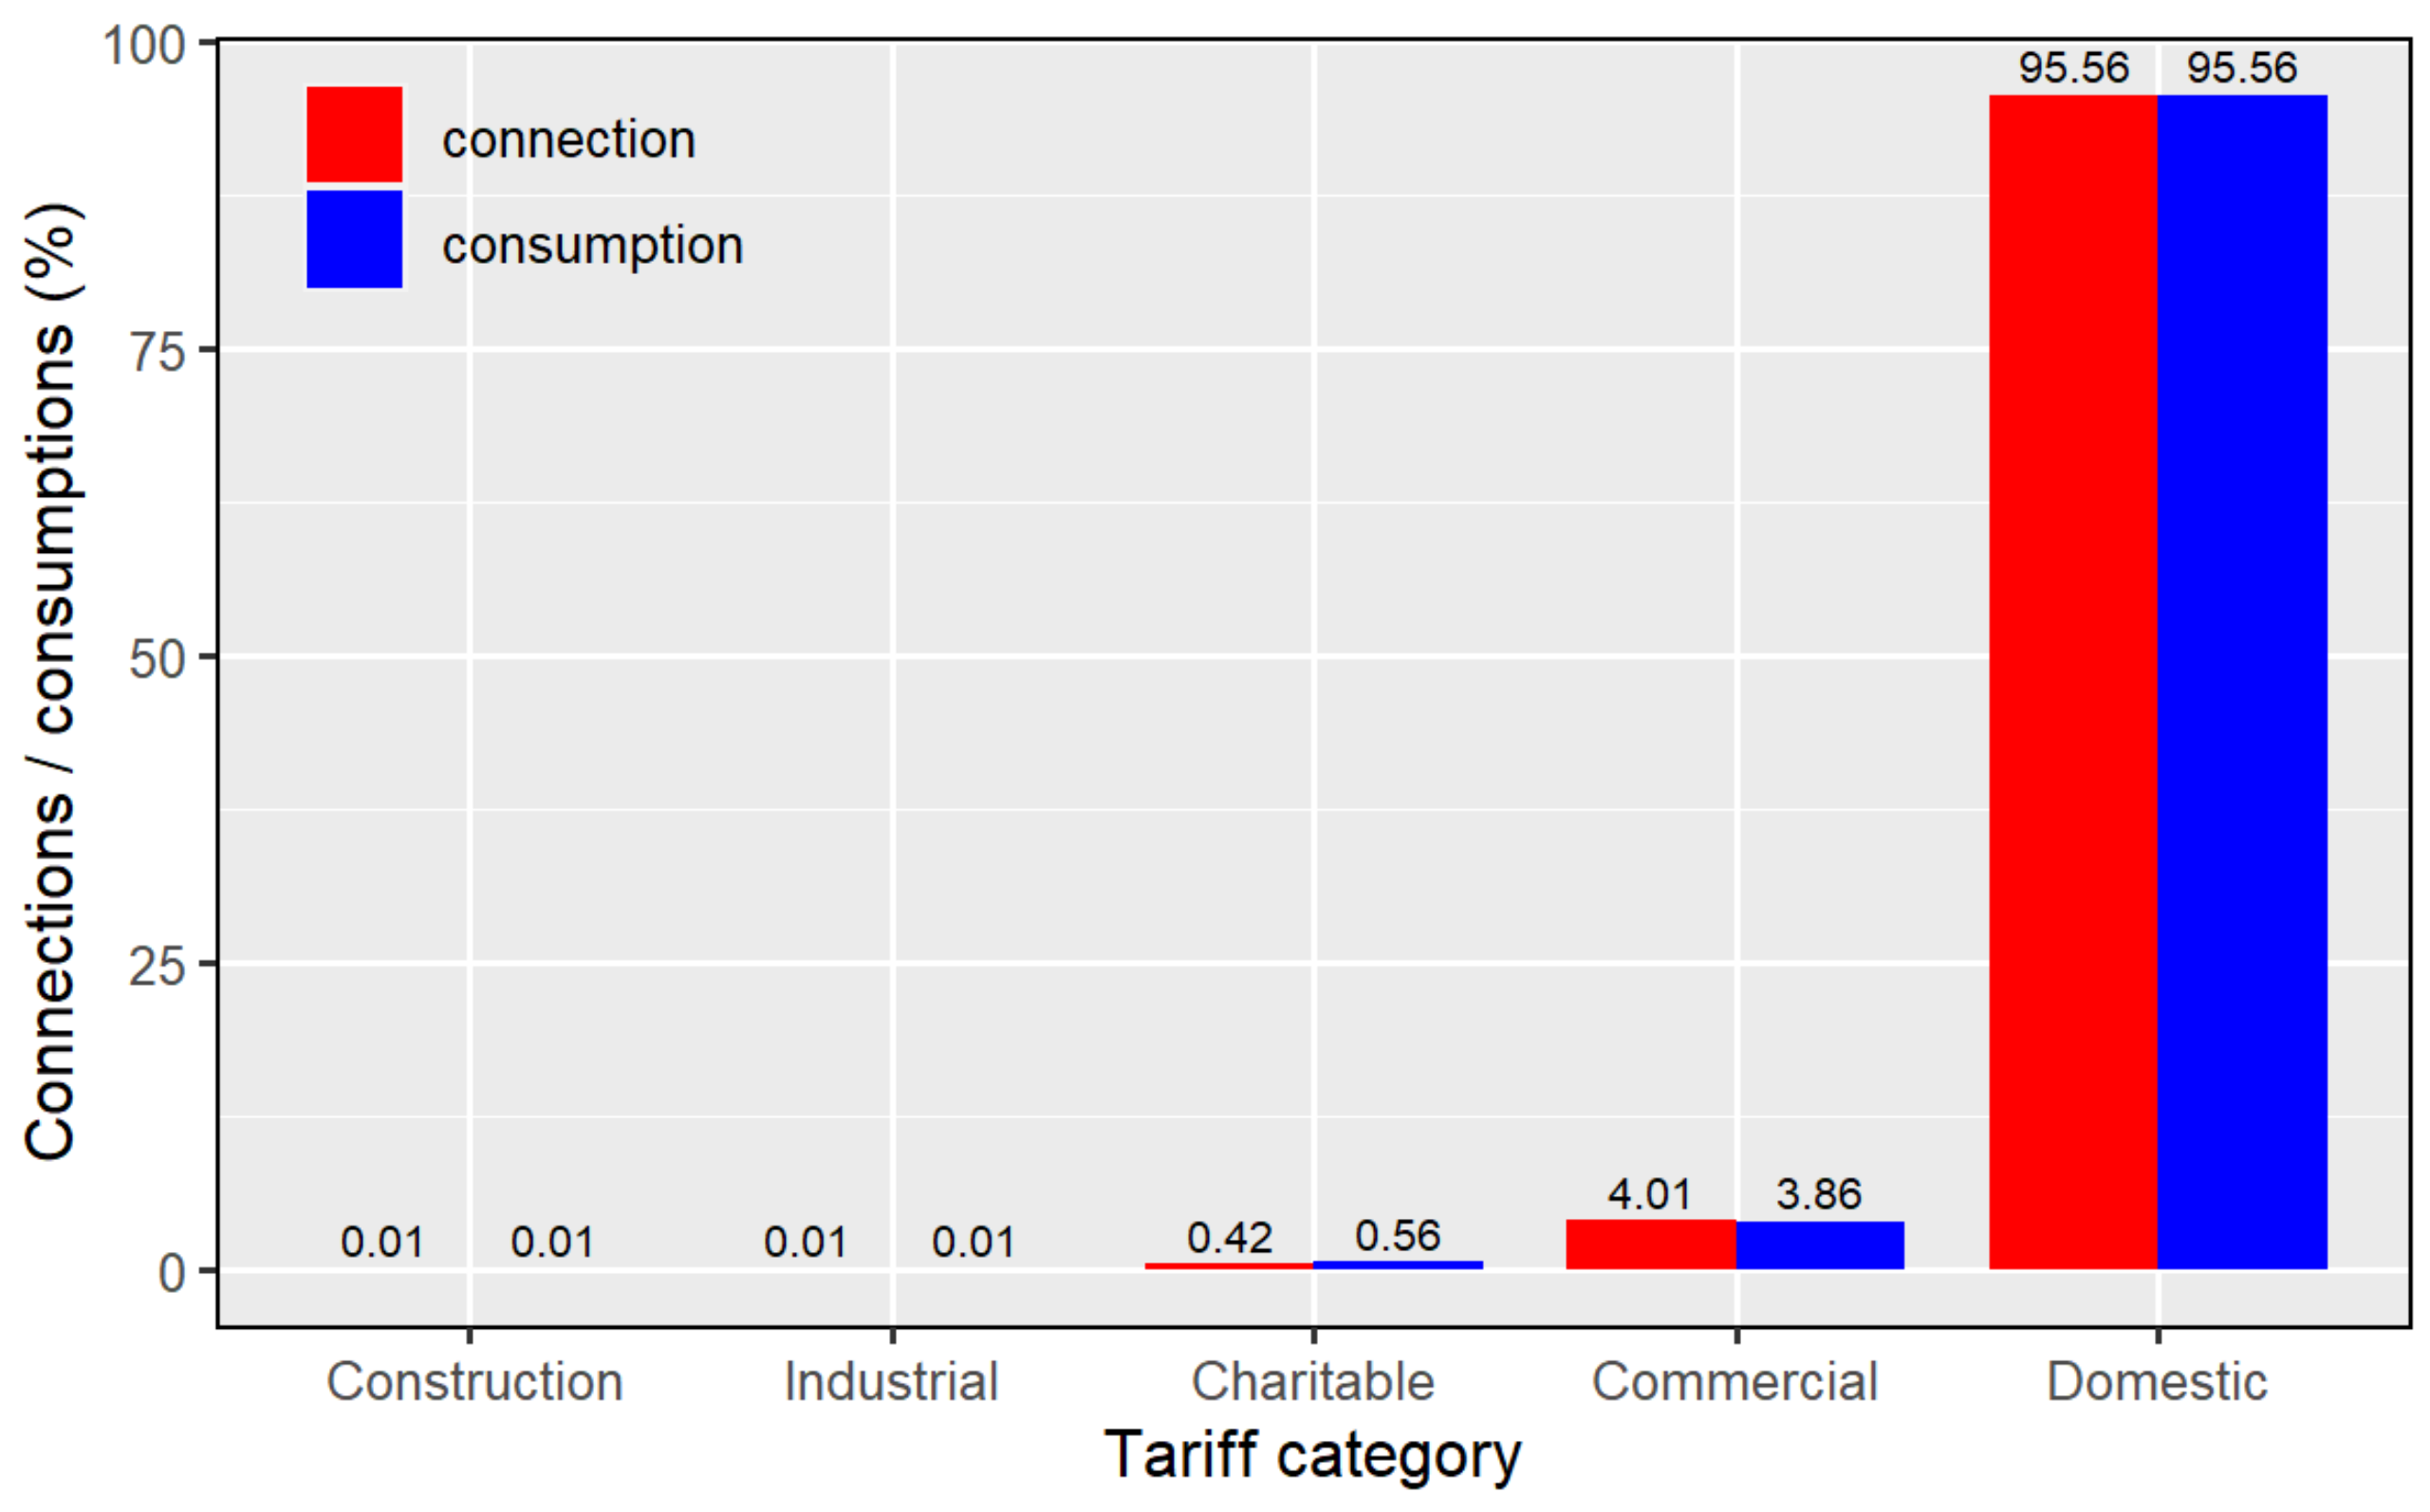
3.1.1. Primary Water Category

Figure 2 shows the percentages of the number of connections and water consumption in each tariff category. The domestic tariff category was the largest category, both in terms of the number of connections and consumption. The construction category primarily uses water consumption for construction works; both construction and industrial water consumption were very low (at 0.01%), as almost all industries in Lahore (comprising approximately 2700 registered industries) have their own water sources, of which 75% are their own tube wells.

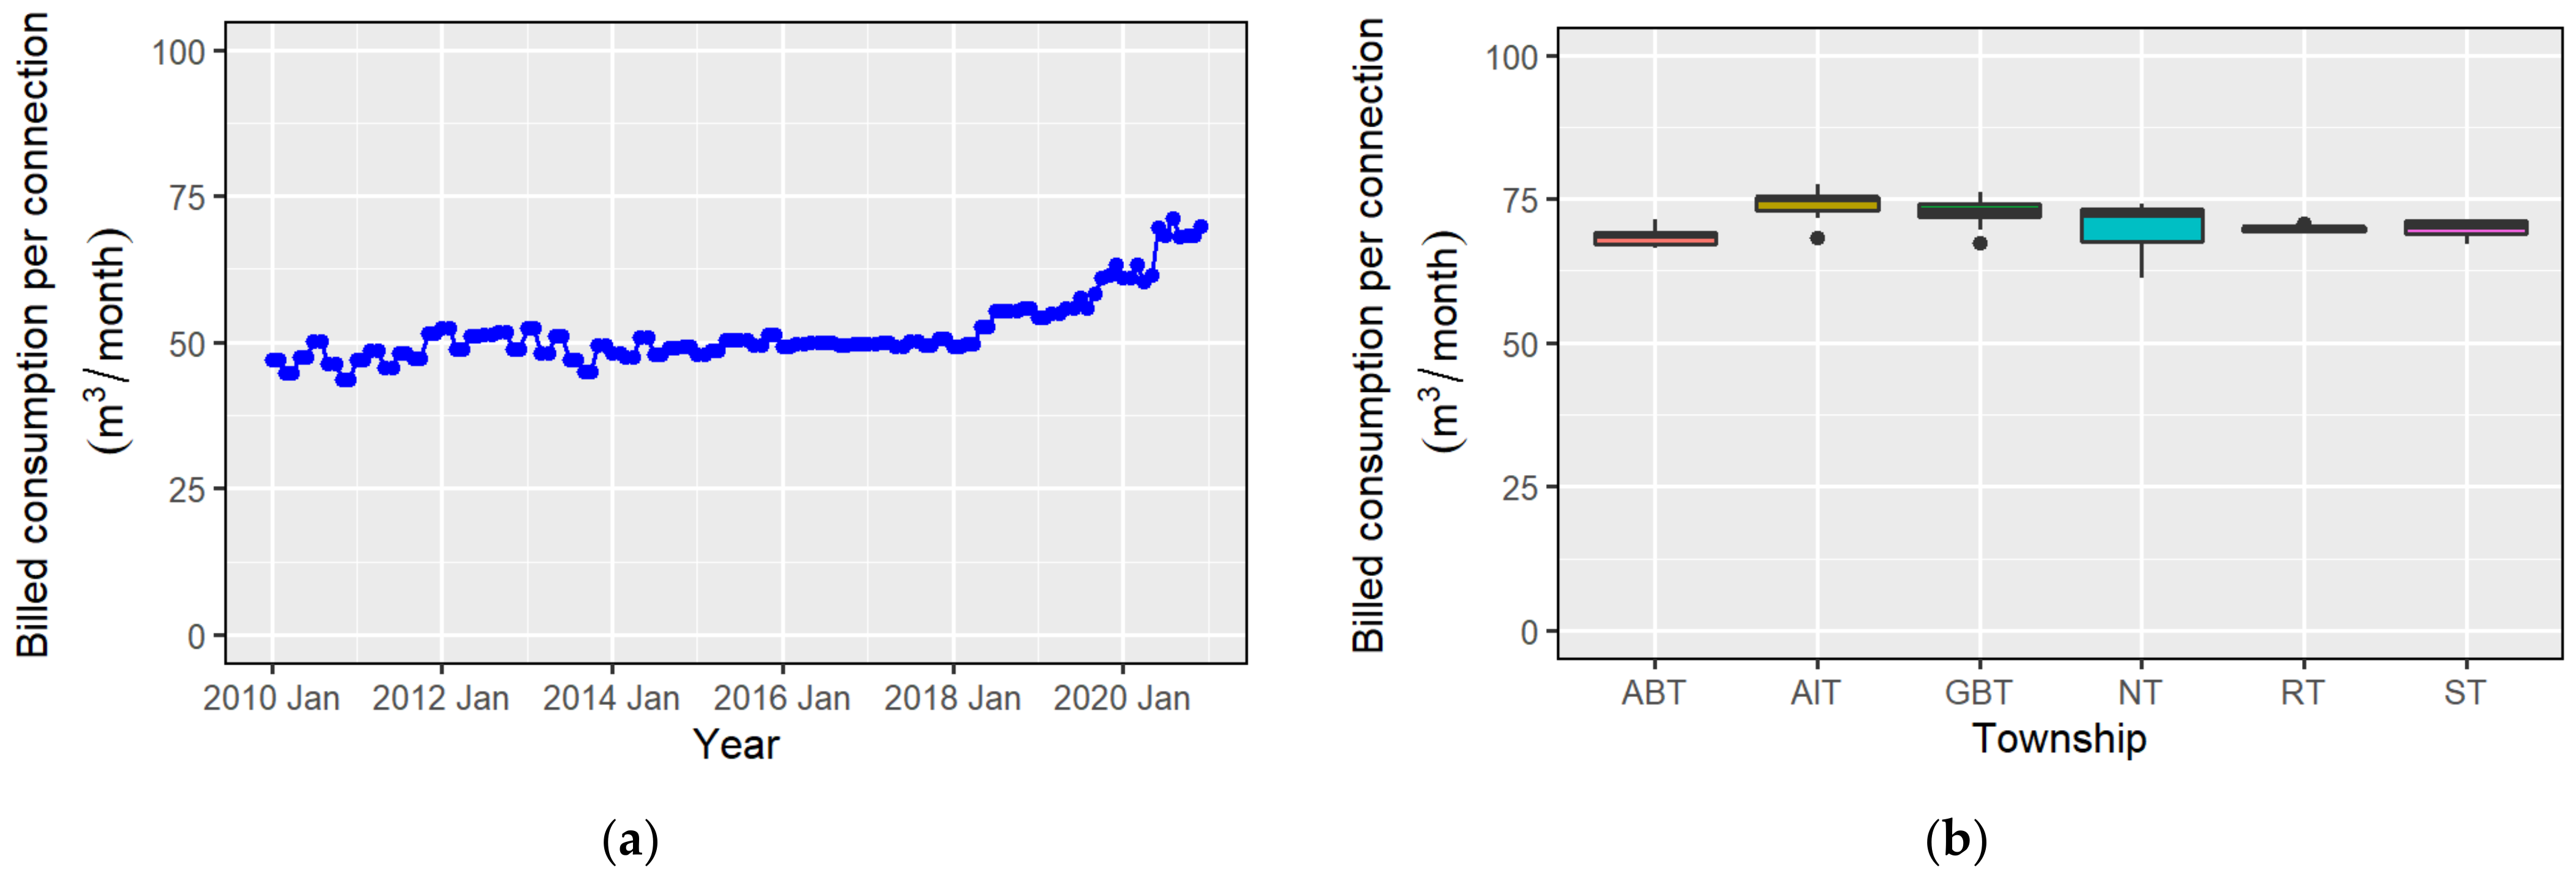
3.1.2. Billed Water Consumption

Figure 3a shows a time-series plot of the monthly billed water consumption per connection, including both metered and unmetered consumption. The billed consumption per connection increased from a minimum of 43.52 m3/month to a maximum of 71.23 m3/month. The mean billed consumption per connection was 49.46 m3/month from 2010 to 2018 and increased to 61.60 m3/month from 2019–2020, with an overall mean of 51.67 m3/month, as the water consumption slabs were revised in 2018 (Table 1).
Figure 3b shows the billed consumption per connection for the six townships. The average consumption per connection was almost the same among these townships; the highest was in AIT at 74.21 m3/month, followed by 72.69 m3/month in GBT, 70.10 m3/month in NT, 69.85 m3/month in ST, 69.81 m3/month in RT, and 68.60 m3/month in ABT. The small variation in consumption can be attributed primarily to the similar sizes of homes.

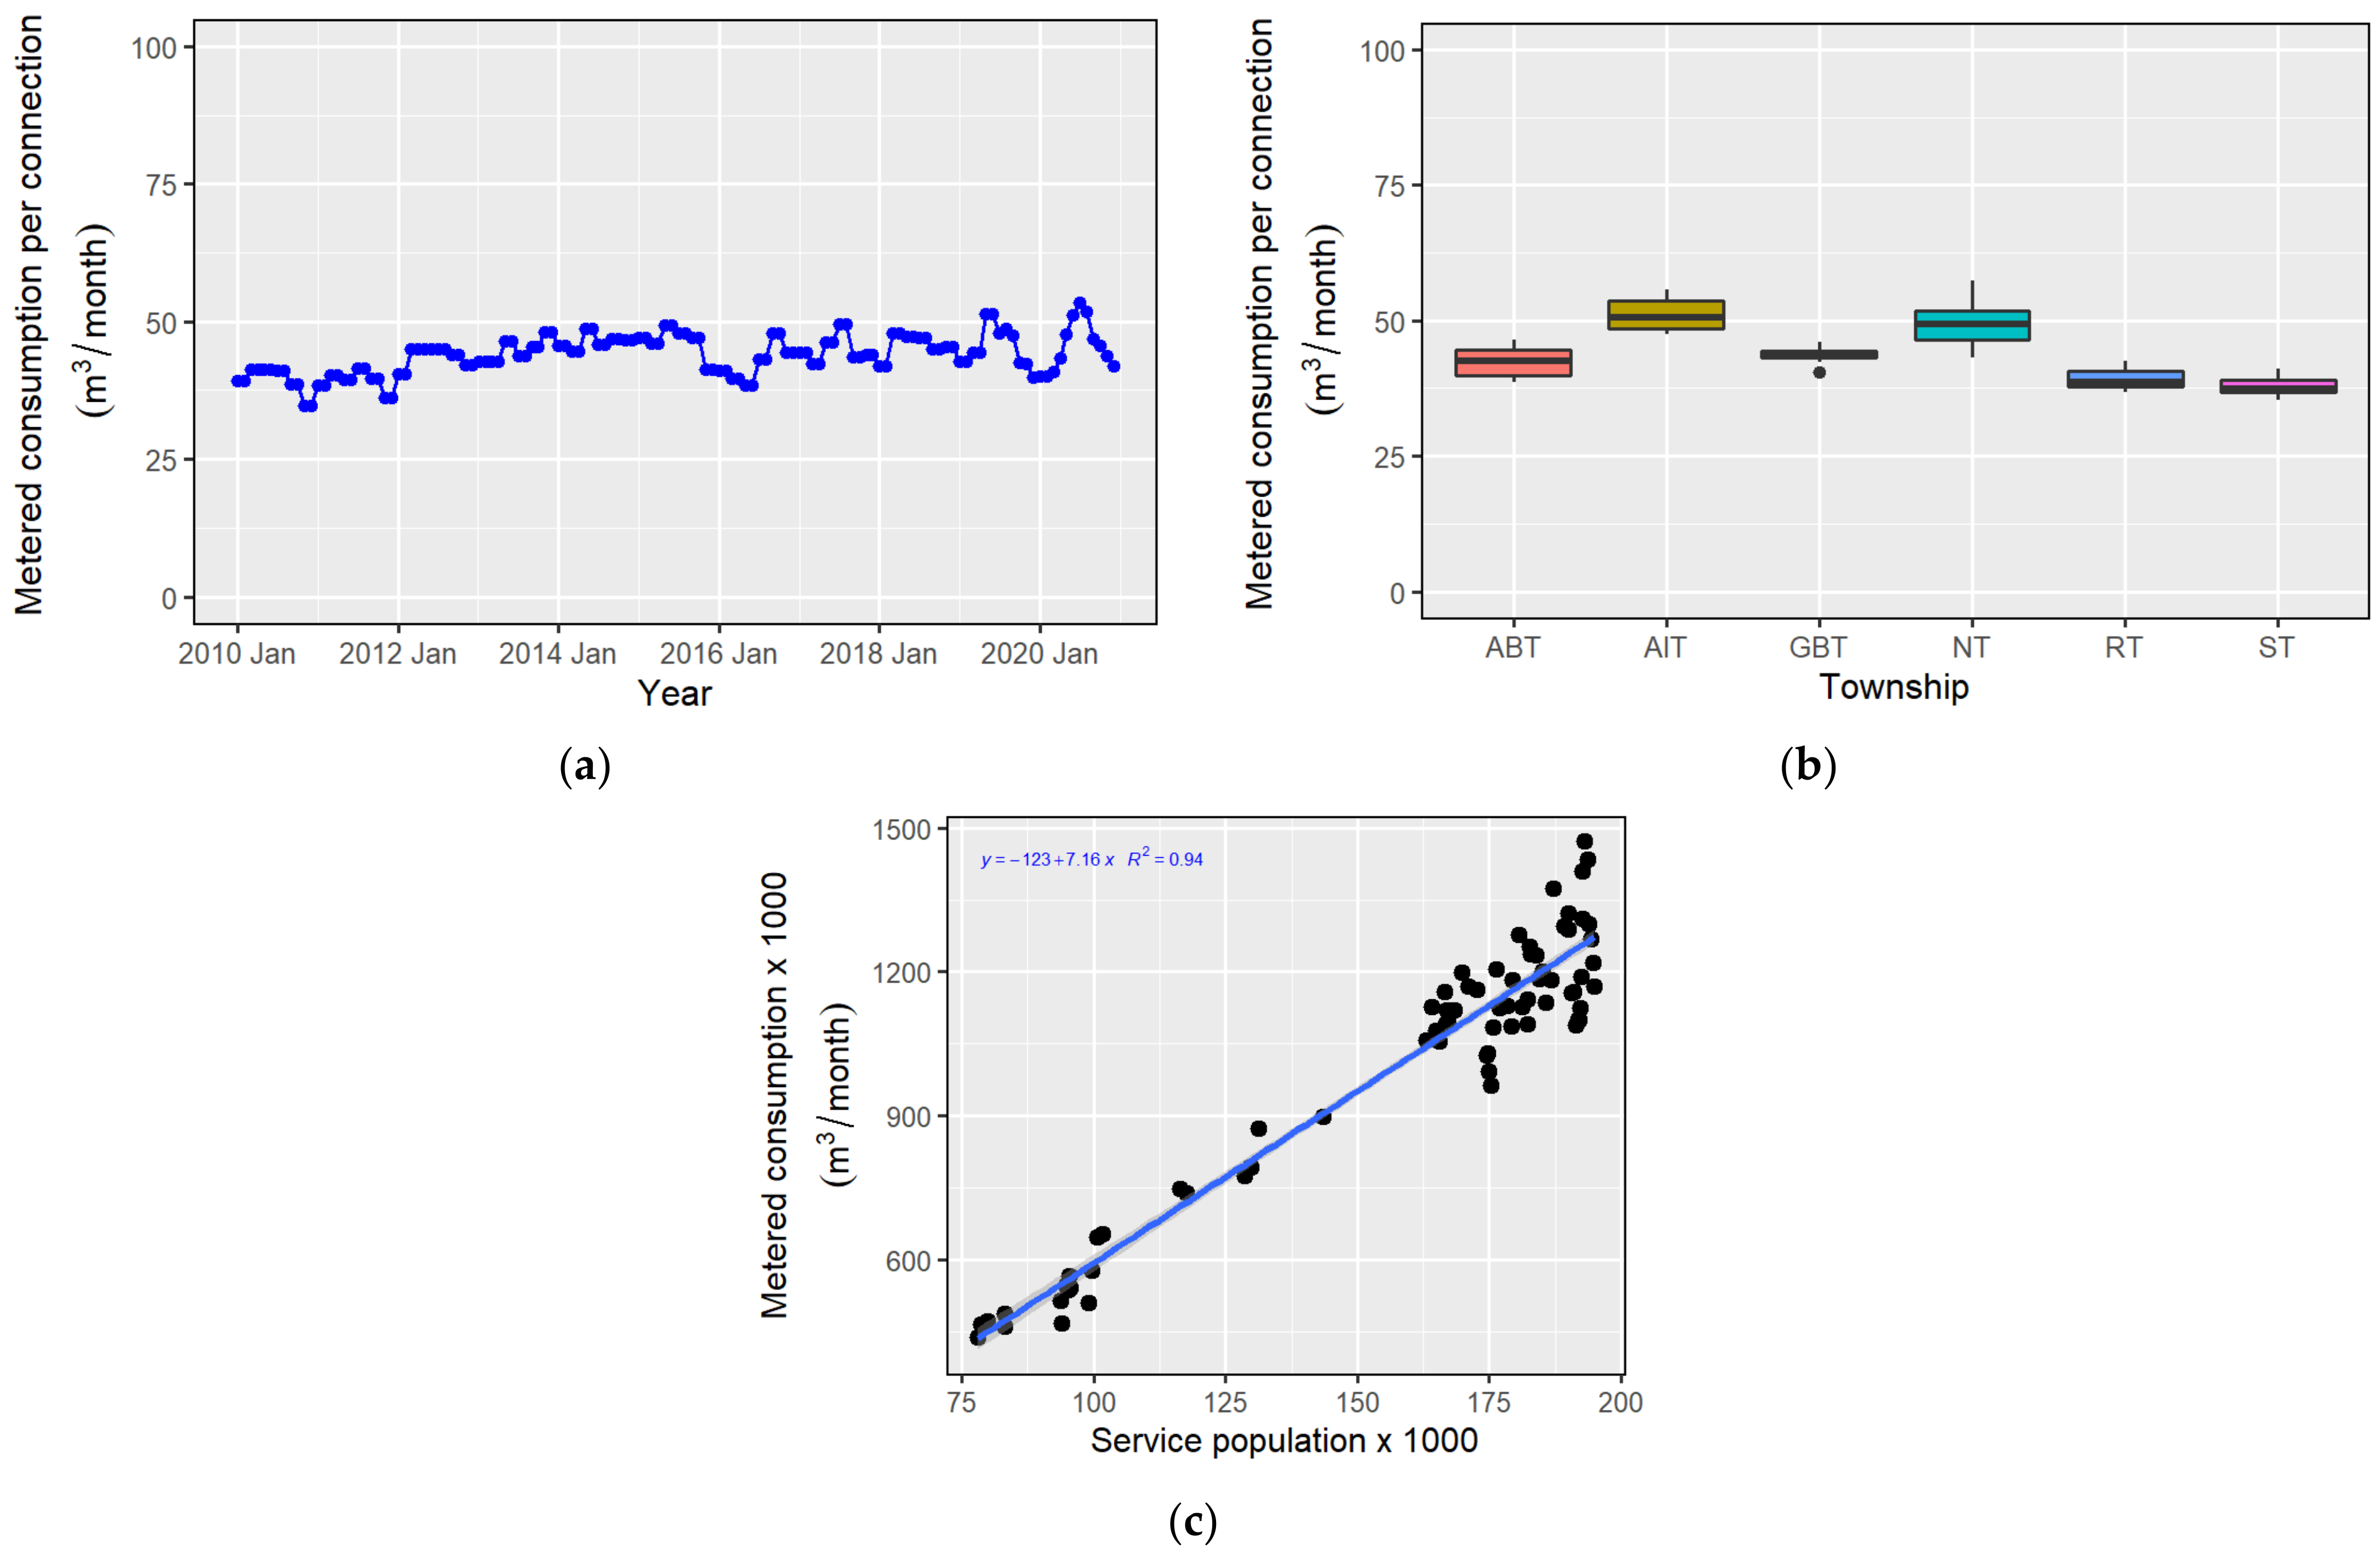
3.1.3. Metered Water Consumption

In Tajpura, the number of domestic connections increased from 13,417 to 27,851 over the 11 years from 2010 to 2020 (Figure A1). During this period, the connections with working meters remained between 182 and 186. Figure 4a shows the time-series plot of monthly consumption per connection. The metered consumption per connection slightly increased in 2012, but remained almost stable afterwards, while seasonal variations were observed. The minimum and maximum values of metered consumption per connection were 34.80 and 53.36 m3/month, respectively, with an overall average of 44.02 m3/month.
To examine the cause of variations in metered water consumption, the impact of temperature was analyzed (Figure A2). The average monthly temperature was low in January but high in May–August. The seasonal variations in water consumption were correlated with the temperature variation, as shown for 2019 and 2020, as monthly water metering commenced in July 2019 (Section 2.3.1).
Figure 4b shows the metered consumption per connection for each township. The difference in metered water consumption among the townships were greater than that in the billed (i.e., metered plus unmetered) water consumption (Figure 3b). The average metered consumption per connection in AIT was the highest, at 51.19 m3/month, followed by 49.35 m3/month in NT, 43.75 m3/month in GBT, 42.48 m3/month in ABT, 39.20 m3/month in RT, and 37.95 m3/month in ST (the minimum). Figure 4c depicts the linear correlation between service population and metered consumption in Tajpura (p < 0.01; R2 = 0.94).

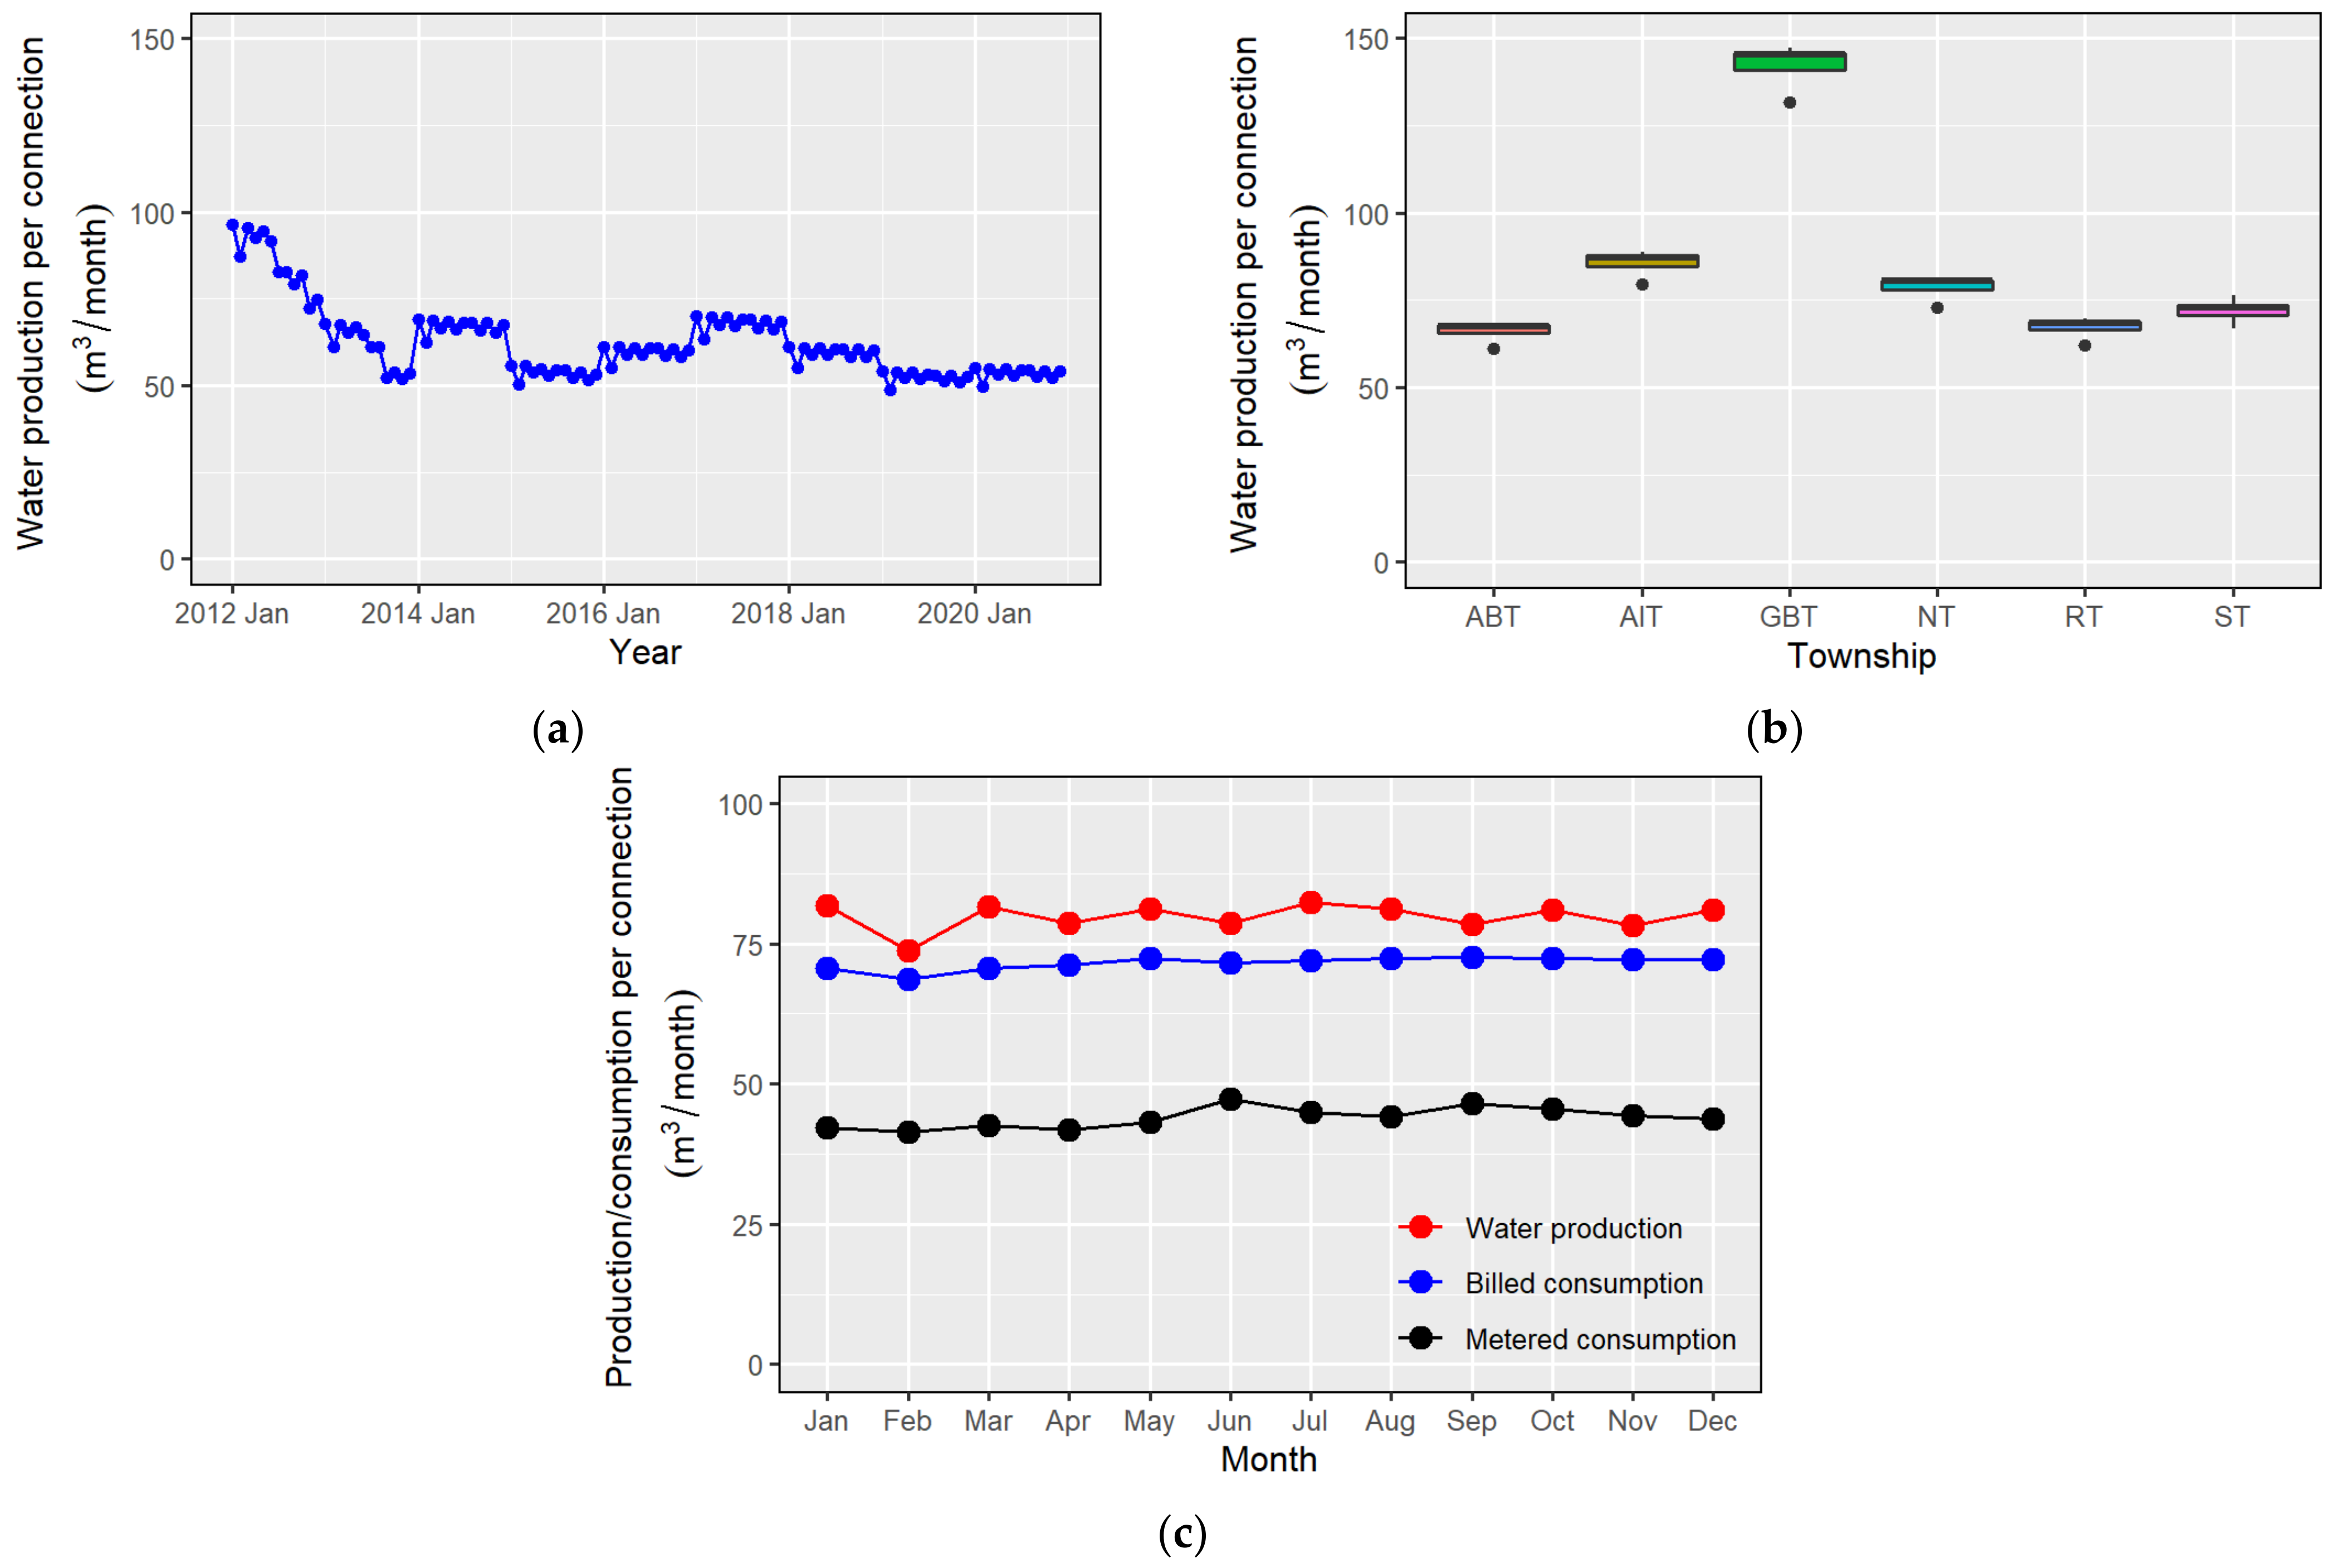
3.1.4. Water Production

Based on the electricity consumption in Tajpura, the average operation time of tube wells was estimated to be 10.47 h a day in 2010–2020. The water production per connection decreased rapidly, from 96.5 m3/month to 53.5 m3/month, in 2012–2013, then followed a slowly decreasing trend with some variations (Figure 5a). In other words, the water production per connection decreased in accordance with the increasing number of customers (Figure A1). The average water production per connection in 2012 was estimated to be 85.92 m3/month, which decreased to 53.53 m3/month in 2020, with some variations between these years. These variations can best be understood in terms of factors such as the number of tube wells, supply hours, and cost of electricity. The decrease in production from 2012–13 was due to the increasing number of connections at the same time. In 2014, there were 16 tube wells operating at a unit cost of 0.065 US$/kWh, whereas in 2015, 15 tube wells operated at 0.080 US$/kWh. Due to increased electricity costs and reduced number of tube wells, the water production dropped in 2015.
The water production per connection was also calculated for each township (Figure 5b). The average production per connection was the highest in GBT, at 142.94 m3/month, followed by 85.99 m3/month in AIT, 79.03 m3/month in NT, 72.21 m3/month in ST, 67.39 m3/month in RT, and 66.34 m3/month in ABT. The possible cause for the highest productivity in GBT was the highest number of tube wells (172) with actual discharge capacity of 14.5 m3/s to supply water to 122,854 customer connections (Table 2). In the case of ABT, there were 73 tube wells with an actual discharge capacity of 6.1 m3/s to supply water to 111,357 customer connections. On the other hand, there were 89 tube wells in NT with an actual discharge capacity of 7.0 m3/s to supply water to 107,181 customer connections, less than the number of customers in ABT.
Figure 5c shows the monthly variations in water production, billed consumption, and metered consumption of WASA Lahore, calculated using the data for the six townships. The average water production, billed consumption, and metered consumptions per connection were 79.8 m3/month, 71.6 m3/month, and 44.02 m3/month, respectively, for WASA Lahore. It is evident that the water production and billed consumption were much higher than the metered consumption.

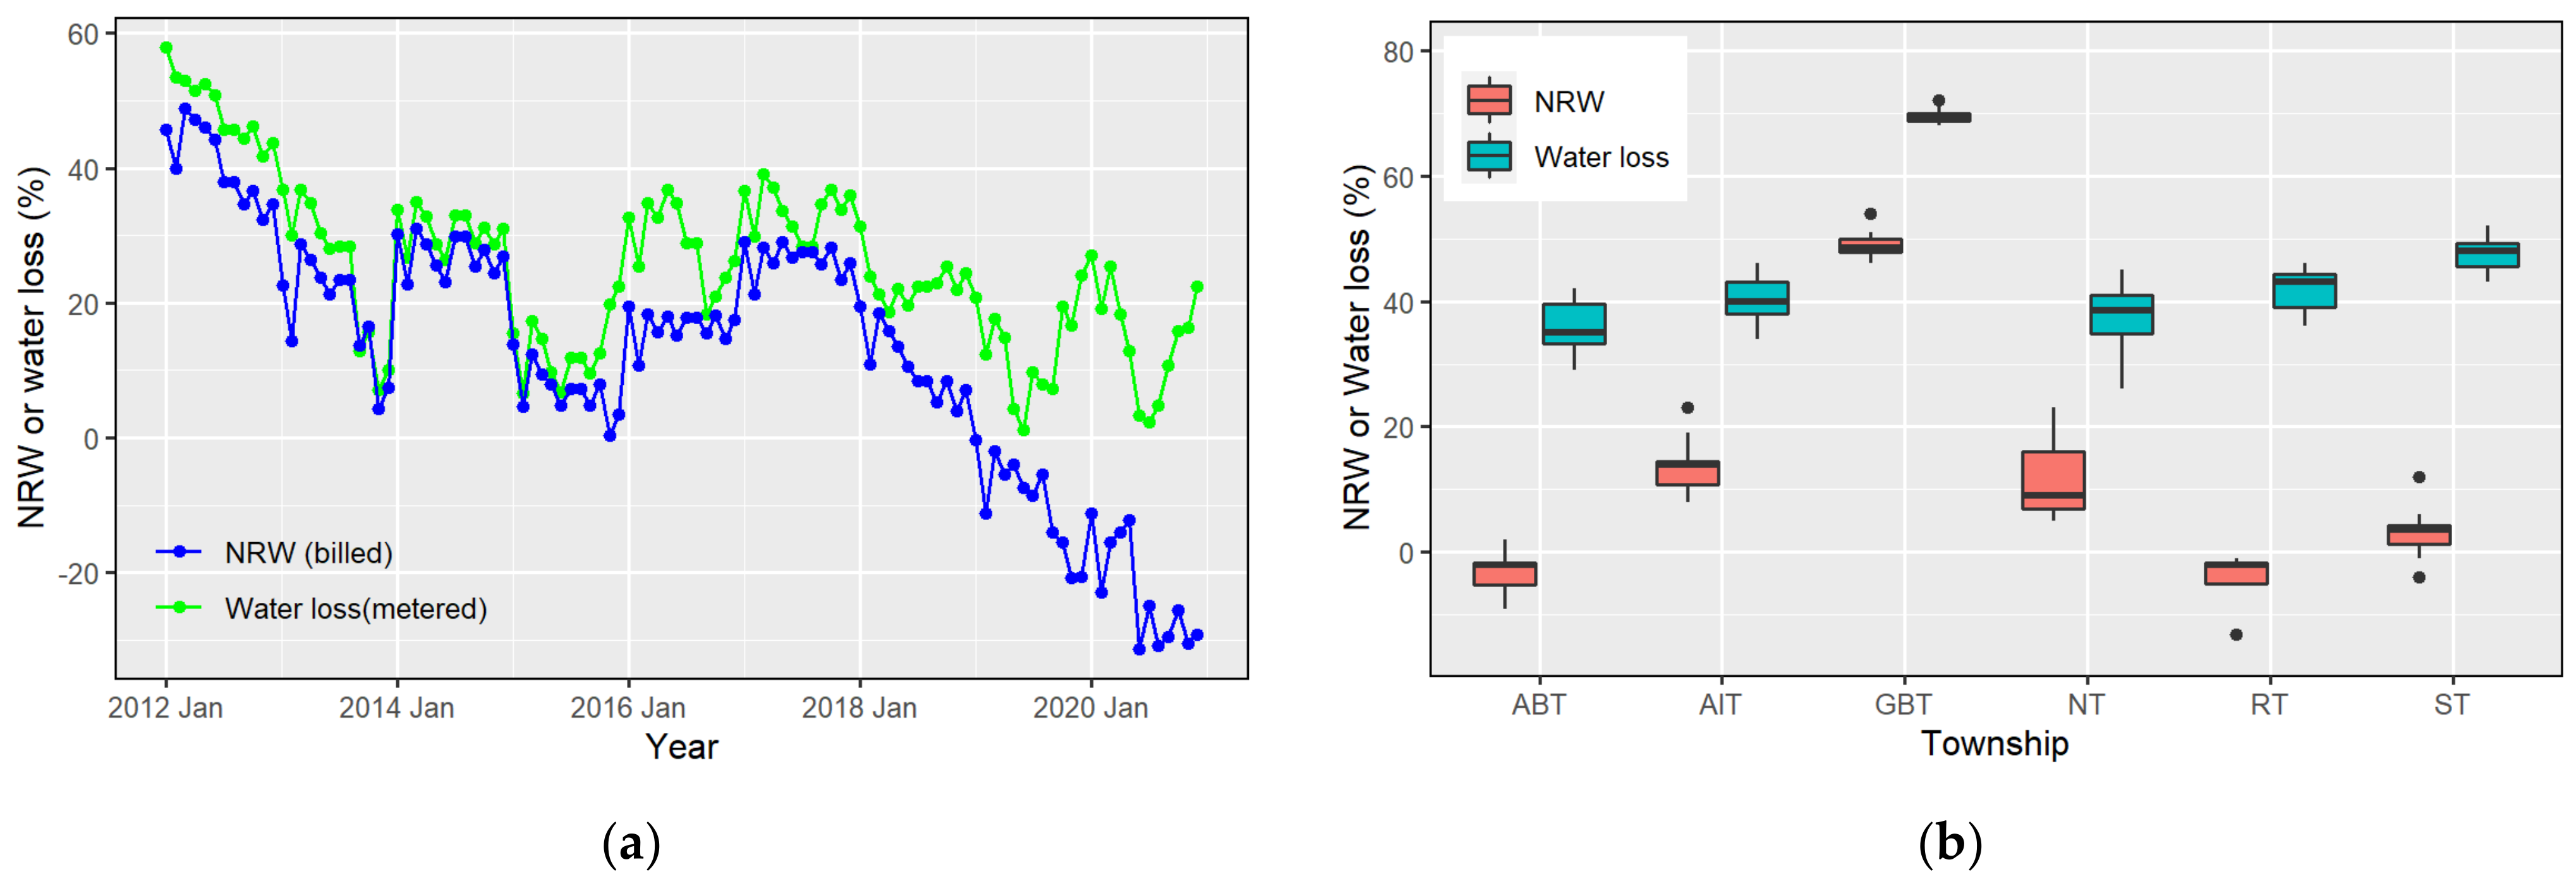
3.1.5. Non-Revenue Water (NRW) and Water Loss in Tajpura
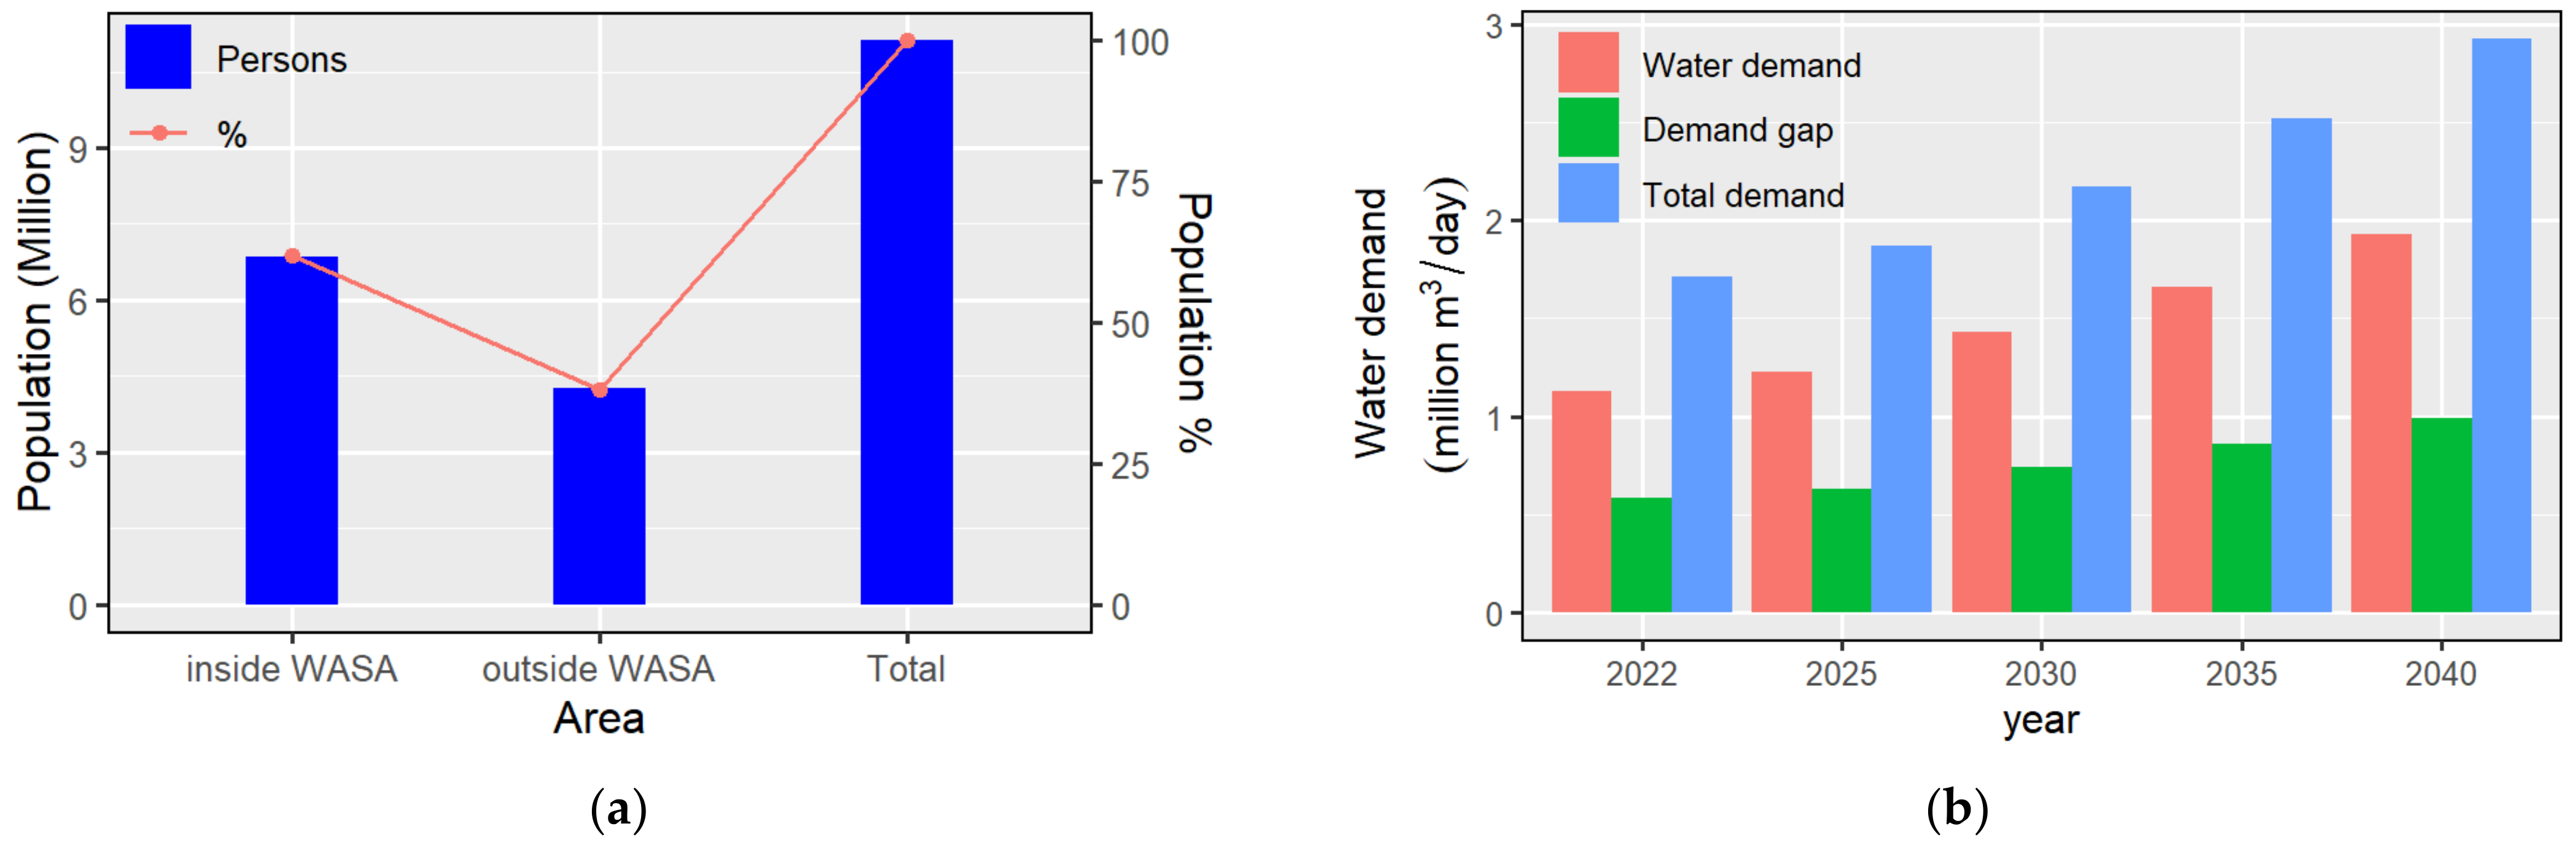
Figure 6a shows NRW and water losses in Tajpura, calculated based on the billed consumption and metered consumption, respectively. NRW and physical water loss were synchronized from 2012 to 2018 but decoupled afterwards. The water loss, calculated by metered consumption, dropped from 58.0% in 2012 to 22.4% in 2020, with an average of 25.7% between 2012 and 2018. On the other hand, NRW decreased to negative values since mid-2018, due to an increase in consumption slabs (Table 2). Meanwhile, many steps have been taken in recent years to control water losses through improvement of the water supply infrastructure under development packages including the Sustainable Development Goals (SDGs), Institute of Public Opinion and Research (IPOR), and the Annual Development Program (ADP) of the Government. Under these developments, water supply pipes have been switched from Asbestos Cement (AC) pipes to High-Density Polyethylene (HDPE) pipes. In addition, a comprehensive campaign named “One-Street One-Line” has been launched, the idea of which is to make only one line per street operational and to disconnect other old and/or additional pipes.
Figure 6b shows the NRWs and water losses for the six townships. The highest average NRW was found in GBT, at 48.8%, followed by 13.5% in AIT, 11.2% in NT, 3.0% in ST, −3.1% in ABT, and −3.6% in RT, with an overall average NRW of 12%. The highest average water losses were found in GBT, at 69.4%, followed by 47.4% in ST, 41.8% in RT, 40.4% in AIT, 37.5% in NT, and 35.9% in ABT, with an overall average of 45.4%. Although it is reported that the water loss estimation has a high variability depending on the method used [41], the method employed in this study is highly accurate as it is shown in the small variability of NRW or water loss in each township (Figure 6b). The actual water losses estimated from metered consumption were significantly higher than the NRWs, as the NRWs were calculated using the billed volume of water consumption, of which 97.99% are based on the water consumption slabs (Table 1).
Figure 6c shows the linear correlation between metered water consumption per connection (Figure 4b) and water losses (p < 0.01). It is important that the percent water loss decreases with increasing water consumption; in other words, increasing water demand could be met partially by reducing water losses. As water production equals water consumption plus water losses, water loss reduction is important to meet the increasing water demands without significantly increasing water production.

3.1.6. Water Demand

The average metered consumption per connection (Figure 5c) for WASA Lahore was 44.02 m3/connection per month. The estimated per capita water consumption, assuming 7 persons per connection, is 200 L per capita per day (LPCD). According to the 2017 Census, WASA covered only 61.6% of the total area of Lahore City (Figure 7a). In December 2021, 8.02 million people were living within the WASA service area, of which 5.29 million (66.0%) were connected to the piped water supply, whereas the remaining 2.73 million (34.0%) had no access to the piped water supply by WASA. Assuming an annual population growth rate of 3%, the future water demand was estimated by multiplication of the per capita water consumption with the projected population (Figure 7b). According to this figure, the total water demand will increase from 1.71 million m3/day in 2022 to 2.93 million m3/day in 2040; however, if average water losses (Figure 6b) of about 45.4% are added to the water demand, then WASA will need to produce approximately 4.25 million m3/day of water by 2040.

3.2. Factors Influencing Water Demand

3.2.1. Static Groundwater Level

Figure 8 shows the time-series (blue line) and the trend line (red line) of static groundwater levels in Tajpura. The fluctuations in static groundwater levels represent the discharge and recharge of groundwater. According to the trend line, the static groundwater level in 2012 was 36.86 m below the ground level, which dropped to 39.97 m in 2020. In other words, the drawdown in groundwater level was 3.11 m over the nine years, at an average rate of 0.35 m/ year. It should be noted that Tajpura is located at the periphery of Lahore (Figure 1b) and is a subdivision of the ABT Township, where 73 tube wells were installed with a discharge capacity of 6.1 m3/s.

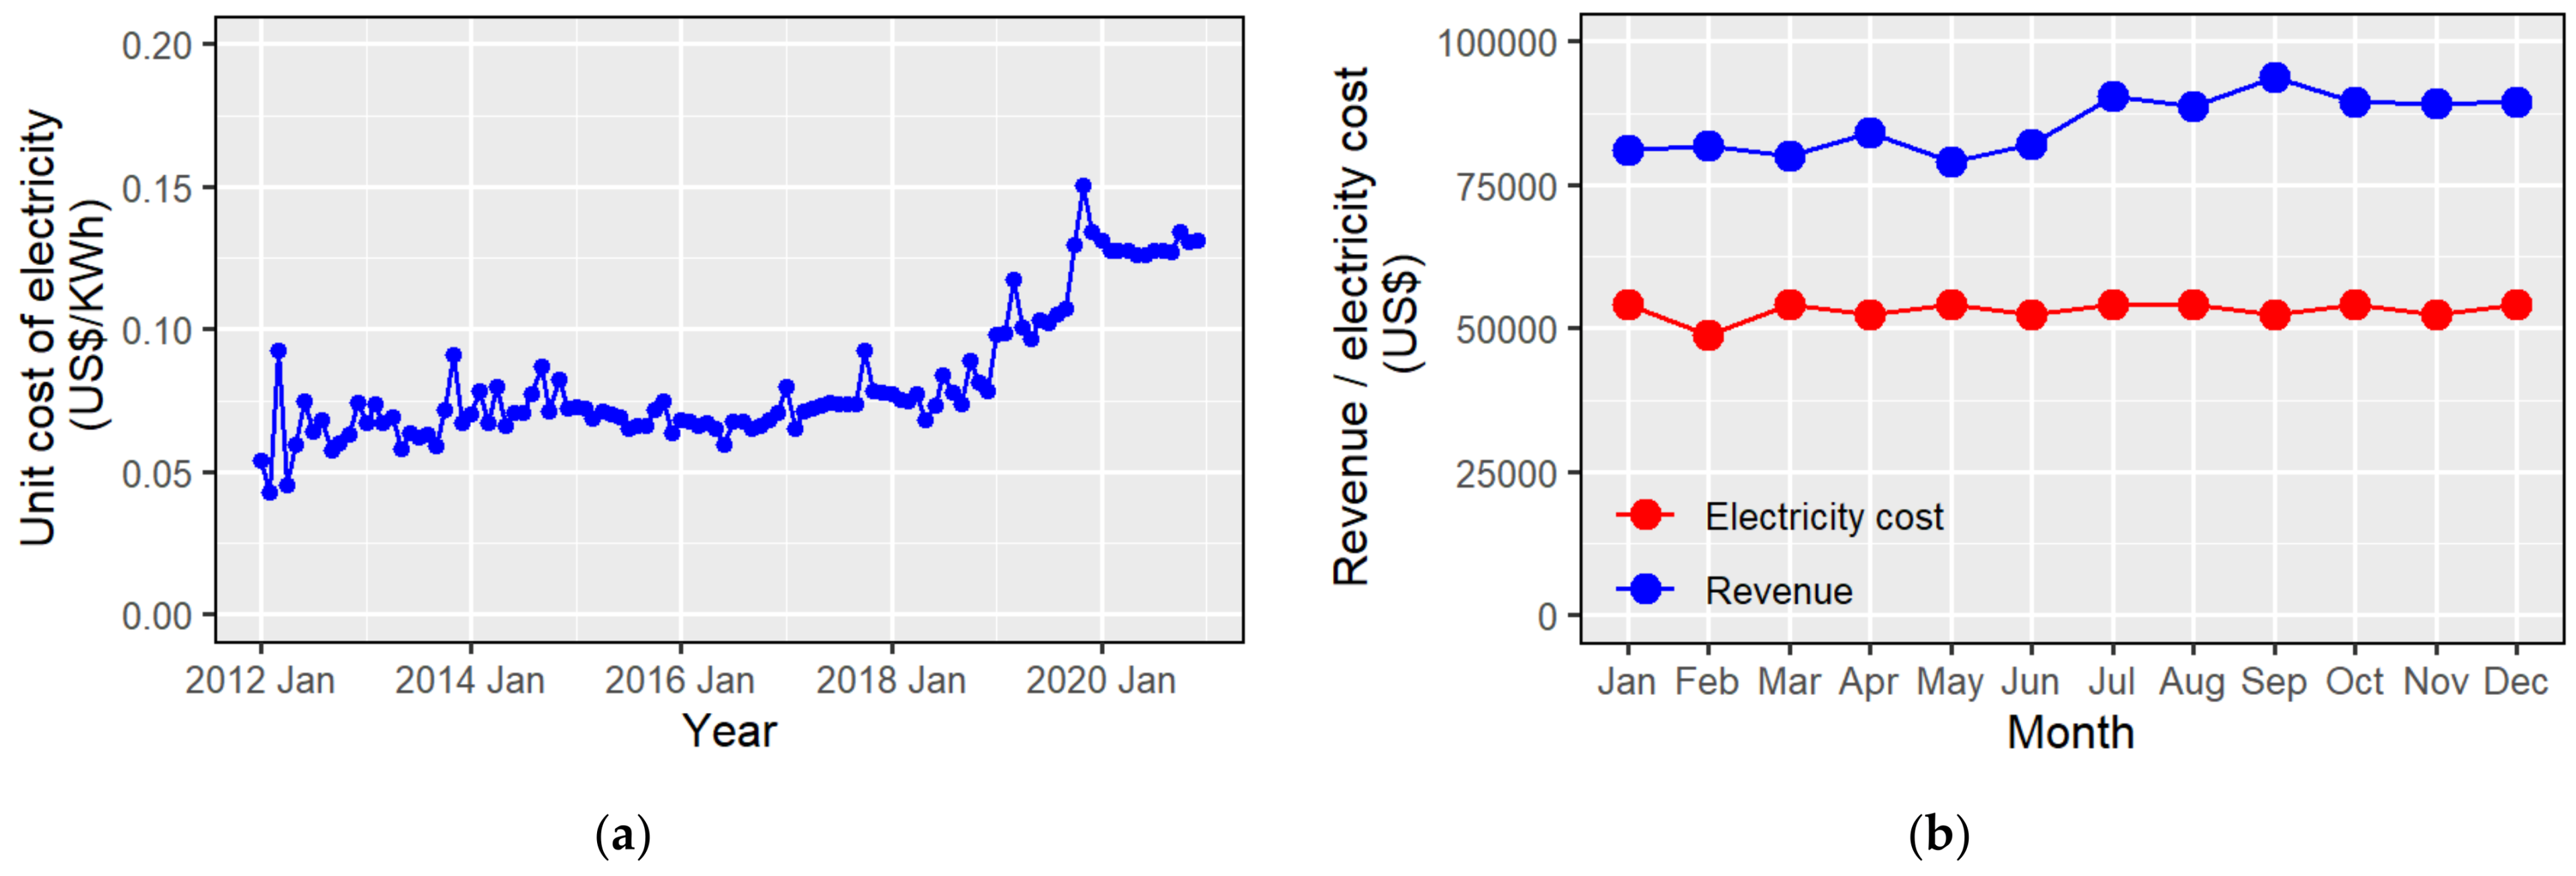
3.2.2. Electricity Consumption and Cost

Deep aquifer tapping is associated with increased consumption and electricity costs (Figure 9a). In 2012, the average unit cost of electricity was 0.062 US$ (11.91 PKR), which increased by 110.7% to 0.130 US$ (25.1 PKR) in 2020 over 9 years. Other than the increase in electricity tariff, the monthly variations in unit cost were due to fuel price adjustments. From 2012 to 2018, the scarp/agricultural tariff (D-1) category, applicable to reclamation and drainage operation pumping under SCARP (salinity control and reclamation program), was applied to tube wells, with the average cost of electricity during this period being 0.069 US$ (13.5 PKR). After 2018, the electricity tariff was revised to general services tariff (A-3), applicable to water supply schemes including water pumps and tube wells other than those for irrigation or reclamation of agricultural land, under which the average unit cost increased to 0.120 US$ (23.61 PKR) in 2019 and 0.130 US$ (25.1 PKR) in 2020.
Figure 9b shows the monthly revenue and expenditure on electricity in Tajpura. The average monthly revenue in 2020 was 85,700 US$ (16.71 million PKR), whereas the average monthly expenditure on electricity was 53,070 US$ (10.35 million PKR). The cost of electricity accounted for 62.1% of the total revenue collected in Tajpura in 2020. This electricity expenditure was used for operating the water supply tube wells, not for drainage or waste disposal stations. In 2020, the estimated water production, based on electricity consumption, was 17.73 million m3 and the expenditure on electricity was 0.64 million US$ (124.19 million PKR); thus, the unit electricity cost for the production of water was 0.0361 US$/m3.

3.2.3. Customer Bills

Figure 10 shows a comparison of monthly customer bills for metered and unmetered connections in Tajpura for 2020. The metered bills showed a clear increase in the summer months between June and September, which was not evident for the unmetered bills. The average monthly bill per metered connection was 1.81 US$ (352 PKR), whereas the average monthly bill per unmetered connection was 2.55 US$ (498 PKR); therefore, the monthly bill for unmetered customers was about 42.5% higher than that for metered customers. It is reported that unmetered households consume 30 LPCD more water than metered consumers; thus, water metering can reduce water consumption by about 15% [42]. However, it is also reported that price elasticity of water consumption decreases under water-scarce conditions [43,44].

3.3. Customer Satisfaction Survey

Table 4 shows that 74.9% of the homes of customers were 21–105 m2 (1–5 Marla) in size, while 24.8% were 105–210 m2 (5–10 Marla). Only 1.02% of the connections in these houses were metered, and the rest were unmetered. As for the drinking water sources, only 10.5% of the customers used piped water for drinking, whereas 80.95% fetched water from filtration plants set up for arsenic removal, and 8.16% of the consumers drank bottled water. The water from filtration plants is free of charge, but bottled water costs were 0.52–5.18 US$ per month (7.5% of the consumers) or more than 5.18 US$ (5.8%). Concerning water quality, 4.8% of the consumers reported the piped water quality as good, 78.9% as acceptable, and 16.3% as bad. A similar response was obtained for the quantity of water supplied. Customers had concerns over the duration of piped water supply, as 92.9% of the customers reported that the water supply hours were only 3–9 h/day, while 5.4% reported that water was available for only 3 h/day. All of the consumers reported water shortages and low pressure and, thus, they had to use booster pumps to lift water from street level to roof-top tanks with storage capacities of 0.45–3.4 m3 (100–750 gallons).

4. Discussion

4.1. Estimation of Water Demand, Water Production, and Water Loss

There were a few factors influencing the accuracy of the estimated water consumption using limited numbers of metered water consumption. First, the number of working water meters was small (about 14,030), comprising only 2.01% of the total connections. In addition, those connections with working water meters were not randomly selected and, thus, there could be deviations from the actual distribution of water consumption in the whole system. In addition, a meter inaccuracy of 2–5% is unavoidable, similar to other water supply [45]. As there were no bulk flowmeters attached to the groundwater pumps, groundwater abstraction was estimated by multiplying the pump capacity by operating hours per day, which was estimated from the electricity bills. As the dates of electricity consumption measurement for billing were not exactly fixed to the first day of the month, the actual electricity consumption for each month might be slightly different from that given by the electricity bills, although the monthly variations could be averaged by taking longer periods to estimate electricity consumption. Furthermore, the amounts of groundwater abstracted by pumps might be different from those of the pump capacity, due to gradual lowering of the groundwater table.
Nevertheless, this study made it possible to estimate the actual amounts of physical loss in the service area of WASA Lahore, where no bulk flowmeters are attached to the groundwater pumps and only 2.01% of the customer meters are working. Although the estimated water loss inherently includes the abovementioned errors, the estimated water losses were very high, at 35.9–69.4%, with an overall average of 45.4%. Reducing water loss should, therefore, be prioritized in order to meet the increasing water demand and electricity costs, as well as to cope with groundwater depletion (Figure 8).

4.2. Factors Influencing Water Demand

The service population in Tajpura increased by 52%, from 128,632 in 2012 to 194,957 in 2020, while the per connection and per capita water consumption remained almost steady, at 44.02 m3/connection/month and 200 LPCD, respectively. (Figure 4a). This means that the short supply hours of 3–12 h (Table 4) did not cause a significant reduction in the water demand, as the consumers developed coping strategies to obtain enough water, such as installing storage tanks. The water tariff has been fixed at low levels since 2004, such that it is not likely that water demand will decrease. Therefore, although it is reported that water prices are an effective tool in water demand management [46], they cannot be applied in Lahore because of the large numbers of unmetered connections.
However, due to the high water demand and high levels of water loss, the supply volume is high, which has caused drawdown of the static groundwater level by 0.35 m per year (Figure 8). More seriously, the over-abstraction of groundwater has led to increased contamination of the aquifer, with a higher-than-acceptable concentration of arsenic and a looming threat of saline water intrusion from Raiwind area towards the fresh groundwater in Lahore [47]. The Pakistan Council of Research in Water Resources (PCRWR) conducted a study to assess arsenic in Lahore City in 2009 and found that most groundwater samples had a concentration higher than 50 µg/L [48]. In addition, the cost of electricity to produce water has increased by 110.9% (Figure 9). In 2020, the expenditure on electricity was 62.1% of the revenue collected. The collected revenue is expected to shrink by 42.5% (Figure 10) if unmetered connections are replaced with 100% metering.

4.3. Customer Perception of Water Supply Service

The average per capita water consumption was found to be 200 LPCD, higher than the per capita water consumption in many cities in the developing and developed world [49]. Nevertheless, all of the consumers reported water shortages (Table 4), possibly due to the short supply hours, not the amount of water they consume. To reduce expenditure on electricity, WASA has reduced the pump operating hours, which has led to short supply hours for the consumers. Due to the intermittent water supply, many homes have installed water tanks to store water for their needs. Thus, once the water is delivered, many people withdraw water from the distribution pipes to fill their storage tanks, leading to water pressure lowering in the network. In addition, the supply hours and water quality vary under the intermittent operations [50]. These problems arising from the intermittent water supply might be the cause of the water shortage complaints of the consumers.

5. Conclusions

Due to broken or non-existent water meters, the number of metered consumers is very small among all consumers in many cities in developing countries. To overcome the difficulties in estimating water production and water consumption in such cities, in this study, we estimated the water consumption for the whole service area of WASA Lahore using the small number of metered consumers (14,030 consumer meters) and electricity bills for pump operation. Water production was also estimated, using pump capacity and electricity consumption data. As a result, we found that the actual water consumption was significantly less than the billed water consumption since the increase in the water consumption slab in 2018, and the water loss was estimated to be 45.4% on average. Water loss decreased as water consumption increased, possibly due to the lowering of water pressure.
To cope with the increasing electricity costs (62.1% of the income in 2020), WASA Lahore has reduced the operational hours of groundwater pumps and the water supply hours (3–12 h in 2021). Subsequently, all consumers complained of low pressure and short supply hours. Based on these results, it is recommended that further efforts be made to reduce water losses, which will make it possible to deliver more water to the consumers and save electricity consumption. Despite the intermittent water supply, water consumption per capita is high, at 200 LPCD. Therefore, demand management, including water-saving, might also be instrumental in sustainable management of the water supply system.
The methods and results presented in this paper might be useful for other cities where the number of working water meters is very limited and where bulk flow meters are not installed in the network. The future perspective of this study is to improve the estimation accuracy based on a higher numbers of customer meters and installation of the bulk flow meters, which requires regular maintenance and replacement of customer and bulk flow meters.

Author Contributions

Conceptualization, S.T., M.A., and S.K.; methodology, S.K. and S.T.; dataanalysis, M.A., S.K., and S.T.; investigation, M.A.; data curation, M.A. and S.K.; writing—original draft preparation, M.A.; writing—review and editing, S.T. and S.K.; visualization, M.A.; supervision, S.T. and S.K.; project administration, S.K. and S.T.; funding acquisition, S.T. All authors have read and agreed to the published version of the manuscript.

Funding

This research was supported by Japan International Cooperation Agency (JICA), though the collaborative program with the University of Tokyo and the scholarship provided to Muzaffar Abbas for his graduate studies. This study was also supported by Grand-in-Aid for Scientific Research (No. 22H01621) provided by the Japan Society for the Promotion of Sciences (JSPS).

Institutional Review Board Statement

Ethical approval is not required for this type of study as it involves no human/personal data (Research Ethics Committee, the University of Tokyo).

Informed Consent Statement

The objective of the study was explained and informed consent was obtained from all the parties engaged in this study.

Data Availability Statement

Restrictions apply to the availability of these data. Data was obtained from Directorates of WASA Lahore and are available from the authors with the permission of WASA Lahore.

Acknowledgments

The authors would like to express their gratitude to Water and Sanitation Agency (WASA) Lahore.

Conflicts of Interest

The authors declare no conflict of interest.

Appendix A

Figure A1. Time-series of domestic connections in Tajpura.
Water 14 02197 g0a1
Figure A2. Monthly variation of metered consumption and ambient temperature in Tajpura.
Water 14 02197 g0a2

References

  1. Amponsah, S.K.; Otoo, D.; Todoko, C.A.K. Time series analysis of water consumption in the Hohoe municipality of the Volta region, Ghana. Int. J. Appl. Math. Res. 2015, 4, 393–403. [Google Scholar] [CrossRef] [Green Version]
  2. Mekonnen, M.M.; Hoekstra, A.Y. Four billion people facing severe water scarcity. Sci. Adv. 2016, 2, e1500323. [Google Scholar] [CrossRef] [PubMed] [Green Version]
  3. Nauges, C.; Whittington, D. Estimation of Water Demand in Developing Countries: An Overview. World Bank Res. Obs. 2010, 25, 263–294. [Google Scholar] [CrossRef] [Green Version]
  4. Boretti, A.; Rosa, L. Reassessing the projections of the World Water Development Report. NPJ Clean Water 2019, 2, 15. [Google Scholar] [CrossRef]
  5. The United Nations. World Water Development Report. Leaving No One Behind; United Nations: New York, NY, USA, 2019; Available online: https://en.unesco.org/themes/water-security/wwap/wwdr/2019 (accessed on 15 June 2022).
  6. Srinivasan, V.; Lambin, E.F.; Gorelick, S.M.; Thompson, B.H.; Rozelle, S. The nature and causes of the global water crisis: Syndromes from a meta-analysis of coupled human-water studies. Water Resour. Res. 2012, 48, W10516. [Google Scholar] [CrossRef]
  7. Kummu, M.; Guillaume, J.; Moel, H.; Eisner, S.; Flörke, M.; Porkka, M.; Siebert, S.; Veldkamp, T.I.E.; Ward, P.J. The world’s road to water scarcity: Shortage and stress in the 20th century and pathways towards sustainability. Sci. Rep. 2016, 6, 38495. [Google Scholar] [CrossRef] [Green Version]
  8. Lal, B.S. Water for Life: Issues and Challenges. Int. J. Sci. Res. 2018, 8, 1949–1957. [Google Scholar] [CrossRef]
  9. Jury, W.A.; Vaux, H., Jr. The role of science in solving the world’s emerging water problems. Proc. Natl. Acad. Sci. USA 2005, 102, 15715–15720. [Google Scholar] [CrossRef] [Green Version]
  10. Ortigara, A.R.C.; Kay, M.; Uhlenbrook, S. A Review of the SDG 6 Synthesis Report 2018 from an Education, Training, and Research Perspective. Water 2018, 10, 1353. [Google Scholar] [CrossRef] [Green Version]
  11. Batool, R.; Mahmood, K.; Ahmad, S.; Naeem, M. Geographic scenario of drinking water quality of Lahore metropolitan, Pakistan, in response to urbanization and water demand: A GIS perspective. Appl. Ecol. Environ. Res. 2019, 17, 3973–3988. [Google Scholar] [CrossRef]
  12. Dabela, M.C.; Muhye, H.K. Water supply and demand scenario of Dilla Town, Southern Ethiopia. Int. J. Water Resour. Environ. Eng. 2017, 9, 270–276. [Google Scholar] [CrossRef] [Green Version]
  13. Wang, X.; Zhang, J.; Shahid, S.; Xie, Y.; Jivio, Z. Forecasting domestic water demand in the Haihe river basin under changing environment. Proc. Int. Assoc. Hydrol. Sci. 2018, 376, 51–55. [Google Scholar] [CrossRef] [Green Version]
  14. Kahlown, M.A.; Majeed, A. Water-Resources Situation in Pakistan: Challenges and Future Strategies. Available online: http://www.sciencevision.org.pk/BackIssues/Vol7/Vol7No3-4/Vol7No3&4_2_Water_Resources_Situation_MAkramKahlown.pdf (accessed on 15 April 2022).
  15. Zhang, D.; Sial, M.; Ahmad, N.; Filipe, A.J.; Thu, P.A.; Zia Ud Din, M.; Caleiro, A.B. Water Scarcity and Sustainability in an Emerging Economy: A Management Perspective for Future. Sustainability 2020, 13, 144. [Google Scholar] [CrossRef]
  16. Ashraf, M. Water Scarcity in Pakistan: Issues and Options. Pakistan Council of Research in Water Resources (PCRWR). 2018. Available online: https://pcrwr.gov.pk/wp-content/uploads/2021/07/Water-Scarcity-in-Pakistan-Issues-and-Options-May-18.pdf (accessed on 17 April 2022).
  17. Government of Pakistan. Pakistan 2025 One Nation-One Vision; Planning Commission; Ministry of Planning, Development & Reform: Islamabad, Pakistan, 2014. Available online: https://www.pc.gov.pk/uploads/vision2025/Vision-2025-Executive-Summary.pdf (accessed on 17 April 2022).
  18. Government of Pakistan. National Water Policy; Ministry of Water Resources: Islamabad, Pakistan, 2018.
  19. Maqbool, N. Water Crisis in Pakistan: Manifestation, Causes and the Way Forward; Pakistan Institute of Development Economics (PIDE) Knowledge Brief: Islamabad, Pakistan, 2004; Volume 2022, p. 60. Available online: https://www.pide.org.pk/wp-content/uploads/kb-060-water-crisis-in-pakistan-manifestation-causes-and-the-way-forward.pdf (accessed on 15 April 2022).
  20. Foster, S.; Hirata, R. Groundwater use for urban development—Enhancing benefits and reducing risks. Water Front 2011, 21–29. [Google Scholar]
  21. Foster, S. Global Policy Overview of Groundwater in Urban Development—A Tale of 10 Cities! Water 2020, 12, 456. [Google Scholar] [CrossRef] [Green Version]
  22. Haque, M.M.; Hagare, D.; Rahman, A.; Kibria, G. Quantification of Water Savings due to Drought Restrictions in Water Demand Forecasting Models. J. Water Resour. Plan. Manag. 2014, 140, 04014035. [Google Scholar] [CrossRef]
  23. Javed, H.; Ghani, N.; Ghani, N.; Tahir, A.; Nasir, A.; Zahid, H. Spatiotemporal variability of indoor atmospheric emissions in the mega-city of Pakistan. Appl. Ecol. Environ. Res. 2019, 17, 4133–4146. [Google Scholar] [CrossRef]
  24. Muhammad, A.M.; Zhonghua, T.; Dawood, A.S.; Earl, B. Evaluation of local groundwater vulnerability based on DRASTIC index method in Lahore, Pakistan. Geofis. Intl. 2015, 54, 67–81. [Google Scholar] [CrossRef] [Green Version]
  25. Ahmad, M.; Rafiq, M.; Akram, W.; Tasneem, M.A.; Ahmad, N.; Iqbal, N.; Sajjad, M.I. Assessment of aquifer system in the city of Lahore, Pakistan using isotopic techniques (IAEA-TECDOC—1298). Int. At. Energy Agency IAEA 2002, 109–133. [Google Scholar]
  26. Kahlown, M.A. Study for Groundwater Management for Developing Integrated Water Use Policy and Regulatory Framework: Development of a Three-Dimensional Finite Difference Groundwater Flow Model of Lahore Urban and Peri-Urban Area 2017; Irrigation Research Institute: Lahore, Pakistan, 2017. [Google Scholar]
  27. Kanwal, S.; Gabriel, H.F.; Mahmood, K.; Ali, R.; Haidar, A.; Tahseen, T. Lahore’s Groundwater Depletion-A Review of the Aquifer Susceptibility to Degradation and its Consequences. Tech. J. Univ. Eng. Technol. UET Taxila Pak. 2015, 20, 26–38. [Google Scholar]
  28. Mahmood, K.; Rana, A.D.; Tariq, S.; Kanwal, S.; Ali, R.; Ali, A.H.; Tahseen, T. Groundwater levels susceptibility to degradation in Lahore Metropolitan. Sci. Int. Lahore 2013, 25, 123–126. [Google Scholar]
  29. Qureshi, A.S.; Syed, A.H. Situation Analysis of the Water Resources of Lahore: Establishing a Case for Water Stewardship; WWF-P and Cleaner Production Institute (CPI): Lahore, Pakistan, 2014. [Google Scholar] [CrossRef]
  30. Hassan, G.Z.; Hassan, F.R.; Akhtar, S. Environmental Issues and Concerns of Groundwater in Lahore. Proc. Pak. Aca. Sci. 2016, 53, 163–178. Available online: https://www.paspk.org/wp-content/uploads/2016/10/Environmental-Issues-and-Concerns.pdf (accessed on 15 June 2022).
  31. Cooper, R. Water Management/Governance Systems in Pakistan; K4D Helpdesk Report; Institute of Development Studies: Brighton, UK, 2018; Available online: https://opendocs.ids.ac.uk/opendocs/handle/20.500.12413/14246 (accessed on 12 May 2022).
  32. Government of Pakistan. Preparatory Survey Report on the Project for Energy Saving in Water Supply System in Lahore; Japan International Cooperation Agency; NJS Consultants Co., Ltd.: Lahore, Pakistan, 2014. Available online: https://openjicareport.jica.go.jp/pdf/12154480_01.pdf (accessed on 12 February 2022).
  33. Rauf, T.; Siddiqi, M.W. Price-setting for Residential Water: Estimation of Water demand in Lahore. Pak. Dev. Rev. 2018, 47, 893–906. Available online: http://www.jstor.org/stable/41261261 (accessed on 15 May 2022). [CrossRef]
  34. UN-Water. Groundwater Making the Invisible Visible. Facts and Figures 2022; United Nations: New York, NY, USA, 2022. [Google Scholar]
  35. Government of Punjab. Project for Improving the Capacity of WASAs in Punjab Province; Japan International Cooperation Agency: Lahore, Pakistan, 2018. Available online: https://openjicareport.jica.go.jp/pdf/12308334_01.pdf (accessed on 14 April 2022).
  36. Government of Punjab. Preparation of Master Plans for the Water, Wastewater & Stormwater Drainage of Lahore District; Water and Sanitation Agency; Lahore Development Authority: Lahore, Pakistan, 2014. Available online: https://wasa.punjab.gov.pk/system/files/tor.pdf (accessed on 24 May 2022).
  37. Government of Punjab. Water and Sanitation Agency: Lahore, Pakistan. Available online: https://wasa.punjab.gov.pk/tubewell_timing (accessed on 25 May 2022).
  38. Studzinski, A.; Pietrucha-Urbanik, K. Failure risk analysis of water distribution systems using hydraulic models on real field data. Ekon. Sr. 2019, 1, 152–165. [Google Scholar] [CrossRef]
  39. Kumpel, E.; Nelson, K.L. Intermittent Water Supply: Prevalence, Practice, and Microbial Water Quality. Environ. Sci. Technol. 2016, 50, 542–553. [Google Scholar] [CrossRef]
  40. Kumpel, E.; Nelson, K.L. Mechanisms Affecting Water Quality in an Intermittent Piped Water Supply. Environ. Sci. Technol. 2014, 48, 2766–2775. [Google Scholar] [CrossRef]
  41. Al-Washali, T.; Sharma, S.; Lupoja, R.; Al-Nozaily, F.; Haidera, M.; Kennedy, M. Assessment of water losses in distribution networks: Methods, applications, uncertainties, and implications in intermittent supply. Resour. Conserv. Recycl. 2020, 152, 104515. [Google Scholar] [CrossRef]
  42. Abu-Bakar, H.; Williams, L.; Hallett, S.H. A review of household water demand management and consumption measurement. Jour. Clean. Prod. 2021, 292, 125872. [Google Scholar] [CrossRef]
  43. Mansur, E.T.; Olmstead, S.M. The value of scarce water: Measuring the inefficiency of municipal regulations. J. Urban Econ. 2012, 71, 332–346. [Google Scholar] [CrossRef] [Green Version]
  44. Garrone, P.; Grilli, L.; Marzano, R. Price elasticity of water demand considering scarcity and attitudes. Util. Policy 2019, 59, 100927. [Google Scholar] [CrossRef]
  45. Japan International Cooperation Agency; Nippon Koei Co., Ltd.; Yokohama Water Co. Ltd. Project Research “Key Points for Finding, Formulating and Implementing Non-Revenue Water Reduction Projects”; Japan International Cooperation Agency: Tokyo, Japan, 2020. Available online: https://openjicareport.jica.go.jp/pdf/12353611.pdf (accessed on 6 June 2022).
  46. Olmstead, S.M. The economics of managing scarce water resources. Rev. Environ. Econ. Policy 2020, 4, 179–198. [Google Scholar] [CrossRef] [Green Version]
  47. Bibi, S.; Farooqi, A.; Ramzan, M.; Javed, A. Health risk of arsenic in the alluvial aquifers of Lahore and Raiwind, Punjab Province, Pakistan: An investigation for safer well water. Toxicol. Environ. Chem. 2015, 97, 888–907. [Google Scholar] [CrossRef]
  48. Akhtar, M.M.; Zhonghua, T.; Sissou, Z.; Mohamadi, B. Assess arsenic distribution in groundwater applying GIS in capital of Punjab, Pakistan. Nat. Hazards Earth Syst. Sci. Discuss. 2015, 3, 2119–2147. [Google Scholar] [CrossRef]
  49. Water in Asian Cities, Utilities Performance and Civil Society Views; Asian Development Bank (ADB): Mandaluyong, Metro Manila, Philippines, 2004; Available online: https://www.adb.org/sites/default/files/publication/28452/water-asian-cities.pdf (accessed on 14 April 2022).
  50. Guragai, B.; Takizawa, S.; Hashimoto, T.; Oguma, K. Effects of inequality of supply hours on consumers’ coping strategies and perceptions of intermittent water supply in Kathmandu Valley, Nepal. Sci. Total Environ. 2017, 599–600, 431–441. [Google Scholar] [CrossRef]
Figure 1. Study area: (a) WASA service area in Lahore City; and (b) townships in WASA service area.
Water 14 02197 g001
Figure 2. Percentages of connection numbers and water consumption for each tariff category in 2020.
Water 14 02197 g002
Figure 3. Billed water consumption per connection: (a) time-series in Tajpura, and (b) for the six townships in 2020. Note: the dot points in the box-plot indicate outliers.
Water 14 02197 g003
Figure 4. Metered water consumption per connection: (a) time-series in Tajpura, (b) for the six townships in 2020, and (c) correlation between service population and metered consumption in Tajpura.
Water 14 02197 g004
Figure 5. Water production per connection: (a) time-series in Tajpura; (b) for the six townships in 2020; and (c) monthly variations in production, billed consumption, and metered consumption for WASA Lahore in 2020, based on data of the six townships.
Water 14 02197 g005
Figure 6. Water losses: (a) time-series of NRW and water loss in Tajpura; (b) NRW and water loss estimated by billed and metered consumption for the six townships in 2020; and (c) correlation between water losses and metered consumption per connection in the six townships.
Water 14 02197 g006aWater 14 02197 g006b
Figure 7. (a) Population inside and outside of the WASA supply area in Lahore; and (b) projected water demands up to 2040.
Water 14 02197 g007
Figure 8. Time-series of static groundwater levels in Tajpura.
Water 14 02197 g008
Figure 9. Electricity cost in Tajpura: (a) time-series of unit electricity cost; and (b) monthly electricity cost and revenue in 2020.
Water 14 02197 g009
Figure 10. Monthly average bill per connection for metered and unmetered consumers in Tajpura in 2020.
Water 14 02197 g010
Table 1. Consumption slabs for unmetered customers before and after 2018.
Consumption Slabs for Unmetered Customers
Land Area (Marla 1)Consumption (GPM 2)
Before 2018After 2018
1–310,00012,500
4–512,50015,625
6–715,00018,750
8–1017,50021,875
11–1520,00025,000
16–2025,00031,250
21–4030,00037,500
>4040,00050,000
Notes: 1 1 Marla ≈ 21 m2. 2 1000 GPM (gallons per month) = 4.6 cubic meters per month.
Table 2. Customer connections, tube wells, and production capacity in the six townships.
TownshipUnmetered ConnectionsMetered ConnectionsTube WellsProduction Capacity (m3/s)Connections per Tube Well
AIT122,46651981079.11193
RT123,1491439806.91557
GBT118,587426717214.5714
ABT
(Tajpura)
110,643
(27,669)
714
(182)
73
(18)
6.1
(1.42)
1525
(1547)
NT105,8341347897.01204
ST103,3741065776.21356
Total684,05314,03059849.81258 (average)
Table 3. Water and sewer tariff for metered and unmetered customers.
Tariff for Metered and Unmetered Customers
(Since 2004)
Consumption (GPM 1)Tariff
(PKR 2/1000 Gallons)
WaterSewerTotal
Without sanitation fee
Up to 500012.889.0221.90
5001 to 20,00020.8614.635.46
20,00127.319.1146.41
With 30% sanitation fee included in sewer rate
Up to 500012.8811.7824.66
5001 to 20,00020.8619.0739.93
20,00127.324.9652.26
Notes: 1 1000 GPM (gallons per month) = 4.6 m3 per month; 2 10 PKR ≈ 0.05128 US$ (as of 18 May 2022).
Table 4. Summary of customer survey in August–September 2021 (n = 294).
DescriptionResponses
House size (m2)62–420 (3–20 Marla)
Connection type (metered/un-metered)1.02%/98.98%
Drinking water sourcePiped water, filter water (treated water), bottled water
Monthly expenditure for drinking water: treated water/bottled water US$ (PKR)Free/0.52 (100) to more than 5.18 (1000)
Water quality (good/acceptable/bad)4.8%/78.9%/16.3%
Water quantity (sufficient/reasonable/insufficient)4.8%/78.9%/16.3%
Supply hours (h)3–12
Water shortage (yes/no)294/0
Water storage (yes/no)294/0
Storage volume (m3)0.45–4.54
Booster pump installation (yes/no)294/0
Publisher’s Note: MDPI stays neutral with regard to jurisdictional claims in published maps and institutional affiliations.

