
Impact of Local Scour around a Bridge Pier on Migration of Waved-Shape Accumulation of Ice Particles under an Ice Cover

1
School of Civil and Hydraulic Engineering, Department of Municipal Engineering, Hefei University of Technology, Hefei 230009, China
2
School of Engineering, Environmental Engineering Program, University of Northern British Columbia, Prince George, BC V2N 4Z9, Canada
*
Authors to whom correspondence should be addressed.
Water 2022, 14(14), 2193; https://doi.org/10.3390/w14142193
Submission received: 22 May 2022
/
Revised: 29 June 2022
/
Accepted: 8 July 2022
/
Published: 11 July 2022
(This article belongs to the Special Issue Fluvial Hydraulics Affected by River Ice and Hydraulic Structures)
Abstract
:The migration of a waved-shape accumulation of ice particles under an ice cover (referred to as “ice wave” in this study) is a phenomenon of transport of ice particles during an ice accumulation process in rivers. The migration of an ice wave will affect the pier scour. On the other hand, the local scour at the pier will affect the migration of ice waves. The interaction between the migration of ice waves and local scour around a pier is a very complicated process since not only the channel bed deforms, but also the ice jam develops simultaneously. By conducting a series of flume experiments, the interaction between the local scour around bridge piers and the migration of ice waves was studied. By applying both continuity and momentum equations, an empirical equation has been derived for predicting the thickness of ice waves around the pier. The impacts of the scour hole on the thickness of ice waves around the pier have been studied. The thickness of the wave crest and the migration speed of ice waves have been investigated. Similar to a scour hole in a sand bed, an “ice scour hole” appeared at the bottom of the ice jam around the pier. The existence of the “ice scour hole” affects the development of ice waves. A formula for calculating ice transport capacity has been obtained. Results calculated using the derived formula are in good agreement with those of laboratory experiments.
1. Introduction
The presence of ice jams in rivers leads to a decrease in the flow capacity and could potentially result in flooding and collapse of hydraulic structures [1]. When an ice cover is formed in a river, frazil ice particles from upstream are entrained by water and submerged under the ice cover and then accumulate under the ice cover. A special phenomenon called ice jam is formed along a river reach depending on the hydraulic and climate conditions [2,3]. During the formation process of an ice jam, a waved-shape accumulation of ice particles (defined as the “ice wave” in this study) has been noticed [4]. The migration of an ice wave is a movement of a group of ice particles under an ice cover. This process should be similar to the phenomenon of sand waves on a riverbed surface during sediment movement and bedload motion. When a bridge pier is present in a river, the pier affects the transport capacity of ice particles and floes, the thickness of ice jams, and the water level around it. In the meantime, the appearance of an ice jam results in intense local scour around piers [5]. The presence of scour holes around bridge piers changes the flow structure and influences the migration of the ice wave process around bridge piers.
The evolution of an ice jam is affected by hydraulic, thermal, and boundary conditions. The mechanism of ice jam evolution in a channel has been investigated by researchers, either based on field measurements in natural rivers, flume experiments in laboratories, or numerical simulations. Beltaos et al. [6,7,8] made long-term observations on ice jam thickness during the spring breakup period of the Matapedia River. Theoretical analysis on the internal strength characteristics of ice jam was also conducted. Based on field observations of ice jams in the Yellow River, which is 70-km long, Sui et al. [9,10] studied the mechanism of ice jam evolution and the riverbed deformation. Results indicated that variations of the ice jam thickness, water levels, and the changes of riverbed deformation depend on flow Froude number. Some numerical simulations have been conducted to study ice jam evolution and ice transport. Knack and Shen [11] modified the Rouse formula for calculating the suspended sediment transport discharge. Yang et al. [12] proposed an equation to describe the formation of an ice jam and simulated the evolution process of an ice jam in the Songhua River. Mao et al. [13] and Wang et al. [14] built some synthetic and dynamic mathematic models for simulating river ice jam. Szydłowski and Kolerski [15] used the DynaRICE model to simulate river ice hydrodynamics in the vicinity of bridge piers. Results indicated that the new structure in a channel has a notable effect on flow velocity and ice transport capacity. Instead of the impact of ice jam on bridge piers, some researchers carried out research work regarding the interaction of debris and bridge piers. Istrati et al. [16] investigated the tsunami-borne debris loading on bridges to mention as an example here.
The formation of a stable ice jam is the sequence of the balance between the drag force caused by flowing water, the partial force of the gravity of the ice jam along the flow direction, and the supporting force of the channel bank to the ice jam [1]. By considering the effect of the secondary vortex and neglecting the cohesive force between ice particles, equations for describing the changes of ice jam thickness have been derived [17].
The flow condition in a river changes significantly in the presence of bridge piers and then affects the evolution process of an ice jam. Beltaos et al. [18] pointed out that when the resultant force of the drag force and gravity force is greater than the resistance caused by bridge piers, it is difficult to develop an ice jam. Wang et al. [19] studied the stability of an ice jam around a pier and developed an equation for describing an ice jam under an equilibrium condition. By conducting a series of flume experiments, Wang et al. [20,21] further studied the stability of an ice jam around a bridge pier and proposed the criteria for the formation of an ice jam around piers. The influence of bridge piers on the evolution of an ice jam was also investigated.
The presence of an ice cover/jam in a river results in a shift of the maximum velocity from the water surface to the point between the ice cover/jam and channel bed, depending on the roughness of the ice cover/jam and channel bed. This means, the maximum flow velocity under an ice cover/jam is shifted closer to the channel bed, comparing to that under an open flow condition. As a consequence, shear stresses near the channel bed under an ice-covered or ice-jammed flow condition increase and more sediment will be eroded comparing to that under an open flow condition [22]. Carr and Tuthill [23] studied the scour hole at the Melvin Price Lock and claimed that a large scour hole developed with a smaller discharge under an ice-covered flow condition. To date, some important experimental studies on local scour around bridge piers under ice-covered conditions have been conducted [24,25,26,27,28,29,30,31,32]. Results of those studies showed that the depth of scour holes under an ice cover was clearly deeper than that under an open flow condition. The maximum scour depth increased with the increase in the roughness of an ice cover. Wang et al. [5] analyzed the local scour under an ice-jammed flow condition through laboratory experiments. Results of these experimental studies show that the size of a scour hole is affected by the dynamic process of the accumulation of an ice jam, namely, the variation of the thickness of an ice jam around bridge piers influences the local scour process. It is found that the maximum scour depth under an ice jam was much larger than that under both an open flow and sheet ice-covered flow conditions.
At present, the existing studies are mainly focused on the influence of bridge piers on the evolution process of an ice jam. Very few studies have been carried out by considering the impacts of the scouring process at piers on the evolution of an ice jam. Very few data about systematic observations of the migration of ice waves under ice jams are available [33]. The theory and mechanism of the migration of an ice wave has not been explored. A scour hole with deeper depth and larger scour area will be formed under an ice-jammed flow condition [33]. On the other hand, the existence of a scour hole should affect the migration process of the ice wave and ice transport process. In the present paper, based on laboratory experiments, the interaction between the local scour at a bridge pier and the migration process of ice waves around the pier is studied. The migration speed of an ice wave and ice transport process at the pier was investigated, and a formula for determining the ice transport capacity was derived.
2. Methods and Materials
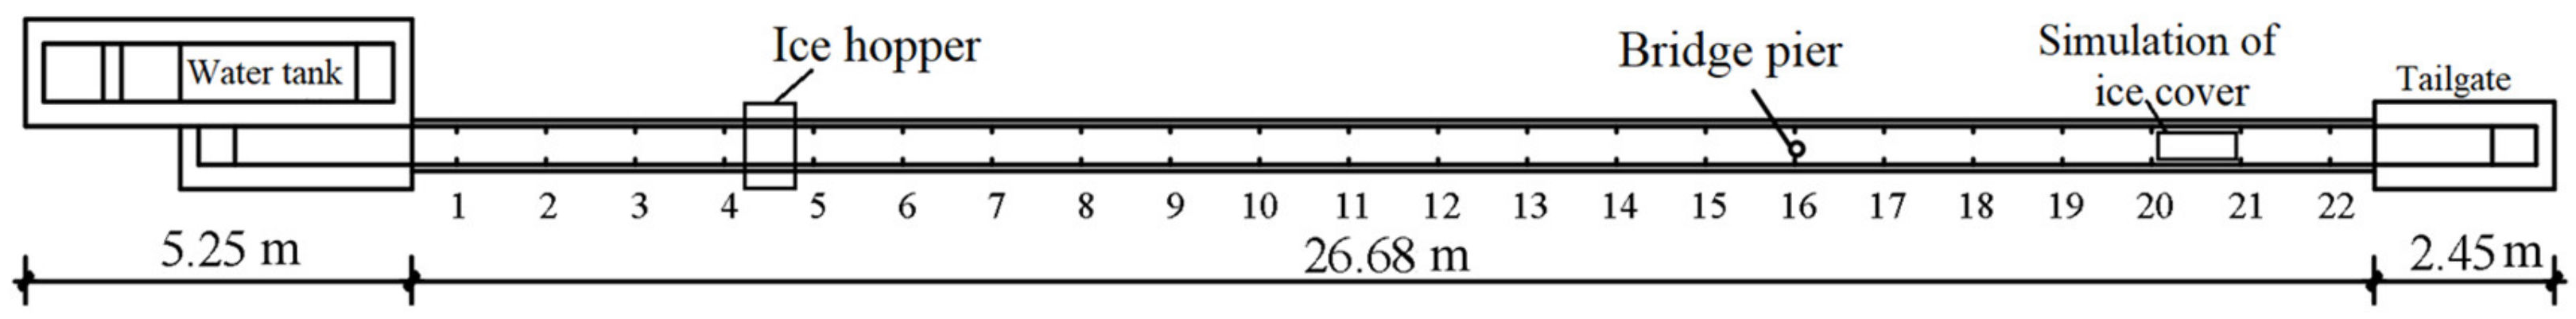
Laboratory experiments were carried out in a flume, as shown in Figure 1. The flume was 26.68 m long and 0.4 m wide. With an equal spacing distance of 1.2 m, 22 cross sections (CS) for measurements along the flume were setup. A pressure transducer was installed at each measurement CS. The wall of the flume was smooth, tempered glass. The bottom of the flume between CS-2 and CS-22 was covered by a layer of sand to form a sand bed. The initial thickness of the sand bed was 10 cm. The inhomogeneity coefficient (η) of sand is 1.61 mm with a median grain size (d50) of 0.713. Before each experimental run, the entire sand bed was leveled with the slope of 0. To initiate the formation of an ice jam, a Styrofoam panel, which was 1.0 m long and 0.39 m wide, was placed on the water surface at CS-20. The CS-4 was chosen as the control cross section. At the beginning of each experimental run, the average approaching flow velocity (V0) and flow depth (H0) at CS-4 were used as the initial hydraulic condition. In this experimental study, the model ice particles were made of polyethylene material with a mass density of 0.918 g/cm3, which was nearly identical to that of natural ice of 0.917 g/cm3. The shape of the model ice particles was flat-ellipsoid with the longest diameter of 3.5 mm. Model ice particles were discharged from an ice hopper that was located over the flume between CS-2 and CS-3. The discharge rate of ice particles from the ice hopper could be adjusted as required. A cylinder with a diameter of D = 2 cm was used to model a bridge pier and installed in the center of the flume at CS-16.
Results of the experiments showed that if the flow intensity is too high, the frazil ice particles are unable to accumulate for the development of an ice jam and the ice wave phenomenon does not occur. In this study, the flow Froude number was used as an important factor for describing the flow intensity relevant for the accumulation process of an ice jam. Thus, when the flow Froude number is more than the critical Froude number for the development of an ice jam, frazil ice particles cannot accumulate under an ice cover, but will be washed out and transported to the downstream section of the channel, referred as to the “wash-load” [34]. To investigate the impact of the scour hole on the migration of ice waves, flow conditions for all experimental runs were controlled with the flow Froude number less than its critical value. Under such a flow condition, ice waves could be generated in each experimental run. In the present study, to compare the result of ice wave migration with the presence of scour hole at the pier to that without a local scour, experiments were conducted with and without the presence of a local scour around the pier. The flow conditions for 16 experimental runs are summarized in Table 1. In the present study, all scour experiments used clear water scour with an experiment duration of 12 h to ensure that both local scour and accumulation of an ice jam achieved equilibrium conditions as long as the water level and scour depth at the pier did not change. The selections of proportion of relevant parameters in this experimental study are conformed to the General Code for Design of Highway Bridges and Culverts (JTG D60-2004) [35].
3. Interaction of Local Scour and Ice Wave Migration
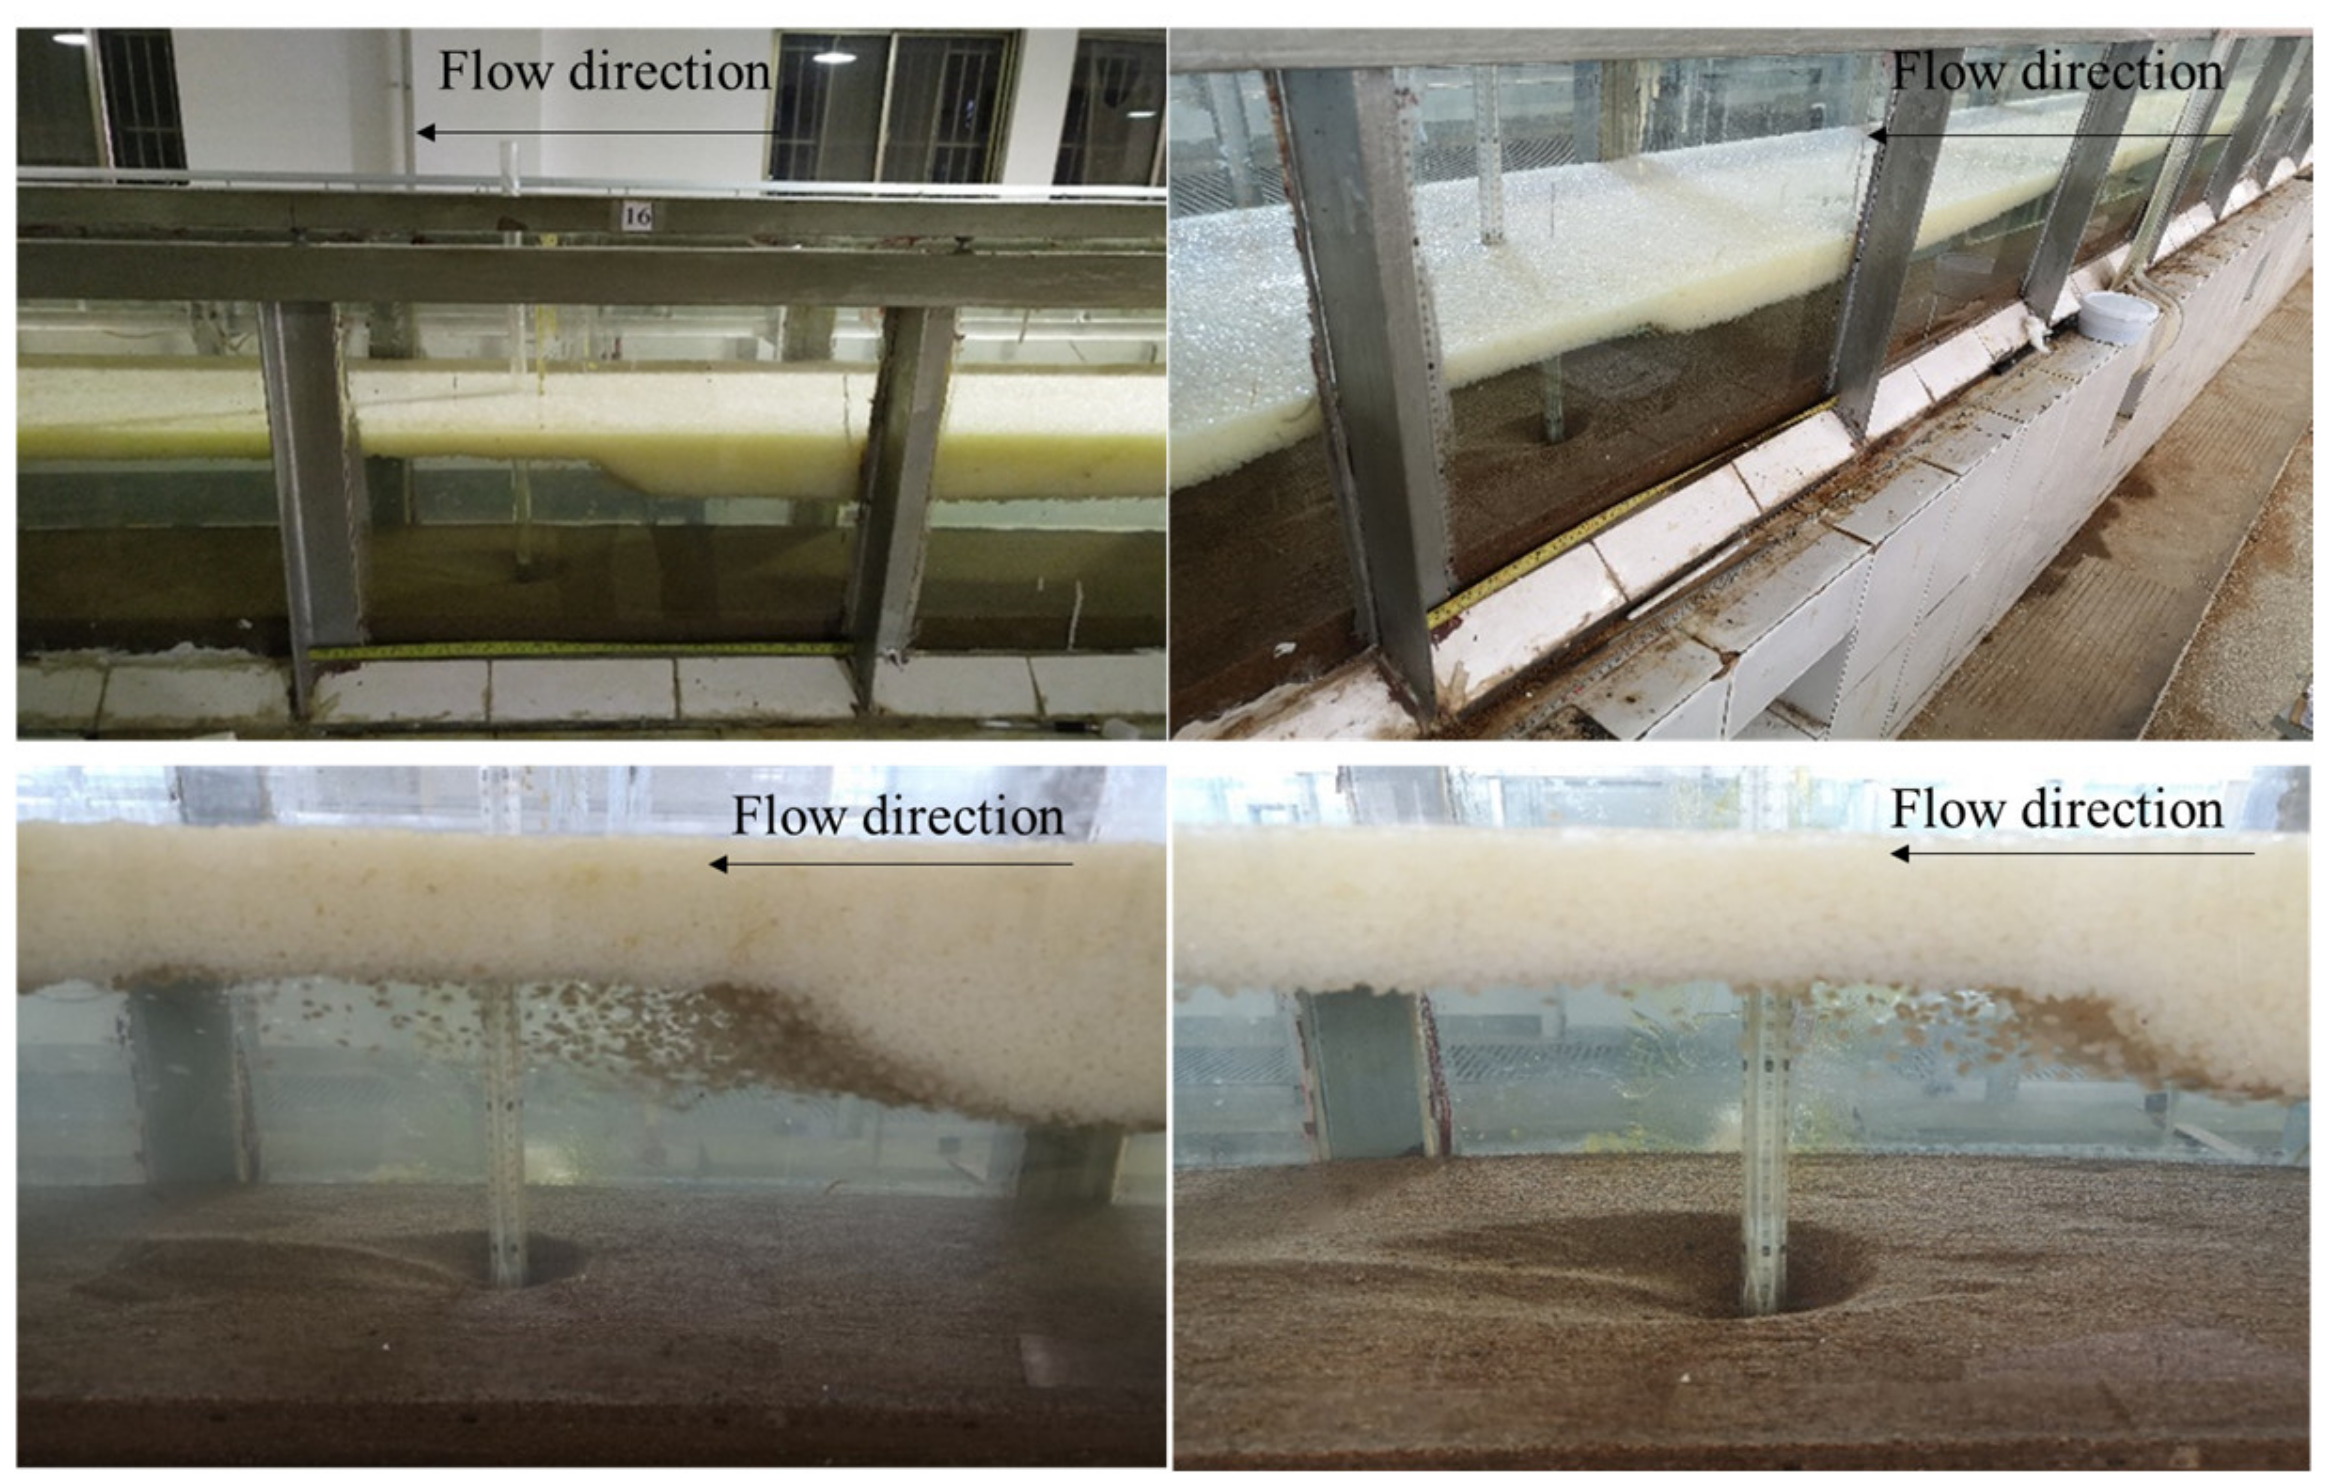
Wang et al. [5] pointed out that the development of an ice jam can be divided into following three stages: the initial development of an ice jam from downstream toward upstream of a channel (stage 1); the formation of an initial ice jam along the entire channel (stage 2); and the thickening process of the initial ice jam accompanied by the migration process of ice waves (stage 3). During the third stage, the incoming ice particles from the upstream section will be entrained by flowing water and submerged and accumulated under the initial ice jam and gradually transport downstream. As can be seen in Figure 2, ice waves may appear during this process, depending on flow Froude number.
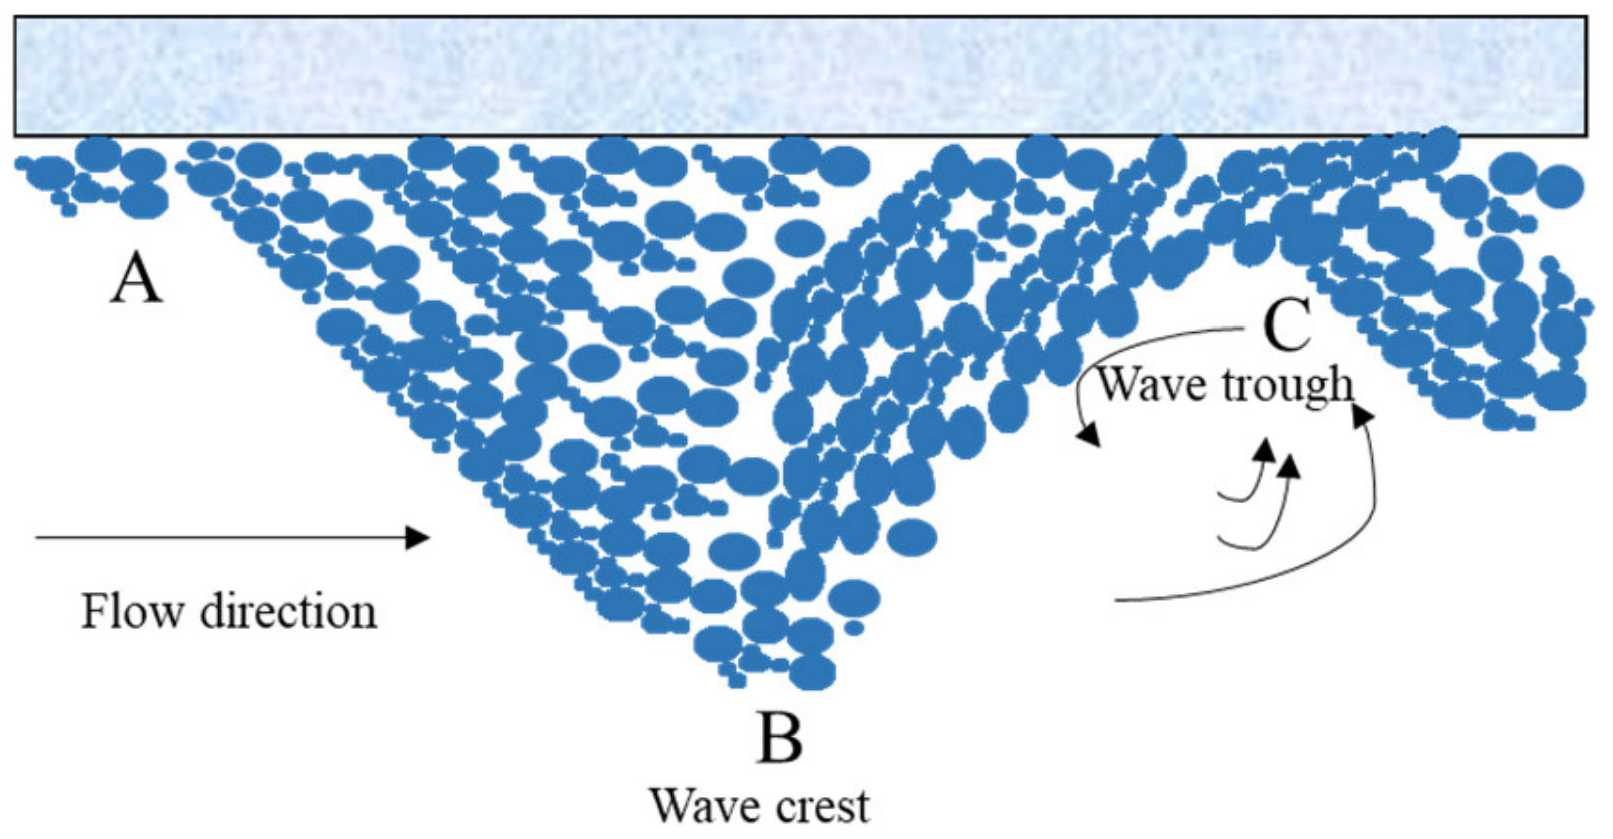
As shown in Figure 3, during the migration process of an ice wave, along the flow direction, points “A”, “B”, and “C” represent the “wave starting point”, “wave crest”, and “wave trough” of an ice wave, respectively. The A-B section is the stoss side of an ice wave, and the B,C section is the lee side of an ice wave [34]. The appearance of ice waves under an ice jam creates extra resistance to the flowing water. Due to variations in the thickness of the ice jam along the A-C channel section, the velocity field under an ice wave (along the channel section A-C, as shown in Figure 3) becomes complicated. The flow depth under point “B” is the least, implying the maximum flow velocity comparing to that at another place. Thus, ice particles at the crest of an ice wave will be eroded and delivered downstream. In the third stage, the local scour process around a bridge pier interacts with the ice jam evolution. It has been observed that both the scour hole and ice wave morphology does not change significantly or reach a dynamic equilibrium. After a scour hole around a pier reaches an equilibrium condition, the scour hole has the deepest depth and largest range and thus it should have the greatest influence on the migration of an ice wave.
Although the migration process of an ice wave is similar to that of sand waves formed by sediment on riverbeds, the drag force, buoyancy force, and gravity of ice particles under an ice jam are different from those of sediment particles in a riverbed. The sediment particles in a riverbed are subjected to more gravity than the buoyancy force, while ice particles at the bottom of an ice jam are subjected to larger buoyancy force than gravity. An ice particle is more easily disturbed by flowing water than a sediment particle, since the difference between water mass density and ice mass density is less than that between sand mass density and water mass density. With a local scour at the pier, the presence of a scour hole further changes flow conditions around the pier. Depending on the location of ice particles and the kinetic energy of flowing water, the moving speeds of ice particles are different. Thus, different ice particles will be deposited at different places. It should be noted that the features of ice waves around the pier are the main objective in this study.
Regarding the influence of the thickness of an ice wave on the depth of the scour hole, according to Wang et al. [34], the thicker the ice jam, the deeper the scour hole, and thus, the higher risk to the pier. Under the action of an ice wave, a channel reach from the upstream ice jam head (or wave front or free water surface) to the pier is considered the study “control volume”. Forces acting on this control volume are shown in Figure 4.
The continuity equation for flow water passing this control volume under an ice wave can be written as follows:
where B is flume width; x is the distance from the left flume wall (perpendicular to the flume wall); dx is the width of each unit profile; H(x) is the flow depth in front of an ice wave at a distance of x from the left flume wall; vw0(x) is the depth-average flow velocity in front of the ice wave at a distance of x from the left flume wall; Hw1(x)is the flow depth above the initial sand bed at the pier at a distance of x from the left flume wall; vw1(x) is the depth-average flow velocity at the pier under the ice jam at a distance of x from the left flume wall; Hs1(x) is the depth of the scour hole at a distance of x from the left flume wall; and Hs1(x) = 0 in a sand bed without a scour, as shown in Figure 4.
The flow velocity distribution along the transverse direction (perpendicular to the flow direction or flume wall) can be approximately expressed as follows [36]:
where d is the distance from this profile to the left or right-side flume wall; vm0 is the depth-average flow velocity in the center of the flume in front of the ice wave, vm1 is the depth-average flow velocity in the center of the flume at the pier (note, the bridge pier is located at the center of the flume); K is the transverse distribution parameter of flow velocity.
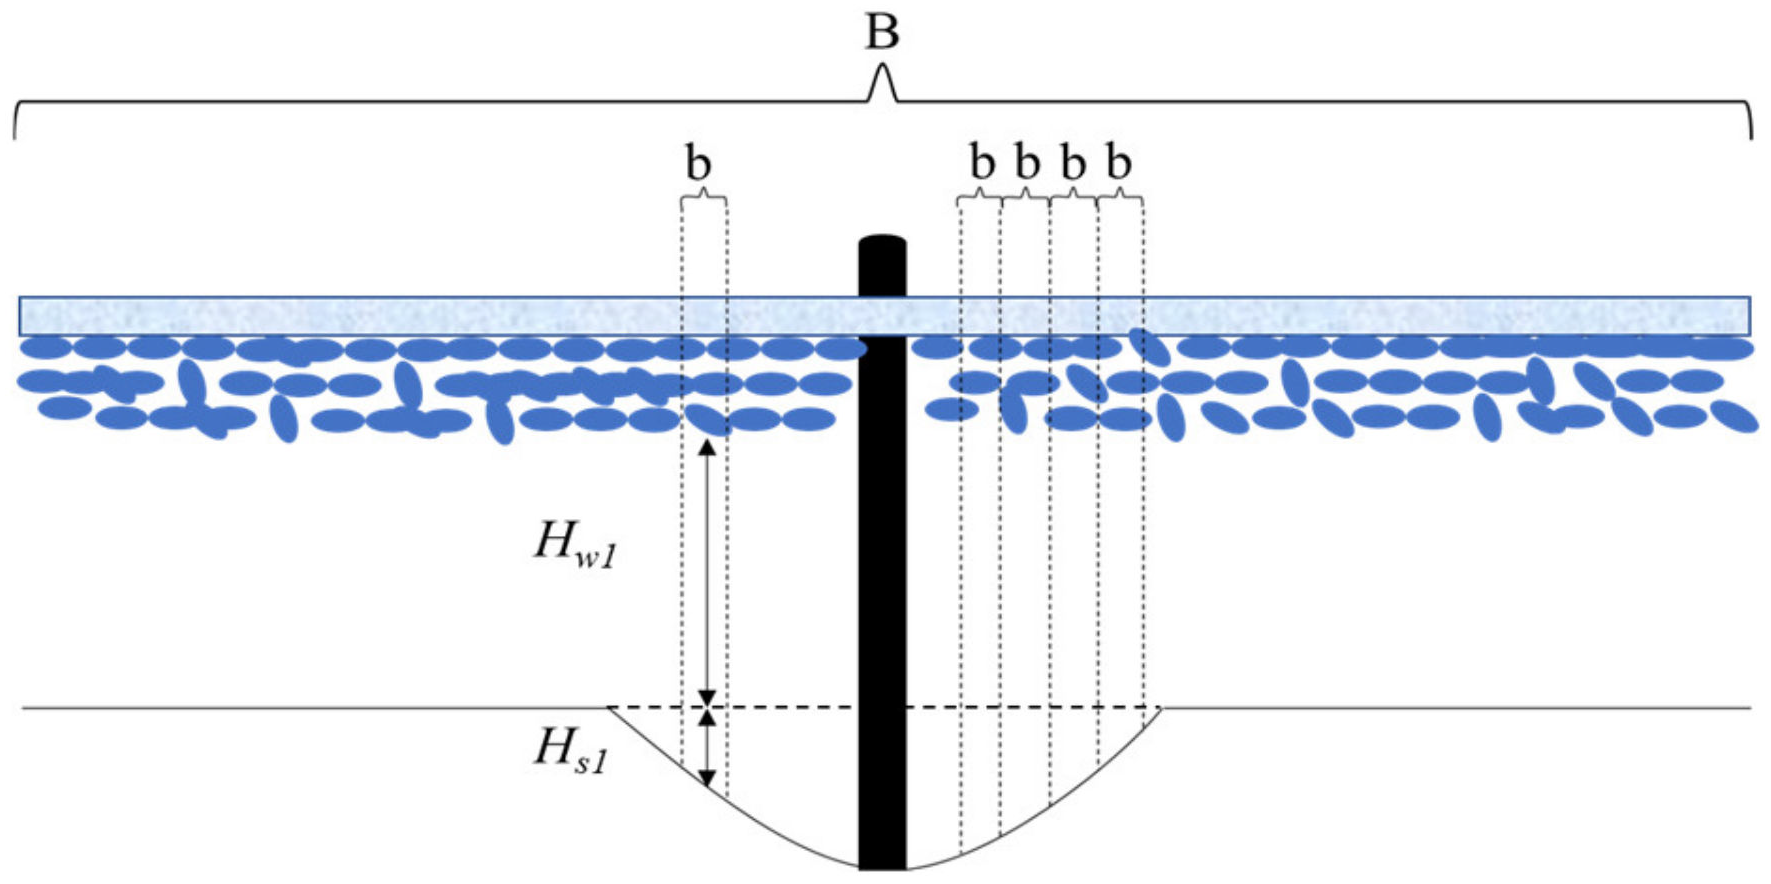
As shown in Figure 5, the width of the channel cross section at the pier (transverse direction of the flume) was divided into n units. The width of each unit can be expressed as:
where b is the width of each unit, and the sum of width of all units is B; H is the flow depth in front of an ice wave in this transverse unit; Hw1, Hs1 are flow depth under an ice jam (above the initial sand bed) and the scour hole depth in this transverse unit, respectively, as shown in Figure 5.
In each transverse unit, the continuity equation near the pier along the flow direction can be written as:
Considering the influence of the local scour around the pier, flowing water under an ice wave is taken as the control volume, and the momentum equation along the flow direction is expressed as:
where ΣF is the total force in the direction of flow; ρw is the mass density of water; Qw is the discharge of flow.
The difference of pressure force between the upstream control surface (cross section) and downstream control surface of flow under the ice wave is:
where FP is the difference between the pressure force at upstream control surface (at the ice wave front) and that at downstream cross section (at the pier); Hi is the thickness of ice wave crest; g is gravitational acceleration.
The drag force resulted from an ice wave to the control volume can be expressed as:
where F1 is the drag force caused by an ice wave; Ci is the drag coefficient, which ranges from 5.5 to 12.5 and increases with the increase of the ice discharge rate Qi.
The resistance force caused by the pier when flow passes the pier is:
where F2 is the resistance force caused by the pier, and other transverse units without the pier are F2 = 0; CD is the resistance coefficient, which is related to the Reynolds number; D is the pier diameter.
The resistance to the control volume caused by the channel bed and side walls of the flume can be expressed as:
where F3 is the resistance caused by the channel bed and side wall of the flume; Cd is the drag coefficient; nc is composite roughness coefficient of the flume; L is the length of the control volume between the upstream and downstream control surfaces.
Combining Equations (5)–(10), the following equation is derived:
It can be concluded that the thickness of the ice wave crest under the influence of the local scour process around the pier can be expressed as follows:
where ; ; ; .
Equation (12) is simplified as follows:
where ; ; .
The appearance of an ice wave under an ice cover leads to changes in the thickness of an ice jam, since both the crests and troughs of ice waves appear alternately along an ice jam from upstream to downstream. In fact, an equilibrium ice jam belongs to a dynamic equilibrium. The equilibrium thickness of an ice jam reported in the present study corresponds to the average thickness of wave crest and wave trough. Results showed that the ratio of the wave crest thickness to the average thickness of an ice jam is about 2–3, and this ratio increases with the increase in the ice discharge rate Qi. Because ice wave affects the local scour depth and the mechanical load on the pier, an ice wave with a thicker crest should be vulnerable to failure of the bridge. By substituting the experimental data into the above formula, the thickness of an ice wave can be obtained. At the cross section where the pier is located, the origin of the transverse coordinates is located at the center of the flume (the pier center) is set. The transverse distribution of thickness of ice waves at this cross section is shown in Figure 6. The calculated results using the above formula agree well with results of experiments.
The distribution of thickness of an ice wave in the transverse direction has the following features:
- (1)
- As shown in Figure 6, the closer to the central axis of the flume, the smaller the thickness of an ice wave and the deeper the scour hole. Thus, the cross-sectional area for flow at the pier is larger. Around the pier, it is difficult for ice particles to accumulate here because of the existence of the downflow and vortices around the pier. Results of experiments showed that, similar to a scour hole in a sand bed, an “ice scour hole” appeared at the bottom of the ice jam around the pier. The appearance of the “ice scour hole” is resulted from the presence of the pier. The existence of the “ice scour hole” affects the development of ice waves. Interestingly, the thickness of the wave crest at this cross section (where the pier is located) is less than that at other cross sections without the presence of a pier.
- (2)
- With the increase in the distance from the flume center toward the flume wall, the thickness of the wave crest increases first and then decreases. In the zone around the pier, a scour hole in the sand bed developed, and the wave crest thickness increases slightly because the presence of a scour hole leads to the increase in the cross-sectional area for flow. Further away from the flume center (or the pier), for zones without the presence of scour holes in the sand bed, the wave crest thickness reaches a constant toward the flume side wall.
To analyze the impacts of the local scour in the channel bed on the migration of an ice wave under different experiment conditions, the ice wave thickness of each transverse unit was averaged to obtain the average ice wave crest thickness at the cross section where the pier presents and was used as the ice wave crest thickness for this cross section. The comparison between the calculated results and those of experiments is shown in Table 2. In Table 2, the wave crest thickness with the presence of the local scour in the bed is calculated by Equation (13), and the wave crest thickness without the presence of the local scour is calculated by the formula proposed by Wang et al. [34]. As shown in Table 2, the calculated results agree well with those of experiments. Clearly, under the same hydraulic condition, the appearance of a scour hole around the pier leads to an increase in the thickness of the ice wave crest at the pier.
The flow velocity under an ice wave around the pier is also one of important factors affecting ice transport capacity. Results indicated that the local scour at the pier affects the migration speed of an ice wave passing the pier. The migration of an ice wave is a complex process. During the evolution process of an ice jam, an ice jam may reach a dynamic equilibrium state due to the presence of ice waves along the ice-jammed channel. The wave height and wavelength of each ice wave vary constantly. The simplified schematic diagram of an ice wave is given in Figure 7.
The average height of an ice wave crest was obtained from measured values of an ice wave crest after both the ice jam and local scour process at the pier achieved an equilibrium state, and similarly for obtaining the average length of ice wave. The average migration speed of an ice wave was calculated based on the ice discharge rate during this period. The formula for calculating these factors is expressed as follows:
where is the average height of ice wave crest; is the average length of ice wave; is the average ice wave volume; is the length of the ice wave.
Then, the migration speed of an ice wave can be calculated as follows:
where vi is the migration speed of an ice wave; T is the duration of the selected period for certain time for collecting data.
The migration speed of an ice wave in each experiment was calculated, as shown in Table 3. Compared with the experiment conditions in Table 1, the migration speed of an ice wave with the presence of a local scour is lower than that without a local scour in the bed. Additionally, the faster the flow velocity under an ice jam is, the higher the migration speed of an ice wave is. Under the same flow condition, the presence of a local scour slows down the migration of an ice wave around the pier.
With the presence of a local scour, considering the effects of various influencing factors on the migration speed of an ice wave, the following formula can be used to express the migration speed of an ice wave:
where ni is the roughness coefficient of the ice jam; nb is the composite roughness coefficient of the channel bed and flume wall; ρi is the density of ice; di is the particle grain size of ice; T is the temperature; J is the water surface slope.
In this experimental study, the median grain sizes of ice and sediment particle are consistent. Considering other major variables influencing the migration speed of an ice wave, the following equation for calculating the migration speed of an ice wave under an ice jam was derived:
As showed in the above equation, the migration speed of an ice wave is affected by the flow Froude number, the sum of the scour depth and the water depth under the ice jam where the pier presents, and the ice discharge rate. This equation indicates that the higher the flow Froude number is, the faster the ice waves migrate; the greater the ratio of the water depth under an ice jam, including the scour hole depth to total water depth, the smaller the migration speed of an ice wave; the greater the ice discharge, the greater the migration speed of an ice wave.
The ice transport capacity through the migration speed of an ice wave with the presence of a scour hole refers to the ice transport capacity per unit time at the pier. After the ice jam achieved a dynamic equilibrium state, although the migration process of ice waves along the ice-jammed channel continues, the mean value of the ice transport capacity per unit time tends to be stable. After an ice jam achieved a dynamic equilibrium, the ice transport capacity at the pier was equal to the incoming ice discharged from the ice hopper. By applying the mass conservation equation to the process of ice jam accumulation, the ice transport capacity without the presence of a local scour at the pier was given as follows [34]:
where QT is the ice transport capacity; p is the porosity of an ice jam in this study, p = 0.4; yi is the thickness of an ice jam at any cross section; and t is time.
The migration speed of an ice wave can be expressed as:
The following equation can be obtained by combining Equations (20) and (21):
At any location of x0 and at any instant time of t0, Equation (22) can be expressed as:
where h0 is the ice jam thickness at the cross section of the ice wave trough.
By ignoring the ice transport capacity below the trough of an ice wave, the ice wave transport capacity without a presence of a local scour at the pier can be expressed by the following formula:
where α is the correction coefficient of ice wave bottom morphology. The value ranges from 0.6 to 0.8.
Substituting the ice wave crest thickness and the migration speed of an ice wave by considering the influence of a local scour at the pier into the above equation, the ice transport capacity at the pier with the presence of a local scour can be derived as:
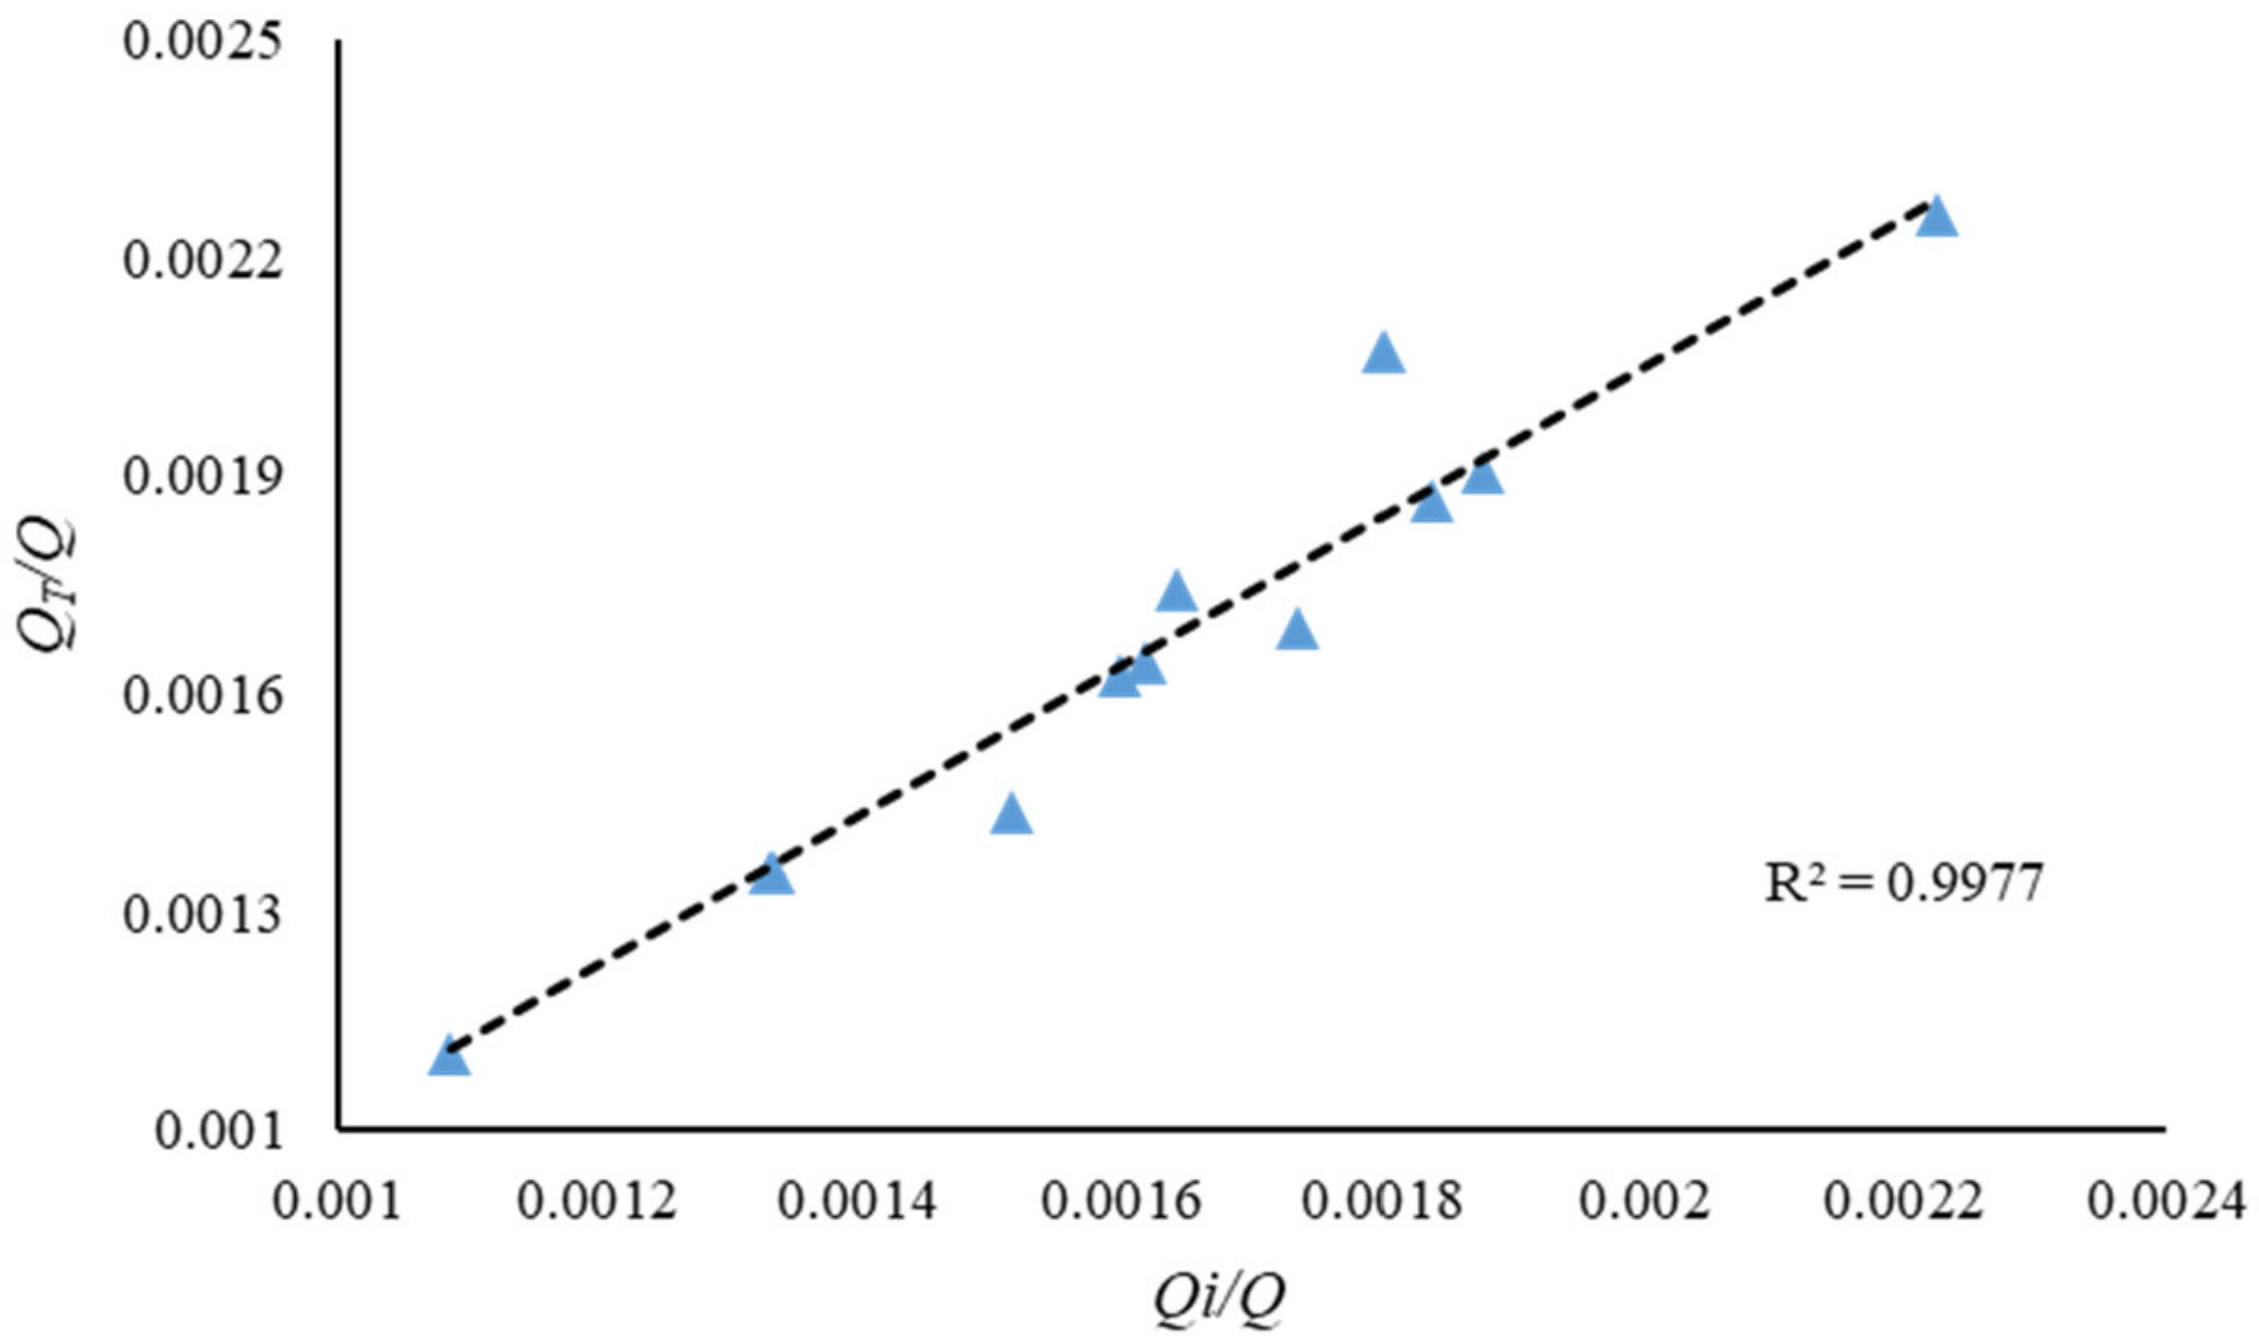
The ice transport capacity by means of the migration process of ice waves with a presence of a scour hole under different hydraulic conditions (such as ice discharge rate, flow velocity, and water depth) can be determined by Equation (25). It can be seen from this equation that the ice transport capacity at the pier decreases with the increase in both the scour hole depth and the flow depth under an ice jam. This is because the presence of a local scour increases the cross sectional area of flow at the pier and the migration speed of an ice wave at the pier slows down. As shown in Figure 8, based on data collected from experiments, the ice transport capacities calculated using the above equation with the presence of a local scour at the pier agree well with those of laboratory experiments.
4. Conclusions
In the present study, to analyze the influence of a scour hole on the migration of ice waves, laboratory experiments have been carried out under different flow and boundary conditions. The following results have been drawn:
- By combining the continuity equation and momentum equation, the equation for calculating the thickness of ice wave crest under the influence of a local scour was derived. Results showed that the ice wave thickness near the central axis of the flume is smaller. This “ice scour hole” phenomenon at the bottom of an ice jam near the pier is similar to the scour hole at the pier in the sand bed. With the increase in the distance from the flume center, the thickness of the wave crest increases first and then decreases. Further away from the central axis of the flume, for zones without the presence of scour holes in the sand bed, the wave crest thickness reaches a constant toward the flume walls. The calculated average ice wave thickness of the whole section is in good agreement with result of experiments regardless of whether or not a local scour is present in channel bed. Under the same hydraulic condition, the presence of a local scour at a pier lead to an increase in the thickness of the wave crest.
- Under the same hydraulic condition, the appearance of a scour hole slows down the migration speed of an ice wave at the pier. With the presence of a local scour at the pier, the dimensionless relation for determining the migration speed of an ice wave was obtained based on experimental data. Results showed that the larger the ice discharge rate and flow Froude number is, the higher the migration speed of an ice wave is. The greater the ratio of the water depth under an ice jam, including the scour hole depth to total water depth, the smaller the migration speed of an ice wave.
- The ice transport capacity with the presence of a scour hole was analyzed. The ice transport capacity at the pier decreases with the increase in both the scour hole depth and the flow depth under an ice jam. The developed equation can be used to determine the ice transport capacity by means of the migration speed of ice waves considering a local scour process at a bridge pier. The calculated results agree well with those of experiments in the laboratory.
- The interaction between an ice jam and local scour at a pier is very complicated and has hardly been conducted. This study, based on laboratory experiments, belongs to conceptual research instead of research based on field prototype data from a natural river. More field observation data are needed to verify results obtained from laboratory experiments. Considering the influence of different pier types, river bends, and side wall effects, relevant experiments need to be further carried out.
Author Contributions
Conceptualization, J.W. and J.S.; methodology, Z.H.; investigation, Z.H. and J.S.; software, Z.H.; validation Z.H.; data curation, Z.H.; formal analysis, Z.H.; writing-original draft preparation, Z.H.; writing—review and editing, J.S.; funding acquisition, J.W.; laboratory works, Z.H., F.S. and Z.L. All authors have read and agreed to the published version of the manuscript.
Funding
This research was supported by the National Natural Science Foundation of China (grant nos. 51879065). The authors are grateful for the financial support.
Institutional Review Board Statement
Not applicable.
Informed Consent Statement
Not applicable.
Data Availability Statement
The data are available.
Conflicts of Interest
The authors declare no conflict of interest.
References
- Beltaos, S. River Ice Jams: Theory, Case Studies, and Applications. J. Hydraul. Eng. 1983, 109, 1338–1359. [Google Scholar] [CrossRef]
- Sui, J.; Karney, B.W.; Fang, D. Variation in water level under ice-jammed condition–Field investigation and experimental study. Hydrol. Res. 2005, 36, 65–84. [Google Scholar] [CrossRef]
- Sui, J.; Wang, J.; Balachandar, R.; Sun, Z.; Wang, D. Accumulation of frazil ice along a river bend. Can. J. Civ. Eng. 2008, 35, 158–169. [Google Scholar] [CrossRef]
- Sui, J.; Wang, D.; Karney, B.W. Suspended sediment concentration and deformation of riverbed in a frazil jammed reach. Can. J. Civ. Eng. 2000, 27, 1120–1129. [Google Scholar] [CrossRef]
- Wang, J.; Hou, Z.X.; Sun, H.J.; Fang, B.H.; Sui, J.; Karney, B. Local scour around a bridge pier under ice-jammed flow condition—An experimental study. J. Hydrol. Hydromech. 2021, 69, 275–287. [Google Scholar] [CrossRef]
- Beltaos, S.; Burrell, B.C. Field measurements of ice-jam-release surges. Can. J. Civ. Eng. 2005, 32, 699–711. [Google Scholar] [CrossRef]
- Beltaos, S. Internal strength properties of river ice jams. Cold Reg. Sci. Technol. 2010, 62, 83–91. [Google Scholar] [CrossRef]
- Beltaos, S.; Burrell, B.C. Ice-jam model testing: Matapedia River case studies, 1994 and 1995. Cold Reg. Sci. Technol. 2010, 60, 29–39. [Google Scholar] [CrossRef]
- Sui, J.; Karney, B.W.; Sun, Z.; Wang, D. Field investigation of frazil jam evolution: A case study. J. Hydraul. Eng. 2002, 128, 781–787. [Google Scholar] [CrossRef]
- Sui, J.; Hicks, F.; Menounos, B. Observations of riverbed scour under a developing hanging ice dam. Can. J. Civ. Eng. 2006, 33, 214–218. [Google Scholar] [CrossRef]
- Knack, I.; Shen, H.T. Sediment transport in ice-covered channels. Int. J. Sediment Res. 2015, 30, 5. [Google Scholar] [CrossRef]
- Yang, K.L.; Liu, Z.P.; Li, G.F.; Chen, C.J.; Liu, C.J.; Hu, H.D. Simulation of ice jams in river channels. Water. Resour. Hydr. Eng. 2002, 33, 40–47. [Google Scholar]
- Mao, Z.Y.; WU, J.J.; Zhang, L.; Zhang, R.T. Numerical simulation of river ice jam. Adv. Water Sci. 2003, 14, 700–705. [Google Scholar]
- Wang, J.; He, L.; Chen, P.P.; Sui, J. Numerical simulation of mechanical breakup of river ice-cover. J. Hydrodyn. 2013, 25, 415–421. [Google Scholar] [CrossRef]
- Szydłowski, M.; Kolerski, T. Numerical modeling of water and ice dynamics for analysis of flow around the Kiezmark Bridge piers. In Free Surface Flows and Transport Processes; Springer: Cham, Switzerland, 2018; pp. 465–476. [Google Scholar]
- Istrati, D.; Hasanpour, A.; Buckle, I.G. Numerical investigation of tsunami-borne debris damming loads on a coastalbridge. In Proceedings of the 17th World Conference on Earthquake Engineering (17WCEE), Sendai, Japan, 13–18 September 2020. [Google Scholar]
- Wang, J.; Shi, F.Y.; Chen, P.P.; Wu, P.; Sui, J. Simulations of ice jam thickness distribution in the transverse direction. J. Hydrodyn. 2014, 26, 840–847. [Google Scholar] [CrossRef]
- Beltaos, S.; Miller, L.; Brian, B.C.; Sullivan, D. Hydraulic effects of ice breakup on bridges. Can. J. Civ. Eng. 2007, 34, 539–548. [Google Scholar] [CrossRef]
- Wang, J.; Shi, F.Y.; Chen, P.P.; Wu, P.; Sui, J. Impact of bridge pier on the stability of ice jam. J. Hydrodyn. 2015, 27, 865–871. [Google Scholar] [CrossRef]
- Wang, J.; Hua, J.; Sui, J.; Wu, P.; Lu, T.; Chen, P.P. The impact of bridge pier on ice jam evolution—An experimental study. J. Hydrol. Hydromech. 2016, 64, 75–82. [Google Scholar] [CrossRef] [Green Version]
- Wang, J.; Hua, J.; Chen, P.P.; Sui, J.; Wu, P.; Whitcombe, T. Initiation of ice jam in front of bridge piers—An experimental study. J. Hydrodyn. 2019, 31, 117–123. [Google Scholar] [CrossRef]
- Wang, J.; Sui, J.; Karney, B.W. Incipient motion of non-cohesive sediment under ice cover—An experimental study. J. Hydrodyn. 2008, 20, 117–124. [Google Scholar] [CrossRef]
- Carr, M.L.; Tuthill, M.A. Modeling of Scour-Inducing Ice Effects at Melvin Price Lock and Dam. J. Hydraul. Eng. 2012, 138, 85–92. [Google Scholar] [CrossRef]
- Batuca, D.; Dargahi, B. Some experimental results on local scour around cylindrical piers for open and covered flow. In Proceedings of the 3rd International Symposium on River Sedimentation, Jackson, MS, USA, 31 March–4 April 1986. [Google Scholar]
- Ackermann, N.L.; Shen, H.T.; Olsson, P. Local scour around circular piers under ice covers. Ice in the Environment. In Proceedings of the 16th IAHR International Symposium on Ice, Dunedin, New Zealand, 2–6 December 2002. [Google Scholar]
- Hains, D.B. An Experimental Study of Ice Effects on Scour at Bridge Piers. Ph.D. Thesis, Lehigh University, Bethlehem, PA, USA, 2004. [Google Scholar]
- Wu, P.; Hirshfield, F.; Sui, J.; Wang, J.; Chen, P.P. Impacts of ice cover on local scour around semi-circular bridge abutment. J. Hydrodyn. 2014, 26, 10–18. [Google Scholar] [CrossRef]
- Namaee, M.R.; Sui, J. Impact of armour layer on the depth of scour hole around side-by-side bridge piers under ice-covered flow condition. J. Hydrol. Hydromech. 2019, 67, 240–251. [Google Scholar] [CrossRef] [Green Version]
- Namaee, M.R.; Sui, J. Local scour around two side-by-side cylindrical bridge piers under ice-covered conditions. Int. J. Sediment Res. 2019, 34, 355–367. [Google Scholar] [CrossRef]
- Namaee, M.R.; Sui, J. Velocity profiles and turbulence intensities around side-by-side bridge piers under ice-covered flow condition. J. Hydrol. Hydromech. 2020, 68, 70–82. [Google Scholar] [CrossRef] [Green Version]
- Valela, C.; Sirianni, D.; Nistor, I.; Rennie, C.D.; Almansour, H. Bridge pier scour under ice cover. Water 2021, 13, 536. [Google Scholar] [CrossRef]
- Jafari, R.; Sui, J. Velocity field and turbulence structure around spur dikes with different angles of orientation under ice covered flow conditions. Water 2021, 13, 1844. [Google Scholar] [CrossRef]
- Hu, H.; Wang, J.; Cheng, T.; Hou, Z.; Sui, J. Channel Bed Deformation and Ice Jam Evolution around Bridge Piers. Water 2022, 14, 1766. [Google Scholar] [CrossRef]
- Wang, J.; Wu, Y.; Sui, J.; Karney, B. Formation and movement of ice accumulation waves under ice cover—An experimental study. J. Hydrol. Hydromech. 2019, 67, 171–178. [Google Scholar] [CrossRef] [Green Version]
- JTG D60–2004; General Code for Design of Highway Bridges and Culverts. Ministry of Transportation of China (MTC): Beijing, China, 2004.
- Yan, J.; Wang, E.P.; Sun, D.P.; Dong, Z.H. Experimental study on distribution properties of velocity in rectangular open channel. Eng. J. Wuhan Univ. 2005, 38, 59–64. [Google Scholar]
Figure 1.
The setup of the experimental flume in the laboratory.

Figure 2.
Ice wave migration in experiments.

Figure 3.
Diagram of an ice wave migration.

Figure 4.
Forces acting on the control volume of flowing water under an ice wave around the bridge pier.
Figure 4.
Forces acting on the control volume of flowing water under an ice wave around the bridge pier.

Figure 5.
Channel cross-section at the pier (where, b is the width of each unit, and B is the sum of width of all units).
Figure 5.
Channel cross-section at the pier (where, b is the width of each unit, and B is the sum of width of all units).

Figure 6.
Transverse distribution of ice wave thickness at the cross section where the pier is located.
Figure 6.
Transverse distribution of ice wave thickness at the cross section where the pier is located.

Figure 7.
Simplified schematic diagram of an ice wave.

Figure 8.
Calculated ice transport capacities compared to those measured from experiments.


Table 1.
Experimental conditions.
| Experimental Run # | v0 (m/s) | H0 (m) | D (cm) | Qi (L/s) | d50 (mm) | HS (m) |
|---|---|---|---|---|---|---|
| A1 | 0.17 | 0.25 | 2 | 0.0205 | 0.713 | 0.0319 |
| A2 | 0.15 | 0.25 | 2 | 0.0205 | 0.713 | 0.0286 |
| A3 | 0.17 | 0.20 | 2 | 0.0205 | 0.713 | 0.0343 |
| A4 | 0.15 | 0.20 | 2 | 0.0205 | 0.713 | 0.0323 |
| A5 | 0.18 | 0.25 | 2 | 0.018 | 0.713 | 0.0288 |
| A6 | 0.18 | 0.25 | 2 | 0.022 | 0.713 | 0.0327 |
| A7 | 0.18 | 0.25 | 2 | 0.026 | 0.713 | 0.0350 |
| A8 | 0.18 | 0.25 | 2 | 0.030 | 0.713 | 0.0365 |
| A9 | 0.18 | 0.20 | 2 | 0.018 | 0.713 | 0.0308 |
| A10 | 0.18 | 0.20 | 2 | 0.022 | 0.713 | 0.0339 |
| A11 | 0.18 | 0.20 | 2 | 0.026 | 0.713 | 0.0384 |
| A12 | 0.18 | 0.20 | 2 | 0.030 | 0.713 | 0.0391 |
| B1 | 0.17 | 0.25 | 2 | 0.0205 | / | 0 |
| B2 | 0.15 | 0.25 | 2 | 0.0205 | / | 0 |
| B3 | 0.17 | 0.20 | 2 | 0.0205 | / | 0 |
| B4 | 0.15 | 0.20 | 2 | 0.0205 | / | 0 |
Note: v0 is the average approaching velocity at CS-4; H0 is the approaching flow depth at CS-4; D is the pier diameter; Qi is the discharge rate of ice particles released from the ice hopper; d50 is the median grain size of sand particles; HS is the maximum scour depths. B1–B4 represent experiments without local scour (without bed sand on the flume bottom).
Table 2.
Comparison of the calculated ice wave crest thickness to that of experiments.
| Experiment Run # | Calculated Value (m) | Experimental Value (m) | Experiment Run # | Calculated Value (m) | Experimental Value (m) |
|---|---|---|---|---|---|
| A1 | 0.082 | 0.073 | B1 | 0.068 | 0.070 |
| A2 | 0.082 | 0.079 | B2 | 0.053 | 0.077 |
| A3 | 0.065 | 0.056 | B3 | 0.059 | 0.051 |
| A4 | 0.065 | 0.068 | B4 | 0.053 | 0.065 |
Table 3.
The calculated migration speed of ice wave.
| Number | Hs (m) | vi (m/s) | Number | Hs (m) | vi (m/s) |
|---|---|---|---|---|---|
| A1 | 0.0319 | 0.00142 | B1 | 0 | 0.00147 |
| A2 | 0.0286 | 0.00128 | B2 | 0 | 0.00134 |
| A3 | 0.0343 | 0.00184 | B3 | 0 | 0.00200 |
| A4 | 0.0323 | 0.00152 | B4 | 0 | 0.00159 |
Publisher’s Note: MDPI stays neutral with regard to jurisdictional claims in published maps and institutional affiliations. |
© 2022 by the authors. Licensee MDPI, Basel, Switzerland. This article is an open access article distributed under the terms and conditions of the Creative Commons Attribution (CC BY) license (https://creativecommons.org/licenses/by/4.0/).
Share and Cite
MDPI and ACS Style
Hou, Z.; Wang, J.; Sui, J.; Song, F.; Li, Z. Impact of Local Scour around a Bridge Pier on Migration of Waved-Shape Accumulation of Ice Particles under an Ice Cover. Water 2022, 14, 2193. https://doi.org/10.3390/w14142193
AMA Style
Hou Z, Wang J, Sui J, Song F, Li Z. Impact of Local Scour around a Bridge Pier on Migration of Waved-Shape Accumulation of Ice Particles under an Ice Cover. Water. 2022; 14(14):2193. https://doi.org/10.3390/w14142193
Chicago/Turabian StyleHou, Zhixing, Jun Wang, Jueyi Sui, Feihu Song, and Zhicong Li. 2022. "Impact of Local Scour around a Bridge Pier on Migration of Waved-Shape Accumulation of Ice Particles under an Ice Cover" Water 14, no. 14: 2193. https://doi.org/10.3390/w14142193
Note that from the first issue of 2016, this journal uses article numbers instead of page numbers. See further details here.