Article

Microbial Networks Reveal the Structure of Water Microbial Communities in Kalamaili Mountain Ungulate Nature Reserve

1
School of Ecology and Nature Conservation, Beijing Forestry University, Beijing 100086, China
2
Xinjiang Kalamaili Mountain Ungulate Nature Reserve Management Center, Urumqi 830000, China
*
Author to whom correspondence should be addressed.
These authors contributed equally to this work.
Water 2022, 14(14), 2188; https://doi.org/10.3390/w14142188
Submission received: 12 April 2022 / Revised: 7 July 2022 / Accepted: 7 July 2022 / Published: 11 July 2022
(This article belongs to the Topic Microorganisms in Aquatic Environments)

Abstract

:
Water microorganisms contribute to the key components of ecosystems in dryland waters, which are extremely important for wildlife. However, the distribution patterns of water microbes across different basal water sources are still largely unknown. This study was conducted to compare microorganisms in the water bodies of different types of water sources in the Kalamaili Mountain Ungulate Nature Reserve in China. Bioinformatic analysis revealed that the undirected microbial co-existence network consisted of 15 main modules referring to different water sources, which indicated specific molecular co-existence relationships. It was found that the most dominant phyla (namely Proteobacteria, Patescibacteria, Firmicutes, Bacteroidota, and Actinobacteriota) of the molecular ecological network shared the same structures as the microbial community, which justified the construction of the network via a random network formation. Principal coordinate analysis (PCoA) based on Bray–Curtis distances revealed that there were still considerable variations among different habitats, showing separate sample clusters. Additionally, the different topological roles of subnetworks trimmed to a uniform size indicated different co-existence patterns in the microbiome. The artificially recharged water from concrete pond substrate (ARC) subnetworks had a relatively discrete co-occurrence, while the natural water sources (NRE) and artificially recharged water from earthen pond substrate (ARE) groups were more compact with giant modules. The NRE and ARE groups were also richer in microbial composition and had a higher number of species with low abundance. Consequently, concrete substrates may contribute to dysfunction in water microbiomes. Moreover, the functional diversity of the NRE and ARE groups is due to more intra-module connections and more inter-module connections, indirectly leading to a stable function resilient to external environmental influences. In conclusion, the microecology of the NRE was more stable than that of the concrete substrate, and artificial transportation had less effect on the microbial community.

1. Introduction

Microbes are widespread in water, soil, air, and other environments, and they play important roles in agro-ecosystems [1]. As decomposers, microorganisms can break down fertilizers, pesticides, bait residues, and excreta through metabolism [2], and they can also break down organic compounds directly into inorganic products through mineralization, driving various material cycles, such as nitrogen fixation, nitrification, and denitrification, and playing a key role in promoting energy flow and maintaining environmental homeostasis [3,4,5]. As is well known, nitrifying bacteria eliminate ammonia and nitrite to reduce water toxicity [6], while Bacillus can convert organic carbon into CO2 or mucilage to improve water quality [7]. It was previously found that not only does Lactobacillus promote the immune response and improve the survival of Litopenaeus vannamei, but it also increased the activity of digestive enzymes and optimized the survival rate of shrimp [8]. However, when ecosystems are out of balance, conditioned pathogenic bacteria in the environment may cause disease in plants and animals and jeopardize their healthy growth [9]. Therefore, microorganisms largely determine the productivity and eco-efficiency of wildlife water sources’ ecosystems, and it is important to investigate the diversity and community structure of the microorganisms in wildlife water sources’ ecosystems for conservation biology.
As is often the case, a highly complex and heterogeneous microbiota establishes the dynamic microbial ecosystem [10]. Ecological network models are an important tool to elucidate microbial community interactions, and their analysis using visual networks can provide new insights into the environmental response of complex microbial communities [11], offering additional information that is difficult to obtain using traditional research methods. A series of topological parameters, such as modularity, clustering coefficients, and connectivity, can reflect the systemic characteristics of a community [12]. However, the roles of key nodes in regulating the functional potential of microbial communities are largely unexplored and unstudied [13]. Additionally, numerous complex intra-species interactions contribute to the same work [14], shaping the structure and function of microbial communities. Previously, attention has mainly been focused on the construction of large-scale microbial networks; the interactions of microorganisms within a single host or habitat and their functions remain poorly investigated [2]. However, relatively little research exists to support the importance of the relative abundance of key nodes in water microbial networks. Key nodes can re-establish themselves even when disturbed by environmental factors. Microbial dysbiosis has been reported to lead to metabolic disorders [15]. Determining the response to nutrients and the functional importance of the microbial taxa of key nodes is particularly important in order to better understand how microbial communities support metabolic functions.
The Kalamaili Mountain Ungulate Nature Reserve (KNR) is located in the Junggar Basin of Xinjiang, China, and it is a major area for ungulate wildlife. Since the establishment of the reserve in the 1980s, wildlife such as Przewalski’s horses (Equus ferus przewalskii), Mongolian wild asses (Equus hemionus hemionus), and Gazella subgutturosa has increased significantly in the KNR [16]. The climate is moderately temperate and continental, with an average annual temperature of only around 2 °C, and annual precipitation is scarce. There is no surface water in the reserve, only a dozen or so salt springs overflowing from fissure water, rainfall, and snowmelt in the lowlands and a few artificial wide-mouth wells, which serve as natural watering points for wildlife in the dry season. Water scarcity is a major constraint to the survival of wildlife in the area. Consequently, natural water sources and artificially transported water sources are the main solutions to the wildlife drinking water problem in nature reserves [17]. At present, there are two main types of storage for man-made water sources—namely, earthen pond storage and concrete pond storage. Earthen ponds are prone to downward seepage and have limited water storage, while concrete water storage offers good prospects. However, some studies have reported that concrete is not conducive to ecological restoration and tends to disrupt the microecological environment of water bodies [18]. According to previous reports, this could be because concrete may adsorb microorganisms in the water, reducing the microbial diversity in the water and enriching the microorganisms around the concrete [19,20]. Microbes in water bodies are an important part of aquatic ecosystems. A close link has been found between microbial communities and water quality [21]. Changes in the structures of microbial communities respond well to the accumulation of water pollution loads and have a very important role in the cycling of microbial biogenic elements, the decomposition of organic matter, and the purification of pollutants. The diversity and structure of freshwater microbial communities are determined by the temporal and spatial variability of physicochemical and biological parameters, responding rapidly to changes in the environment and adjusting the community structure to adapt to changes in the ecological environment. Therefore, in this study, a comparative analysis of the diversity and community structure of microorganisms in artificially transported water sources and in water bodies under different substrates was carried out based on high-throughput sequencing of 16S rDNA amplicons, with the aim of revealing the impact of artificial intervention on the ecological environment from a microbial perspective. The aim is to provide a scientific basis for ecological research and the further development of water bodies in arid environments, and to provide theoretical support for the sustainable development of the KNR.

2. Materials and Methods

2.1. Experimental Management

Forty-three water samples were collected from water sources in the KNR—namely, 18 from natural water sources (NRE), 19 from artificially recharged water from earthen pond substrate (ARE), and 6 from artificially recharged water from concrete pond substrate (ARC) (Figure 1). Artificially recharging water means transporting groundwater to a water source from the earthen pond substrate or concrete pond substrate through a water tanker. Therefore, ARC was the most affected by humans, the second being ARE, and NRE was not influenced by humans. The water samples were collected during May 2021.

2.2. Sampling and Analysis
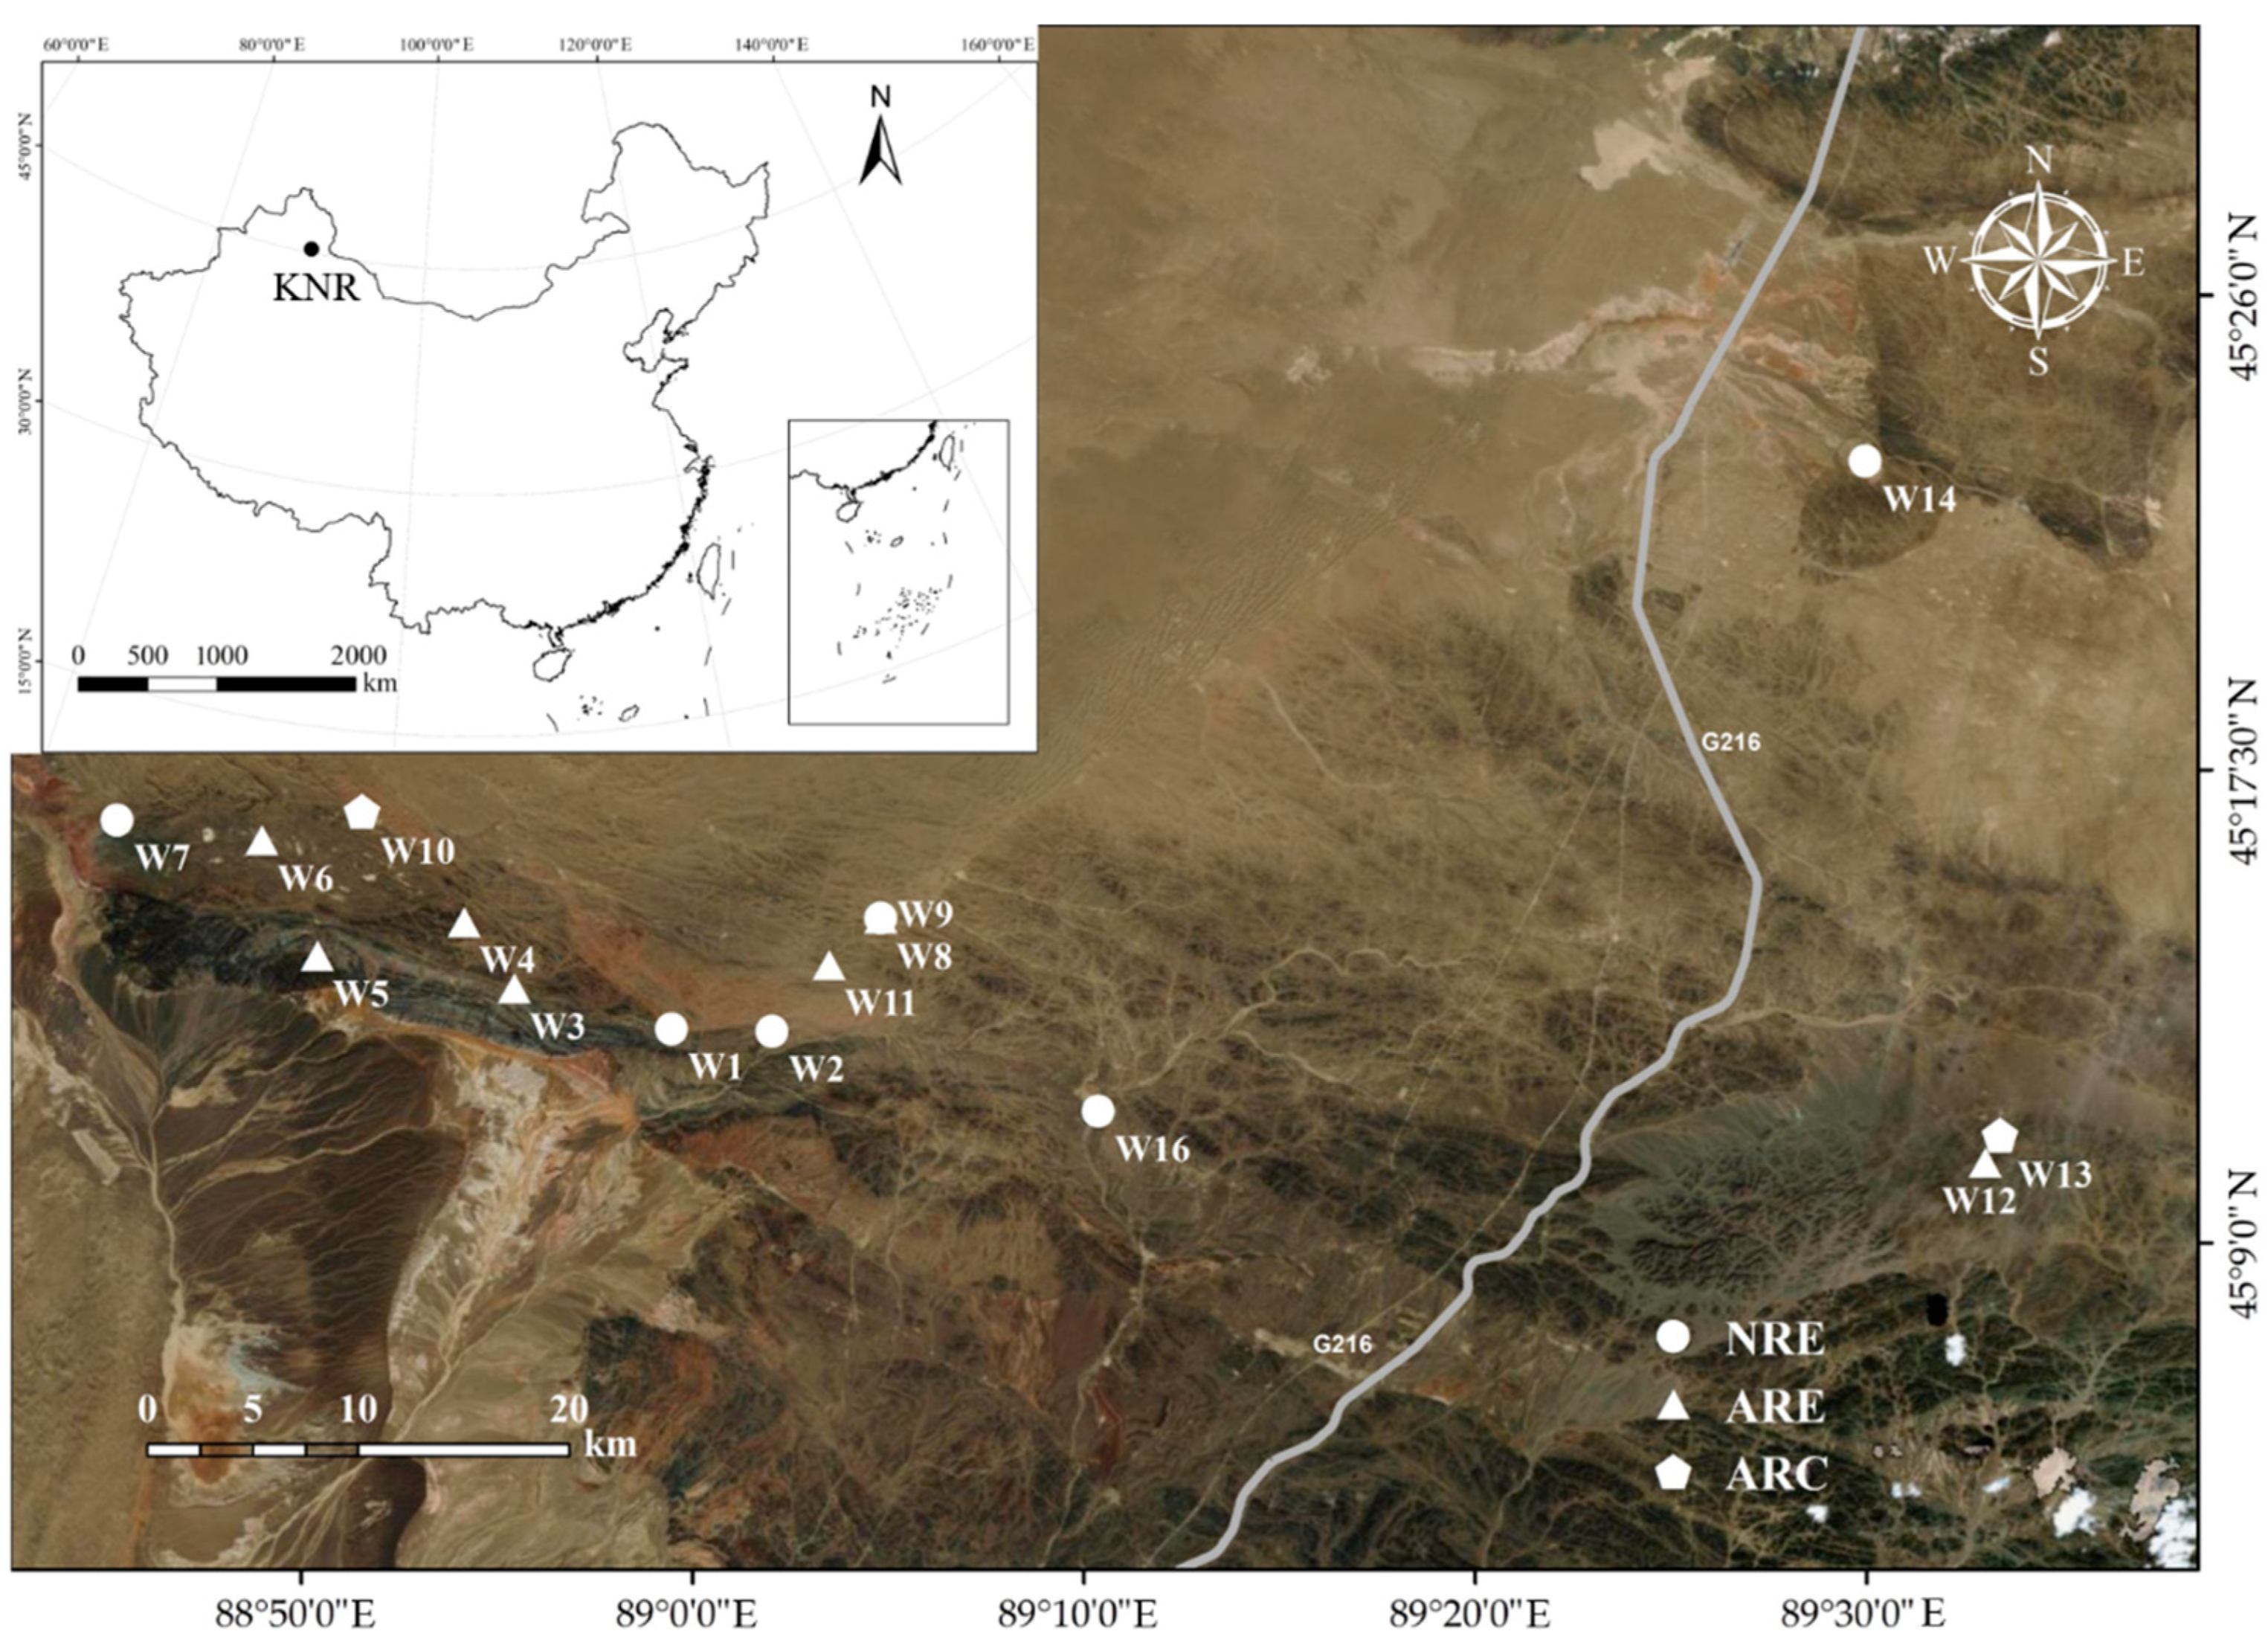
2.2.1. Sampling

Water samples were collected in sterile water collection bags and marked with the sample name, sampling time, sampling location, collector, and other collection information. The water samples were taken using a sterile 250 mL syringe while wearing sterile gloves. A total of 100 mL of water was collected from the same water source at different locations, resulting in 500 mL water samples being collected from each location. Two to three replicates were taken from each water source. A disposable filter cup containing a 0.45 μm filter membrane (PALL Microfunnel), a rubber stopper, a 500 mL filter bottle, and an electric pump were connected to form a complete filtration unit. Water samples from the sampling bag were poured into the filter cups over a 24 h period and vacuumed using an electric vacuum pump to speed up the flow rate, stopping filtration when the water flow rate was 3 drops in 10 s [22]. The filter membranes were rolled into sterile tubes using disposable sterilized forceps and placed in −20 °C freezing storage until DNA extraction.

2.2.2. 16S rDNA Sequencing and Water Microbiota Analysis

The high-throughput sequencing of 16S rDNA against water samples was performed using a method described in a previous publication [11], where the primers used were 338F (5′-ACTCCTACGGGAGGCAGCAG-3′) and 806R (5′-GGACTACHVGGGTWTCTAAT-3′). Purified amplicons were pooled in equimolar units and paired-end sequenced on an Illumina MiSeq PE300 platform/NovaSeq PE250 platform (Illumina, San Diego, CA, USA) according to the standard protocols of Majorbio Bio-Pharm Technology Co. Ltd. (Shanghai, China). The raw 16S rRNA gene sequencing reads were demultiplexed, quality-filtered by fastp version 0.20.0 [23], and merged by FLASH version 1.2.7 [24] with the following criteria: (i) the 300 bp reads were truncated at any site receiving an average quality score of <20 over a 50 bp sliding window, and the truncated reads shorter than 50 bp were discarded; reads containing ambiguous characters were also discarded; (ii) only overlapping sequences longer than 10 bp were assembled according to their overlapped sequence; the maximum mismatch ratio of overlap region was 0.2, and reads that could not be assembled were discarded; (iii) samples were distinguished according to the barcode and primers, and the sequence direction was adjusted, exact barcode matching, 2 nucleotide mismatches in primer matching. After a series of quality control checks, the raw sequences were annotated to different taxonomic levels, with operational taxonomic units (OTUs) at 97% similarity grouped into the same genera [25], and chimeric sequences were identified and removed. The taxonomy of each OTU representative sequence was analyzed by RDP Classifier version 2.2 [26] against the 16S rRNA database (Silva v138), using a confidence threshold of 0.7. The R package phyloseq was used to sample the absolute abundance tables equally in order to remove low-abundance OTUs for later analysis.

2.2.3. Construction and Visualization of Co-Occurrence Ecology Networks

Weighted gene co-expression network analysis (WGCNA) based on the absolute abundance OTU table was used to construct co-occurrence networks using R packages igraph and Hmisc to describe interspecific interactions [27]. The methods can be found described in detail in the previous report [11]. First, the absolute abundance table was transposed to calculate the proportion of each operation unit and the Spearman correlation coefficient and its significance by using the “corAndPvalue” function in the WGCNA package, and an adjacency matrix was constructed. Then, the multtest package was used to correct the p-value and reconstruct the adjacency matrix. Briefly, the combination of a p-value greater than 0.05 and a correlation absolute value less than 0.4 in the adjacency matrix was filtered out. Second, the “graph.adjacency” function was used to convert the adjacency matrix into an igraph object and to delete isolated and self-correlated nodes. Third, the data output was realized by the igraph package (version: 1.3.2, https://cran.r-project.org/, accessed on 6 July 2022) and visualized in perl (version: 5.30.2, https://www.perl.org/, accessed on 6 July 2022), gephi (version: 0.9.6, https://gephi.org/, accessed on 6 July 2022) and cytoscape (version: 3.9.1, https://cytoscape.org/, accessed on 6 July 2022).
The parameters of networks can be described as network size, avgK, GD, avgCC, and modularity. Among these, network size (node) is the number of all nodes in the network. Network size (edge) is the number of all edges in the network. Average degree (avgK) stands for the average degrees (the number of edges) of all nodes in the network. Average path distance (GD) stands for the length of the shortest path between nodes. Average clustering coefficient (avgCC) describes the probability that two adjacent nodes linked to one node are also adjacent to each other. Modularity is a method used to measure the quality of community division in community discovery. A relatively good result is where the connectivity of nodes within the community is high, while the connectivity of nodes outside the community is low.

2.3. Statistical Analysis

The experimental raw data were initially processed and analyzed using R (version 4.0.3). The R package vegan was also used to analyze alpha and beta diversities (Bray–Curtis distance) based on unweighted principal component analysis. The R package microeco was then used to construct evolutionary branching relationships utilizing linear discriminant analysis effect size (LEfSe) analysis (LDA score = 4.0).

3. Results

3.1. Microbial Diversity

The influence of concrete substrate on water microbial communities was investigated using 43 samples from three different types of water sources. A total of 27,675 high-quality sequences (median 562) ranging from 143 to 2240 were derived from bacterial profiles. A total of 12,266 bacterial OTUs were detected in all samples, with a sequencing depth and coverage of over 90%. The network inclusion was limited to 5090 OTUs present in the normalized sample, using the R package phyloseq in order to reduce noise and false positive predictions. At the phylum level, Proteobacteria, Patescibacteria, Firmicutes, Bacteroidota, and Actinobacteriota were the most dominant microbial communities, as shown in Supplementary Figure S1. There were 122 OTUs (4.71%) that were shared by all three groups, with those that were unique to each water environment being 906 (NRE, 34.97%), 863 (ARE, 33.31%), and 151 (ARC, 2.43%), and those that were shared between the two groups being 445 (NRE-ARE, 17.17%), 63 (NRE-ARC 2.09%), and 41 (ARE-ARC, 1.58%). The lowest Observed, Chao1, ACE, Shannon, and Simpson values were found in the ARC group (Figure S2). Additionally, the differences in the water microbial communities from different substrates were found to be statistically significant after permutational multivariate analysis of variance (PERMANOVA analysis, R2 = 0.078, p = 0.001). It could be seen that most samples in the NRE and ARE groups clustered together, with a tendency to sort under PCoA based on Bray–Curtis distance (Figure 2), revealing that there were no differences between the two treatments. In contrast, the concrete substrate water microbes were arranged in isolation, indicating that the concrete substrate led to a greater effect than the other two treatments.

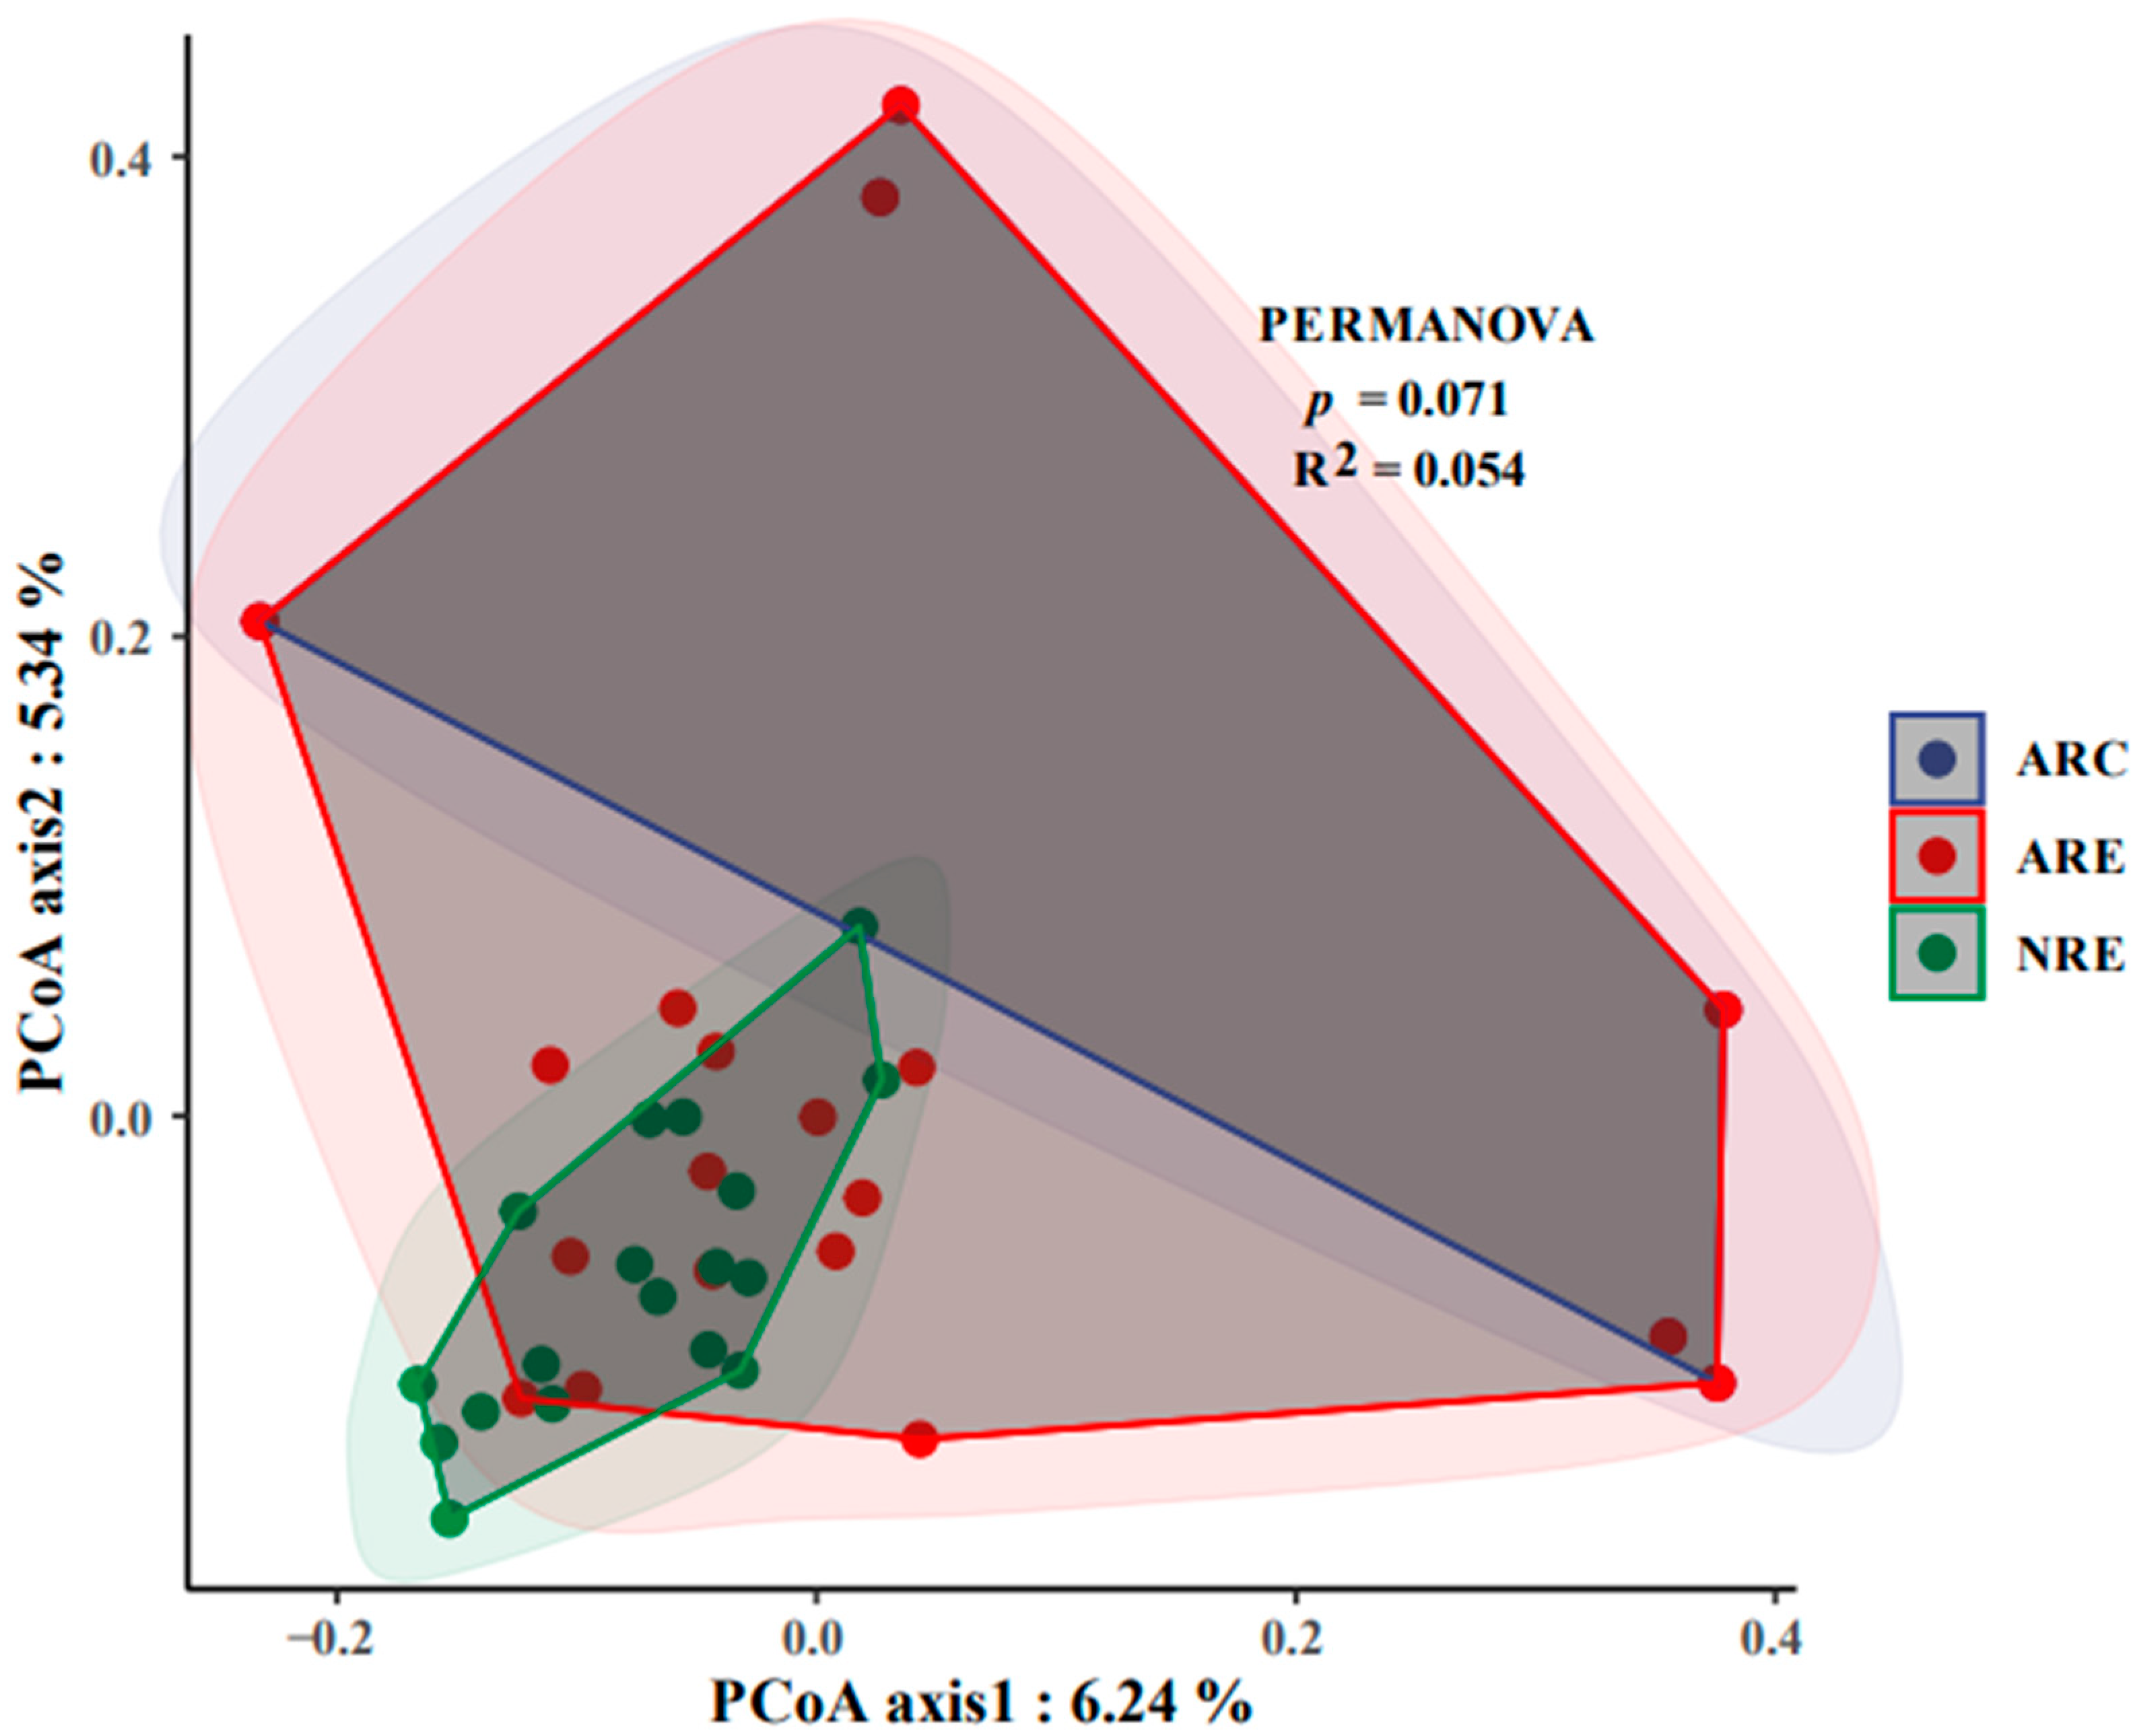
3.2. Differential Analysis

LEfSe analysis of water microbiota revealed that differential OTUs were a few of the biomarkers with high scores at the corresponding taxonomic level (Figure S3). The cladogram showed that the differential OTUs were mainly distributed among the groups in the dominant phyla, such as Proteobacteria, Patescibacteria, Firmicutes, Bacteroidota, and Actinobacteriota (Figure S3). These findings, together with the distribution histogram’s findings, reveal that the differential indicator species that ranked in the top 10 in the natural water microbiome were Rhodobacterales and Sphingomonadales at the order level classified into Alphaproteobacteria in Proteobacteria and Patescibacteria. Artificial recharge contributed to a significant increase in Actinobacteria at the class level classified into Actinobacteriota, as well as Clostridia classified into Firmicutes, the abundance of which showed an obvious decrease in the microbiome of the artificially recharged water in the cement substrate. Moreover, the concrete substrate significantly increased the relative abundance of Rhodobacterales at the order level classified into Alphaproteobacteria in Proteobacteria, as well as Bacteroidia at the class level classified into Bacteroidota.

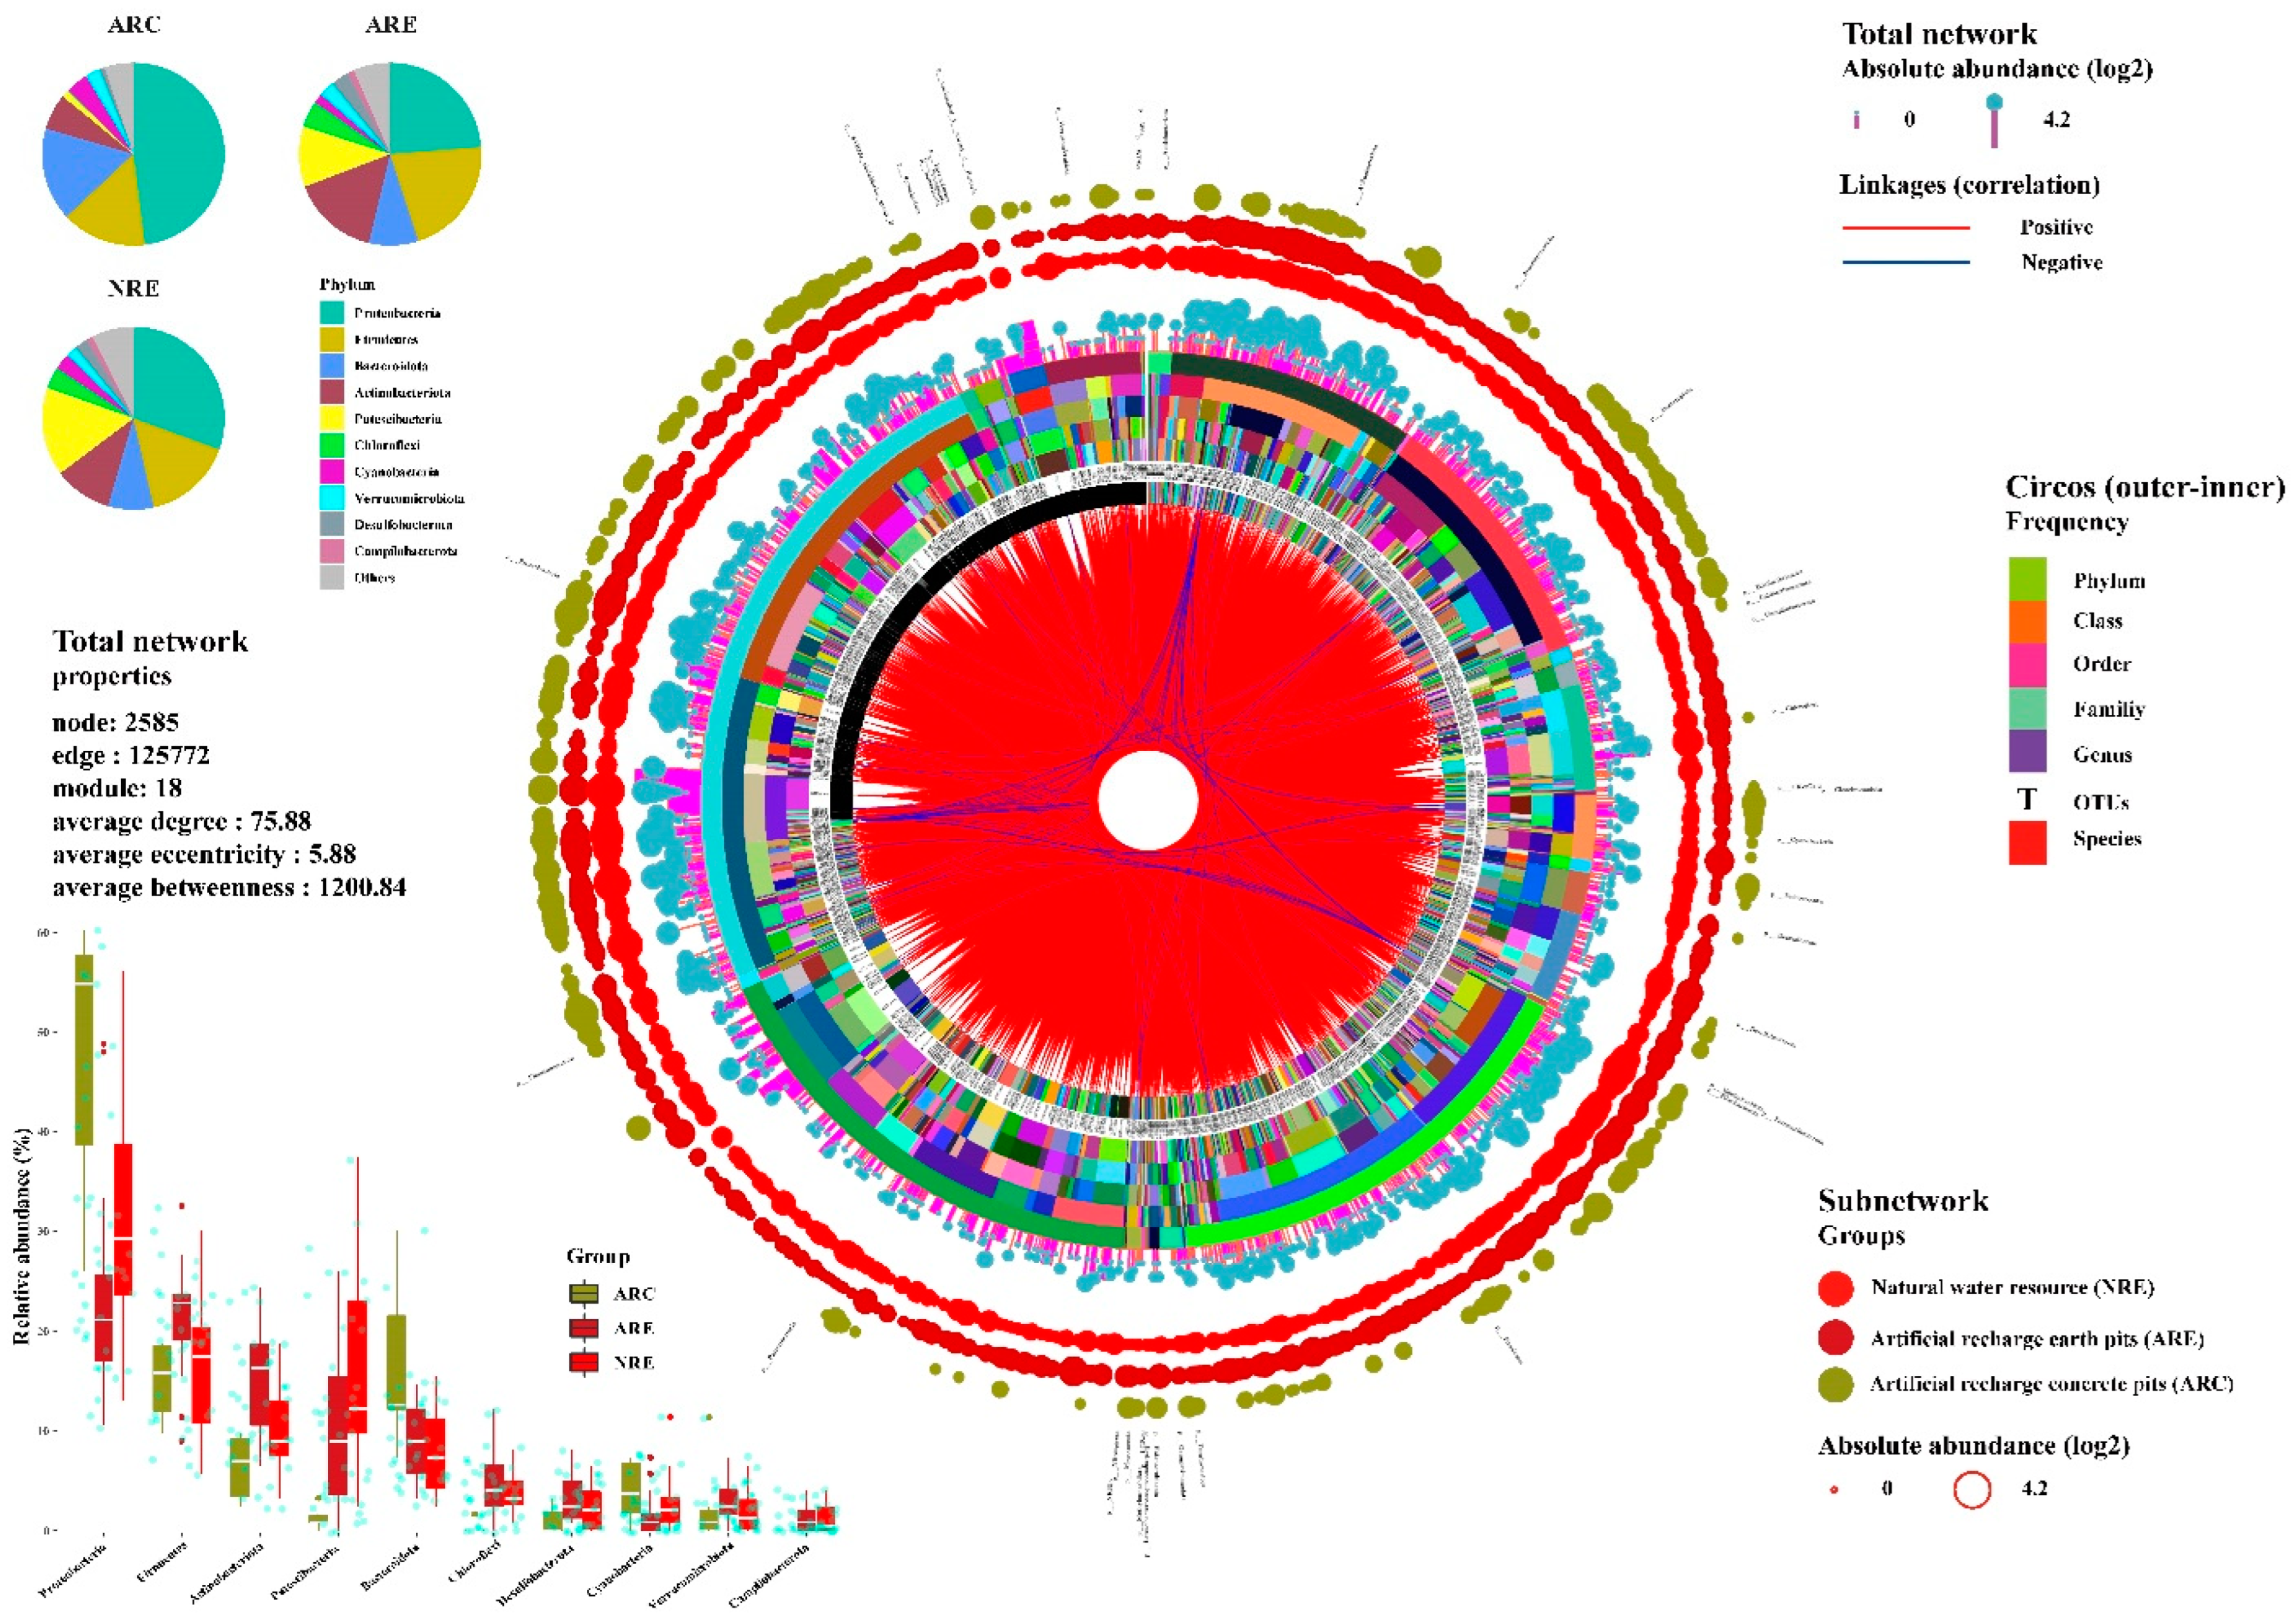
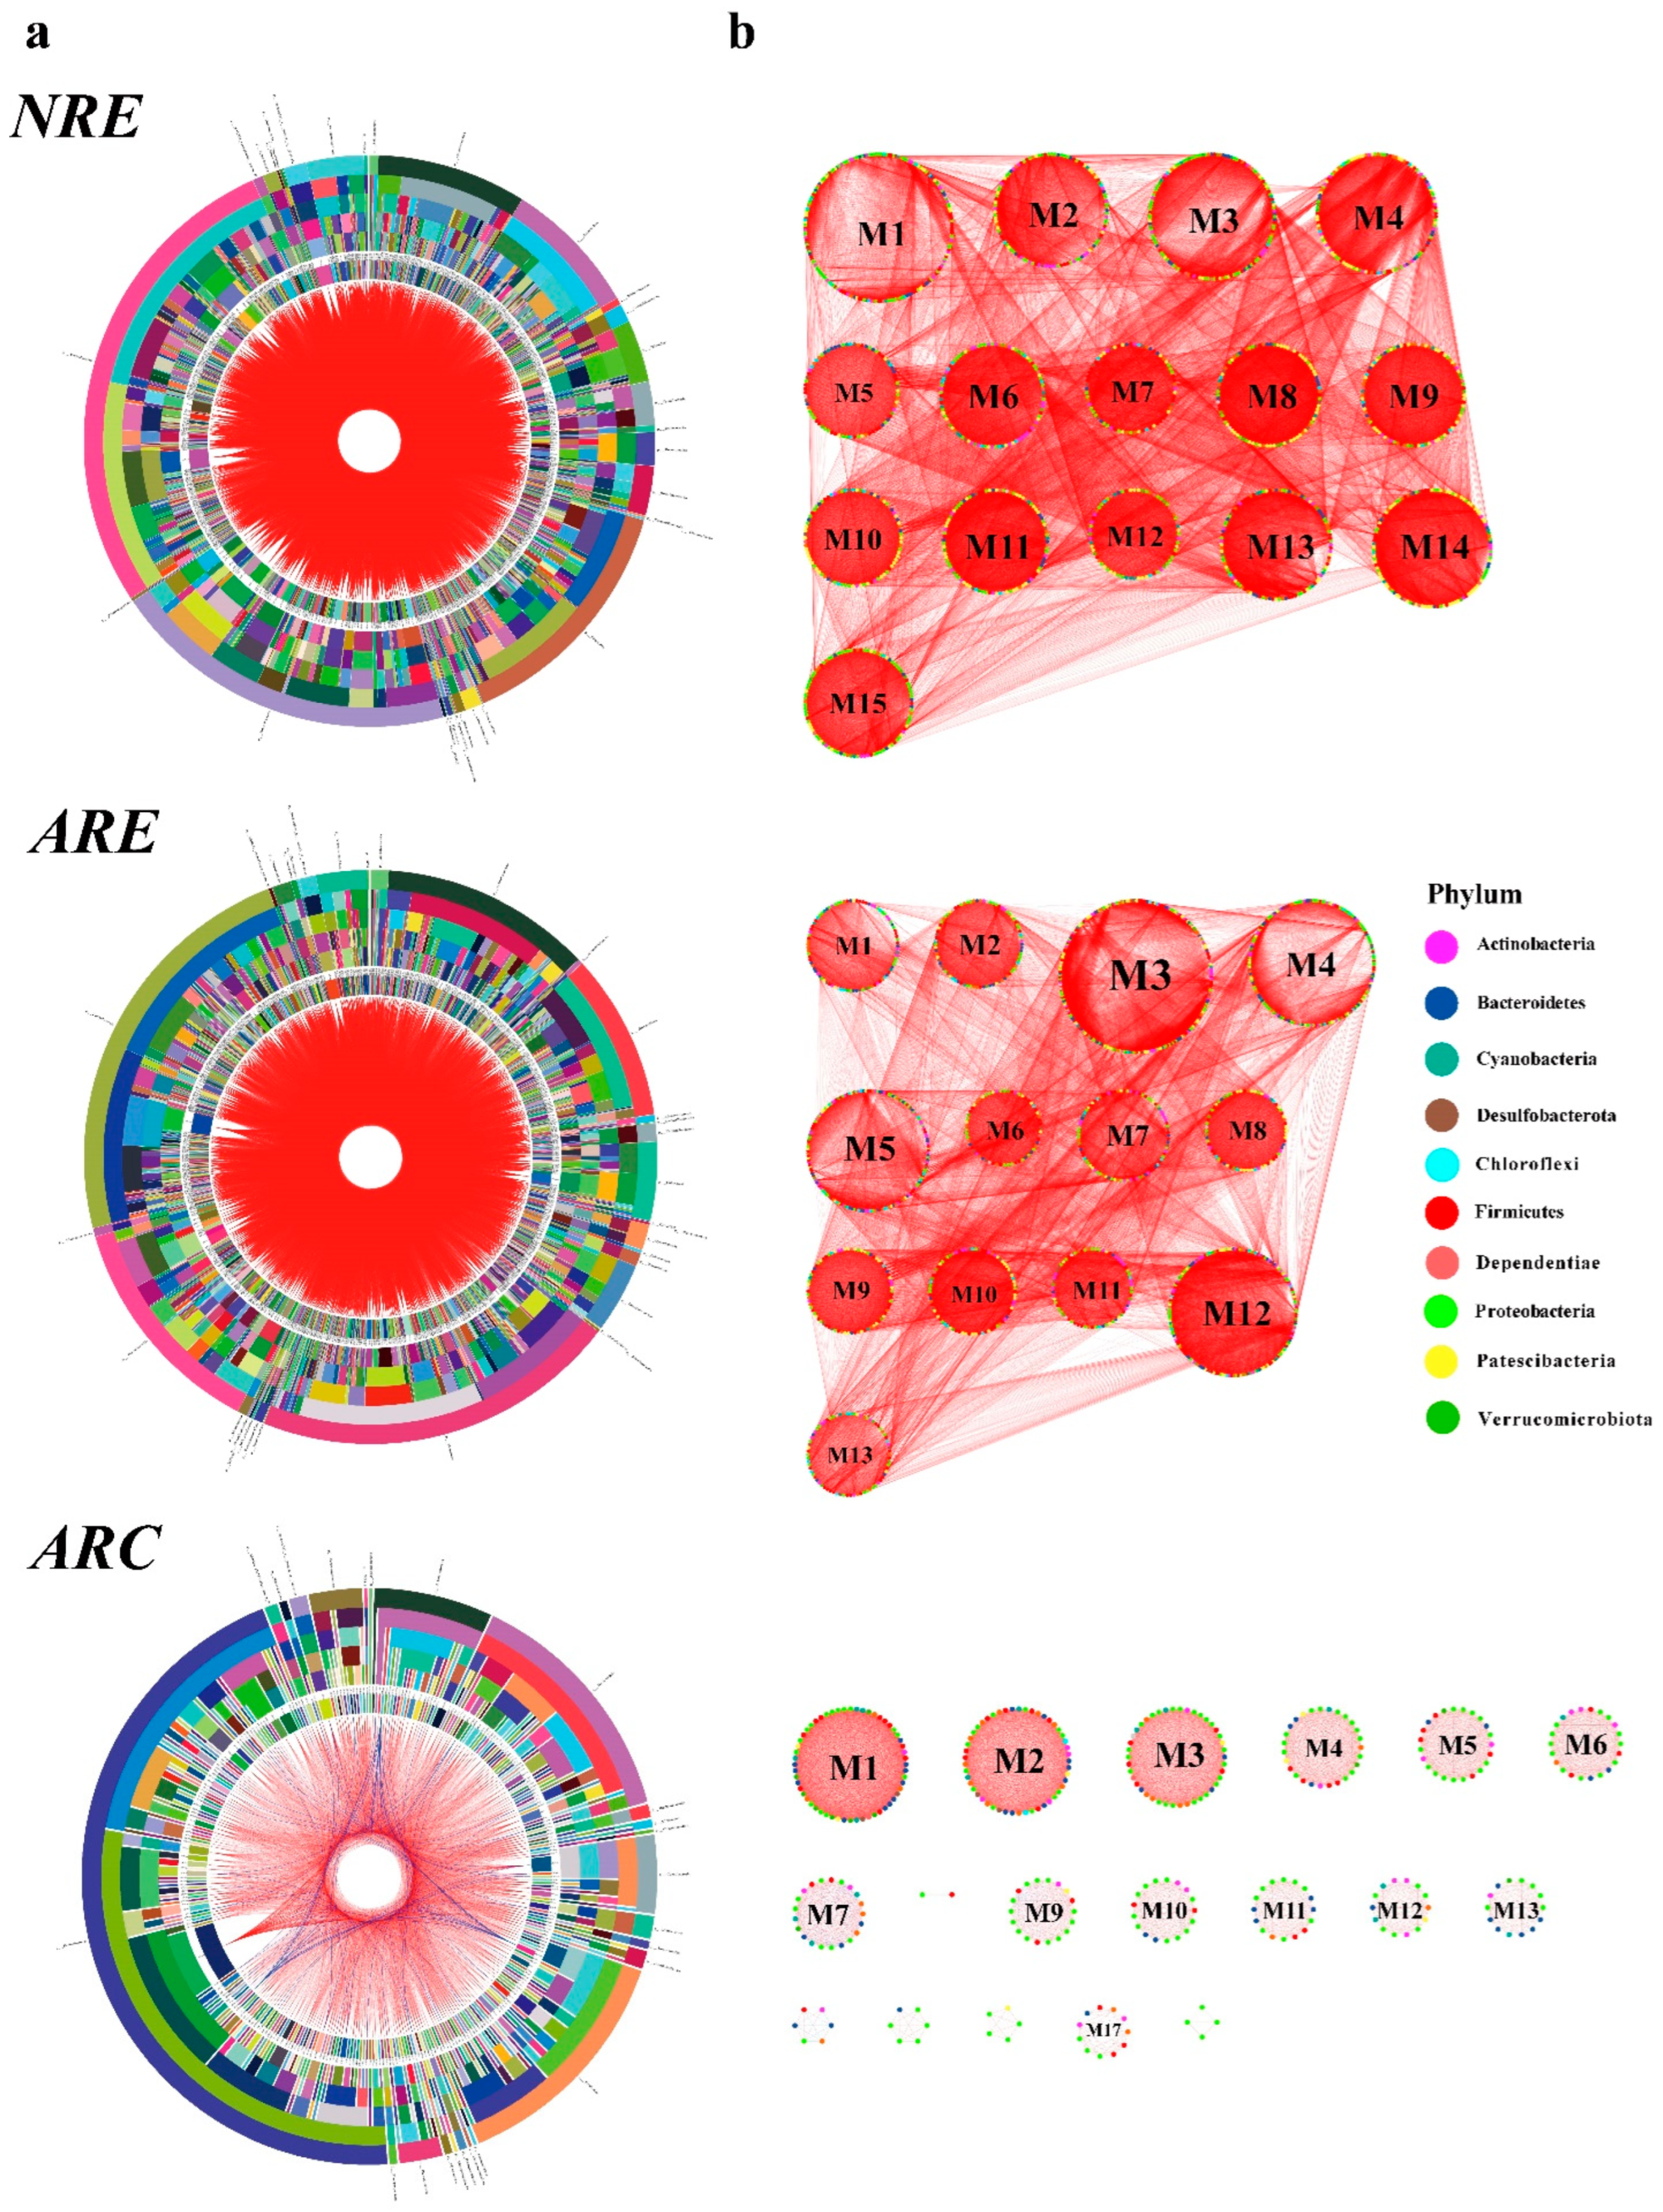
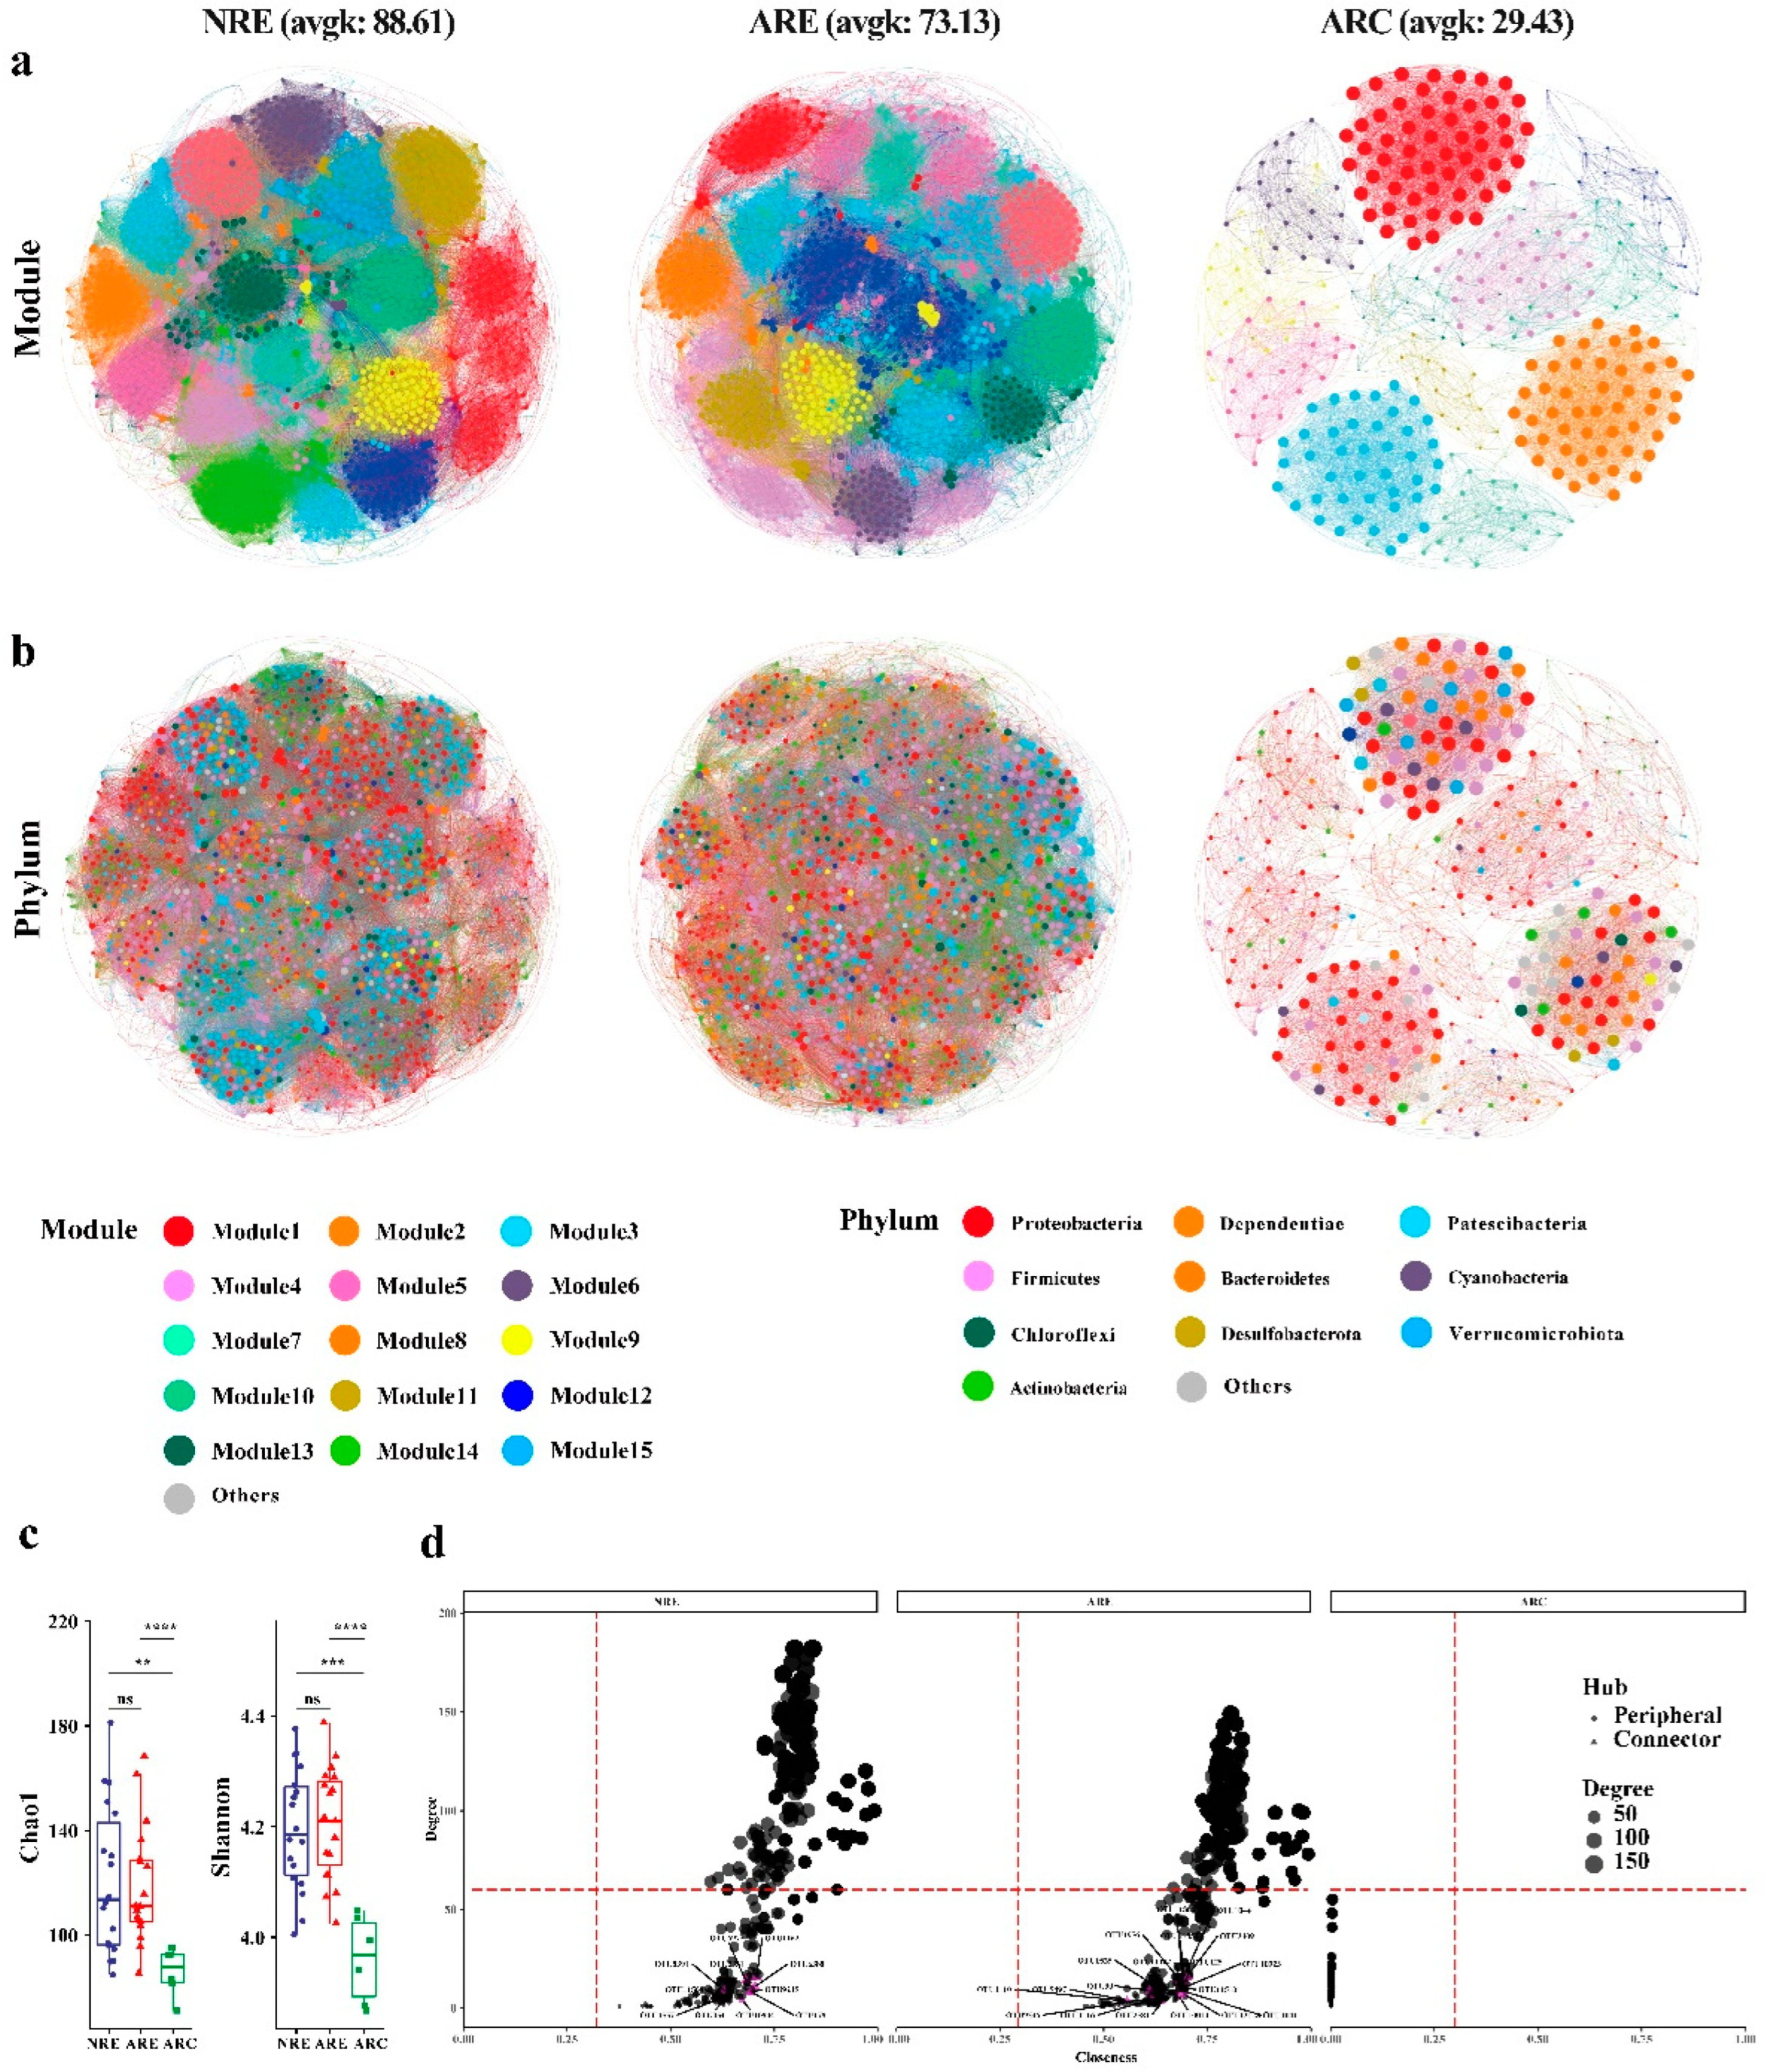
3.3. Water Microbial Co-Occurrence Network

Three microbial subnetworks were constructed with conservative statistical cut-off values applied (p > 0.05, abs(r) < 0.4). The three subnetworks were merged into a total microbial network by overlapping the nodes and edges; the total network consisted of 2585 nodes and 125,772 edges after the removal of unconnected nodes (Figure 3 and Figure 4). The scale-free property (R2 = 0.132), the relationship between degree and strength (R2 = 0.934), the network centrality parameter (R2 = 0.408), and independency (R2 = 0.106) suggest a non-random co-occurrence pattern in this microbial network (Figure S4), which is consistent with the result of a comparison between the empirical network and a random network. Moreover, the total network exhibited high modularity, with 99.2% of the nodes occupied by 15 of the 18 total modules, showing the same microbial composition as the original microbial composition (Figure 4 and Figure S5). Vertices from water microbiomes in the NRE, ARE, and ARC groups were present in different modular patterns (Figure 3 and Figure 4b), and the ARC group showed bad network properties (Table 1).
Circos plots were employed to illustrate the microbial composition and interspecies relationships within each microbial community, referring to the corresponding groups. In Figure 5, three representative networks are presented in order to identify combinations of potential interactions in the water microbial communities. A minimum of five node modules were targeted, while major modules with at least 10 nodes were visualized. It can clearly be seen that the total network was inclined to co-exist rather than co-exclude, with positive correlations accounting for 99.9% (125,709 edges) of the potential interactions that were scanned (Figure 5). However, the negative interactions only existed in the water microbiome of concrete substrate pits. Moreover, enhanced interaction of the microbial network could be found in the water microbiome of earth pits; this was evidenced by a significant increase in the number of edges and mainly positively correlated edges (Table 1). As with the total network structure, changes in the size of the modules and in the number of inter-module connections with the introduction of the concrete substrate mainly reduced the number of microbial community modules and the number of intra-module connections (Figure 5; Table 1).

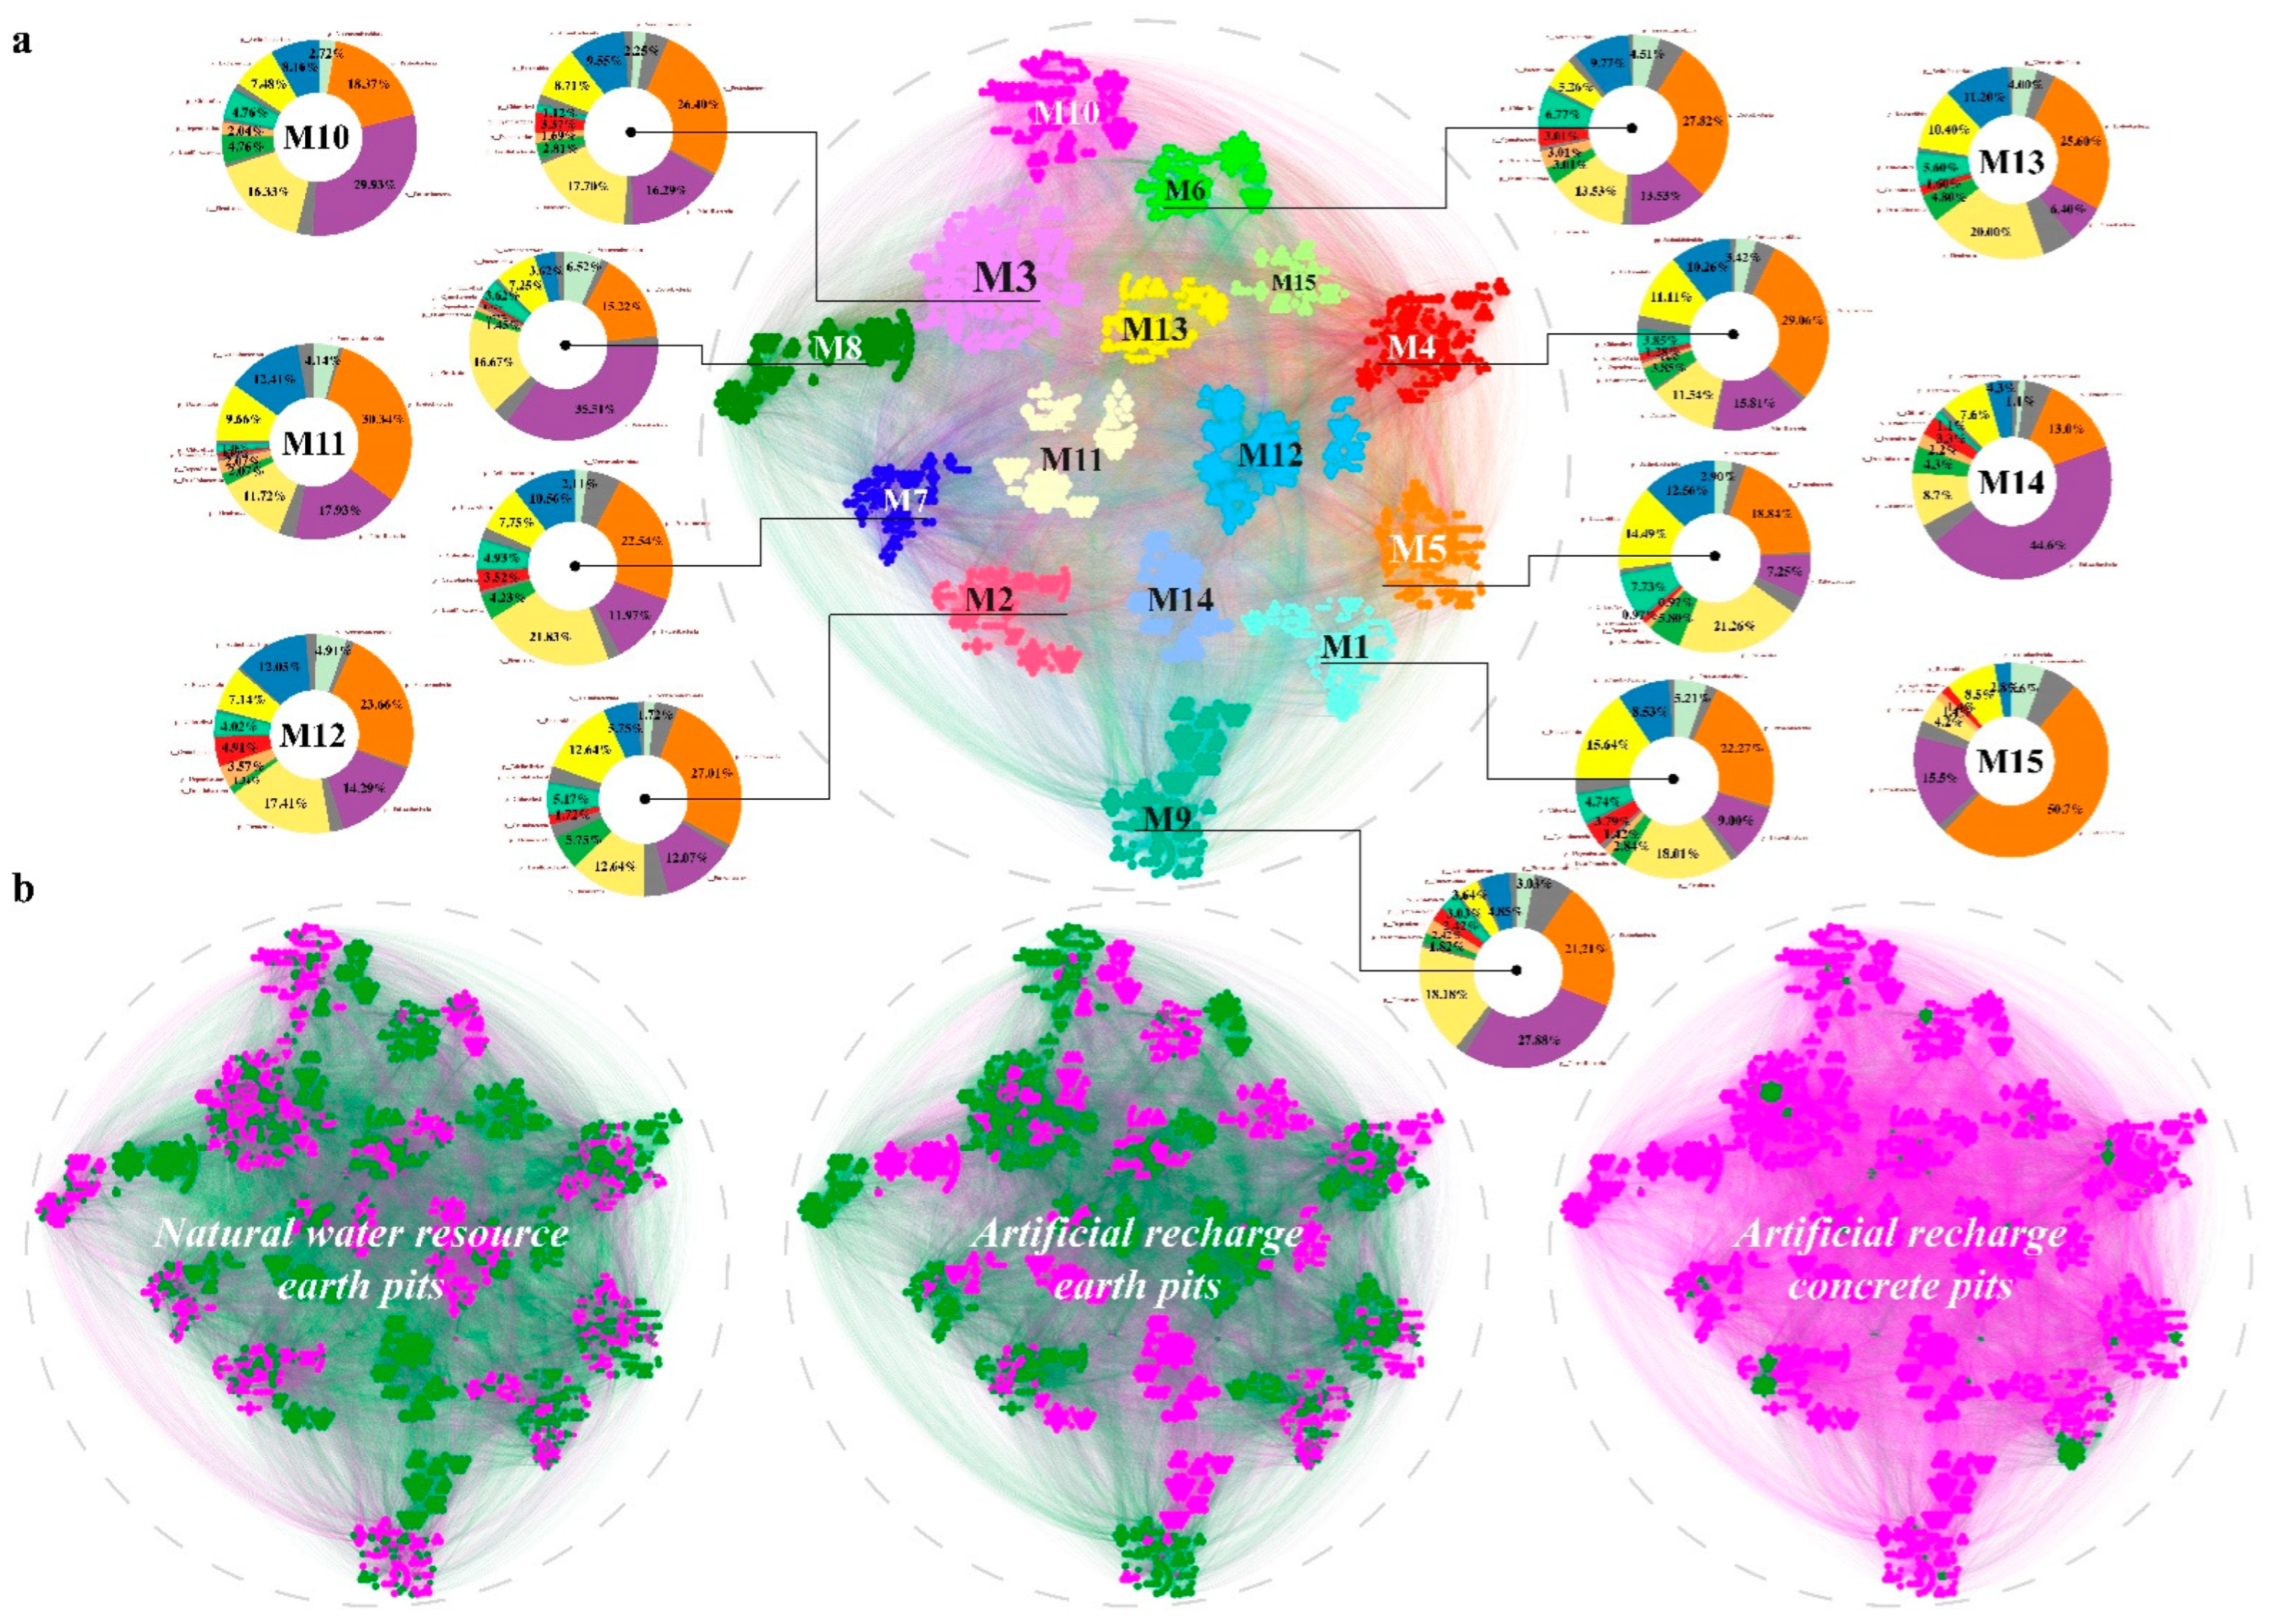
3.4. Topological Roles

To evaluate the potential topology of the taxa in all three subnetworks, the nodes were divided into four classes based primarily on the relationship between the degree and closeness centrality (Figure 6). Meanwhile, the alpha diversity of the microbial network showed a decreasing trend as the concrete substrate was introduced, and it became the same as that of the original microbial composition. Moreover, the number of key nodes (Hubs) in the microbial network of the water body tended to decrease with artificial interventions (the artificial transportation of water and concrete substrates), as evidenced by the few remaining peripherals in the ARC group. Furthermore, there were higher modular connections found in the NRE and ARE groups, owing to more key nodes with a higher degree. The NRE group contributed to the highest average connectivity, as shown in Table 1, indicating the microbial community network that was the most complex. The average path distance (GD) was higher for the NRE and ARE group networks than for the ARC group network, coupled with an increase in the average degree (avgK) and a decrease in the average clustering coefficient (avgCC).

4. Discussion

4.1. Microbial Community Structure Characteristics of Water

The microbial community structure of water microbiomes not only directly affects the transformation and composition of water microbiomes but is also one of the main factors in maintaining and restoring the productivity of water bodies. The substrate of a water resource plays a significant role in maintaining environmental stability in water bodies. The evolution of microbiota (quantity and composition) is an important biological indicator of changes in the quality of the water environment [28]. In this study, the bacterial diversity of the water sources in the KNR was analyzed using high-throughput sequencing technology, and the bacterial communities were found to be mainly composed of Proteobacteria, Patescibacteria, Firmicutes, Bacteroidota, and Actinobacteriota. It was also found that Proteobacteria was the most common microbial group in the water microbiome [29]. The water sources from cement substrates contained almost no Patescibacteria, suggesting that cement substrates reduced the abundance of bacterial communities in the water column, while artificially transported water sources had no significant effect. Studies have shown that a lower level of Patescibacteria means that carbon and nutrients are released, from which other bacteria can benefit and survive. It has been reported that species diversity is positively correlated with stability [30]. In our study, water from a concrete pond substrate showed significantly reduced bacterial diversity. Community diversity reflects community stability and functional diversity, and it can ultimately influence process rates and state variables in an ecosystem [13]. This suggests that concrete substrates are not conducive to the recovery of bacterial community diversity [20]. An analysis of the microbial diversity of the water column and phylogenetic tree showed that the concrete substrate changed the structural composition of the soil bacterial community [31], which was less diverse than the mud-bottom water column, because bacteria are suited to nutrient-rich silt environments, and higher fertility stimulates bacterial growth. A poor concrete substrate does not provide sufficient nutrients for microbial growth, so concrete substrates have a negative impact on the diversity of the microbial community in the water column.

4.2. Microbial Co-Occurrence Network Composition of Water

The total microbial network was scale-free, which implied that a high number of connectors co-exist with many species that have a small edge number. It could be concluded that complex interactions among microbiota play a critical role in community assembly processes [32]. Due to the characteristics of small-world networks, it is possible that effects on a few taxa are transmitted to any other member of the microbial community through a few key vertices. The modularity of this microbial co-occurrence network varied with the degree of artificial intervention changes. Previous studies have found the existence of artificial-factor-driven modules, such as fasting stress [27] and dietary supplementation [11]. Moreover, the microbial patterns in the current modules may also indicate similarities in microbial symbiosis patterns across habitats, given that modules in a microbial symbiosis network may represent different ecological contexts. Within the current total microbial symbiosis network, a similar distribution of modules was not found between the ARC subnetwork and the other two subnetworks.
Dominant species might play an important role in the construction of microbial networks [12]. As described above, the total microbial co-occurrence network was constructed based on three subnetworks. In each network, the dominant phyla were mainly Proteobacteria, Patescibacteria, Firmicutes, Bacteroidota, and Actinobacteriota, with Proteobacteria and Bacteroidota dominating, and Patescibacteria in the ARC subnetwork presented in a disordered form in the total co-occurrence network. Bacteroidota play an important role in the conversion of complex molecules into simple compounds. A unique degradation mechanism has been found to have evolved in Bacteroidota, and it mediates the degradation of most polysaccharides [33]. It has been shown that Bacteroidota have a strong correlation with high concentrations of dissolved organic carbon, suggesting that the high activity of Bacteroidota at high concentrations of organic carbon and the lack of nutrient-rich substrates in concrete may be the reasons for this phylum being dominant [34]. At the phylum level, we found a decrease in the relative abundance of the phylum Patescibacteria, accompanied by fewer interconnections in the ARC group, which revealed that the earthen pond storage still had an advantage.

4.3. Microbial Co-Occurrence Network Topological Roles of Water

Microorganisms prefer to co-exist by building complex ecological networks, as most are unable to survive on their own [35]. Interspecies interactions determine the functional properties or ecological niche occupancy of microbial communities and play an important role in facilitating ecosystem processes [36]. It has been shown that interspecific linkages play an important role in driving the beta diversity of nitrogen-fixing nutrient flora in rice soils [31]. Biological factors were found to be more predictive of bacterial alpha and beta diversity than environmental factors, suggesting that biological interactions have a more important role in the diversity and structuring of bacterial communities in different habitats. This observation was also confirmed by examining the primary role of biotic factors in determining the distribution of specific taxa in the community [37]. Biological mechanisms may be related to species associations, which are commonly used in ecology and biogeography as a proxy for species interactions in communities. Species interactions, such as competition and reciprocity, resulting from differences in fitness can lead to the delineation of ecological niches among community members in response to environmental heterogeneity [38]. For example, competition caused by limited nutrient sources and antagonism between species limits species co-existence and thus affects the construction of microbial communities. Metabolic interdependence between taxa can induce species co-existence and lead to microbial aggregation. These studies therefore support our conclusion that interactions between microbial taxa promote significant changes in community beta diversity across habitats on a large scale.
The different profiles of topological roles along subnetworks suggest that unique microbial patterns exist in each subnetwork. The key taxa represent highly connected microorganisms that play an important role in the structure and function of the microbiota and act as indicators of experimental treatment change. A microbial community is a complex network generated by interspecies interactions within a microbial community that maintains the stability of a complex microbial ecosystem [14]. In this study, we found that the co-existence network of the microbial community in the earthen pond water source was more complex and shared ecological niches that were more developed. It has been found that a higher network connectivity may be related to the rapid response of microorganisms to environmental disturbances; therefore, the higher network connectivity of the microbial community of the earthen pond water source in this study indicates that the surface microbial community is more susceptible to environmental disturbances, which is the reason for which the microbial composition of the concrete pond water source is more variable. It was found that microbial taxa co-occurred more frequently (to a higher degree) in earthen pond water environments, possibly in part because the increased nutrient enrichment of the earthen ponds stimulated increased biomass and provided more opportunities for interactions between different species. In addition, negatively correlated linkages appeared in the subnetwork of the concrete water sources, suggesting that concrete may cause more antagonistic or competing biological interactions. This may be due to the fact that the nutrient-poor concrete substrate is not conducive to biological growth, leading to reduced community stability, increased competition between species, and reduced resource transfer efficiency compared to those species colonizing more isolated spaces. On this basis, we found that substrate species are an important abiotic factor influencing bacterial community structure and species co-existence.
Interspecific interactions within microbial communities may occur as a result of various species performing comparable or complementary roles or sharing ecological niches [35]. Most bacteria are natural auxobactoria. They are unable to synthesize many vital nutrients because of the absence of crucial pathways or key genes [39]. As a result, auxotrophic bacteria’s survival is largely reliant on the community or host as a whole for the interchange of carbon flows and by-products. Because it is more robust to population disturbances under spatial constraints, synergism is expected to support a more stable co-existence. Conversely, competitive interactions are prone to disruption and might lead to unstable co-existence [40]. However, contrary views from previous studies have suggested that ecological competition can contribute to the stability of microbial communities. A synergistic effect dominates the microbial network of the water microbiome, as indicated by the results of this experiment, which are consistent with those of previous studies in Procambarus clarkia [11,27]. Furthermore, there are also variations in the composition of microbial networks. The majority of OTUs in microbial networks are peripheral nodes, although a few act as linking nodes or modular hubs. Ecologically, peripheral nodes may behave as specialists, whereas connecting nodes and modular hubs may act as generalists. The functional key OTUs performed by generalists play a critical role in sustaining a network’s identity [41]. In these networks, the majority of generalists are from dominant microbial communities, indicating that dominant microbial communities play an important role in the networks. The number of connectors and modular hubs suggests that the topology of a microbial network varies between substrate sources and that the nature of the modules varies significantly. The pattern of lower abundance and types of keystone species in concrete substrate waters than in mud substrate waters suggests that concrete substrate microbial communities may be more susceptible to fragmentation and more vulnerable to overall community collapse if keystone species are lost to environmental influences. Keystone species play an important role in maintaining communities and functions. Proteobacteria act as both dominant and keystone species, suggesting that they are actively involved in the function and processes of reservoir ecosystems. It was found that a reduction in peripheral nodes had no structural impact on microbial network properties, while the network deteriorated when generalist nodes were reduced [42]. Consequently, the results of our study suggest that the concrete substrate led to the deterioration of the entire network, resulting in a dysfunctional microbial composition. However, the increase in the number of modules in the co-occurrence network of the water microbiome in the case of the earthen pond suggests that the muddy substrate is a contributor to microbial diversity and the stability of the microecology of water bodies.

4.4. Microbial Co-Occurrence Network Modular Structures of Water

According to the results based on OTUs sensitive to water substrates, the three modules that make up the core cluster demonstrated strong demarcation to distinct habitats. This is in line with the PCoA results revealed previously. However, the independent co-occurrence network for each group reveals that the water microbiome on the concrete substrate became more modular, diminishing the network’s complexity. It has been shown that the higher the mean degree and mean clustering coefficient of a microbial community network topology, the lower the mean path length and the more complex the interactions between species. In addition, it has been demonstrated that water sources alter the composition of differential OTUs and their distribution in networks. Furthermore, by varying the average degree (avgK), average clustering coefficient (avgCC), average path distance (GD), and modularity coefficient after performing network modularity analysis separately for each treatment, water sources were found to significantly influence the ecological network structure of microbial communities. As is well known, modularity is one of the major structural elements of networks, indicating how well the network is partitioned into well-defined sub-modules [12]. The identification of sub-modules in a complex network does not only show the building patterns among these networks into closely linked communities. The link between this building pattern and its functionality and robustness is arguably more crucial [43]. Each microbial community in this study has its own ecological network with distinct sub-modules, and the dominant microbial community is the main component of these networks, signaling that the dominant microbial community plays a critical role in these networks. The results demonstrate that numerous OTUs in the sub-modules belong to the same group. OTUs of the same taxon are quite likely to have similar functions, given that they share the same genes [44]. Furthermore, there is a positive correlation between network complexity and average connectivity. Thus, water introduced from the concrete pond reduced the complexity of the ecological network, implying that the microbial community was impacted in the opposite way.

5. Conclusions

Future large-scale culture-based research may reveal the biological mechanism of microbial interactions, deepening our understanding of how water microbiomes respond to environmental stress. In this study, it was found that muddy substrates contributed to the community structure of the water microbiome, which was correlated with the proportions of the dominant phyla, and their strong inter-phylum connections co-existed in the microbial network. As a means of water storage, concrete substrates can prevent water seepage in arid areas, but natural water sources and artificially recharged water from earthen pond substrates are of great significance in maintaining the health of water microecosystems.

Supplementary Materials

The following supporting information can be downloaded at: https://www.mdpi.com/article/10.3390/w14142188/s1, Figure S1: Microbial composition; Figure S2: Alpha diversity of microbial community; Figure S3: Differential analysis in the microbial community; Figure S4: The degree distribution of microbial co-occurrence network; Figure S5: The topological roles of 15 modules of the microbial co-occurrence network.

Author Contributions

Conceptualization, D.Z. and L.Y.; methodology, L.T.; software, Y.X. (Yu Xiong); validation, Y.X. (Yu Xiong), L.T. and H.J.; investigation, Y.X. (Yu Xiong); resources, C.S., J.T. and Y.X. (Yanping Xu); writing—original draft preparation, Y.X. (Yu Xiong); writing—review and editing, L.T.; visualization, Y.X. (Yu Xiong); supervision, D.Z.; project administration, D.Z.; funding acquisition, D.Z. and L.Y. All authors have read and agreed to the published version of the manuscript.

Funding

This research was funded by the Beijing Forestry University Outstanding Young Talent Cultivation Project (2019JQ0318).

Institutional Review Board Statement

Not applicable.

Informed Consent Statement

Not applicable.

Data Availability Statement

The raw sequencing reads of all samples were deposited in the NCBI database (https://www.ncbi.nlm.nih.gov/) under BioProject accession number PRJNA803975 (accessed on 7 June 2022).

Acknowledgments

We appreciate the Xinjiang Kalamaili Mountain Ungulate Nature Reserve Management Center for providing personnel and material resources for this research.

Conflicts of Interest

The authors declare no conflict of interest.

References

  1. Ramakrishna, B.S. Role of the gut microbiota in human nutrition and metabolism. J. Gastroenterol. Hepatol. 2013, 28, 9–17. [Google Scholar] [CrossRef] [PubMed]
  2. Montoya, J.M.; Pimm, S.L.; Solé, R.V. Ecological networks and their fragility. Nature 2006, 442, 259–264. [Google Scholar] [CrossRef] [PubMed]
  3. Junier, P.; Molina, V.; Dorador, C.; Hadas, O.; Kim, O.-S.; Junier, T.; Witzel, J.-P.; Imhoff, J.F. Phylogenetic and functional marker genes to study ammonia-oxidizing microorganisms (AOM) in the environment. Appl. Microbiol. Biotechnol. 2010, 85, 425–440. [Google Scholar] [CrossRef] [Green Version]
  4. Ng, D.H.P.; Kumar, A.; Cao, B. Microorganisms meet solid minerals: Interactions and biotechnological applications. Appl. Microbiol. Biotechnol. 2016, 100, 6935–6946. [Google Scholar] [CrossRef]
  5. Zou, Y.; Han, C. Interaction between intestinal microorganisms and carbohydrates of mammals and its influence. J. Appl. Ecol. 2020, 31, 3959–3968. [Google Scholar]
  6. Isobe, K.; Koba, K.; Otsuka, S.; Senoo, K. Nitrification and nitrifying microbial communities in forest soils. J. For. Res. 2011, 16, 351. [Google Scholar] [CrossRef]
  7. Oppert, B.; Martynov, A.G.; Elpidina, E.N. Bacillus thuringiensis Cry3Aa protoxin intoxication of Tenebrio molitor induces widespread changes in the expression of serine peptidase transcripts. Comp. Biochem. Physiol. Part D Genom. Proteom. 2012, 7, 233–242. [Google Scholar] [CrossRef]
  8. Gómez, R.G.D.; Shen, M.A. Influence of probiotics on the growth and digestive enzyme activity of white Pacific shrimp (Litopenaeus vannamei). J. Ocean. Univ. Chin. 2008, 7, 215–218. [Google Scholar] [CrossRef]
  9. Peng, Z.; Guo, X.; Xu, Y.; Liu, D.; Wang, H.; Guo, L.; Zhang, Y. Advances in interaction between medicinal plants and rhizosphere microorganisms. China J. Chin. Mater. Med. 2020, 45, 2023–2030. [Google Scholar]
  10. Tremaroli, V.; Bäckhed, F. Functional interactions between the gut microbiota and host metabolism. Nature 2012, 489, 242–249. [Google Scholar] [CrossRef]
  11. Cai, M.; Hui, W.; Deng, X.; Wang, A.; Hu, Y.; Liu, B.; Chen, K.; Liu, F.; Tian, H.; Gu, X.; et al. Dietary Haematococcus pluvialis promotes growth of red swamp crayfish Procambarus clarkii (Girard, 1852) via positive regulation of the gut microbial co-occurrence network. Aquaculture 2022, 551, 737900. [Google Scholar] [CrossRef]
  12. Deng, Y.; Jiang, Y.-H.; Yang, Y.; He, Z.; Luo, F.; Zhou, J. Molecular ecological network analyses. BMC Bioinf. 2012, 13, 113. [Google Scholar] [CrossRef] [PubMed] [Green Version]
  13. He, J.; Lange, J.; Marinos, G.; Bathia, J.; Harris, D.; Soluch, R.; Vaibhvi, V.; Deines, P.; Hassani, M.A.; Wagner, K.-S.; et al. Advancing our functional understanding of host-microbiota interactions: A need for new types of studies. Bioessays 2020, 42, e1900211. [Google Scholar] [CrossRef] [Green Version]
  14. Coyte, K.Z.; Schluter, J.; Foster, K.R. The ecology of the microbiome: Networks, competition, and stability. Science 2015, 350, 663–666. [Google Scholar] [CrossRef] [PubMed]
  15. Li, X.; Watanabe, K.; Kimura, I. Gut microbiota dysbiosis drives and implies novel therapeutic strategies for diabetes mellitus and related metabolic diseases. Front. Immunol. 2017, 8, 1882. [Google Scholar] [CrossRef]
  16. Zhang, M.; Xu, W.T.; Pape, T.; Pei, W.Y.; Zhang, D. Flesh flies (Diptera: Sarcophagidae) of Kalamaili Mountain Ungulate Nature Reserve (China: Xinjiang): Checklist and description of four new species. Zootaxa 2021, 5063, 1–95. [Google Scholar] [CrossRef]
  17. McNeely, J.A. Today’s protected areas: Supporting a more sustainable future for humanity. Integr. Zool. 2020, 15, 603–616. [Google Scholar] [CrossRef]
  18. Cooke, S.J.; Bergman, J.N.; Nyboer, E.A.; Reid, A.J.; Gallagher, A.J.; Hammerschlag, N.; Van de Riet, K.; Vermaire, J.C. Overcoming the concrete conquest of aquatic ecosystems. Biol. Conserv. 2020, 247, 108589. [Google Scholar] [CrossRef]
  19. Guo, Z.; Wang, L.; Cong, W.; Jiang, Z.; Liang, Z. Comparative Analysis of the Ecological Succession of Microbial Communities on Two Artificial Reef Materials. Microorganisms 2021, 9, 120. [Google Scholar] [CrossRef]
  20. Long, Y.; Bing, Y.; Zhang, Z.; Cui, K.; Pan, X.; Yan, X.; Li, B.; Xie, S.; Guo, Q. Influence of plantation on microbial community in porous concrete treating polluted surface water. Int. Biodeterior. Biodegrad. 2017, 117, 8–13. [Google Scholar] [CrossRef]
  21. Buysschaert, B.; Favere, J.; Vermijs, L.; Baetens, V.; Naka, A.; Boon, N.; Gusseme, B.D. Flow cytometric fingerprinting to assess the microbial community response to changing water quality and additives. Environ. Sci. Water Res. Technol. 2019, 5, 1672–1682. [Google Scholar] [CrossRef]
  22. Furlan, E.M.; Davis, J.; Duncan, R.P. Identifying error and accurately interpreting environmental DNA metabarcoding results: A case study to detect vertebrates at arid zone waterholes. Mol. Ecol. Resour. 2020, 20, 1259–1276. [Google Scholar] [CrossRef] [PubMed]
  23. Chen, S.; Zhou, Y.; Chen, Y.; Gu, J. fastp: An ultra-fast all-in-one FASTQ preprocessor. Bioinformatics 2018, 34, i884–i890. [Google Scholar] [CrossRef] [PubMed]
  24. Magoč, T.; Salzberg, S.L. FLASH: Fast length adjustment of short reads to improve genome assemblies. Bioinformatics 2011, 27, 2957–2963. [Google Scholar] [CrossRef] [PubMed]
  25. Edgar, R.C.; Haas, B.J.; Clemente, J.C.; Quince, C.; Knight, R. UCHIME improves sensitivity and speed of chimera detection. Bioinformatics 2011, 27, 2194–2200. [Google Scholar] [CrossRef] [PubMed] [Green Version]
  26. Wang, Q.; Garrity, G.M.; Tiedje, J.M.; Cole, J.R. Naive Bayesian classifier for rapid assignment of rRNA sequences into the new bacterial taxonomy. Appl. Environ. Microbiol. 2007, 73, 5261–5267. [Google Scholar] [CrossRef] [Green Version]
  27. Cai, M.; Li, H.; Gu, X.; Tian, H.; Liu, F.; Yang, W.; Ren, S.; Chu, W.; Hu, Y.; Wang, A.; et al. Re-aliment regains feed deprivation-induced microflora dysbiosis and immune stress in the gut of red swamp crayfish (Procambarus clarkii). Aquacult. Rep. 2022, 22, 100992. [Google Scholar] [CrossRef]
  28. Lu, P.; Chen, C.; Wang, Q.; Wang, Z.; Zhang, X.; Xie, S. Phylogenetic diversity of microbial communities in real drinking water distribution systems. Biotechnol. Bioprocess. Eng. 2013, 1, 119–124. [Google Scholar] [CrossRef]
  29. El-Chakhtoura, J.; Saikaly, P.E.; van Loosdrecht, M.C.M.; Vrouwenvelder, J.S. Impact of distribution and network flushing on the drinking water microbiome. Front. Microbiol. 2018, 9, 2205. [Google Scholar] [CrossRef] [Green Version]
  30. Glasl, B.; Smith, C.E.; Bourne, D.G.; Webster, N.S. Exploring the diversity-stability paradigm using sponge microbial communities. Sci. Rep. 2018, 8, 8425. [Google Scholar] [CrossRef] [Green Version]
  31. Fernández-Luqueño, F.; Valenzuela-Encinas, C.; Marsch, R.; Martínez-Suárez, C.; Vázquez-Núñez, E.; Dendooven, L. Microbial communities to mitigate contamination of PAHs in soil—Possibilities and challenges: A review. Environ. Sci. Pollut. Res. 2011, 18, 12–30. [Google Scholar] [CrossRef] [PubMed]
  32. Ma, B.; Wang, Y.; Ye, S.; Liu, S.; Stirling, E.; Gilbert, J.A.; Faust, K.; Knight, R.; Jansson, J.K.; Cardona, C.; et al. Earth microbial co-occurrence network reveals interconnection pattern across microbiomes. Microbiome 2020, 8, 82. [Google Scholar] [CrossRef] [PubMed]
  33. Sun, C.; Mudassir, S.; Zhang, Z.; Feng, Y.; Chang, Y.; Che, Q.; Gu, Q.; Zhu, T.; Zhang, G.; Li, D. Secondary metabolites from deep-sea derived microorganisms. Curr. Med. Chem. 2020, 27, 6244–6273. [Google Scholar] [CrossRef] [PubMed]
  34. Johnson, E.L.; Heaver, S.L.; Walters, W.A.; Ley, R.E. Microbiome and metabolic disease: Revisiting the bacterial phylum bacteroidetes. J. Mol. Med. 2017, 95, 1–8. [Google Scholar] [CrossRef] [PubMed] [Green Version]
  35. Zhou, J.; Deng, Y.; Luo, F.; He, Z.; Yang, Y. Phylogenetic molecular ecological network of soil microbial communities in response to elevated CO2. mBio 2011, 2, e00122-11. [Google Scholar] [CrossRef] [PubMed] [Green Version]
  36. Zhang, Z.; Yan, C.; Zhang, H. Mutualism between antagonists: Its ecological and evolutionary implications. Integr. Zool. 2021, 16, 84–96. [Google Scholar] [CrossRef] [PubMed]
  37. Yan, L.; Tang, L.; Zhou, Z.; Lu, W.; Wang, B.; Sun, Z.; Jiang, X.; Hu, D.; Li, J.; Zhang, D. Metagenomics reveals contrasting energy utilization efficiencies of captive and wild camels (Camelus ferus). Integr. Zool. 2022, 17, 333–345. [Google Scholar] [CrossRef] [PubMed]
  38. Tourinho, L.; Vale, M.M. Choosing among correlative, mechanistic, and hybrid models of species’ niche and distribution. Integr. Zool. 2021. [Google Scholar] [CrossRef]
  39. Mee, M.T.; Collins, J.J.; Church, G.M.; Wang, H.H. Syntrophic exchange in synthetic microbial communities. Proc. Natl. Acad. Sci. USA 2014, 111, E2149–E2156. [Google Scholar] [CrossRef] [Green Version]
  40. Pande, S.; Kaftan, F.; Lang, S.; Svatoš, A.; Germerodt, S.; Kost, C. Privatization of cooperative benefits stabilizes mutualistic cross-feeding interactions in spatially structured environments. ISME J. 2016, 10, 1413–1423. [Google Scholar] [CrossRef]
  41. Olesen, J.M.; Bascompte, J.; Dupont, Y.L.; Jordano, P. The modularity of pollination networks. Proc. Natl. Acad. Sci. USA 2007, 104, 19891–19896. [Google Scholar] [CrossRef] [PubMed] [Green Version]
  42. Ramos-Jiliberto, R.; Valdovinos, F.S.; Moisset de Espanés, P.; Flores, J.D. Topological plasticity increases robustness of mutualistic networks. J. Anim. Ecol. 2012, 81, 896–904. [Google Scholar] [CrossRef] [PubMed]
  43. McWilliams, C.; Lurgi, M.; Montoya, J.M.; Sauve, A.; Montoya, D. The stability of multitrophic communities under habitat loss. Nat. Commun. 2019, 10, 2322. [Google Scholar] [CrossRef] [PubMed] [Green Version]
  44. Yan, K.K.; Wang, D.; Rozowsky, J.; Zheng, H.; Cheng, C.; Gerstein, M. OrthoClust: An orthology-based network framework for clustering data across multiple species. Genome Biol. 2014, 15, R100. [Google Scholar] [CrossRef] [PubMed] [Green Version]
Figure 1. Locations of the sampling site for water sources in Kalamaili Mountain Ungulate Nature Reserve (KNR). Natural water sources (NRE, dots): W1 (rw1, rw2, rw3), W2 (rw4, rw5, rw6), W7 (rw7, rw8, rw9), W9 (rw10, rw11 rw12), W14 (rw13, rw14, rw15), W16 (rw16, rw17, rw18); artificial recharged water from earthen pond substrate (ARE, triangles): W3 (rh1, rh2, rh3), W4 (rh4, rh5, rh6), W5 (rh7, rh8, rh9), W6 (rh10, rh11, rh12), W8 (rh13, rh14, rh15), W11 (rh16, rh17), W12 (rh18, rh19); artificial recharged water from concrete pond substrate (ARC, pentagons): W10 (rc1, rc2, rc3), W13 (rc4, rc5, rc6).
Water 14 02188 g001
Figure 2. Beta diversity of natural water sources (NRE, included rw1-18 in blue) microbial community, artificial recharged water from earthen pond substrate (ARE, included rh1-19 in red) microbial community, and artificial recharged water from concrete pond substrate (ARC, included rc1-6 in green) microbial community.
Water 14 02188 g002
Figure 3. Circos diagram of total microbial co-occurrence network. Circos diagram consists of three parts: an outer layer of circles and dots, a middle layer of color blocks, and an inner layer of connecting lines. The outer layer was visualized by taking the logarithm of the microbial abundance of the total network; the middle layer presents the composition of microorganisms, with six layers from the outermost phylum level to the inner species level; and the innermost layer presents the interaction links between microbes, with positive correlations indicated with red lines and negative correlations indicated with blue lines.
Water 14 02188 g003
Figure 4. Microbial co-occurrence total network. (a) Layout and taxonomic profiles of 15 dominant modules (M) in the microbial co-occurrence network. Modules are displayed in different colors. (b) The distribution of vertices from 3 subnetworks, where green indicates the vertices from corresponding subnetworks.
Water 14 02188 g004
Figure 5. Microbial co-occurrence subnetworks and their modularity. (a) The taxonomic levels are class, order, family, genera, and species from the outside to the inside of the circle. (b) Nodes in the network indicate OTUs. Colors of the nodes indicate different major classes. The edges (blue edge = negative interaction, and red edge = positive interaction) inside the circle and ecological network represent the interactions between species.
Water 14 02188 g005
Figure 6. Topological roles of microbial co-occurrence subnetwork. (a) Different colors represent different modules from three subnetworks. (b) Different colors represent different phyla from three subnetworks. (c) The asterisks represent the statistically significantly different values. **: p < 0.01, ***: p < 0.001. (d) The relationship between the degree and closeness centrality under three subnetworks.
Water 14 02188 g006
Table 1. Comparison of the roles of the natural water sources (NRE) network, artificially recharged water from earthen pond substrate (ARE) network, and artificially recharged water from concrete pond substrate (ARC) network.
ItemEmpirical NetworkRandom Network
Network
Size (Node)
Network
Size (Edge)
Average
Degree
(avgK)
Average
Clustering
Coefficient
(avgCC)
Average Path
Distance
(GD)
Modularity (No.
of Modules)
Average
Clustering
Coefficient
(avgCC)
Average Path
Distance
(GD)
Modularity
NRE15326787488.610.7983.0330.751 (15)0.0579 ± 0.00021.9477 ± 0.00010.0489 ± 0.0013
ARE14535312773.130.7343.1440.720 (13)0.0504 ± 0.00021.9735 ± 0.00020.0574 ± 0.0014
ARC353519529.430.9691.0240.720 (18)0.0837 ± 0.00121.9943 ± 0.00140.1233 ± 0.0047
Publisher’s Note: MDPI stays neutral with regard to jurisdictional claims in published maps and institutional affiliations.

