
Study on the Sugar-Producing Effect of High-Temperature Anaerobic Straw Biosaccharification Strain
by
Chengjiao Xu
1,2, 
Mengqi Ding
1,
Chenhao Cui
1,
Peichao Zhao
2,
Shanshan Yang
1,*,
Jie Ding
1,* and
Nanqi Ren
1 1
State Key Laboratory of Urban Water Resource and Environment, School of Environment, Harbin Institute of Technology, Harbin 150090, China
2
College of Resources and Environment, Northeast Agricultural University, Harbin 150006, China
*
Authors to whom correspondence should be addressed.
Water 2022, 14(14), 2186; https://doi.org/10.3390/w14142186
Submission received: 14 June 2022
/
Revised: 30 June 2022
/
Accepted: 5 July 2022
/
Published: 11 July 2022
(This article belongs to the Section Wastewater Treatment and Reuse)
Abstract
:The utilization of straw waste cellulose will be beneficial by economic, social, and environmental means. The present study sought to screen the high-efficiency cellulose sugar-producing strain from corn straw. The 16S high-throughput sequencing method and the combination of morphological, physiological, and biochemical characteristics of the strain confirmed the strain to be Clostridium thermocellum, which was named Clostridium thermocellum FC811. Moreover, the single factor experiment was conducted to investigate the effect of environmental factors on saccharification efficiency. The optimal saccharification conditions of cellulose saccharification of FC811 strain selected through response surface analysis were as follows: temperature of 58.9 °C, pH of 7.21, culture time of 6.60 d, substrate concentration of 5.01 g/L, and yeast powder concentration of 2.15 g/L. The soluble sugar yield was 3.11 g/L, and the conversion rate of reducing sugar was 62.2%. This study will provide a reference for resource and energy utilization of straw materials, simultaneous fermentation of sugar and hydrogen production, and their large-scale production and application.
1. Introduction
In recent years, traditional fossil energy has been facing serious social problems [1]. Moreover, the global water resources are also polluted by the digestion of traditional fossil energy [2,3]. The lignocellulosic raw material is the most abundant and cheapest renewable resource on earth, of which 89% are unutilized by humans. According to reports, the global annual cumulative production reaches 200 billion tons [4,5,6]. Some studies find that mealworms are capable of digesting lignin, hemicellulose, and cellulose in rice straw, corn straw, wheat straw, and bran [7,8]. Therefore, the conversion of lignocellulose into clean energy substances, such as hydrogen, ethanol, and butanol, through biotechnology could effectively reduce CO2 emission and synergistically solve environmental and energy problems by ecological means [9,10,11,12].
Lignocellulosic saccharification has always been a bottleneck in the efficient utilization of fibrous raw materials, such as straw [13,14]. The keys to converting lignocellulose into energy substances include the destruction of lignin, the release of cellulose and hemicellulose, and the hydrolysis of these substances into small monosaccharides [15,16]. At present, the lignocellulosic saccharification treatment can be divided into three ways: physical, chemical, and biological [17,18]. Although the physical and chemical methods can effectively saccharify lignocellulose, the production of monosaccharides through the hydrolysis process is often accompanied by the generation of by-products, contributing to secondary environmental pollution [19,20]. However, the biological saccharification method characterized by mild conditions, low energy consumption, and green environmental protection has attracted the attention of researchers worldwide [21,22,23]. It is an important pathway to promote the lignocellulosic biomass resource utilization by converting cellulose, hemicellulose, and other macromolecule carbohydrates into fermentable sugars using saccharifying strains, or enzymes.
Cellulase is widely distributed in nature and can be obtained from many microorganisms, plants, and insects [24,25,26]. It has the advantage of decomposing cellulosic raw materials. However, at present, the cost of cellulase acquisition is high, and the enzymatic hydrolysis efficiency is generally low, far less than amylase and protease, which greatly affects the mass production and wide application of cellulase [27,28]. Therefore, screening the saccharifying strains that can degrade lignocellulose efficiently in the environment for biosaccharification would be a feasible research direction.
However, the glucose effect is the primary bottleneck in the biosaccharification process using strains. Most of the cellulose degrading bacteria can metabolize the reducing sugar obtained through the biosaccharification process but cannot accumulate the reducing sugars. Therefore, exploring and domesticating cellulose biosaccharifying strains with high-efficiency, reducing sugar tolerance, continuously improving and optimizing their culture conditions, and further fermenting to produce hydrogen, ethanol, butanol, and other energy substances are the keys to the efficient utilization of cellulose resources. The study will provide a theoretical basis for the application of biological refining pathway for energy production from organic wastes.
2. Materials and Methods
2.1. Strain Source
In this study, rotten bark (Yichun, Heilongjiang, 128.92 E, 47.73 N, 290 m, pH 7.4) was used as the source of strain. The compost samples were put into anaerobic sterile water with several glass beads and vibrated in an oscillator for 1 h under the protection of nitrogen. The shear force of the glass beads was used for crushing the compost sample to fully disperse the microorganisms in the system. The mixed system was then inoculated in corn straw culture medium with 10% inoculation amount, enriched, and in static at 35 °C for 10 d. The inoculation was transferred twice to accumulate the cellulose degrading strains greatly.
The original bacterial solution was transferred to a 100 mL anaerobic flask containing the modified ATCC 1191 (MA) medium for culture [29]. The working volume was 50 mL, the inoculation amount was 10%, and the culture time was 5 d. After inoculation in the continuous flow domestication reactor, the hydraulic retention time was 7 d. Then, the fresh corn straw culture solution was added every 24 h and continued to use the corn straw as the sole carbon source to culture in a 35 °C incubator. Later, the samples were taken every 24 h, and the reducing sugar concentration, pH, and other indicators were determined using DNS colorimetry under the conditions of anaerobic culture until the compound bacteria tend to be stable. When the reducing sugar yield increased, the culture system with the dilution degree was diluted to 10−3–10−9 and then inoculated to the fresh straw culture medium for liquid culture. In this way, continuous dilution was used to obtain a high sugar yield compound bacteria. In order to verify the cellulose degradation ability of the compound bacteria, they were added into the fermentation medium with straw and filter paper as the only carbon source, respectively, to observe the degradation effect.
2.1.1. Preparation of Culture Medium
Modified MA medium: NaCl 1.0 g/L, NH4Cl 1.0 g/L, K2HPO4 1.5 g/L, KH2PO4 3.5 g/L, MgCl2 0.5 g/L, KCl 0.2 g/L, yeast extract 2 g/L, peptone 2 g/L cysteine 0.6 g/L, trace element 5 mL/L, vitamin 0.5 mL/L, 0.1% (w/v) resazurin 0.2 g/L, microcrystalline cellulose (PH101) 5 g/L, distilled water 1000 mL, and pH was adjusted to 7.
Straw medium: carbon source was corn straw; other components were the same as in the MA medium.
Microcrystalline cellulose rolling tube medium: NaCl 1.0 g/L, NH4Cl 1.0 g/L, K2HPO4 1.5 g/L, KH2PO4 3.5 g/L, MgCl2 0.5 g/L, KCl 0.2 g/L, yeast extract 2 g/L, peptone 2 g/L cysteine 0.6 g/L, trace element 5 mL/L, vitamin 0.5 mL/L, 0.1% (w/v) resazurin 0.2 g/L, microcrystalline cellulose (PH101) 5 g/L, agar 20 g, distilled water 1000 mL, and pH was adjusted to 7.
2.1.2. Preparation of Reagent and Buffer Solution
Trace element: FeCl2 1.5 g/L, ZnCl2 70.0 mg/L, H3BO3 6.0 mg/L, MnCl2 4H2O 0.1 g/L, CuCl2 2H2O 2.0 mg/L, CoCl2 6H2O 0.19 g/L, NiCl2 6H2O 24.0 mg/L, Na2MoO4 H2O 36.0 mg/L, Na2WO4 15.0 mg/L, Na2O4Se 5H2O 15.0 mg/L, and distilled water 1000 mL.
Vitamins: Lipoic acid 50.0 mg/L, biotin 20.0 mg/L, niacin 0.35 g/L, thiamine hydrochloride 5.0 mg/L, p-aminobenzoic acid 50.0 mg/L, folic acid 20.0 mg/L, calcium pantothenate 50.0 mg/L, Vitamin B12 1.0 mg/L, pyridoxine hydrochloride 100.0 mg/L, distilled water 1000 mg/L, and pH was adjusted to 6.8–7.0.
DNS solution: 6.3 g of 3,5-nitrosalicylic acid was dissolved in 262 mL of 2 mol/L NaOH solution, and then the mixed solution was slowly added to the pre-prepared hot water solution containing 185 g of sodium potassium tartrate, 5 g of phenol, and 5 g sodium sulfite. Later, the solution was thoroughly stirred and dissolved. After the solution was cooled, distilled water was added to a constant volume of 1000 mL, transferred to a brown flask, and refrigerated at 4 °C for 7 days before use.
1 mg/mL glucose standard solution: accurately 100 mg of pure analytical glucose was weighed, dried in an oven at 80 °C to a constant weight, placed in a small beaker, added a small amount of ultra-pure water to dissolve, then transferred to a volumetric flask of 100 mL. Then, ultra-pure water was added to a constant volume of 100 mL, shaken up, and stored in a refrigerator at 4 °C for later use.
2.2. Isolation, Purification, and Identification of High-Efficiency Cellulose Degrading Sugar-Producing Strain
The compound strain was domesticated by the continuous transfer method and inoculation using different carbon sources. The single strain colony was isolated and obtained by the multiple gradient dilution method. Then, the single bacteria with crystalline cellulose as the substrate was used for fermentation. The cellulose degradation and reducing sugar yield rates were recorded to screen high-efficiency degrading bacteria. The bacterial colonies cultured for 5 d were selected, stained by the Gram staining method, and bacteria color was observed under an oil microscope (CX23LEDRFS1C 100X/1.25). The morphological characteristics were identified by scanning electron microscope. Then, the physiological and biochemical reaction characteristics of glucose, microcrystalline cellulose, cellulose-disaccharide, mannose, mannitol, fructose, filter paper, xylose, pentose, and starch were identified according to the previously reported methods. Finally, molecular biological identification was carried out. The genome of the target strain was extracted using the SK8255 Ezup column bacterial genome DNA extraction kit. 27F-AGTTTGATCMTGGCTCAg and 1492R-GGTTACCTTGTTACGACTT were used as the primers for V3-V4 fragment amplification of the 16SrDNA gene. Taq Plus DNA Polymerase was used for PCR amplification. The PCR reaction conditions were set as follows: DNA Template 1 μL, 10× Buffer (with Mg2+) 11.3 μL, dNTP 1 μL, enzyme 0.2 μL, primer F (10 μM) 1 μL, primer R (10 μM) 1 μL, added double-distilled H2O to 25 mL, and stored at 4 °C. The products obtained from this process were purified and detected by 1% agarose gel electrophoresis [30]. The amplification products were sent to Sangon Biotech Co. Ltd. (Shanghai, China). The data were processed using BLAST software (https://blast.ncbi.nlm.nih.gov/Blast.cgi, accessed on 1 November 2020) [31]. The obtained sequences were uploaded to Gen Bank (www.ncbi.nlm.nih.gov, accessed on 1 November 2020) [32] for similarity retrieval, and the strain with the most similar strain sequences was obtained. Finally, MEGA7.0 software (Version 7.0.14, Sudhir Kumar, Koichiro Tamura, and Masatoshi Nei, USA)was used for phylogenetic tree analysis [33]. The taxonomic status of the strain was determined according to its genetic position, morphological, and physiological characteristics in the phylogenetic tree [34].
2.3. Effect of Environmental Factors on Sugar Production Efficiency of High-Efficiency Cellulose Degrading Strains
2.3.1. Temperature
Approximately 45 mL of the fermentation medium containing 5 g/L microcrystalline cellulose was added into a 100 mL anaerobic flask. After sterilization, the cellulosic saccharifying bacterium FC811 was injected into the anaerobic flask with 10% inoculation amount (v/v) and cultured in a water bath constant temperature oscillator at pH 7.0 and 130 rpm under the conditions of 45 °C, 50 °C, 55 °C, 60 °C, 65 °C, 70 °C, and 75 °C. Three parallels were set for each temperature. Later, the samples were taken after 6 d culture, and the biomass of FC811 strain and soluble sugar accumulation in the solution was determined.
2.3.2. Initial pH
Approximately 45 mL of the fermentation medium was added into a 100 mL anaerobic flask. The concentration of microcrystalline cellulose was 5 g/L, and the pH was adjusted to 5.0, 5.5, 6.0, 6.5, 7.0, 7.5, 8.0, 8.5, and 9.0 with 1 mol/L HCl and NaOH. The cellulose saccharifying bacterium FC811 was injected into the fermentation medium with 10% inoculation amount (v/v) and cultured in a water bath constant temperature oscillator at 60 °C with 130 rpm. Three parallels were set for each pH. Later, the samples were taken after 6 d culture, and the biomass of FC811 strain and soluble sugar accumulation in the solution was determined.
2.3.3. Culture Time
Approximately 45 mL of the fermentation medium containing 5 g/L microcrystalline cellulose was added into a 100 mL anaerobic flask. The cellulosic saccharifying bacterium FC811 was injected into an anaerobic flask with 10% inoculation amount (v/v) and cultured in a water bath constant temperature oscillator at 60 °C with pH 7.0 and 130 rpm. The culture time was 1 d, 2 d, 3 d, 4 d, 5 d, 6 d, 7 d, and 8 d, and 3 parallels were set for each culture time. Later, the samples were taken after 6 d culture, and the biomass of FC811 strain and soluble sugar accumulation in the solution was determined.
2.3.4. Substrate Concentration
Approximately 45 mL of the fermentation medium was added into a 100 mL anaerobic flask, and then the concentration of the microcrystalline cellulose in the fermentation medium was adjusted to 1.0, 2.0, 3.0, 4.0, 5.0, 6.0, and 7.0 g/L. The cellulosic saccharifying bacterium FC811 was injected into the anaerobic flask with 10% inoculation amount (v/v) and cultured in a water bath constant temperature oscillator at 60 °C with pH 7.0 and 130 rpm. Three parallels were set for each concentration. Later, the samples were taken after 6 d culture, and the biomass of FC811 strain and soluble sugar accumulation in the solution were determined.
2.3.5. Yeast Powder Content
Approximately 45 mL of the fermentation medium containing 5 g/L microcrystalline cellulose was added into a100 mL anaerobic flask, and then the concentration of yeast power in the fermentation medium was adjusted to 0.0, 0.5, 1.0, 1.5, 2.0, 2.5, 3.0, and 3.5 g/L. The pH was 7, the temperature was 60 °C, and the inoculation amount of the FC811 strain was 10%. The strain was cultured in a water bath constant temperature oscillator 130 rpm for 6 d. Three parallels were set for each concertation. Later, the samples were taken after 6 d culture, and the biomass of FC811 strain and soluble sugar accumulation in the solution was determined.
2.4. Optimization of Experimental Conditions for Sugar Production Efficiency of High-Efficiency Cellulose Degrading Strain
2.4.1. Response Surface Optimization Design for Saccharification Conditions of Microcrystalline Cellulose
Based on the single factor experiment results, the Central Composite Design (CCD) was used to optimize the conditions. Temperature, pH, substrate concentration, culture time, and yeast powder concentration were selected as the independent variables, and the yield of soluble sugar was taken as the only dependent variable. Three parallels were set for each group of experiment, and the factors and levels are listed in Table 1. The polynomial regression method was adopted, and Minitab software (Version17.1.0, Minitab Inc., Philadelphia, PE, USA) was used for quadratic polynomial fitting of experimental data of CCD design. The equation was as follows [35]:
where:
- Y: response model A: model constant
- : Linear coefficient of the model : Square coefficient of the model
- : Interactive coefficient of two factors of the model
2.4.2. Verification Experiment of Saccharification Ability of High-Efficiency Cellulose Degrading Strain to Microcrystalline Cellulose
Approximately 45 mL of the fermentation medium was added into a 100 mL anaerobic flask, and the bacterial solution of Clostridium thermocellum FC811 at 10% inoculation was injected into the fermentation medium. The optimal saccharification conditions optimized by CCD were used for the culture. Three parallels were set, and the samples were taken after culture to determine soluble sugar accumulation in the solution.
2.5. Determination of Reducing Sugar Content
Take 1.00 g of fermented residue into a 50 mL centrifuge tube, add 9.00 mL of sterile water to the centrifuge tube, vortex shake for 0.50 h, stand still, suck the suspension at 3000 g, centrifuge at 4 °C for 5 min, take 1.00 mL of supernatant and add it to a 25 mL graduated tube, at the same time, suck 1.00 mL of supernatant without fermented straw after the same treatment into a 25 mL graduated tube as a blank control, add 1.00 mL of citric acid buffer and 1.50 mL of DNS solution. After mixing, heat it in boiling water for 5 min, cool it, and then fix the volume to the scale line. After fully shaking, measure the absorbance at the wavelength of 540 nm, and measure the reducing sugar concentration through the glucose standard curve.
3. Results and Discussion
3.1. Screening and Morphological Identification of Strains
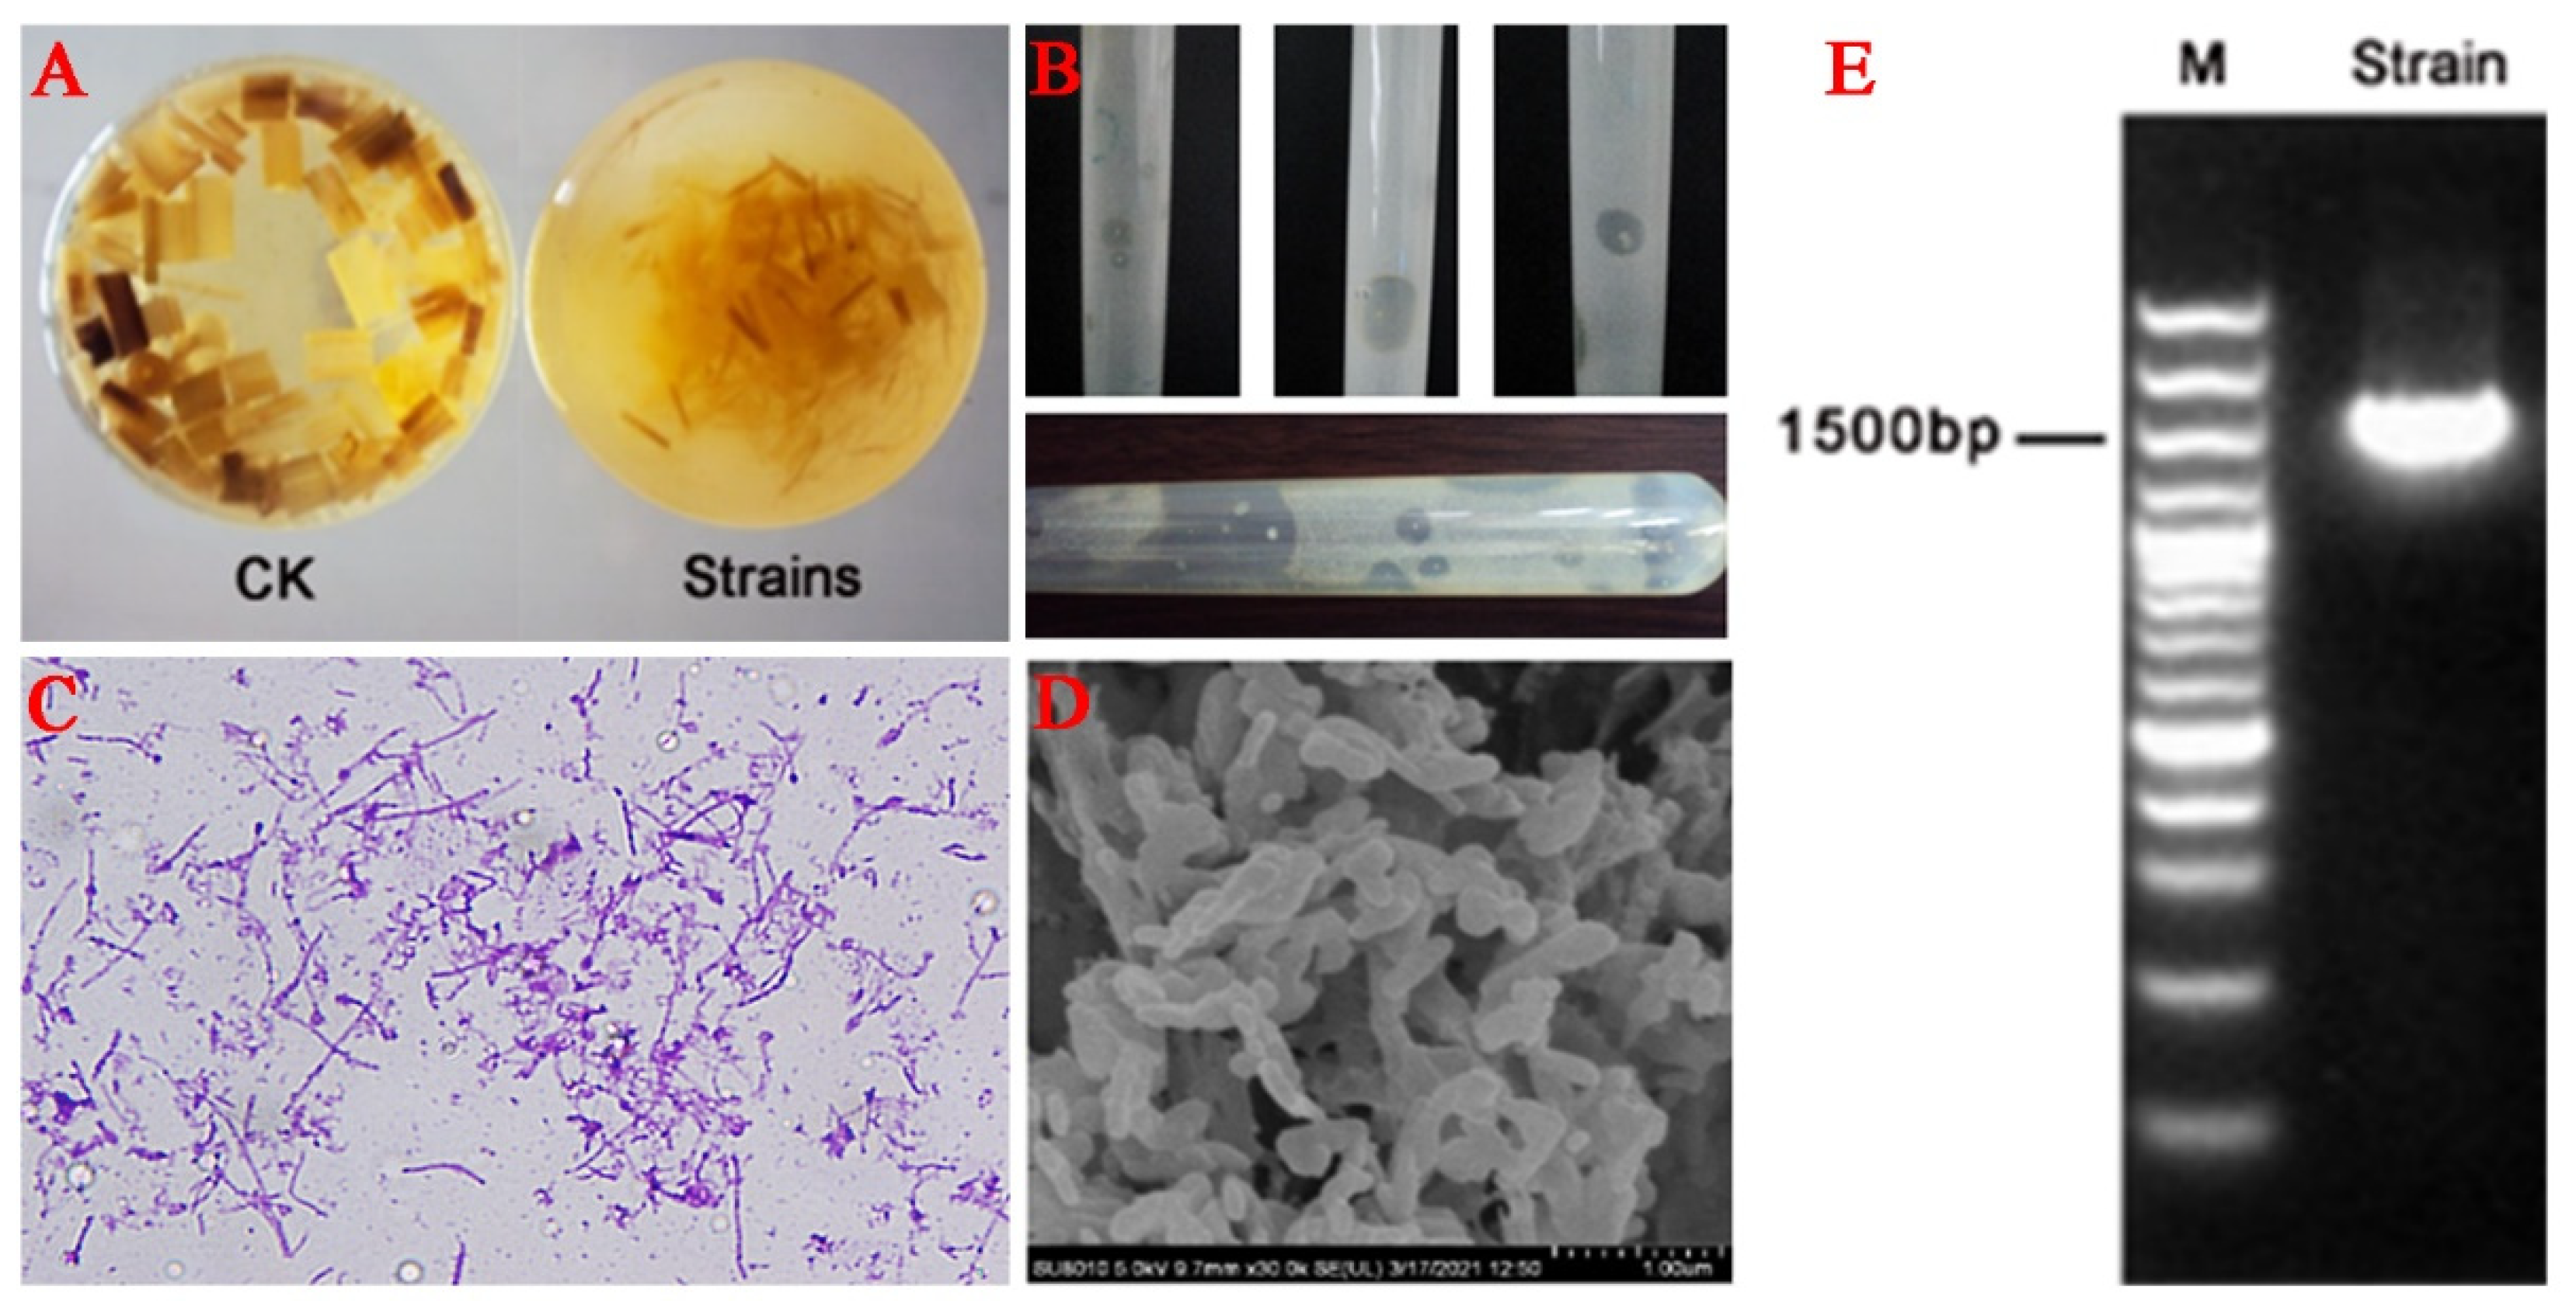
Figure 1A depicts the changes in the fermentation medium before and after the degradation of unpretreated straw by the compound bacteria, i.e., the straw was significantly degraded by the compound bacteria. It was found that many yellow affinity substances (YAS) were produced in the serum flask when the strain used microcrystalline cellulose as the substrate. These substances are considered to be carotenoids, which can promote the degradation of microcrystalline cellulose [36,37]. In this study, two strains were preliminarily named FC721 and FC811 after the purification of the compound bacteria. YAS was used to characterize the degradation of crystalline fiber, and the more the plus sign, the more obvious the degradation. The results showed that the FC811 had a good effect on cellulose crystal fiber degradation (Table 2). Transparent hydrolysis circles were formed on the microcrystalline cellulose rolling tube medium. After a period of time of culture in a constant temperature water bath shaker at 60 °C, the hydrolysis circles became significantly larger. Meanwhile, the yellow colonies were observed in the center of the hydrolysis circle, which was non-transparent with a smooth surface and a diameter of about 0.5–2 mm (Figure 1B). Therefore, this bacterium was selected for subsequent research. FC811 strain showed purple color after gram staining, confirming it to be a gram-positive bacterium (Figure 1C). The scanning electron microscopy results showed that the bacterium was rod-shaped, sporous, and flagellated, capable of movement and single growth (Figure 1D).
3.2. Physiological and Biochemical Characteristics and Molecular Biological Identification of FC811
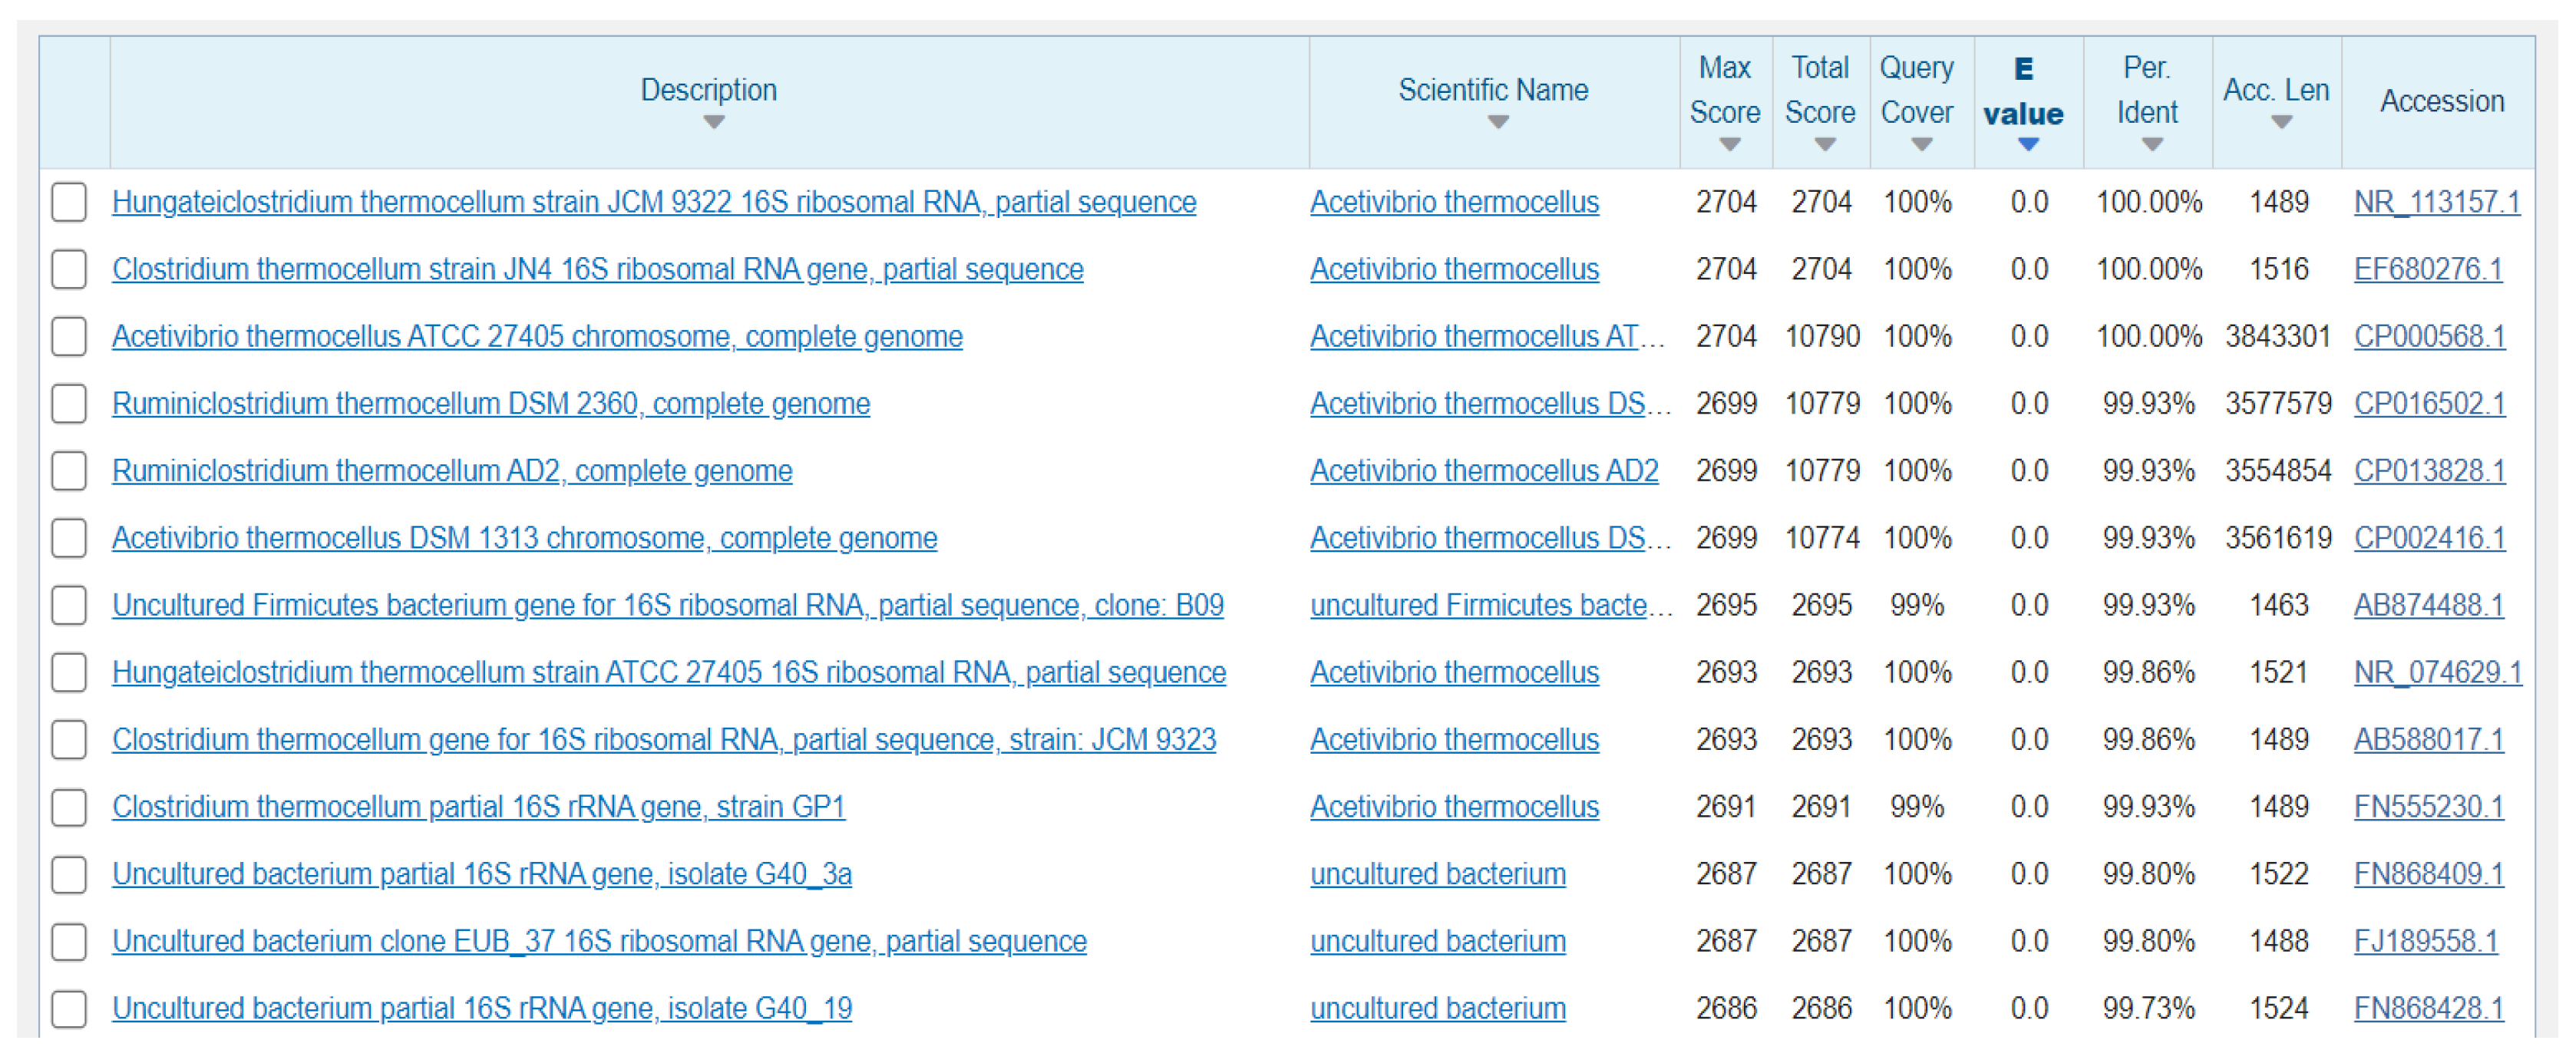
The decomposition ability of the nutrient matrix is different due to the different enzyme systems of various bacteria. The metabolic effect of bacteria, metabolites, and metabolic types on various substrates was detected by the biochemical experiment method. The physiological and biochemical characteristics of the FC811 strain are summarized in Table 3. The results indicate that the FC811 strain could use glucose, microcrystalline cellulose, cellulose-disaccharide, mannose, mannitol, fructose, and filter paper but could not ferment xylose, pentose, or starch. PCR amplification products of the anaerobic FC811 strain are depicted in Figure 1E. The sequencing verification results showed that the PCR amplification band size of the FC811 strain was about 1.5 kb, and the length of the 16S rDNA sequence of the FC811 strain was 1464 bp. The gene was sequenced by the similarity retrieval analysis using the GenBank database. The sequence with higher homology of the FC811 strain 16S rDNA was obtained, as shown in Figure 2. The phylogeny of the FC811 strain and the obtained highly homologous sequence were constructed using MEGA7 software (Version 7.0.14, Sudhir Kumar, Koichiro Tamura, and Masatoshi Nei, Philadelphia, PE, USA) (Figure 3). The similarity between FC811 strain and Clostridium thermocellum strain JN4 was 100%. The morphological observation, physiological, and biochemical analysis results confirmed FC811 to be Clostridium thermocellum, which was named Clostridium thermocellum FC811.
3.3. Factors Influencing Cellulose Saccharification Effect of FC811 Strain
Microorganisms are tiny single-cell organisms that are in direct contact with the external environment; thus, the physiological activities of microbial populations are closely related to the changes in the environmental factors, such as temperature, pH, and nutrients. The data of soluble sugar accumulation are obtained through a wet test.
3.3.1. Effect of Temperature on the Growth of FC811 Strain and Saccharification Effect of Microcrystalline Cellulose
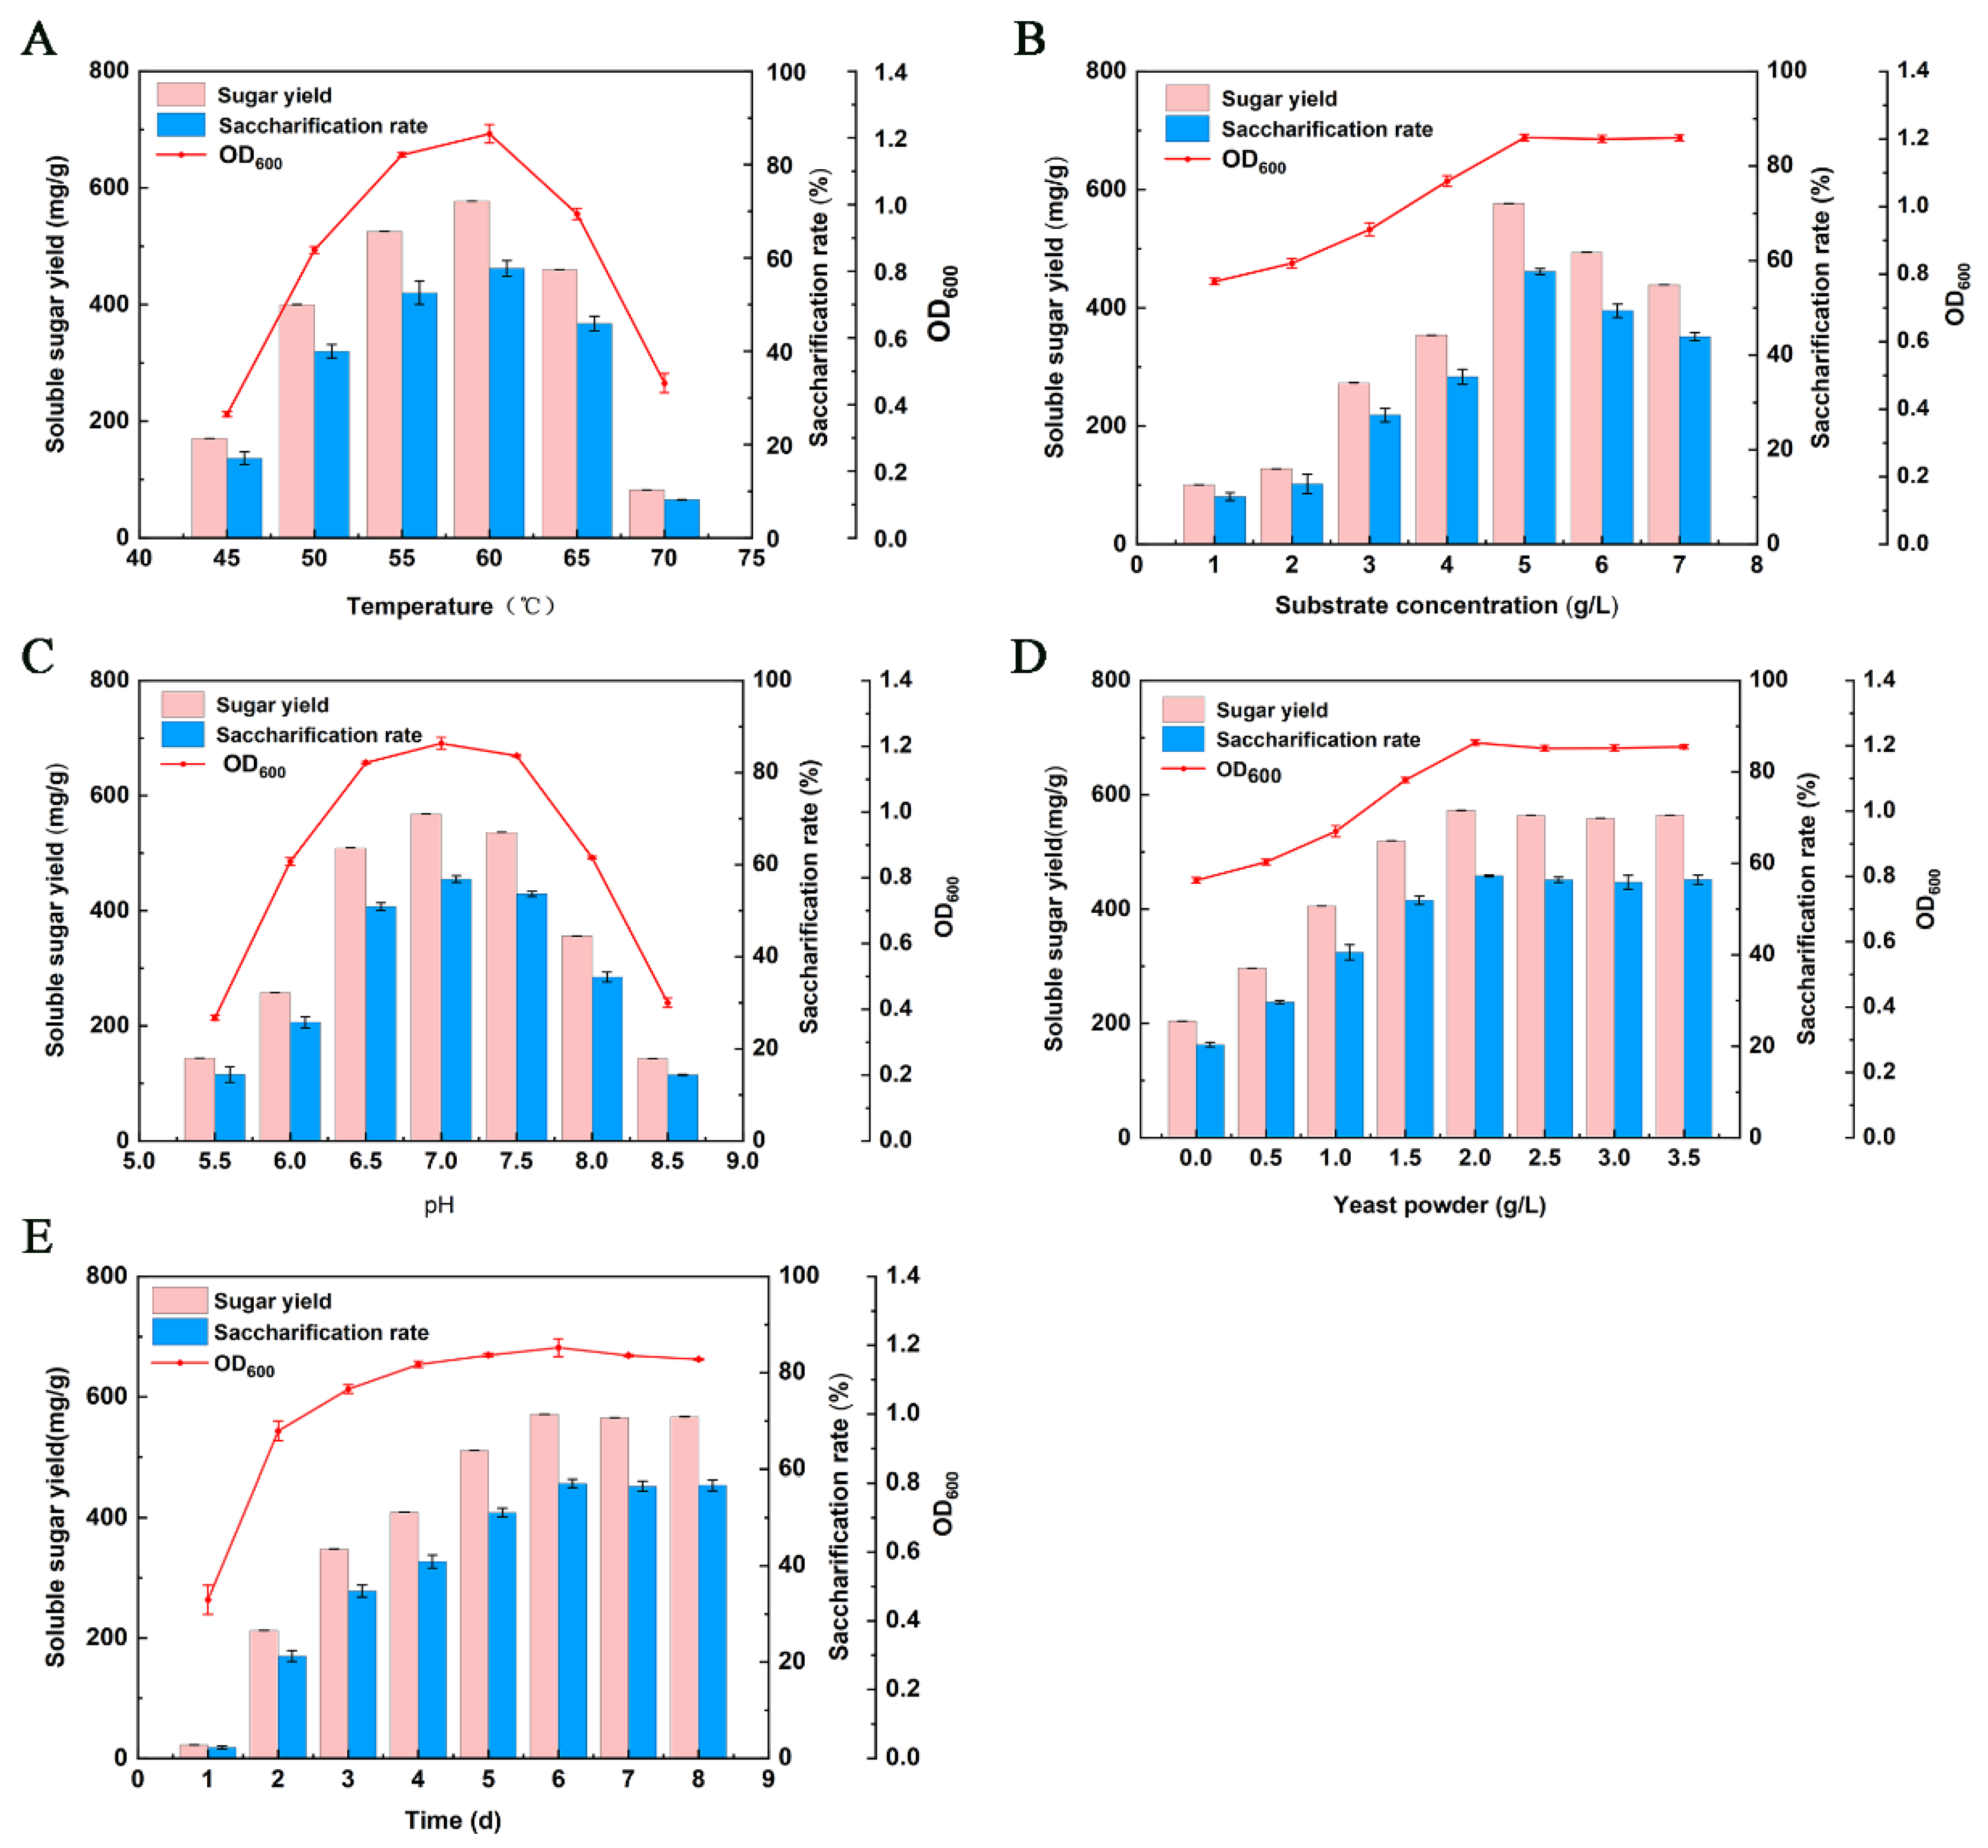
Temperature is one of the essential factors affecting the growth and reproduction of microorganisms. In a certain range, the physiological and biochemical reactions of the strain increase with the increase of temperature, but if the temperature continuously increases and reaches a certain extent, the metabolic capacity of the strain decreases sharply, leading to cell death. As depicted in Figure 4A, the biomass of the FC811 strain, the soluble sugar accumulation, and the saccharification rate increased with the increase of temperature from 45 to 60 °C. When the temperature was 60 °C, the soluble sugar accumulation of the FC811 strain reached the maximum, which was 577.20 mg/g microcrystalline cellulose and the saccharification rate was 57.72%. However, the soluble sugar accumulation began to decrease with the increase in temperature. When the temperature was increased to 70 °C, the soluble sugar yield was 81.87 mg/g of microcrystalline cellulose, and the saccharification rate was less than 10%. Compared with 60 °C, the biomass of the strain was also significantly reduced, indicating that the FC811 strain grew slowly or stopped growing when the temperature was 70 °C. The results suggested that the FC811 strain had the highest saccharification efficiency on microcrystalline cellulose under the survival environment of 60 °C. Therefore, 60 °C was the optimum temperature for the growth and saccharification of the FC811 strain.
3.3.2. Effect of Initial pH on the Growth of FC811 Strain and Saccharification Effect of Microcrystalline Cellulose
Too high or too low pH will affect the metabolic ability of microorganisms, leading to survival difficulty. Different microorganisms have different requirements for pH [38]. As depicted in Figure 4B, the FC811 strain was in the initial pH range of 5.5–7.0. With the increase in pH, the saccharification effect of FC811 strain on microcrystalline cellulose and its biomass increased. When the pH was 7.0, the soluble sugar accumulation of the FC811 strain reached the maximum, which was 568.13 mg/g of microcrystalline cellulose, and the saccharification rate was 56.81%. When pH exceeded 8.0, the biomass of the FC811 strain, the soluble sugar accumulation, and saccharification rate decreased significantly (Figure 4). When the pH increased to 9.0, the FC811 strain could not grow, and almost no soluble sugar could be detected in the anaerobic flask. It might be that too high pH inhibited the activity of the strain and prevented the strain from metabolizing, making the strain unable to grow or saccharify microcrystalline cellulose. The results showed that the biomass of the FC811 strain, the soluble sugar accumulation, and the saccharification rate reached a peak when pH was 7.0. Therefore, the initial pH of 7.0 was the optimal initial pH for the growth of the FC811 strain and saccharification of microcrystalline cellulose.
3.3.3. Effect of Substrate Concentration on the Growth of FC811 Strain and Saccharification Effect of Microcrystalline Cellulose
According to the Michaelis–Menten equation, the substrate concentration has no effect on enzyme activities of metabolic capacity (FC811 strain in this study); rather, it only affects the enzymatic reaction rate [39]. With the increase of substrate concentration, the enzymatic reaction rate gradually increases. After reaching a certain value, it does not increase with increasing concentration. As depicted in Figure 4C, when the initial concentration of microcrystalline cellulose was 5 g/L, the biomass of the FC811 strain was 1.204 (OD600nm), and the accumulation of soluble sugar reached the maximum, which was 576.67 mg/g microcrystalline cellulose, and the saccharification rate was 57.67%. When the initial concentration of microcrystalline cellulose was in the range of 1–5 g/L, the saccharification rate and the biomass of the FC811 strain increased with the increase of microcrystalline cellulose concentration. When the concentration of microcrystalline cellulose was continuously increased, it was found that the accumulation of soluble sugar increased a little, and the saccharification rate gradually decreased. This might be because cellulase could not fully interact with the substrate, affecting the saccharification effect. Therefore, 5 g/L microcrystalline cellulose concentration was selected as the optimal concentration.
3.3.4. Effect of Yeast Powder Content on the Growth of FC811 Strain and Saccharification Effect of Microcrystalline Cellulose
The concentration of yeast powder, one of the nutrients of strains, will directly nourish the biomass accumulation and reproduction capacity of strains [40]. As depicted in Figure 4D, when the yeast powder concentration was in the range of 0–2 g/L, the biomass of the FC811 strain, the soluble sugar accumulation, and saccharification rate increased with the increase of yeast powder concentration. When the yeast powder concentration was 2.0 g/L, the biomass of the strain was 1.209, the soluble sugar accumulation was 572.6 mg/g, and the saccharification rate was 57.26%. When the yeast powder concentration was more than 2.0 g/L, the biomass of the FC811 strain and soluble sugar accumulation changed a little. Therefore, considering the economic benefits, the yeast powder concentration of 2.0 g/L was selected as the optimal concentration for the experiment.
3.3.5. Effect of Culture Time on the Growth of FC811 Strain and Saccharification Effect of Microcrystalline Cellulose
The growth rate of different strains is different, and the biomass in the reactor is not enough if the time is too short. If the time is too long, the strains will age and even show apoptosis. As depicted in Figure 4E, when the culture time was 1 d, the biomass of FC811 strain, soluble sugar accumulation, and saccharification rates were all low. When the culture time was 2 d, the FC811 strain grew rapidly, its biomass was 0.951, and the soluble sugar accumulation was 212.6 mg/g. After 3–8 d of culture, the FC811 strain grew slowly, but the soluble sugar accumulation and saccharification rate reached the maximum value on 6 d, which were 570.93 mg/g and 57.09%, respectively. Therefore, 6 d was the optimal culture time for the growth and saccharification of the FC811 strain.
3.3.6. Optimization of the Growth of FC811 Strain and Saccharification Effect of Microcrystalline Cellulose
In this study, temperature (A), pH (B), culture time (C), substrate concentration (D), and yeast powder concentration (E) were used as independent variables, and soluble sugar yield was used as the response value. In terms of single factor experiment results, it was determined that 55 < A < 65, 6.5 < B < 7.5, 5 < C < 7, 4 < D < 6, and 1.5 < E <2.5. The optimal saccharification condition of the strain and the effect of two factors’ interaction on the soluble sugar yield were determined using the Minitab software (Version17.1.0, Minitab Inc., Philadelphia, PE, USA). Table 4 and Table 5 summarize the design and response surface CCD experimental results for microcrystal cellulose saccharifying strain Clostridium thermocellum FC811.
After the strain Clostridium thermocellum FC811 was inoculated in the anaerobic fermentation medium, the soluble sugar accumulation in the solution ranged from 1.101–2.950 g/L, indicating that the five factors had a significant impact on soluble sugar yield. The soluble sugar yield measured in the experiment was consistent with the predicted result of the model, implying that the regression equation had high accuracy.
Minitab17.0 software was used for statistical analysis of the experimental data, and the results are summarized in Table 5. The coefficient of determination (R2) and adjusted coefficient (Adj. R2) of the experimental model were 99.85% and 99.75%, respectively. The p value of the response surface regression model was less than 0.0001, indicating that the regression model had a high fitting degree and could be used to predict the response value.
The fitting regression optimization equation of Clostridium thermocellum FC811 strain with soluble sugar yield as the response value was obtained as follows:
where Y denotes the accumulation of soluble sugar; A, B, C, D, and E denote temperature, pH, culture time, substrate concentration, and yeast powder concentration, respectively.
Y = − 55.40 + 0.897A + 2.733B − 0.015C + 7.208D + 2.342E − 0.007339A2 − 0.2316B2 − 0.0555C2 − 0.6480D2 − 0.744E2 + 0.00459AB + 0.00166AC − 0.01299AD − 0.00224AE + 0.0497BC − 0.0026BD + 0.0104BE +
0.04916CD + 0.0106CE + 0.1531DE
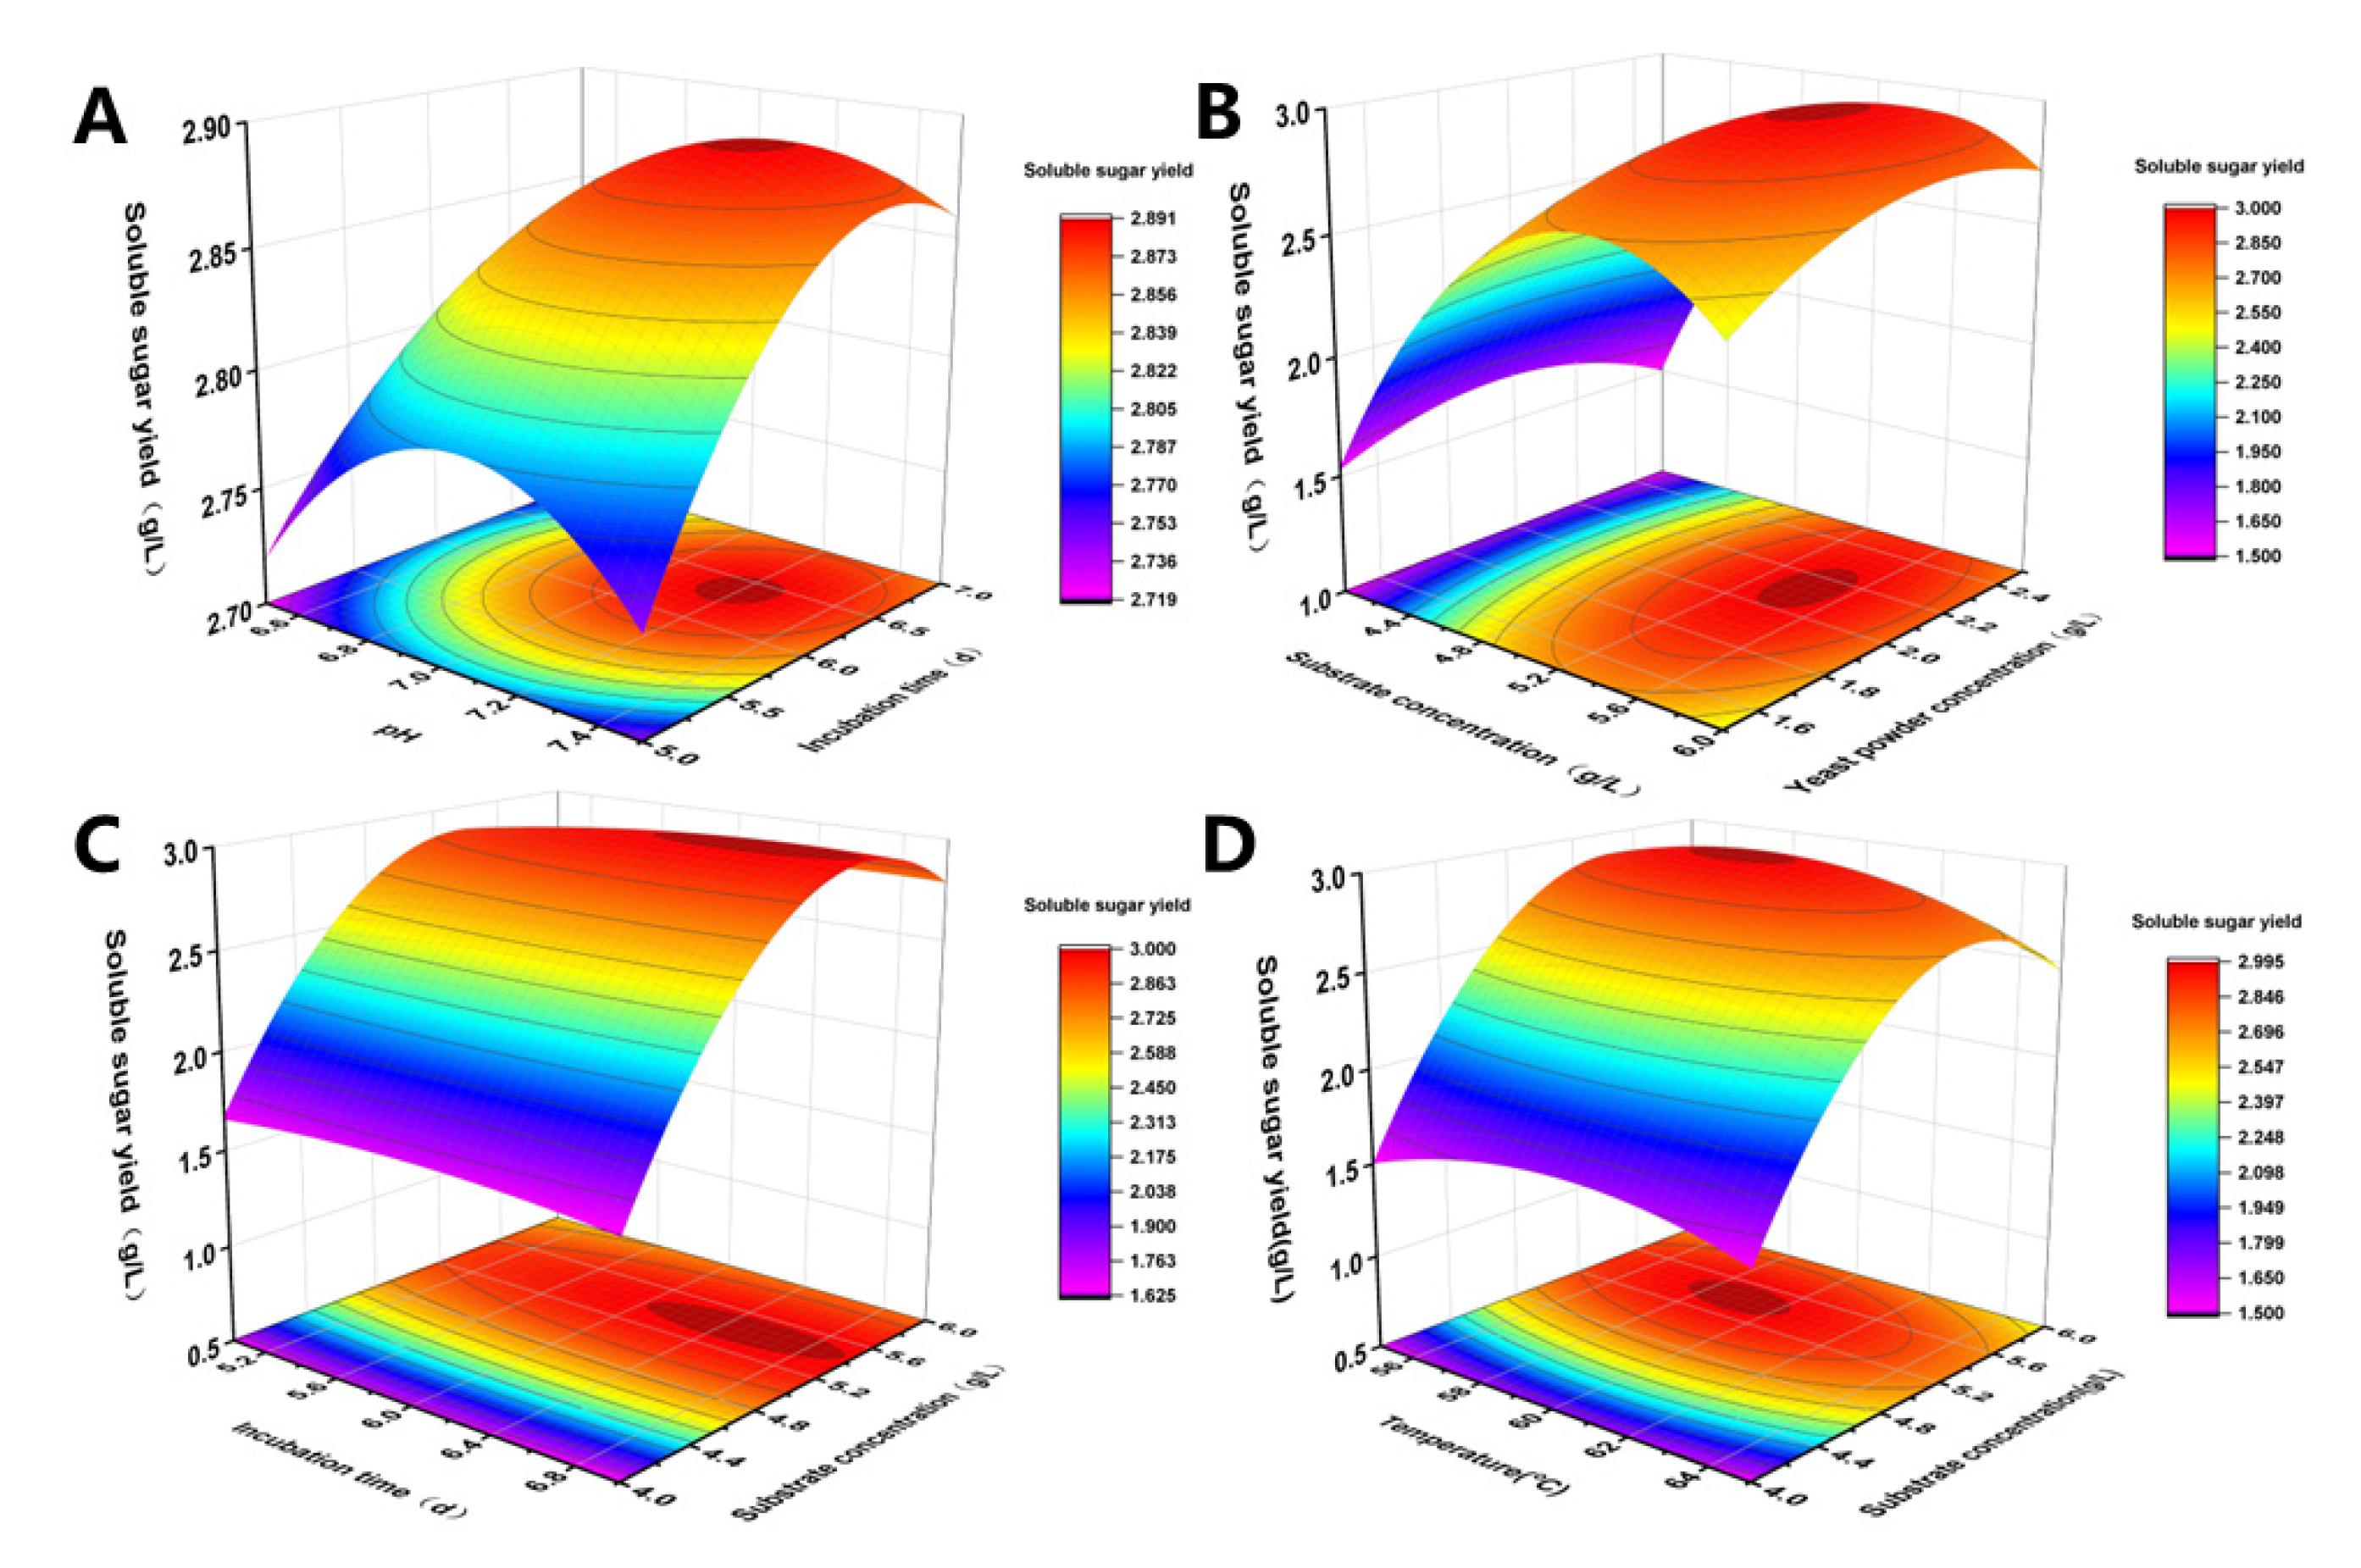
As summarized in Table 5, the interactions between temperature and substrate concentration, pH and culture time, culture time and substrate concentration, and substrate concentration and yeast powder concentration were extremely significant (p < 0.0001).
Combined with the above results, the response curve of the two factors were extremely, significantly affecting the soluble sugar yield of microcrystalline cellulose saccharified by Clostridium thermocellum FC811 strain that was plotted (Figure 5). Based on the regression model equation analysis, the optimal saccharification conditions for Clostridium thermocellum FC811 were set as follows: temperature of 58.94 °C, pH of 7.21, culture time of 6.60 d, substrate concentration of 5.01 g/L, yeast powder concentration of 2.15 g/L, and soluble sugar yield of 3.03 g/L. Further experiments were carried out to verify the accuracy of the model prediction. The anaerobic culture results showed that the soluble sugar yield was 3.11 g/L under the optimal saccharification conditions, which was consistent with the predicted value of the model.
In this study, two cellulose saccharification strains were isolated from rotten bark. The FC811 strain was identified as Clostridium thermocellum, a Gram-positive strain named Clostridium thermocellum FC811 with the strongest cellulose saccharification effect. It also showed a strong utilization capacity of glucose, microcrystalline cellulose, cellobiose, mannose, mannitol, and filter paper. The key factors affecting FC811 for fiber saccharification, such as fructose as temperature, initial pH, substrate concentration, yeast powder content, and culture time, were verified through the single factor experiment. The optimization results were obtained through response surface analysis: temperature of 58.94 °C, pH of 7.21, culture time of 6.60 d, substrate concentration of 5.01 g/L, and yeast powder concentration of 2.15 g/L. The soluble sugar accumulation and saccharification rates were 622 mg/g and 62.2%, respectively.
4. Conclusions
Due to the depletion of global energy reserves and continuous environmental pollution by straws, hydrogen production by anaerobic fermentation of corn straw has significant development potential. In this study, the compound bacteria screened from rotten wood were inoculated in the straw medium. The sugar production characteristics were determined from two perspectives of nutrient factors and ecological factors. It was proved that the optimal conditions for sugar production of FC811 strain were a temperature of 58.9 °C, pH of 7.21, culture time of 6.60 d, substrate concentration of 5.01 g/L, and yeast powder concentration of 2.15 g/L. The yield of soluble sugar was 3.11 g/L, and the conversion rate of reducing sugar was 62.2%, which is much higher than the previous [41]. The present study results will provide a theoretical basis for subsequent synchronous fermentation of sugar and hydrogen production.
Author Contributions
C.X.: Conceptualization—experimental design, Formal analysis, Sample collection, Methodology, Supervision, Validation, Writing—original draft, review & editing. M.D.: Methodology, Writing—original draft, review & editing. C.C.: Writing—original draft, review & editing. P.Z.: Investigation-sample collection & extraction. S.Y.: Methodology, Supervision, Validation, Formal analysis, Investigation, Writing-review & editing, Funding acquisition. J.D.: Conceptualization, Funding acquisition. N.R.: Conceptualization—experimental design. All authors have read and agreed to the published version of the manuscript.
Funding
The authors gratefully acknowledge the National Natural Science Foundation of China (Grant No. 52170131), the National Engineering Research Center for Bioenergy (Harbin Institute of Technology, Grant No. 2021A001), and the Open Project of State Key Laboratory of Urban Water Resource and Environment (Harbin Institute of Technology) (Grant No. 2021TS03). We gratefully acknowledge the support of Heilongjiang Province Touyan Team.
Data Availability Statement
The bacterial 16S rRNA raw read sequence datasets were deposited in NMDC https://nmdc.cn/resource/genomics/sequence/detail/NMDCN00011G7 accessed on 8 July 2022.
Acknowledgments
The authors gratefully acknowledge the National Natural Science Foundation of China (Grant No. 52170131), the National Engineering Research Center for Bioenergy (Harbin Institute of Technology, Grant No. 2021A001), and the Open Project of State Key Laboratory of Urban Water Resource and Environment (Harbin Institute of Technology) (Grant No. 2021TS03). We gratefully acknowledge the support of Heilongjiang Province Touyan Team.
Conflicts of Interest
The authors declare no conflict of interest.
References
- Rabaal, M.; Ferreira, A.F.; Silva, C.A.M.; Costa, M. Biorefineries Targeting Energy, High Value Products and Waste Valorisation Lecture Notes in Energy; Springer: Berlin/Heidelberg, Germany, 2017; Volume 57. [Google Scholar]
- Zhao, Z.-T.; Cheng, H.-M.; Wang, S.; Liu, H.-Y.; Song, Z.-M.; Zhou, J.-H.; Pang, J.-W.; Bai, S.-W.; Yang, S.-S.; Ding, J.; et al. SCC-UEFAS, an urban-ecological-feature based assessment system for sponge city construction. Environ. Sci. Ecotechnol. 2022, 12, 100188. [Google Scholar] [CrossRef]
- Zhao, S.-Y.; Chen, C.-X.; Ding, J.; Yang, S.-S.; Zang, S.Y.-N.; Qin, X.-D.; Gao, X.-L.; Song, Z.; Ren, N.-Q. Fabrication of AQ2S/GR composite photosensitizer for the simulated solar light-driven degradation of sulfapyridine. Environ. Sci. Ecotechnol. 2021, 8, 100111. [Google Scholar] [CrossRef]
- Xu, Y.H.; Li, M.F. Hydrothermal liquefaction of lignocellulose for value-added products: Mechanism, parameter and production application. Bioresour. Technol. 2021, 342, 126035. [Google Scholar] [CrossRef] [PubMed]
- Mood, S.H.; Golfeshan, A.H.; Tabatabaei, M.; Jouzani, G.S.; Najafi, G.H.; Gholami, M.; Renewable, M.A.J.; Reviews, S.E. Lignocellulosic biomass to bioethanol, a comprehensive review with a focus on pretreatment. Renew. Sustain. Energy Rev. 2013, 27, 77–93. [Google Scholar] [CrossRef]
- Liu, Y.J.; Li, B.; Feng, Y.; Cui, Q.J.B.A. Consolidated bio-saccharification: Leading lignocellulose bioconversion into the real world. Biotechnol. Adv. 2020, 40, 107535. [Google Scholar] [CrossRef]
- Yang, S.S.; Ding, M.Q.; Ren, X.R.; Zhang, Z.R.; Li, M.X.; Zhang, L.L.; Pang, J.W.; Chen, C.X.; Zhao, L.; Xing, D.F.; et al. Impacts of physical-chemical property of polyethylene on depolymerization and biodegradation in yellow and dark mealworms with high purity microplastics. Sci. Total Environ. 2022, 828, 154458. [Google Scholar] [CrossRef]
- Yang, S.S.; Ding, M.Q.; Zhang, Z.R.; Ding, J.; Bai, S.W.; Cao, G.L.; Zhao, L.; Pang, J.W.; Xing, D.F.; Ren, N.Q.; et al. Confirmation of biodegradation of low-density polyethylene in dark-versus yellow-mealworms (larvae of Tenebrio obscurus versus Tenebrio molitor) via. gut microbe-independent depolymerization. Sci. Total Environ. 2021, 789, 147915. [Google Scholar] [CrossRef]
- Srivastava, N.; Srivastav, M.; Malhotra, B.D.; Gupta, V.K.; Ramteke, P.W.; Silva, R.N.; Shukla, P.; Dubey, K.K.; Mishra, P.K. Nanoengineered cellulosic biohydrogen production via dark fermentation: A novel approach. J. Biotechnol. Adv. 2019, 37, 107384. [Google Scholar] [CrossRef]
- Xsa, B.; Rs, A.J.C.P. Recent advances in lignocellulose prior-fractionation for biomaterials, biochemicals, and bioenergy. Carbohydr. Polym. 2021, 261, 117884. [Google Scholar]
- Mailaram, S.; Maity, S.K. Dual liquid–liquid extraction versus distillation for the production of bio-butanol from corn, sugarcane, and lignocellulose biomass: A techno-economic analysis using pinch technology. Fuel 2022, 312, 122932. [Google Scholar] [CrossRef]
- Silva, C.; Schirmer, M.A.; Maeda, R.N.; Barcelos, C.A.; Pereira, N., Jr. Potential of giant reed (Arundo donax L.) for second generation ethanol production. Electron. J. Biotechnol. 2014, 18, 10–15. [Google Scholar] [CrossRef] [Green Version]
- Adegboye, M.F.; Ojuederie, O.B.; Talia, P.M.; Babalola, O.O.J.B.f.B. Bioprospecting of microbial strains for biofuel production: Metabolic engineering, applications, and challenges. Biotechnol. Biofuels 2021, 14, 5. [Google Scholar] [CrossRef] [PubMed]
- Ying, L.; Peng, L.; Huang, J.; Ran, Z.; Zhen, H.; Feng, S.; Wang, Y.; Wang, L.; Tao, X.; Peng, L.J.G.C. Mild chemical pretreatments are sufficient for bioethanol production in transgenic rice straws overproducing glucosidase. Green Chem. 2018, 20, 2047–2056. [Google Scholar]
- Zhou, Z.; Liu, D.; Zhao, X.J.R.; Reviews, S.E. Conversion of lignocellulose to biofuels and chemicals via sugar platform: An updated review on chemistry and mechanisms of acid hydrolysis of lignocellulose. Renew. Sustain. Energy Rev. 2021, 146, 111169. [Google Scholar] [CrossRef]
- Haldar, D.; Purkait, M.K. A review on the environment-friendly emerging techniques for pretreatment of lignocellulosic biomass: Mechanistic insight and advancements-ScienceDirect. Chemosphere 2020, 264, 128523. [Google Scholar] [CrossRef]
- Rs, A.; Rapc, B.; Hp, B.; Pls, B.; Tcl, A.; Whccde, F.; Yang, T.G.J.B.T. Recent advances in the pretreatment of microalgal and lignocellulosic biomass: A comprehensive review-ScienceDirect. Bioresour. Technol. 2020, 298, 122467. [Google Scholar]
- Kumar, B.; Bhardwaj, N.; Agrawal, K.; Chaturvedi, V.; Verma, P.J.F.P.T. Current perspective on pretreatment technologies using lignocellulosic biomass: An emerging biorefinery concept. Fuel Processing Technol. 2020, 199, 106244. [Google Scholar] [CrossRef]
- Daehwan, K.J.M. Physico-Chemical Conversion of Lignocellulose: Inhibitor Effects and Detoxification Strategies: A Mini Review. Molecules 2018, 23, 309. [Google Scholar]
- Qing, Q.; Huang, M.; He, Y.; Wang, L.; Zhang, Y.J.A.B.; Biotechnology. Dilute Oxalic Acid Pretreatment for High Total Sugar Recovery in Pretreatment and Subsequent Enzymatic Hydrolysis. Appl. Biochem. Biotechnol. 2015, 177, 1493–1507. [Google Scholar] [CrossRef]
- Wen, B.; Yuan, X.; Li, Q.X.; Liu, J.; Ren, J.; Wang, X.; Cui, Z.J.B.T. Comparison and evaluation of concurrent saccharification and anaerobic digestion of Napier grass after pretreatment by three microbial consortia. Bioresour. Technol. 2015, 175, 102–111. [Google Scholar] [CrossRef]
- Sindhu, R.; Binod, P.; Pandey, A. Biological pretreatment of lignocellulosic biomass—An overview. Bioresour. Technol. 2016, 199, 76–82. [Google Scholar] [CrossRef] [PubMed]
- Baramee, S.; Siriatcharanon, A.K.; Ketbot, P.; Teeravivattanakit, T.; Waeonukul, R.; Pason, P.; Tachaapaikoon, C.; Ratanakhanokchai, K.; Phitsuwan, P. Biological pretreatment of rice straw with cellulase-free xylanolytic enzyme-producing Bacillus firmus K-1: Structural modification and biomass digestibility. Renew. Energy 2020, 160, 555–563. [Google Scholar] [CrossRef]
- Hou, R.; Hu, J.; Wang, Y.; Wei, H.; Gao, M.T. Bioengineering. Simultaneous production of cellulase and ferulic acid esterase by Penicillium decumbens with rice straw as the sole carbon source. J. Biosci. Bioeng. 2020, 129, 276–283. [Google Scholar] [CrossRef] [PubMed]
- Szentner, K.; Waśkiewicz, A.; Kaźmierczak, S.; Wojciechowicz, T.; Goliński, P.; Lewandowska, E.; Wasielewski, O. Enzymatic hydrolysis of cellulose using extracts from insects. Carbohydr. Res. 2019, 485, 107811. [Google Scholar] [CrossRef] [PubMed]
- Verma, V.; Singhal, G.; Joshi, S.; Choudhary, M.; Srivastava, N. Plant Extracts as Enzymes; Academic Press: Cambridge, MA, USA, 2022; pp. 209–223. [Google Scholar]
- Ellil, S.; Fonseca, L.; Uchima, C.; Cota, J.; Goldman, G.H.; Saloheimo, M.; Sacon, V.; Siika-Aho, M. Development of a low-cost cellulase production process using Trichoderma reesei for Brazilian biorefineries. Biotechnol. Biofuels 2017, 10, 30. [Google Scholar] [CrossRef] [Green Version]
- Liu, G.; Zhang, J.; Bao, J.J.B.; Engineering, B. Cost evaluation of cellulase enzyme for industrial-scale cellulosic ethanol production based on rigorous Aspen Plus modeling. Bioprocess Biosyst. Eng. 2016, 39, 133–140. [Google Scholar] [CrossRef]
- Sheng, T.; Zhao, L.; Gao, L.F.; Liu, W.Z.; Cui, M.H.; Guo, Z.C.; Ma, X.D.; Ho, S.H.; Wang, A.J. Lignocellulosic saccharification by a newly isolated bacterium, Ruminiclostridium thermocellum M3 and cellular cellulase activities for high ratio of glucose to cellobiose. Biotechnol. Biofuels 2016, 9, 172. [Google Scholar] [CrossRef] [Green Version]
- Sun, L.; KSiddique, M.; Wang, L.; Li, S. Mixing characteristics of a bubble mixing microfluidic chip for genomic DNA extraction based on magnetophoresis: CFD simulation and experiment. Electrophoresis. 2021.42, 2365–2374. [CrossRef]
- Basic Local Alignment Search Tool. Available online: https://blast.ncbi.nlm.nih.gov/Blast.cgi (accessed on 1 November 2020).
- National Library of Medicine. Available online: www.ncbi.nlm.nih.gov. (accessed on 1 November 2020).
- Messaoudi, O.; Bendahou, M.; Benamar, I.; Abdelwouhid, D.E. Identification and preliminary characterization of non-polyene antibiotics secreted by new strain of actinomycete isolated from sebkha of Kenadsa, Algeria. Asian Pac. J. Trop. Biomed. 2015, 5, 438–445. [Google Scholar] [CrossRef] [Green Version]
- Hanson, R.S. Manual of methods for general bacteriology. J. Clin. Pathol. 1981, 34, 1069. [Google Scholar]
- Madani, S.; Gheshlaghi, R.; Mahdavi, M.A.; Sobhani, M.; Elkamel, A.J.F. Optimization of the performance of a double-chamber microbial fuel cell through factorial design of experiments and response surface methodology. Fuel 2015, 150, 434–440. [Google Scholar] [CrossRef]
- Popova, L.I.; Bahl, H.; Egorova, M.A.; Leont′Eva, M.R.; Netrusov, A.I.; Tsavkelova, E.A.J.M. Isolation of Cellulose-Degrading Thermoanaerobacterium Strains from Thermophilic Methanogenic Microbial Communities. Microbiology 2021, 90, 158–165. [Google Scholar] [CrossRef]
- Lv, W.; Yu, Z. Isolation and characterization of two thermophilic cellulolytic strains of Clostridium thermocellum from a compost sample. J. Appl. Microbiol. 2013, 114, 1001–1007. [Google Scholar] [CrossRef] [PubMed]
- Erkmen, O. Osmotic pressure and pH effects on microorganisms. Math. Biosci. 2021, 315, 108220. [Google Scholar]
- Patsatzis, D.G.; Goussis, D.A. A new Michaelis-Menten equation valid everywhere multi-scale dynamics prevails. Math. Biosci. 2019, 315, 108220. [Google Scholar] [CrossRef]
- Jones, A.M.; Ingledew, W.M. Fuel alcohol production: Appraisal of nitrogenous yeast foods for very high gravity wheat mash fermentation. Process Biochem. 1994, 29, 483–488. [Google Scholar] [CrossRef]
- Sheng, T.; Zhao, L.; Liu, W.Z.; Gaob, L.F.; Wang, A.J. Fenton pre-treatment of rice straw with citric acid as an iron chelate reagent for enhancing saccharification. Rsc. Adv. 2017, 7, 32076–32086. [Google Scholar] [CrossRef] [Green Version]
Figure 1.
High-efficiency cellulose degrading sugar-producing strain: (A). Changes in straw fermentation medium before and after degradation (CK: straw fermentation medium without compound bacteria, Strains: straw fermentation medium with compound bacteria); (B). Hydrolysis circles formed in microcrystalline cellulose rolling tube of FC811; (C). Morphology of gram-stained cells of XF811; (D). SEM image of FC811; (E). Electrophoresis of PCR products of FC811 strain.

Figure 2.
16SrDNA sequence source and database registration number.

Figure 3.
Phylogenetic tree of cellulose saccharifying bacterium FC811.

Figure 4.
Sugar production effect of saccharifying strains under different culture conditions: (A). Effect of tmperature; (B). Effect of substrate concentration; (C). Effect of pH; (D). Effect of yeast powder; (E). Effect of time.
Figure 4.
Sugar production effect of saccharifying strains under different culture conditions: (A). Effect of tmperature; (B). Effect of substrate concentration; (C). Effect of pH; (D). Effect of yeast powder; (E). Effect of time.

Figure 5.
Surface results of effects on sugar production yield under different culture conditions: (A). Effect of pH and incubation time; (B). Effect of substrate concentration and yeast powder concentration; (C). Effect of incubation time and substrate concentration; (D). Effect of temperature and substrate concentration.


Table 1.
Five factors and level design.
| Factor | Name | Unit | Low Level (−1) | Medium Level (0) | High Level (1) |
|---|---|---|---|---|---|
| A | Temperature | °C | 55 | 60 | 65 |
| B | pH | 6.5 | 7 | 7.5 | |
| C | Culture time | d | 5 | 6 | 7 |
| D | Substrate concentration | g/L | 4 | 5 | 6 |
| E | Yeast powder concentration | g/L | 1.5 | 2 | 1.5 |
Table 2.
Degradation of crystalline cellulose and yield of reducing sugar.
| Strain | YAS | Yield of Reducing Sugar (mg/L) |
|---|---|---|
| FC721 | + | 230.6 |
| FC811 | +++ | 2764 |
Note: “+” indicates the degradation of crystalline fiber, and the more the plus sign, the more obvious the degradation.
Table 3.
Physiological and biochemical characteristics of FC811 strain.
| Characteristics | Results | Characteristics | Results |
|---|---|---|---|
| Glucose | + | Mannose | + |
| Microcrystalline cellulose | + | Mannitol | + |
| Cellobiose | + | Filter paper | + |
| Fructose | + | Sucrose | + |
| Lactose | − | Maltose | + |
| Xylose | − | Starch | − |
| Xylan | + | Anaerobic growth | + |
| Growth at 60 °C | + | Gelatin experiment | + |
| Fluorescent pigment | − | CMC-Na | + |
| Nitrate reduction experiment | − | Citrate | − |
Note: “+” indicates that it can be used; “−” indicates that it cannot be used.
Table 4.
Response surface CCD experiment design of Clostridium thermocellum FC811 strain.
| Number | Temperature (°C) | pH | Culture Time (d) | Substrate Concentration (g/L) | Yeast Powder Concentration (g/L) | Soluble Sugar Yield (g/L) | |
|---|---|---|---|---|---|---|---|
| Actual Value | Predicted Value | ||||||
| 1 | 60 | 7 | 6 | 5 | 2 | 2.87 | 2.87 |
| 2 | 55 | 7.5 | 5 | 4 | 1.5 | 1.25 | 1.23 |
| 3 | 55 | 6.5 | 5 | 4 | 2.5 | 1.23 | 1.21 |
| 4 | 65 | 6.5 | 7 | 4 | 2.5 | 1.10 | 1.12 |
| 5 | 60 | 7 | 6 | 5 | 2 | 2.83 | 2.87 |
| 6 | 55 | 6.5 | 5 | 6 | 1.5 | 2.18 | 2.18 |
| 7 | 65 | 7.5 | 5 | 6 | 1.5 | 1.97 | 1.95 |
| 8 | 65 | 7.5 | 5 | 4 | 2.5 | 1.20 | 1.23 |
| 9 | 65 | 6.5 | 5 | 6 | 2.5 | 2.14 | 2.17 |
| 10 | 60 | 7 | 6 | 5 | 2 | 2.86 | 2.87 |
| 11 | 65 | 7.5 | 7 | 6 | 2.5 | 2.47 | 2.46 |
| 12 | 65 | 7.5 | 7 | 4 | 1.5 | 1.29 | 1.29 |
| 13 | 55 | 6.5 | 7 | 6 | 2.5 | 2.53 | 2.57 |
| 14 | 65 | 6.5 | 7 | 6 | 1.5 | 2.01 | 2.03 |
| 15 | 55 | 6.5 | 7 | 4 | 1.5 | 1.13 | 1.12 |
| 16 | 55 | 7.5 | 5 | 6 | 2.5 | 2.50 | 2.46 |
| 17 | 55 | 7.5 | 7 | 6 | 1.5 | 2.38 | 2.36 |
| 18 | 60 | 7 | 6 | 5 | 2 | 2.85 | 2.87 |
| 19 | 65 | 6.5 | 5 | 4 | 1.5 | 1.24 | 1.22 |
| 20 | 55 | 7.5 | 7 | 4 | 2.5 | 1.26 | 1.23 |
| 21 | 60 | 7 | 6 | 5 | 2 | 2.82 | 2.84 |
| 22 | 60 | 7.5 | 6 | 5 | 2 | 2.78 | 2.82 |
| 23 | 65 | 7 | 6 | 5 | 2 | 2.60 | 2.60 |
| 24 | 60 | 7 | 6 | 5 | 2 | 2.89 | 2.84 |
| 25 | 60 | 7 | 5 | 5 | 2 | 2.72 | 2.75 |
| 26 | 60 | 7 | 6 | 4 | 2 | 1.63 | 1.66 |
| 27 | 60 | 7 | 6 | 5 | 2 | 2.89 | 2.84 |
| 28 | 60 | 7 | 6 | 5 | 2 | 2.82 | 2.84 |
| 29 | 60 | 7 | 6 | 5 | 1.5 | 2.56 | 2.59 |
| 30 | 60 | 7 | 7 | 5 | 2 | 2.83 | 2.82 |
| 31 | 60 | 6 | 6 | 5 | 2 | 2.54 | 2.54 |
| 32 | 60 | 7 | 6 | 6 | 2 | 2.73 | 2.72 |
| 33 | 55 | 7 | 6 | 5 | 2 | 2.69 | 2.71 |
| 34 | 60 | 7 | 6 | 5 | 2 | 2.91 | 2.84 |
| 35 | 55 | 7.5 | 7 | 4 | 1.5 | 1.24 | 1.26 |
| 36 | 65 | 6.5 | 5 | 6 | 1.5 | 1.94 | 1.95 |
| 37 | 65 | 7.5 | 5 | 4 | 1.5 | 1.32 | 1.30 |
| 38 | 60 | 7 | 6 | 5 | 2 | 2.87 | 2.91 |
| 39 | 55 | 6.5 | 5 | 6 | 2.5 | 2.51 | 2.50 |
| 40 | 60 | 7 | 6 | 5 | 2 | 2.93 | 2.91 |
| 41 | 65 | 7.5 | 7 | 6 | 1.5 | 2.18 | 2.20 |
| 42 | 55 | 6.5 | 7 | 4 | 2.5 | 1.15 | 1.16 |
| 43 | 65 | 7.5 | 7 | 4 | 2.5 | 1.32 | 1.31 |
| 44 | 55 | 7.5 | 5 | 6 | 1.5 | 2.18 | 2.21 |
| 45 | 55 | 6.5 | 5 | 4 | 1.5 | 1.25 | 1.27 |
| 46 | 65 | 6.5 | 7 | 4 | 1.5 | 1.18 | 1.18 |
| 47 | 60 | 7 | 6 | 5 | 2 | 2.95 | 2.91 |
| 48 | 65 | 6.5 | 7 | 6 | 2.5 | 2.38 | 2.35 |
| 49 | 60 | 7 | 6 | 5 | 2 | 2.92 | 2.91 |
| 50 | 55 | 7.5 | 7 | 6 | 2.5 | 2.67 | 2.71 |
| 51 | 65 | 6.5 | 5 | 4 | 2.5 | 1.23 | 1.21 |
| 52 | 65 | 7.5 | 5 | 6 | 2.5 | 2.25 | 2.25 |
| 53 | 55 | 6.5 | 7 | 6 | 1.5 | 2.34 | 2.30 |
| 54 | 55 | 7.5 | 5 | 4 | 2.5 | 1.24 | 1.25 |
Table 5.
Response surface CCD statistics and analysis results.
| Source | Coefficient | Degree of Freedom | Sum of Square | Mean Sum of Square | F Value | p Value |
|---|---|---|---|---|---|---|
| Model | 22 | 24.1737 | 1.09880 | 946.52 | <0.0001 | |
| Linear | 5 | 9.9579 | 1.99158 | 1715.56 | <0.0001 | |
| A | −0.05576 | 1 | 0.1057 | 0.10573 | 91.08 | <0.0001 |
| B | 0.03615 | 1 | 0.0446 | 0.04464 | 38.46 | <0.0001 |
| C | 0.03329 | 1 | 0.0377 | 0.03769 | 32.47 | <0.0001 |
| D | 0.53215 | 1 | 9.6281 | 9.62814 | 8293.74 | <0.0001 |
| E | 0.06614 | 1 | 0.1407 | 0.14071 | 121.21 | <0.0001 |
| Square | 5 | 8.8270 | 1.76540 | 1520.72 | <0.0001 | |
| A2 | −0.1835 | 1 | 0.0815 | 0.08152 | 70.22 | <0.0001 |
| B2 | −0.05790 | 1 | 0.0509 | 0.05093 | 43.87 | <0.0001 |
| C2 | −0.0555 | 1 | 0.0075 | 0.00745 | 6.42 | 0.017 |
| D2 | −0.6480 | 1 | 1.0167 | 1.01668 | 875.78 | <0.0001 |
| E2 | −0.1861 | 1 | 0.0512 | 0.05124 | 44.14 | <0.0001 |
| Interaction of two factors | 10 | 0.4281 | 0.04281 | 36.88 | <0.0001 | |
| AB | 0.01147 | 1 | 0.0042 | 0.00421 | 3.63 | 0.066 |
| AC | 0.00828 | 1 | 0.0022 | 0.00219 | 1.89 | 0.179 |
| AD | −0.06497 | 1 | 0.1351 | 0.13507 | 116.35 | <0.0001 |
| AE | −0.00559 | 1 | 0.0010 | 0.00100 | 0.86 | 0.360 |
| BC | 0.02484 | 1 | 0.0198 | 0.01975 | 17.01 | <0.0001 |
| BD | −0.00128 | 1 | 0.0001 | 0.00005 | 0.05 | 0.833 |
| BE | 0.00259 | 1 | 0.0002 | 0.00022 | 0.19 | 0.670 |
| CD | 0.04916 | 1 | 0.0773 | 0.07732 | 66.61 | <0.0001 |
| CE | 0.00528 | 1 | 0.0009 | 0.00089 | 0.77 | 0.387 |
| DE | 0.07653 | 1 | 0.1874 | 0.18743 | 161.45 | <0.0001 |
| Residual | 31 | 0.0360 | 0.00116 | |||
| Lack of fit | 21 | 0.0242 | 0.00115 | 0.98 | 0.539 | |
| Pure error | 10 | 0.0118 | 0.00118 | |||
| Total | 53 | 24.2097 |
Note: R2 = 0.9985; Adj. R2 = 0.9975; A, B, C, D, and E denote temperature, pH, culture time, substrate concentration, and yeast powder concentration, respectively. p < 0.05 indicates significant, p < 0.0001 indicates extremely significant, and p > 0.05 indicates not significant.
Publisher’s Note: MDPI stays neutral with regard to jurisdictional claims in published maps and institutional affiliations. |
© 2022 by the authors. Licensee MDPI, Basel, Switzerland. This article is an open access article distributed under the terms and conditions of the Creative Commons Attribution (CC BY) license (https://creativecommons.org/licenses/by/4.0/).
Share and Cite
MDPI and ACS Style
Xu, C.; Ding, M.; Cui, C.; Zhao, P.; Yang, S.; Ding, J.; Ren, N. Study on the Sugar-Producing Effect of High-Temperature Anaerobic Straw Biosaccharification Strain. Water 2022, 14, 2186. https://doi.org/10.3390/w14142186
AMA Style
Xu C, Ding M, Cui C, Zhao P, Yang S, Ding J, Ren N. Study on the Sugar-Producing Effect of High-Temperature Anaerobic Straw Biosaccharification Strain. Water. 2022; 14(14):2186. https://doi.org/10.3390/w14142186
Chicago/Turabian StyleXu, Chengjiao, Mengqi Ding, Chenhao Cui, Peichao Zhao, Shanshan Yang, Jie Ding, and Nanqi Ren. 2022. "Study on the Sugar-Producing Effect of High-Temperature Anaerobic Straw Biosaccharification Strain" Water 14, no. 14: 2186. https://doi.org/10.3390/w14142186
Note that from the first issue of 2016, this journal uses article numbers instead of page numbers. See further details here.