
Environmental Drivers and Aquatic Ecosystem Assessment of Periphytic Algae at Inflow Rivers in Six Lakes over the Yangtze River Basin

Yangtze River Basin Ecological Environment Monitoring and Scientific Research Center, Yangtze River Basin Ecological Environment Supervision and Administration Bureau, Ministry of Ecological Environment, Wuhan 430010, China
*
Author to whom correspondence should be addressed.
Water 2022, 14(14), 2184; https://doi.org/10.3390/w14142184
Submission received: 7 June 2022
/
Revised: 23 June 2022
/
Accepted: 3 July 2022
/
Published: 11 July 2022
(This article belongs to the Section Biodiversity and Functionality of Aquatic Ecosystems)
Abstract
:Periphytic algae is frequently utilized as a health indicator for ecosystems. Many research studies have been conducted in China on the periphytic algae community, but none has compared the periphytic algae community structure at inflow rivers among different lakes in the Yangtze river basin. The periphytic algae were investigated at 94 sites in inflow rivers of Dianchi Lake, Danjiangkou Reservoir, Dongtinghu Lake, Poyanghu Lake, Chaohu Lake, and Taihu Lake. Based on microscopic research, eight phyla and 126 genera of periphytic algae were found in the inflow river of six lakes, with Cyanobacteria and Bacillariophyta dominating. The CCA (Canonical Correspondence Analysis) was used to analyze the association between the periphytic algae community and environmental factors in the inflow river of six lakes, and the LefSe (Linear discriminant analysis effect size) analysis was used to find enriched species in the inflow river of six lakes. We discovered that TN (total nitrogen) and TP (total phosphorus) were the driving environment variables at the basin scale based on the combined results of the CCA and the Mantel Test. The TITAN (Threshold Indicator Taxa Analysis) analysis also revealed the indicator species and their TN and TP concentration thresholds. Finally, we assessed the ecosystem health of the inflow river at six lakes; biotic and abiotic indices yielded conflicting results, but utilizing both indices to assess ecosystem health using the Random Forest algorithm will yield objective and comprehensive results.
1. Introduction
Periphytic algae can be found in a wide range of water bodies, from small puddles to enormous rivers. They are a key contribution to aquatic ecosystem primary productivity, as they play an important role in nutrient cycles and energy metabolism via photosynthetic metabolism [1]. Periphytic algae are vulnerable to environmental changes and human activities, such as habitat destruction, eutrophication, and heavy metal contamination. Periphytic algae community composition and relative abundance fluctuate depending on environmental factors [2]. Meanwhile, periphytic algae recover and spread faster than other species after disturbance, making them a helpful indicator of aquatic ecological conditions [3].
With the rapid industrialization and urbanization of human society, hydrodynamic circumstances, water quality, and biotic community have changed dramatically, and ecological environment degradation has worsened, resulting in a diverse structure and distribution of periphytic algal communities [4,5,6]. The relationship between periphytic algae and environmental heterogeneity has been studied extensively. According to functional marker gene research, the community composition of periphytic algae is closely related to nutrient levels [7]. Pollution-tolerant taxa, such as bacillariophytes Navicula, dominated the structure of periphytic algae in Dianchi Lake, and TN, NH4-N+, and TP were significant aquatic environmental factors impacting the community composition of periphytic algae [8]. Seasonal fluctuation had a substantial impact on environmental parameters at the Danjiangkou Reservoir and its related water diversion channel, water temperature and nutrient concentration were the key factors determining the structure of the periphytic algae community [9], and the environmental factors plays an important role in shaping the periphytic algal community assembly in the water diversion channel based on marker gene analysis [10]. Different water levels in Poyang Lake resulted in environmental variety, resulting in varied habitats for periphytic algae [11]. Periphytic algae in Lake Taihu had a distinct community composition, with spatial variation and nutrient concentrations [12].
Many research studies on periphytic algae communities and their relationships with environmental variables have been conducted in a single Chinese lake, but few have been conducted at the basin scale between the inflow river of different lakes. This study focuses on the abundance, community composition and indicator species in the inflow river of six lakes. These six lakes, located in the Yangtze river basin, are Dianchi Lake, Danjiangkou Reservoir, Dongtinghu Lake, Poyanghu Lake, Chaohu Lake and Taihu Lake. The aim was to investigate the relationships between periphytic algae communities and environmental variables, to objectively evaluate the ecosystem health of the six lakes inflow river in the Yangtze river basin. To provide theoretical support and a scientific foundation for the maintenance of water ecological health.
2. Materials and Methods
2.1. Study Area
This study was conducted in the inflow rivers of six Yangtze River basin lakes (Dianchi Lake, Danjiangkou Reservoir, Dongtinghu Lake, Poyanghu Lake, Chaohu Lake, and Taihu Lake, Figure 1). In China, Dianchi Lake, Chaohu Lake, and Taihu Lake are examples of eutrophication inland lakes [13]. Poyang Lake and Dongting Lake are China’s largest and second largest freshwater lakes, respectively, and they maintain a natural connection with the middle Yangtze River [14]. Danjiangkou Reservoir is the water source of the South-to-North Water Diversion Projects, which represent the world’s largest water diversion projects [15].
2.2. Sampling and Analysis
Between June and August 2021, 94 sites were sampled for periphytic algae (Table 1). The periphytic algae sample approach is based on previous research [16]. At each site, sampling was done in the places where algae grew on the river’s slope (10–30 cm from the water surface). A 100 cm2 area was randomly picked, and the algae was scraped into the sample container with tweezers, a knife, and a brush. Sampling tools were then rinsed with distilled water, and the rinse water was then transferred to the sample bottle, and samples were fixed with a 1% Lugol iodine solution. After that, the samples were condensed and sedimented, with the volume of each sample set to 30 mL. After shaking and mixing well, 0.1 mL of the sample was placed into the counting frame; species identification and counting were carried out under a microscope (Olympus BX51, Olympus, Tokyo, Japan) at 400× or 1000× (for species in Bacillariophyta) magnification [17,18,19]. The concentration times were converted to the number of cells per unit area, and the number of cells was computed as the algae’s abundance [20].
The multi-parameter water analyzer (YSI Professional Plus, Xylem, Yellow Springs, OH, USA) was used to determine the water temperature (Temp), pH, turbidity (TUB), electrical conductivity (Cond), and dissolved oxygen (DO). Total phosphorus (TP), total nitrogen (TN), ammonia nitrogen (AN), chemical oxygen demand by potassium permanganate (CODMn), and Silicon Dioxide (SiO2) were measured by the Standard Methods for the Examination of Water and Wastewater in China [21].
2.3. Data Analysis
The Shannon–Wiener index, Margalef index, the Pielou index and dominant degree were calculated according to related studies [22,23]. Temp, pH, Cond, DO, TN, AN, TP and CODMn were used to calculate the water quality index (WQI) according to Pesce et al. [24].
The LEfSe method (http://huttenhower.sph.harvard.edu/lefse/, accessed on 27 April 2022) was used to detect the potential enriched species, and the Kruskal–Wallis test with value < 0.05 and LDA threshold > 5 was used to detect features with significantly different abundances. The mantel test analysis between environmental factors and periphytic algae used the ggcor package (version 0.9.5.2) in R, and the CCA and detrended correspondence analysis (DCA) were conducted based on the VEGAN package for R [25]. Indicator species were identified, and their threshold values were calculated using TITAN in the TITAN2 package in R [26]. This method compared the TN or TP mutation points of all species in the community, when numerous species exhibit similar responses at the same time within a short range of nutrient concentration. This range of nutrient concentration is considered as the community’s reaction threshold; for a more complete explanation of this method, please check the reference [27].
Based on the Random Forest Algorithm, the Shannon–Wiener index, Pielou index, Margalef index, and WQI were used to assess ecosystem health. These four indices were divided into five criteria based on related studies (Table 2) [22,24,28]. According to Table 1, 100 dataset groups are created at random for each assessment standard, for a total of 500 dataset groups for five standards. To develop a random forest model, 350 groups of datasets are randomly selected as training samples, and 150 groups of datasets are randomly selected as test samples. The results from this study are then substituted into the model to determine the water ecological health status of each region.
3. Results
3.1. Spatial Distribution of Periphytic Algae Community Structure
A total of 126 periphytic algae genera were discovered, distributing in eight phyla. Note that 56 genera were identified in Chlorophyta, 32 genera in Bacillariophyta, 26 genera in Cyanobacteria, and 10 genera in other phyla (Dinophyta, Cryptophyta, Chrysophyta, Euglenophyta and Rhodophyta).
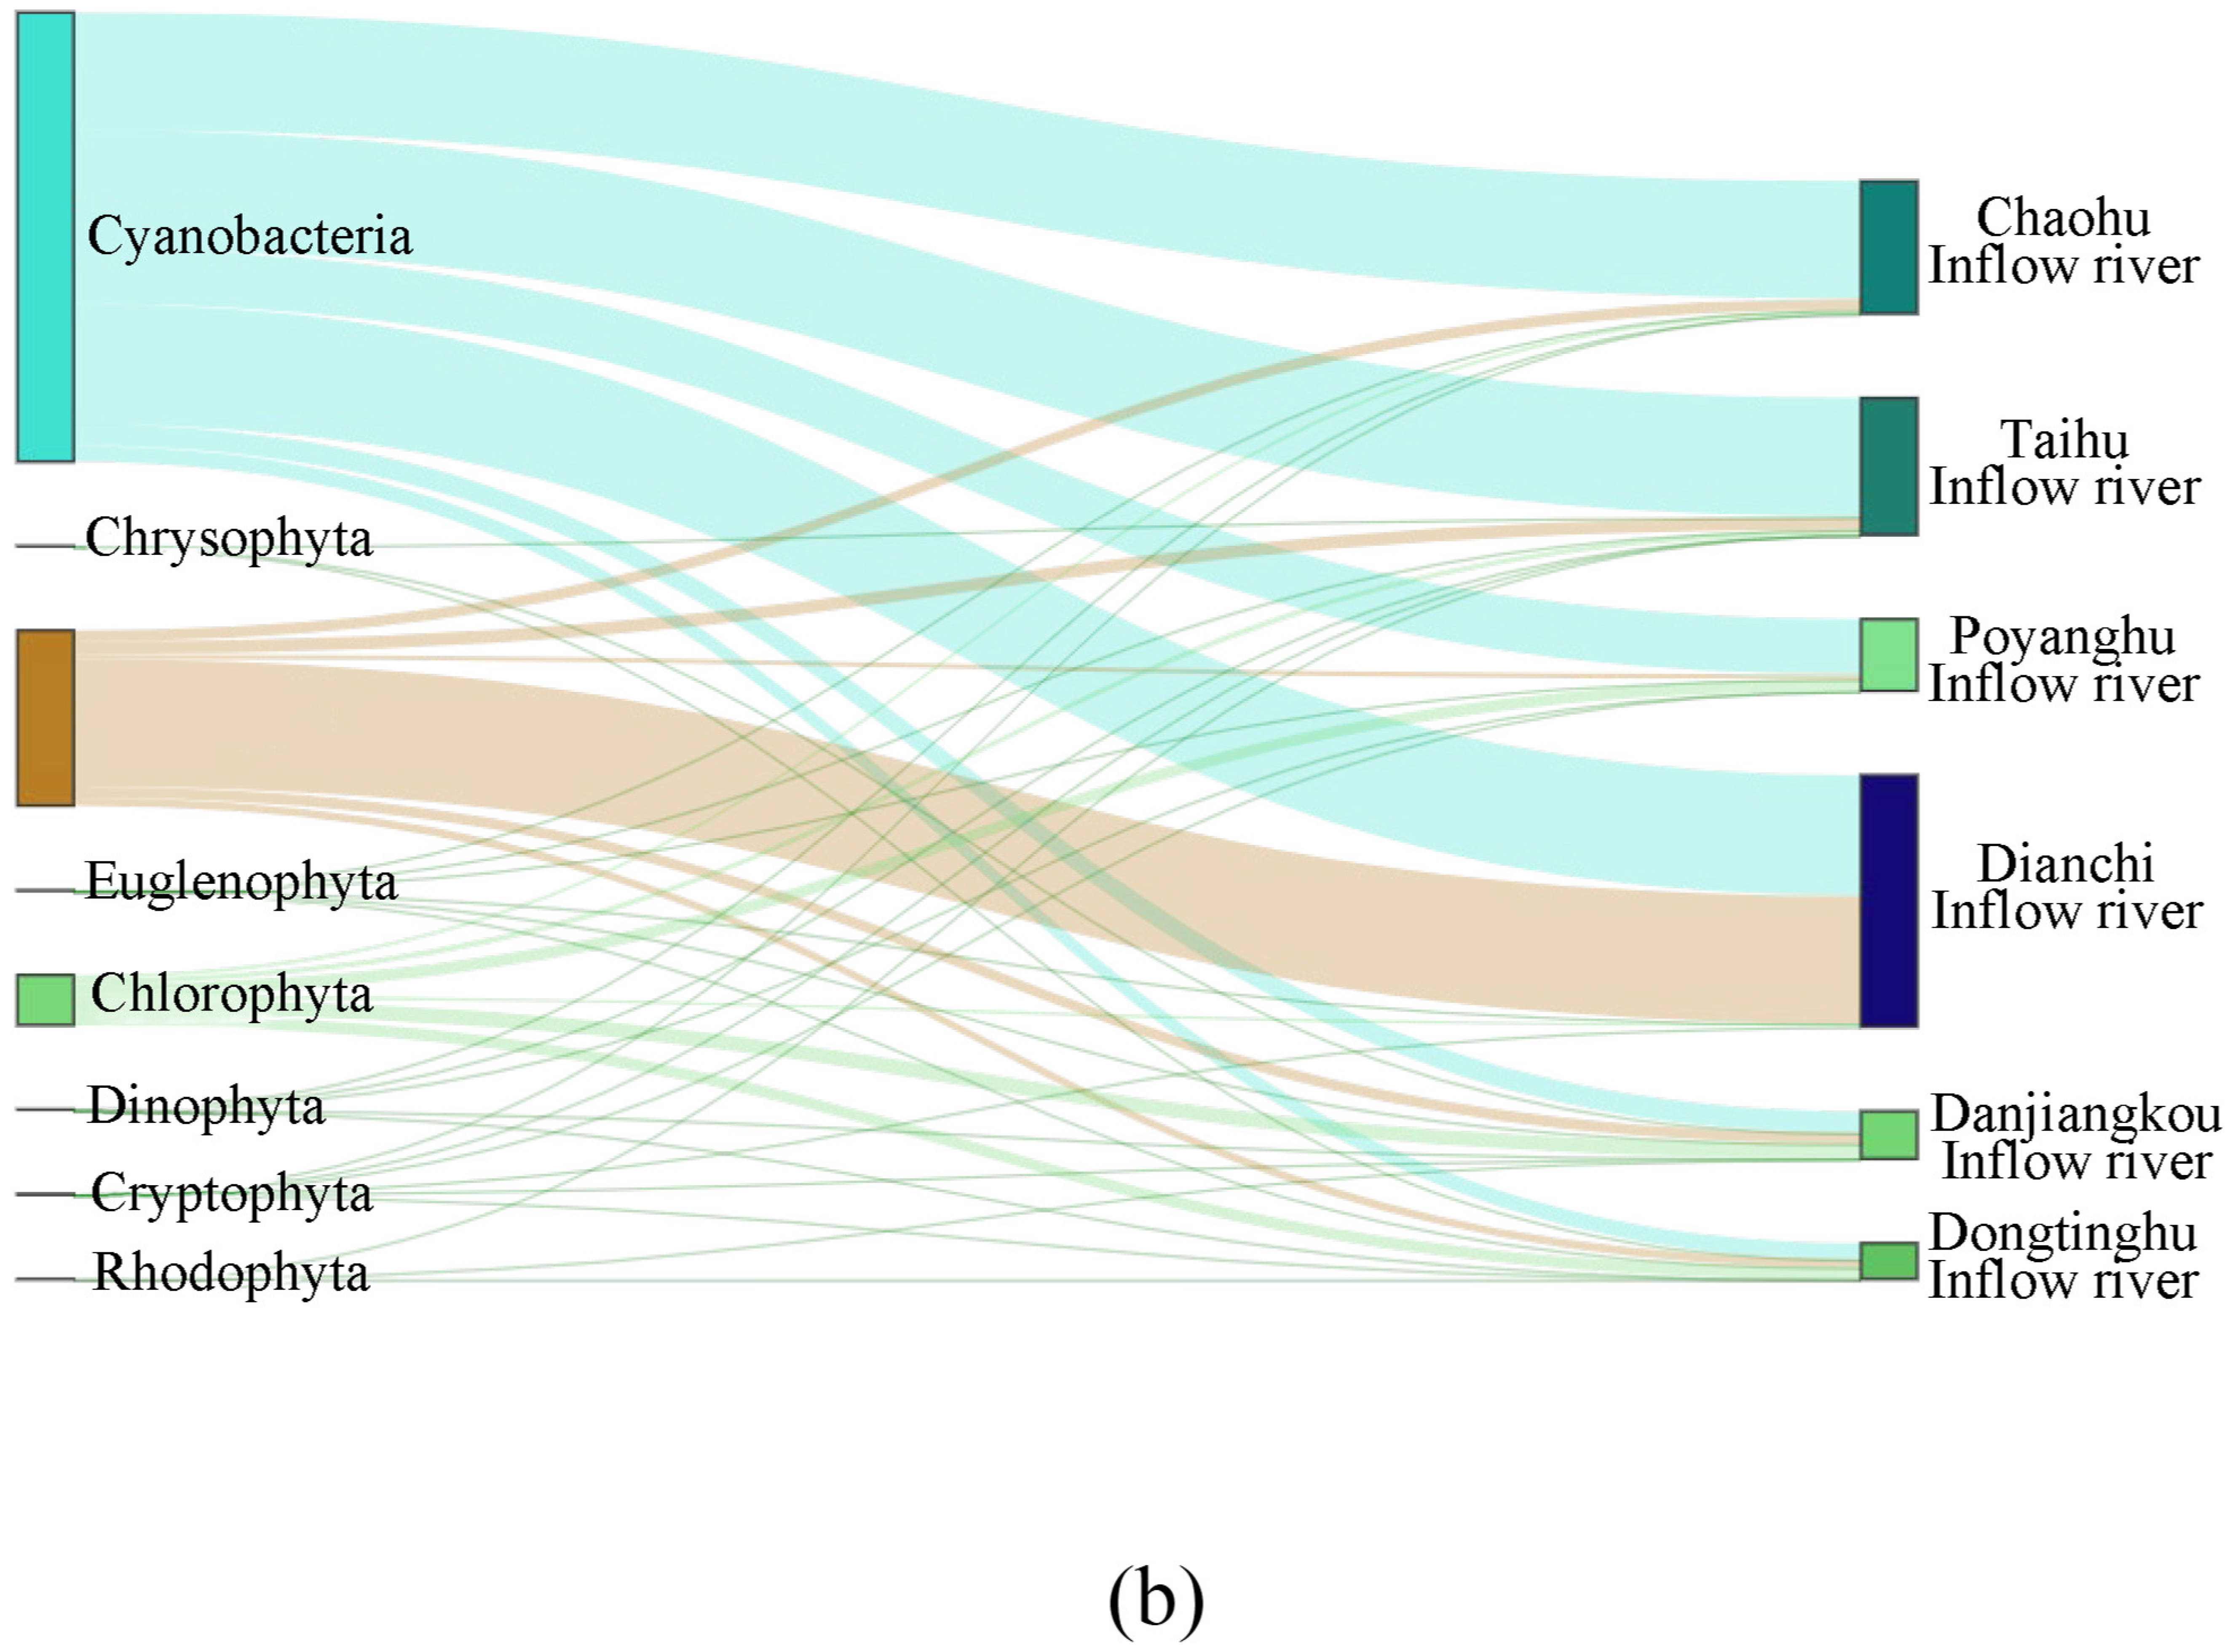
Based on the cell density of each sampling site according to Table 1, the cell density and community composition of each area were computed. Figure 2a shows the periphytic algae cell density in each location. The median of cell density from highness to lowness in each area were: the Dianchi inflow river, the Chaohu inflow river, the Poyanghu inflow river, the Danjiangkou inflow river, the Dongtinghu inflow river and the Taihu inflow river. Based on Wilcoxon rank sum test, the cell density of the Dianchi inflow river is significantly higher than the Danjiangkou inflow river, the Dongtinghu inflow river and the Taihu inflow river; the cell density of the Chaohu inflow river is significantly higher than the Dongtinghu inflow river and the Taihu inflow river. Cyanobacteria was the dominant phylum in the community composition of periphytic algae in the Chaohu inflow river, the Poyanghu inflow river, and the Taihu inflow river. The dominant phyla in the Dianchi inflow river were Cyanobacteria and Bacillariophyta. The dominant phyla in the Danjiangkou inflow river and the Dongtinghu inflow river were Cyanobacteria, Bacillariophyta, and Chlorophyta.
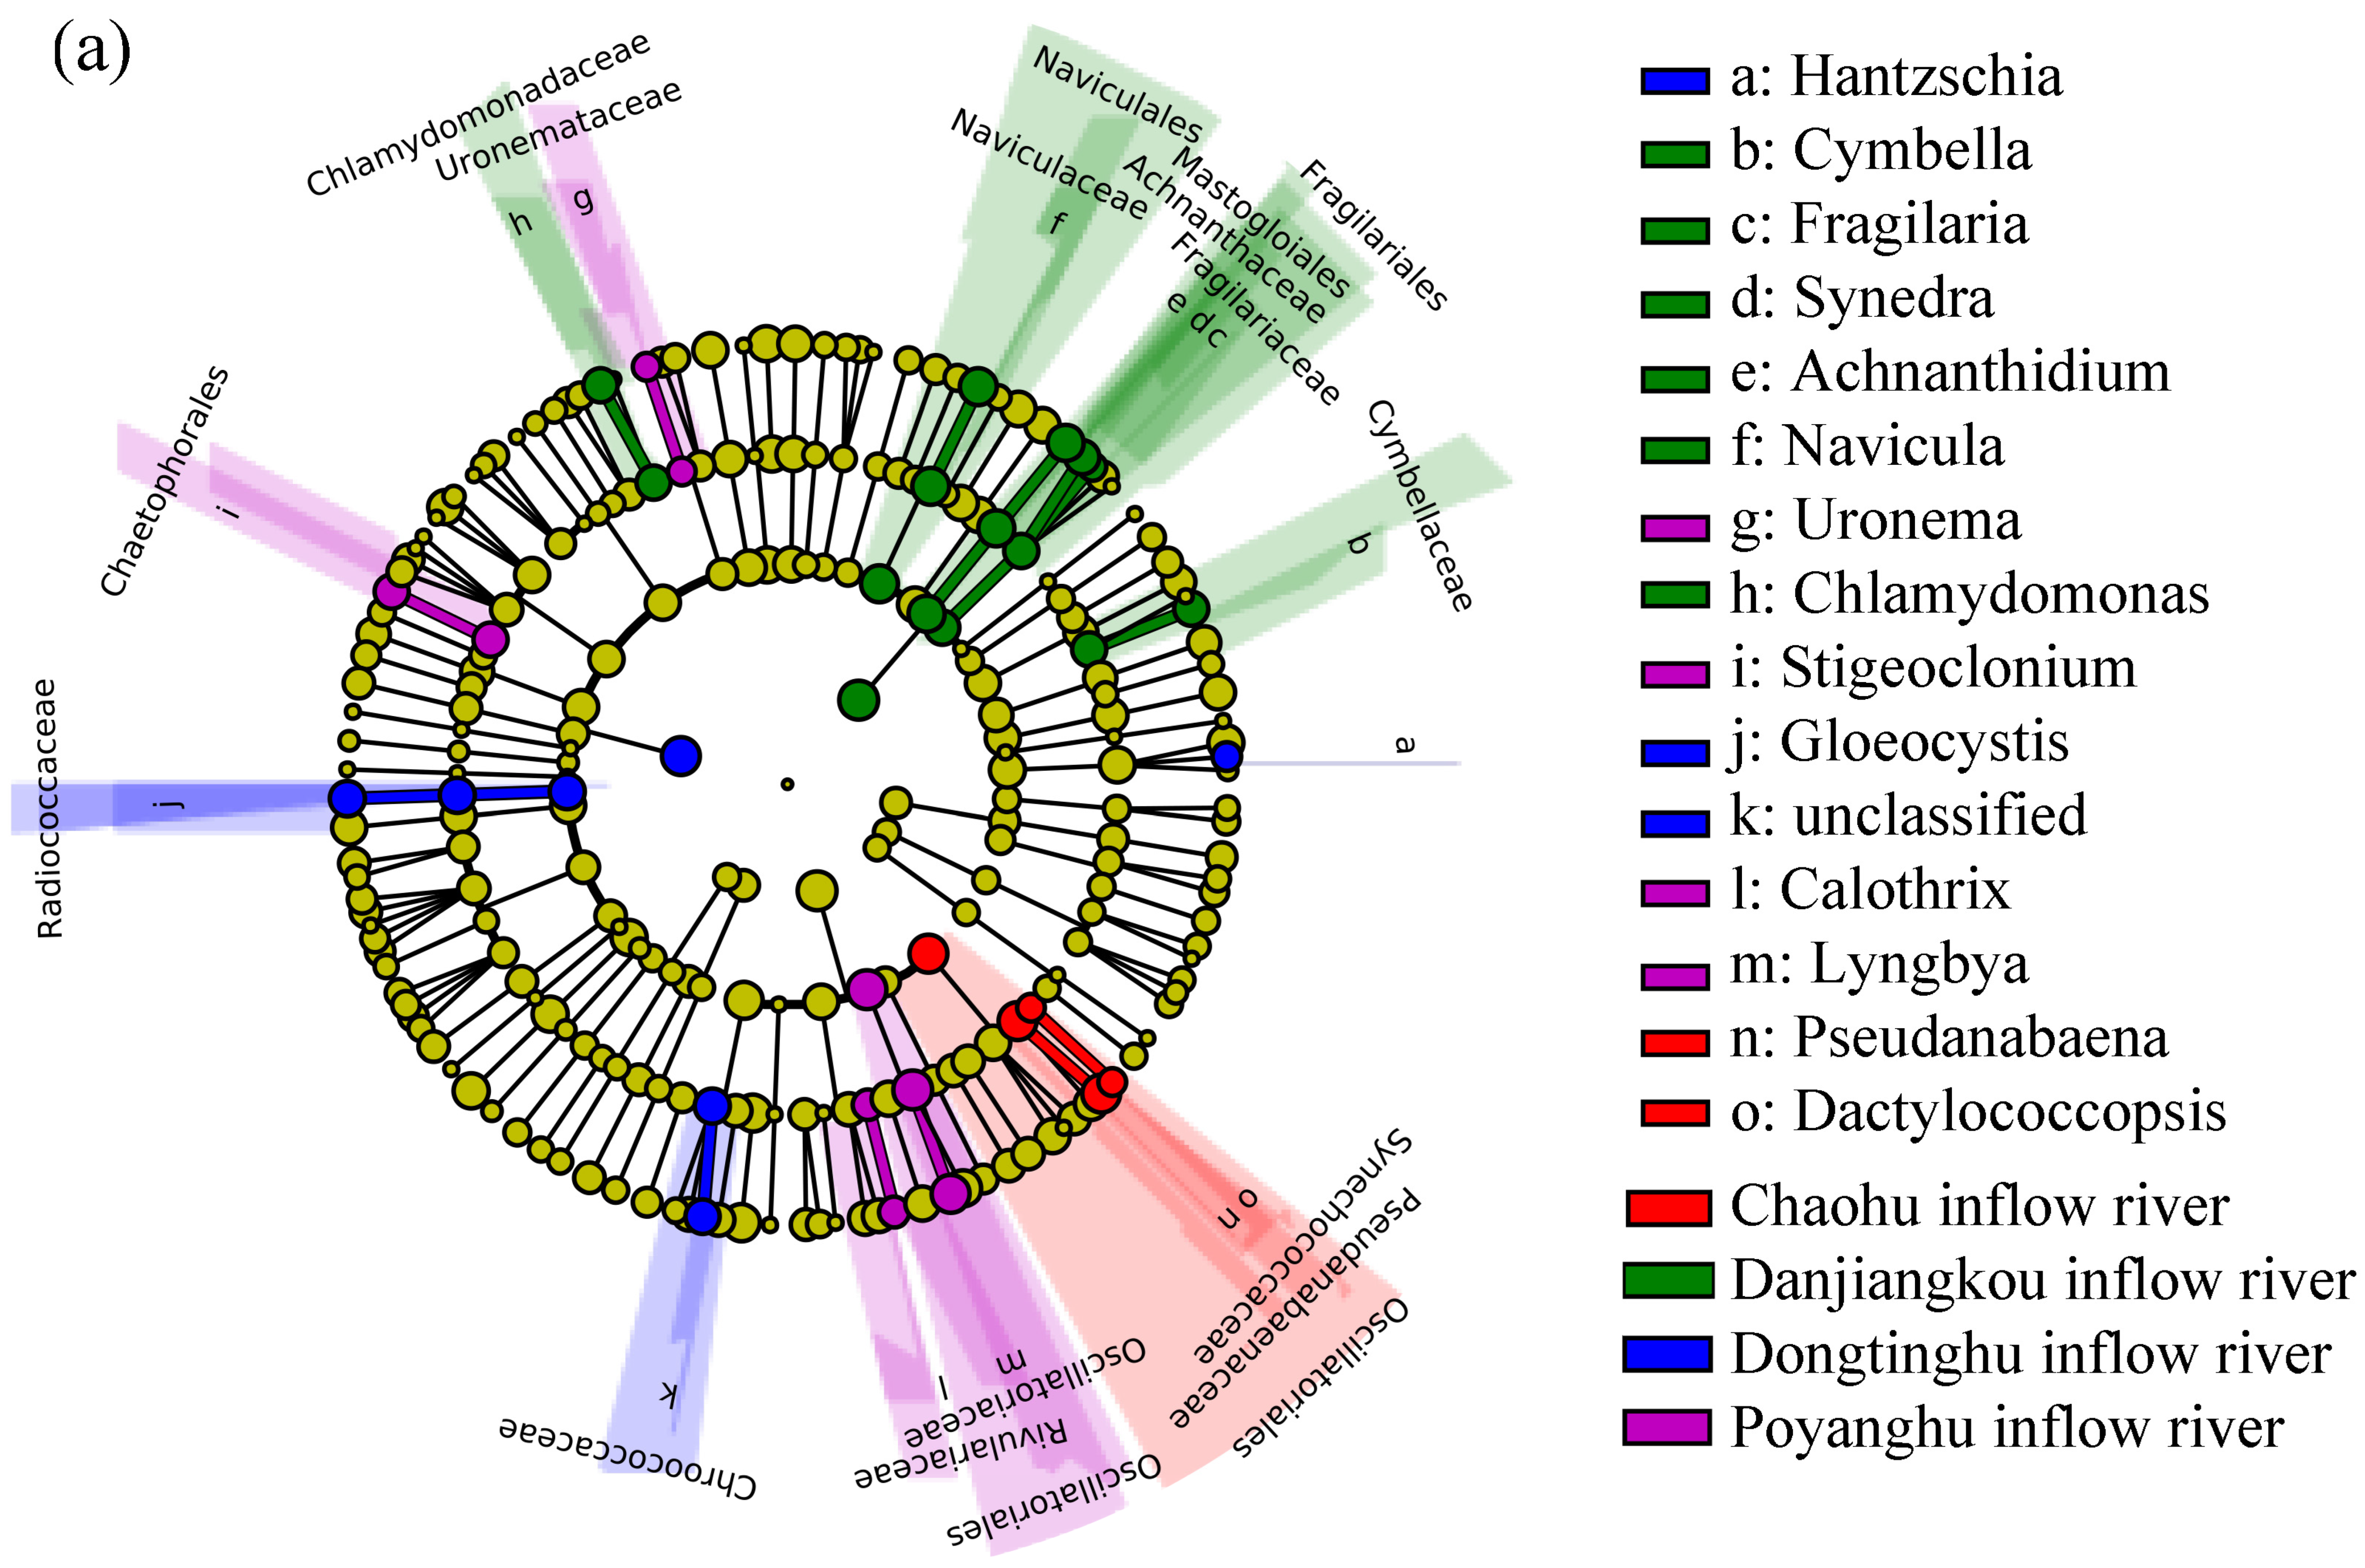
According to the LEfSe analysis (Figure 3), when the threshold on the logarithmic LDA score for discriminative features was set to 5.0, the Poyanghu inflow river was abundant in Oscillatoriales, Oscillatoriaceae, and Lyngbya. Chlorophyta were abundant in the Dongtinghu inflow river, with Gloeocystis being the most common genus. Bacillariophyta were abundant in the Danjiangkou inflow river, with the genus level dominated by Navicula and Achnanthidium. Oscillatoriales, Pseudanabaenaceae, and Pseudanabaena were abundant in the Chaohu inflow river. There were no enriched species in other areas.
3.2. Relationship between Periphytic Algae Communities and Environment Variables
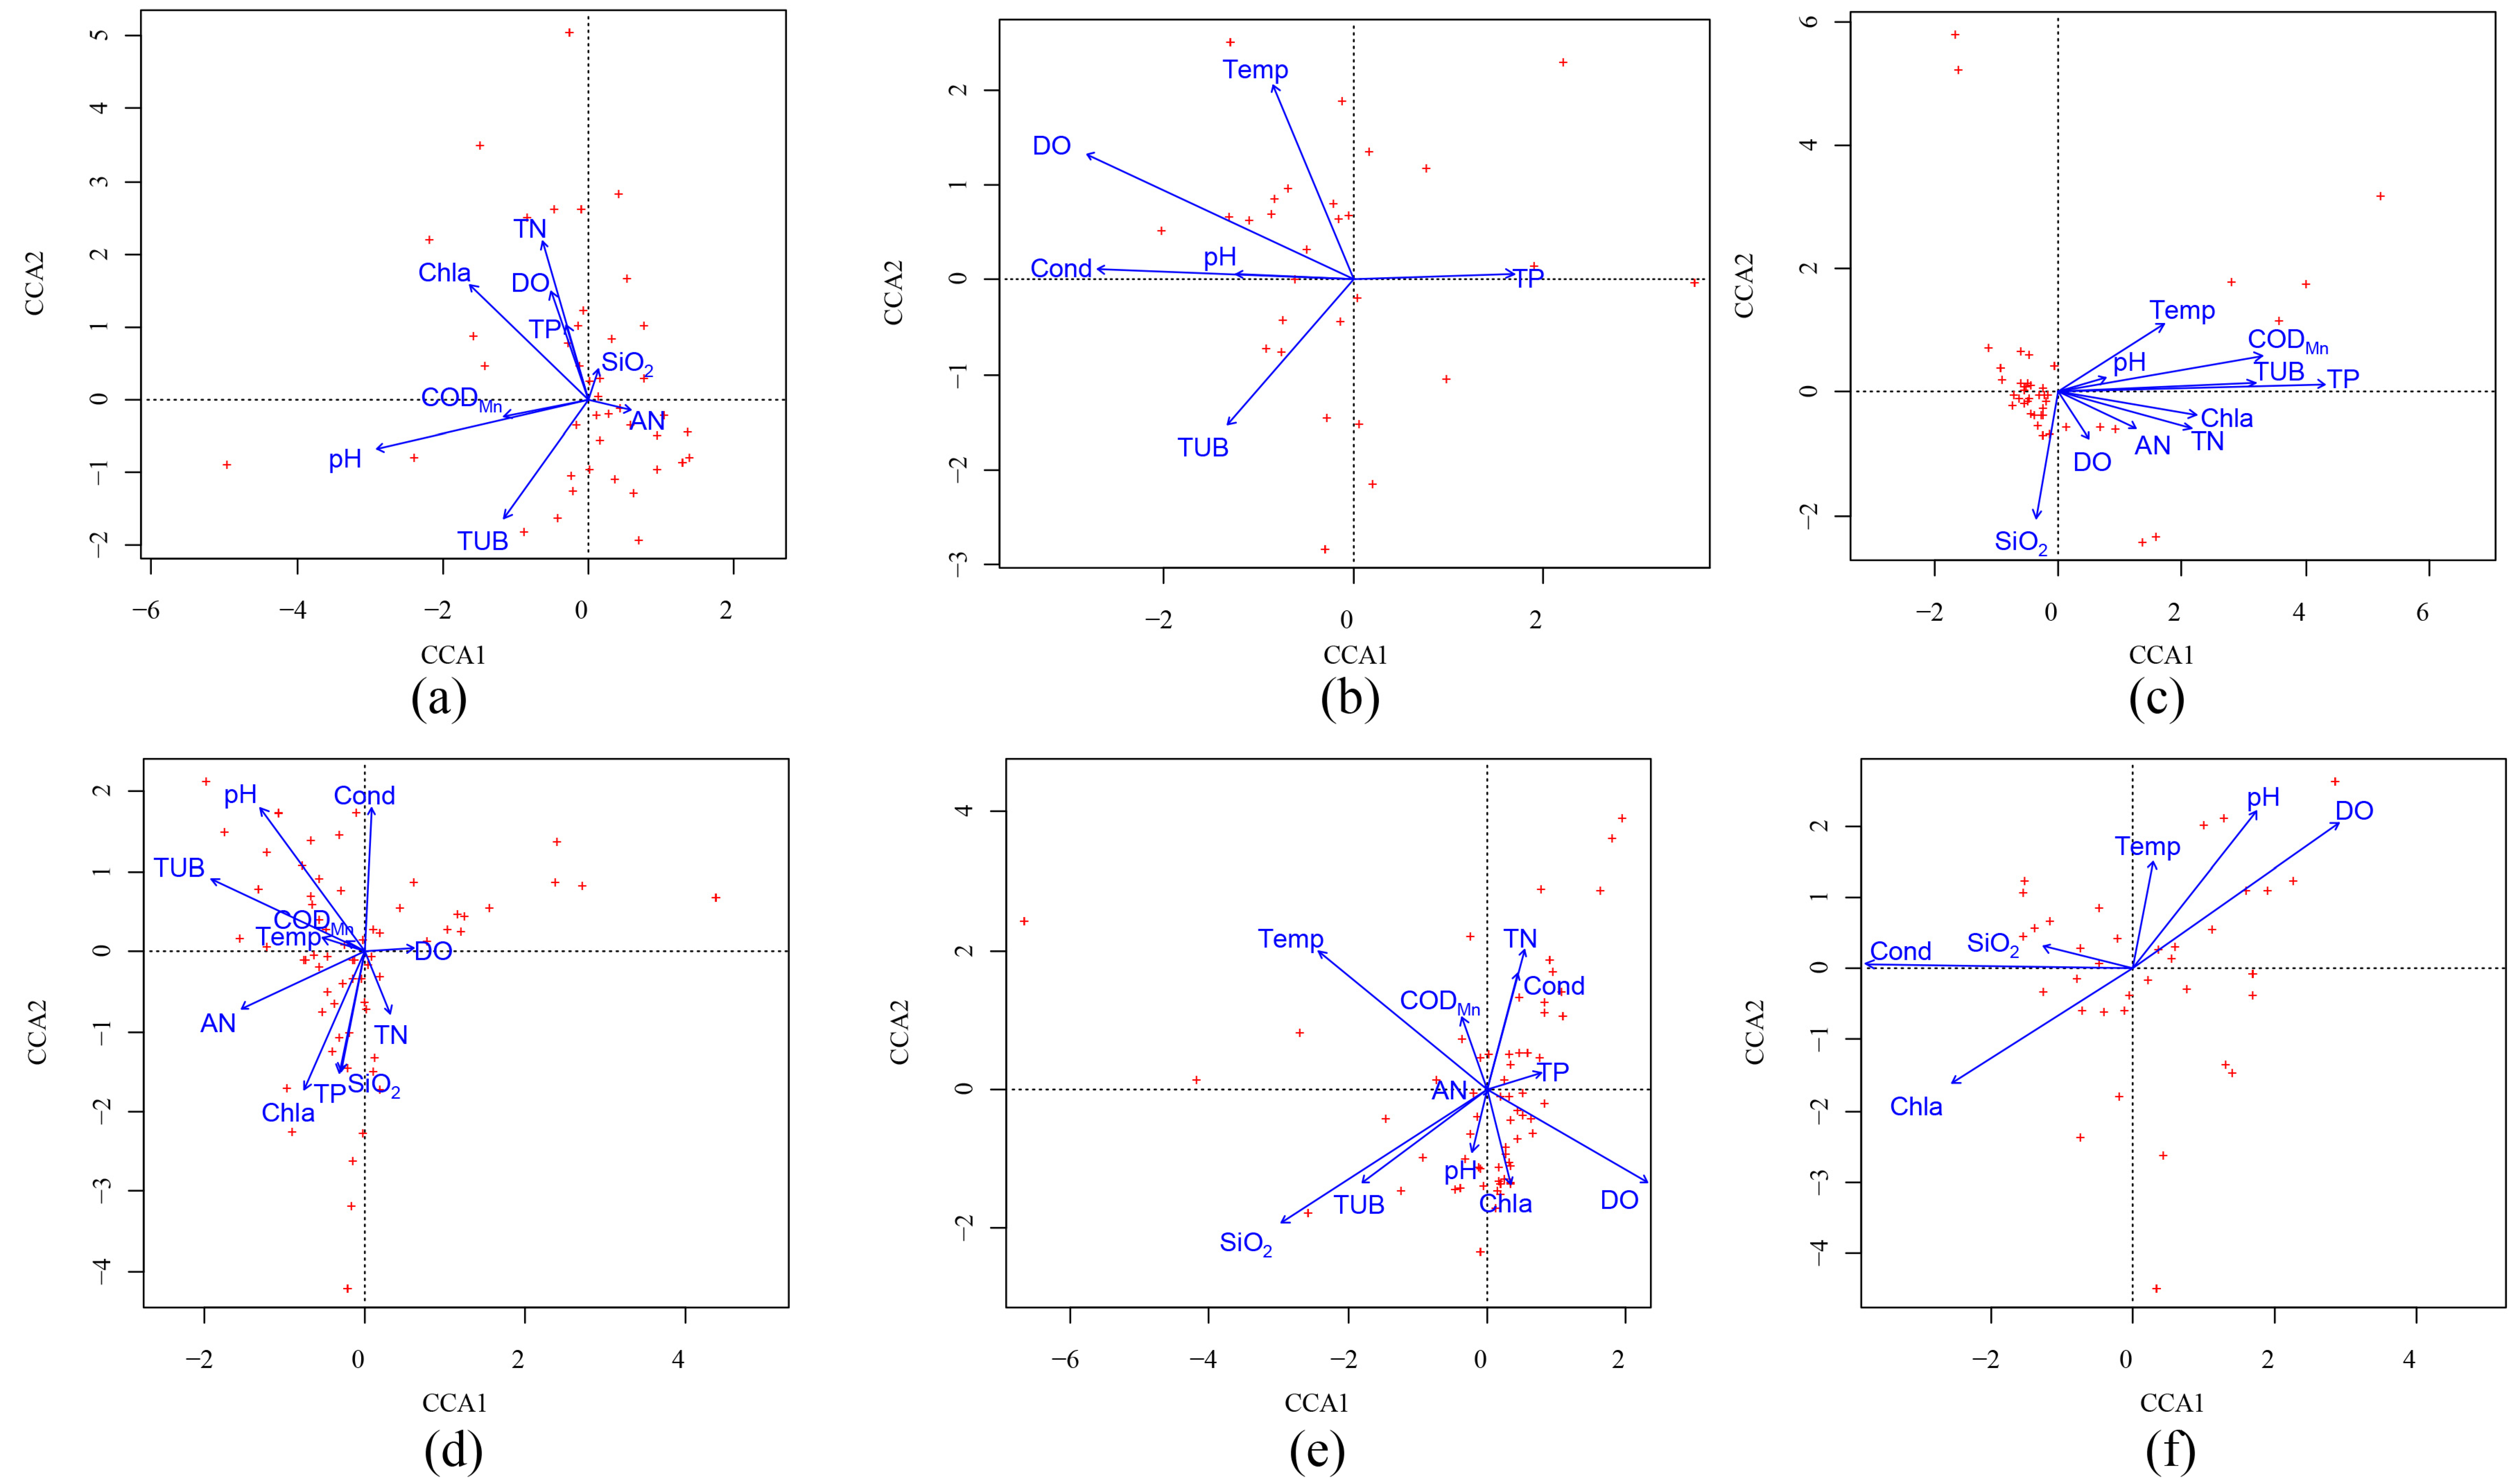
The length of the gradient was larger than 3.0 according to the DCA analysis, hence CCA was utilized to investigate the link between periphytic algae and environmental variables [29]. Prior to CCA, the Hellinger transformation was used to homogenize the variance of species abundance and down-weight rare species [30], and the multicollinearity of environmental factors was removed using the variance inflation factor [31], as shown in Figure 4.
To find significant correlations between periphytic algae communities and environmental variables, the criterion of p < 0.05 and 1000 Monte Carlo permutations was used. The periphytic algal population in the Chaohu inflow river was significantly influenced by TN and pH. The periphytic algal population in the Danjiangkou inflow river was significantly influenced by TP, TUB, and CODMn. In the Dongtinghu inflow river, pH had a substantial impact on the periphytic algal community. The periphytic algae population in the Poyanghu inflow river was significantly affected by Temp and DO. The periphytic algae community in the Dianchi and Taihu inflow rivers had no environmental drivers.
3.3. Indicator Species and Ecological Community Thresholds
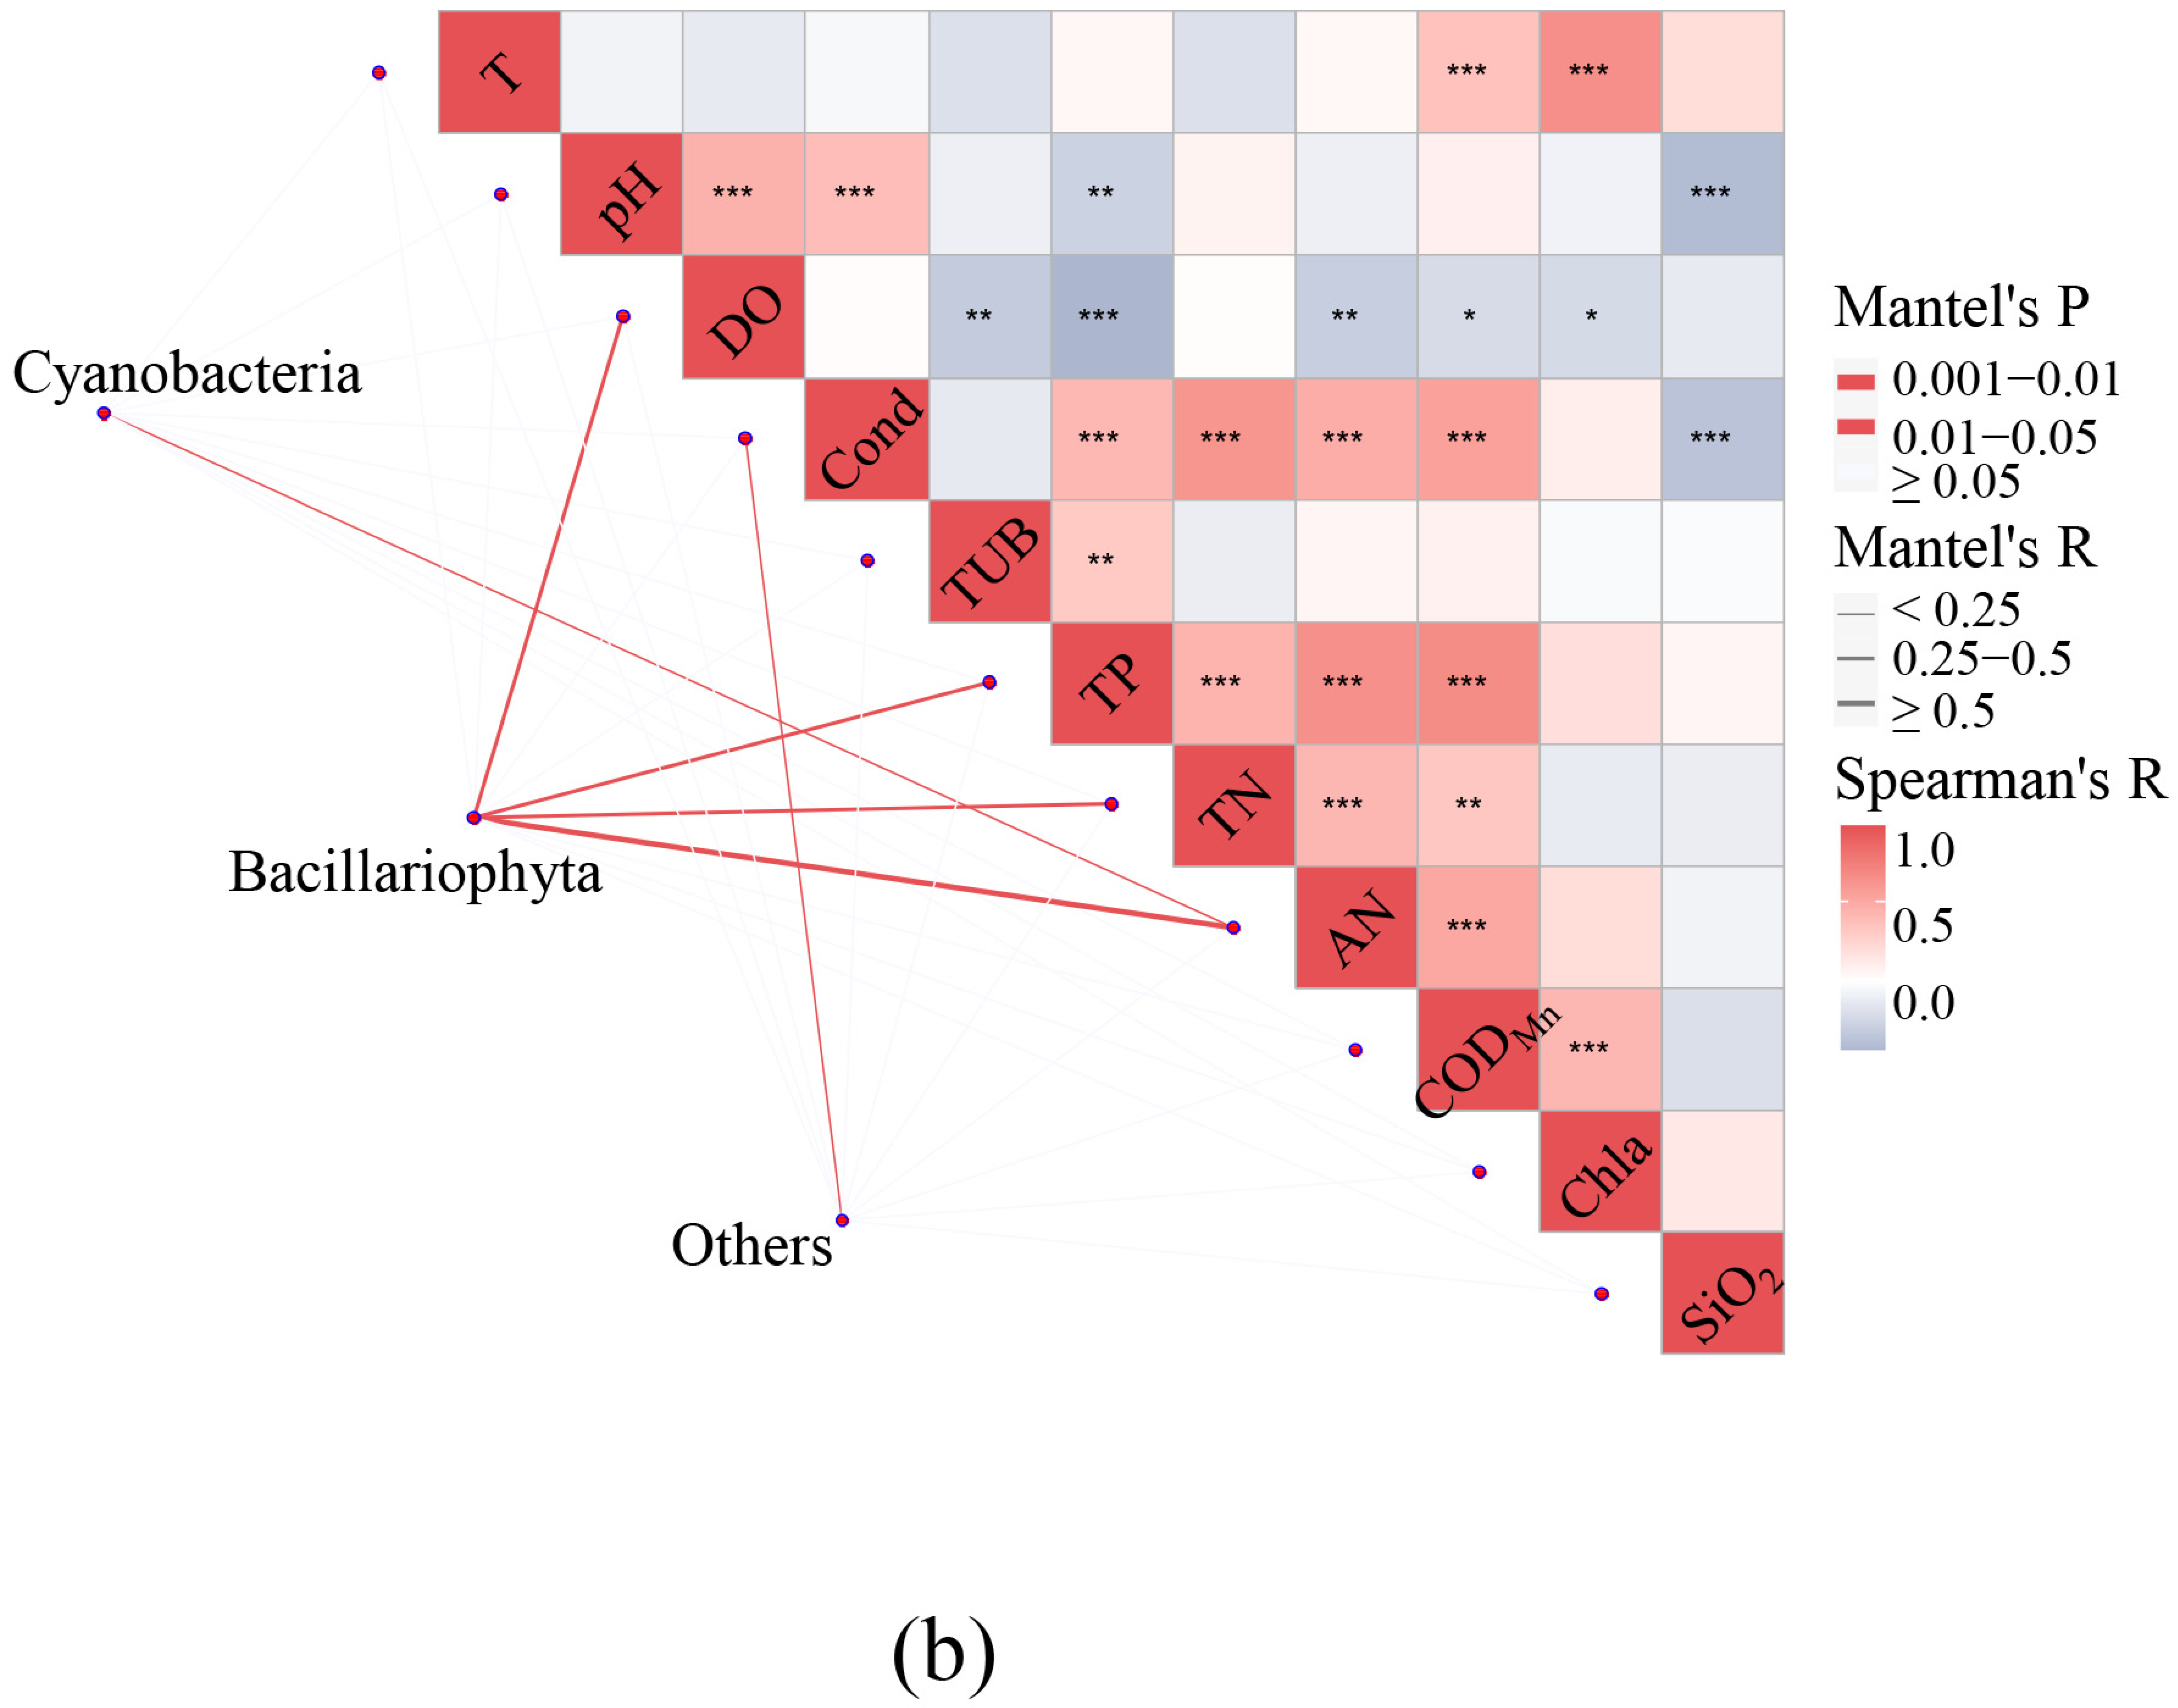
Figure 5 shows the CCA and Mantel test results based on periphytic algae community and environment variable data from all inflow rivers. Temp, Cond, TUB, TP, TN CODMn, Chla, and SiO2 all had a substantial impact on the periphytic algae population, according to CCA. Because Cyanobacteria and Bacillariophyta were the most prevalent phyla in all inflow rivers (Figure 2b), the Mantel test was used to investigate their relationships with environmental variables. Cyanobacteria were primarily influenced by AN, while Bacillariophyta were influenced by DO, TP, TN, and AN. TN and TP were the overlapped environment variables that significantly influenced the periphytic algae community composition in all inflow rivers, according to the results of the CCA and Mantel test.
The indicator species and ecological community thresholds in all inflow rivers were further analyzed using TN and TP. Species with dominant degree higher than 0.0001 and occurrence higher than three times were used for analysis, TITAN identified positive (z+) and negative (z−) responding species for periphytic community change points in response to TN and TP (Figure 6).
Chlorococcum has been found as a negative reacting species to TN, with cell density increasing as TN decreases and a threshold of 1.835 mg/L. As a result, TN concentrations below 1.835 mg/L are insufficient for periphytic algae growth and reproduction. Cyclotella has been found as a positive responsive species, with cell density increasing as TN increases and Cyclotella thresholds of 2.355 mg/L. As a result, TN concentrations more than 2.355 mg/L are unsuitable for periphytic algae growth and reproduction. In all input rivers of the Yangtze river basin, the lowest acceptable TN concentration for periphytic algae is 1.835 mg/L.
The Amphora and Achnanthidium were shown to be negative reacting species for TP, with thresholds of 45 μg/L and 19.5 μg/L, respectively. As a result, TP concentrations less than 19.5 μg/L are insufficient for periphytic algae growth and reproduction. Cryptomonas has been found as a positive responsive species, with a 122.5 μg/L threshold. As a result, the lowest acceptable TP concentration of periphytic algae in the Yangtze inflow rivers is 19.5 μg/L.
3.4. Ecosystem Health Assessment in All Inflow River
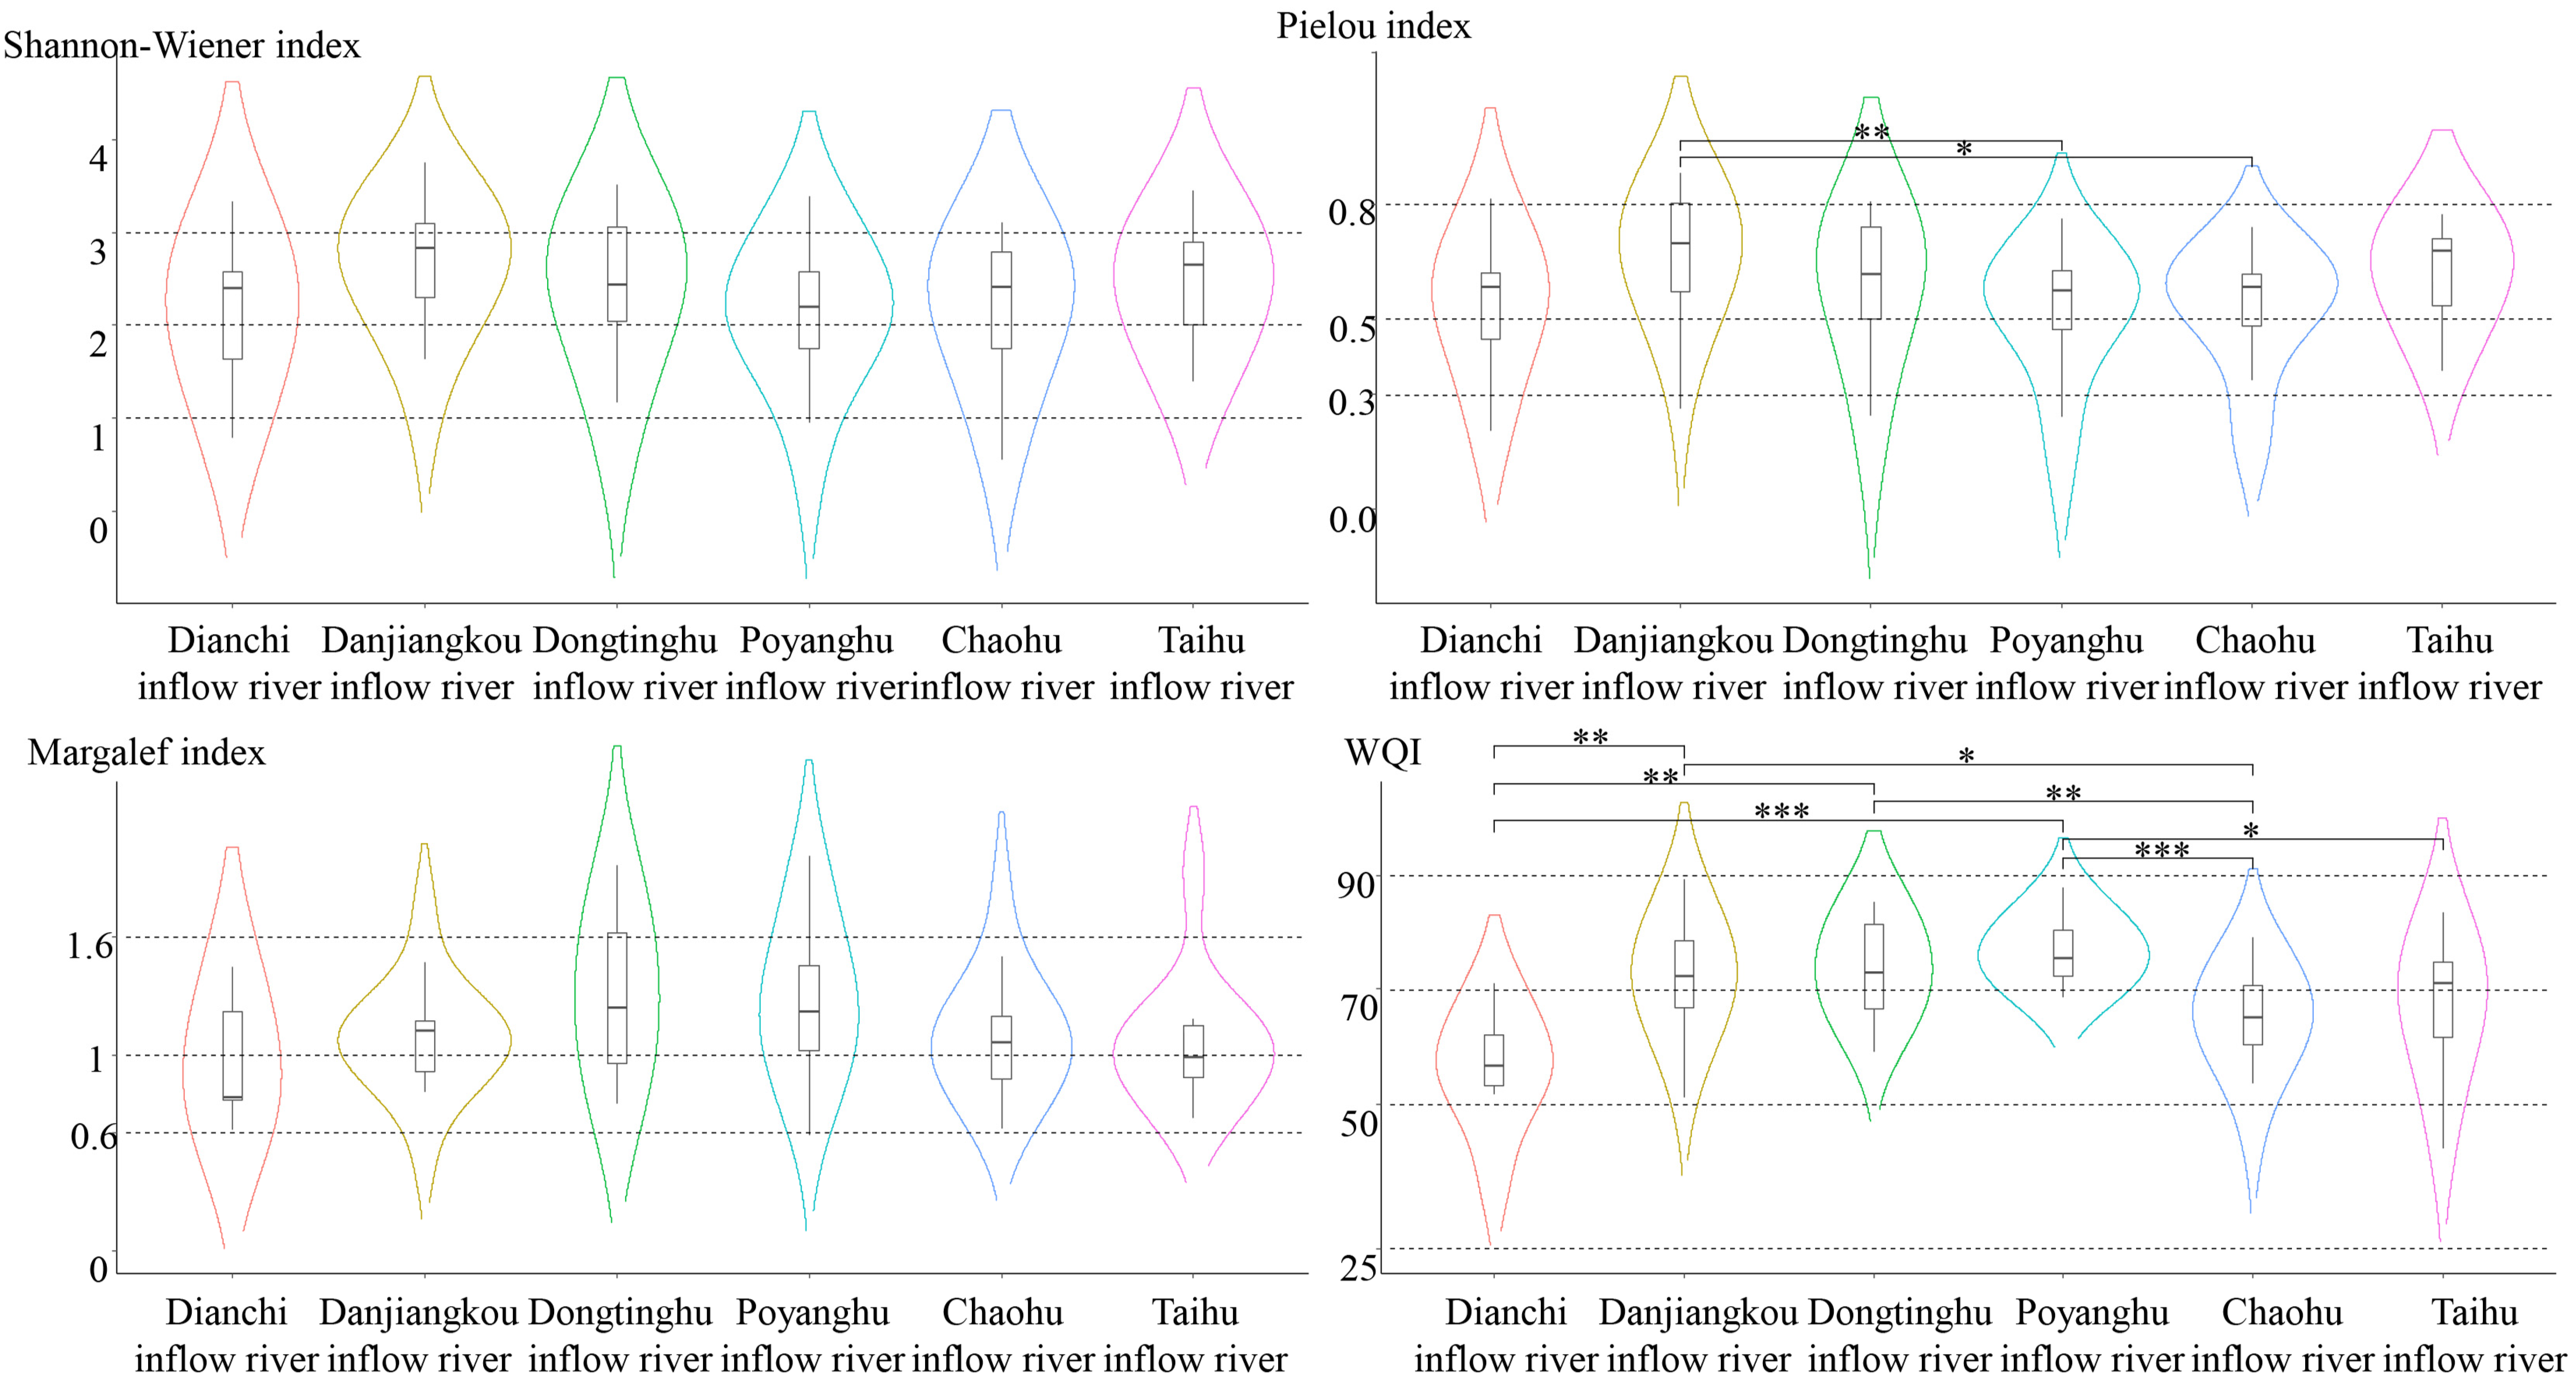
The Shannon–Wiener index, Margalef index, and the Pielou index were used to assess the biotic health of each of the inflow rivers. The WQI is used to quantify water quality using multiple measurable parameters, allowing us to monitor changes in water quality and identify water trends [24], so the WQI tests were used to assess the abiotic health of each inflow river, and Wilcoxon rank sum test was used to compare different groups (Figure 7).
The Shannon–Wiener index is a species diversity index emphasizing both richness and evenness [32], the Margalef’s index is a species diversity index emphasizing species richness [33], but there is no significant difference between any pairings of inflow rivers. The Pielou index is a species diversity index emphasizing evenness [34]; the periphytic algae community in the Danjiangkou inflow river had significantly higher evenness than the Poyanghu inflow river and the Chaohu inflow river.
The WQI for all inflow rivers ranges from 37.5 to 95, with an average WQI of 74.2 across all sites, indicating that the water quality of all inflow rivers was “good” (Table 2). The WQI in the Poyanghu inflow river is significantly greater than the WQI in the Di-anchi inflow river, the Chaohu inflow river, and the Taihu inflow river, according to the Wilcoxon rank sum test. The Dongtinghu and Danjiangkou inflow rivers have a higher WQI than the Dianchi and Chaohu inflow rivers. In conclusion, the water quality of the Dongtinghu inflow river and the Poyanghu inflow river is the best, followed by the Danjiangkou inflow river.
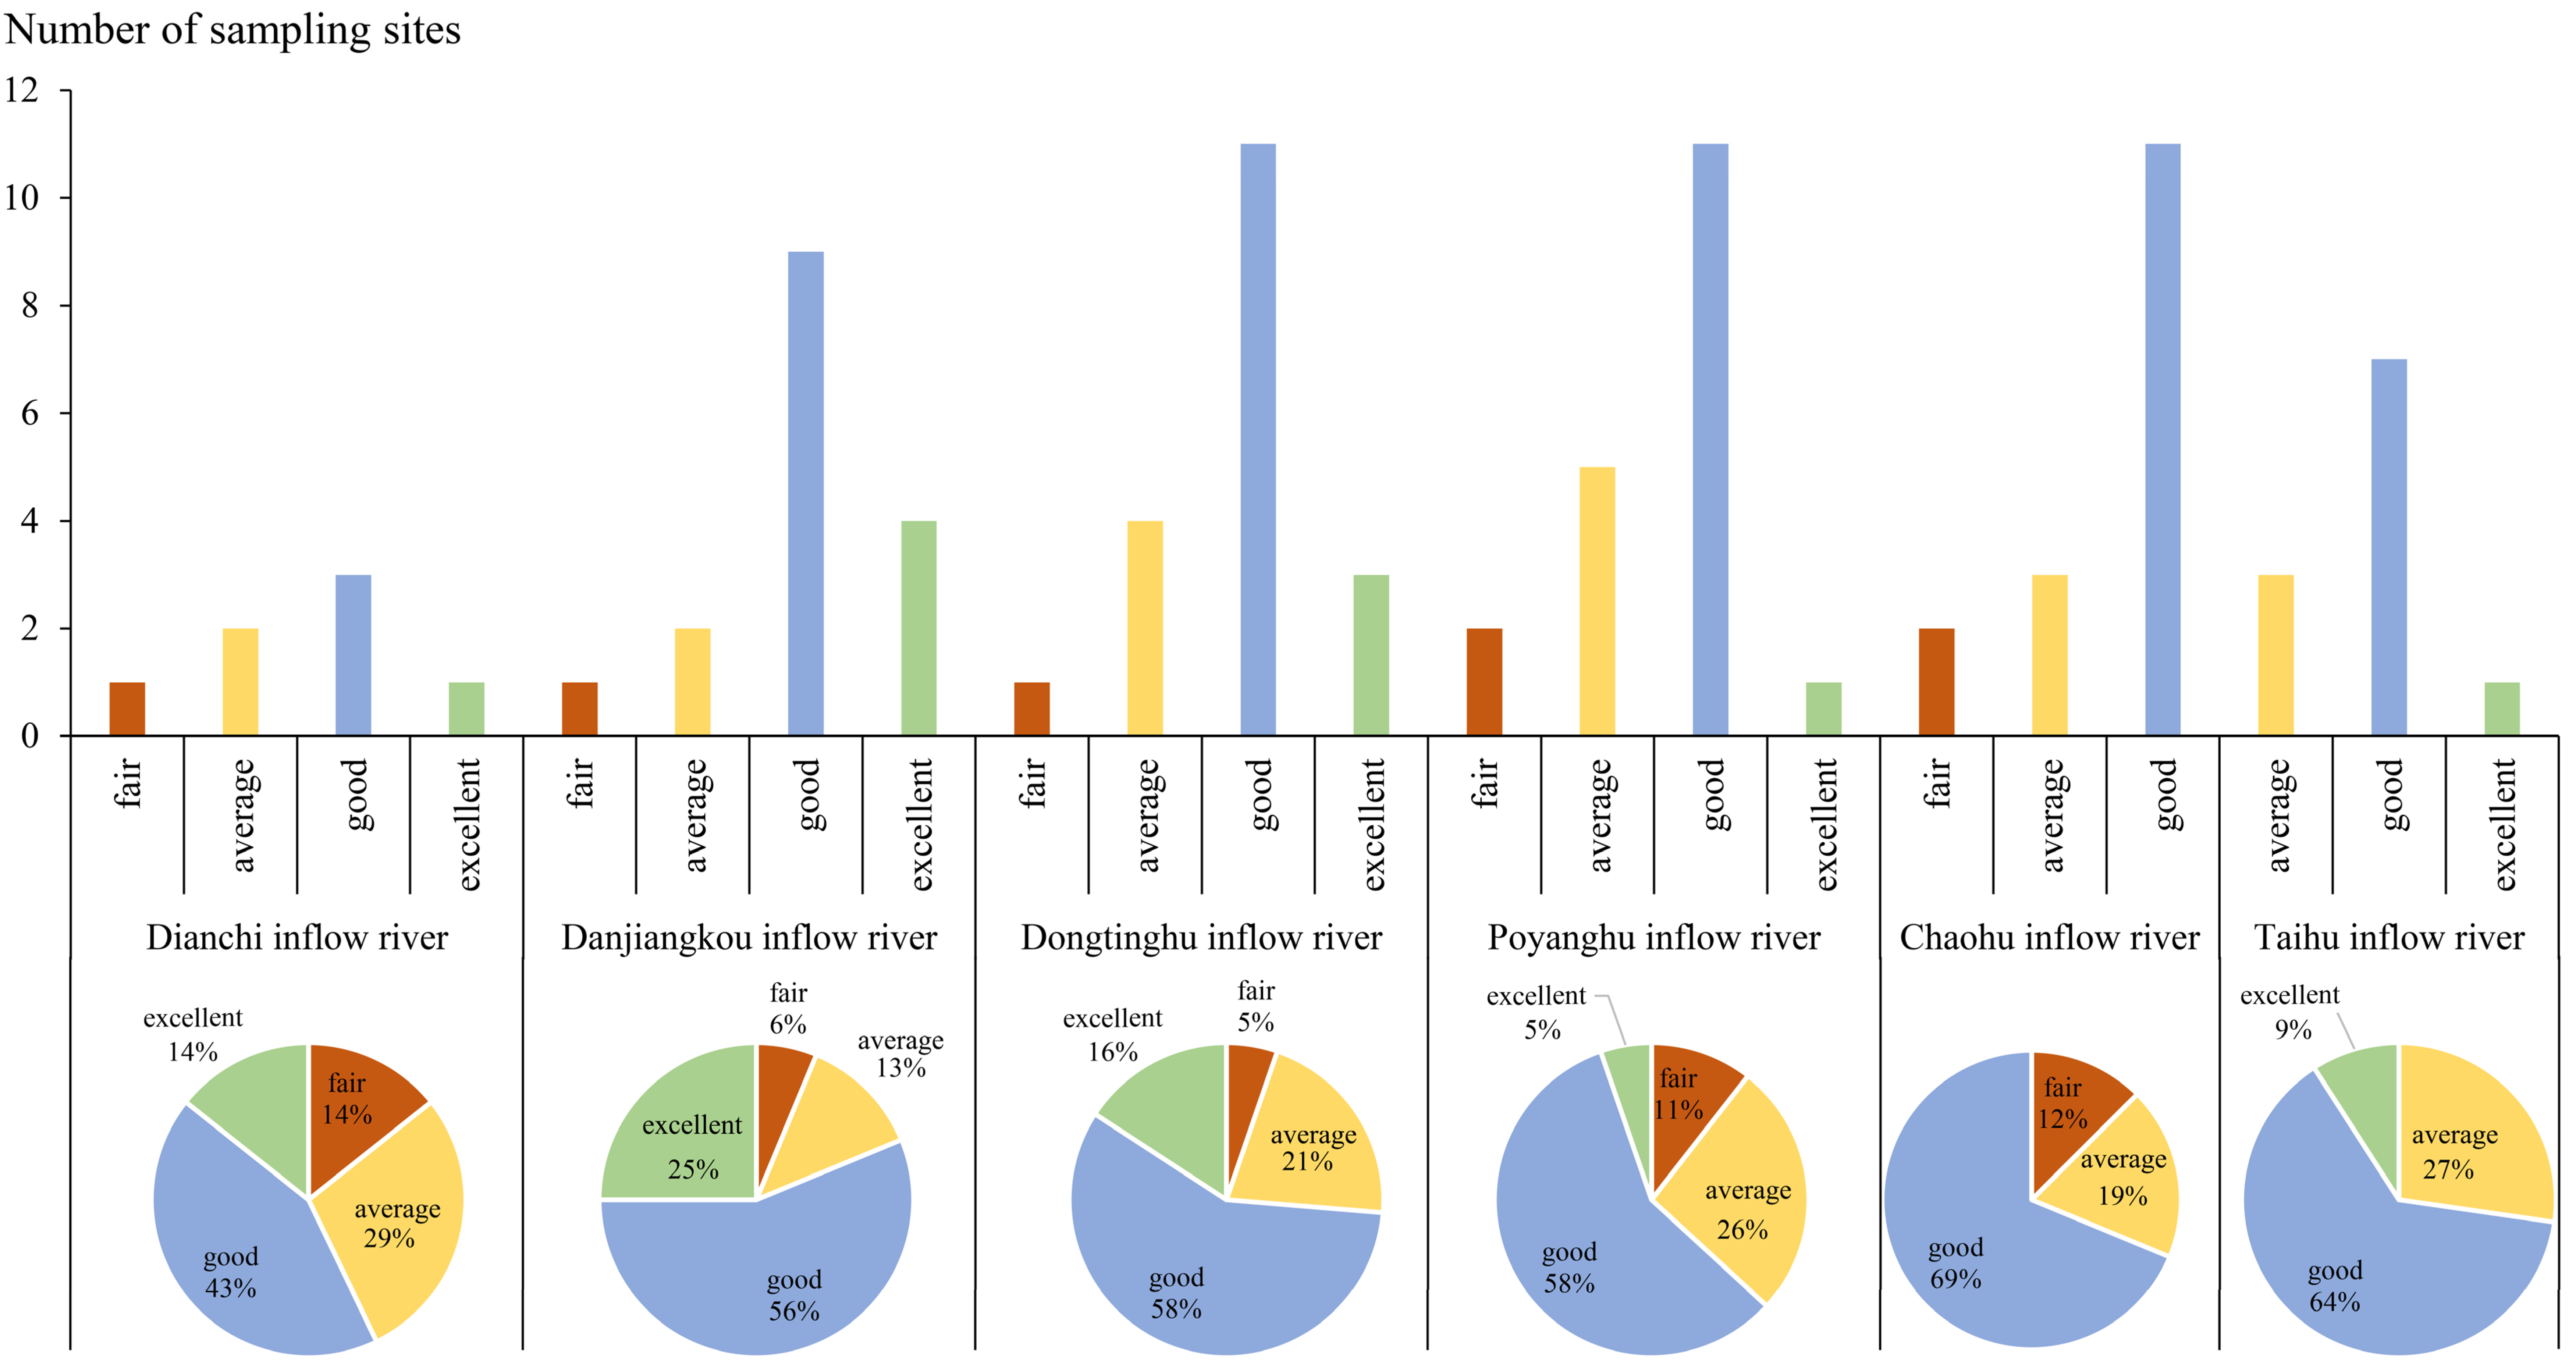
Figure 8 displays the random forest algorithm-based ecosystem health evaluation of each inflow river. In all inflow rivers except the Dianchi, more than 50% of sampling locations are in “good” condition. The ecosystem health of different inflow rivers was compared using the percentage of sampling sites with an assessment result better than “average” (i.e., “good” and “excellent”). The Dianchi inflow river, the Danjiangkou inflow river, the Dongtinghu inflow river, the Poyanghu inflow river, the Chaohu inflow river, and the Taihu inflow river all had excellent and good rates of 57%, 81%, 74%, 63%, 69% and 73%, respectively. So, the ecosystem health assessments from good to poor were: the Danjiangkou inflow river, the Dongtinghu inflow river, the Taihu inflow river, the Chaohu inflow river, the Poyanghu inflow river and the Dianchi inflow river.
4. Discussion
4.1. Spatial Distribution of Periphytic Algae Community Structure
In China, the structure of periphytic algal communities has been extensively researched. The periphytic algae in the Weihe river basin were examined by Liu et al., who discovered that Bacillariophyta is the dominant phylum [35]. Chlorophyta, Bacillariophyta, and Cyanobacteria were the most common periphytic algae in Poyanghu Lake [11]. Bacillariophyta was likewise found to be the most prevalent species in the Danjiangkou Reservoir and its associated water channel [10]. The dominant phyla of this study are Bacillariophyta and Cyanobacteria, which is consistent with prior findings. Bacillariophyta’s dominance is likely due to its adaptation to many environmental conditions and ecological tolerance, whereas Cyanobacteria’s dominance is likely due to the diverse methods used by this group, such as storing phosphorus, fixing atmospheric nitrogen, absorbing CO2, and so on [36].
When it refers to cell density, algae’s growth and reproduction are inextricably linked to its surrounding nutrition environment. The driving environment variables for all inflow rivers, according to this study, are TN and TP. When we compared the TN concentration, TP concentration, and cell density of each area, we discovered that the Dianchi inflow river and Chaohu inflow river have higher cell density and TP concentration than the other areas, but a higher TN concentration in some areas may have lower cell density (the Danjiangkou inflow river has the second highest TN concentration, but the cell density is ranked fourth). Schindler et al. found that the nitrogen fixation of nitrogen-fixing cyanobacteria was adequate to allow cell density to continue to be generated in proportion to phosphorus, implying that TP contributes more to eutrophication than TN [37]. Here, we speculate that the increased cell density could be attributable to the high TP concentration in the Dianchi and Chaohu input rivers.
4.2. The Relationship between Environmental Variables and Periphytic Algae at Inflow Rivers in Six Lakes
The Dianchi inflow river has the largest density of periphytic algae, with Cyanobacteria and Bacillariophyta dominating the ecosystem. Cyanobacteria similarly dominated the periphytic algae in the Taihu inflow river, but we found no enriched species or environmental drivers in these locations.
The periphytic algae density in the Chaohu inflow river is the second largest; the community is dominated by Cyanobacteria, particularly Pseudanabaena, which is frequently reported as cyanobacterial bloom components [38]. Because the Chaohu Lake is frequently threatened by algae blooms [39], and algae distribution is influenced by water flow [40], the Pseudanabaena bloom in the Chaohu Lake should be monitored. The periphytic algae community in the Chaohu inflow river was significantly influenced by TN and pH; as TN is one of the most important nutrients for algae growth and reproduction, pH can directly influence the growth rate of algae [41].
Cyanobacteria, particularly Lyngbya, dominated the periphytic algae in the Poyanghu inflow river, which are found in a wide range of habitats and geographies [42]. Because water temperature is the most important physical driving element for Cyanobacteria species growth [43], and dissolved oxygen level is predominantly dependent on algal photosynthetic oxygen generation and respiration [44], the community structure is highly related to Temp and DO.
Periphytic algae in the Danjiangkou inflow river was dominated by Cyanobacteria, Bacillariophyta and Chlorophyta; the enriched species in the genus level are Navicula and Achnanthidium, which are both cosmopolitan in rivers [10]. TUB, TP and CODMn are the most driving environmental factors in the Danjiangkou inflow river. TUB is known to restrict algal growth by influencing light access [45]. Not only is TP an essential nutrient for algal growth and reproduction, but it also has a strong interaction with TUB [46]. CODMn is used to assess organic pollution in surface water; the organic matter was probably mineralized by microorganisms, providing nutrients to periphytic algae [9].
Cyanobacteria, Bacillariophyta, and Chlorophyta dominated periphytic algae in the Dongtinghu inflow river, and Gloeocystis was the enriched species, which commonly appears as the dominant species in oligotrophic water bodies during summer [19]. pH is a crucial environmental variable that influences the photosynthetic rate of periphytic algae. It affects protoplasmic ion balance and the solubility of numerous chemicals, including inorganic carbon [41].
4.3. The Periphytic Algae Indicator and the Threshold of TN and TP at Inflow Rivers in Six Lakes
This study found that the TN and TP significantly influenced the periphytic algal community composition in all inflow rivers (Figure 5). The community structure, biomass, and elemental composition of river periphytic algae can be affected by TN and TP concentrations [47]. The lowest optimum concentration of TN and TP for periphytic algae development were found to be 1.835 mg/L and 19.5 μg/L, respectively, in this study.
Low nutrition levels can result in low periphytic algae density when the TN concentration is less than 1.835 mg/L or the TP concentration is less than 19.5 μg/L. When TN and TP concentrations are above this threshold, higher TN and TP levels can result in increased periphytic algal density. The TN and TP thresholds of algae were 0.03 mg/L and 0.5 mg/L, respectively, according to Dodds et al. and Stevenson et al. [48,49]. Chambers et al. found that the TN and TP thresholds in streams were 0.21~1.20 mg/L and 0.01~0.03 mg/L, respectively. Different TN and TP thresholds in varied studies could be attributable to different geographical factors such as climate, land use types, and other physical and chemical elements [48,50].
4.4. The Ecosystem Health Assessment at Inflow Rivers in Six Lakes
This study assessed the biotic health of each inflow river in three aspects, the biodiversity (Shannon–Wiener index), evenness (Pielou index) and richness (Margalef index). Except for the periphytic algae community in the Danjiangkou inflow river, which showed significantly higher evenness than the Poyanghu inflow river and the Chaohu inflow river, no significant differences were found in other areas, indicating that most sites’ biotic assessments range from “average” to “good.” Abiotic examination revealed a more substantial difference (Figure 7). More significant difference was found in abiotic assessment. The water quality index (WQI) in the inflow rivers of Dongtinghu and Poyanghu is better than in other areas; these two lakes are naturally connected to the middle Yangtze river, so water and mass exchange between rivers and lakes are key processes that may keep the inflow rivers of Dongtinghu and Poyanghu healthy [14]. The water quality in the Danjiangkou inflow river is second only to the Dongtinghu inflow river and the Poyanghu inflow river, with most sites in these three areas rating “good” on the WQI. The Danjiangkou Reservoir, which delivers water to cities along the middle route of the South-to-North Water Transfer Project (the world’s largest inter-regional water transfer project), is critical for maintaining the reservoir’s water quality [51]. Dianchi Lake, Chaohu Lake, and Taihu Lake frequently experience harmful algal blooms, which are linked to elevated TP concentrations in these waterbodies [52]. The WQI showed low water quality in the inflow river of Dianchi Lake, Chaohu Lake, and Taihu Lake, and the evaluation result of most locations was “average,” as in the previous study.
Our research uses the Random Forest method to measure ecosystem health using biotic and abiotic indexes. This technique may consider a variety of variables while avoiding overfitting, and it has been used to predict and evaluate unknown components that were difficult to forecast using earlier statistical methods [53]. The results showed that the majority of sites in inflow rivers were in “good” condition, with the Danjiangkou inflow river (which has poorer water quality than the Dongtinghu inflow river or the Poyanghu inflow river) having the highest excellent and good rate and the Poyanghu inflow river (which has the best water quality of all inflow rivers of the six lakes) having the second last excellent and good rate, which differs from the biotic or abiotic assessment result. The measurement of water quality and ecological health are both critical components of the water ecosystem health assessment. Aquatic organisms recycle substances and transfer energy through the water environment. Changes in the organization of aquatic organism communities are directly linked to changes in water quality indices. As a result, we can only undertake a fuller health evaluation of the aquatic environment if we combine the water quality and ecological assessments [54,55].
5. Conclusions
- (1)
- Periphytic algae from eight phyla and 126 taxa were discovered in the inflow rivers of six lakes in the Yangtze river basin, with Cyanobacteria and Bacilariophyta dominating. The driving environmental elements influencing the periphytic algae community structure are TN and TP. The lowest optimum TN concentration for periphytic algae was found to be 1.835 mg/L, with Chlorococcum being the negative responding species and Cyclotella being the positive responding species. The lowest optimum TP concentration for periphytic algae is19.5 μg/L; negative responding species include Amphora and Achnanthidium, while positive responding species include Cryptomonas.
- (2)
- For the periphytic algae density in the inflow river of six lakes, the median from high to low were the Dianchi inflow river, the Chaohu inflow river, the Poyanghu inflow river, the Danjiangkou inflow river, the Dongtinghu inflow river and the Taihu inflow river. In the Dianchi and Taihu inflow rivers, no driving environmental conditions or enriched species were discovered. Pseudanabaena was abundant in the Chaohu inflow river, and TN and pH were the primary environmental drivers. The Poyanghu inflow river was enriched in Lyngbya, and temperature and DO were the main driving environmental factors. The Navicula and Achnanthidium enriched the Danjiangkou inflow river, and the primary driving environmental elements were TP, TUB, and CODMn. The Dongtinghu inflow river was enriched in Gloeocystis, and the key driving environmental factor was pH.
- (3)
- In terms of biotic evaluation, the Danjiangkou inflow river showed significant higher evenness than the Poyanghu inflow river and the Chaohu inflow river; however, no significant differences were found in other areas. For abiotic assessment, the Dongtinghu inflow river and the Poyanghu inflow river have the best water quality, followed by the Danjiangkou inflow river, while the water quality in other places is relatively poor. Combining the biotic and abiotic assessments by the Random Forest algorithm, the ecosystem health from good to poor were: the Danjiangkou inflow river, the Dongtinghu inflow river, the Taihu inflow river, the Chaohu inflow river, the Poyanghu inflow river, the Dianchi inflow river.
Author Contributions
Conceptualization, Y.H.; Data curation, Y.H.; Formal analysis, Y.H.; Funding acquisition, S.H.; Methodology, Y.H.; Validation, Y.H.; Visualization, Y.H.; Writing—original draft, Y.H.; Writing—review & editing, Y.H., J.Z., J.H. and S.H. All authors have read and agreed to the published version of the manuscript.
Funding
This research was funded by National Key research and development Program of China, grant number 2021YFC3200103.
Institutional Review Board Statement
Not applicable.
Informed Consent Statement
Not applicable.
Data Availability Statement
Not applicable.
Conflicts of Interest
The authors declare no conflict of interest.
References
- Azim, M.E.; Beveridge, M.C.M.; Van Dam, A.A.; Verdegem, M.C.J. Periphyton and Aquatic Production: An Introduction; CABI Publishing: Oxfordshire, UK, 2005. [Google Scholar]
- Potapova, M.; Charles, D.F. Distribution of benthic diatoms in US rivers in relation to conductivity and ionic composition. Freshw. Biol. 2003, 48, 1311–1328. [Google Scholar] [CrossRef] [Green Version]
- Stevenson, J.; Graham, L. Ecological assessments with algae: A review and synthesis. J. Phycol. 2014, 50, 437–461. [Google Scholar] [CrossRef] [PubMed]
- Gillett, N.D.; Pan, Y.; Asarian, J.E.; Kann, J. Spatial and temporal variability of river periphyton below a hypereutrophic lake and a series of dams. Sci. Total Environ. 2016, 541, 1382–1392. [Google Scholar] [CrossRef] [PubMed]
- Todeschini, S.; Papiri, S.; Sconfietti, R. Impact assessment of urban wet-weather sewer discharges on the Vernavola river (Northern Italy). Civ. Eng. Environ. Syst. 2011, 28, 209–229. [Google Scholar] [CrossRef]
- Panagiotis, T. The effects of urbanisation on ecological interactions. Curr. Opin. Insect Sci. 2022, 52, 100922. [Google Scholar] [CrossRef]
- Su, J.; Kang, D.; Xiang, W.; Wu, C. Periphyton biofilm development and its role in nutrient cycling in paddy microcosms. J. Soils Sediments 2017, 17, 810–819. [Google Scholar] [CrossRef]
- Huang, Y.; Wen, H.; Cai, J.; Cai, M.; Sun, J. Key Aquatic Environmental Factors Affecting Ecosystem Health of Streams in the Dianchi Lake Watershed, China. Procedia Environ. Sci. 2010, 2, 868–880. [Google Scholar] [CrossRef] [Green Version]
- Chen, X.; Wang, X.; Li, Y.; Yao, Y.; Zhang, Y.; Jiang, Y.; Lei, X.; Liu, H.; Wu, N.; Fohrer, N. Succession and Driving Factors of Periphytic Community in the Middle Route Project of South-to-North Water Division (Henan, China). Int. J. Environ. Res. Public Health 2022, 19, 4089. [Google Scholar] [CrossRef]
- Zhu, Y.; Mi, W.; Tu, X.; Song, G.; Bi, Y. Environmental Factors Drive Periphytic Algal Community Assembly in the Largest Long-Distance Water Diversion Channel. Water 2022, 14, 914. [Google Scholar] [CrossRef]
- Qian, K.; Dokulil, M.; Lei, W.; Chen, Y. The effects of water-level changes on periphytic algal assemblages in Poyang Lake. Fundam. Appl. Limnol. 2021, 194, 311–320. [Google Scholar] [CrossRef]
- Song, Y.; Xue, Y.; Gao, Y.; Jin, Y. Distribution of epipelic algae and related environmental nutrients in Taihu Lake, revealed by HPLC analysis. Mar. Freshw. Res. 2019, 70, 849–856. [Google Scholar] [CrossRef]
- Jin, X.; Lu, S.; Hu, X.; Jiang, X.; Wu, F. Control concept and countermeasures for shallow lakes’ eutrophication in China. Front. Environ. Sci. Eng. China 2008, 2, 257–266. [Google Scholar] [CrossRef]
- Yang, G.; Zhang, Q.; Wan, R.; Lai, X.; Jiang, X.; Li, L.; Dai, H.; Lei, G.; Chen, J.; Lu, Y. Lake hydrology, water quality and ecology impacts of altered river–lake interactions: Advances in research on the middle Yangtze river. Hydrol. Res. 2016, 47 (Suppl. S1), 1–7. [Google Scholar] [CrossRef]
- Zhang, L.; Yin, W.; Wang, C.; Zhang, A.; Zhang, H.; Zhang, T.; Ju, F. Untangling Microbiota Diversity and Assembly Patterns in the World’s Largest Water Diversion Canal. Water Res. 2021, 204, 117617. [Google Scholar] [CrossRef]
- Peck, D.V.; Herlihy, A.T.; Hill, B.H.; Hughes, R.M.; Kaufmann, P.R. Environmental Monitoring and Assessment Program: Surface Waters. In Western Pilot Study: Field Operations Manual for Wadeable Streams; US Environmental Protection Agency, Office of Research and Development: Washington, DC, USA, 2006. [Google Scholar]
- Hu, H.J.; Wei, Y.X. The Freshwater Algae of China: Systematics, Taxonomy and Ecology; Beijing Science Press: Beijing, China, 2006. [Google Scholar]
- Lee, R.E. Phycology; Cambridge University Press: Cambridge, UK, 2008. [Google Scholar]
- Wehr, J.D.; Sheath, R.G.; Kociolek, J.P. Freshwater Algae of North America: Ecology and Classification; Academic Press: New York, NY, USA, 2015. [Google Scholar]
- Jun, S.; Dongyan, L.; Shuben, Q. Study on phytoplankton biomass Ⅰ. Phytoplankton measurement biomass from cell volume or plasma volume. Acta Oceanol. Sin. 1999, 21, 75–85. [Google Scholar]
- Administration, S.E.P. Methods for Monitoring and Analysis of Water and Wastewater, 4th ed.; China Environmental Science Press: Beijing, China, 2002. [Google Scholar]
- Ren, L.; Zhang, Z.; Zeng, X.; Ma, Y.; Zeng, Y.; Zhou, C. Community Structure of Zooplankton and Water Quality Assessment of Jialing River in Nan Chong. Procedia Environ. Sci. 2011, 10, 1321–1326. [Google Scholar] [CrossRef] [Green Version]
- McNaughton, S.J. Relationships among functional properties of Californian grassland. Nature 1967, 216, 168–169. [Google Scholar] [CrossRef]
- Pesce, S.F.; Wunderlin, D.A. Use of water quality indices to verify the impact of Córdoba City (Argentina) on Suquía River. Water Res. 2000, 34, 2915–2926. [Google Scholar] [CrossRef]
- Dixon, P. VEGAN, a package of R functions for community ecology. J. Veg. Sci. 2003, 14, 927–930. [Google Scholar] [CrossRef]
- Baker, M.; King, R.; Kahle, D. TITAN2: Threshold Indicator Taxa Analysis; R Package Version 2; 2015; Available online: https://cran.r-project.org/web/packages/TITAN2/index.html (accessed on 11 May 2022).
- Baker, M.E.; King, R.S. A new method for detecting and interpreting biodiversity and ecological community thresholds. Methods Ecol. Evol. 2010, 1, 25–37. [Google Scholar] [CrossRef]
- Wu, T.H.; Liu, J.S.; Deng, J.M. Community structure of phytoplankton and bioassessment of water quality in a large water-carrying lake, Lake Hongze. J. Lake Sci. 2019, 31, 440. [Google Scholar]
- Li, D.-W.; Kendrick, B. A year-round study on functional relationships of airborne fungi with meteorological factors. Int. J. Biometeorol. 1995, 39, 74–80. [Google Scholar] [CrossRef] [PubMed]
- Legendre, P.; Gallagher, E.D. Ecologically meaningful transformations for ordination of species data. Oecologia 2001, 129, 271–280. [Google Scholar] [PubMed]
- Thompson, C.G.; Kim, R.S.; Aloe, A.M.; Becker, B.J. Extracting the variance inflation factor and other multicollinearity diagnostics from typical regression results. Basic Appl. Soc. Psychol. 2017, 39, 81–90. [Google Scholar]
- Strong, W.L. Biased richness and evenness relationships within Shannon—Wiener index values. Ecol. Indic. 2016, 67, 703–713. [Google Scholar]
- Margalef, R. Information theory in ecology. Gen. Syst. 1958, 3, 36–71. [Google Scholar]
- Jost, L. The Relation between Evenness and Diversity. Diversity 2010, 2, 207–232. [Google Scholar] [CrossRef]
- Liu, Y.; Fu, J.; Cheng, D.; Lin, Q.; Su, P.; Wang, X.; Sun, H. The spatial pattern of periphytic algae communities and its corresponding mechanism to environmental variables in the Weihe River Basin, China. Hydrol. Res. 2020, 51, 1036–1047. [Google Scholar]
- Carapunarla, L.; Baumgartner, D.; Rodrigues, L. Community structure of periphytic algae in a floodplain lake: A long-term study. Acta Sci. Biol. Sci. 2014, 36, 147–154. [Google Scholar] [CrossRef]
- Schindler, D.W.; Hecky, R.E.; Findlay, D.L.; Stainton, M.P.; Parker, B.R.; Paterson, M.J.; Kasian, S. Eutrophication of lakes cannot be controlled by reducing nitrogen input: Results of a 37-year whole-ecosystem experiment. Proc. Natl. Acad. Sci. USA 2008, 105, 11254–11258. [Google Scholar] [CrossRef] [Green Version]
- Zhu, M.; Yu, G.; Song, G.; Chang, J.; Wan, C.; Li, R. Molecular specificity and detection for Pseudanabaena (cyanobacteria) species based on rbcLX sequences. Biochem. Syst. Ecol. 2015, 60, 110–115. [Google Scholar] [CrossRef]
- Huang, J.; Zhang, Y.; Huang, Q.; Gao, J. When and where to reduce nutrient for controlling harmful algal blooms in large eutrophic lake Chaohu, China? Ecol. Indic. 2018, 89, 808–817. [Google Scholar] [CrossRef]
- Zhu, J.; Lei, X.; Quan, J.; Yue, X. Algae Growth Distribution and Key Prevention and Control Positions for the Middle Route of the South-to-North Water Diversion Project. Water 2019, 11, 1851. [Google Scholar] [CrossRef] [Green Version]
- Agrawal, S.C. Factors controlling induction of reproduction in algae-review: The text. Folia Microbiol. 2012, 57, 387–407. [Google Scholar] [CrossRef] [PubMed]
- Engene, N.; Tronholm, A.; Paul, V.J. Uncovering cryptic diversity of Lyngbya: The new tropical marine cyanobacterial genus Dapis (Oscillatoriales). J. Phycol. 2018, 54, 435–446. [Google Scholar] [CrossRef] [PubMed]
- Zhao, C.S.; Shao, N.F.; Yang, S.T.; Ren, H.; Ge, Y.R.; Feng, P.; Dong, B.E.; Zhao, Y. Predicting cyanobacteria bloom occurrence in lakes and reservoirs before blooms occur. Sci. Total Environ. 2019, 670, 837–848. [Google Scholar] [CrossRef]
- Smith, D.W.; Piedrahita, R.H. The relation between phytoplankton and dissolved oxygen in fish ponds. Aquaculture 1988, 68, 249–265. [Google Scholar] [CrossRef]
- Duong, T.T.; Nguyen, H.Y.; Le, T.P.Q.; Nguyen, T.K.; Tran, T.T.H.; Le, N.D.; Dang, D.K.; Vu, T.N.; Panizzo, V. Transitions in diatom assemblages and pigments through dry and wet season conditions in the Red River, Hanoi (Vietnam). Plant Ecol. Evol. 2019, 152, 163–177. [Google Scholar] [CrossRef]
- Tedeschi, A.C.; Chow-Fraser, P. Periphytic algal biomass as a bioindicator of phosphorus concentrations in agricultural headwater streams of southern Ontario. J. Great Lakes Res. 2021, 47, 1702–1709. [Google Scholar] [CrossRef]
- Stelzer, R.S.; Lamberti, G.A. Effects of N: P ratio and total nutrient concentration on stream periphyton community structure, biomass, and elemental composition. Limnol. Oceanogr. 2001, 46, 356–367. [Google Scholar] [CrossRef]
- Dodds, W.K.; Smith, V.H.; Lohman, K. Nitrogen and phosphorus relationships to benthic algal biomass in temperate streams. Can. J. Fish. Aquat. Sci. 2002, 59, 865–874. [Google Scholar] [CrossRef] [Green Version]
- Stevenson, R.J.; Rier, S.T.; Riseng, C.M.; Schultz, R.E.; Wiley, M.J. Comparing effects of nutrients on algal biomass in streams in two regions with different disturbance regimes and with applications for developing nutrient criteria. In Advances in Algal Biology: A Commemoration of the Work of Rex Lowe; Springer: Dordrecht, The Netherlands, 2006; pp. 149–165. [Google Scholar]
- Leland, H.V. Distribution of phytobenthos in the Yakima River basin, Washington, in relation to geology, land use and other environmental factors. Can. J. Fish. Aquat. Sci. 1995, 52, 1108–1129. [Google Scholar] [CrossRef]
- Ma, B.; Wu, C.; Ding, F.; Zhou, Z. Predicting basin water quality using source-sink landscape distribution metrics in the Danjiangkou Reservoir of China. Ecol. Indic. 2021, 127, 107697. [Google Scholar] [CrossRef]
- Huang, J.; Zhang, Y.; Arhonditsis, G.B.; Gao, J.; Chen, Q.; Peng, J. The magnitude and drivers of harmful algal blooms in China’s lakes and reservoirs: A national-scale characterization. Water Res. 2020, 181, 115902. [Google Scholar] [CrossRef] [PubMed]
- Woo, S.Y.; Jung, C.G.; Lee, J.W.; Kim, S.J. Evaluation of Watershed Scale Aquatic Ecosystem Health by SWAT Modeling and Random Forest Technique. Sustainability 2019, 11, 3397. [Google Scholar] [CrossRef] [Green Version]
- Alvarez-Mieles, G.; Irvine, K.; Griensven, A.V.; Arias-Hidalgo, M.; Torres, A.; Mynett, A. Relationships between aquatic biotic communities and water quality in a tropical river–wetland system (Ecuador). Environ. Sci. Policy 2013, 34, 115–127. [Google Scholar] [CrossRef]
- Karr, J.R. Defining and assessing ecological integrity: Beyond water quality. Environ. Toxicol. Chem. Int. J. 1993, 12, 1521–1531. [Google Scholar] [CrossRef]
Figure 1.
The location of the sampling sites in inflow rivers of six lakes.

Figure 2.
The cell density and community composition of periphytic algae in inflow rivers of six lakes. (a) Cell density; (b) Community composition. (* p < 0.05, and NS—not significant).
Figure 2.
The cell density and community composition of periphytic algae in inflow rivers of six lakes. (a) Cell density; (b) Community composition. (* p < 0.05, and NS—not significant).


Figure 3.
Comparison of periphytic algae variations based on LEfSe analysis. (a) Cladogram for taxonomic representation of significantly differences among groups. (b) Histogram of the LDA scores for differentially abundant features among groups.
Figure 3.
Comparison of periphytic algae variations based on LEfSe analysis. (a) Cladogram for taxonomic representation of significantly differences among groups. (b) Histogram of the LDA scores for differentially abundant features among groups.


Figure 4.
Canonical correspondence analysis (CCA) showed the relationship of the periphytic algae community and environment variable in each inflow river. (a) Chaohu inflow river; (b) Dianchi inflow river; (c) Danjiangkou inflow river; (d) Dongtinghu inflow river; (e) Poyanghu inflow river; (f) Taihu inflow river.

Figure 5.
CCA and Mantel test showed the relationship of periphytic algae community and environment variable in all inflow river. (a) CCA; (b) Mantel test.
Figure 5.
CCA and Mantel test showed the relationship of periphytic algae community and environment variable in all inflow river. (a) CCA; (b) Mantel test.


Figure 6.
TITAN results showing significant indicator taxa. Circles showed taxa change points which were sized according to magnitudes of response. (a) Indicating species and thresholds of TN; (b) Indicating species and thresholds of TP.
Figure 6.
TITAN results showing significant indicator taxa. Circles showed taxa change points which were sized according to magnitudes of response. (a) Indicating species and thresholds of TN; (b) Indicating species and thresholds of TP.

Figure 7.
The Shannon–Wiener index, Pielou index, Margalef index and WQI of each inflow river. The dotted line indicates the assessment standard of each index. Wilcoxon rank sum test was used to compare different groups; *** indicates p < 0.001, ** indicates p < 0.01, * indicates p < 0.05.
Figure 7.
The Shannon–Wiener index, Pielou index, Margalef index and WQI of each inflow river. The dotted line indicates the assessment standard of each index. Wilcoxon rank sum test was used to compare different groups; *** indicates p < 0.001, ** indicates p < 0.01, * indicates p < 0.05.

Figure 8.
The ecosystem health assessment of each inflow rivers based on random forest algorithm.


Table 1.
Information of sampling sites.
| Sample Sites | Longitude | Latitude | Area | Sample Sites | Longitude | Latitude | Area |
|---|---|---|---|---|---|---|---|
| 1 | 109.4803 | 27.0753 | Dongtinghu inflow river | 51 | 114.29 | 28.73 | Poyanghu inflow river |
| 2 | 110.0222 | 27.1486 | Dongtinghu inflow river | 52 | 114.73 | 29.18 | Poyanghu inflow river |
| 3 | 110.11 | 28.09 | Dongtinghu inflow river | 53 | 114.8094 | 26.6581 | Poyanghu inflow river |
| 4 | 110.44 | 29.13 | Dongtinghu inflow river | 54 | 114.9242 | 25.9953 | Poyanghu inflow river |
| 5 | 110.9115 | 28.7746 | Dongtinghu inflow river | 55 | 115.1299 | 27.2832 | Poyanghu inflow river |
| 6 | 111.0989 | 28.0478 | Dongtinghu inflow river | 56 | 115.4378 | 27.9188 | Poyanghu inflow river |
| 7 | 111.3 | 29.59 | Dongtinghu inflow river | 57 | 115.88 | 28.69 | Poyanghu inflow river |
| 8 | 111.4266 | 27.2074 | Dongtinghu inflow river | 58 | 116.01 | 29.19 | Poyanghu inflow river |
| 9 | 111.64 | 28.98 | Dongtinghu inflow river | 59 | 116.02 | 29.19 | Poyanghu inflow river |
| 10 | 111.88 | 29.59 | Dongtinghu inflow river | 60 | 116.04 | 28.99 | Poyanghu inflow river |
| 11 | 112.1176 | 28.913 | Dongtinghu inflow river | 61 | 116.0439 | 28.7864 | Poyanghu inflow river |
| 12 | 112.18 | 26.54 | Dongtinghu inflow river | 62 | 116.0995 | 28.5081 | Poyanghu inflow river |
| 13 | 112.3867 | 28.6168 | Dongtinghu inflow river | 63 | 116.17 | 28.19 | Poyanghu inflow river |
| 14 | 112.61 | 26.91 | Dongtinghu inflow river | 64 | 116.4305 | 28.7169 | Poyanghu inflow river |
| 15 | 112.77 | 29.46 | Dongtinghu inflow river | 65 | 116.55 | 27.28 | Poyanghu inflow river |
| 16 | 112.8 | 28.57 | Dongtinghu inflow river | 66 | 116.64 | 29.03 | Poyanghu inflow river |
| 17 | 112.93 | 27.33 | Dongtinghu inflow river | 67 | 117.26 | 28.28 | Poyanghu inflow river |
| 18 | 112.95 | 28.17 | Dongtinghu inflow river | 68 | 117.43 | 28.4 | Poyanghu inflow river |
| 19 | 113.03 | 28.88 | Dongtinghu inflow river | 69 | 117.9 | 28.41 | Poyanghu inflow river |
| 20 | 113.05 | 27.85 | Dongtinghu inflow river | 70 | 110.57 | 32.7 | Danjiangkou inflow river |
| 21 | 113.1 | 29.19 | Dongtinghu inflow river | 71 | 110.78 | 32.66 | Danjiangkou inflow river |
| 22 | 102.77 | 24.49 | Dianchi inflow river | 72 | 110.84 | 32.75 | Danjiangkou inflow river |
| 23 | 102.61 | 24.66 | Dianchi inflow river | 73 | 110.89 | 32.63 | Danjiangkou inflow river |
| 24 | 102.69 | 24.69 | Dianchi inflow river | 74 | 110.91 | 32.63 | Danjiangkou inflow river |
| 25 | 102.73 | 24.69 | Dianchi inflow river | 75 | 111 | 33.27 | Danjiangkou inflow river |
| 26 | 102.78 | 24.88 | Dianchi inflow river | 76 | 111.03 | 32.52 | Danjiangkou inflow river |
| 27 | 102.78 | 24.92 | Dianchi inflow river | 77 | 111.06 | 33.56 | Danjiangkou inflow river |
| 28 | 102.74 | 24.95 | Dianchi inflow river | 78 | 111.18 | 33.68 | Danjiangkou inflow river |
| 29 | 102.71 | 24.97 | Dianchi inflow river | 79 | 111.22 | 33.03 | Danjiangkou inflow river |
| 30 | 102.65 | 24.99 | Dianchi inflow river | 80 | 111.22 | 33.08 | Danjiangkou inflow river |
| 31 | 102.67 | 25.01 | Dianchi inflow river | 81 | 111.24 | 32.44 | Danjiangkou inflow river |
| 32 | 102.68 | 25.03 | Dianchi inflow river | 82 | 111.25 | 32.43 | Danjiangkou inflow river |
| 33 | 116.95 | 31.43 | Chaohu inflow river | 83 | 111.48 | 33.04 | Danjiangkou inflow river |
| 34 | 117.19 | 31.66 | Chaohu inflow river | 84 | 111.07 | 32.54 | Danjiangkou inflow river |
| 35 | 117.26 | 31.5 | Chaohu inflow river | 85 | 111.07 | 32.55 | Danjiangkou inflow river |
| 36 | 117.27 | 31.66 | Chaohu inflow river | 86 | 120.02 | 30.88 | Taihu inflow river |
| 37 | 117.32 | 31.75 | Chaohu inflow river | 87 | 120.19 | 30.93 | Taihu inflow river |
| 38 | 117.33 | 31.45 | Chaohu inflow river | 88 | 120.13 | 30.94 | Taihu inflow river |
| 39 | 117.33 | 31.84 | Chaohu inflow river | 89 | 120.34 | 30.94 | Taihu inflow river |
| 40 | 117.35 | 31.54 | Chaohu inflow river | 90 | 119.99 | 31.03 | Taihu inflow river |
| 41 | 117.36 | 31.73 | Chaohu inflow river | 91 | 119.92 | 31.31 | Taihu inflow river |
| 42 | 117.39 | 31.52 | Chaohu inflow river | 92 | 120.01 | 31.45 | Taihu inflow river |
| 43 | 117.4 | 31.8 | Chaohu inflow river | 93 | 120.42 | 31.45 | Taihu inflow river |
| 44 | 117.44 | 31.16 | Chaohu inflow river | 94 | 120.28 | 31.55 | Taihu inflow river |
| 45 | 117.53 | 31.37 | Chaohu inflow river | ||||
| 46 | 117.7405 | 31.7096 | Chaohu inflow river | ||||
| 47 | 117.79 | 31.62 | Chaohu inflow river | ||||
| 48 | 117.79 | 31.68 | Chaohu inflow river | ||||
| 49 | 117.83 | 31.6 | Chaohu inflow river | ||||
| 50 | 117.87 | 31.58 | Chaohu inflow river | ||||
Table 2.
Assessment standard of diversity indexes.
| Assessment Standard | Shannon–Wiener Index | Pielou Index | Margalef Index | WQI |
|---|---|---|---|---|
| poor | 0 | 0 | 0 | (0, 25) |
| fair | (0, 1) | (0, 0.3) | (0, 0.6) | (25, 50) |
| average | (1, 2) | (0.3, 0.5) | (0.6, 1) | (50, 70) |
| good | (2, 3) | (0.5, 0.8) | (1, 1.6) | (70, 90) |
| excellent | (3, +∞) | (0.8, 1) | (1.6, 3) | (90, 100) |
Publisher’s Note: MDPI stays neutral with regard to jurisdictional claims in published maps and institutional affiliations. |
© 2022 by the authors. Licensee MDPI, Basel, Switzerland. This article is an open access article distributed under the terms and conditions of the Creative Commons Attribution (CC BY) license (https://creativecommons.org/licenses/by/4.0/).
Share and Cite
MDPI and ACS Style
Hu, Y.; Zhang, J.; Huang, J.; Hu, S. Environmental Drivers and Aquatic Ecosystem Assessment of Periphytic Algae at Inflow Rivers in Six Lakes over the Yangtze River Basin. Water 2022, 14, 2184. https://doi.org/10.3390/w14142184
AMA Style
Hu Y, Zhang J, Huang J, Hu S. Environmental Drivers and Aquatic Ecosystem Assessment of Periphytic Algae at Inflow Rivers in Six Lakes over the Yangtze River Basin. Water. 2022; 14(14):2184. https://doi.org/10.3390/w14142184
Chicago/Turabian StyleHu, Yuxin, Jing Zhang, Jie Huang, and Sheng Hu. 2022. "Environmental Drivers and Aquatic Ecosystem Assessment of Periphytic Algae at Inflow Rivers in Six Lakes over the Yangtze River Basin" Water 14, no. 14: 2184. https://doi.org/10.3390/w14142184
Note that from the first issue of 2016, this journal uses article numbers instead of page numbers. See further details here.