
Analysis of the Remediation of Coal Tar-Contaminated Groundwater Using Ex Situ Remediation

 ,
,  ,
,  ,
, 
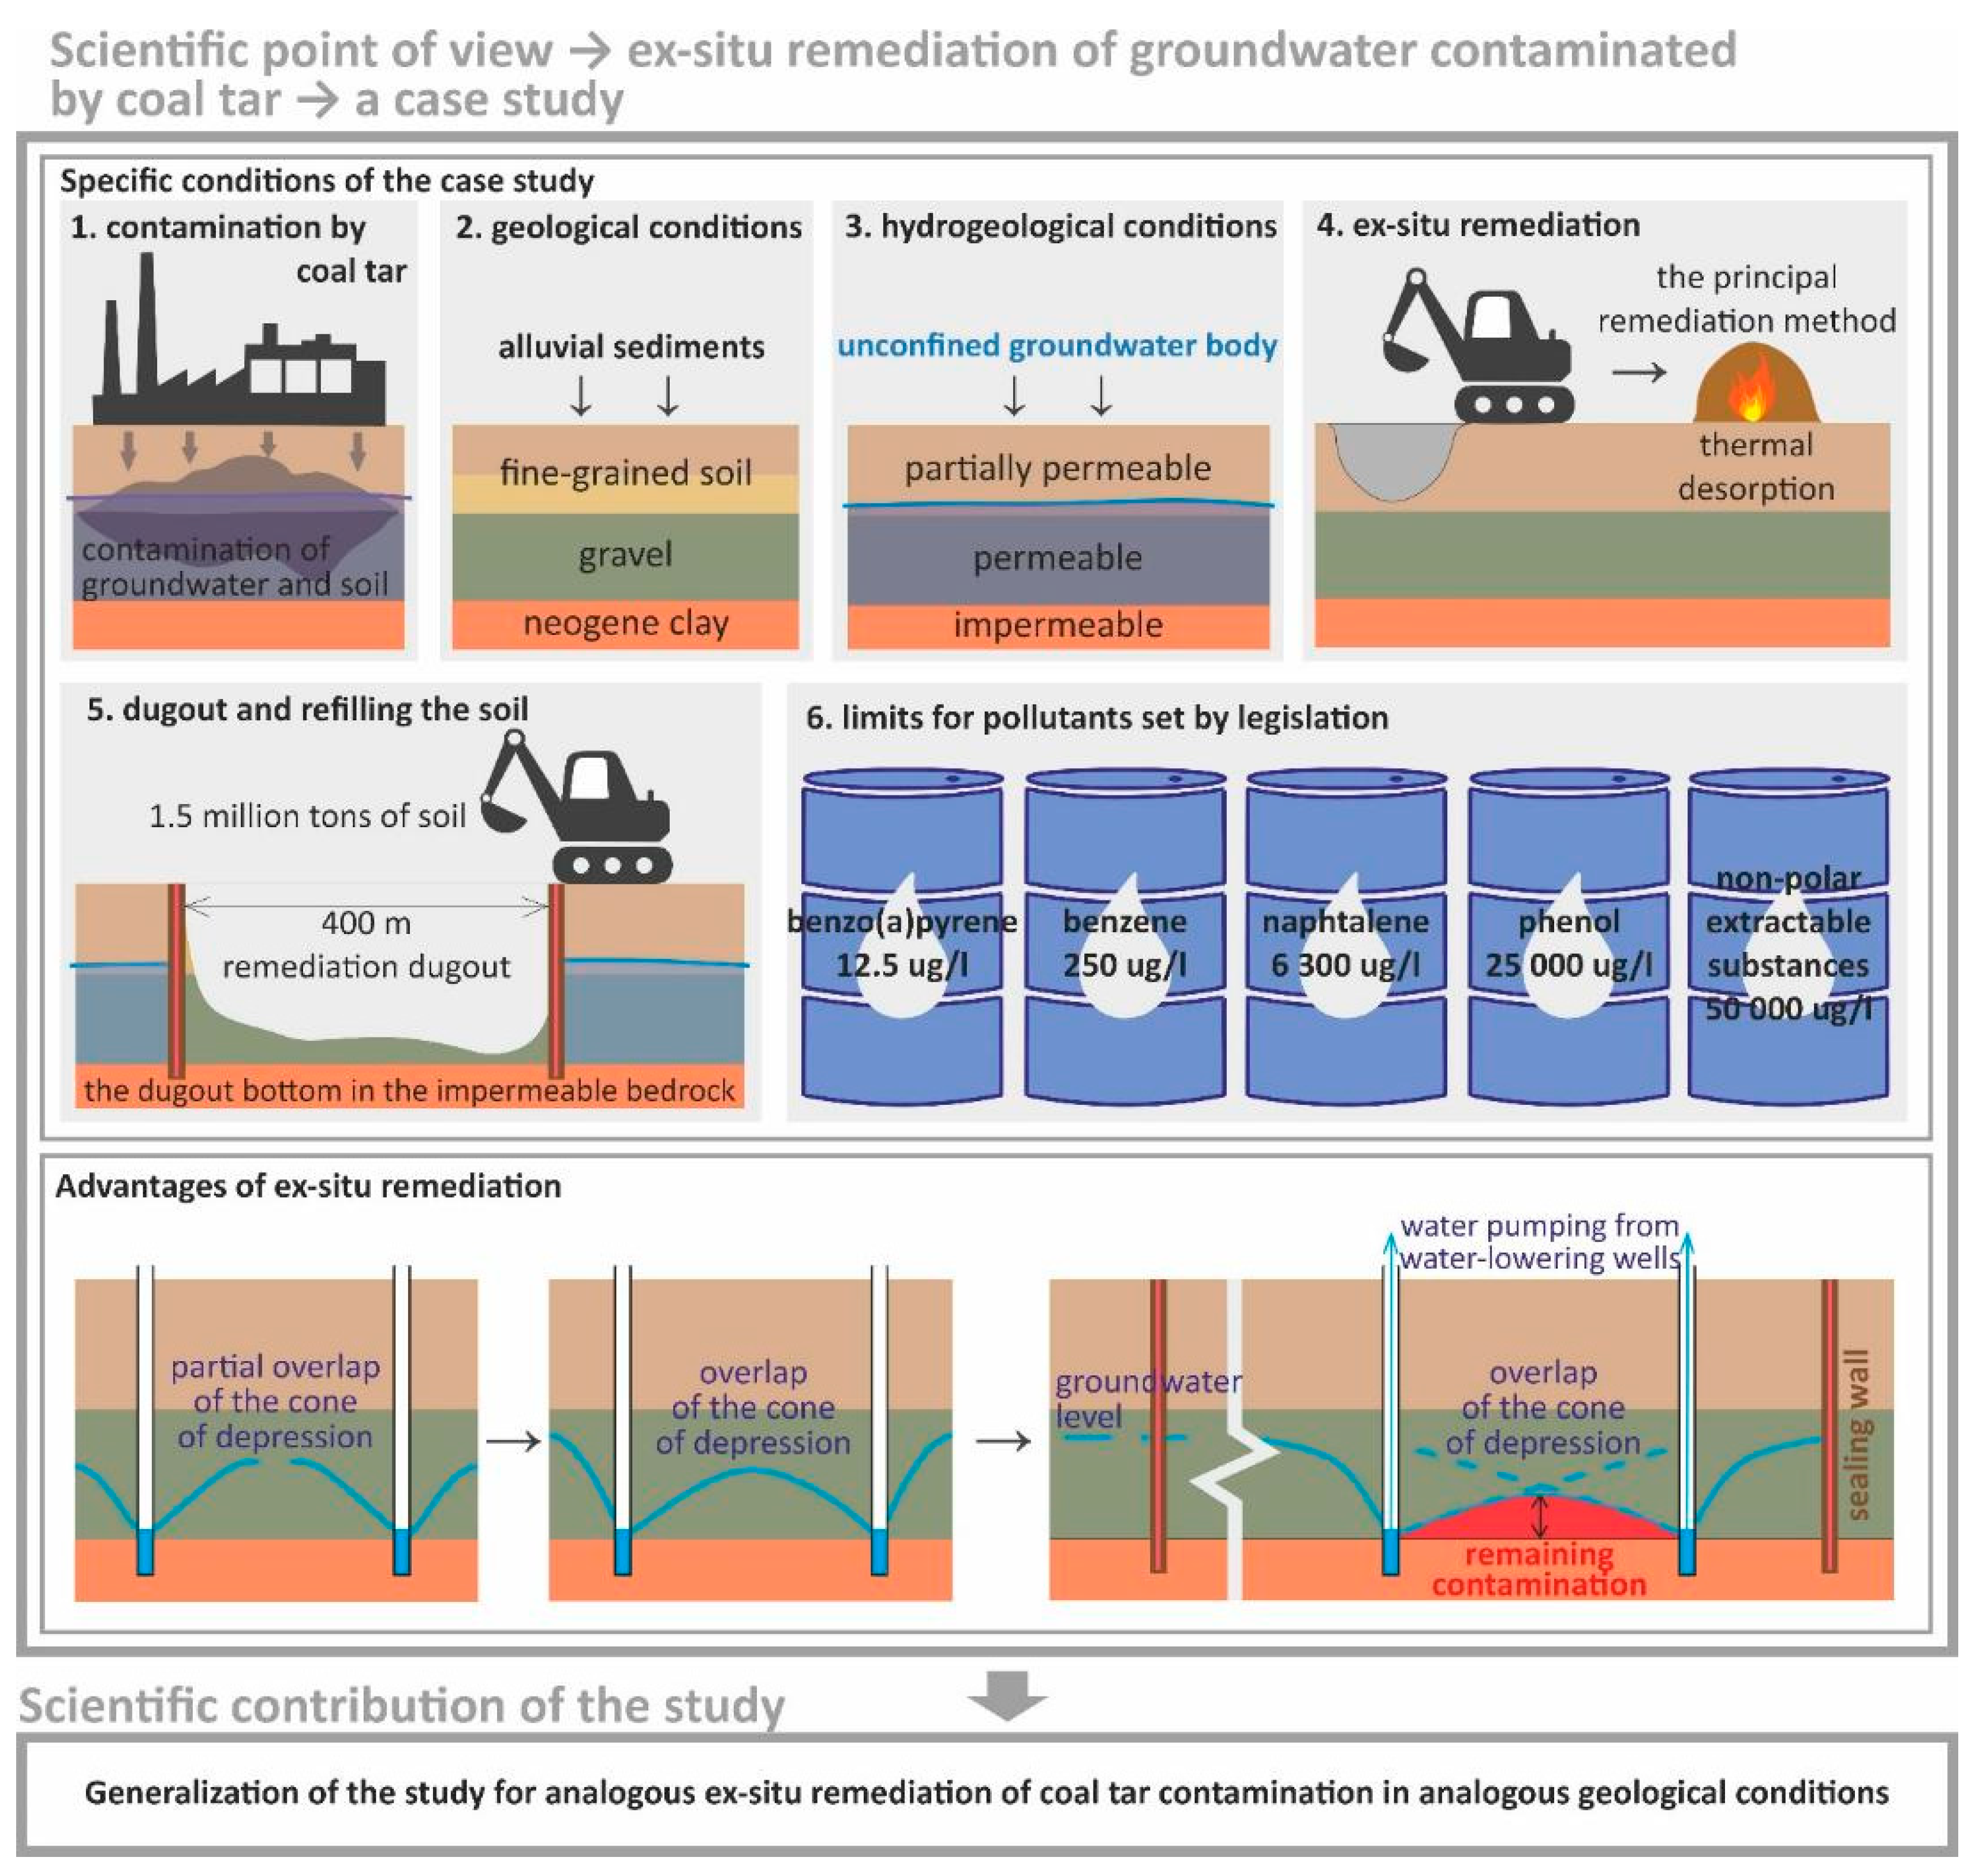
Abstract
:1. Introduction
2. Methods
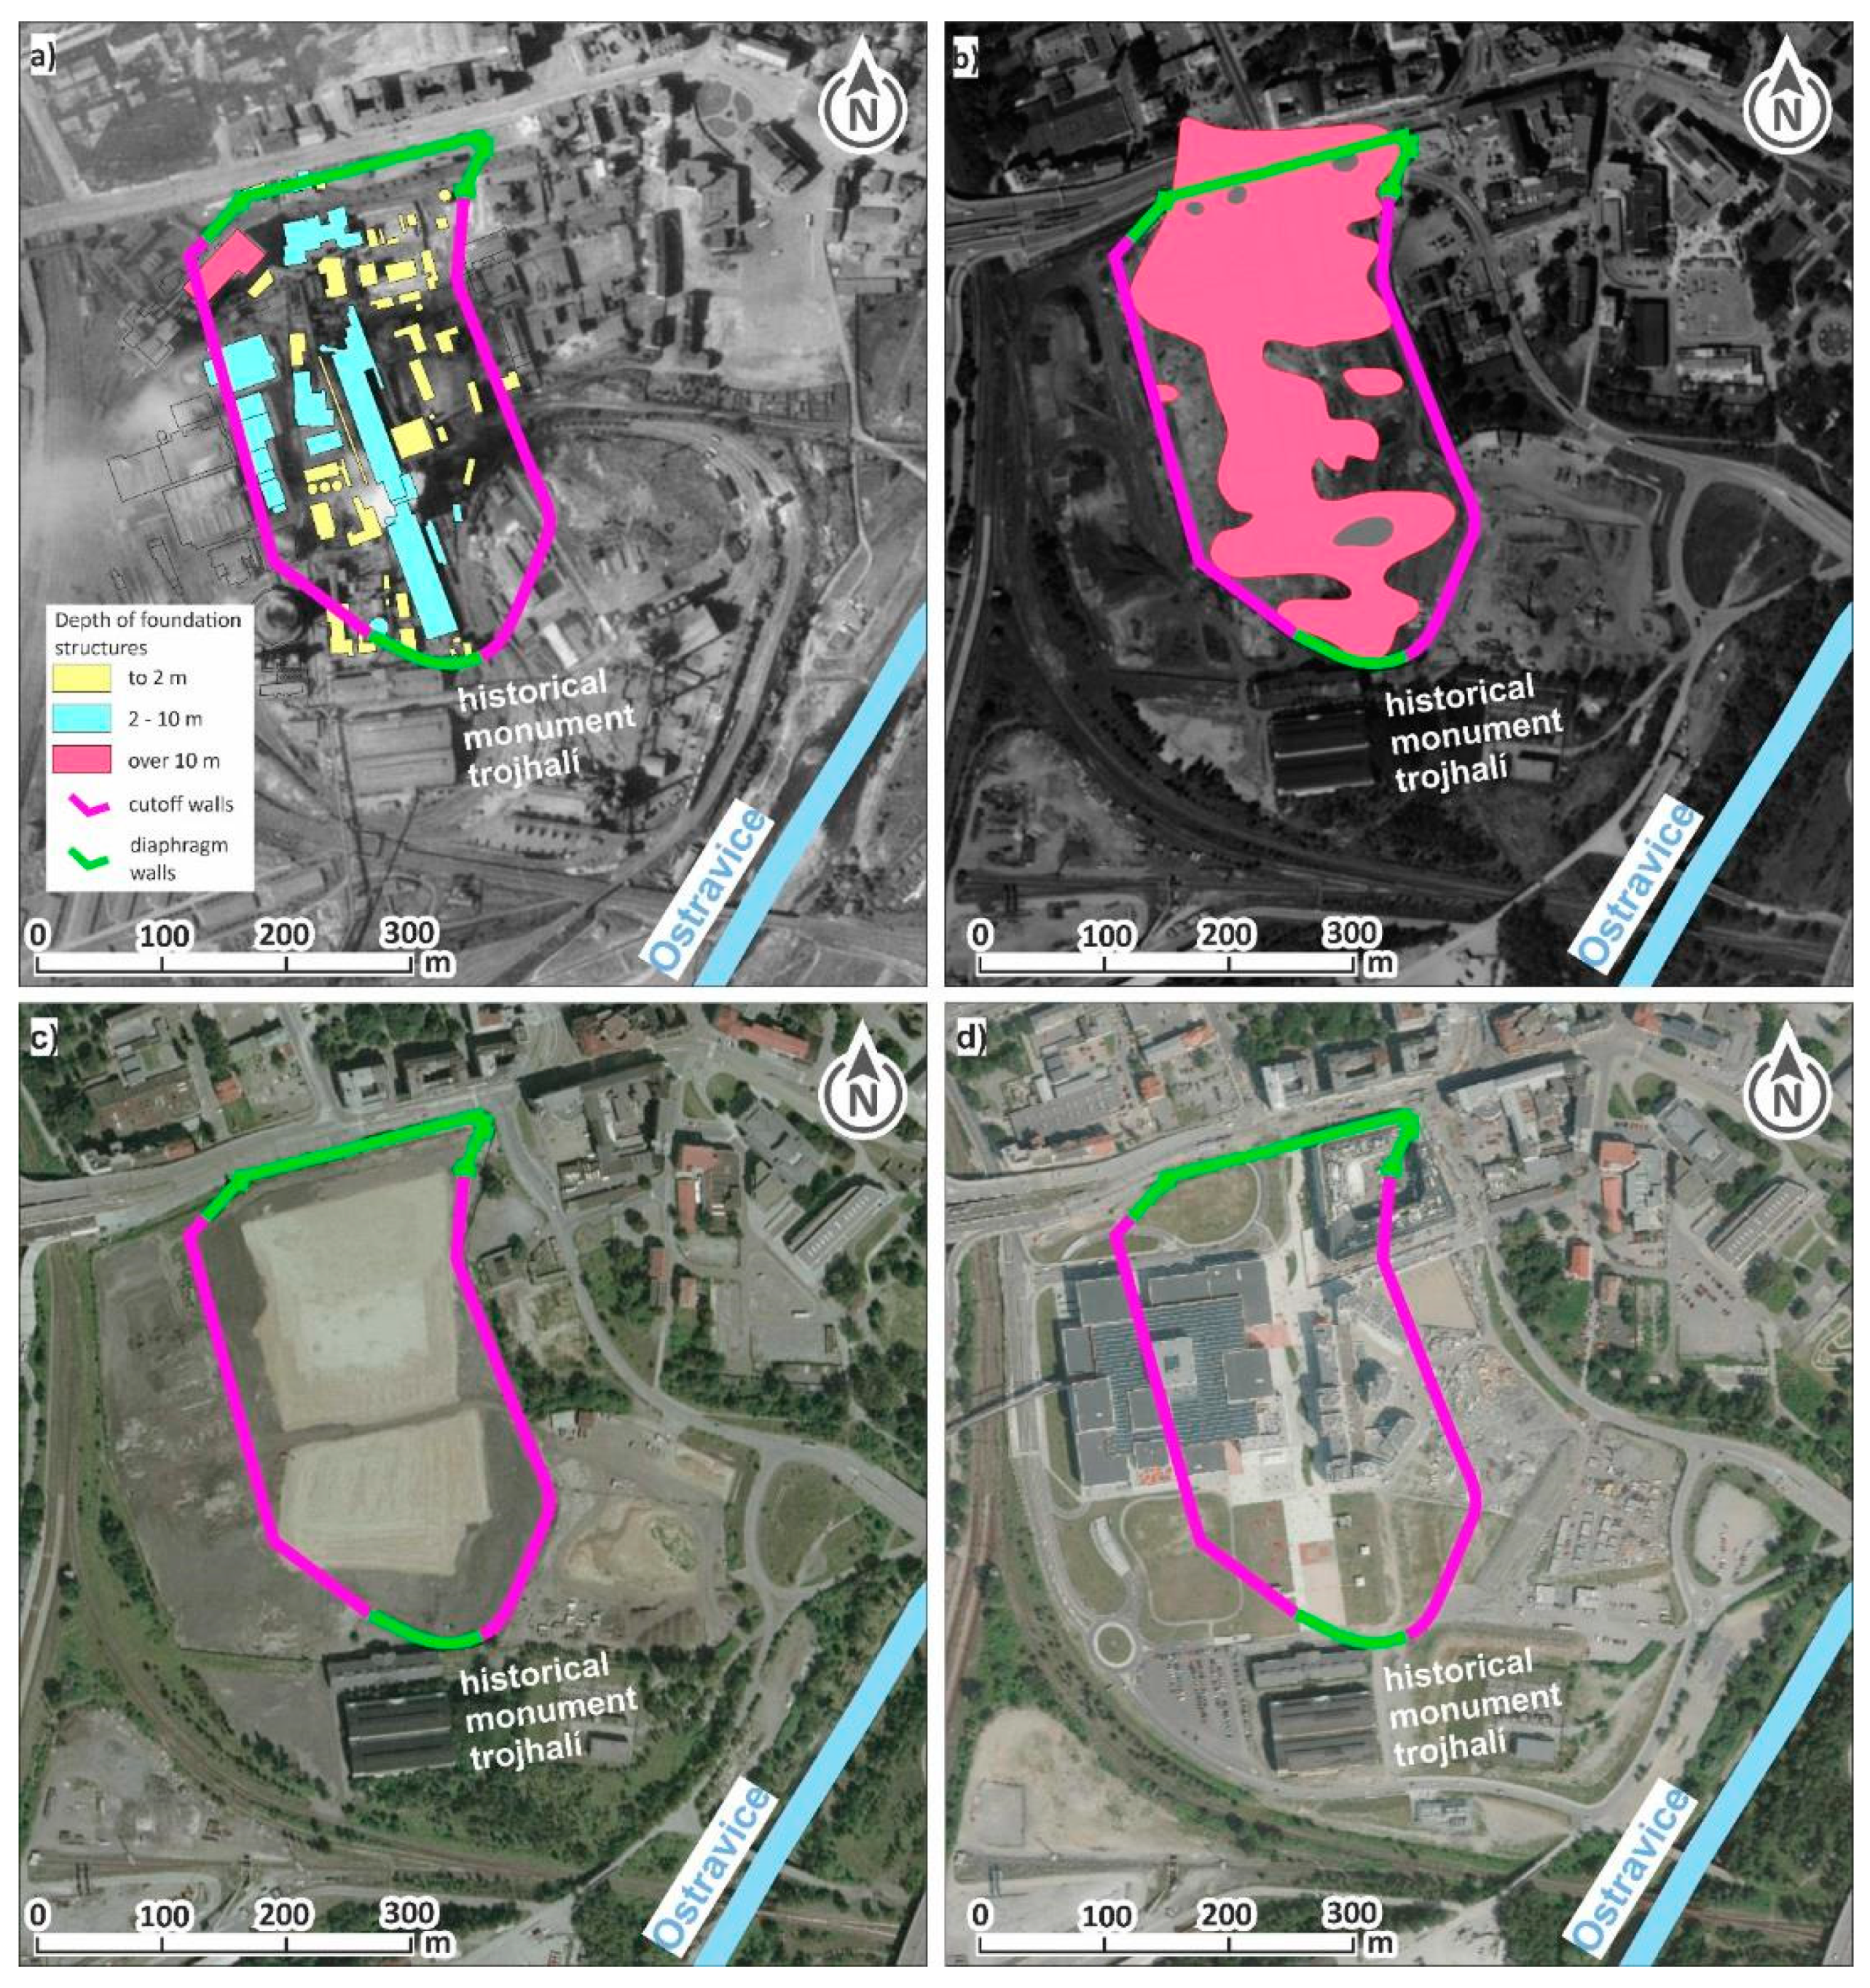
2.1. Study Area
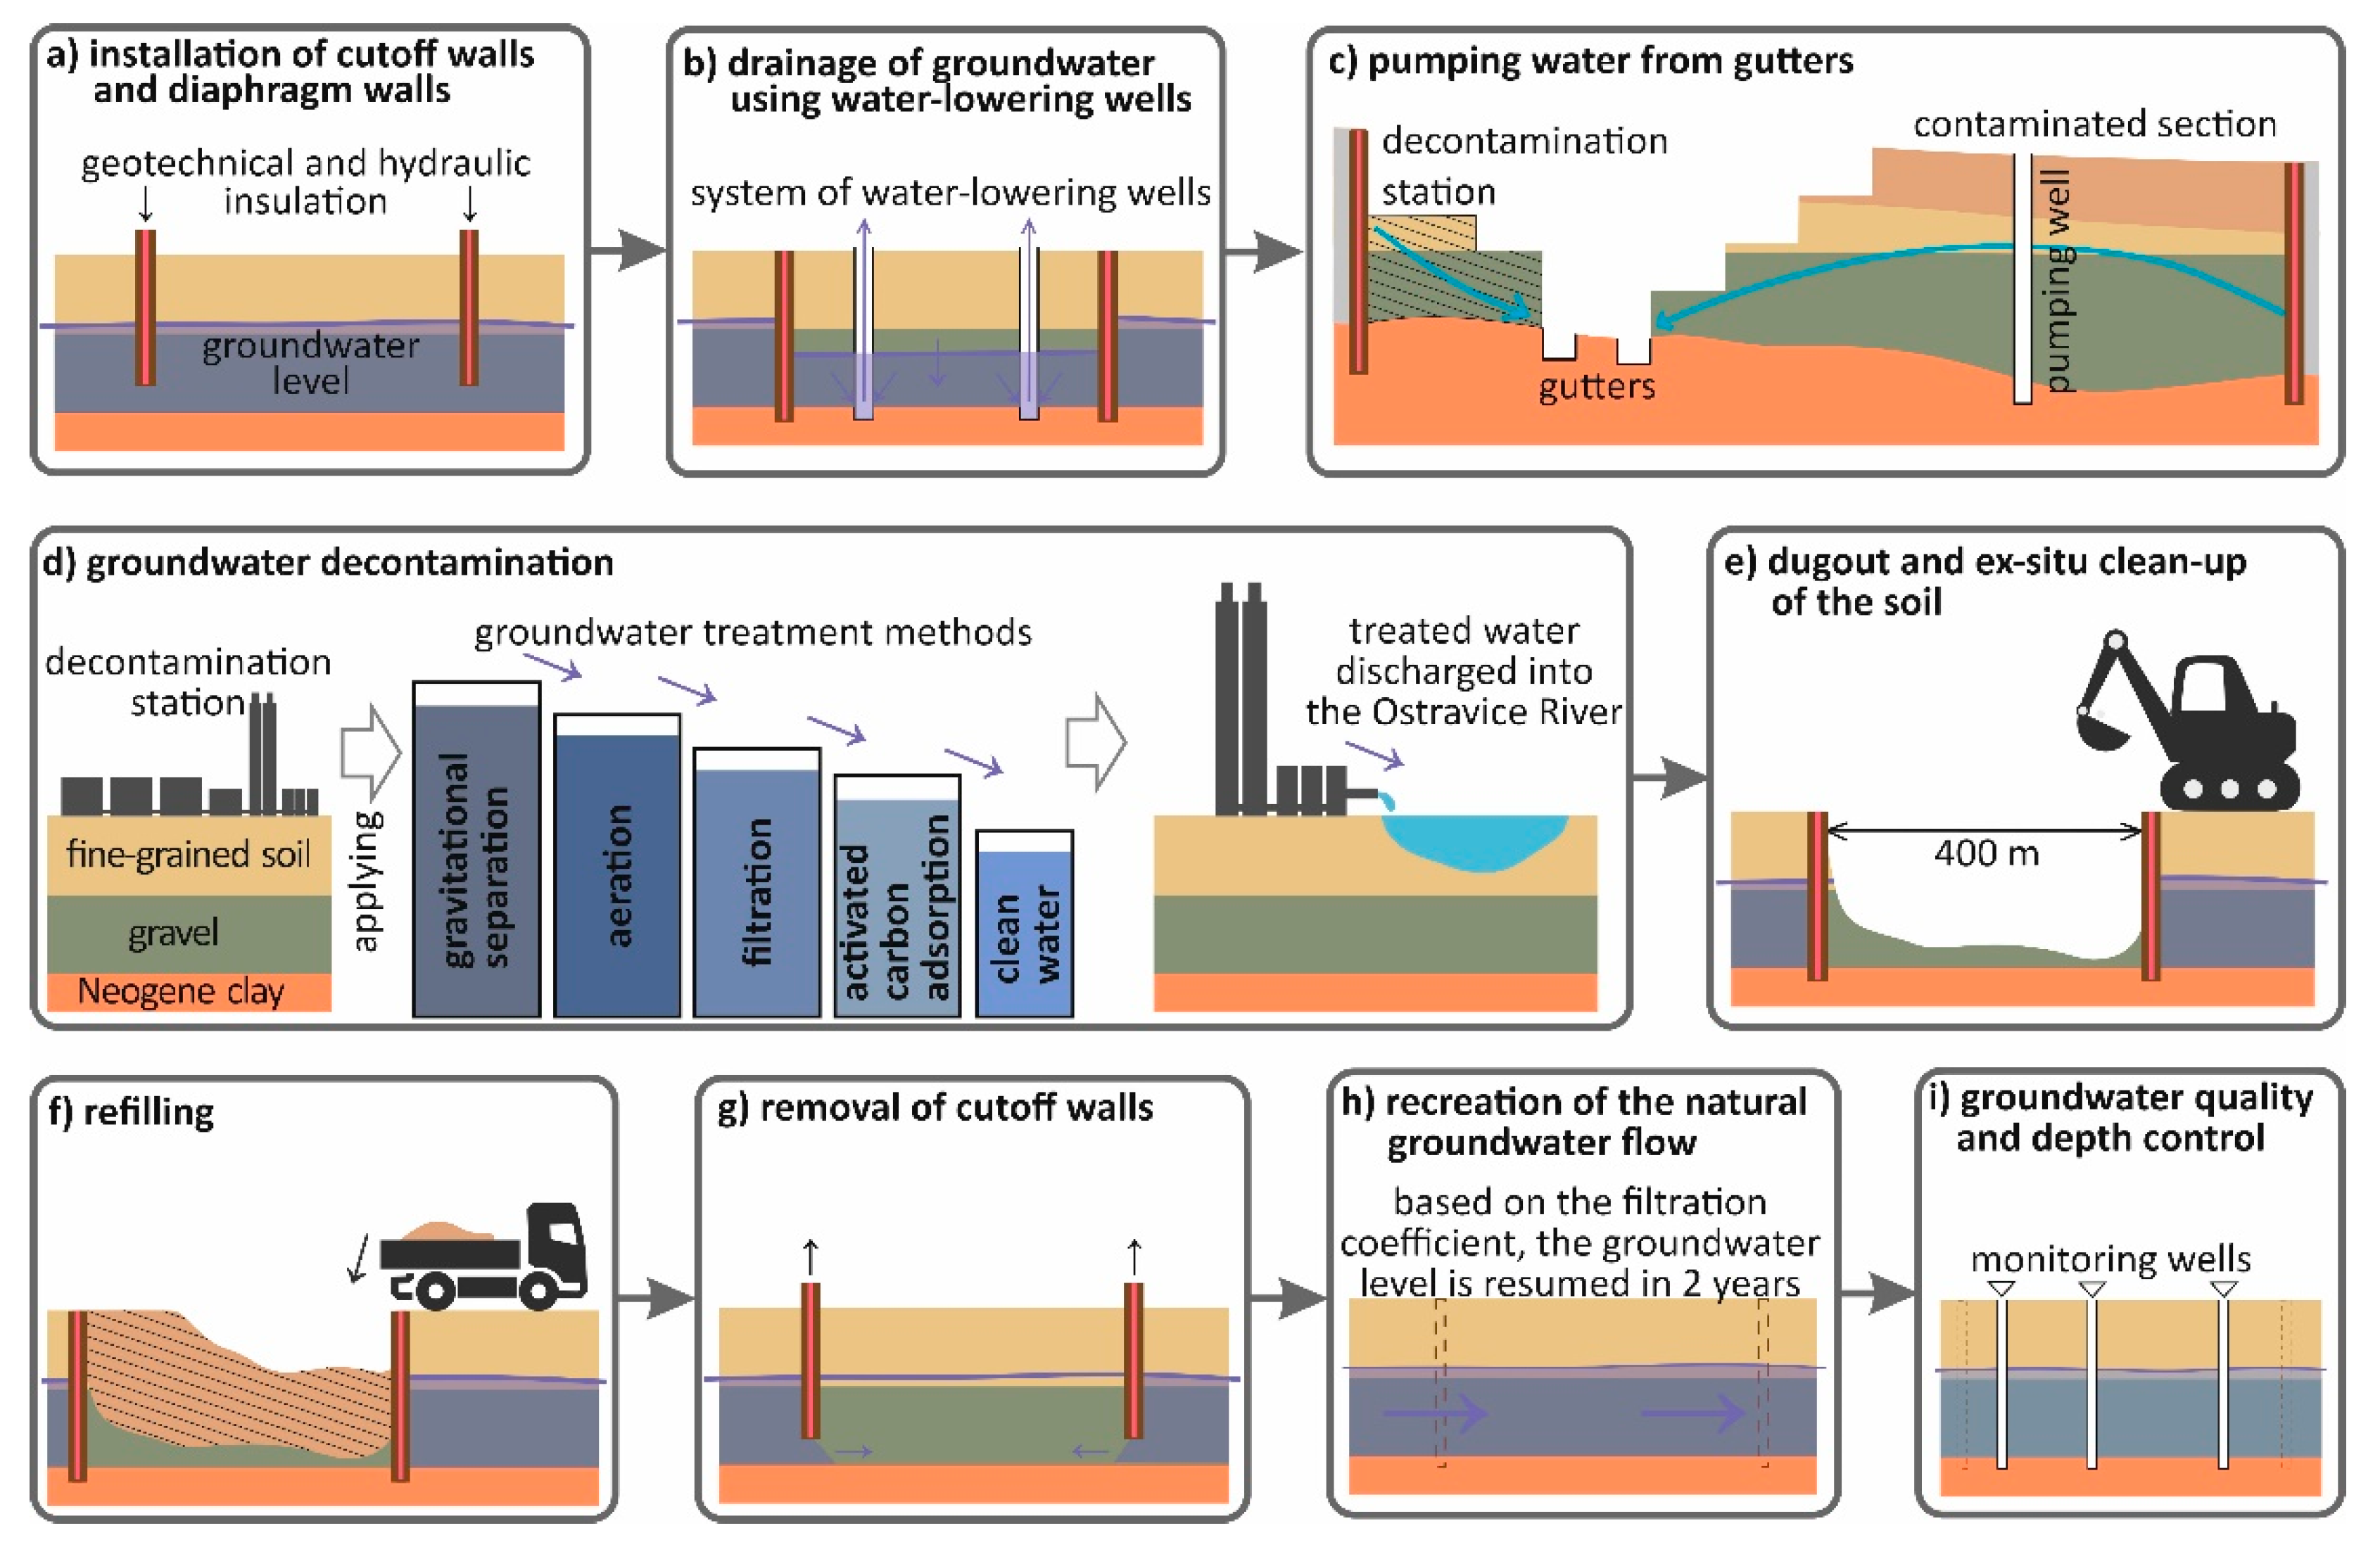
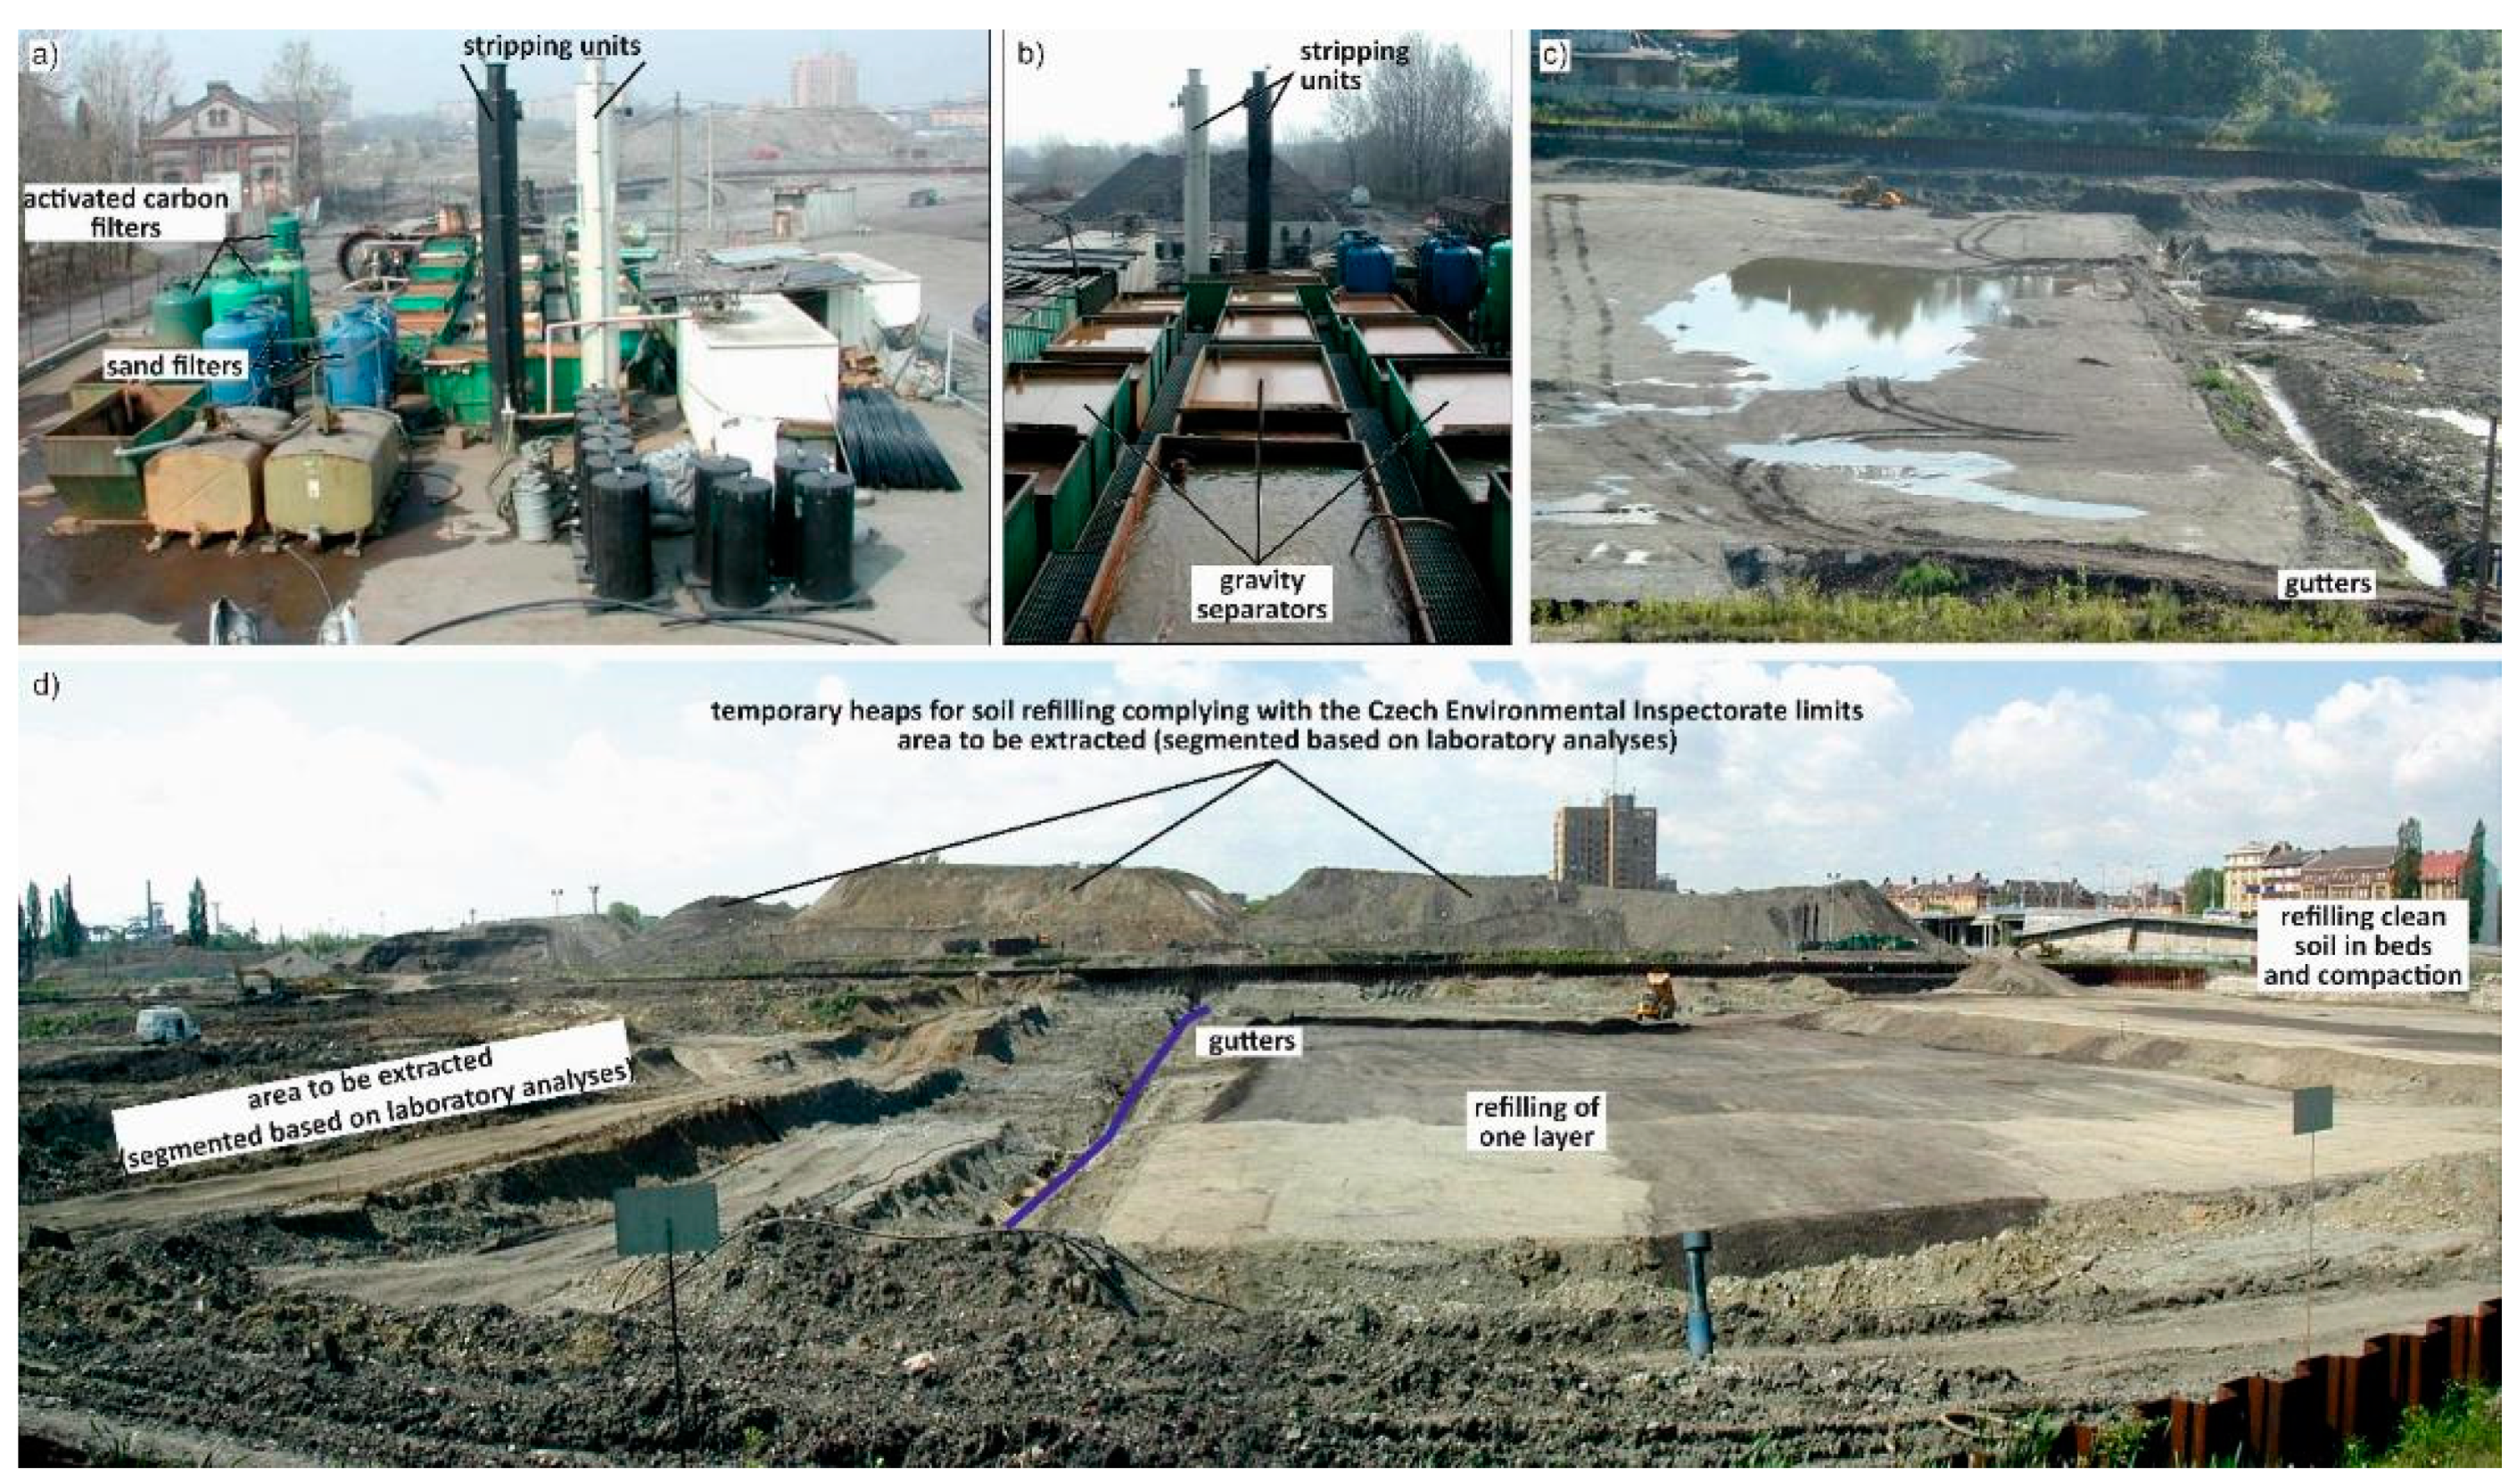
2.2. Groundwater Remediation
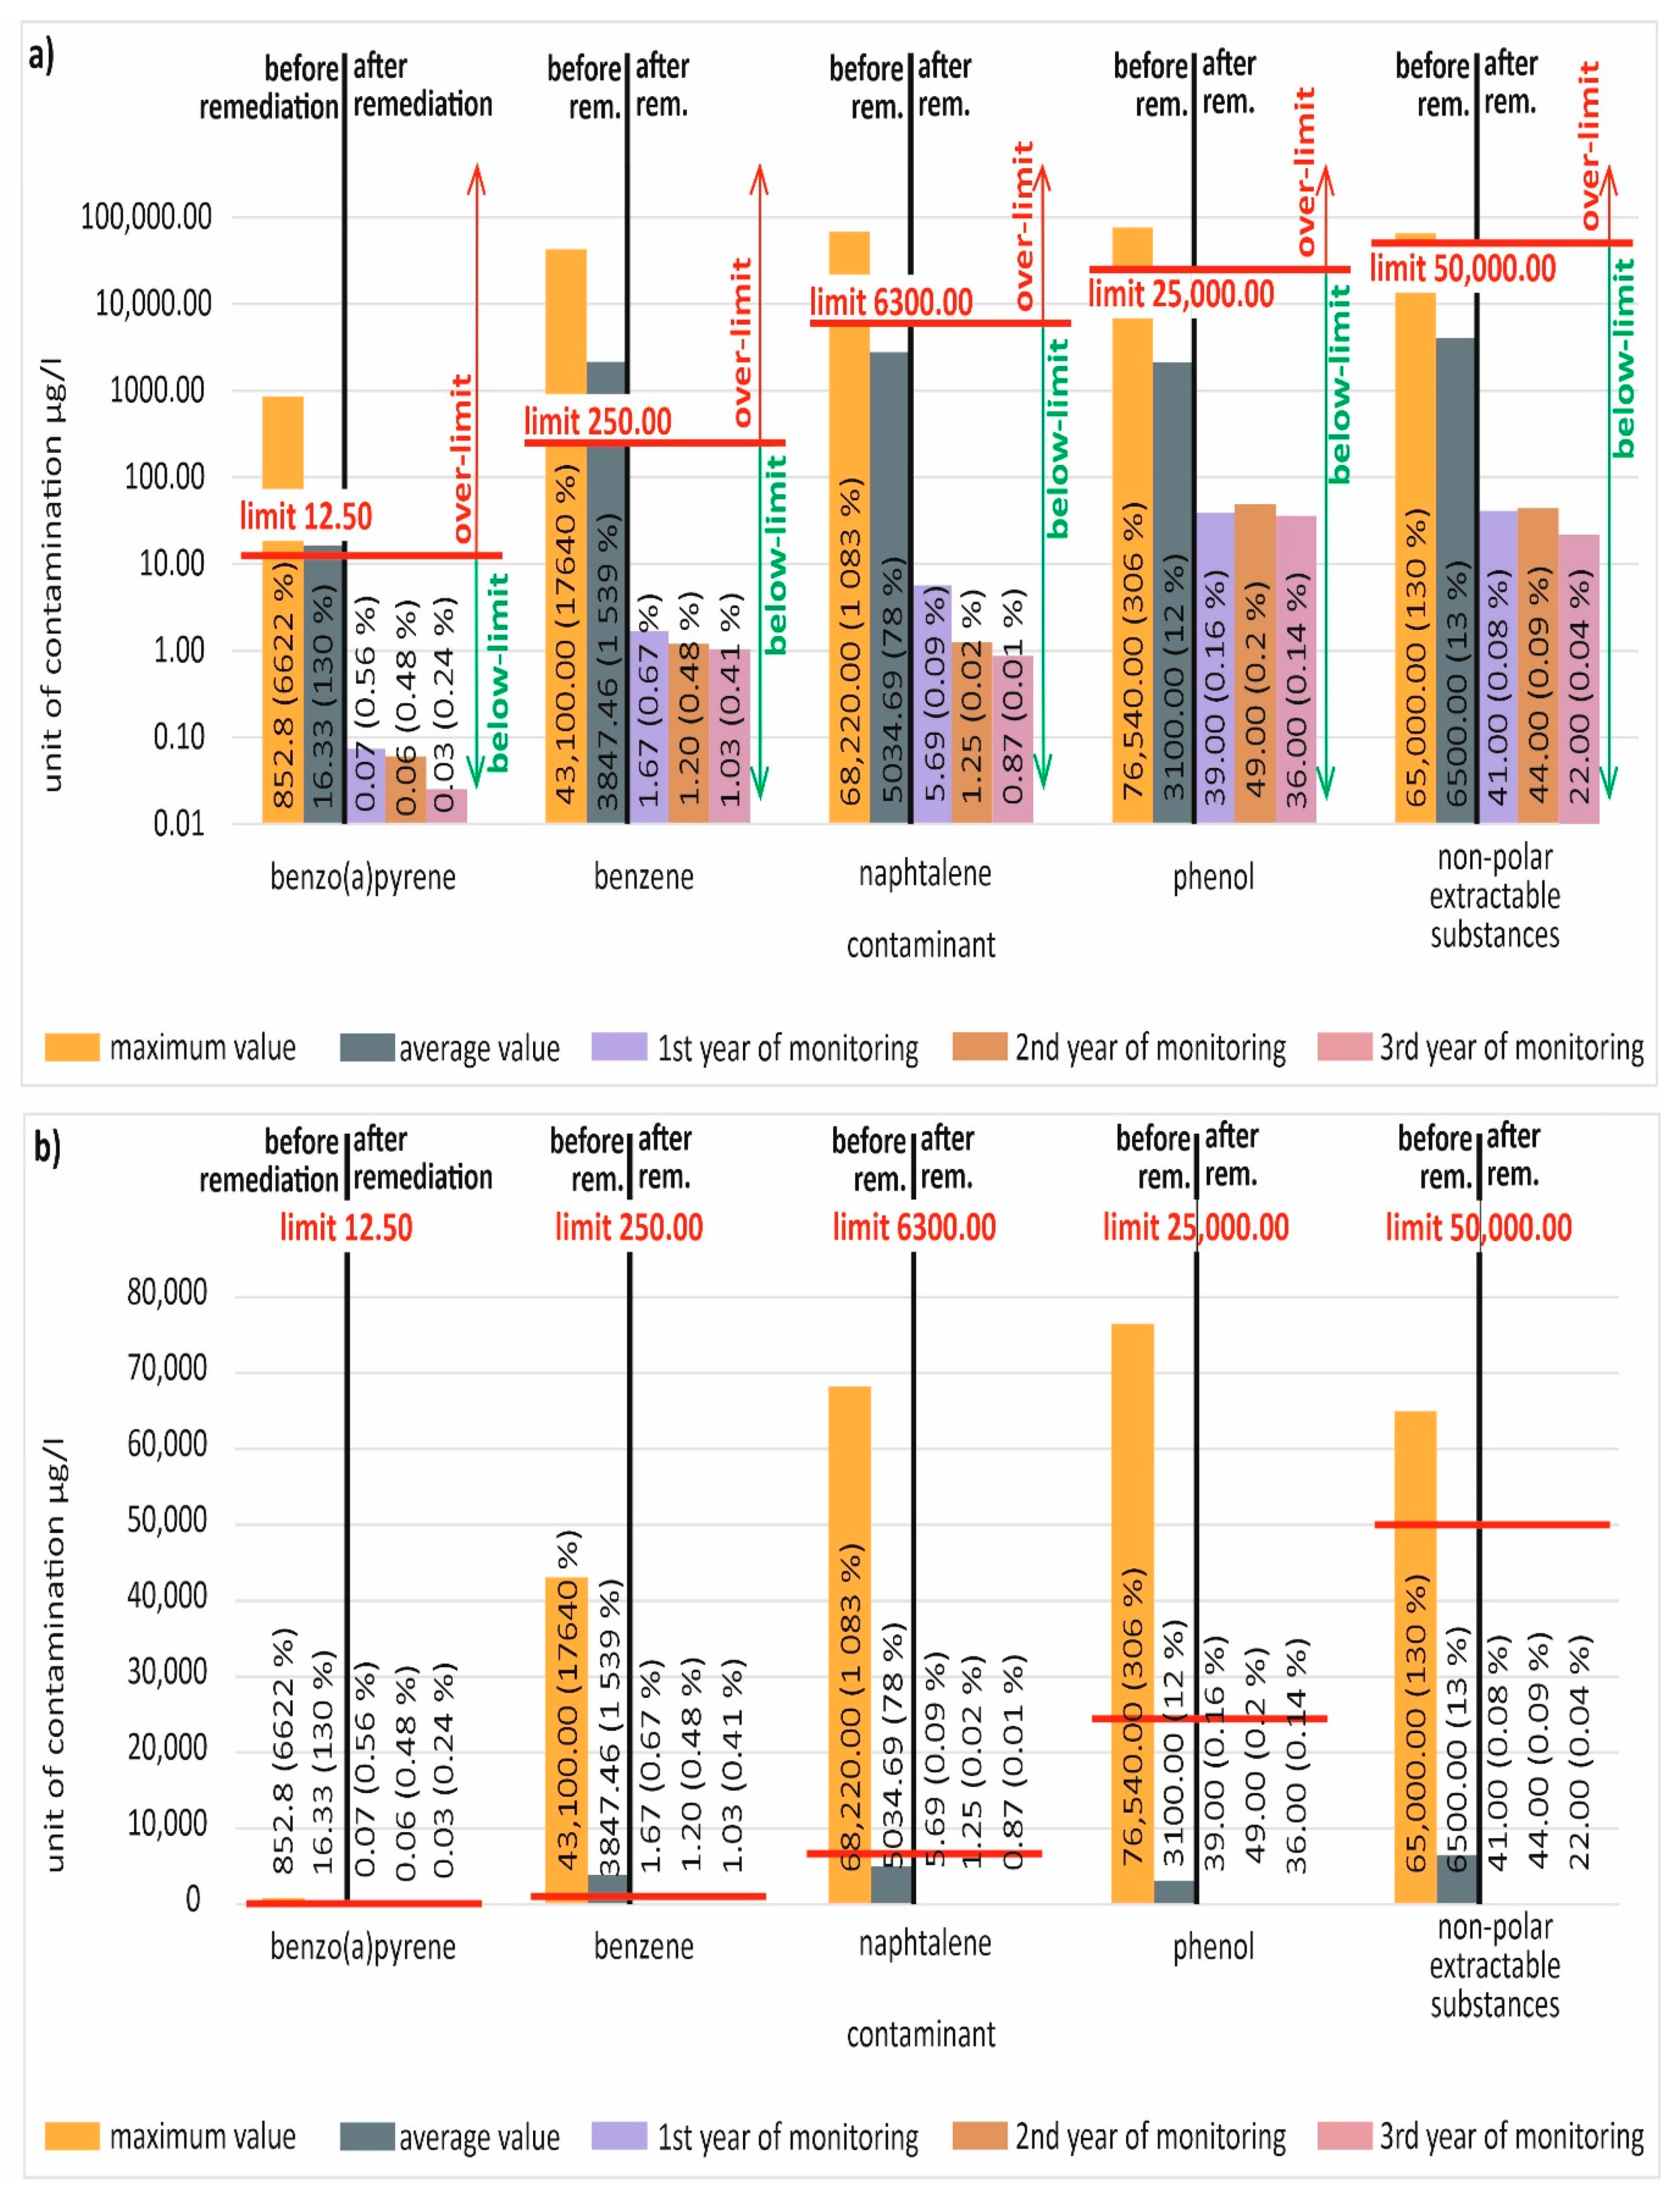
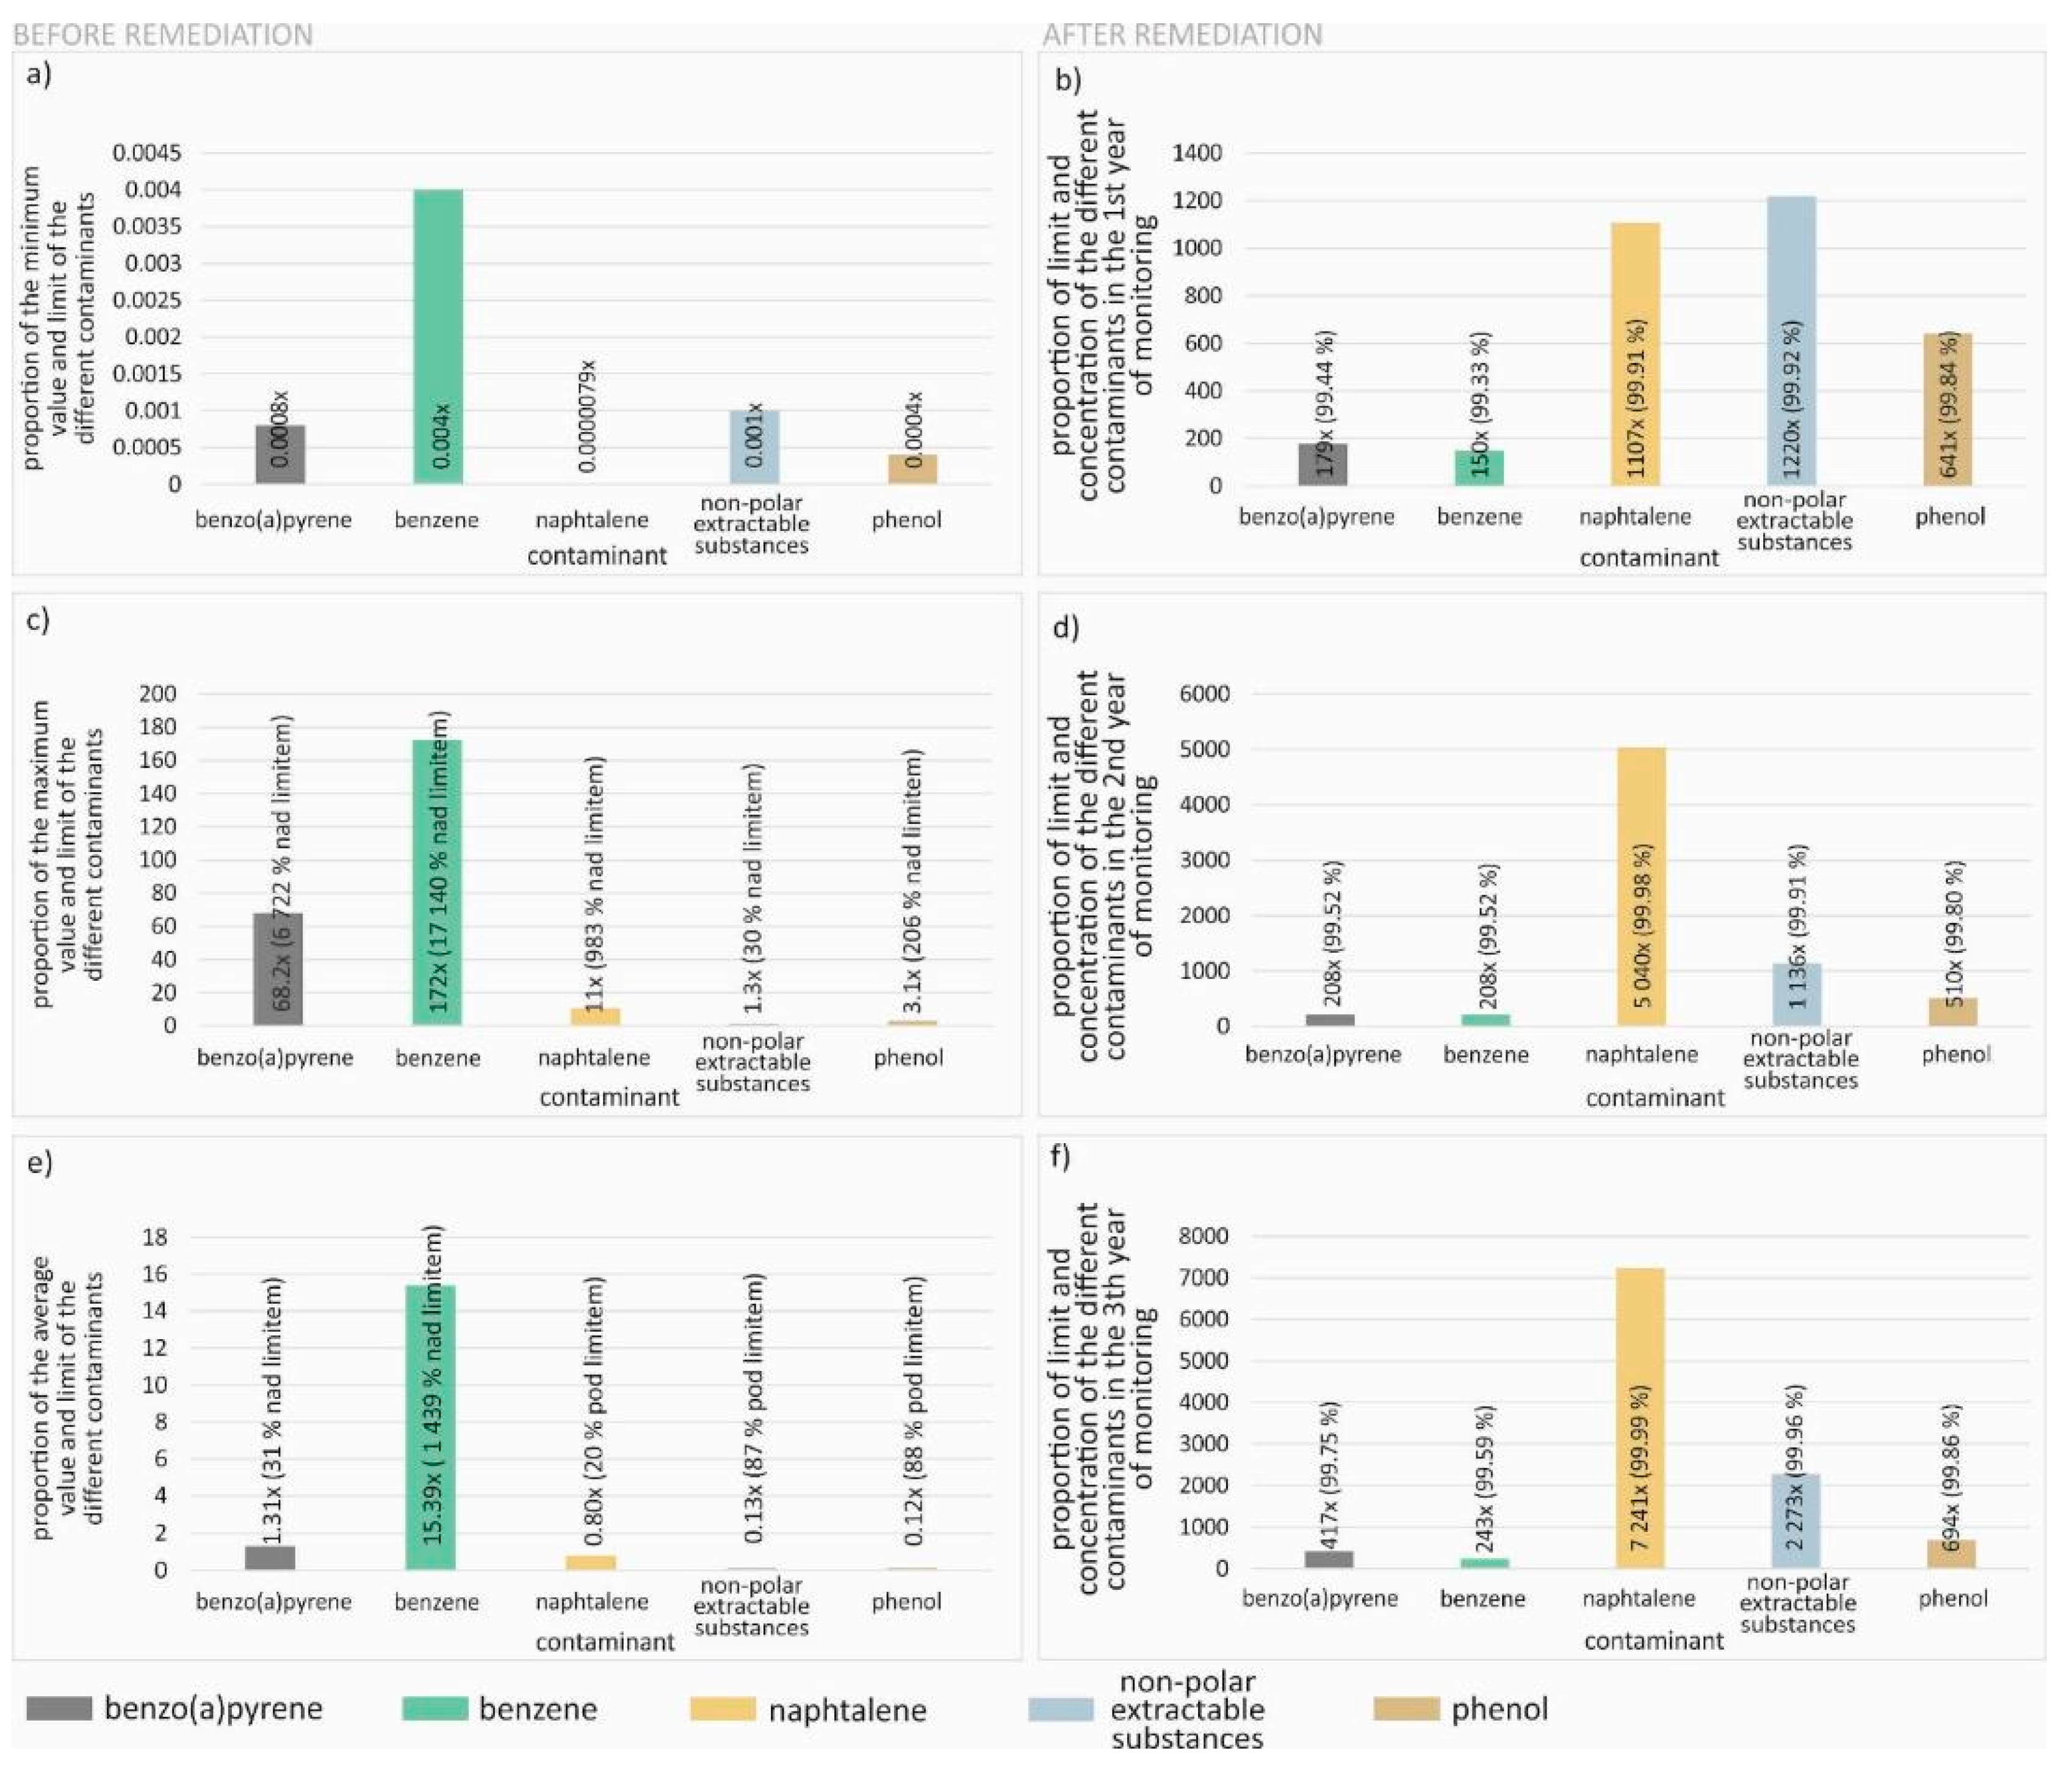
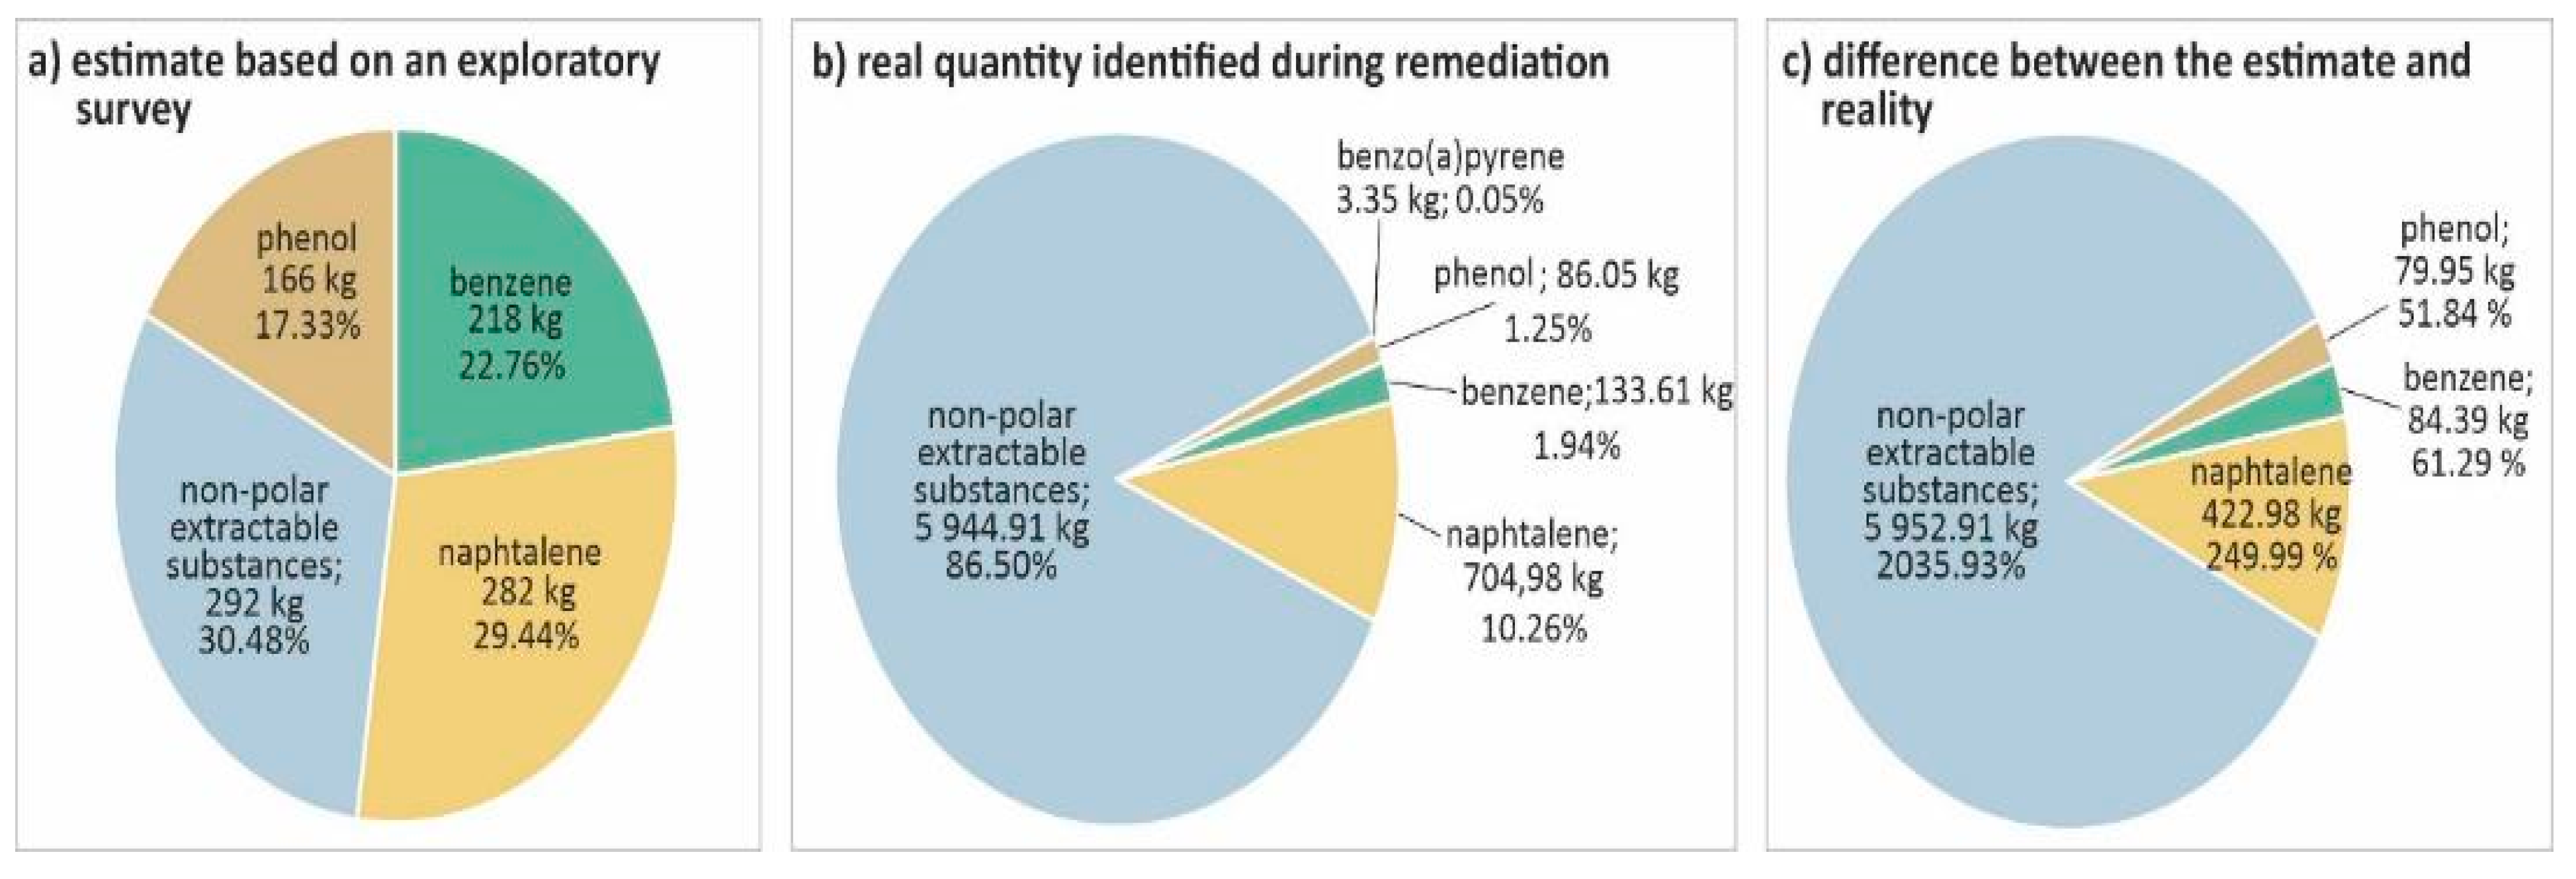
3. Results
Changes in the Hydrogeological Conditions during Remediation
4. Discussion
Evaluation of Groundwater Contamination
5. Conclusions
Author Contributions
Funding
Institutional Review Board Statement
Informed Consent Statement
Data Availability Statement
Conflicts of Interest
References
- Höckenreiner, M.; Neugebauer, H.; Elango, L. Ex situ bioremediation method for the treatment of groundwater contaminated with PAHs. Int. J. Environ. Sci. Technol. 2015, 12, 285–296. [Google Scholar] [CrossRef]
- Kuppusamy, S.; Palanisami, T.; Megharaj, M.; Venkateswarlu, K.; Naidu, R. Ex-situ remediation technologies for environmental pollutants: A critical perspective. In Reviews of Environmental Contamination and Toxicology; Springer: Cham, Switzerland, 2016; Volume 236, pp. 117–192. [Google Scholar]
- Vidonish, J.E.; Zygourakis, K.; Masiello, C.A.; Sabadell, G.; Alvarez, P.J. Thermal treatment of hydrocarbon-impacted soils: A review of technology innovation for sustainable remediation. Engineering 2016, 2, 426–437. [Google Scholar] [CrossRef]
- Xinhong, G.A.N.; Ying, T.E.N.G.; Wenjie, R.E.N.; Jun, M.A.; Christie, P.; Yongming, L.U.O. Optimization of ex-situ washing removal of polycyclic aromatic hydrocarbons from a contaminated soil using nano-sulfonated graphene. Pedosphere 2017, 27, 527–536. [Google Scholar]
- Cassidy, D.P.; Srivastava, V.J.; Dombrowski, F.J.; Lingle, J.W. Combining in situ chemical oxidation, stabilization, and anaerobic bioremediation in a single application to reduce contaminant mass and leachability in soil. J. Hazard. Mater. 2015, 297, 347–355. [Google Scholar] [CrossRef] [PubMed]
- Scholes, G.C.; Gerhard, J.I.; Grant, G.P.; Major, D.W.; Vidumsky, J.E.; Switzer, C.; Torero, J.L. Smoldering remediation of coal-tar-contaminated soil: Pilot field tests of STAR. Environ. Sci. Technol. 2015, 49, 14334–14342. [Google Scholar] [CrossRef] [PubMed] [Green Version]
- Rostmark, S.C.; Colombo, M.; Knutsson, S.; Öberg, G. Removal and Re-use of Tar-contaminated Sediment by Freeze-dredging at a Coking Plant Luleå, Sweden. Water Environ. Res. 2016, 88, 847–851. [Google Scholar] [CrossRef] [PubMed] [Green Version]
- Meegoda, J.N.; Janitha, H. Briefing: In situ decontamination of sediments using ozone nanobubbles and ultrasound. J. Environ. Eng. Sci. 2017, 12. [Google Scholar] [CrossRef]
- Ehrlich, G.G.; Goerlitz, D.F.; Godsy, E.M.; Hult, M. Degradation of phenolic contaminants in ground water by anaerobic bacteria: St. Louis Park, Minnesota. Groundwater 1982, 20, 703–710. [Google Scholar] [CrossRef]
- Pereira, W.E.; Rostad, C.E.; Garbarino, J.R.; Hult, M.F. Groundwater contamination by organic bases derived from coal-tar wastes. Environ. Toxicol. Chem. 1983, 2, 283–294. [Google Scholar]
- Rostad, C.E.; Pereira, W.E.; Hult, M.F. Partitioning studies of coal-tar constituents in a two-phase contaminated ground-water system. Chemosphere 1985, 14, 1023–1036. [Google Scholar] [CrossRef]
- Kempa, T.; Marschalko, M.; Yilmaz, I.; Lacková, E.; Kubečka, K.; Stalmachová, B.; Bouchal, T.; Bednárik, M.; Drusa, M.; Bendová, M. In-situ remediation of the contaminated soils in Ostrava city (Czech Republic) by steam curing/vapor. Eng. Geol. 2013, 154, 42–55. [Google Scholar] [CrossRef]
- Lamich, D.; Marschalko, M.; Yilmaz, I.; Bednářová, P.; Niemiec, D.; Durďák, J.; Kubečka, K.; Duda, R. Utilization of engineering geology in geo-tourism: Few case studies of subsidence influence on historical churches in Ostrava-Karvina District (Czech Republic). Environ. Earth Sci. 2016, 75, 128. [Google Scholar] [CrossRef] [Green Version]
- Marschalko, M.; Zástěrová, P.; Yilmaz, I.; Jelínek, P.; Růžička, J.; Růžičková, K.; Duda, R. A case study assessing thermal activity at a significant geotourism locality of Ema coal tailing dumps in the mining landscape of Ostrava, Czech Republic. Q. J. Eng. Geol. Hydrogeol. 2017, 50, 53–59. [Google Scholar] [CrossRef]
- Czech Environmental Inspectorate, Limits [Online]. Ministry of the Environment. 2021. Available online: https://www.cizp.cz/en (accessed on 16 June 2022).
- DeBruyn, J.M.; Chewning, C.S.; Sayler, G.S. Comparative quantitative prevalence of Mycobacteria and functionally abundant nidA, nahAc, and nagAc dioxygenase genes in coal tar contaminated sediments. Environ. Sci. Technol. 2007, 41, 5426–5432. [Google Scholar] [CrossRef] [PubMed]
- Vulava, V.M.; Vaughn, D.S.; McKay, L.D.; Driese, S.G.; Cooper, L.W.; Menn, F.M.; Levine, N.S.; Sayler, G.S. Flood-induced transport of PAHs from streambed coal tar deposits. Sci. Total Environ. 2017, 575, 247–257. [Google Scholar] [CrossRef] [PubMed]
- Burchill, P.; Herod, A.A.; Pritchard, E. Investigation of nitrogen compounds in coal tar products. 2. Basic fractions. Fuel 1983, 62, 20–29. [Google Scholar] [CrossRef]
- Wise, S.A.; Benner, B.A.; Byrd, G.D.; Chesler, S.N.; Rebbert, R.E.; Schantz, M.M. Determination of polycyclic aromatic hydrocarbons in a coal tar standard reference material. Anal. Chem. 1988, 60, 887–894. [Google Scholar] [CrossRef]
- Wang, P.; Jin, L.; Liu, J.; Zhu, S.; Hu, H. Analysis of coal tar derived from pyrolysis at different atmospheres. Fuel 2013, 104, 14–21. [Google Scholar] [CrossRef]
- Jiao, T.; Li, C.; Zhuang, X.; Cao, S.; Chen, H.; Zhang, S. The new liquid–liquid extraction method for separation of phenolic compounds from coal tar. Chem. Eng. J. 2015, 266, 148–155. [Google Scholar] [CrossRef]


Publisher’s Note: MDPI stays neutral with regard to jurisdictional claims in published maps and institutional affiliations. |
© 2022 by the authors. Licensee MDPI, Basel, Switzerland. This article is an open access article distributed under the terms and conditions of the Creative Commons Attribution (CC BY) license (https://creativecommons.org/licenses/by/4.0/).
Share and Cite
Marschalko, M.; Kempa, T.; Popielarczyk, D.; Cernik, M.; Vicherkova, M.; Vicherek, P.; Niemiec, D. Analysis of the Remediation of Coal Tar-Contaminated Groundwater Using Ex Situ Remediation. Water 2022, 14, 2182. https://doi.org/10.3390/w14142182
Marschalko M, Kempa T, Popielarczyk D, Cernik M, Vicherkova M, Vicherek P, Niemiec D. Analysis of the Remediation of Coal Tar-Contaminated Groundwater Using Ex Situ Remediation. Water. 2022; 14(14):2182. https://doi.org/10.3390/w14142182
Chicago/Turabian StyleMarschalko, Marian, Tomas Kempa, Dariusz Popielarczyk, Miroslav Cernik, Michaela Vicherkova, Petr Vicherek, and Dominik Niemiec. 2022. "Analysis of the Remediation of Coal Tar-Contaminated Groundwater Using Ex Situ Remediation" Water 14, no. 14: 2182. https://doi.org/10.3390/w14142182