Review

Advanced Techniques for Monitoring and Management of Urban Water Infrastructures—An Overview

1
Department of Computer Science, Technical University of Cluj-Napoca, 400114 Cluj-Napoca, Romania
2
Computer Science Department, Politehnica University of Bucharest, 060042 București, Romania
*
Author to whom correspondence should be addressed.
Water 2022, 14(14), 2174; https://doi.org/10.3390/w14142174
Submission received: 29 May 2022 / Revised: 26 June 2022 / Accepted: 5 July 2022 / Published: 9 July 2022
(This article belongs to the Special Issue Smart Water Solutions with Big Data)

Abstract

:
Water supply systems are essential for a modern society. This article presents an overview of the latest research related to information and communication technology systems for water resource monitoring, control and management. The main objective of our review is to show how emerging technologies offer support for smart administration of water infrastructures. The paper covers research results related to smart cities, smart water monitoring, big data, data analysis and decision support. Our evaluation reveals that there are many possible solutions generated through combinations of advanced methods. Emerging technologies open new possibilities for including new functionalities such as social involvement in water resource management. This review offers support for researchers in the area of water monitoring and management to identify useful models and technologies for designing better solutions.

1. Introduction

Contrary to popular belief, only 3% of the water on earth exists in the form of freshwater, of which 69% is trapped in polar ice caps and glaciers and 30% of it is groundwater. This perspective provides an overview of the actual scarcity of this vital resource [1,2]. In this context, urban water supply systems (WSS) have to cope with the increase in population and growing economy [3].
Water supply systems represent a key infrastructure for modern society, defined by a set of interconnected hydraulic components to collect and distribute water, encompassing raw water sources, water pumps, transmission infrastructure, treatment plants, storage tanks and distribution systems to deliver the water to the final consumers.
The sustainability of water resource management is of primary concern in the formulation of large scale policies and governance mechanisms for the development of resilient infrastructure in urban environments. A key factor for ensuring an effective management of natural water resources is represented by the open data paradigm, that can provide a bridge between local and global scales.
In this sense, the Open Water Data Initiative [4] was defined with the purpose of connecting fragmented systems into a connected water data framework across the U.S. to facilitate integration and knowledge sharing for designing large-scale solutions. The committee assembles multiple organizations from the government level: federal level (e.g., U.S. Army Corps of Engineers, U.S. Department of Agriculture, U.S. Department of the Interior, U.S. Environmental Protection Agency), regional, state and local level (e.g., Association of State Drinking Water Administrators, Interstate Council on Water Policy, National Association of Clean Water Agencies), to the industry (e.g., American Society of Civil Engineers, Electric Power Research Institute) and academia (Universities Council on Water Resources), as well as professional associations (e.g., American Water Resources Association, American Water Works Association, National Ground Water Association). The Open Water Web was defined based on a set of layers, from data modeling, to community involvement, which is discussed further in this review paper, as follows:
  • Water data catalog: data sources and ontologies, further discussed in Section 2.2 and Section 6.1;
  • Water data as a service: standards, visualization and delivery, e.g., IoT, further discussed in Section 3 and Big Data, further discussed in Section 4;
  • Water data enrichment: data modeling and advanced processing, e.g., AI methods, further discussed in Section 5;
  • Water data and tools marketplace: community exchange, extensions, e.g., Decision Support Systems, Blockchain, further discussed in Section 4 and Section 6.
The European equivalent is represented by the INSPIRE Directive [5], focusing on the integration of spatial information across different domains to support environmentally aware policy-making through open data and interoperability. The latest INSPIRE Conference was focused on the environmental agenda and sustainability, covering the political roadmap and retrospective on the implementation and findings since the adoption of the directive, the architectural roadmap, i.e., an overview of the new technologies and their implications, and the Green data initiative, encouraging data-driven innovation to enable the implementation of the European Green Deal [6].
Considering the importance of water in nearly every domain, with direct implications in daily life, the large-scale initiatives and frameworks are supported by a considerable research interest focused on various aspects of water resource management.
Pamidimukkala et al. [7] provide a classification of challenges in urban water infrastructure found in the literature, of which the most frequent ones were identified as: climate change (environmental), aging infrastructure and improper maintenance (technical and infrastructure), lack of infrastructure capital (financial and economic), population growth and rapid urbanization (social). The paper also lists some of the more common models for improving resilience of urban water infrastructure through preventive and corrective actions: standards (GIS—Geographic Information Systems), applications (EPANET—The Environmental Protection Agency Network), methods (Bayesian network, Monte Carlo simulation) and instruments (WNTR—The Water Network Tool for Resillience). Last, but not least, the paper presents concrete problems that were resolved with Big Data methods and Blockchain in various sectors (with the focus on water domain), either by using them separately, or by interconnecting them in a hybrid architecture.
Considering the integration of ICT (Information and Communications Technology) systems for water resource management, complex event processing (CEP) methods in WSS focus on event streams to identify patterns in real-time, detecting leaks and anticipating problems based on water pressure and flow, using advanced queries and policies.
To evaluate the trends in the context of this research, we extracted from Google Scholar a number of papers published during the past 10 years debating topics related to water and ICT systems: IoT (Internet of Things), Big Data, Anomaly Detection, Decision Support Systems (DSS) and Smart City.
From this analysis, IoT shows the largest growth in the overall level of interest for this subject since 2017, while the other topics are more constant since 2015, as shown in Figure 1.
Nonetheless, the overall number of papers has increased exponentially over the analyzed time frame, suggesting an increase in the level of interest related to water in the context of emerging technologies.
This review article focuses on the latest research in the domains of interest for water infrastructure management. The numbers of referenced papers for the corresponding years are shown in Figure 2a. As the number of papers has increased considerably since 2017, the number of references cited in this article show a similar trend. A qualitative analysis is revealed in Figure 2b, in the form of a word cloud generated from keywords in paper titles, showing a balanced distribution of topics related to this review article.
The content of the paper is organized as follows: Section 2 introduces the concept of smart cities in the context of water infrastructure management based on standard frameworks and enabling ICT technologies. The section begins with an evaluation of several review articles that present an overview of the concept using manual and automated classification methods. Then, an overview of the technologies and frameworks for data collection and processing is discussed. In Section 3, the integration of IoT is discussed from the perspective of enabling technologies and frameworks. An evaluation of IoT boards and platforms provides an overview of the enabling technologies. The multiple levels of integration are discussed in the context of water infrastructure monitoring solutions: sensors, platforms and applications. Afterwards, the importance of Big Data methods in water infrastructures is presented in Section 4. With the amount of data being processed in real time increasing continuously, the usage of Big Data is imperative. The main concerns taken into consideration are data security and data irreversibility. These two key aspects can be improved by using Blockchain combined with Big Data architectures. Section 5 is dedicated to the presentation of methods used for data analysis in water infrastructures. As a first step, several preprocessing techniques are mentioned, which are used to eliminate errors and noise from the input data as well as for the enhancement and normalization of the collected data. Then, a significant part of the section discusses anomaly detection techniques, meant to generate alerts in case of deviations from water quality standards, in case of water consumption anomalies (e.g., caused by leaks) or in case of cyber security attacks. The last part of the section presents water infrastructure modeling techniques used to identify consumption patterns, hl to generate demand forecasting and to predict water pipes failure. Section 6 emphasizes the importance of monitoring water consumption to ensure good water supply management. Ontologies are a key factor in processing consumer data in order to validate their consistency. Moreover, the analysis of the collected data and the extraction of the relevant one from a large data set is essential in order to be able to make decisions that lead to the conservation of water resources. All these aspects of monitoring and predicting water consumption are also used in the context of drinking water, which has a major impact on human health. Thus, the more consumers use water in a responsible way, the more they will take care of their long-term health. The paper ends with our final conclusions in Section 7.

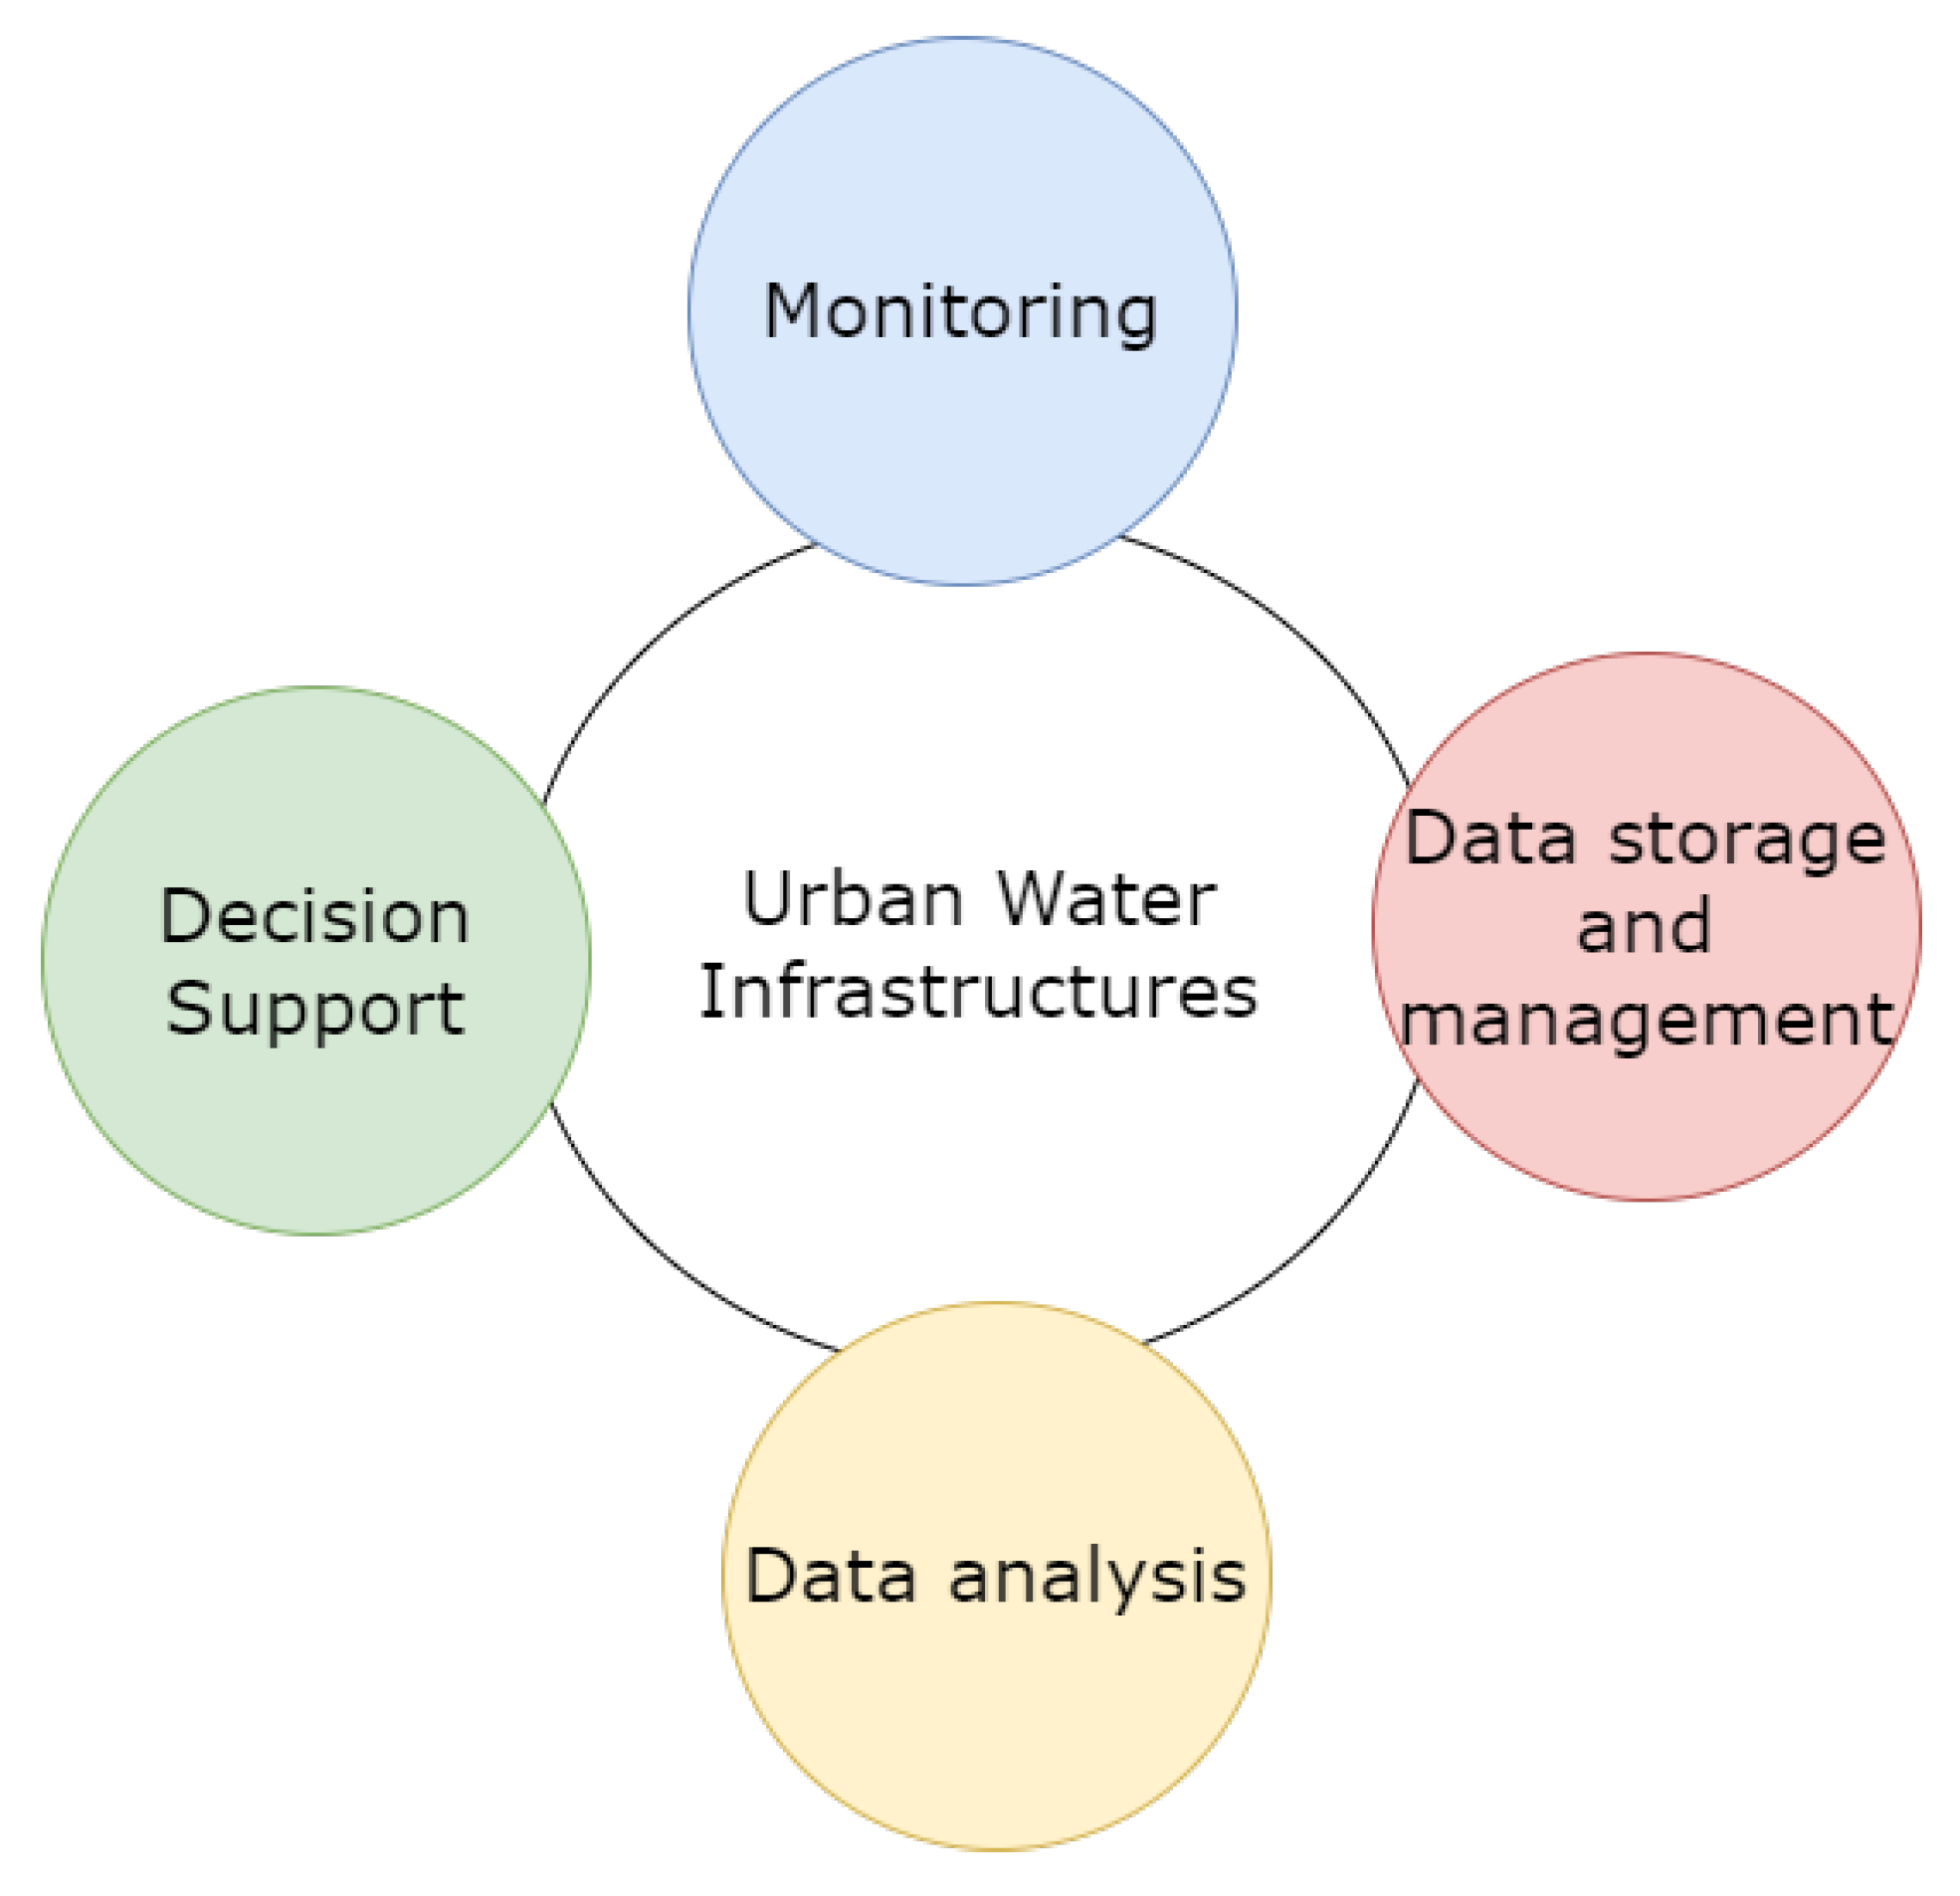
2. Water Infrastructure Management in Smart Cities

Smart cities represent a modern paradigm towards improving the quality of life by integrating intelligent systems in a large-scale context, with citizen involvement [8].
The concept of a Smart City dates back to the mid-1970s, defining an integrative approach for urban ecosystems supported by technology. Since the mid-2000s, technological advancement and urbanization have propelled the level of interest in smart city applications, with more than 2,500,000 related studies listed on Google Scholar.
The level of integration between connected systems allows for multi-domain optimization towards achieving higher levels of sustainability and collaboration between the stakeholders [9].
An automated method of classifying the main interests from the smart city applications was presented by Stübinger and Schneider [10] in their review paper that systematically surveys the top 200 Google Scholar publications, in which, using natural language processing combined with clustering methods, they manage to identify five relevant streams: smart infrastructure, smart economy and policy, smart technology, smart sustainability and smart health. These trends are further analyzed using time series forecasting, revealing that the topic of smart sustainability was predicted to be increasing in interest over the next few years.
Bellini, Nesi and Pantaleo [11] realized a manual classification of the identified smart city applications, obtaining eight main categories: smart governance (e-Government, Decision-Making Policies, Citizens’ Participation), smart living and infrastructures (Smart Buildings, Smart Home, Smart Education, Smart Tourism and Cultural Activities), smart mobility and transportation (private/public traffic management, dynamic routing, smart parking, sustainable mobility, vehicle sharing), smart economy (smart business, e-Commerce, smart retail and shopping, peer-to-peer marketplaces, peer-to-peer labor services), smart industry and production (Industry 4.0, predictive maintenance, smart manufacturing, smart agriculture and farming), smart energy (sustainable energy, smart grids, smart lighting), smart environment (air quality monitoring, weather monitoring, smart waste management, smart water) and healthcare (smart hospitals, telemedicine and telenursing, e-Health records, healthcare tracking).
In [12], an overview of research papers related to urban water infrastructure management is presented, covering water distribution networks, nature-based solutions, urban drainage networks and communication technologies.
A table summary of smart city domains is presented from three different perspectives:
  • Services, applications and features;
  • IoT and sensing technologies involved;
  • Real-world case studies.
Improving water infrastructure management in the context of smart cities requires considerable research effort to develop effective strategies for leak detection: hardware solutions (using specialized sensors [13,14], autonomous mobile robots [15,16]), modeling and simulation models (hydraulic models [17,18,19,20,21], evaluating optimal sensor placement), computational intelligence (demand forecast, anomaly detection, priority evaluation [22,23,24,25,26,27]), and participative solutions (mobile crowdsensing for monitoring the environment [28]).

2.1. Technologies

A primary challenge in the context of smart cities is represented by the integration of multiple technologies and approaches that cross different domains of activity, requiring a broad perspective and understanding of the system as a whole [29,30]. Moreover, the role of each component has to be clearly defined, in order to achieve the desired global outcomes [31,32].
Smart cities are fundamentally supported by physical infrastructure, advanced ICT systems and social involvement. Data collection, context awareness, advanced computation and connectivity represent the core technological factors in smart cities [33].
In [34], the opportunities and challenges for the development of smart cities are explored in the context of four disruptive technologies: IoT [35], big data [36], AI (Artificial Intelligence) [37,38] and blockchain [39,40]. In the context of water infrastructure, IoT represents the foundation for various applications that involve other technologies and represents the connection between the physical infrastructure and the digital world. “Disruptive technologies are considered key drivers in smart city progress” [34]. At the same time, the integration of various technologies represents an important step towards improving the quality of service in a large-scale WSS.
Wireless sensor networks (WSN) have solved many of the problems in water quality monitoring that traditionally required manual analysis in laboratory settings [41]; therefore, it is now common for smart water management solutions to integrate IoT technologies for real-time remote monitoring, having a lower cost of hardware and low energy requirements. The typical IoT architecture can be generically described by the multiple layers involved: sensors, gateways, cloud services and dashboards [1].
An overview of wired and wireless communication technologies applicable for Smart City environments is presented in [12], based on the data rate (1 kb/s–10 Gb/s) and transmission range (1 m–100 km), classified as either LPWAN (low-power wide-area network), mobile communication, short/medium-range or wired communication. The recommended measurement (10 s–1 mo.) and transmission intervals (30 min–1 mo.) are provided for the communication technologies commonly used in IoT configurations.
Considering the broad range of technologies involved in smart city water infrastructure management, an in-depth overview of each technology is beyond the scope of this article; a more focused perspective is presented in the following section, showing how these can be integrated in the context of enabling frameworks.

2.2. Frameworks

A domain of convergence between the emerging technologies with applications in water infrastructure is represented by GIS (geographic information systems), which can be used in nearly all aspects of smart city environments, from design and planning, to monitoring and maintenance operations [42].
In the context of ICT applied in the water domain, EPANET is a free tool created by USEPA (the United States Environmental Protection Agency) to perform hydraulic simulations. It is commonly used in civil engineering to design well-planned water distribution networks [43]. The software provides capabilities for simulating hydraulic behavior based on physical parameters and evaluating network configurations, calculating the pressure at the nodes and the flow in the pipes by solving the mass conservation equation for each node and the energy conservation equation for each pipe and pump.
Oberascher, Rauch and Sitzenfrei [12] present a detailed guideline for smart city deployments of monitoring and control networks, with consideration of sustainability requirements.
To encourage consumers and building owners to monitor water consumption data, an online platform called ENERGY STAR was developed [44]. The EPA Water Score was defined in collaboration with the the USEPA WaterSense Program [45]. To encourage participation, the consumer can adapt according to the recommendations to achieve a better EPA score.
To define a framework for collaborative approaches in water management, open data represents a key paradigm for applications in the public domain. Multiple datasets can be used for water management solutions, focusing on, but not limited to water infrastructure in Smart Cities:
  • Water Levels of Rivers and Lakes—Hydroweb (LEGOS/GOHS- Laboratoire d’Etudes en Géophysique et Océanographie Spatiales/Géophysique, Océanographie et Hydrologie Spatiales) [46].
  • Global Reservoirs and Lakes Monitor—G-REALM (USDA/FAS—U.S. Department of Agriculture/Foreign Agricultural Service, IPAD—International Product Assessment Division) [47].
  • Database for Hydrological Time Series of Inland Waters (DGFI TUM—Deutsches Geodätisches Forschungsinstitut der Technischen Universität München) [48].
  • Dynamic Surface Water Extent (U.S. Department of the Interior) [49].
  • Self-calibrating Palmer Drought Severity Index (CRU UEA—Climatic Research Unit from the University of East Anglia) [50].
  • Global Land Precipitation (CRU UEA—Climatic Research Unit from the University of East Anglia) [51].
  • AQUASTAT Core Database (FAO—Food and Agriculture Organization) [52].
  • Precipitation (ANM—Romanian National Weather Administration) [53].
There are multiple data modeling frameworks for water management, an example being described in the 12th Chapter of the book Data Science and Big Data Analytics in Smart Environments [54]. The proposed framework includes a data ingestion module, a data processing model and data visualization capabilities, providing support for real-time applications in water resource management. The solution is based on ODC (Open Data Cube)—an open-source framework used for processing geospatial data to provide support for informed decisions—and CKAN—an open-source tool used by organizations to publish datasets.

3. IoT in Water Infrastructure Monitoring

Increasing the efficiency of water supply networks is especially important in dry areas, where drinking water is scarce. Smart water infrastructure relies on IoT systems to improve monitoring capabilities, providing decision support for water resource management [55].
As safe water is becoming a scarce resource, water quality monitoring needs to be automated as well, to provide real-time feedback for the operators and consumers. IoT systems can provide a cost-effective alternative for real-time monitoring in water infrastructure; however, there are few papers that focus on water quality monitoring using IoT technologies. In [56], a solution based on IoT has been developed using low-cost hardware and open-source software and was found to be comparable to industry-standard SCADA monitoring systems in terms of measurement accuracy.
Nowadays, IoT can be seriously considered for monitoring WDNs (water distribution networks). Pressure monitoring is important to reduce the occurrence of leaks in WDNs, while flow and pressure sensors are usually installed in very few locations due to the high costs involved. Leak detection capabilities are evaluated using a sensitivity matrix and optimization problems are formulated to determine the optimal locations of pressure sensors in large-scale WDNs [57].
The water quality parameters used in IoT measurement solutions include temperature, electrical conductivity, potential of hydrogen (pH), turbidity, oxidation-reduction potential (ORP/REDOX), free chlorine, total dissolved solids, dissolved oxygen, sodium, fluoride, manganese, magnesium hardness, calcium hardness and hydrogen sulfide. WHO/USEPA defines safe limits of drinking water based on these parameters.
Starting from the important aspects from the water monitoring—low cost, portability, low energy consumption, IoT-based and real-time—and using WHO/USEPA minimum standards for drinking water, Jan, Min-Allah and Düştegör [1] rated the related works on a scale between 20% and 100%. A considerable number of papers were analyzed and classified by scope: general reports, leak detection, water management, flood-level monitoring, water level monitoring, agriculture and aquaculture, automatic control of water pumps, water control in smart cities and water quality.
Due to the vast ecosystem of IoT technologies, frameworks and applications, the integration of various components into a large-scale ICT system is of particular interest for water infrastructure monitoring. Multiple levels of integration can be considered, of which the most representative for this context were defined as: sensor level, platform level and application level.
Measurement nodes are usually required to collect data from sensors, and process and update local displays and communicate with cloud servers. Based on the complexity of local data processing, there are many embedded solutions available, e.g., Raspberry Pi 4 Model B, Intel Galileo Gen 2 and NVIDIA Jetson. IoT sensors and actuators in water monitoring can be classified by their applications: water level monitoring (e.g., ultrasonic sensors, infrared sensors, time-of-flight LED sensor, LIDAR), water leakage monitoring (e.g., portable sensors, moisture sensors, water flow sensors) and automatic refilling of water storage tanks (e.g., relays, power electronics) [2].
IoT connects physical devices and can be employed for real-time monitoring of water infrastructure in remote locations. Water quality monitoring (WQM) sensors play a key role in the overall efficiency of IoT in water quality monitoring and should follow some general guidelines for quick installation: having built-in signal conditioning circuitry, acquired from a reputable vendor and using adequate materials for the particular scenario.
In terms of hardware, there are multiple development kits with different real-time and processing capabilities that can be classified as: microcontroller boards (e.g., Arduino UNO R3, Arduino Mega 2560, Arduino Due, Arduino Nano 33 IoT, NodeMCU, ESP32, BBC Micro: bit V2) and single board computers (e.g., Raspberry Pi 4 Model B, BeagleBone Black, Intel Edison) [58,59].
A classification of IoT Boards is shown in Figure 3, based on the low-level interfacing and high-level processing scores calculated from technical specifications. The latest IoT boards available on the market were assigned to the following categories: MCU (microcontroller boards), MCU-WS (microcontroller boards with wireless connectivity) and SoC (system-on-a-chip boards).
The evaluation considered the interfacing capabilities, i.e., number of digital pins, analog pins, UART (universal asynchronous receiver-transmitter), USB (universal serial bus), Wi-Fi, Bluetooth, PWM (pulse-width modulation), ADC (analog to digital converter), DAC (digital to analog converter), I2C (inter-integrated circuit), SPI (serial peripheral interface), CAN (controller area network), Ethernet, HDMI (high-definition multimedia interface) and processing capabilities, i.e., size of flash memory, EEPROM (electrically erasable programmable read-only memory), RAM (random-access memory), number of CPU cores, CPU speed, architecture (number of bits) and support for modern operating systems.
It was found that MCU boards offered generally lower interfacing and processing scores than MCU-WS boards, as MCU-WS boards are usually equipped with more powerful chips to support the wireless communication protocols. Naturally, SoC boards scored the highest in terms of processing power, and are lacking in low-level interfacing capabilities when compared to MCU-based counterparts. The Raspberry Pi 4B shows the highest processing score and an average interfacing score, whereas the ESP32 was found to be the most versatile for IoT applications, showing the highest overall score.
There are many Cloud IoT Platforms that can be used for general purpose applications, working with real-time measurements and providing configurable dashboards, such as Blynk, Pachube, Thringer.io, Ubidots, ThingSpeak, Arduino and Adafruit.
The Ubidots Cloud platform was deployed in [60] to monitor real-time water consumption in households, offering real-time notifications, reports and charts. As confirmed in [61], smart water meters can provide detailed feedback in the context decision support systems for sustainable water consumption behavior.
Although there are many PaaS (platform as a service), IaaS (infrastructure as a service) and SaaS (software as a service) solutions available on the market, most offer a broad range of features for general-purpose applications from the provider perspective. The IoT components are commonly represented as devices, gateways, user interfaces and services. The functional requirements involved in general-purpose IoT platforms include support for design, implementation and operations. These characteristics were evaluated in [62], based on the publicly available descriptions of the platforms.
A classification of IoT platforms is considerably more subjective in terms of flexibility and usability from the end-user perspective. Functional requirements related to general characteristics, i.e., primary value, availability and scalability, security and reliability and connectivity can vary depending on the application type, i.e., consumer IoT (e.g., wearables, devices, B2C products) or industrial IoT (e.g., automotive, aerospace, manufacturing, agriculture) [63].
Some of the most advanced IoT platforms provided by large corporations, i.e., Google Cloud IoT, Microsoft Azure IoT Hub and Amazon AWS IoT Core, were reviewed in [64], based on a set of factors: (i) general features, i.e., scalability, availability, security and privacy, plug and play, real-time data, storage and support; (ii) technical capabilities, i.e., supported protocols, certified hardware and SDKs; (iii) usability, i.e., developer friendliness, configuration effort and time to market; (iv) affordability, i.e., solution type and pricing. Although every platform offered the complete set of general features, specific technical capabilities were significantly different, each platform supporting a different range of protocols, certified hardware and SDKs.
However, there is no universally compatible platform for specific applications in urban water management, and custom solutions are often designed due to the inherent limitations and risks involved in the integration of third-party solutions into a large-scale system [1].
Applications of IoT in water infrastructure monitoring include data processing capabilities to enable decision support for effective resource management and maintenance operations.
Extracting demand patterns is useful in customer segmentation analysis, i.e., residential, commercial, industrial and for detecting anomalies, i.e., burst water pipes, leaks and unauthorized consumption.
For example, Cominola et al. [65] presented a data-driven approach that revealed water use profiles from smart meter readings, based on the difference between usage time and volume. The proposed framework uses water-proof ultrasonic sensors, data collection methodologies, cloud-based technologies and data analysis for detecting the status of consumption and leaks, extracting trends and supporting decision making.
Yang et al. [66] used Autoflow as an intelligent water resources management system that can extract the types of water usage, e.g., showering, toilet use and washing dishes, with an accuracy of about 90%. Usually, these systems are useful to detect leaks and can go a step forward by offering recommendations directly to consumers.

3.1. Technologies

IoT is closely related to open-source hardware and software platforms, providing superior flexibility and lower cost when compared to traditional monitoring and control solutions for water infrastructure management. Wireless communication can be enabled by LoRaWAM technology for low-power, interconnected devices over medium-long distances, or GSM/GPRS modems for long distances.
In this sense, IoT represents next-generation infrastructure, superseding SCADAs and PLCs, and moving towards decentralized architectures that improve system efficiency, scalability and adaptability to new workflows. Bruno et al. [56] proposed a system that used an Arduino microcontroller as a cost-effective solution for pressure measurement, focusing on the data collection, communication, storage and virtualization levels. Upon calibration using hydrostatic and hydrodynamic experiments, it was found to achieve a higher measurement quality and data acquisition frequency than SCADA.
Although GSM and Wi-Fi are commonly used in water monitoring, these technologies consume maximum power during transmission, and cannot be used continuously with battery-powered nodes. The advancements in wireless sensor networks (WSN) have minimized power consumption by using prescribed time intervals; however, this method does not work for control purposes, such as operating a water pump. Singh et al. [67] suggest a combination of wireless technologies to enable communication between local components and real-time operation as required for more complex automation.
Communication networks suitable for water supply systems include low-power wide-area networks (LPWAN), e.g., Sigfox, LoRaWAN and NB-IoT, which are characterized by long-range, low energy consumption and low cost [68,69,70]. The large-scale adoption of open-source technologies and platforms accounts for a growing community of developers and a more versatile approach for real-world deployments [55].
LPWAN is especially suitable for pressure-based leak detection in urban water infrastructure where optimal sensor locations are not accessible for power sources. Pointl and Fuchs-Hanusch [71], compared GPRS with LPWAN standards, using a self-developed low-power pressure-monitoring device, having real-time application capabilities, with a reduced cost of operation.

3.2. Frameworks

Frameworks for water supply management address the efficiency of water supply by leak detection, automatic meter reading, online billing and water consumption monitoring. Mathematical models provide the theoretical foundation for designing effective IoT frameworks, centered around monitoring consumption levels, leakage reporting and cost optimization, in the context of smart cities. Monitoring water resources extends across multiple layers: device perception layer (sensor networks), information communication layer (data acquisition systems) and application layer (processing and decision support) [72].
Applications that benefit from collecting large amounts of data from IoT networks often require advanced computation and decision-making capabilities. The increased connectivity of IoT systems provides the foundation of advanced AI and collaborative applications, connecting devices and citizens in large-scale smart government strategies.
Although there are many research works focusing on either big data applications in water management or intelligent systems for analyzing large amounts of data generated by the sensors, few papers address the real-time operation and dynamic behavior of water supply systems.
Gonçalves, Soares and Lima [73] propose an IoT framework for intelligent water management, called REFlex Water, using declarative processes and complex event processing to model the water system and analyze the real-time operation.
The framework is defined for physical layer (components of the water supply system and IoT devices), middleware IoT layer (Orion Context Broker—monitoring interface updater, Perseo—event processor and rule enforcer, Cygnus—historical data collector, SHT-Comet—graph visualizer, MongoDB—data storage) and application layer (declarative business workflow, rule engine, control panel).
Pérez-Padillo et al. [55], proposed an architecture that is defined by four levels: data collection level (using a Honeywell pressure transducer), communication level (using a Sigfox network operator and an Arduino MKR FOX 1200 board, with a focus on energy consumption), cloud database and analysis level (Sigfox back end, ThingSpeak platform) and platform and visualization level (ThingSpeak platform). The prototype was installed in Córdoba, Spain for monitoring drinking water supply in 10 municipalities. The sensors were installed in optimal locations based on the Sigfox signal quality. The configuration was able to quickly detect leaks and breakdowns, as well as anomalies in pump operation by analyzing pressure measurements.

4. Big Data Methods in Water Infrastructures

Big Data is one of the technologies that created a brand new level when talking about information. Even if we talk about structured, semi-structured or non-structured data, relational or non-relational databases, sensors that generates data or any other IoT devices that are able to transfer data to a central point of computation, Big Data can incorporate all these terminologies. From data generation to data transfer, data sanitation and refinement but also decision making based on this information, the entire process represents methods of Big Data that can be applied in various domains. The domain of “water resources” is not an exception and, during the last period, Big Data was successfully implemented in a lot of software architectures.
An important aspect when talking about all these solutions, data transfer from sensors or any other devices to the central processing point is the security of the data and how these data cannot be manipulated in a malicious way. Another topic that can be taken into consideration is the data persistence and how the architects ensures that these data are not altered.
Blockchain may be a solution that can solve the previously presented aspects by its security, transparency and irreversibility.
Initially designed as a technology in the financial sector, with limited usage through Bitcoin, the ecosystem stated to reach its maturity in the last years and new opportunities appeared with the new architecture. With applicability in various numbers of domains such as: decentralize finance, energy, gaming and much more, the technology presents more and more interest for all sectors, including the water resource sector.
Figure 4 presents the two technologies that are discussed in this section. When talking about Big Data, we discuss about keys term such as: big databases, remote communication, IoT devices, various sensors (e.g., water meter sensor), data analysis, data centers, data processing that requires strong CPU usage, wireless data transfer, artificial intelligence and much more. On the other side, blockchain comes with linked peers, verified transactions, distributed network, consensus mechanism, certified validators, decentralization, transparency and immutability.
Even if Big Data represents huge amounts of data that are generated and processed with high speed and blockchain is a technology that, at the beginning of its existence, had serious restrictions on the amount of transactions that can be processed on a concrete time-frame, nowadays it is possible to use these two solutions in the same architecture in order to create robust and secure applications.

4.1. Big Data Solutions

Big Data concepts have become more and more popular in recent years, since the amount of data generated by both human actions and machines/software components increases each day. Expanded in all the domains, and with an increasing number of developed solutions in various sectors, this concept has challenged software architects to find new ways to store, process and use this amount of data. On the other hand, Blockchain comes with a new concept of decentralized architecture, increased security, transparency providing data ownership and trust [74].
Adamala [75] described the advantages of using Big Data in water resources engineering. They started by defining the “V” dimensions of the Big Data: volume (the data that are generated: terabytes, petabytes and exabytes), velocity (the duration from the time when data are generated until the time when it is processed and analyzed), variety (characterized by the different types of data that can be processed: unstructured or structured, relational or non-relational), veracity (referring to data accuracy) and value (the value added by Big Data usage for a concrete set of data). All these data require a lot of attention and strong processing techniques based on well-defined algorithms and very efficient optimization in order to create valuable systems that can determine or make actions in an (semi-)autonomous manner. Regarding analyzing techniques that are used in Big Data, the author enumerated: A|B testing, classification, cluster analysis, data integration, data mining, ensemble learning, genetic algorithm, machine learning, natural language processing, neural network, network analysis, optimization, pattern recognition, regression, sentiment analysis, signal processing, spatial analysis, statistics, simulation, time series analysis and visualization. Some examples of Big Data usage in the water domain can be irrigation solutions with monitoring sensors and real time data processing or water pollution prevent system that could be easily used to report faster any incidents, but also many other applications in the water decision support system or other sub-domains.
Part of the previous presented tools and technologies were used in the article posted by the authors of [76]. In this paper, they presented a Big Data solution combined with some computational technologies approach regarding ways of improving the process of water pollution minimization. One of the tools that they provide as example in SAGIS (Source Apportionment GIS) tool used to link all the factors: human health, wastewater, environment and chemical substances that are thrown in the water and produce a big impact in the entire ecosystem. Even if the Big Data technologies evolved so much in the last period, there are still some limitations and a lot of space for improvements when talking about the water sector.
The importance of water treatment is also discussed in [77]. The authors concluded that the development process for a solution that aims to improve the water sector is more complex than others due to a multitude of factors, the amount of data that can be collected from various sensors (quality sensors, water flow sensors, environment sensors) become hard to be parsed and analyzed; however, once the system is improved and developed, there is a consistent additional value that will be added in the water management workflows, decision making and water treatment processes.

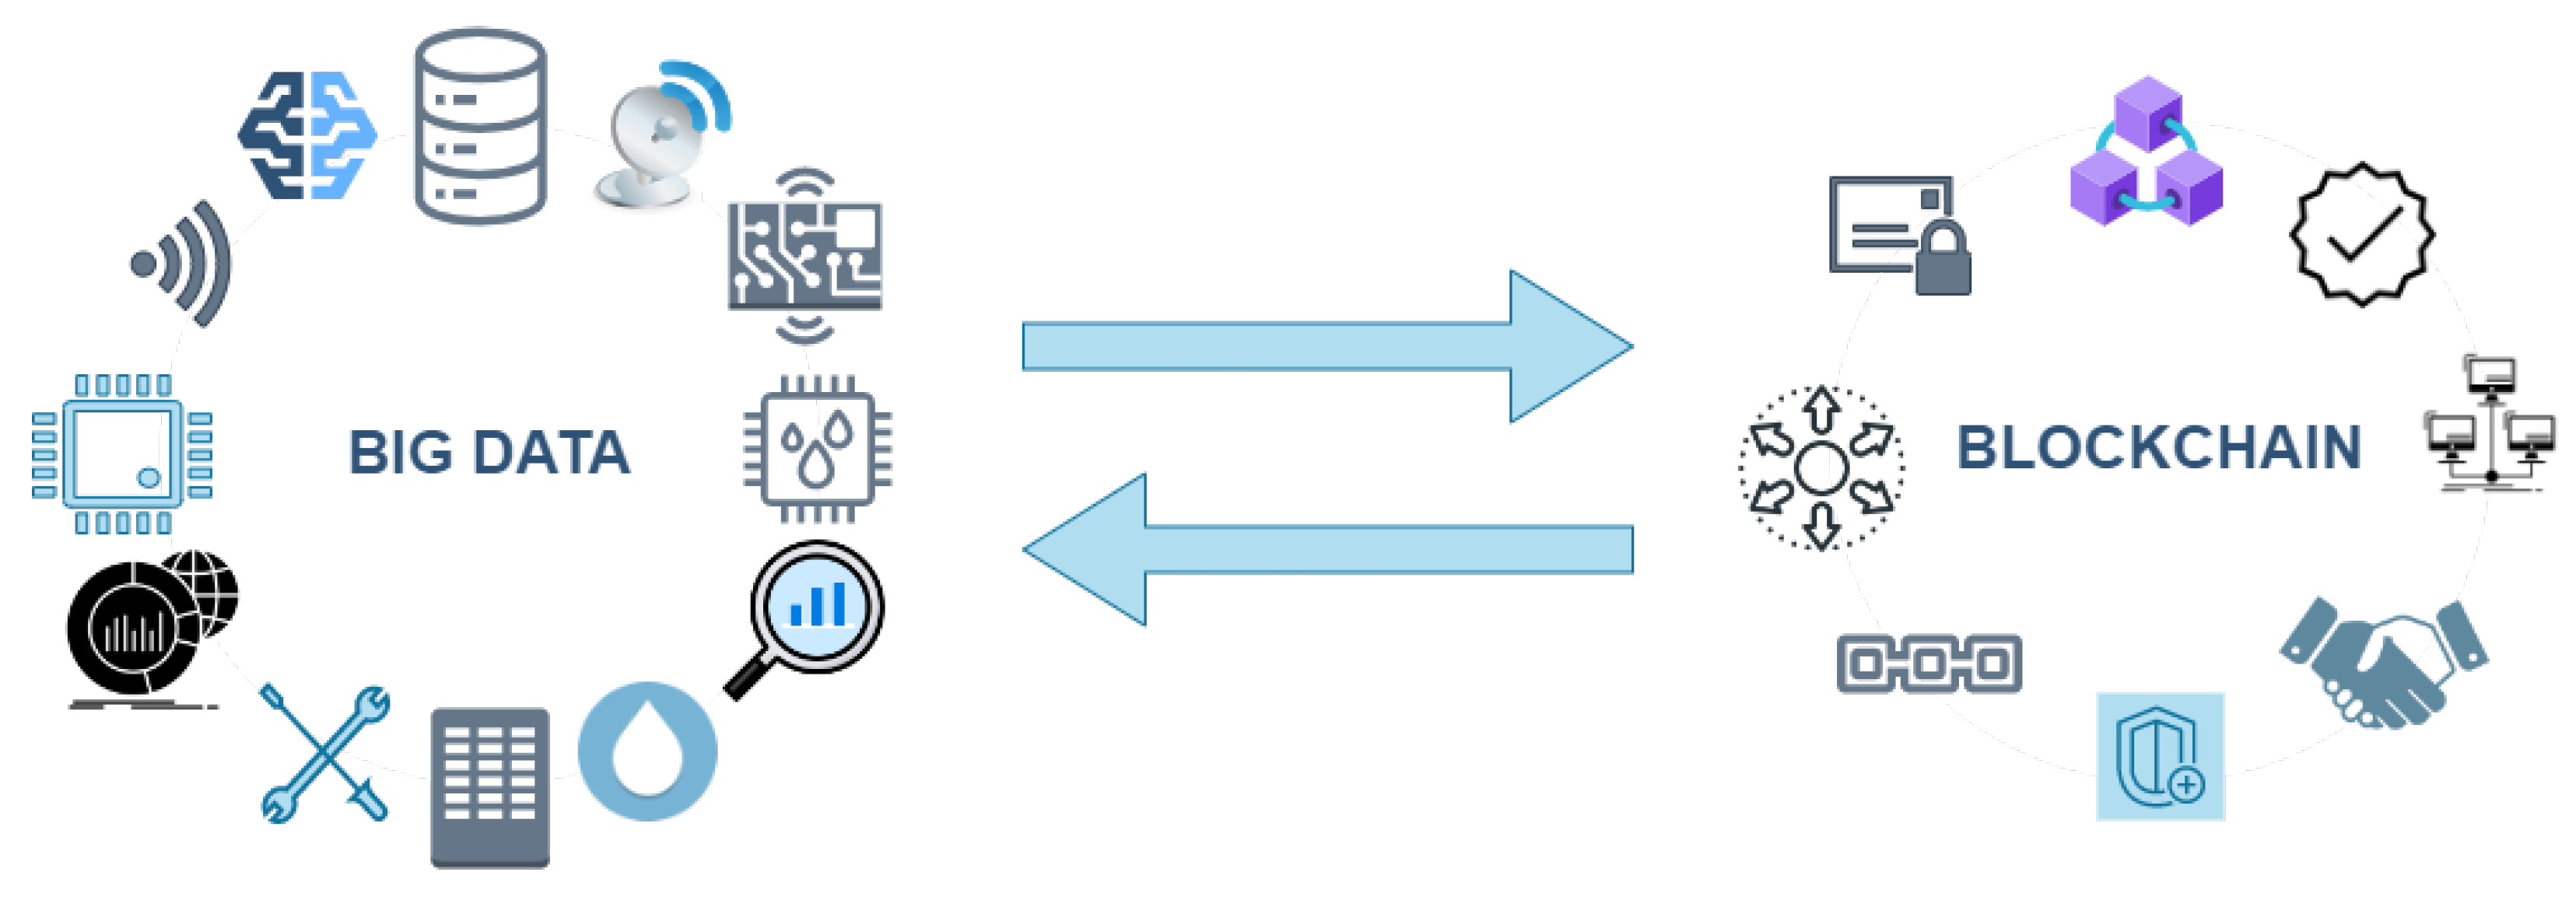
4.2. Big Data and Blockchain Solutions

To accomplish a higher standard of security and privacy, when talking about Big Data, Es-Samaali, Outchakoucht and Leroy [78] designed a solution that uses blockchain in order to facilitate the access to the data, naming the solution an access control framework. According to the same paper, even though there are new technologies and tools that can be used in this domain (Spark, Hadoop, NoSQL), there is still an increasing demand for ensuring that the applications are robust and secure but also to minimize the potential attacks that may happen. In this context, blockchain allows solutions based on peer-to-peer communication, where there is no need for a central authority to validate all the operations and the actions happening by consensus mechanisms.
The increased security of blockchain architecture may be used also in water irrigation systems [79]. Starting from a previously designed project named SWAM (smart water management), the authors added the blockchain infrastructure as an additional layer of trust by authorizing the device and improve the security of the sensors that are monitoring the water quality and the communication between the sensors and the gateway. Further, an important aspect that was taken into consideration is the fact that by using blockchain, the amount of data that is transmitted from the nodes to the platform is not modified.
An important water-related sector where blockchain technology can be used is waste water management. Hakak et al. [80] designed an architecture of a blockchain solution based on initial case studies and presented all the requirements in order to integrate this technology in the waste water/pollution preventing domain.
Another important sector where Big data and Blockchain can be used is in the context of Smart Cities. According to Yu, Yang and Sinnott [81], an important aspect in the Smart Cities environments is the way of validating and auditing all the data that are transmitted by various systems and applications. Big Data are generated by a multitude of sensors, devices, IoT components and so on, and all the data should be audited in an optimized way, since the performance of the audit system determines the performance of the used AI architecture. The Big data auditing schemes raised more and more attention during the last period and this is why the authors of this paper designed an optimized solution based on blockchain with decreased costs (especially on computations) in comparison with the existing schemes.
Even if the usage of these two technologies together (Big Data and Blockchain) seem to be hard to accomplish, Hassani, Huang and Silva wrote the article named “Big-Crypto” [82], in which these two concepts are presented and linked together based on concrete solutions or proposed architectures. The aim of that paper is to review what has been studied in these areas and evaluate solutions in real domains.
The expansion of Big Data technologies impacted most of the sectors, with concrete usage in energy [83], banking [84], analysis [85] or forecasting [86]. Further, various solutions are used in the decision making systems, risk management and water management systems.
Mystiko [87] is another approach of combining blockchain with Big Data, built over Apache Cassandra in order to allow high scalability and full text search. The architecture of this solution is composed by multiple micro-services and each service handles small pieces of the application: storage service, miner service, chain service, Kafka and Etcd (service registry).
As mentioned in the previous subsections, one of the most aspects that may be taken into consideration when using blockchain is the scalability. This is an ongoing impediment that causes a lot of troubles from analysis to the implementation of Blockchain–Big Data solutions, regardless of the domain. A possible solution that uses Hadoop Ecosystem was designed by Sahoo and Baruah [88] and their solution was to shift the validation of the blocks after the blocks were added into the distributed database. Even if the added blocks are invalid, these blocks are kept in the chain to maintain the immutability and the validation/voting process is performed afterwards. Based on Hbase infrastructure, the solution produced good performance metrics, with about 5900 transactions per second for a test infrastructure with eight nodes.

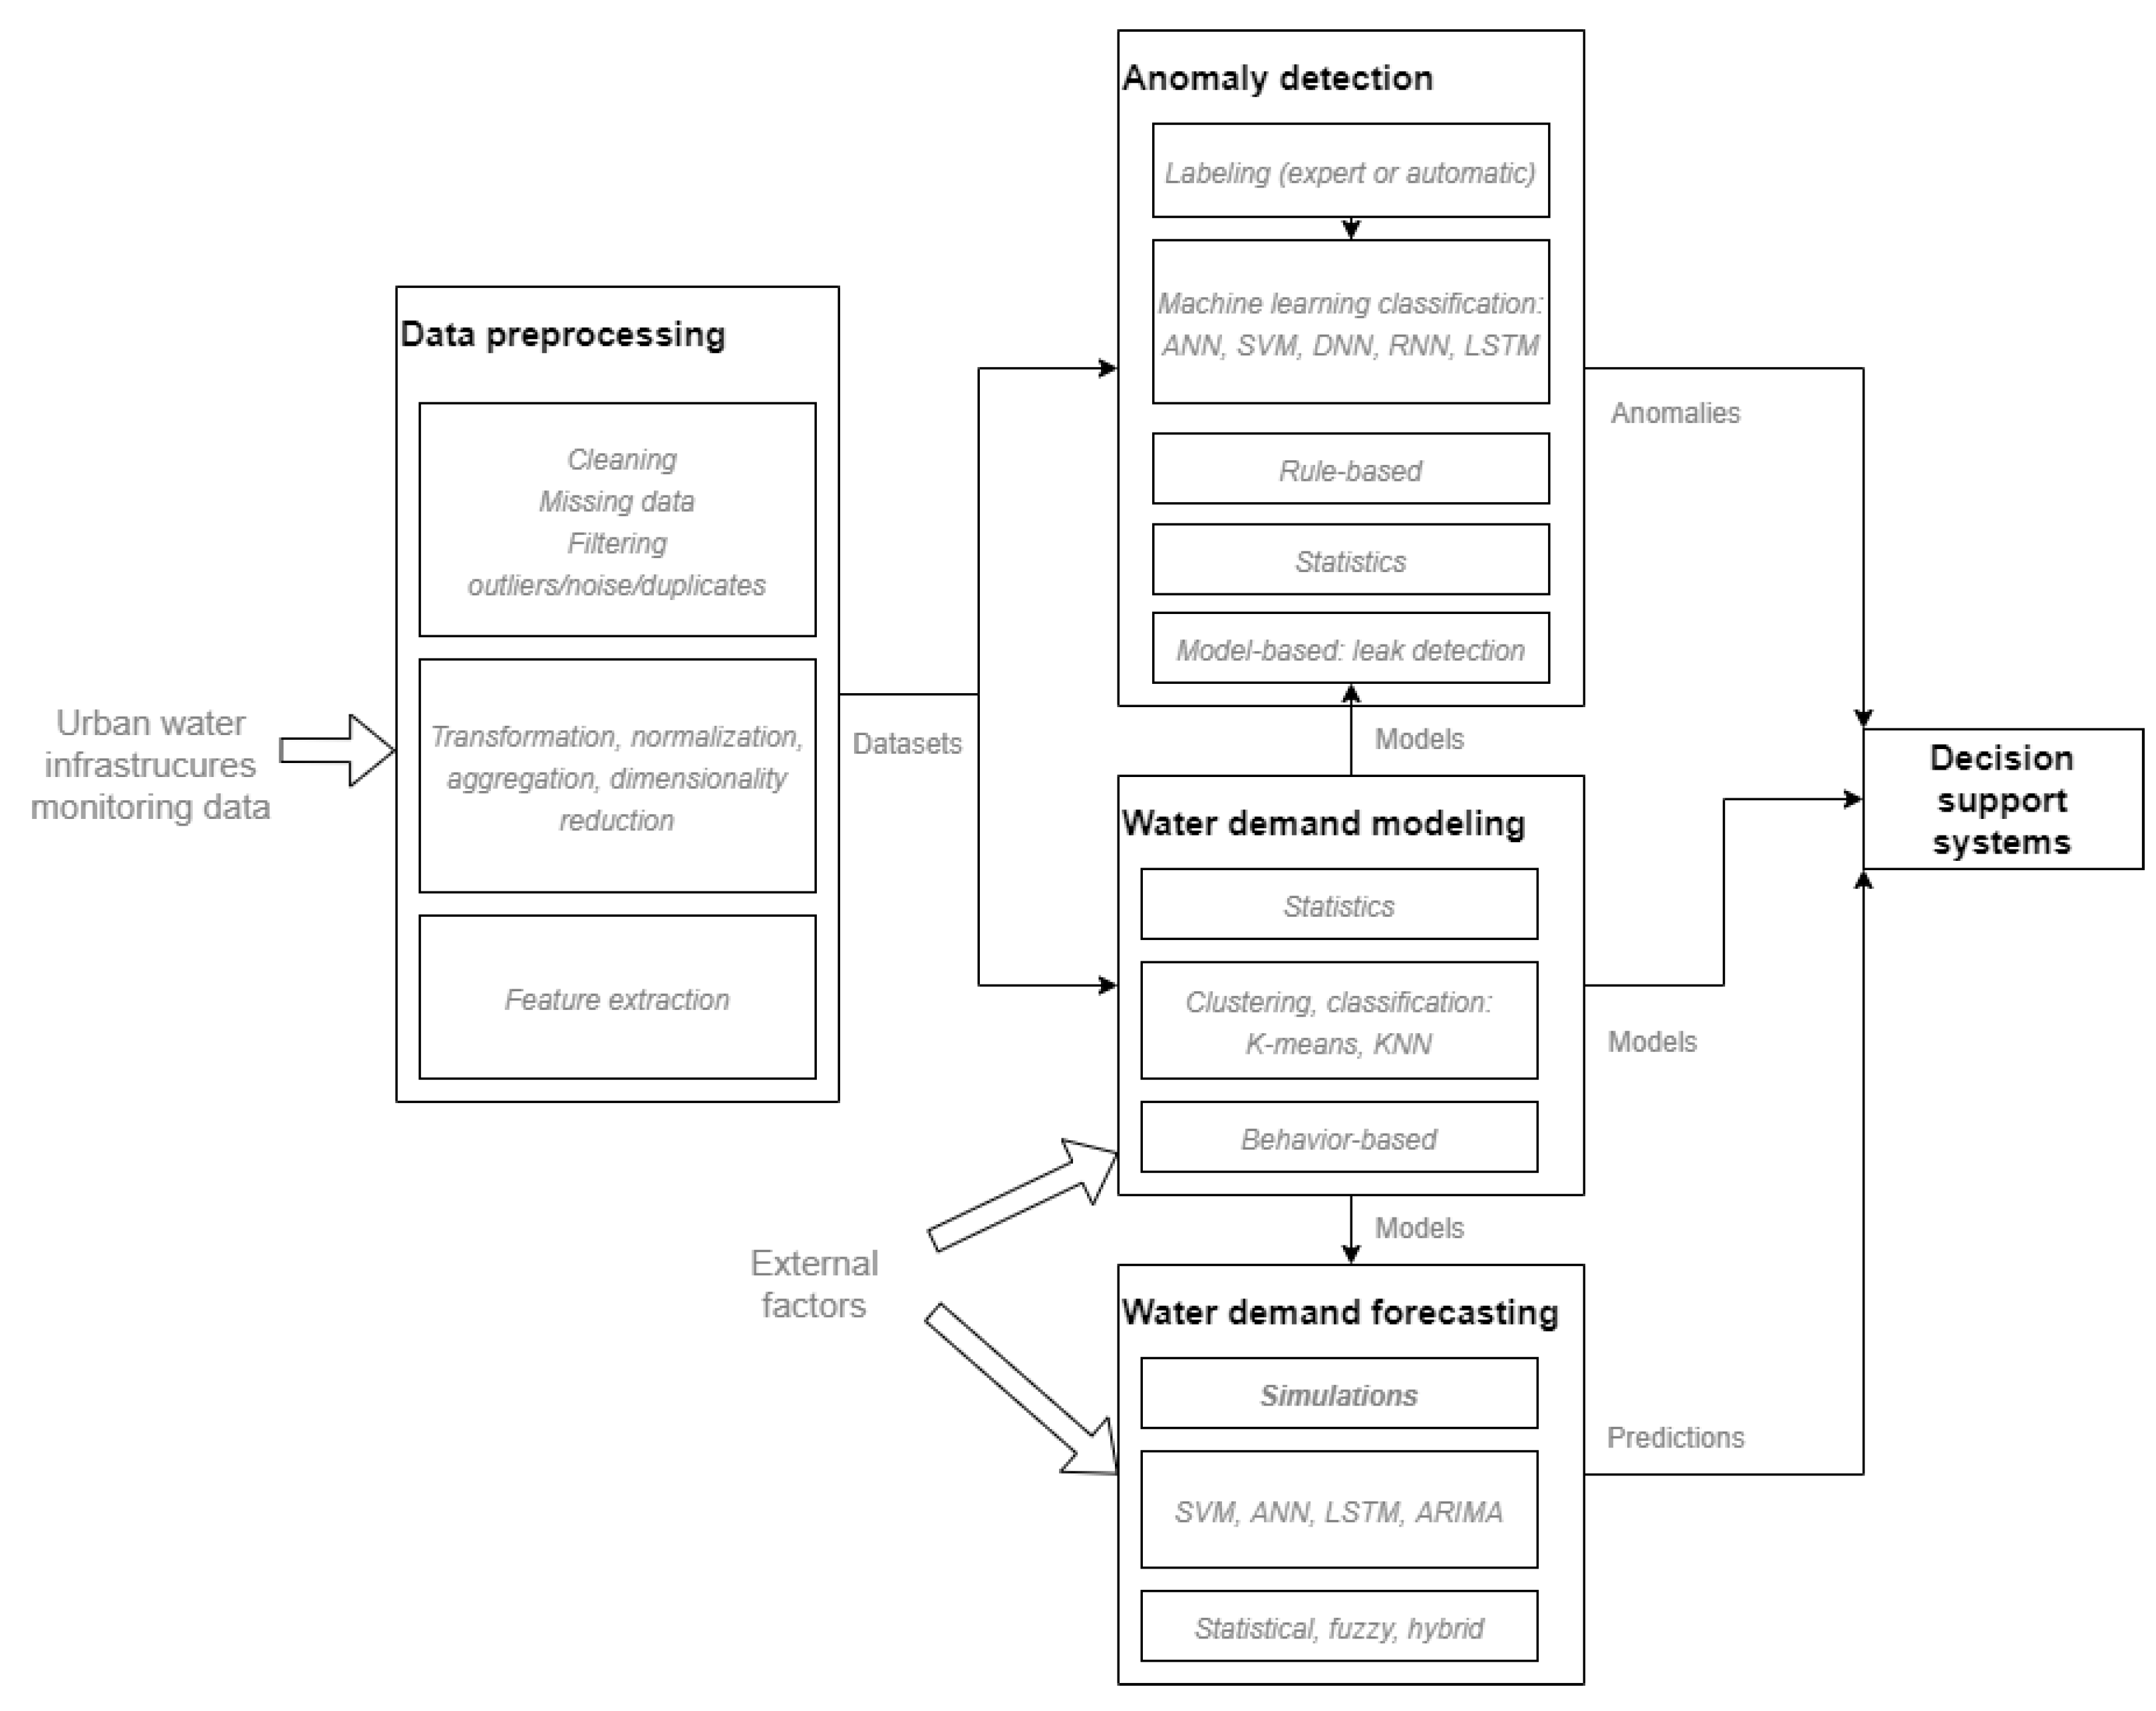
5. Data Analysis in Water Infrastructures

As more data are readily available from smart water monitoring systems, there is need for techniques that extract meaningful information from raw data series, to be used in decision support systems. Data analysis in data collected from urban water infrastructures comprises preprocessing steps, feature extraction, anomaly detection (for signaling abnormal events), pipe failure prediction, water demand modeling and forecasting.

5.1. Data Preprocessing

Irrelevant, noisy or unreliable data have negative effects on the information extracted using any type of data analysis technique. For this reason, raw data need to be transformed through a series of preprocessing steps into datasets that are ready to be analyzed. Data preprocessing techniques include data cleaning, normalization, transformation, scaling, reduction and so on [89].
Sets of data obtained by monitoring urban water infrastructures, such as water quality data or water consumption data, are usually represented as time series or the observation points are time-correlated and the values are mainly sensor readings. As presented in [90], time series are susceptible of several errors due to faulty sensors or due to transmission issues:
  • Missing data—the number of recorded values in a period of time is smaller than the expected one;
  • Duplicate data—there is more than one value with the same timestamp (duplicates are removed from the dataset);
  • Irregular time steps—a data record does not respect the expected time interval between consecutive data records (values will be filled in by interpolation);
  • Sensor failure data—faulty sensors will generate erroneous data that will appear as outliers in a dataset.
To address these problems, various data cleaning techniques are used.
Missing data can be filled in by using estimated average values, predefined default values or through prediction. Kofinas, Spyropoulou and Laspidou [91] propose a methodology for synthetic household water consumption data generation, which they use to fill in missing data in real datasets. In the presented algorithm, distributions of incidents (incidents are defined as periods of time when water is used inside a household) and flowrates are generated based on real water consumption data. These distributions are later used to generate synthetic incidents and flowrates. Finally, to be able to create water incidents that last a few minutes, clusters of incidents are generated by using the law of inverse square distance. In other cases, such as the one presented in [92], missing data are interpreted as a failure of the sensor and data related to that sensor is removed from the dataset.
Outliers generated by faulty sensors can be filtered out by applying lower and upper thresholds. More advanced filtering techniques are sometimes required to remove outliers and noise. In [93], for example, outliers and noise values are removed by using the box–whisker method and the discrete wavelet transform.
More data preprocessing techniques are specific for the preparation of datasets used for machine learning. Transformation, normalization and dimensionality reduction are used in [94] before discovering water consumption patterns through clustering and cluster classification. At first, raw water consumption data are transformed into 24 h consumption columns, so each data point is a weekly mean. Then, a min-max scaler is applied to normalize data. Finally, to improve clustering and classification performance, ‘t-distributed stochastic neighbor embedding’ is used to transform the 24 column normalized data into two column data. Two steps of transformation and normalization are applied on raw data in [95], to discover interconnections between urban water and energy usage. The first transformation step aggregates monthly data into annual data. In the second step, annual water consumption data are transformed in water consumption per person. In the last step, min-max normalization is used in order to increase the performance of the clustering technique.

5.2. Anomaly Detection Techniques

Anomaly detection techniques are used for different purposes in water infrastructures, from detecting water quality problems, such as pollution in ground waters, rivers or water cleaning facilities, to infrastructure issues such as malfunctioning meters, sensors or water leaks, to disruption in consumption patterns or cyber security-related events. As follows, we review anomaly detection methods for three categories of objectives: to detect events in water quality data, to detect disruptions in water consumption patterns and water leaks and, finally, to detect cyber security issues.

5.2.1. Water Quality

There are two main directions of research for anomaly detection in water quality data:
  • Detection of water contamination in rivers;
  • Detection of water contamination in water distribution systems.
The two directions differ in terms of data characteristics and variability, water parameters regulations, anomaly types and more. For this reason, the methods applied for anomaly detection are different.
Leigh et al. [96] present a framework for automated anomaly detection in water-quality data, developed for monitoring of rivers, through a remote sensor system. The first step of the research was to identify and define the different types of anomalies that may be detected in the quality of the rivers’ water, such as: large sudden spikes, low variability of parameters, constant offset, high variability, impossible values, drifts, out-of-range values, missing values, etc. Depending on the anomaly type and the type of the measured parameter, the authors propose different approaches, from rule-based methods, toward regression-based time-series analysis and feature-based methods. The authors conclude that a combination of the proposed methods is likely to provide better results while minimizing false detection rates.
The authors of [97] focus on anomaly detection on data collected from a water cleaning facility. They adapt a data-mining and clustering algorithm called ADWICE (Anomaly Detection With fast Incremental ClustEring [98]). The basic idea of the algorithm is to identify, in the training phase of the algorithm, a set of clusters considered “normal cases” in a multi-dimensional space. An anomaly is considered a multi-parameter observation that does not fit in a normal cluster. As the paper shows, the complexity of the anomaly detection procedure is given by the fact that water quality parameters may have seasonal or cyclic variations that should not be mistaken with variations caused by true contamination.
Dogo et al. [99] analyze supervised machine learning methods used for anomaly detection in quality measurements collected from water distribution networks. The authors group these methods in traditional machine learning, extreme learning and deep learning methods and compare them using F1 score as the metric. They conclude that a solution based on SVM has the best results but it has the important drawback of being time and memory-intensive during training. Hence, Dogo et al. propose a hybrid method that combines deep learning for feature extraction and extreme learning for decision making.
In [100], the authors propose combining several preprocessing and resampling methods with different classifiers in an ensemble learning setup to address the problem of using imbalanced data sets for supervised machine learning. The paper contains an extensive study of the performance of each combination of methods in the ensemble and their respective training time. The conclusion is that dynamic classifier selection techniques can improve classifiers’ ability to learn from imbalanced datasets.
Shalyga, Filonov and Lavrentyev [101] evaluate the possibility of using artificial neural networks (ANN) for anomaly detection in water distribution infrastructures. In order to find the most efficient network configuration for a given dataset, a genetic search algorithm is proposed. For experiments, the authors are using the secure water treatment (SWaT) industrial control system (ICS) testbed dataset. The basic idea behind the anomaly detection is to compare evolution in time of the parameters in the given dataset with the values predicted through the neural network. The authors use different filtering techniques (e.g., exponentially weighted smoothing, mean p-powered error, weighted p-powered error, etc.) in order to reduce the effect of noise or erroneous readings. The goal of the genetic algorithm is to configure the settings of the neural network: the number, type and dimension of layers, the weights and initializes, the type of activation functions used, etc. Finally, the authors evaluate the relevance of different performance metrics in the case of anomaly detection in water quality, demonstrating that the numenta anomaly benchmark (NAB) seams the best choice.
Muharemi, Logofătu and Leon [102] evaluate the impact of imbalanced datasets on several machine learning methods for detecting anomalies in the water quality data, such as: logistic regression, linear discriminator analysis, support vector machines (SVM), ANN, deep neural networks (DNN), recurrent neural networks (RNN) and long short-term memory (LSTM). Their conclusion, based on the conducted experiments, is that all of these methods are greatly affected by imbalanced datasets, but the largest vulnerability was observed for DNN, RNN and LSTM.

5.2.2. Water Consumption

Compared to water quality data, water consumption data are more easily available through smart meters; however, there are less available labeled datasets. As a result, many anomaly detection methods are based on pattern identification/classification or are based on rules.
Vercruyssen et al. [103] propose a semi-supervised anomaly detection method, which they use to detect water leakage in supermarkets. The authors argue that in many real cases supervised learning is not feasible because of the lack of properly labeled data; therefore, an anomaly is considered a sample that deviates significantly from the clusters considered normal. Such an approach, however, may generate false positives for rare cases of normal behaviors; therefore, the authors propose a constrained clustering-based semi-supervised method. The idea is to start as an unsupervised learning method and that, as a high volume of data is collected, corrective measures are applied. The authors propose equations for computing the anomaly score, point deviation, cluster deviation and squashing function, which are used to improve the detection capability of the system. The proposed method outperformed previous methods, which were based only on unsupervised learning.
Patabendige et al. [92] propose a method to detect anomalous water use for non-residential water users. The algorithm calculates an anomaly score for each day, based on ten features of daily demand and its historical context. The score is calculated taking into consideration the K-nearest neighbor (KNN) neighborhood. The authors use calendar contexts within the anomaly detection algorithm. A calendar context for a day d is a subset of days from the database D that would be expected to have similar water use as d. This allows them to give possible causes to the detected anomalies. The score and its explanations are posted to users to help them track down the physical causes of anomalies.
Fuentes and Mauricio [104] propose a water leak detection algorithm based on rules, historical context and user location. The algorithm covers 10 possible water consumption scenarios between normal and anomalous consumption. Five anomalous cases are checked to detect leaks: negative consumption value, continuous consumption in last 24 h, three similar consumption values in a row, high consumption compared to past behavior and user’s presence at home.
The authors of [94] use clustering and cluster classifications techniques based on K-means and KNN to discover water consumption patterns and argue that certain patterns expose water leaks inside households.

5.2.3. Cyber Security

Another important objective for anomaly detection in water infrastructures is the discovery of cyber security issues.
Ramotsoela, Abu and Hancke [105] make a survey of anomaly detection techniques used in critical water infrastructures, with the focus on intrusion detection. The authors classify the different detection methods into parametric and non-parametric methods, based on the methods’ requirements of a-priori knowledge. The authors also analyze the feasibility of using different basic classification and search techniques for anomaly detection, such as: SVM, KNN, ANN, genetic algorithms and hybrid systems. The final part of the paper presents different approaches used for detecting anomalies in water infrastructures, such as data integrity attacks, denial of service (DoS), data tampering and node misbehavior. The conclusion is that complex detection methods that need a training (learning) phase use a high volume of normal and abnormal traffic, which in many cases is not available. Anomalies are less frequent in real infrastructures, which generate imbalanced training sets; therefore, the authors propose experimental setups where anomaly injection can be simulated.
Guathama, Somu and Mathur [106] propose a multilayer perceptron model to identify cyber-attacks against a water treatment infrastructure. In the first step, a temporal model of the system is built using a multilayer neural network. Then, parameter values are predicted based on the obtained model. In the final step, the CUmulative SUM (CUSUM) method is used to detect abnormal deviations between the observed and predicted sensor values. The main challenge of this research was to properly establish a threshold beyond which an anomaly is considered and the elimination of false positives caused by noise.

5.3. Water Demand Models and Forecasting

One of the challenges of water management in urban areas is water demand forecasting. To obtain good results, there are several problems that need attention in this area of research:
  • Understanding the factors that influence water demand;
  • Providing models and discovering patterns for water consumption;
  • Being able to detect and handle changes in water consumption patterns.

5.3.1. Factors That Influence Water Demand

Many factors have impact on water demand forecasting [107,108,109] for industrial, commercial, public and residential customers: housing density, the dynamic of population growth, the water supply system capacity, water prices, the income of customers, climatic conditions and so on.
Rinaudo [109] shows that land-use planning factors such as housing density greatly influence residential water use. Moreover, in the case of single-family houses with outdoor pools or gardens, climate conditions add to the factors that increase water use. Another factor that influences water demand is climate change through increasing temperatures and declining rainfall [109].
Abu-Bakar, Williams and Hallett [107] identify the factors that influence water demand and group them into: environmental, psychological and contextual factors. Environmental factors, including climate, geography, seasonality and population growth mainly influence aggregate water demand. Contextual factors such as plot and building size, outdoor usage, occupants profiles (age, gender, education), metering and psychological factors (awareness, knowledge, conservation behavior) have impact on household water consumption.

5.3.2. Water Consumption Patterns

Being able to provide water consumption models for urban areas is essential for the management of water resources, because they play an important role in the process of estimating aggregated water demand and peak consumption periods. Moreover, models are used to generate synthetic data in simulations, when high frequency data obtained through smart monitoring devices are not available. Kossieris and Makropoulos [110] define statistical models for residential water demand using 15-min and hourly water demand data recorded in 20 households. The authors define a probability density function and cumulative distribution function that describe the water demand process. Furthermore, they explore the statistical properties of the dataset (mean value, standard deviation, skewness, etc.) of the dataset and its variations (seasonal and daily). Finally, the authors evaluate probabilistic models that best fit their data, concluding that Weibull, Gamma and Lognormal distributions perform the best.
A different approach is presented in [111], where household water consumption is estimated by using an agent-based behavioral model, through simulation. Household occupants are modeled as agents with different water use and presence (at home) behavior. Agent’s behavior and daily activities are modeled using state machines. Alvi and Sarjoughian argue that their agent-based simulation approach can be used for policies planning in the absence of high resolution water consumption data.
A higher number of solutions are based on discovering patterns in water consumption data trough clustering [112,113,114]. Dziminska et al. [112] apply two clustering methods, hierarchical agglomeration and K-means, to build histograms of diurnal water consumption for apartment buildings. They discovered at most three different consumption patterns for a single building and concluded that water use was different during work free days. Abu-Bakar, Williams and Hallett [113] discover four distinct water consumption patterns through K-means clustering and KNN classification. K-means clustering was applied after determining the optimum number o clusters (k) using the elbow method. They label the clusters according to the predominant peak demand time and discover that patterns that contained multiple peaks during the day were more prone to internal leaks. Rahim et al. [114] conducted clustering experiments on two datasets derived from raw digital water metering data, one containing engineered features set and another one containing weighted probabilities of water use events (shower, tap, toilet, etc.) that occur at three different time intervals (15 min, 30 min, 60 min). Their conclusion was that K-means clustering works better on the engineered features dataset, whereas on the other data, the number of clusters depends on the type of water use event, the type of day (weekend, week day), profiling interval and probability of use.

5.3.3. Analyzing Water Consumption Changes

It is very important to have methodologies for estimating the impact of newly introduced rules and regulations on water consumption models, to be able to rapidly adjust to increasing water demand. The recent COVID-19 pandemic created the opportunity to assess the impact of spread-prevention actions and population behavior changes on urban water consumption and to create methodologies that support water resources planning and management.
Several papers investigate water consumption pattern changes due to COVID-19 pandemic [94,112,115,116] from different perspectives. Some of them provide methods to support water demand management strategies and water leak detection [94,112], while others try to identify connections with altered behaviors [115] or with new regulations issued by government authorities [116].
Kalbusch et al. [116] apply Wilcoxon and Kruskal–Wallis statistical tests and Prais–Winsten regression models on data collected from IoT monitoring systems to assess water consumption changes in both residential and non-residential areas of Southern Brazil. Through this analysis methods, they observe a decrease of up to 53% in non-residential water use and an increase of 11% in residential water use and correlate these changes with the period in which social distancing measures were applied.
A similar study was conducted by Ludtke et al. [115] on a residential area in northern Germany. In this case, the authors use a linear mixed model to compare daily water consumption before and after the COVID-19 pandemic and eliminate the effects of the climate by applying Bayesian statistic to be able to estimate only the effect of the pandemic. Their results show a 14.3% increase in daily water consumption. Furthermore, the authors investigate possible reasons for the change in the water consumption behavior and conclude that many altered practices may persist and cause permanent changes in water demand peak times and the water volume required in residential areas.
Abu-Bakar, Williams and Hallett [94] focus on identifying changes in household water consumption and water demand peak times by using K-means algorithm for pattern recognition and KNN for pattern classification. The authors provide a characterization of the consumption patterns and an analysis of the shift between patterns and peak consumption times. The methodology proposed in [94] serves as a basis for identifying hotspots within the water distribution network, for detecting household network leaks and as support for water resource planning.
Dziminska et al. [112] use K-means algorithm to discover water consumption patterns for apartment buildings. Their objective was to generate synthetic water demand histograms to be used for modeling water supply networks. The authors observe that while analyzing the data collected before the COVID-19 pandemic, they were able to generate as much as three different daily synthetic patterns, the data collected during the pandemic generated more clusters and inconclusive results due to a certain randomness in the daily water consumption behavior. Their conclusion is that the data analysis methodology needs to change to be able to obtain better results.

5.3.4. Water Demand Forecasting

Forecasting can be performed for short, intermediate (medium) or long term, all implying different approaches. Rinaudo [109] defines the horizons and aims for water demand forecasting as follows:
  • Short-term forecasting: estimate water demand over the coming hours, days and weeks to optimize the operation of water systems focusing on customer behavior;
  • Intermediate-term forecasting: estimate water use over 1 to 10 years to be able to foresee the variability of water consumption by a fixed or slowly changing customer base while considering changes in weather, economic cycles and customer profiles;
  • Long-term forecasting: estimate water use over horizons of 20–30 years to plan and build long-lifespan water supply infrastructures.
Long-term water demand forecasting methodologies, as presented in [109], include temporal extrapolation models, “unit water demand”-based models, multivariate statistical models, models based on end user behavior, models based on urban planning and hybrid models. These models have to be integrated with land-use plans and climate change variables and need to be finely tuned using a number of scenarios that represent plausible possible alternatives for the future. Similarly, the authors of [108] claim that long-term forecasting should rely more on econometric methods and simulations rather than on computational intelligence methods such as machine learning.
Intermediate-term forecasting methods focus more on finding yearly water use patterns in aggregate monthly consumption data. Padulano et al. [117] present a methodology for identifying annual water demand patterns through clustering using K-means and self-organizing map (SOM) to be used for the estimation of water consumption for non-monitored households. Zubaidi et al. [93] propose a methodology to predict monthly water demand, which uses an adaptive neuro-fuzzy inference system. The presented methodology comprises several steps of data preprocessing including normalization, de-noising and feature engineering before feeding the data to the prediction model. The authors stress the positive impact of the preparatory steps executed on raw data on the performance of the predictor.
The amount and the variety of methods that are explored in the area of short-term water demand forecasting is considerably larger than for intermediate or long-term forecasting, the main reason being the multitude of solutions that fit this problem.
An extensive study of short-term water demand prediction methods is presented in [108]. Souza, Azevedo and Libânio group these methods in linear (exponential smoothing, Autoregressive Integrated Moving Averages, linear regression), non-linear (ANN, fuzzy logic, SVM, statistical) and hybrid methods. Their conclusion is that there is no global method or model that outperforms all others in all cases. Moreover, they show that hybrid models are more robust in terms of performance compared to classical models.
Benítez et al. [118] perform a study that applies pattern similarity-based methods to predict water consumption, which they successfully used to detect and locate water leaks in early stages. They conclude that transforming traditional water distribution networks into smart water networks consisting of a large number of devices scattered over the network and measuring a wide variety of parameters of the distribution network in a continuous and automatic manner would support water flow daily predictions.
Boudhaouia and Wira [119] evaluate the robustness of two prediction models for water consumption, which are based on machine learning techniques. Their study reveals the fact that long short-term memory (LSTM) has the lowest errors compared to back-propagation neural network (BPNN) and is able to detect the long-term dependencies between time steps of water consumption.
Du, Zhao and Xie [120] propose an autoregressive moving average model combined with a Markov chain (ARIMA-M) to predict daily water consumption. The Markov chain is used to correct the prediction errors of the ARIMA model, which tend to accumulate over time. The experiments showed that the proposed model improved prediction accuracy and eliminated the effect of overfitting.
Koo et al. [121] conduct extensive experiments on several widely used models for short-term water demand forecasting: ARIMA, radial basis function-artificial neural network (RBS-ANN), quantitative multi-model predictor plus (QMMP+), and LSTM. For the experiments, the authors use hourly water consumption data from smart water meters in an urban area with several types of water consumers (domestic, church, pre-school, restaurants, community center and shops). Their observations show that all these models are limited because they underestimate or overestimate the water demand and fail to estimate peak water consumption amounts. The conclusion is that only water consumption data are not enough to make precise predictions and that there is need for more factors (customer behavior, weather, household members characteristics, etc.) to be considered while building a water demand prediction model.
Figure 5 summarizes the techniques employed for data analysis in the area of urban water infrastructures. The results, water demand models, predictions and datasets annotated with anomaly labels or anomaly scores are inputs for decision support systems, urban planning and water supply infrastructures development.

5.4. Pipe Failure Prediction in Water Supply Networks

Computational intelligence-based tools play an important role in planning the rehabilitation of water supply networks, as the number of unexpected pipe failures can be greatly reduced by replacing the pipes that have the highest probability to break in the near future. If large amounts of data that describe past incidents in the water infrastructure are available, statistical and machine learning techniques can provide predictions about future incidents. There are several approaches to modeling water pipe deterioration using computational intelligence methods. Dawood et al. [122] classify these models into:
  • Failure prediction models, which include pipe break prediction and pipe rate failure assessment methods;
  • Risk analysis models that describe structural deterioration due to age, pipe–soil interaction and other factors;
  • Models for water quality failure due to pipe deterioration;
  • Condition monitoring and assessment models;
  • Remaining useful life models;
  • Leak detection and prioritization models.
Furthermore, they recommend taking into consideration factors such as soil type, traffic loads and trenchless method of construction along with data collected from remote sensors, to obtain more accurate results in estimating pipe break rates.
Giraldo and Rodriguez [123] compare statistical and ML methods for pipe failure modeling. They use pipe failure records collected in a time span of six years to train and validate their models. Besides failure history, the factors taken into consideration for their analysis are pipe material, age and diameter. They also investigate the impact of several other factors on their model such as pipe length, precipitation, land use, soil type and the presence of hydrants. Their conclusion is that both statistical and ML models have shown acceptable results and that Poisson regression was most suitable for predicting lower failure rates, whereas gradient-boosted tree was most suitable for unbalanced datasets.
Robles et al. [124] propose a methodology to predict pipe failures in water supply networks in which they use logistic regression (LR) and support vector classification (SVC) as predictors. The experimental dataset, in this case, contains pipe break and pressure historical data as well as information about pipe material, length, diameter, age and number of connections. To improve the accuracy of their system, the authors employ various preprocessing steps (e.g., missing values and outlier handling, rescaling) before data are passed to the predictors. The experimental results show that both LR and SVC perform very well in terms of accuracy (over 75%) and recall (over 84%), LR having slightly better accuracy in some cases.
Amiri and Najafzadeh [125] present a methodology for assessing pipe break rate by analyzing data containing number of pipe failures, pipe localization, depth of installation, pipe pressure and age. They compute the pipe break rate using three different AI models: multivariate adaptive regression spline (MARS), gene-expression programming (GEP) and M5 model tree. Their experiments show that the MARS model has the best results overall, whereas the GEP model is second best with a slight difference in the testing stage. Moreover, extended experiments on different datasets show that the GEP model tends to overestimate pipe brake rates, while the MARS model proves to be more reliable.

6. Water Infrastructure and Decision Support Systems

In order to have a sustainable economy, natural resources and ecology play a key role, according to the BCC Research Report [126]. The challenge of ensuring the sustainability of water resources is to monitor, plan and manage water supply networks, which evolve from day to day, reaching complex systems that involve multiple integration of data sources.
Emerging Big Data and linked open data (LOD) technologies are solutions for integrating a large amount of data related to water resources management [76]. Thus, significant information can be extracted that helps to create a decision support system based on a wide range of data. The purpose of water monitoring services is to collect and integrate data from different fields, such as: meteorological, environmental, quality data, climate change, feedback, etc. [127]; however, unfortunately, there are still interoperability issues and thus the exchange of data is limited, along with the analytical power of business intelligence (BI) tools.

6.1. Ontologies

Monitoring water consumption and providing the possibility for end users to see their own consumption and can significantly increase awareness, improving the decision-making process regarding the management of water resources [128]. It should be noted that continuous monitoring involves a large volume of data. Such an approach is present in smart cities, where the concept of Internet of Things (IoT) is also integrated. To avoid advanced data analysis techniques, a quick fix is to use ontologies such as smart city ontology (SCO) [129,130].
The analysis of ontologies in the field of water resources has begun to be of great interest to researchers. Water resources management in smart cities emphasizes the supply of water in normal parameters to all consumers [131]. Several studies have been made in order to streamline water management, based on ontologies and aspects related to water quality, its reuse or leak detection [132,133]. In [134], Rivera et al. present the most used related ontologies. There are public and government institutions working to develop new methods by which they can make their data visible, in order to publish it as a LOD. They also focus on creating new user-friendly interfaces to make data easier to analyze.
To increase the degree of enrichment, several knowledge graphs (KG) were used, which are based on LOD concepts such as: DBpedia [135], Wikidata [136] and YAGO [137]. These KGs help the original datasets through connections to other external repositories (GeoNames), allowing access to descriptions and properties in different languages. In addition, an important feature for a valid dataset is consistent data [138]. To create a rich data set, the European Portal [139] collects data from the public portals of European countries.
Based on the Reusing Open Data report [139], it was concluded that the second largest category of data reused by institutions belonging to EU member states is geographical data; thus, by combining several data sets, multidimensional models can be created that provide consistent support in the decision-making process by using different evaluation techniques. To publish multidimensional data, the W3C encourages the use of RDF Data Cube Vocabulary [140].

6.2. Decision Support Systems

Big data collected from sensors are a necessary food for DL to generate those predictions but, at the same time, are a challenge requiring decisions to choose only relevant data from a huge data set [141]. The dire need for the development of decision support systems came due to an explosive economic urban growth [142,143]. Sustainability of water resources entails a complex urban water management system, integrating new technologies and decision-making systems to facilitate data modeling and consumption efficiency [144,145]. This provides a broader view of the water sector and thus consumption can be optimized, providing longer-term reliability.
It should also be noted that the water management system is complex and to control it, it requires resources, methods and statistics as a basis for decision-making systems [146,147]. A key factor is represented by data collection, analysis, processing and storage [148]. Another decision is to choose representative data from a big data collection [149]. For example, making predictions provides decision support for accurate optimizations.
A new challenge in the context of decision-making systems is to build an efficient water management infrastructure. In order to achieve this, it is necessary to know in detail the problems related to urban water consumption [150,151]. Moreover, water consumption has increased rapidly in recent times. Some of the reasons are climate change and rising temperatures, industrial development and population growth [152]; therefore, a decision taken in this direction to reduce the volume of water consumed is to increase water prices [153]. For this reason, it is recommended that consumption data be analyzed from several perspectives.
Obviously, good decisions made in a timely manner provide optimal results; however, in order for a decision to be good, several perspectives must be analyzed in parallel, both from a socio-economic and a cost–benefit point of view. Moreover, if the decision involves the integration of several areas, then it is considered complex and a more in-depth analysis is needed [154].
On the other hand, it must be taken into account that a complex analysis can make the prediction process difficult [155]. Various studies have been performed in the field of urban water management over time, and researchers have discovered and proposed a variety of solutions, including statistical analysis models [120], exponential smoothing methods [156], grey theory models [157], neural network models (ANN [158] and LSTM [159]).

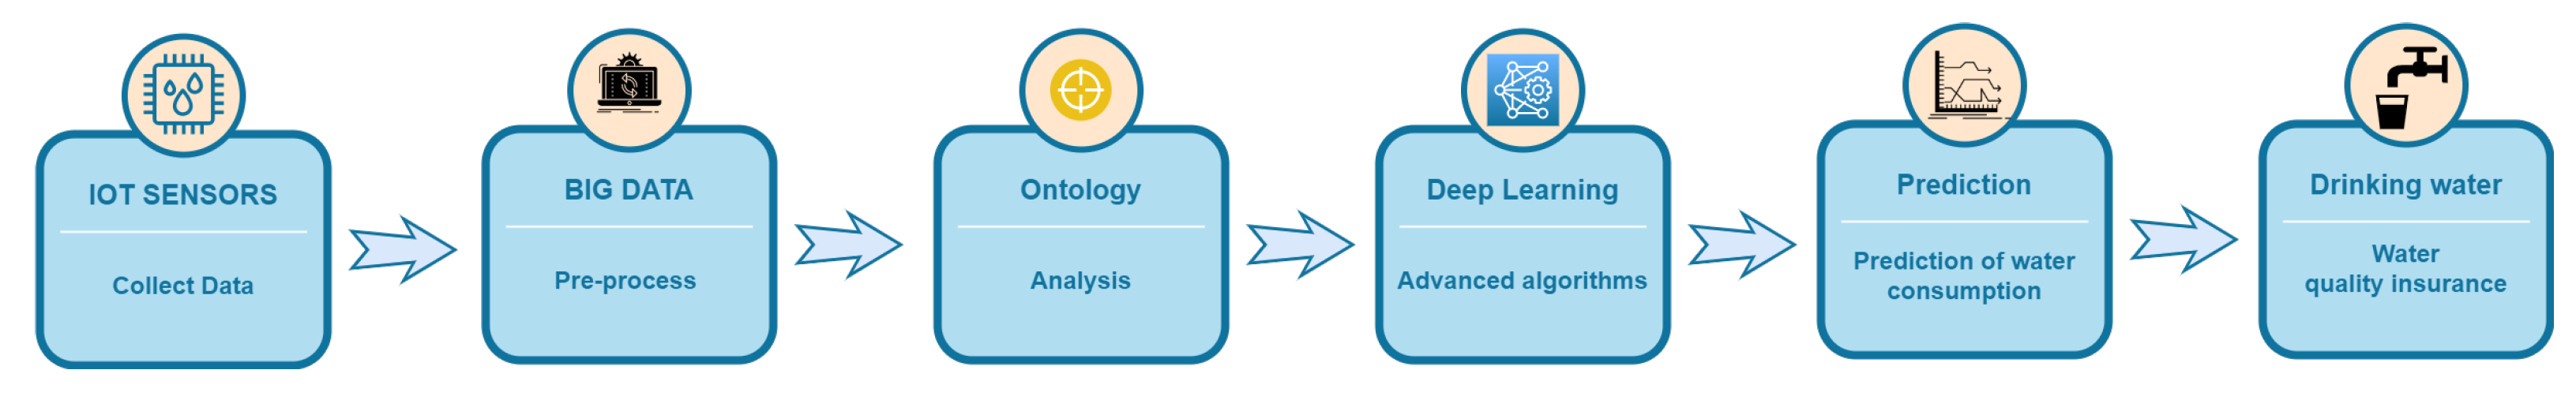
6.3. Deep Learning Solutions

As mentioned in the previous subsection, deep learning (DL) has a major impact on research today [160]. In the field of water, DL has a significant role in trying to solve challenges such as interdisciplinarity, hydrological scaling, regionalization of data, etc. Research in other fields is an important basis for water resources management. For example, it has been found that DL is increasingly used in scientific exploration [161]. Scientists claim that DL is essential in the decision-making process, by analyzing in depth the neural networks and extracting perspectives/directions. Moreover, DL obtained unrivaled results in improving highly accurate predictions [162].
Since 2012, DL has achieved undisputed performance as a leader in machine learning [163]. If, traditionally, water science consists only in tracking and managing the water cycle, with the advent of DL in studies related to water resources management, new challenges appear such as interaction with other subsystems (climate, vegetation, socio-economics, human dynamics) [164]. Currently, several aspects need to be considered in order to build a sustainable ecosystem, such as human feedback, high water demand due to population growth, water quality, etc. Moreover, urban water infrastructure is very complex and depends of many parameters, but nowadays advanced technology offers enough resources to overcome this challenge [165].

6.4. Predicting Water Consumption

For statistical analysis methods to provide encouraging results, the data collected need to meet certain assumptions, which is not always feasible. Further, grey theory models are used especially in the context of rare data; however, given that water consumption involves several factors, a more in-depth analysis is needed to provide a more accurate prediction of a complex volume of data. For example, in [166] the authors described a model for predicting water consumption in the Middle East, using neural networks combined with time series. This solution is also based on climate factors, which are constantly changing and can have a major impact on consumption.
Another approach to predicting water consumption, which is also based on climatic factors, is presented in [167] and consists of using an improved fuzzy wave pattern. This model uses noise reduction methods for water consumption over a period of time, using this data to train the model. Thus, the results obtained are more efficient than the classic fuzzy models; therefore, climate change is an essential component in the decision-making process related to consumption efficiency methods; however, keep in mind that there are many other factors that can change water consumption. Achieving an optimal connection between factors while also optimizing each factor is a complex process.

6.5. Drinking Water and Health Risks

An in-depth understanding of the characteristics of water quality and quantity plays an important role in making timely decisions to avoid certain risks. Moreover, drinking water is essential for survival; therefore, more attention should be paid to the allocation of water resources, while taking into account risk management. In this sense, decision support models are indispensable, streamlining risk assessment and applying mitigation measures in order to facilitate access to available water resources.
A factor that should not be neglected is the transmission of diseases through water, if it does not meet all the conditions related to quality. Thus, a quantitative microbial risk analysis (QMRA) is also needed [168]. For such an analysis, decision makers play an important role in risk mitigation. A cost–benefit analysis (CBA) must also be considered to maintain a healthy and sustainable ecosystem and to minimize the socio-economic risks. For example, in [169] the authors proposed an evaluation of drinking water, from a chemical and aesthetic point of view. In principle, the decisions already taken were analyzed and an overview of the aspects before and after the decisions taken was observed. Moreover, it was found that following this analysis, more accurate predictions are obtained regarding the cost–benefit aspects.
Another approach is presented in [170], combining QMRA and CBA to measure microbial health risks and socio-economic profitability. Moreover, in the process of drinking water treatment, the need for a holistic approach is emphasized. The results obtained are an essential input for the decision makers, helping the water suppliers to make the right decisions at the right time. It is also important to integrate several citations into the decision-making process. Consumers play a key role in this process and therefore it should be noted how they perceive water quality, the risks that may occur to health and the costs involved in drinking water treatment.
Figure 6 presents the flow of a decision system within the water infrastructure. It starts with collecting data from smart sensors and continues with pre-processing the data. Given that the volume of data obtained is large and that not all the data collected are revealing, the inconclusive ones must be eliminated. The next step is to analyze the data and use the ontologies to give consistency to the entire data set. After that, advanced machine learning algorithms, more specifically deep learning algorithms are used to make predictions regarding water consumption. The aim is to continuously monitor the demand for water to ensure the quality of drinking water and also to prevent the risks that may arise due to leaks, waste or water scarcity.

7. Conclusions

As shown in Figure 7, urban waters infrastructure management, in the context of a Smart City, has multiple challenging aspects that include: smart infrastructure monitoring, data collection, storage and management, data analysis and decision support. In this paper, we made an overview of state-of-the-art techniques applied in these areas of interest.
In Section 2, the Smart City concept is described, based on extensive literature reviews, as a broad context for water infrastructure management, with many interconnected domains that integrate large-scale technologies and frameworks. From smart infrastructure, to data collection, and to advanced computational strategies, the developments in Smart City provide a vast ecosystem of technologies and approaches for urban water infrastructure. Considering the smart water infrastructure, the enabling technologies and frameworks are presented with a focus on the physical devices that can provide low-level sensing capabilities, and the high-level processing strategies based on frameworks and open datasets in the water domain.
In Section 3, the perspectives for integrating IoT technologies in monitoring water infrastructure are evaluated in terms of potential scenarios and applications. The IoT component is represented by physical devices and platforms that can be adapted for monitoring various parameters in water supply systems. The section includes a classification of IoT development boards and a literature review of IoT platforms that can provide practical guidelines for possible applications in this domain. Multiple technologies and frameworks are described, from industrial standards to research works and reference architectures.
Throughout Section 4, the possibilities for using Big Data and Blockchain in water resource domain were evaluated. The research has shown that the Big Data methods can be successfully applied in a large variety of water systems. An important interest is manifested in the waste water management, water pollution prevention, irrigations and water resource management. From data collection to data processing and decision making, Big Data is an important tool that can facilitate all the phases and automate the flows. Blockchain may add the trust, security and transparency that are crucial factors for all these systems in order to be robust and secure. The usage of these two architectures in the same context is possible and guarantee for healthy and solid solutions. Another important aspect in the context of globalization is related to application scaling and integration between various technical solutions. As lesson learned from the previous implementations it is critical to achieve easy-to-integrate architectures that put together multiple institutions from various layers (federal, regional, local) with companies from private sectors. Blockchain can be an innovative solution for this requirements by its decentralization and security facilities. The technology can be a bridge between a local used solution to a global infrastructure accessible around the world and managed through consensus mechanisms by consortium of international organizations.
Data analysis plays an important role in the management of smart urban water infrastructures, as the information that can be extracted from a very large amount of monitoring data is quite valuable and can bring insight about the maintenance and further development of water infrastructures. Section 5 presents a review of the techniques and methodologies employed in this area, from pre-processing methods applied on raw data, to anomaly detection, to water pipe failure prediction, to water demand modeling and forecasting. As in many other areas of research where large amounts of data are generated, there are many techniques that are based on clustering and classification using machine learning; however, still, in some cases (e.g., anomaly source explanation, water demand model characterization) rule-based or statistical approaches have been proven useful. Computational intelligence techniques proved to produce highly accurate results for anomaly detection, water demand pattern extraction and classification, pipe failure prediction and for short term water demand forecasting. Of course, there are cases in which these techniques will not produce good results, and this is the case for long term water demand forecasting, where, as presented in our overview, there is need for other types of solutions. As expected, we cannot provide a general recipe for any of the aspects of data analysis in this field of interest, nor point out a technique that will provide a minimum guaranteed performance for water infrastructure datasets, because there may be multiple pre-processing and data analysis combinations of steps that will produce similar results in terms of performance; however, our review presents some solutions that have good results for several categories of problems. By analyzing the available literature on the subject, we can point out that future developments need to be directed towards integrating weather, economical, administrative and user behavior data into models developed for urban water management.
The majority of the computational intelligence techniques reviewed in this paper have been tested on a small scale to assess their potential for decision support, in the context of urban water infrastructure maintenance and administration. Decision support systems must integrate many distinct tools to be able to address multiple issues such as insuring water quality, water availability, infrastructure maintenance and so on. For example, notifications and alarms are generated by anomaly detection tools to signal abnormalities such as water contamination, distribution network malfunctions, or water treatment facility cyber attacks. Water demand models are used together with simulation tools to assess the effect of introducing new rules towards lowering water consumption, or to evaluate water demand for residential areas under development. Pipe failure predictors need to be integrated in infrastructure maintenance planning tools to be able to reduce the high costs of unexpected pipe breaks. Future steps must be directed towards the integration of these tools and their interoperability, through data and methodology standardization, to be able to create large scale systems for water infrastructure management.
Section 6 highlights the importance of monitoring water consumption using modern algorithms for data processing, analysis and prediction, thus providing input for an intelligent decision-making system. Quantifying the demand, use and risks in terms of water resources is a particularly important challenge with effects now but especially in the future. To better understand the problems related to ecological risks and human health and to make informed decisions, it is important to use new methods and tools that improve access to data and facilitate the open exchange of information about water. This challenge can be made possible by using the concept of open water data, which provides an innovative infrastructure and support for data sharing and modeling in order to develop new, modern and optimal solutions. Decision support systems domain had a significant increase in the last decades. From simple solutions, based on trivial methods to sophisticated architectures that includes multiple areas, complex algorithms for mapping and modeling water data with cross-domains scalable technologies, nowadays the possibilities are much more variate and creates bridges between local and global stakeholders. With all these components, we must take into account a new key factor: ensuring the security (both data security and applications security). Another point of view when talking about water solutions workflows is the security of the processes that are applied in water treatments in order to not alter the data that are used in the applications but also affect the worldwide ecosystem or the humans health. Global water consumption is growing significantly each year. This influences the decisions made at the socio-economic level to keep the management of water resources under control. A major risk for society is water shortages. Water demand is increasing in recent years and thus the supply capacity is limited. An effective solution is to continuously monitor the demand and consumption of water resources to prevent risks. Furthermore, the steps of processing and analyzing the data collected from the sensors are essential in the decision-making process. Ontologies also provide data consistency that is then analyzed using complex machine and deep learning algorithms. Deep learning has stood out in recent years for the accuracy of its results, being indispensable in studies conducted by researchers. Moreover, it offers encouraging results in predicting water consumption, being an important factor in conserving water resources. Finally, in order to keep drinking water within normal parameters that do not affect human health and to avoid other risks that may arise, additional attention should be paid to the steps described above.
As presented throughout this paper, there are many advanced technologies and methods that are used to develop smart water management systems: IoT for smart monitoring, blockchain for data management, computational intelligence for data analysis and ontologies for knowledge representation; however, ICT technologies alone do not solve all the issues of urban water management as many more factors such as climate change, social, economical, political and behavioral, influence this domain; thus, efficient management of water resources is a permanent challenge for society, especially for researchers who have to provide the technological means for these complex interdisciplinary systems.

Author Contributions

Conceptualization, methodology, and formal analysis: M.M. and A.H.; investigation, resources, and writing: A.H., C.-G.C., D.A., Z.C., D.F.L., M.M., B.P., A.P., G.S.; visualization, A.P.; supervision, A.H.; project administration, C.-G.C. and M.M.; funding acquisition, C.-G.C. All authors have read and agreed to the published version of the manuscript.

Funding

This research was funded by UEFISCDI, grant number PN-III-P2-2.1-PED-2019-4993, Smart Urban Water-Based on Community Participation Through Gamification—Watergame Project.

Institutional Review Board Statement

Not applicable.

Informed Consent Statement

Not applicable.

Data Availability Statement

Not applicable.

Conflicts of Interest

The authors declare no conflict of interest.

References

  1. Jan, F.; Min-Allah, N.; Düştegör, D. IoT Based Smart Water Quality Monitoring: Recent Techniques, Trends and Challenges for Domestic Applications. Water 2021, 13, 1729. [Google Scholar] [CrossRef]
  2. Jan, F.; Min-Allah, N.; Saeed, S.; Iqbal, S.Z.; Ahmed, R. IoT-Based Solutions to Monitor Water Level, Leakage, and Motor Control for Smart Water Tanks. Water 2022, 14, 309. [Google Scholar] [CrossRef]
  3. Danilenko, A.; Dickson, E.; Jacobsen, M. Climate Change and Urban Water Utilities: Challenges and Opportunities; World Bank: Washington, DC, USA, 2010. [Google Scholar]
  4. Advisory Committee on Water Information Open Water Data Initiative Overview. Available online: https://acwi.gov/spatial/owdi/ (accessed on 25 June 2022).
  5. Commission, E. INSPIRE. Available online: https://inspire.ec.europa.eu/ (accessed on 25 June 2022).
  6. Commission, E. INSPIRE CONFERENCE 2021: Towards a Common European Green Deal Data Space for Environment and Sustainability. Available online: https://inspire.ec.europa.eu/conference2021 (accessed on 25 June 2022).
  7. Pamidimukkala, A.; Kermanshachi, S.; Adepu, N.; Safapour, E. Resilience in Water Infrastructures: A Review of Challenges and Adoption Strategies. Sustainability 2021, 13, 2986. [Google Scholar] [CrossRef]
  8. Predescu, A.; Mocanu, M. A data driven survey of video games. In Proceedings of the 2020 12th International Conference on Electronics, Computers and Artificial Intelligence (ECAI), Bucharest, Romania, 25–27 June 2020; pp. 1–6. [Google Scholar] [CrossRef]
  9. Predescu, A.; Arsene, D.; Pahonțu, B.; Mocanu, M.; Chiru, C. A Serious Gaming Approach for Crowdsensing in Urban Water Infrastructure with Blockchain Support. Appl. Sci. 2021, 11, 1449. [Google Scholar] [CrossRef]
  10. Stübinger, J.; Schneider, L. Understanding Smart City—A Data-Driven Literature Review. Sustainability 2020, 12, 8460. [Google Scholar] [CrossRef]
  11. Bellini, P.; Nesi, P.; Pantaleo, G. IoT-Enabled Smart Cities: A Review of Concepts, Frameworks and Key Technologies. Appl. Sci. 2022, 12, 1607. [Google Scholar] [CrossRef]
  12. Oberascher, M.; Rauch, W.; Sitzenfrei, R. Towards a smart water city: A comprehensive review of applications, data requirements, and communication technologies for integrated management. Sustain. Cities Soc. 2022, 76, 103442. [Google Scholar] [CrossRef]
  13. Hardware and Software Techniques for Pipeline Integrity and Leak Detection Monitoring, Vol. All Days, SPE Offshore Europe Conference and Exhibition, SPE-23044-MS. 1991. Available online: https://onepetro.org/SPEOE/proceedings-pdf/91OE/All-91OE/SPE-23044-MS/2002568/spe-23044-ms.pdf (accessed on 12 April 2022).
  14. Geiger, I.G. Principles of leak detection. Fundam. Leak Detection. KROHNE Oil Gas 2005, 2005, 3–6. [Google Scholar]
  15. Sharma, S.L.; Qavi, A.; Kumari, K. Oil pipelines/water pipeline crawling robot for leakage detection/cleaning of pipes. Glob. J. Res. Eng. 2014, 14, 30–38. [Google Scholar]
  16. Choi, C. Robot Design for Leak Detection in Water-Pipe Systems. Ph.D. Thesis, Massachusetts Institute of Technology, Cambridge, MA, USA, 2012. [Google Scholar]
  17. Oven, S. Leak Detection in Pipelines by the Use of State and Parameter Estimation. Master’s Thesis, Institutt for Teknisk Kybernetikk, Trondheim, Norway, 2014. [Google Scholar]
  18. Lupu, C.; Chirita, D.; Iftime, S.; Miclaus, R. Consideration on leak/fault detection system in mass transfer networks. Energy Procedia 2017, 112, 58–66. [Google Scholar] [CrossRef]
  19. Isermann, R. Process fault detection based on modeling and estimation methods—A survey. Automatica 1984, 20, 387–404. [Google Scholar] [CrossRef]
  20. Predescu, A.; Mocanu, M.; Lupu, C. Modeling the effects of leaks on measured parameters in a water distribution system. In Proceedings of the 2017 21st International Conference on Control Systems and Computer Science (CSCS), Bucharest, Romania, 29–31 May 2017; pp. 585–590. [Google Scholar]
  21. Predescu, A.; Mocanu, M.; Lupu, C. Real time implementation of IoT structure for pumping stations in a water distribution system. In Proceedings of the 2017 21st International Conference on System Theory, Control and Computing (ICSTCC), Sinaia, Romania, 19–21 October 2017; pp. 529–534. [Google Scholar]
  22. Predescu, A.; Negru, C.; Mocanu, M.; Lupu, C.; Candelieri, A. A multiple-layer clustering method for real-time decision support in a water distribution system. In Lecture Notes in Business Information Processing, Proceedings of the International Conference on Business Information Systems, Berlin, Germany, 18–20 July 2018; Springer: Cham, Switzerland, 2018; pp. 485–497. [Google Scholar]
  23. Predescu, A.; Negru, C.; Mocanu, M.; Lupu, C. Real-time clustering for priority evaluation in a water distribution system. In Proceedings of the 2018 IEEE International Conference on Automation, Quality and Testing, Robotics (AQTR), Cluj-Napoca, Romania, 24–26 May 2018; pp. 1–6. [Google Scholar]
  24. Moglia, M.; Burn, S.; Meddings, S. Decision support system for water pipeline renewal prioritisation. J. Inf. Technol. Constr. (ITcon) 2006, 11, 237–256. [Google Scholar]
  25. Predescu, A.; Mocanu, M.; Lupu, C. A modern approach for leak detection in water distribution systems. In Proceedings of the 2018 22nd International Conference on System Theory, Control and Computing (ICSTCC), Sinaia, Romania, 10–12 October 2018; pp. 486–491. [Google Scholar]
  26. Candelieri, A. Clustering and support vector regression for water demand forecasting and anomaly detection. Water 2017, 9, 224. [Google Scholar] [CrossRef]
  27. Candelieri, A.; Soldi, D.; Archetti, F. Short-term forecasting of hourly water consumption by using automatic metering readers data. Procedia Eng. 2015, 119, 844–853. [Google Scholar] [CrossRef]
  28. Ganti, R.K.; Ye, F.; Lei, H. Mobile crowdsensing: Current state and future challenges. IEEE Commun. Mag. 2011, 49, 32–39. [Google Scholar] [CrossRef]
  29. Rojko, A. Industry 4.0 concept: Background and overview. Int. J. Interact. Mob. Technol. 2017, 11, 77–90. [Google Scholar] [CrossRef] [Green Version]
  30. Gilchrist, A. Digital Success: A Holistic Approach to Digital Transformation for Enterprise and Manufacturing. 2018. Available online: https://www.amazon.com/Digital-Success-Transformation-Enterprise-Manufacturing/dp/1730850235 (accessed on 8 April 2022).
  31. Keitsch, M. Structuring ethical interpretations of the sustainable development goals—Concepts, implications and progress. Sustainability 2018, 10, 829. [Google Scholar] [CrossRef] [Green Version]
  32. Manion, M. Ethics, engineering, and sustainable development. IEEE Technol. Soc. Mag. 2002, 21, 39–48. [Google Scholar] [CrossRef]
  33. Lim, C.; Kim, K.J.; Maglio, P.P. Smart cities with big data: Reference models, challenges, and considerations. Cities 2018, 82, 86–99. [Google Scholar] [CrossRef]
  34. Radu, L.D. Disruptive Technologies in Smart Cities: A Survey on Current Trends and Challenges. Smart Cities 2020, 3, 1022–1038. [Google Scholar] [CrossRef]
  35. Talari, S.; Shafie-khah, M.; Siano, P.; Loia, V.; Tommasetti, A.; Catalão, J.P.S. A Review of Smart Cities Based on the Internet of Things Concept. Energies 2017, 10, 421. [Google Scholar] [CrossRef] [Green Version]
  36. Hashem, I.A.T.; Chang, V.; Anuar, N.B.; Adewole, K.; Yaqoob, I.; Gani, A.; Ahmed, E.; Chiroma, H. The role of big data in smart city. Int. J. Inf. Manag. 2016, 36, 748–758. [Google Scholar] [CrossRef] [Green Version]
  37. Voda, A.I.; Radu, L.D. Chapter 12—How can artificial intelligence respond to smart cities challenges. In Smart Cities: Issues and Challenges; Visvizi, A., Lytras, M.D., Eds.; Elsevier: Amsterdam, The Netherlands, 2019; pp. 199–216. [Google Scholar] [CrossRef]
  38. Ullah, Z.; Al-Turjman, F.; Mostarda, L.; Gagliardi, R. Applications of Artificial Intelligence and Machine learning in smart cities. Comput. Commun. 2020, 154, 313–323. [Google Scholar] [CrossRef]
  39. Beck, R.; Avital, M.; Rossi, M.; Thatcher, J. Blockchain Technology in Business and Information Systems Research. Bus. Inf. Syst. Eng. 2017, 59, 381–384. [Google Scholar] [CrossRef] [Green Version]
  40. Bhushan, B.; Khamparia, A.; Sagayam, K.M.; Sharma, S.K.; Ahad, M.A.; Debnath, N.C. Blockchain for smart cities: A review of architectures, integration trends and future research directions. Sustain. Cities Soc. 2020, 61, 102360. [Google Scholar] [CrossRef]
  41. Pule, M.; Yahya, A.; Chuma, J. Wireless sensor networks: A survey on monitoring water quality. J. Appl. Res. Technol. 2017, 15, 562–570. [Google Scholar] [CrossRef]
  42. Esri India. Cover Story: GIS for Smart Cities. Available online: https://www.esri.in/esri-news/publication/vol9-issue1/articles/gis-for-smart-cities (accessed on 8 April 2022).
  43. Sultana, Q. Design of Water Supply Distribution System: A Case Study. Int. J. Sci. Res. Rev. 2021, 7, 434–453. [Google Scholar]
  44. ENERGY STAR. Available online: https://www.energystar.gov/ (accessed on 8 April 2022).
  45. EPA, Environmental Protection Agency. Available online: https://www.epa.gov/watersense/water-score-multifamily-housing (accessed on 8 April 2022).
  46. Water Levels of Rivers and Lakes (Hydroweb). 2022. Available online: https://www.theia-land.fr/en/product/water-levels-of-rivers-and-lakes-hydroweb/ (accessed on 8 April 2022).
  47. Global Reservoirs and Lakes Monitor (G-REALM). 2022. Available online: https://ipad.fas.usda.gov/cropexplorer/global_reservoir/gr_regional_chart.aspx (accessed on 8 April 2022).
  48. Database for Hydrological Time Series of Inland Waters. 2013. Available online: https://dahiti.dgfi.tum.de/en/ (accessed on 8 April 2022).
  49. Dynamic Surface Water Extent. 2015. Available online: https://eros.usgs.gov/doi-remote-sensing-activities/2015/usgs/dynamic-surface-water-extent (accessed on 8 April 2022).
  50. Self-Calibrating Palmer Drought Severity Index (scPDSI). 2021. Available online: https://crudata.uea.ac.uk/cru/data/drought/ (accessed on 8 April 2022).
  51. CRU Hulme Global Land Precipitation Data. 2015. Available online: https://crudata.uea.ac.uk/cru/data/precip/ (accessed on 8 April 2022).
  52. AQUASTAT Core Database. 2017. Available online: https://www.fao.org/aquastat/en/databases/maindatabase (accessed on 8 April 2022).
  53. The Romanian Stations Dataset and Their Main Meteorological Observations. 2020. Available online: https://inspire.meteoromania.ro/geonetwork/srv/api/records/b7e35875-272e-416e-bf85-8f3789c48198 (accessed on 8 April 2022).
  54. Negru, C.; Pop, F.; Chinnici, M. Data Science and Big Data Analytics in Smart Environments; CRC Press: Boca Raton, FL, USA, 2020. [Google Scholar] [CrossRef]
  55. Pérez-Padillo, J.; García Morillo, J.; Ramirez-Faz, J.; Torres Roldán, M.; Montesinos, P. Design and Implementation of a Pressure Monitoring System Based on IoT for Water Supply Networks. Sensors 2020, 20, 4247. [Google Scholar] [CrossRef]
  56. Bruno, F.; De Marchis, M.; Milici, B.; Saccone, D.; Traina, F. A Pressure Monitoring System for Water Distribution Networks Based on Arduino Microcontroller. Water 2021, 13, 2321. [Google Scholar] [CrossRef]
  57. Quintiliani, C.; Vertommen, I.; Laarhoven, K.V.; Vliet, J.V.D.; Thienen, P.V. Optimal Pressure Sensor Locations for Leak Detection in a Dutch Water Distribution Network. Environ. Sci. Proc. 2020, 2, 40. [Google Scholar] [CrossRef]
  58. EDUCBA. IoT Boards. Available online: https://www.educba.com/iot-boards/ (accessed on 8 April 2022).
  59. Dhruva, A.; Babu, S.; Chakraborty, A.S. Computing Boards for Internet of Things: A Comparative Survey. Available online: https://www.techrxiv.org/articles/preprint/Computing_Boards_for_Internet_of_Things_A_Comparative_Survey/18517235 (accessed on 8 April 2022).
  60. Che Soh, Z.H.; Shafie, M.S.; Shafie, M.A.; Noraini Sulaiman, S.; Ibrahim, M.N.; Afzal Che Abdullah, S. IoT Water Consumption Monitoring & Alert System. In Proceedings of the 2018 International Conference on Electrical Engineering and Informatics (ICELTICs), Banda Aceh, Indonesia, 19–20 September 2018; pp. 168–172. [Google Scholar] [CrossRef]
  61. Liu, A.; Giurco, D.; Mukheibir, P. Advancing household water-use feedback to inform customer behaviour for sustainable urban water. Water Supply 2016, 17, 198–205. [Google Scholar] [CrossRef] [Green Version]
  62. Mazhelis, O.; Tyrväinen, P. A framework for evaluating Internet-of-Things platforms: Application provider viewpoint. In Proceedings of the 2014 IEEE World Forum on Internet of Things (WF-IoT), Seoul, Korea, 6–8 March 2014; pp. 147–152. [Google Scholar]
  63. Perry, M.J. Evaluating and Choosing an IoT Platform; O’Reilly Media: Newton, MA, USA, 2016. [Google Scholar]
  64. Tech, K. IoT Platform Evaluation—Investigating the Right Analogy. Available online: https://www.kelltontech.com/kellton-tech-white-paper/iot-platform-evaluation-investigating-right-analogy (accessed on 8 April 2022).
  65. Cominola, A.; Nguyen, K.; Giuliani, M.; Stewart, R.A.; Maier, H.R.; Castelletti, A. Data Mining to Uncover Heterogeneous Water Use Behaviors From Smart Meter Data. Water Resour. Res. 2019, 55, 9315–9333. [Google Scholar] [CrossRef] [Green Version]
  66. Yang, A.; Zhang, H.; Stewart, R.A.; Nguyen, K. Enhancing Residential Water End Use Pattern Recognition Accuracy Using Self-Organizing Maps and K-Means Clustering Techniques: Autoflow v3.1. Water 2018, 10, 1221. [Google Scholar] [CrossRef] [Green Version]
  67. Singh, R.; Baz, M.; Gehlot, A.; Rashid, M.; Khurana, M.; Akram, S.V.; Alshamrani, S.S.; AlGhamdi, A.S. Water Quality Monitoring and Management of Building Water Tank Using Industrial Internet of Things. Sustainability 2021, 13, 8452. [Google Scholar] [CrossRef]
  68. Mekki, K.; Bajic, E.; Chaxel, F.; Meyer, F. A comparative study of LPWAN technologies for large-scale IoT deployment. ICT Express 2019, 5, 1–7. [Google Scholar] [CrossRef]
  69. Mekki, K.; Bajic, E.; Chaxel, F.; Meyer, F. Overview of cellular LPWAN technologies for IoT deployment: Sigfox, LoRaWAN, and NB-IoT. In Proceedings of the 2nd International Workshop on Mobile and Pervasive Internet of Things, PERIOT 2018, Part of International Conference on Pervasive Computing and Communications, PerCom2018, Athens, Greece, 19–23 March 2018. [Google Scholar]
  70. Singh, R.K.; Puluckul, P.P.; Berkvens, R.; Weyn, M. Energy Consumption Analysis of LPWAN Technologies and Lifetime Estimation for IoT Application. Sensors 2020, 20, 4794. [Google Scholar] [CrossRef]
  71. Pointl, M.; Fuchs-Hanusch, D. Assessing the Potential of LPWAN Communication Technologies for Near Real-Time Leak Detection in Water Distribution Systems. Sensors 2021, 21, 293. [Google Scholar] [CrossRef]
  72. Gautam, G.; Sharma, G.; Magar, B.T.; Shrestha, B.; Cho, S.; Seo, C. Usage of IoT Framework in Water Supply Management for Smart City in Nepal. Appl. Sci. 2021, 11, 5662. [Google Scholar] [CrossRef]
  73. Gonçalves, R.; Soares, J.M.; Lima, M.F.R. An IoT-Based Framework for Smart Water Supply Systems Management. Future Internet 2020, 12, 114. [Google Scholar] [CrossRef]
  74. Karafiloski, E.; Mishev, A. Blockchain solutions for big data challenges: A literature review. In Proceedings of the IEEE EUROCON 2017-17th International Conference on Smart Technologies, Ohrid, Macedonia, 6–8 July 2017; pp. 763–768. [Google Scholar] [CrossRef]
  75. Adamala, S. An Overview of Big Data Applications in Water Resources Engineering. Mach. Learn. Res. 2017, 2, 10–18. [Google Scholar] [CrossRef]
  76. Ponce Romero, J.M.; Hallett, S.H.; Jude, S. Leveraging Big Data Tools and Technologies: Addressing the Challenges of the Water Quality Sector. Sustainability 2017, 9, 2160. [Google Scholar] [CrossRef] [Green Version]
  77. Ghernaout, D.; Aichouni, M.; Alghamdi, A. Applying Big Data in Water Treatment Industry: A New Era of Advance. Int. J. Adv. Appl. Sci. 2018, 5, 89–97. [Google Scholar] [CrossRef]
  78. Es-Samaali, A.O.J.L.H.; Van, N.; Kodama, R.N.T.T.S. A Blockchain-based Access Control for Big Data. J. Comput. Netw. Commun. 2017, 5, 137–147. [Google Scholar]
  79. Drăgulinescu, A.M.; Constantin, F.; Orza, O.; Bosoc, S.; Streche, R.; Negoita, A.; Osiac, F.; Balaceanu, C.; Suciu, G. Smart Watering System Security Technologies using Blockchain. In Proceedings of the 2021 13th International Conference on Electronics, Computers and Artificial Intelligence (ECAI), Pitesti, Romania, 1–3 July 2021; pp. 1–4. [Google Scholar] [CrossRef]
  80. Hakak, S.; Khan, W.Z.; Gilkar, G.A.; Haider, N.; Imran, M.; Alkatheiri, M.S. Industrial Wastewater Management using Blockchain Technology: Architecture, Requirements, and Future Directions. IEEE Internet Things Mag. 2020, 3, 38–43. [Google Scholar] [CrossRef]
  81. Yu, H.; Yang, Z.; Sinnott, R.O. Decentralized Big Data Auditing for Smart City Environments Leveraging Blockchain Technology. IEEE Access 2019, 7, 6288–6296. [Google Scholar] [CrossRef]
  82. Hassani, H.; Huang, X.; Silva, E. Big-Crypto: Big Data, Blockchain and Cryptocurrency. Big Data Cogn. Comput. 2018, 2, 34. [Google Scholar] [CrossRef] [Green Version]
  83. Hassani, H.; Silva, E.S. Big Data: A big opportunity for the petroleum and petrochemical industry. OPEC Energy Rev. 2018, 42, 74–89. [Google Scholar] [CrossRef]
  84. Hassani, H.; Huang, X.; Silva, E. Digitalisation and Big Data Mining in Banking. Big Data Cogn. Comput. 2018, 2, 18. [Google Scholar] [CrossRef] [Green Version]
  85. Hassani, H.; Huang, X.; Ghodsi, M. Big Data and Causality. Ann. Data Sci. 2018, 5, 133–156. [Google Scholar] [CrossRef]
  86. Hassani, H.; Silva, E. Forecasting with Big Data: A Review. Ann. Data Sci. 2015, 2, 5–19. [Google Scholar] [CrossRef] [Green Version]
  87. Bandara, E.; Ng, W.K.; De Zoysa, K.; Fernando, N.; Tharaka, S.; Maurakirinathan, P.; Jayasuriya, N. Mystiko—Blockchain Meets Big Data. In Proceedings of the 2018 IEEE International Conference on Big Data (Big Data), Seattle, WA, USA, 10–13 December 2018; pp. 3024–3032. [Google Scholar] [CrossRef]
  88. Sahoo, M.; Baruah, P.K. HBasechainDB—A Scalable Blockchain Framework on Hadoop Ecosystem. In Lecture Notes in Computer Science, Proceedings of the Asian Conference on Supercomputing Frontiers, Singapore, 26–29 March 2018; Springer: Cham, Switzerland, 2018; pp. 18–29. [Google Scholar] [CrossRef] [Green Version]
  89. Kotsiantis, S.B.; Kanellopoulos, D.; Pintelas, P.E. Data preprocessing for supervised leaning. Int. J. Comput. Sci. 2006, 1, 111–117. [Google Scholar]
  90. Wu, Z.Y.; He, Y.; Li, Q. Comparing deep learning with statistical control methods for anomaly detection. In Proceedings of the WDSA/CCWI Joint Conference Proceedings, Kingston, ON, Canada, 23–25 July 2018; Volume 1. [Google Scholar]
  91. Kofinas, D.T.; Spyropoulou, A.; Laspidou, C.S. A methodology for synthetic household water consumption data generation. Environ. Model. Softw. 2018, 100, 48–66. [Google Scholar] [CrossRef]
  92. Patabendige, S.; Cardell-Oliver, R.; Wang, R.; Liu, W. Detection and interpretation of anomalous water use for non-residential customers. Environ. Model. Softw. 2018, 100, 291–301. [Google Scholar] [CrossRef]
  93. Zubaidi, S.L.; Al-Bugharbee, H.; Ortega-Martorell, S.; Gharghan, S.K.; Olier, I.; Hashim, K.S.; Al-Bdairi, N.S.S.; Kot, P. A novel methodology for prediction urban water demand by wavelet denoising and adaptive neuro-fuzzy inference system approach. Water 2020, 12, 1628. [Google Scholar] [CrossRef]
  94. Abu-Bakar, H.; Williams, L.; Hallett, S.H. Quantifying the impact of the COVID-19 lockdown on household water consumption patterns in England. NPJ Clean Water 2021, 4, 13. [Google Scholar] [CrossRef]
  95. Wang, L.; El-Gohary, N.M. Understanding the water-energy nexus in urban areas: A cluster analysis of urban water and energy consumption. In Proceedings of the Annual Conference—Canadian Society for Civil Engineering, Laval, QC, Canada, 12–15 June 2019; pp. 1–10. [Google Scholar]
  96. Leigh, C.; Alsibai, O.; Hyndman, R.J.; Kandanaarachchi, S.; King, O.C.; McGree, J.M.; Neelamraju, C.; Strauss, J.; Talagala, P.D.; Turner, R.D.; et al. A framework for automated anomaly detection in high frequency water-quality data from in situ sensors. Sci. Total Environ. 2019, 664, 885–898. [Google Scholar] [CrossRef] [PubMed] [Green Version]
  97. Raciti, M.; Cucurull, J.; Nadjm-Tehrani, S. Anomaly detection in water management systems. In Critical Infrastructure Protection; Springer: Berlin/Heidelberg, Germany, 2012; pp. 98–119. [Google Scholar]
  98. Burbeck, K.; Nadjm-Tehrani, S. Adaptive real-time anomaly detection with incremental clustering. Inf. Secur. Tech. Rep. 2007, 12, 56–67. [Google Scholar] [CrossRef]
  99. Dogo, E.M.; Nwulu, N.I.; Twala, B.; Aigbavboa, C. A survey of machine learning methods applied to anomaly detection on drinking-water quality data. Urban Water J. 2019, 16, 235–248. [Google Scholar] [CrossRef]
  100. Dogo, E.M.; Nwulu, N.I.; Twala, B.; Aigbavboa, C. Accessing imbalance learning using dynamic selection approach in water quality anomaly detection. Symmetry 2021, 13, 818. [Google Scholar] [CrossRef]
  101. Shalyga, D.; Filonov, P.; Lavrentyev, A. Anomaly detection for water treatment system based on neural network with automatic architecture optimization. arXiv 2018, arXiv:1807.07282. [Google Scholar]
  102. Muharemi, F.; Logofătu, D.; Leon, F. Machine learning approaches for anomaly detection of water quality on a real-world data set. J. Inf. Telecommun. 2019, 3, 294–307. [Google Scholar] [CrossRef] [Green Version]
  103. Vercruyssen, V.; Meert, W.; Verbruggen, G.; Maes, K.; Baumer, R.; Davis, J. Semi-supervised anomaly detection with an application to water analytics. In Proceedings of the 2018 IEEE International Conference on Data Mining (ICDM), Singapore, 17–20 November 2018; Volume 2018, pp. 527–536. [Google Scholar]
  104. Fuentes, H.; Mauricio, D. Smart water consumption measurement system for houses using IoT and cloud computing. Environ. Monit. Assess. 2020, 192, 602. [Google Scholar] [CrossRef] [PubMed]
  105. Ramotsoela, D.; Abu-Mahfouz, A.; Hancke, G. A survey of anomaly detection in industrial wireless sensor networks with critical water system infrastructure as a case study. Sensors 2018, 18, 2491. [Google Scholar] [CrossRef] [PubMed] [Green Version]
  106. MR, G.R.; Somu, N.; Mathur, A.P. A multilayer perceptron model for anomaly detection in water treatment plants. Int. J. Crit. Infrastruct. Prot. 2020, 31, 100393. [Google Scholar]
  107. Abu-Bakar, H.; Williams, L.; Hallett, S.H. A review of household water demand management and consumption measurement. J. Clean. Prod. 2021, 292, 125872. [Google Scholar] [CrossRef]
  108. De Souza Groppo, G.; Costa, M.A.; Libânio, M. Predicting water demand: A review of the methods employed and future possibilities. Water Supply 2019, 19, 2179–2198. [Google Scholar] [CrossRef]
  109. Rinaudo, J.D. Long-term water demand forecasting. Underst. Manag. Urban Water Transit. 2015, 15, 239–268. [Google Scholar]
  110. Kossieris, P.; Makropoulos, C. Exploring the statistical and distributional properties of residential water demand at fine time scales. Water 2018, 10, 1481. [Google Scholar] [CrossRef] [Green Version]
  111. Alvi, M.S.Q.; Mahmood, I.; Javed, F.; Malik, A.W.; Sarjoughian, H. Dynamic behavioural modeling, simulation and analysis of household water consumption in an urban area: A hybrid approach. In Proceedings of the 2018 Winter Simulation Conference (WSC), Gothenburg, Sweden, 9–12 December 2018; pp. 2411–2422. [Google Scholar]
  112. Dzimińska, P.; Drzewiecki, S.; Ruman, M.; Kosek, K.; Mikołajewski, K.; Licznar, P. The use of cluster analysis to evaluate the impact of COVID-19 pandemic on daily water demand patterns. Sustainability 2021, 13, 5772. [Google Scholar] [CrossRef]
  113. Abu-Bakar, H.; Williams, L.; Hallett, S.H. An empirical water consumer segmentation and the characterisation of consumption patterns underpinning demand peaks. Resour. Conserv. Recycl. 2021, 174, 105792. [Google Scholar] [CrossRef]
  114. Rahim, M.S.; Nguyen, K.A.; Stewart, R.A.; Ahmed, T.; Giurco, D.; Blumenstein, M. A clustering solution for analyzing residential water consumption patterns. Knowl.-Based Syst. 2021, 233, 107522. [Google Scholar] [CrossRef]
  115. Lüdtke, D.U.; Luetkemeier, R.; Schneemann, M.; Liehr, S. Increase in daily household water demand during the first wave of the covid-19 pandemic in germany. Water 2021, 13, 260. [Google Scholar] [CrossRef]
  116. Kalbusch, A.; Henning, E.; Brikalski, M.P.; de Luca, F.V.; Konrath, A.C. Impact of coronavirus (COVID-19) spread-prevention actions on urban water consumption. Resour. Conserv. Recycl. 2020, 163, 105098. [Google Scholar] [CrossRef] [PubMed]
  117. Padulano, R.; Giudice, G.D.; Giugni, M.; Fontana, N.; Uberti, G.S.D. Identification of annual water demand patterns in the City of Naples. Proceedings 2018, 2, 587. [Google Scholar]
  118. Benítez, R.; Ortiz-Caraballo, C.; Preciado, J.C.; Conejero, J.M.; Sánchez Figueroa, F.; Rubio-Largo, A. A short-term data based water consumption prediction approach. Energies 2019, 12, 2359. [Google Scholar] [CrossRef] [Green Version]
  119. Boudhaouia, A.; Wira, P. A Real-Time Data Analysis Platform for Short-Term Water Consumption Forecasting with Machine Learning. Forecasting 2021, 3, 682–694. [Google Scholar] [CrossRef]
  120. Du, H.; Zhao, Z.; Xue, H. ARIMA-M: A New Model for Daily Water Consumption Prediction Based on the Autoregressive Integrated Moving Average Model and the Markov Chain Error Correction. Water 2020, 12, 760. [Google Scholar] [CrossRef] [Green Version]
  121. Koo, K.M.; Han, K.H.; Jun, K.S.; Lee, G.; Kim, J.S.; Yum, K.T. Performance Assessment for Short-Term Water Demand Forecasting Models on Distinctive Water Uses in Korea. Sustainability 2021, 13, 6056. [Google Scholar] [CrossRef]
  122. Dawood, T.; Elwakil, E.; Novoa, H.M.; Delgado, J.F.G. Artificial intelligence for the modeling of water pipes deterioration mechanisms. Autom. Constr. 2020, 120, 103398. [Google Scholar] [CrossRef]
  123. Giraldo-González, M.M.; Rodríguez, J.P. Comparison of statistical and machine learning models for pipe failure modeling in water distribution networks. Water 2020, 12, 1153. [Google Scholar] [CrossRef] [Green Version]
  124. Robles-Velasco, A.; Cortés, P.; Muñuzuri, J.; Onieva, L. Prediction of pipe failures in water supply networks using logistic regression and support vector classification. Reliab. Eng. Syst. Saf. 2020, 196, 106754. [Google Scholar] [CrossRef]
  125. Amiri-Ardakani, Y.; Najafzadeh, M. Pipe break rate assessment while considering physical and operational factors: A methodology based on global positioning system and data-driven techniques. Water Resour. Manag. 2021, 35, 3703–3720. [Google Scholar] [CrossRef]
  126. Joshi, B. Novel Water Sustainability Technologies: Key Projects and Opportunities, Financing, and Venture Capital, Transactions and Trends. BCC Research 2019. Available online: https://www.researchandmarkets.com/reports/4846706/novel-water-sustainability-technologies-key (accessed on 8 April 2022).
  127. Curry, E.; Degeler, V.; Clifford, E.; Coakley, D.; Costa, A.; Andel, S.; van de Giesen, N.; Kouroupetroglou, C.; Messervey, T.; Mink, J.; et al. Linked Water Data for Water Information Management. In Proceedings of the 11th International Conference on Hydroinformatics HIC 2014, New York, NY, USA, 17–21 October 2014. [Google Scholar]
  128. Blodgett, D.; Read, E.; Lucido, J.; Slawecki, T.; Young, D. An Analysis of Water Data Systems to Inform the Open Water Data Initiative. JAWRA J. Am. Water Resour. Assoc. 2016, 52, 845–858. [Google Scholar] [CrossRef] [Green Version]
  129. Bianchini, D.; De Antonellis, V.; Garda, M.; Melchiori, M. Exploiting Smart City Ontology and Citizens’ Profiles for Urban Data Exploration. In Proceedings of the Confederated International Conferences: CoopIS, C&TC, and ODBASE 2018, Valletta, Malta, 22–26 October 2018; pp. 372–389. [Google Scholar] [CrossRef]
  130. Rani, M.; Alekh, S.; Bhardwaj, A.; Gupta, A.; Vyas, O. Ontology-based Classification and Analysis of non- emergency Smart-city Events. In Proceedings of the 2016 International Conference on Computational Techniques in Information and Communication Technologies (ICCTICT), New Delhi, India, 11–13 March 2016; pp. 509–514. [Google Scholar] [CrossRef] [Green Version]
  131. Goel, D.; Chaudhury, S.; Ghosh, H. Smart Water Management: An Ontology-Driven Context-Aware IoT Application. In Lecture Notes in Computer Science, Proceedings of the International Conference on Pattern Recognition and Machine Intelligence, Kolkata, India, 5–8 December 2017; Springer: Cham, Switzerland, 2017; pp. 639–646. [Google Scholar] [CrossRef]
  132. Ahmedi, L.; Jajaga, E.; Ahmedi, F. An Ontology Framework for Water Quality Management. In Proceedings of the 6th International Conference on Semantic Sensor Networks, Aachen, Germany, October 2013; Volume 1063, pp. 35–50. [Google Scholar]
  133. Katsiri, E.; Makropoulos, C. An ontology framework for decentralized water management and analytics using wireless sensor networks. Desalin. Water Treat. 2016, 57, 26355–26368. [Google Scholar] [CrossRef]
  134. Sánchez de Rivera, D.; Robles, T.; Lopez Morales, J.A.; Miguel, A.; Navarro, M.; Sofía, M.; Gómez, I.; Martinez, J.; Skarmeta, A. Adaptation of ontology sets for water related scenarios management with IoT systems for a more productive and sustainable agriculture systems. In Proceedings of the SEMANTiCS 2017 Workshops Proceedings: SIS-IoT, Amsterdam, The Netherlands, 11–14 September 2017. [Google Scholar]
  135. Auer, S.; Bizer, C.; Kobilarov, G.; Lehmann, J.; Cyganiak, R.; Ives, Z. DBpedia: A Nucleus for a Web of Open Data. In Proceedings of the 6th International Semantic Web Conference, 2nd Asian Semantic Web Conference, ISWC 2007 + ASWC 2007, Busan, Korea, 11–15 November 2007; Volume 6, pp. 722–735. [Google Scholar] [CrossRef] [Green Version]
  136. Tanon, T.; Vrandečić, D.; Schaffert, S.; Steiner, T.; Pintscher, L. From Freebase to Wikidata: The Great Migration. In Proceedings of the 25th International Conference on World Wide Web, Montreal, QC, Canada, 11–15 April 2016; pp. 1419–1428. [Google Scholar] [CrossRef] [Green Version]
  137. Rebele, T.; Suchanek, F.; Hoffart, J.; Biega, J.; Kuzey, E.; Weikum, G. YAGO: A Multilingual Knowledge Base from Wikipedia, Wordnet, and Geonames. In Proceedings of the 15th International Semantic Web Conference, 2nd Asian Semantic Web Conference, ISWC 2007 + ASWC 2007, Kobe, Japan, 17–21 October 2016; pp. 177–185. [Google Scholar] [CrossRef]
  138. Faerber, M.; Bartscherer, F.; Menne, C.; Rettinger, A. Linked data quality of DBpedia, Freebase, OpenCyc, Wikidata, and YAGO. Semant. Web 2017, 9, 1–53. [Google Scholar] [CrossRef]
  139. Portal, E.D. Re-Using Open Data. 2017. Available online: https://data.europa.eu/sites/default/files/re-using_open_data.pdf (accessed on 8 May 2022).
  140. Tennison, J. The RDF Data Cube Vocabulary. 2014. Available online: https://www.w3.org/TR/vocab-data-cube/ (accessed on 8 May 2022).
  141. Russo, T.; Lall, U. Depletion and response of deep groundwater to climate-induced pumping variability. Nat. Geosci. 2017, 10, 105–108. [Google Scholar] [CrossRef]
  142. Zhou, X.; Hu, Y.; Liang, W.; Ma, J.; Jin, Q. Variational LSTM Enhanced Anomaly Detection for Industrial Big Data. IEEE Trans. Ind. Inform. 2020, 17, 3469–3477. [Google Scholar] [CrossRef]
  143. Fullerton, T.; Ceballos, A.; Walke, A. Short-Term Forecasting Analysis for Municipal Water Demand. J.-Am. Water Work. Assoc. 2016, 108, E27–E38. [Google Scholar] [CrossRef]
  144. Pacchin, E.; Gagliardi, F.; Alvisi, S.; Franchini, M. A Comparison of Short-Term Water Demand Forecasting Models. Water Resour. Manag. 2019, 33, 1481–1497. [Google Scholar] [CrossRef]
  145. Zhou, X.; Liang, W.; Wang, K.; Wang, H.; Yang, L.; Jin, Q. Deep Learning Enhanced Human Activity Recognition for Internet of Healthcare Things. IEEE Internet Things J. 2020, 7, 6429–6438. [Google Scholar] [CrossRef]
  146. Guo, Z.; Shen, Y.; Bashir, A.; Imran, M.; Kumar, N.; Zhang, D.; Yu, K. Robust Spammer Detection Using Collaborative Neural Network in Internet of Thing Applications. IEEE Internet Things J. 2020, 8, 9549–9558. [Google Scholar] [CrossRef]
  147. Yueming, Z.; Chen, Y.P.; Guo, J.S.; Shen, Y.; Yan, P.; Yang, J. Recycling of orange waste for single cell protein production and the synergistic and antagonistic effects on production quality. J. Clean. Prod. 2018, 213, 384–392. [Google Scholar] [CrossRef]
  148. Yin, Z.; Jia, B.; Wu, S.; Dai, J.; Tang, D. Comprehensive Forecast of Urban Water-Energy Demand Based on a Neural Network Model. Water 2018, 10, 385. [Google Scholar] [CrossRef] [Green Version]
  149. Alamanos, A.; Sfyris, S.; Fafoutis, C.; Mylopoulos, N. Urban water demand assessment for sustainable water resources management, under climate change and socioeconomic changes. Water Supply 2019, 20, 679–687. [Google Scholar] [CrossRef]
  150. Oyebode, O. Evolutionary modelling of municipal water demand with multiple feature selection techniques. Aqua 2019, 68, 264–281. [Google Scholar] [CrossRef] [Green Version]
  151. Zhang, D.; Liu, Y.; Dai, L.; Bashir, A.; Nallanathan, A.; Shim, B. Performance analysis of FD-NOMA-based decentralized V2X systems. IEEE Trans. Commun. 2019, 67, 5024–5036. [Google Scholar] [CrossRef] [Green Version]
  152. Siddiqui, I.; Lee, S.U.J.; Abbas, A.; Bashir, A. Optimizing Lifespan and Energy Consumption by Smart Meters in Green-Cloud-Based Smart Grids. IEEE Access 2017, 5, 20934–20945. [Google Scholar] [CrossRef]
  153. Bashir, A.; Lim, S.J.; Chauhdary, S.; Park, M.S. Energy Efficient In-network RFID Data Filtering Scheme in Wireless Sensor Networks. Sensors 2011, 11, 7004–7021. [Google Scholar] [CrossRef] [PubMed] [Green Version]
  154. Parnell, G.; Bresnick, T. Handbook of Decision Analysis; Wiley: Hoboken, NJ, USA, 2013; pp. 1–21. [Google Scholar] [CrossRef]
  155. Bashir, A.; Arul, R.; Basheer, S.; Raja, G.; Jayaraman, R.; Qureshi, N.M.F. An optimal multitier resource allocation of cloud RAN in 5G using machine learning. Trans. Emerg. Telecommun. Technol. 2019, 30, e3627. [Google Scholar] [CrossRef]
  156. Su, Y.; Gao, W.; Guan, D.; Su, W. Dynamic assessment and forecast of urban water ecological footprint based on exponential smoothing analysis. J. Clean. Prod. 2018, 195, 354–364. [Google Scholar] [CrossRef]
  157. Yuan, Y.; Li, Q.; Yuan, X.; Luo, X.; Liu, S. A SAFSA- and Metabolism-Based Nonlinear Grey Bernoulli Model for Annual Water Consumption Prediction. Iran. J. Sci. Technol. Trans. Civ. Eng. 2020, 44, 755–765. [Google Scholar] [CrossRef]
  158. Chen, G.; Long, T.; Xiong, J.; Bai, Y. Multiple Random Forests Modelling for Urban Water Consumption Forecasting. Water Resour. Manag. 2017, 31, 4715–4729. [Google Scholar] [CrossRef]
  159. Dong, W.; Yang, Q. Data-Driven Solution for Optimal Pumping Units Scheduling of Smart Water Conservancy. IEEE Internet Things J. 2019, 7, 1919–1926. [Google Scholar] [CrossRef]
  160. Leopold, G. Nvidia’s Huang Sees AI ‘Cambrian Explosion’. 2017. Available online: https://www.datanami.com/2017/05/24/nvidias-huang-sees-ai-cambrian-explosion/ (accessed on 8 May 2022).
  161. Baldassi, C.; Borgs, C.; Chayes, J.; Ingrosso, A.; Lucibello, C.; Saglietti, L.; Zecchina, R. Unreasonable Effectiveness of Learning Neural Networks: From Accessible States and Robust Ensembles to Basic Algorithmic Schemes. Proc. Natl. Acad. Sci. USA 2016, 113, E7655–E7662. [Google Scholar] [CrossRef] [PubMed] [Green Version]
  162. Sun, C.; Shrivastava, A.; Singh, S.; Gupta, A. Revisiting Unreasonable Effectiveness of Data in Deep Learning Era. In Proceedings of the IEEE International Conference on Computer Vision, Venice, Italy, 22–29 October 2017; pp. 843–852. [Google Scholar] [CrossRef] [Green Version]
  163. Schmidhuber, J. Deep Learning in Neural Networks: An Overview. Neural Netw. 2014, 61, 85–117. [Google Scholar] [CrossRef] [Green Version]
  164. Sivapalan, M.; Blöschl, G. The Growth of Hydrological Understanding: Technologies, Ideas and Societal Needs Shape the Field. Water Resour. Res. 2017, 53, 8137–8146. [Google Scholar] [CrossRef] [Green Version]
  165. Cai, X.; Wallington, K.; Shafiee-Jood, M.; Marston, L. Understanding and Managing the Food-Energy-Water Nexus—Opportunities for Water Resources Research. Adv. Water Resour. 2017, 111, 259–273. [Google Scholar] [CrossRef]
  166. Al-Zahrani, M.; Abo-Monasar, A. Urban Residential Water Demand Prediction Based on Artificial Neural Networks and Time Series Models. Water Resour. Manag. 2015, 29, 3651–3662. [Google Scholar] [CrossRef]
  167. Surendra, H.; Deka, P. Fuzzy and improved fuzzy-wavelet approach in modeling municipal residential water consumption estimation using climatic variables. Soft Comput. 2020, 24, 11213–11222. [Google Scholar] [CrossRef]
  168. Viñas, V.; Malm, A.; Pettersson, T. Overview of microbial risks in water distribution networks and their health consequences: Quantification, modelling, trends, and future implications. Can. J. Civ. Eng. 2018, 46, 149–159. [Google Scholar] [CrossRef]
  169. Hu, G.; Mian, H.; Abedin, Z.; Li, J.; Hewage, K.; Sadiq, R. Integrated probabilistic-fuzzy synthetic evaluation of drinking water quality in rural and remote communities. J. Environ. Manag. 2022, 301, 113937. [Google Scholar] [CrossRef] [PubMed]
  170. Sköld, N.P.; Bergion, V.; Lindhe, A.; Keucken, A.; Rosén, L. Risk-Based Evaluation of Improvements in Drinking WaterTreatment Using Cost-Benefit Analysis. Water 2022, 14, 782. [Google Scholar] [CrossRef]
Figure 1. Number of papers related to the topics of interest by year published.
Water 14 02174 g001
Figure 2. Evaluation of referenced papers. (a) Number of referenced papers by year. (b) Word cloud from referenced paper titles.
Water 14 02174 g002
Figure 3. A classification of IoT boards.
Water 14 02174 g003
Figure 4. Big Data and Blockchain—Technology Overview.
Water 14 02174 g004
Figure 5. Data analysis techniques in water infrastructures.
Water 14 02174 g005
Figure 6. Decision making flow in water infrastructure.
Water 14 02174 g006
Figure 7. Urban water infrastructures management areas of research.
Water 14 02174 g007
Publisher’s Note: MDPI stays neutral with regard to jurisdictional claims in published maps and institutional affiliations.

