
Hydrogeological Survey, Radiometric Analysis and Field Parametric Measurements: A Combined Tool for the Study of Porous Aquifers

Department of Catanzaro, ARPA Calabria (Regional Agency for the Protection of the Environment of Calabria), 88100 Catanzaro, Italy
*
Author to whom correspondence should be addressed.
Water 2022, 14(14), 2173; https://doi.org/10.3390/w14142173
Submission received: 23 May 2022
/
Revised: 28 June 2022
/
Accepted: 4 July 2022
/
Published: 9 July 2022
(This article belongs to the Special Issue Geologic Controls on Hydrology and Groundwater Flow)
Abstract
:The use of isotopic geochemistry for hydrogeological studies is growing internationally. The use of isotopic geochemistry methodologies on hydrogeological survey data, integrated with the use natural tracers, is helpful when defining the hydrogeological model of the aquifer. In particular, the use of radioisotope concentration measurements as natural tracers and the detection of the temperature, redox potential and dissolved oxygen in groundwater in the field provide information on underground water circulation, which is useful for identifying recharge areas and groundwater drainage. Variations in these parameters in the aquifer allow for information about its hydrodynamics to be obtained. The application of this method in a sample area showed how the uranium and radon concentrations, temperature, redox potential and dissolved oxygen vary in the different sectors of the aquifer, depending on water mobility. This information, integrated with the results of a hydrogeological survey of the static levels, distinguished the recharge and drainage areas of the aquifer and the preferential directions in terms of water flow and allowed for information on the mobility of the aquifer in the various sectors to be obtained. The method presented in this paper was tested in a larger hydrogeological study in the southern sector of the shallow aquifer of the S. Eufemia Lamezia plain (Calabria, Italy).
1. Introduction
Territorial governance and the correct management of water resources require knowledge of the hydrogeological and hydrodynamic characteristics of groundwater, so that the hydrogeological model of aquifers can be defined. However, the rigorous evaluation of the hydrogeochemical and hydrogeological data of aquifers is often difficult, thanks to both complex lithostructural and hydrogeological frameworks, where processes frequently take place, and the considerable associated analytical and survey costs. In this context, techniques based on the use of tracers which are naturally present in the environment may aid in the definition of the hydrogeological model of the aquifer, especially for those features related to the identification of the recharge and drainage areas of the aquifer and the preferential flow directions. Isotopic geochemistry is increasingly used for hydrogeological studies across the globe. The integrated reading of data obtained from hydrogeological surveys, parametric measurements taken in the field and the analysis of tracers naturally present in the environment is particularly useful in medium-scale studies of complex hydrogeological structures, as it allows one to delineate the general hydrogeological model of the aquifer studied. Therefore, in the present study, we propose an integrated methodology based on the use of a hydrogeological field survey of the static level of groundwater, on the measurement of the temperature (T), redox potential (Eh) and dissolved oxygen (O2) in the well as well as and on the laboratory-determined radon (222Rn) and radium (226Ra) and the isotope ratio of the uranium (234U/238U) “activity concentration” of groundwater samples collected in the field. The method here presented was tested in a larger hydrogeological study in the southern sector of the shallow aquifer of the S. Eufemia Lamezia plain (Calabria, Italy) [1]. The isopiezometric map of the aquifer is deduced from the hydrogeological survey data, while thematic maps are derived from other data acquired in the field and in the laboratory for each indicator detected.
In particular, the integrated interpretation of the piezometric morphology, concentrations of (222Rn), (226Ra) and (234U/238U) and distribution of the redox potential, temperature and dissolved oxygen in the aquifer provides useful indications of the hydrodynamics of the aquifer. This information distinguishes the recharge and drainage areas, the preferential directions in terms of water flow, the underground watersheds and allows for indications of the mobility of the aquifer in the various sectors to be obtained. All these items are fundamental for the construction of the general hydrogeological model of the aquifer studied. From the interpretation of the piezometric morphology, it is possible to identify the recharge and drainage areas, the preferential directions in terms of water flow and the underground watersheds of the aquifer. Furthermore, from the same map, it is possible to obtain a qualitative evaluation of the aquifer’s hydraulic degree, transmissivity and permeability by applying Darcy’s law. Instead, the distribution of other quantities measured in the field (T, Eh, O2) and in the laboratory (222Rn, 226Ra, 234U/238U) provides important information on the hydrodynamics of the aquifer, supporting the morphological interpretation of the piezometric surface and helping to define the hydrogeological model of the aquifer studied. Indeed, several chemical elements are found in groundwater, and their concentration varies due to different factors, such as the temperature, the pressure, the nature of crossed lithotypes, the presence of rocks and soils and the length of time groundwater is in contact with them. However, some substances are present in solution in aquifers, and their initial concentration depends only on the characteristics of filtration waters. These are considered natural tracers, and some of these are radioisotopes that can be used as indicators of the characteristics of an aquifer, if they meet certain requirements. The most important requirements are a half-life that is compatible with the duration of monitoring times, high solubility in water, detectability even at low concentrations, neutrality (they must not react with other elements present in the aquifer) and stability. As for the radiometric tracers used, radon is a radioactive noble gas produced by the decay of three progenitor nuclides, giving rise to the same number of radioactive isotopes families, more precisely, thorio 232 (232Th), uranium 235 (235U) and uranium 238 (238U). From the decay chain of the latter, radium, (226Ra) and subsequently radon (222Rn), are derived. In particular, radium (88Ra) is an alkaline earth metal present in traces in the minerals of uranium. Its most stable isotope, (226Ra), has a half-life of 1602 years and decays into radon, which has a lower half-life (half-life ≈ 3.85 days), does not react with other chemical elements present in the monitored environmental matrix and spreads easily in water, where it dissolves. In particular, studies regarding the presence of this environmental tracer and radon diffusion processes as a function of the chemistry of groundwater provide important information for the hydrogeological characterization of aquifers. The mobility of groundwater is related to the concentration of this gas. The movement of radon in the subsoil is fundamentally linked to the physical conditions of the gas–water–rock system and is induced by pressure or concentration gradients. The first kind of motion is called “advection” and the second “diffusion”. The two processes rarely act separately in the subsoil, so the displacement of radioactive gas mass in groundwater can be related to the combined action of both. These motions influence the concentrations of radioactive gas in groundwater and create, at the same water point, differentiations in terms of place and depth [2]. Therefore, radioisotopes used as tracers for their intrinsic characteristics are useful when defining the hydrogeological model of an aquifer, since they are inert (they do not interact with other elements present in the aquifer) and highly soluble. Moreover, their concentration in water varies depending on the characteristics of the crossed lithologies (porosity and permeability), the volume of water in which they are dissolved, the transit of water and how much time it spends in the various sectors of the aquifer. Table 1 shows the concentrations of natural radionuclides present in the main rock types [3].
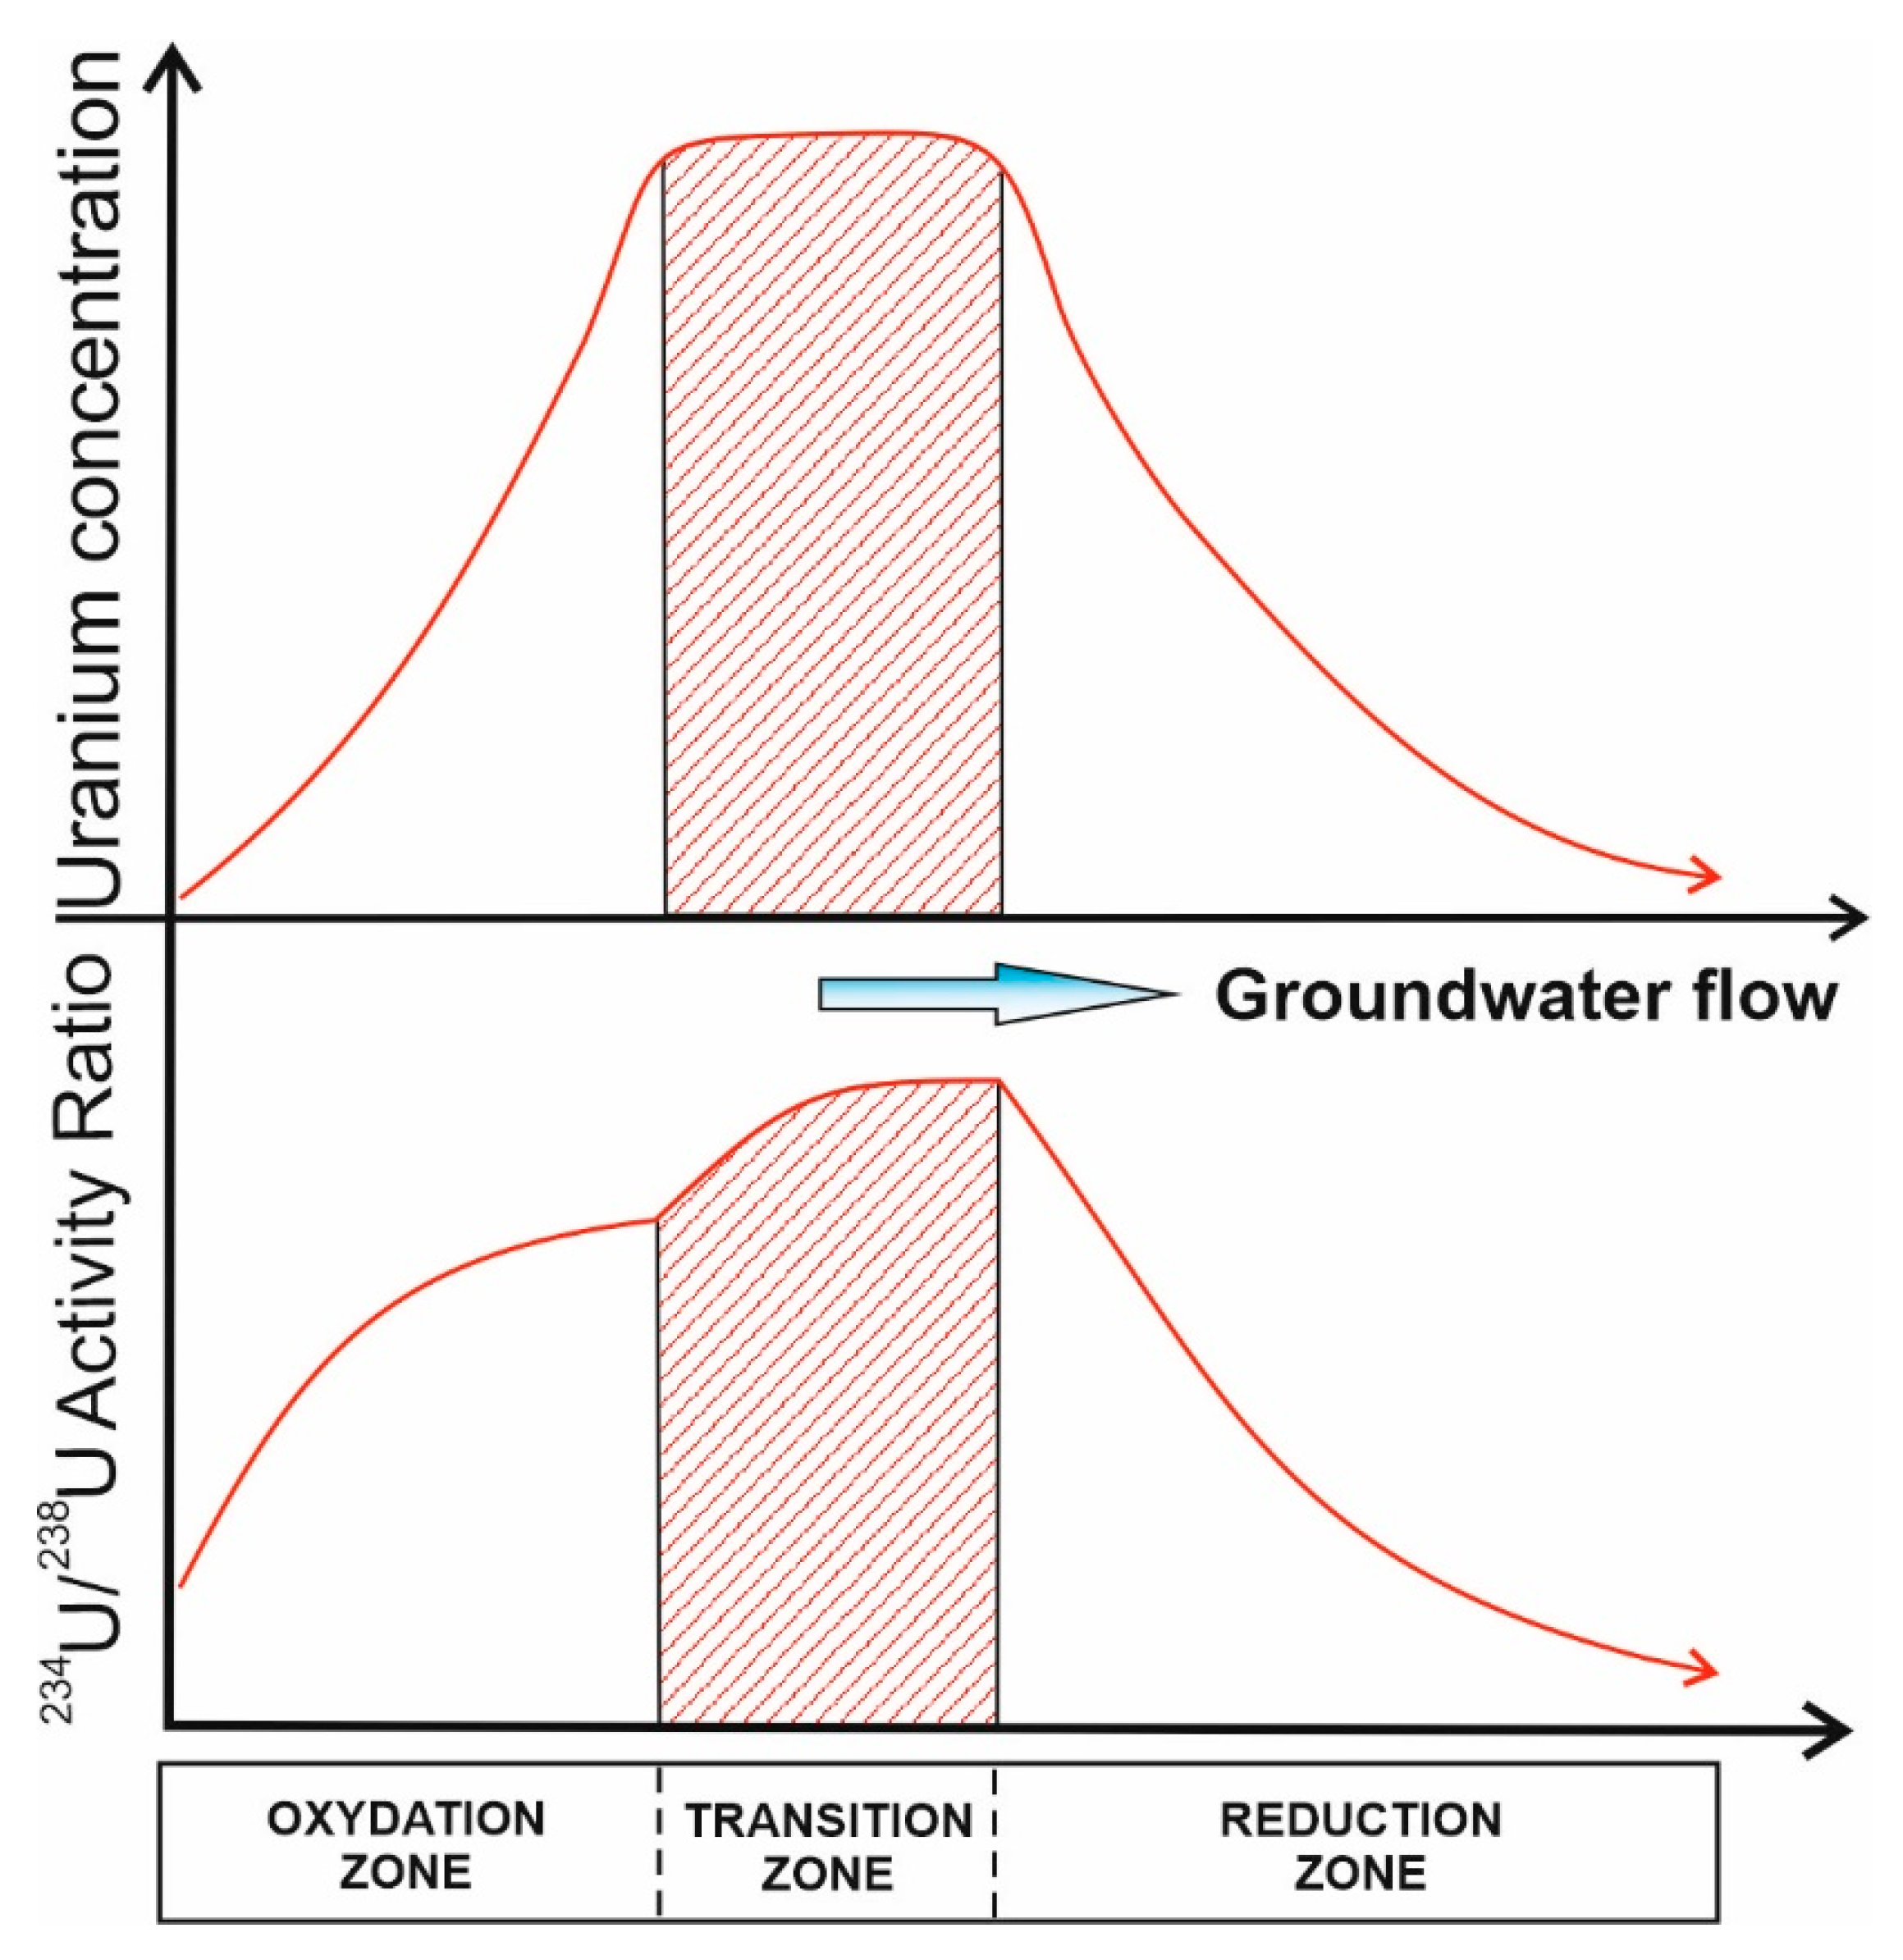
As the main sources of uranium and radon are crossed rocks and soils, if these lithotypes are saturated with water, the isotopes dissolve and are carried in groundwater. Therefore, the study of these radionuclides can provide useful qualitative information regarding transit times and underground water circulation. In particular, uranium behaves differently depending on the amount of oxygen present in the various sectors of the aquifer. In fact, in reducing environments, uranium changes its oxidation state from +6 to +4, forming water-insoluble compounds that precipitate in sediments or rocks [4]. Therefore, the study of this radionuclide and of the isotope ratio (234U/238U) can provide useful information about areas with higher / lower oxygen concentrations. In groundwater, three different zones regarding the chemistry of uranium can be schematically distinguished [4]:
- The oxidizing zone: Uranium is in the oxidation state +6, chemically stable and highly soluble. Here, uranium acts as a conservative tracer and is enriched as (234U).
- The transition zone (downstream of the oxidizing zone): the uranium concentration and isotope ratio (234U/238U) increase.
- The reducing zone: The activity ratio (234U/238U) decreases slowly, approximately linearly, as a function of the residence time, while the uranium concentration is maintained at a relatively constant very low level [4].
Figure 1 shows a qualitative graph that indicates the variation in terms of uranium and its isotope ratio in an aquifer as a function of the transition from the oxidizing to the reducing zone [4].
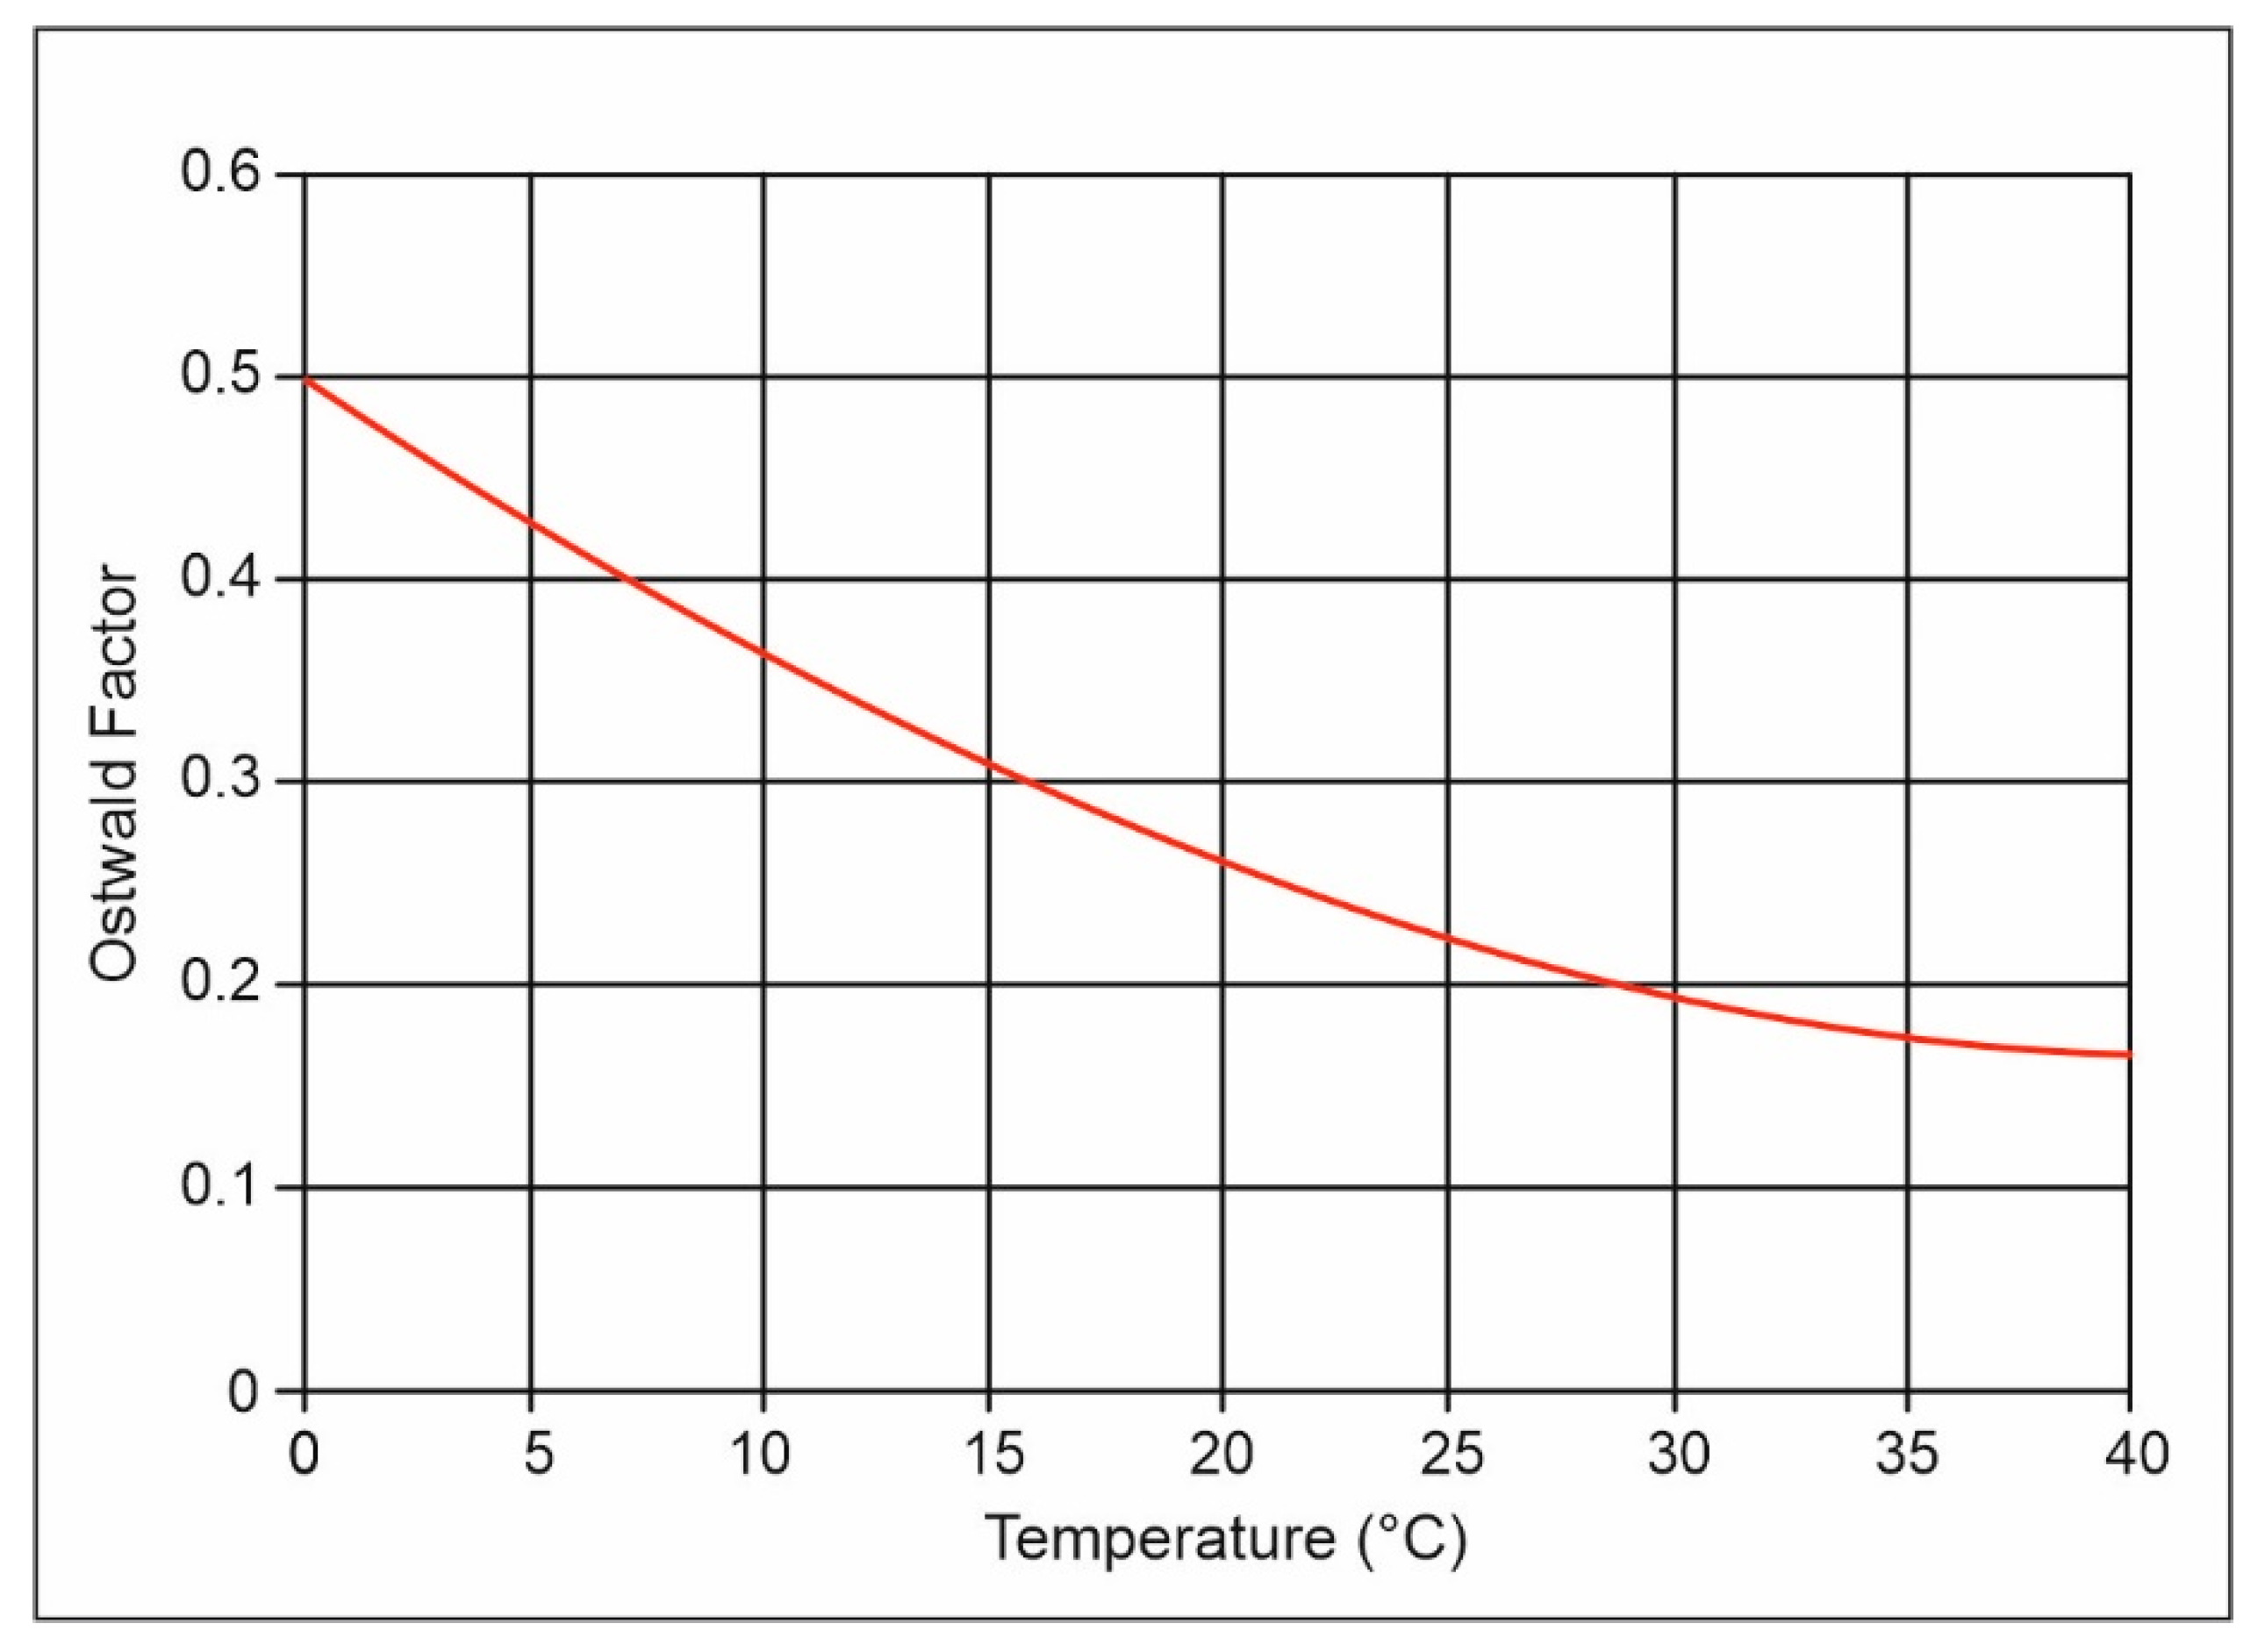
The concentration of radon activity can be also used as an indicator of underground hydrodynamics and provides valid elements for estimations. This inert and hydrotransported gas does not interact with any chemical species and can provide indications of the content of radium present in rocks and, according to certain hypotheses, also makes it possible to obtain information regarding the mobility of groundwater. In fact, if radon is present in the aquifer in a homogeneous way, its content will be higher in the sectors of greater mobility in the aquifer studied. Therefore, radon has been used as a tracer by correcting the performed physical tests with the measurement of the temperatures of samples, since this gas’s solubility in water follows Ostwald’s law as a function of temperature [5], as shown in Figure 2.
Water samples were taken from the study area for the determination of the volumetric activity concentrations of the radioisotopes used in the proposed methodology. Redox potential (Eh), dissolved oxygen and temperature measurements provide indications of the oxidizing and reducing sectors of the aquifer, which usually correspond, respectively, to the recharge and the more mobile areas of the aquifer, which are more oxygenated, and to the drainage and less mobile areas of the aquifer, which are less oxygenated. In particular, since the groundwater temperature depends on various elements, such as the supply water temperature, how long water is resident in the aquifer and the characteristic of the lithotypes that constitute the aquifer (i.e., its hydraulic conductivity and thermal diffusivity), these features can be exploited so that the temperature can be used as another natural tracer of the hydrodynamic characteristics of the aquifer. In fact, even under the same conditions, the water temperature varies according to the mobility of the aquifer. Therefore, this parameter increases due to the length of the hydraulic path, how long water is resident in the aquifer and how long it is in contact with the lithotypes that constitute it. On the other hand, the temperature will be lower in sectors with a higher groundwater flow rate, reduced hydraulic path and low contact times with the lithotypes constituting the aquifer. Hence, temperature distribution maps also provides useful information for the identification of recharge and drainage areas, usually corresponding, respectively, to the areas of greatest and least mobility in the aquifer and to the flow directions along which water is more mobile and therefore colder. Therefore, the purpose of this work was to provide a study methodology based on the integrated analysis of data derived from classical hydrogeological surveying (static groundwater levels), parametric measurements in the field (redox potential, dissolved oxygen and groundwater temperature), volumetric activity concentrations of radon (222Rn) and radium (226Ra) and the uranium (234U/238U) isotope ratio as determined based on samples analyzed in the laboratory. In particular, every used tracer provides specific information about the conditions of the aquifer that, when combined and integrated with the information derived from the piezometric map, contribute to the definition of the hydrogeological model of the studied aquifer. The model can be subsequently improved with laboratory hydrogeochemical data, if available, to increase the accuracy. The method presented here was tested, in the context of a larger hydrogeological study [6], in the southern sector of the shallow aquifer of the S. Eufemia Lamezia plain (Calabria, Southern Italy).
2. Materials and Methods
The proposed methodology allows for the integrated use of data from hydrogeological surveys, parametric measurements in the field and radiometric analyses on samples taken on-site, according to the methodological scheme shown below.
- A structural lithological reconstruction of the study area, which may be based on bibliographic data, where there is sufficient reliable data for a medium-scale reconstruction of the structural lithological characteristics of the examination area. Otherwise, if the data available are not representative enough, this information can be obtained through a geological structural survey in the field. In each case, the surface data needs to be integrated with survey stratigraphies or indirect surveys for a more detailed reconstruction.
- The identification of the existing wells or piezometers in the examination area, which affect the same aquifer (in the case of multilayer aquifers) and whose depths, stratigraphy and construction characteristics are known and accessible for on-site measurements and the sourcing of samples. These wells or piezometers have to be distributed, as much as possible, in a homogeneous way to be representative of the studied aquifer. The set of surveyed wells will form the monitoring network for the subsequent phases.
- The monitoring of groundwater for the hydrogeological survey of the static level of the aquifer, parametric measurements of the redox potential (Eh), dissolved oxygen (O2) and groundwater temperature (T) and water sampling for radiometric investigations. The monitoring period must be extended to at least to one hydrological year which, especially in the case of phreatic shallow aquifers, reflects the local rainfall regime. The hydrogeological survey, parametric measurements taken in the field and sampling must be carried out during the periods of maximum oscillation in terms of the groundwater (flood/lean).
- The reconstruction of the piezometric surface of the aquifer from the hydrogeological survey data.
- The interpretation of the piezometric morphology, either for the identification of recharge and drainage areas in terms of the groundwater, preferential directions of water flow, underground watersheds or a qualitative estimate of hydraulic gradient (i) and transmissivity (T).
- A reconstruction of the isotherms map, for the evaluation of variations in temperature in the various sectors of the aquifer.
- A reconstruction of the redox isopotential map, to evaluate variations in this parameter in the different sectors of the aquifer.
- A reconstruction of the dissolved oxygen isocentration map, to evaluate this parameter in the different sectors of the aquifer.
Each of these maps provides information about the hydrodynamics of the aquifer, times of travel and higher or lower oxygenation areas.
- The determination of radioactive tracers in water samples in the laboratory. In particular, for fluid matrices (air and water), the “volumetric or massive activity concentration” of a radioactive substance must be defined, i.e., the number of disintegrations occurring in the volume or mass unit expressed in Becquerel per liter (Bq/L), Becquerel per cubic meter (Bq/m3) or Becquerel per kilogram (Bq/kg).
- The restitution of radiometric data determined in the laboratory, with representative tables and graphs or with an isodistribution map of the radioisotopes in the various aquifer sectors. The analysis of radiometric data provides additional information to identify the recharge and drainage areas of the aquifer.
According to the proposed method, all the maps indicated need to be reconstructed for the two periods of the oscillation of the aquifer (flood/lean) or as a median of the measurements in the field during the monitoring period. Instead, the determination of the “activity concentration” of the radioactive tracers must be realized by taking water samples in glass bottles (1000 mL) with a teflon cap, to contain the gas dispersion. The samples have to be analyzed by using the instruments and the methods indicated below.
- The manometric technique for measuring radon gas, using the test procedure “Determination of the activity concentration of radon gas (222Rn) in water” performed according to the ISO method [7];
- The ICP—mass technique for the determination of the isotope ratio of 234U/238U in the samples to be analyzed using the test procedure “ASTM C1345–08—Standard Test Method for Analysis of Total and Isotopic Uranium and Total Thorium in Soils by Inductively Coupled Plasma-Mass Spectrometry” [8].
The detection of the static groundwater level will take place in the surveyed wells and piezometers in the examination area. In the same locations, the redox potential and temperature measurements will be carried out with a multiparameter probe. Samples will be taken to be subjected to laboratory radiometric analyses. The water sampling must be performed at low flow, after purging the well or piezometer, avoiding the headspace in the containers. Regarding sampling and field surveys, it should be noted that these elements represent a fundamental part for the correct application of the method described. It is imperative for these activities, often overlooked or roughly executed, to be carried out accurately. Despite the availability of advanced processing tools, if samples have been approximately taken or determined, the results will also be approximate. In fact, the field survey constitutes a substantial part of the entire representation process of the studied phenomenology.
3. Results
3.1. Methodology Application—Case Study
The proposed methodology was tested in the context of a larger hydrogeological study conducted in Calabria (Italy) in the southern sector of shallow aquifer of the S. Eufemia Lamezia plain [6]. In this study, 18 measurement points (piezometers and wells) were recorded, which are distributed in the area of interest, where seasonal measurements of the static level (sl) of the aquifer and parametric measurements (Eh, O2, T) were carried out in the field. Among the 18 piezometers or wells surveyed, half of them (nine points) was also used for taking water samples for laboratory radiometric analyses. This subset was selected by choosing a number of points located in different sectors of the examination area to test the proposed methodology.
3.1.1. Geological, Lithological–Structural and Hydrogeological General Framework of Study Area
The whole study area is located in the southern sector of S. Eufemia Lamezia plain (Central Calabria), which had a complex genesis, as it is part of the Tyrrhenian sector of “Catanzaro Graben”, a significant tectonic structure of regional importance in the broader and more articulated geological context of the Calabrian-Peloritan Arc [9,10]. The graben was generated by sub-vertical faults in a prevailing WNW—ESE direction and a left lateral strike-slip component [9]. The plain is characterized by a complex lithological, geological-structural and hydrogeological arrangement (Figure 3).
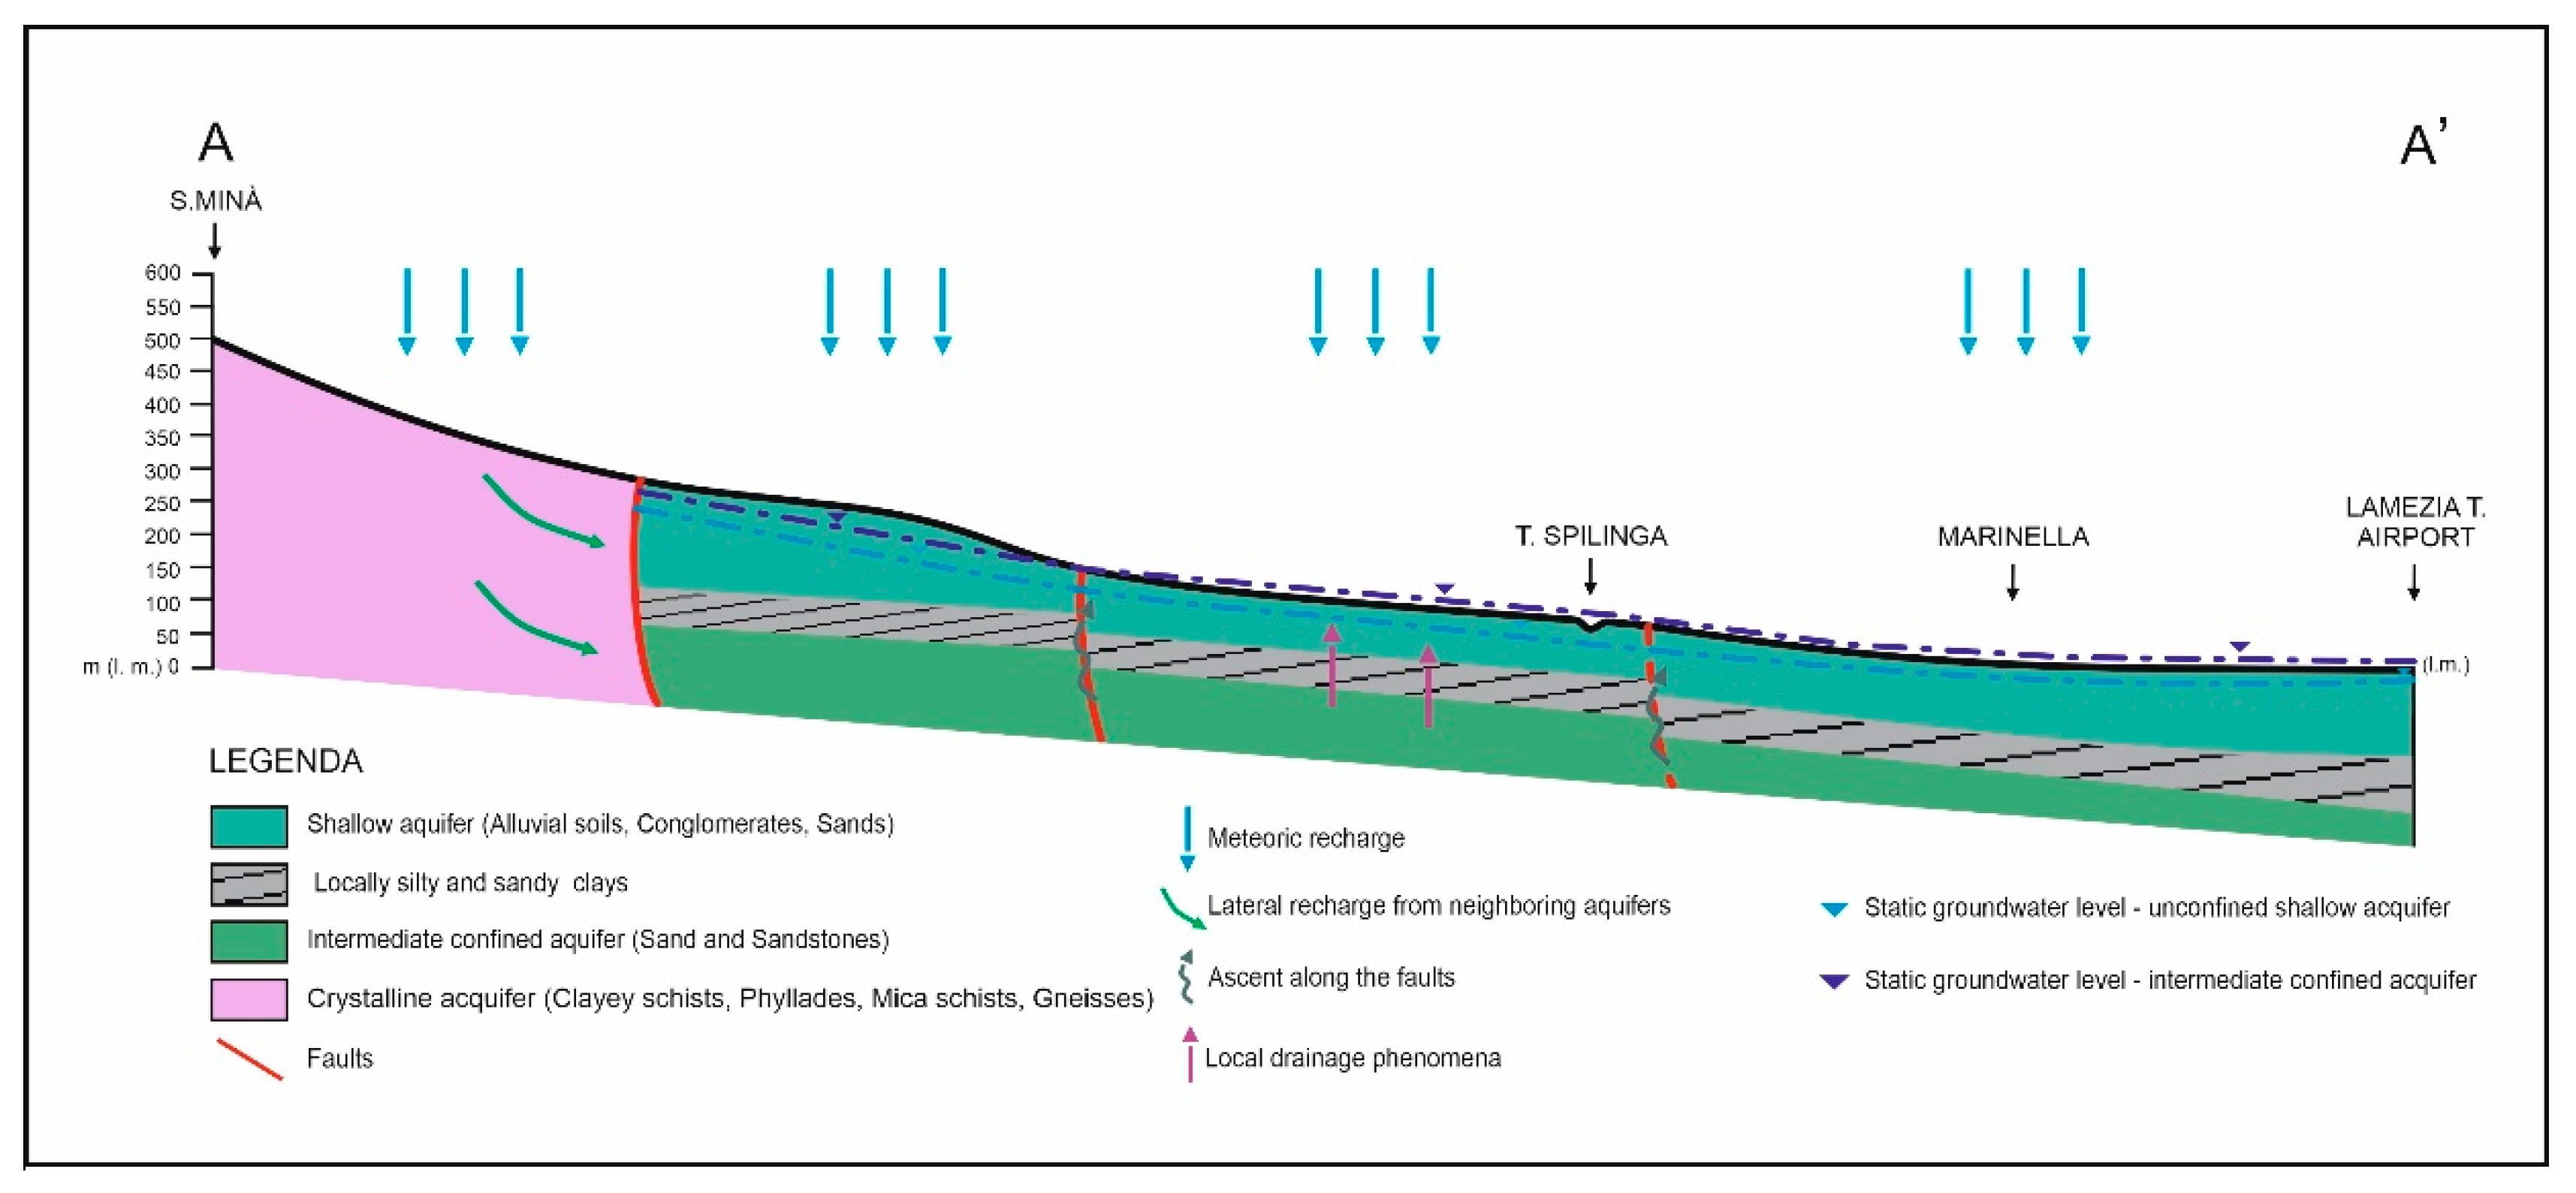
In this varied geological framework, previous studies show that the plain underlies an articulated hydrogeological structure, consisting of a multilayer aquifer (Figure 4) below the entire plain.
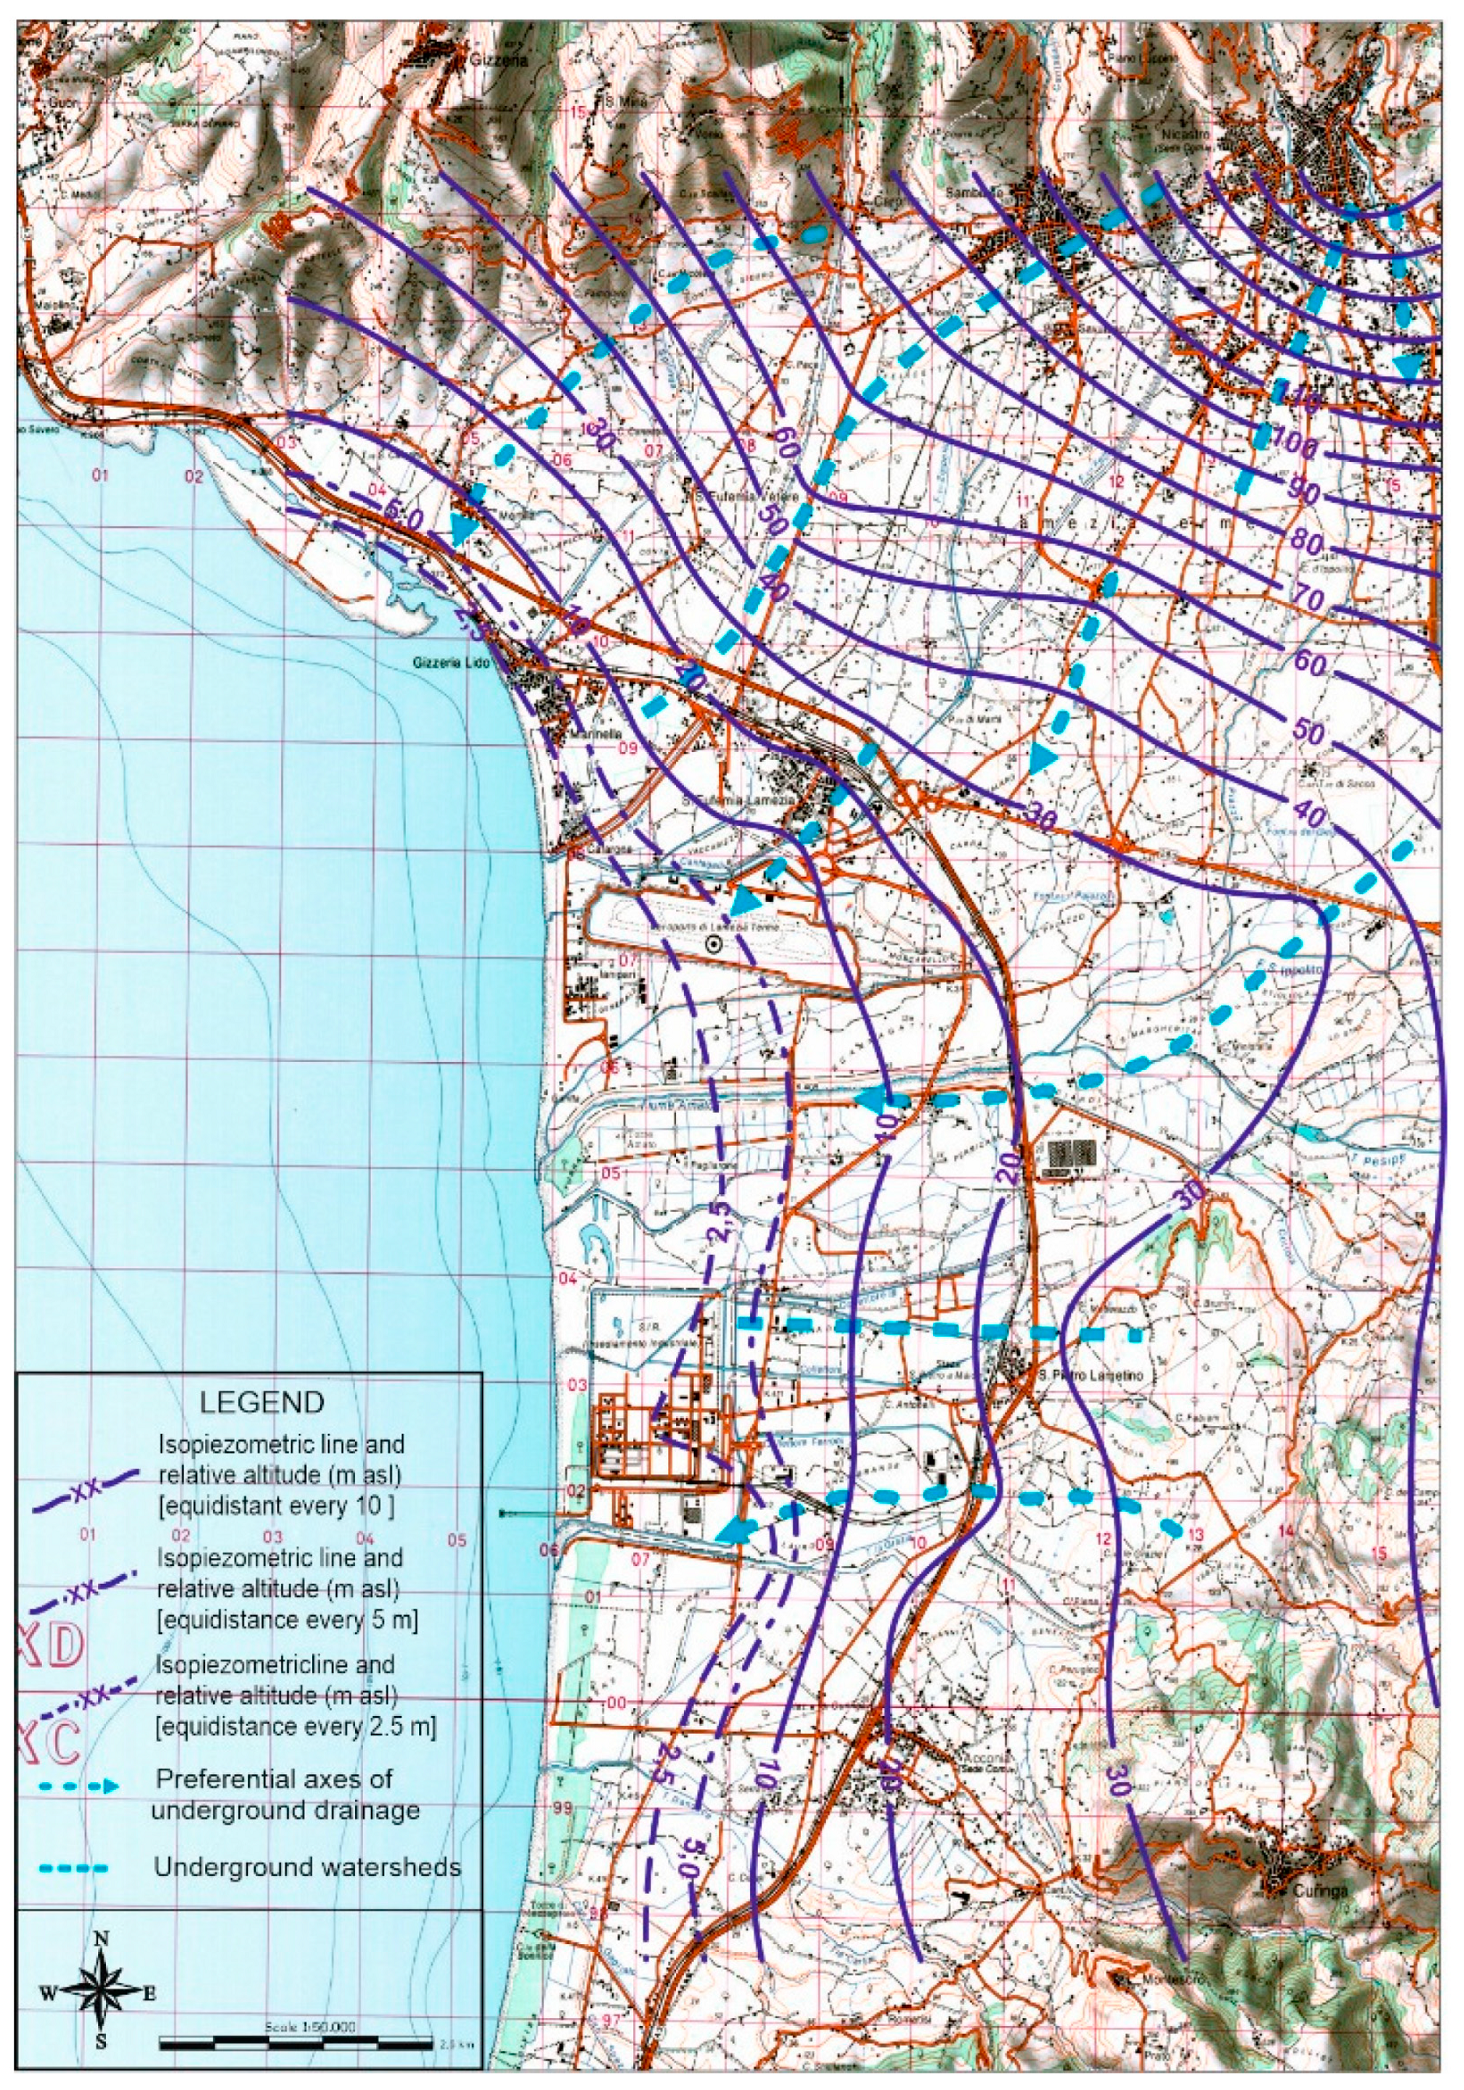
The presence of silt-clayey lithotypes tends to generate an underground water circulation pattern with a muti-layer aquifer [1,11,12,13,14,15]. The subject of this study is the southern sector of the shallow aquifer, placed just below ground level in the S. Eufemia Lamezia plain (Figure 5).
The analysis of the piezometric morphology shows a recharge area in the northern sector and drainage areas in the middle and coastal strip of the plain. There are also preferential drainage axes, with the primary one being roughly located in the center of the plain, in the E–W direction, approximately corresponding to the bed of the Amato River [14,16]. The interpretation of the piezometric morphology also aided the identification of underground watersheds, affecting the underground water circulation model [14].
3.1.2. Hydrogeological Survey—Construction of the Piezometric Map
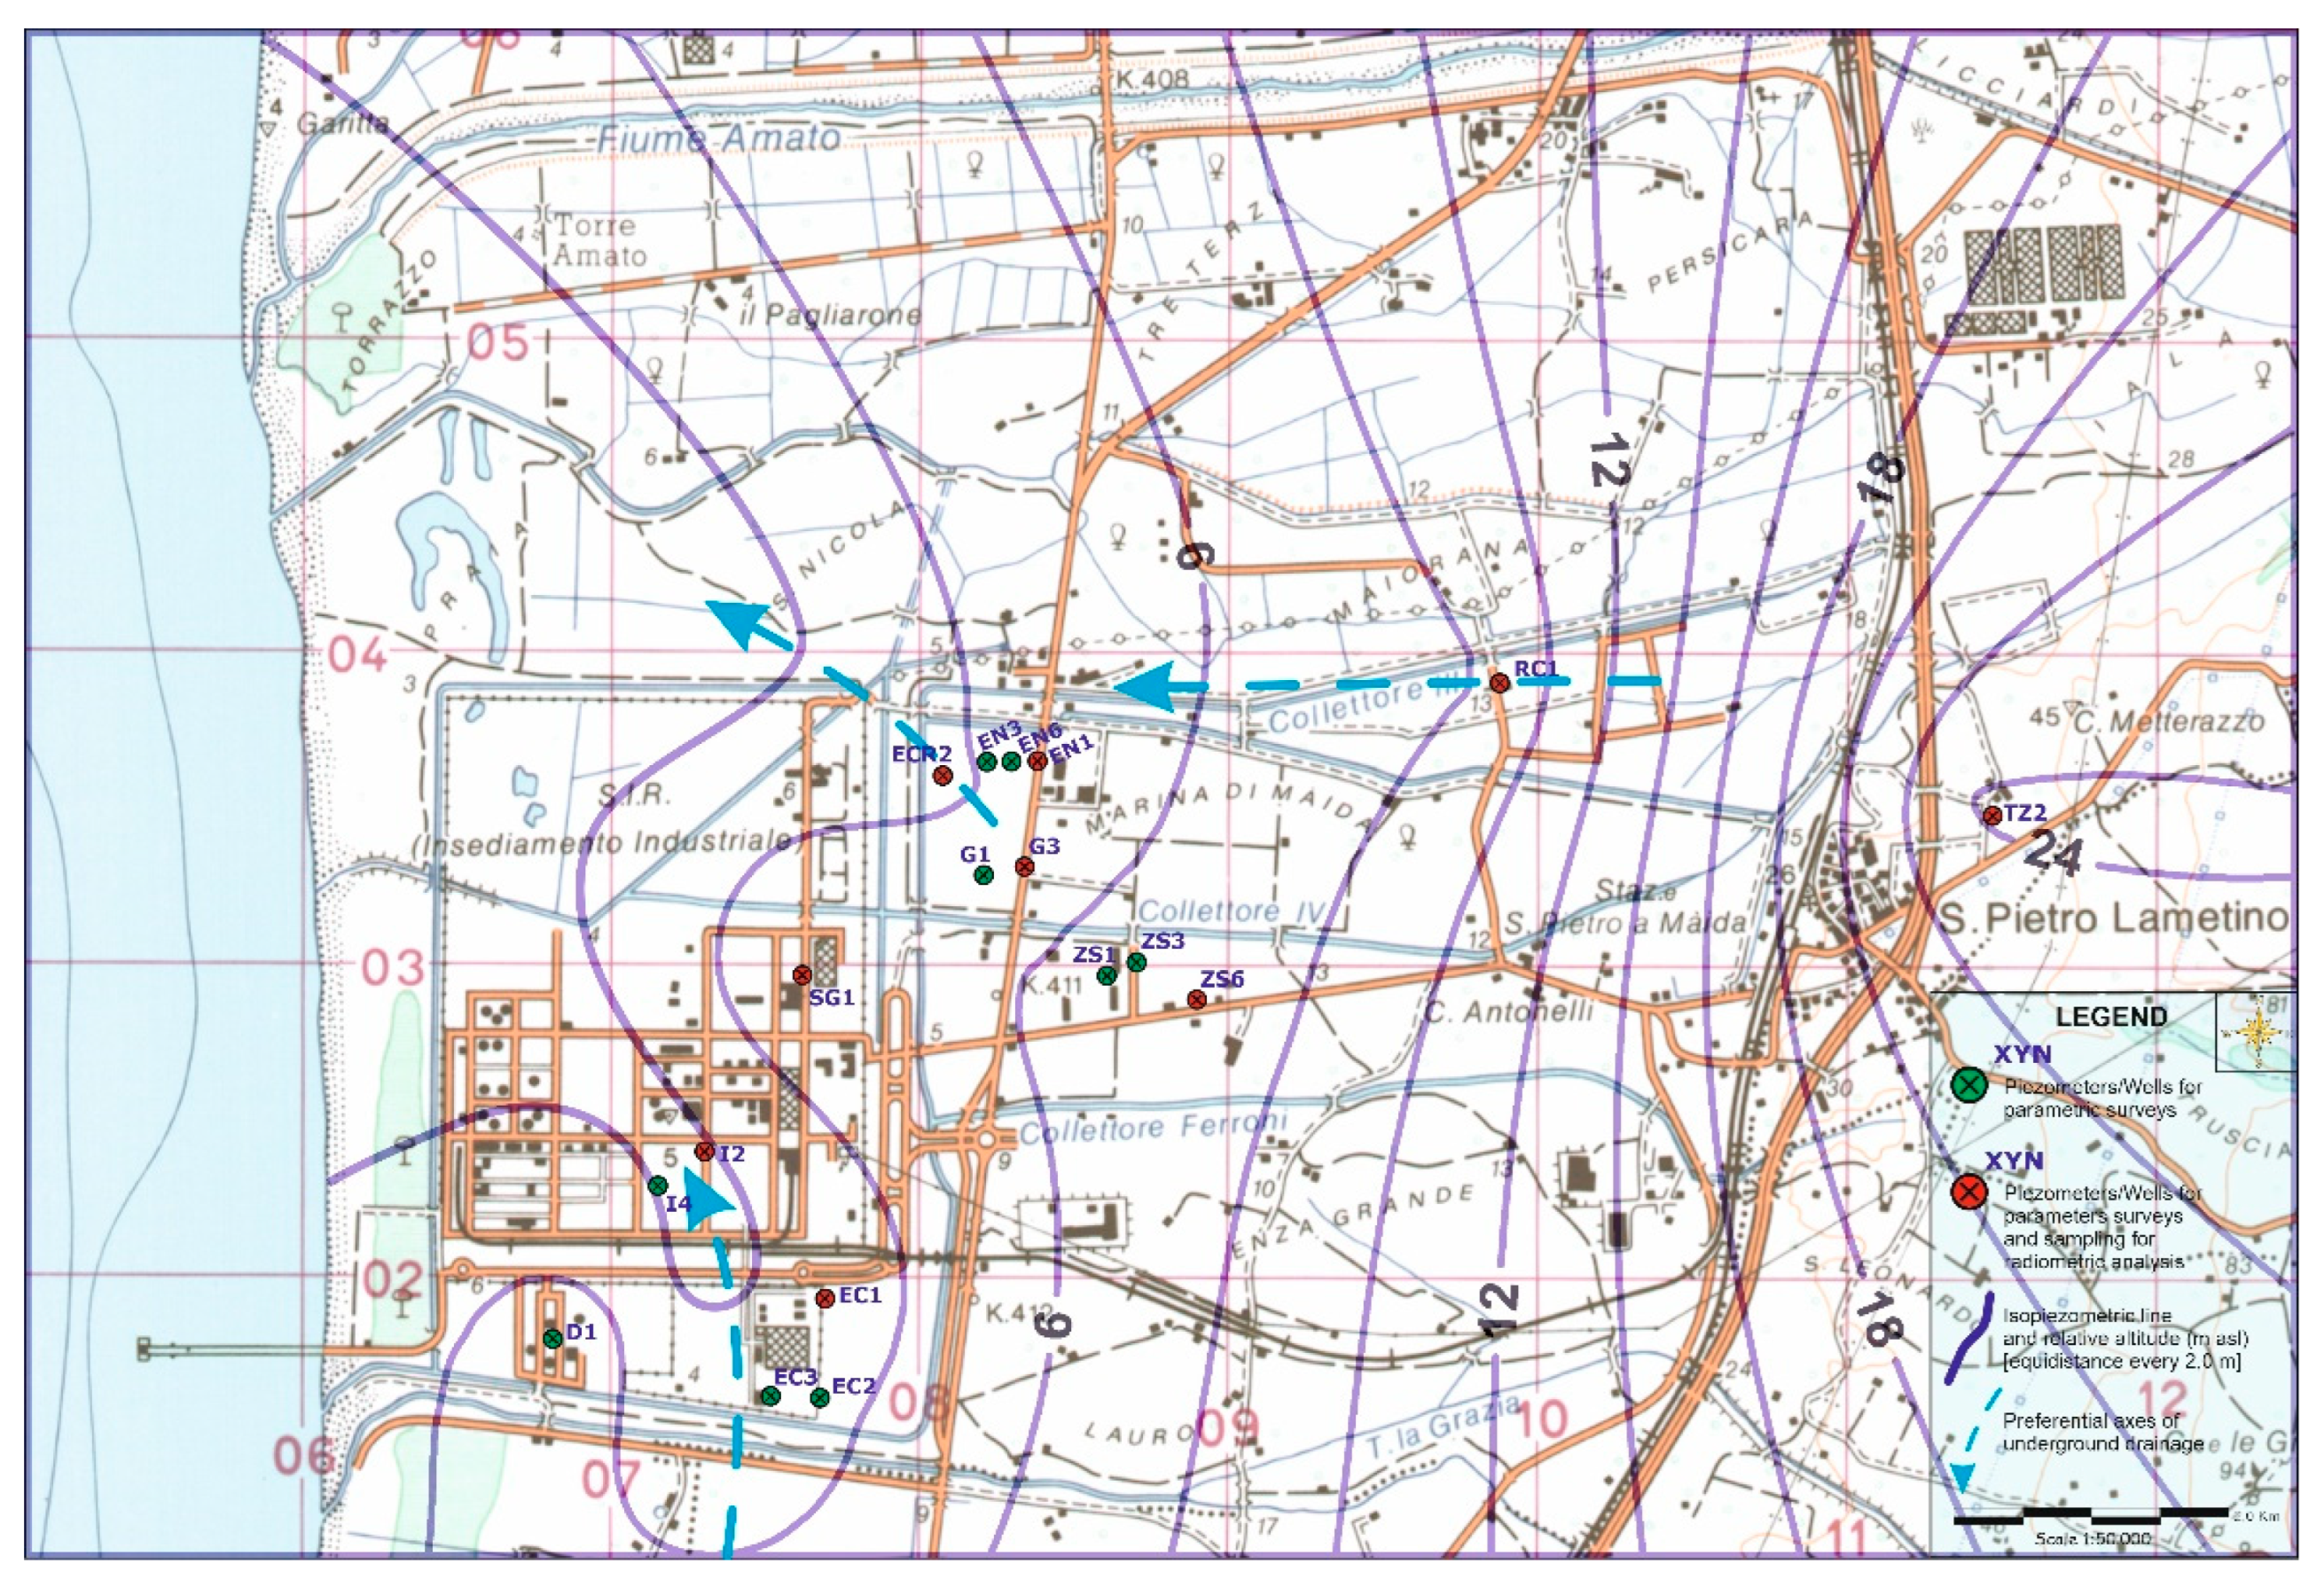
To define the local hydrogeological model of the study area, a synthetic hydrogeological map was obtained (Figure 6), using the median of the static level measurements that were obtained during the available monitoring periods [6].
The piezometric morphology trend in the study area (Figure 6) indicates an innermost area characterized by a strengthening of the isopiezometric lines, and a coastal area characterized by more sparse isophases. This pattern highlights an internal area with reduced hydraulic paths (L) and high hydraulic gradient (i). By progressively approaching the coast, the hydroisoipses widen, the hydraulic paths increase and the gradient (i) decrease.
Applying Darcy’s law:
from which:
(where: [i] = hydraulic gradient; [ΔH] = loss of hydraulic load; [L] = hydraulic path; [q] = unit flow rate; [T] = aquifer transmissivity).
i = ΔH/L and q = Ti,
ΔH/L = q/T
Therefore, as the hydraulic gradient is inversely proportional to the transmissivity (1, 2), a thickening of the isopiezometric lines along the same flow direction corresponds to a decrease in the path [L] and, thus, to an increase in the gradient [i] and a decrease in the transmissivity [T] as well as the other way around [17,18]. Applying this consideration to the piezometric morphology of the study area, a quick qualitative estimate of the main hydrodynamic parameters of the aquifer were made on a local scale. This evaluation highlights that the internal areas, with lower hydraulic paths and high gradients, have low transmissivity; the external areas, meanwhile, are characterized by higher hydraulic paths and low gradients, with them having high transmissivity. Furthermore, as T = K × b (with K = hydraulic conductivity; b = thickness of the aquifer), the increase in T corresponds to an increase in K and the other way around [13]. The hydrodynamic parameters of the aquifer for the study area were derived, in quantitative terms, from previous studies [1].
Transmissivity: 1.9 × 10⁻² > T > 4.0 × 10⁻³ m2/s
Hydraulic conductivity: 1.8 × 10⁻⁴ > K > 5.4 × 10⁻⁴ m/s
Storage coefficient: 1.1 × 10⁻⁴ > S > 1.5 × 10⁻⁴
Hydraulic gradient: 0.002 > i > 0.009
It is likely that the significant variability in terms of the hydrodynamic parameters of the aquifer is due to its granulometric heterogeneity and to the variations in the thickness of the lithotypes characterizing the alluvial aquifer [1].
However, in the present work, previous studies were implemented by making a conservative estimate of the groundwater flow rate in the study area using the formula:
derived from Darcy’s law [18] (where [Q] = flow rate; [T] = mean transmissivity; [L1] = hydraulic path length of the upstream section; [L2] = hydraulic path length of the downstream section; [i] = mean hydraulic gradient).
Q = T × (L1 − L2)/(ln L1 − ln L2) × i
According to the Equation (3), the flow rate of the study area is:
(where [Q] = flow rate; [T] = 1.1 × 10⁻²; [L1] = 4150 m (the upstream section corresponding to the isopiezometric line 8 m in Figure 6); [L2] = 3850 m (the downstream section corresponding to the isopiezometric line 2 m in Figure 6); [i] = 0.005).
Q = 0.22 m3/s
All the mean values used for the formula are derived from the ranges shown above for each parameter.
3.1.3. Analysis of Parametric Data Detected in the Field
In the previous century, the Sant’ Eufemia Lamezia plain was a large and extensive swamp, remediated through interventions such as hydraulic arrangements for streams and the construction of large fillings. The study area falls into one of the sectors most affected by the swamping at that time, which is likely responsible for the genesis of peat deposits [6]. Peat is generated by the putrefaction of vegetable organic substances in anoxic conditions. Its progressive decomposition triggers a redox reaction responsible for the presence of anoxic environments in the aquifer, especially in draining sectors, where the aquifer is usually slower and less oxygenated, as it is less affected by the contributions of colder and oxygen-rich rainwater. To verify this hypothesis, the available field measurements of the redox potential (Eh) and dissolved oxygen (O2) [6] were used. Median values for Eh and O2 are shown in Table 2.
The information derived from the hydrogeological survey, the results of the radiometric analysis of the samples and groundwater temperature measurements were associated with those measurements. For the presentation of the results, it was decided to use the median of the data, interpolating the values obtained. The interpolation method used, for all the maps proposed, was ordinary kriging, starting from the assumption that the interpolated parameter can be treated as a variable. This means that for data detected in points close to each other, there is a spatial correlation, while points distant from each other are independent. A distribution map of the presence of peat was not constructed, as it would generate a continuous horizon that would not be compatible with the discontinuous peat deposition mechanism linked to localized organic material accumulation in humid environments [19]. Moreover, the currently available data are punctual and discontinuous [6]. Therefore, the presence of peat was verified through the available stratigraphies.
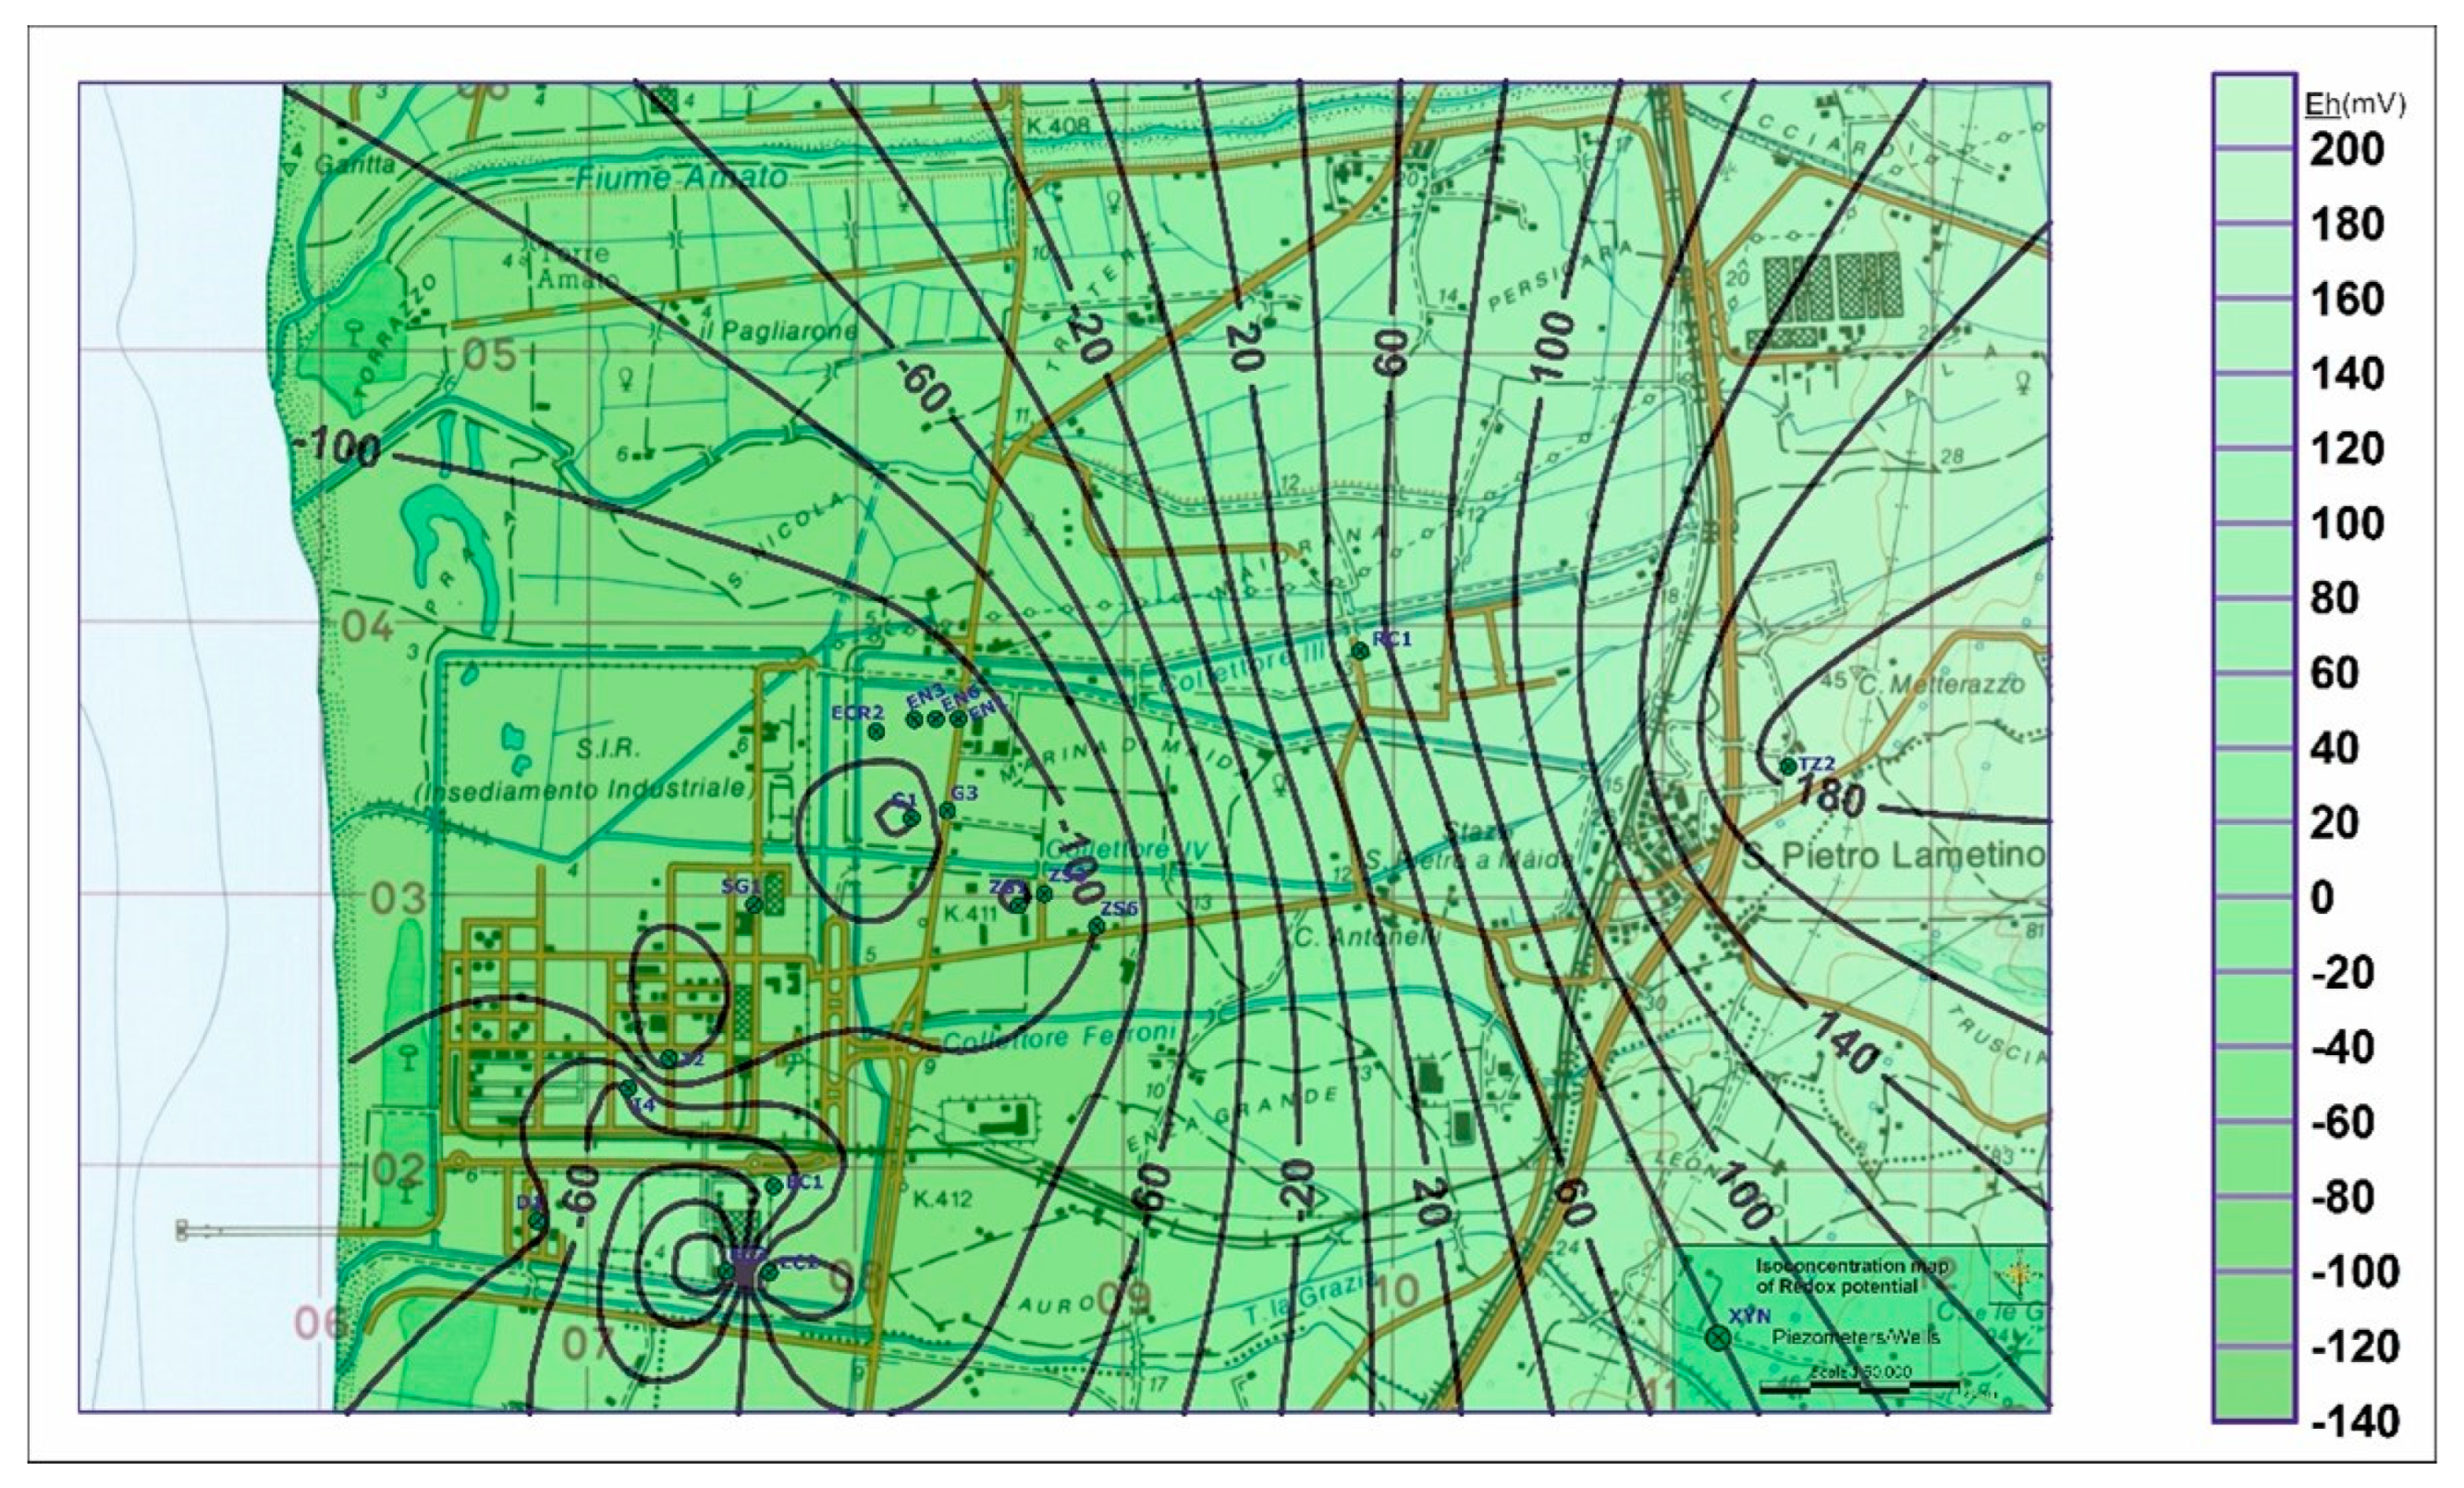
Data collected in the field and reported in Table 2 are returned in the map in Figure 7 with regards to the redox potential.
The map highlights, an innermost sector of the study area with positive redox values and a sector along the coast with negative redox potential values. These correspond to the more oxygenated and less oxygenated sectors of the aquifer, respectively.
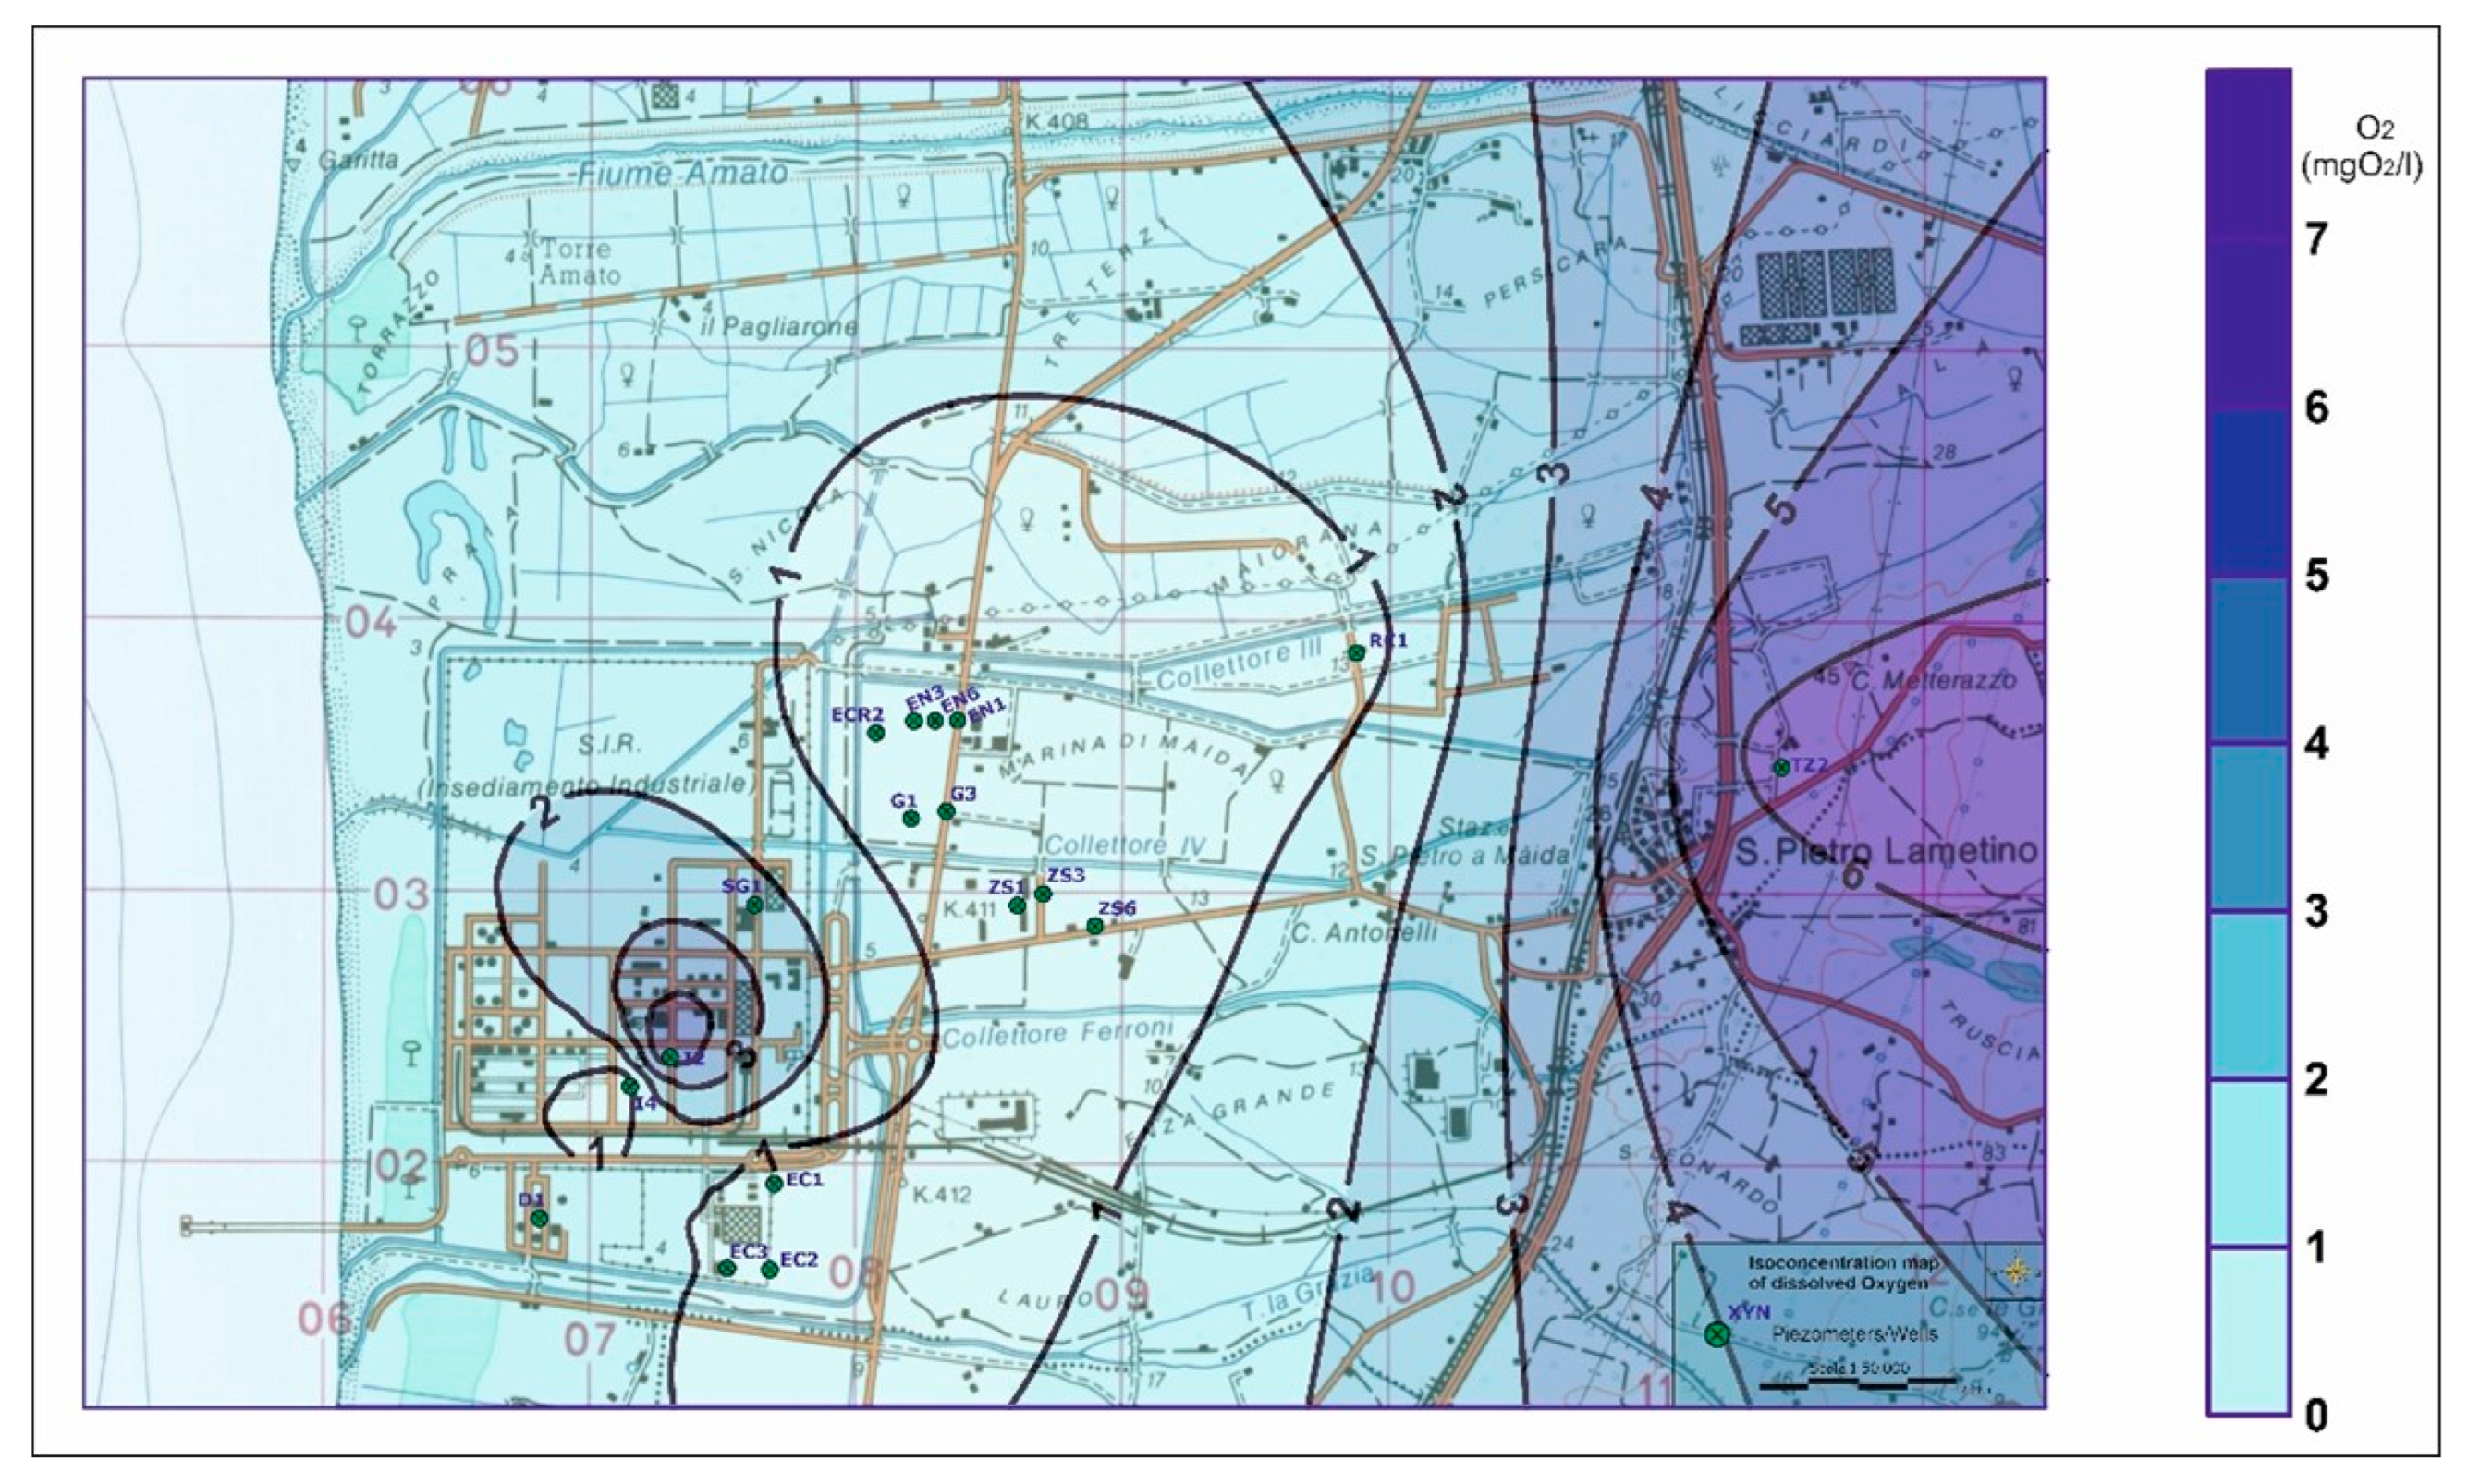
Together with the redox potential value in the monitoring wells, the content of dissolved oxygen (O2) was also measured. The median of the data shown in Table 2 was used for the construction of the dissolved oxygen isoconcentration map of the study area (Figure 8).
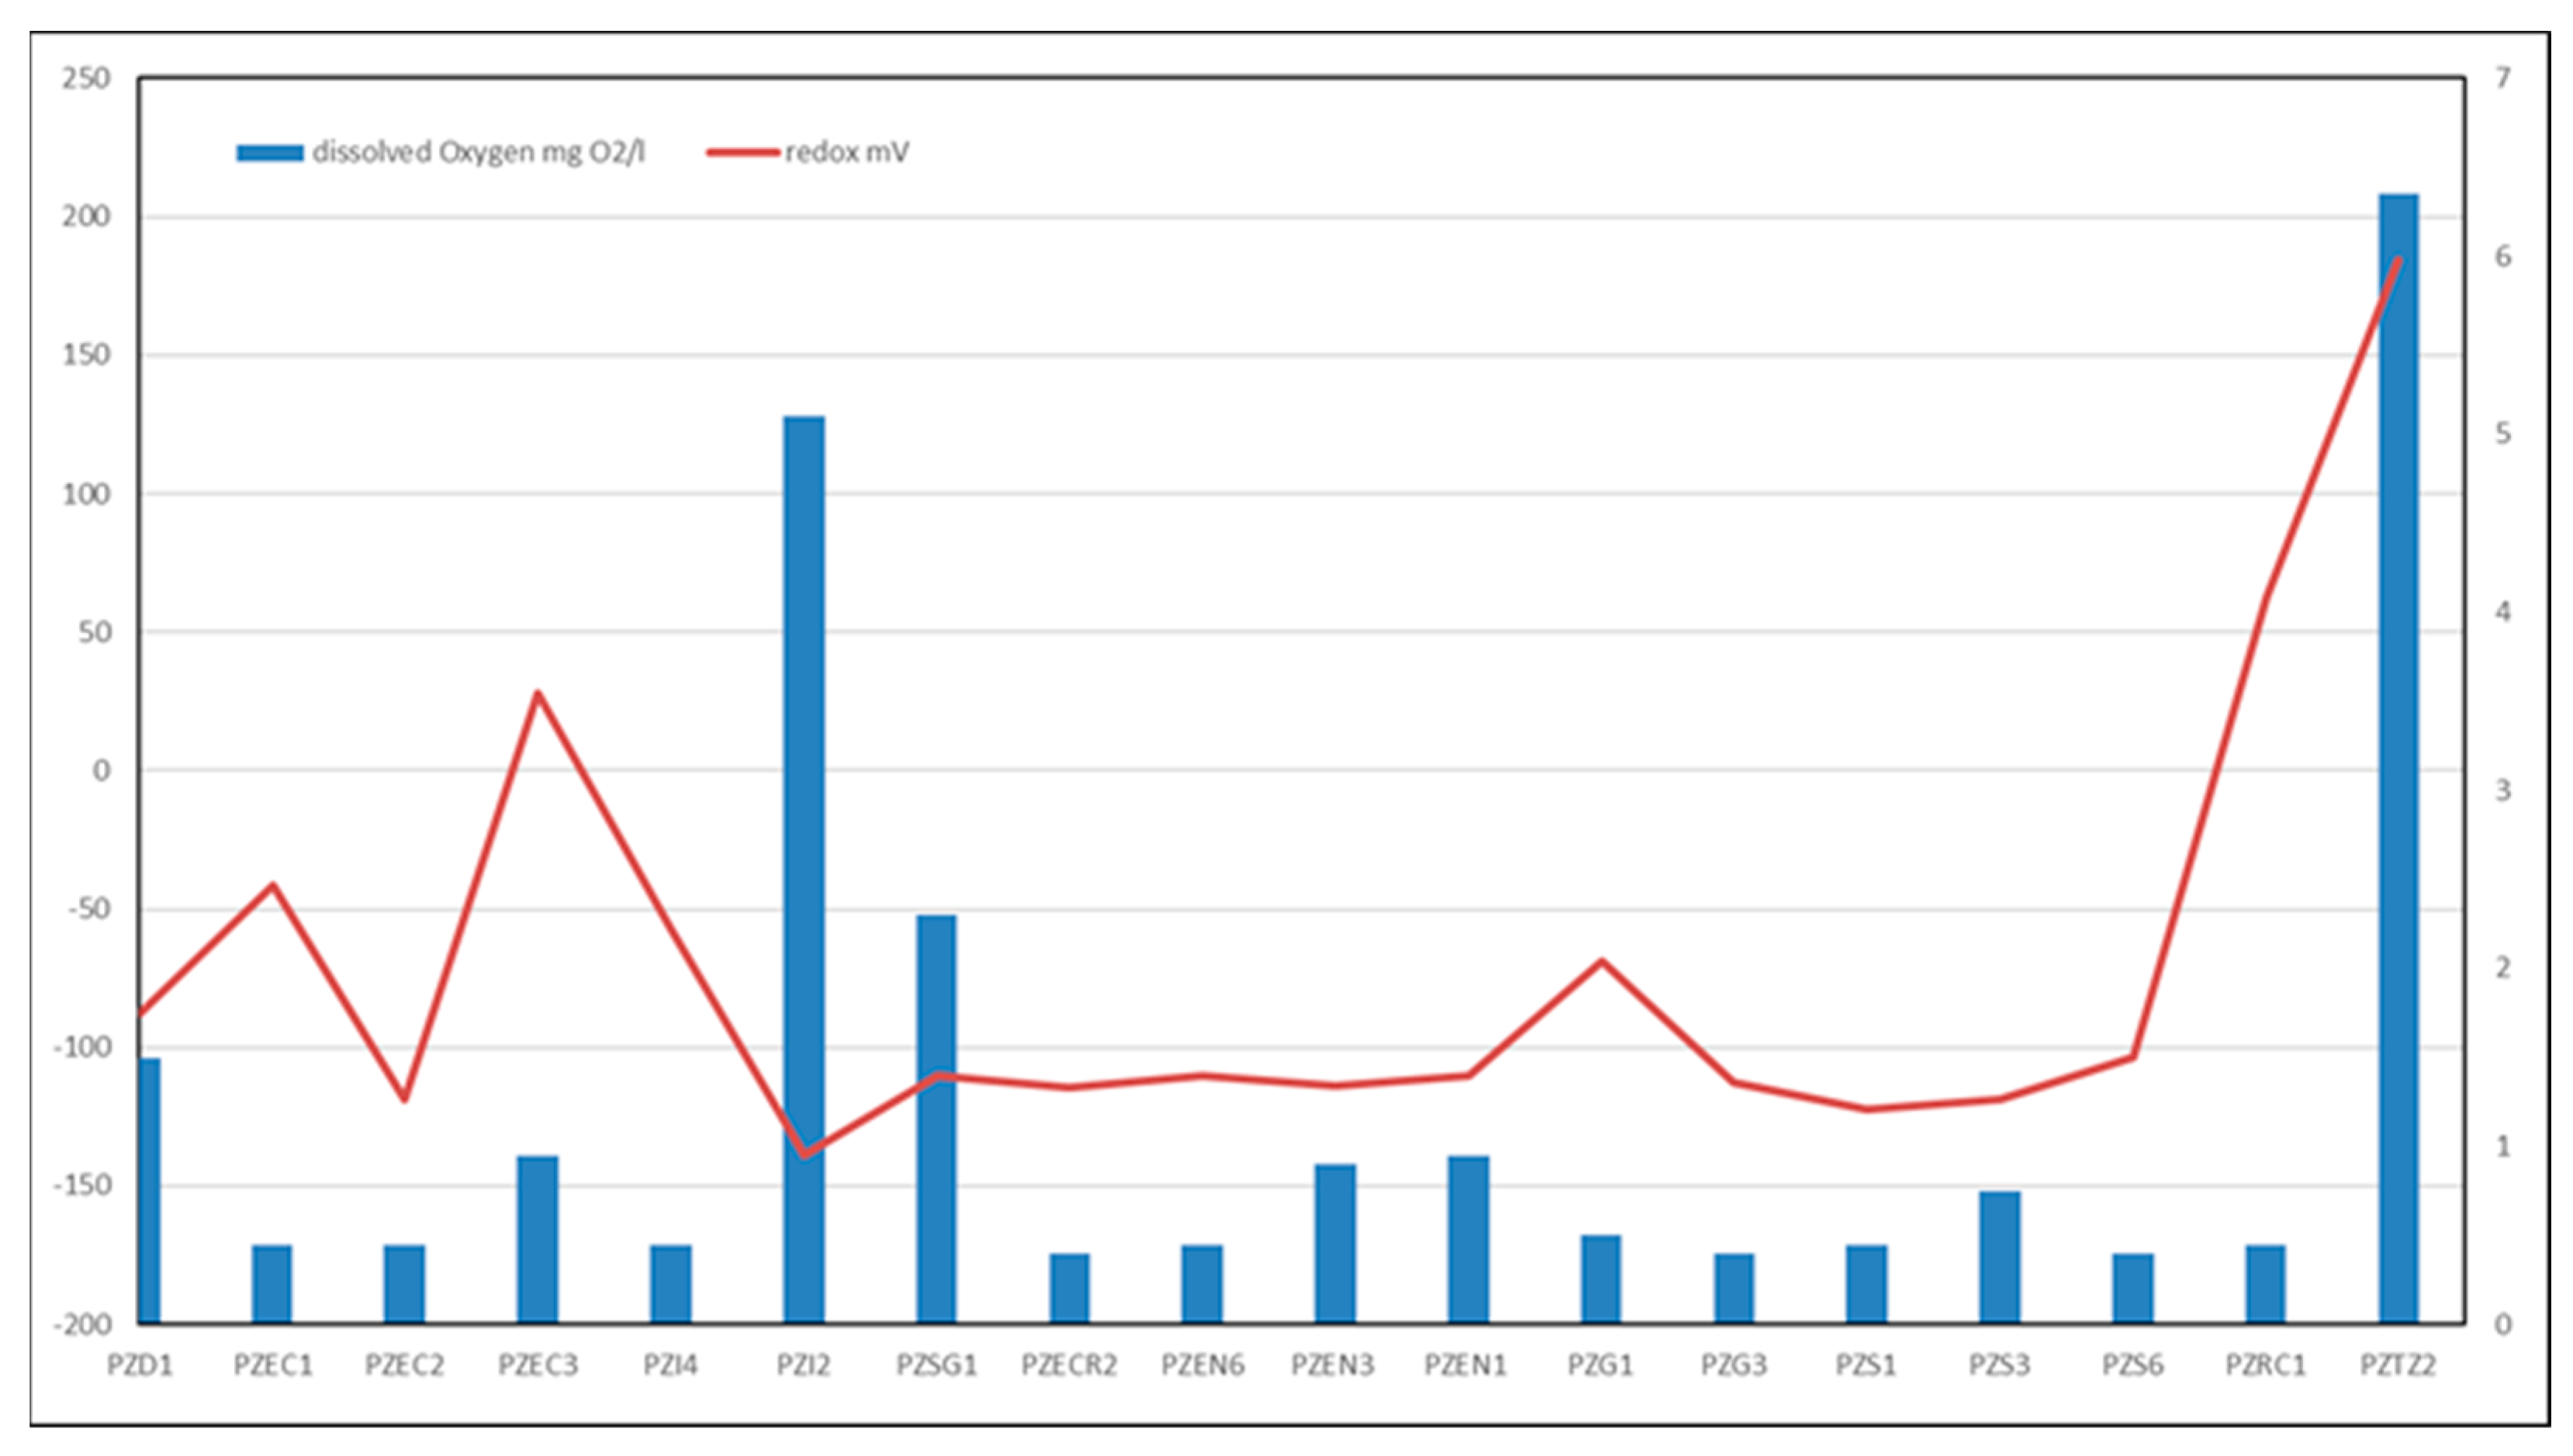
An integrated reading of the Eh isodistribution (Figure 7) and O2 isoconcentration maps (Figure 8) highlights a large reducing zone in the medium-low section of the study area, characterized by median values in terms of negative redox potential and dissolved oxygen levels generally lower than 1 mg/L. The median values of these two parameters were correlated in the graph shown in Figure 9, which highlights their constant and comparable trend.
For the available period, the groundwater temperature in the monitoring wells/piezometers was also measured [6], with this providing useful information on the circulation of underground water, highlighting areas with more active circulation compared to the surrounding ones. The median data is shown in Table 3.
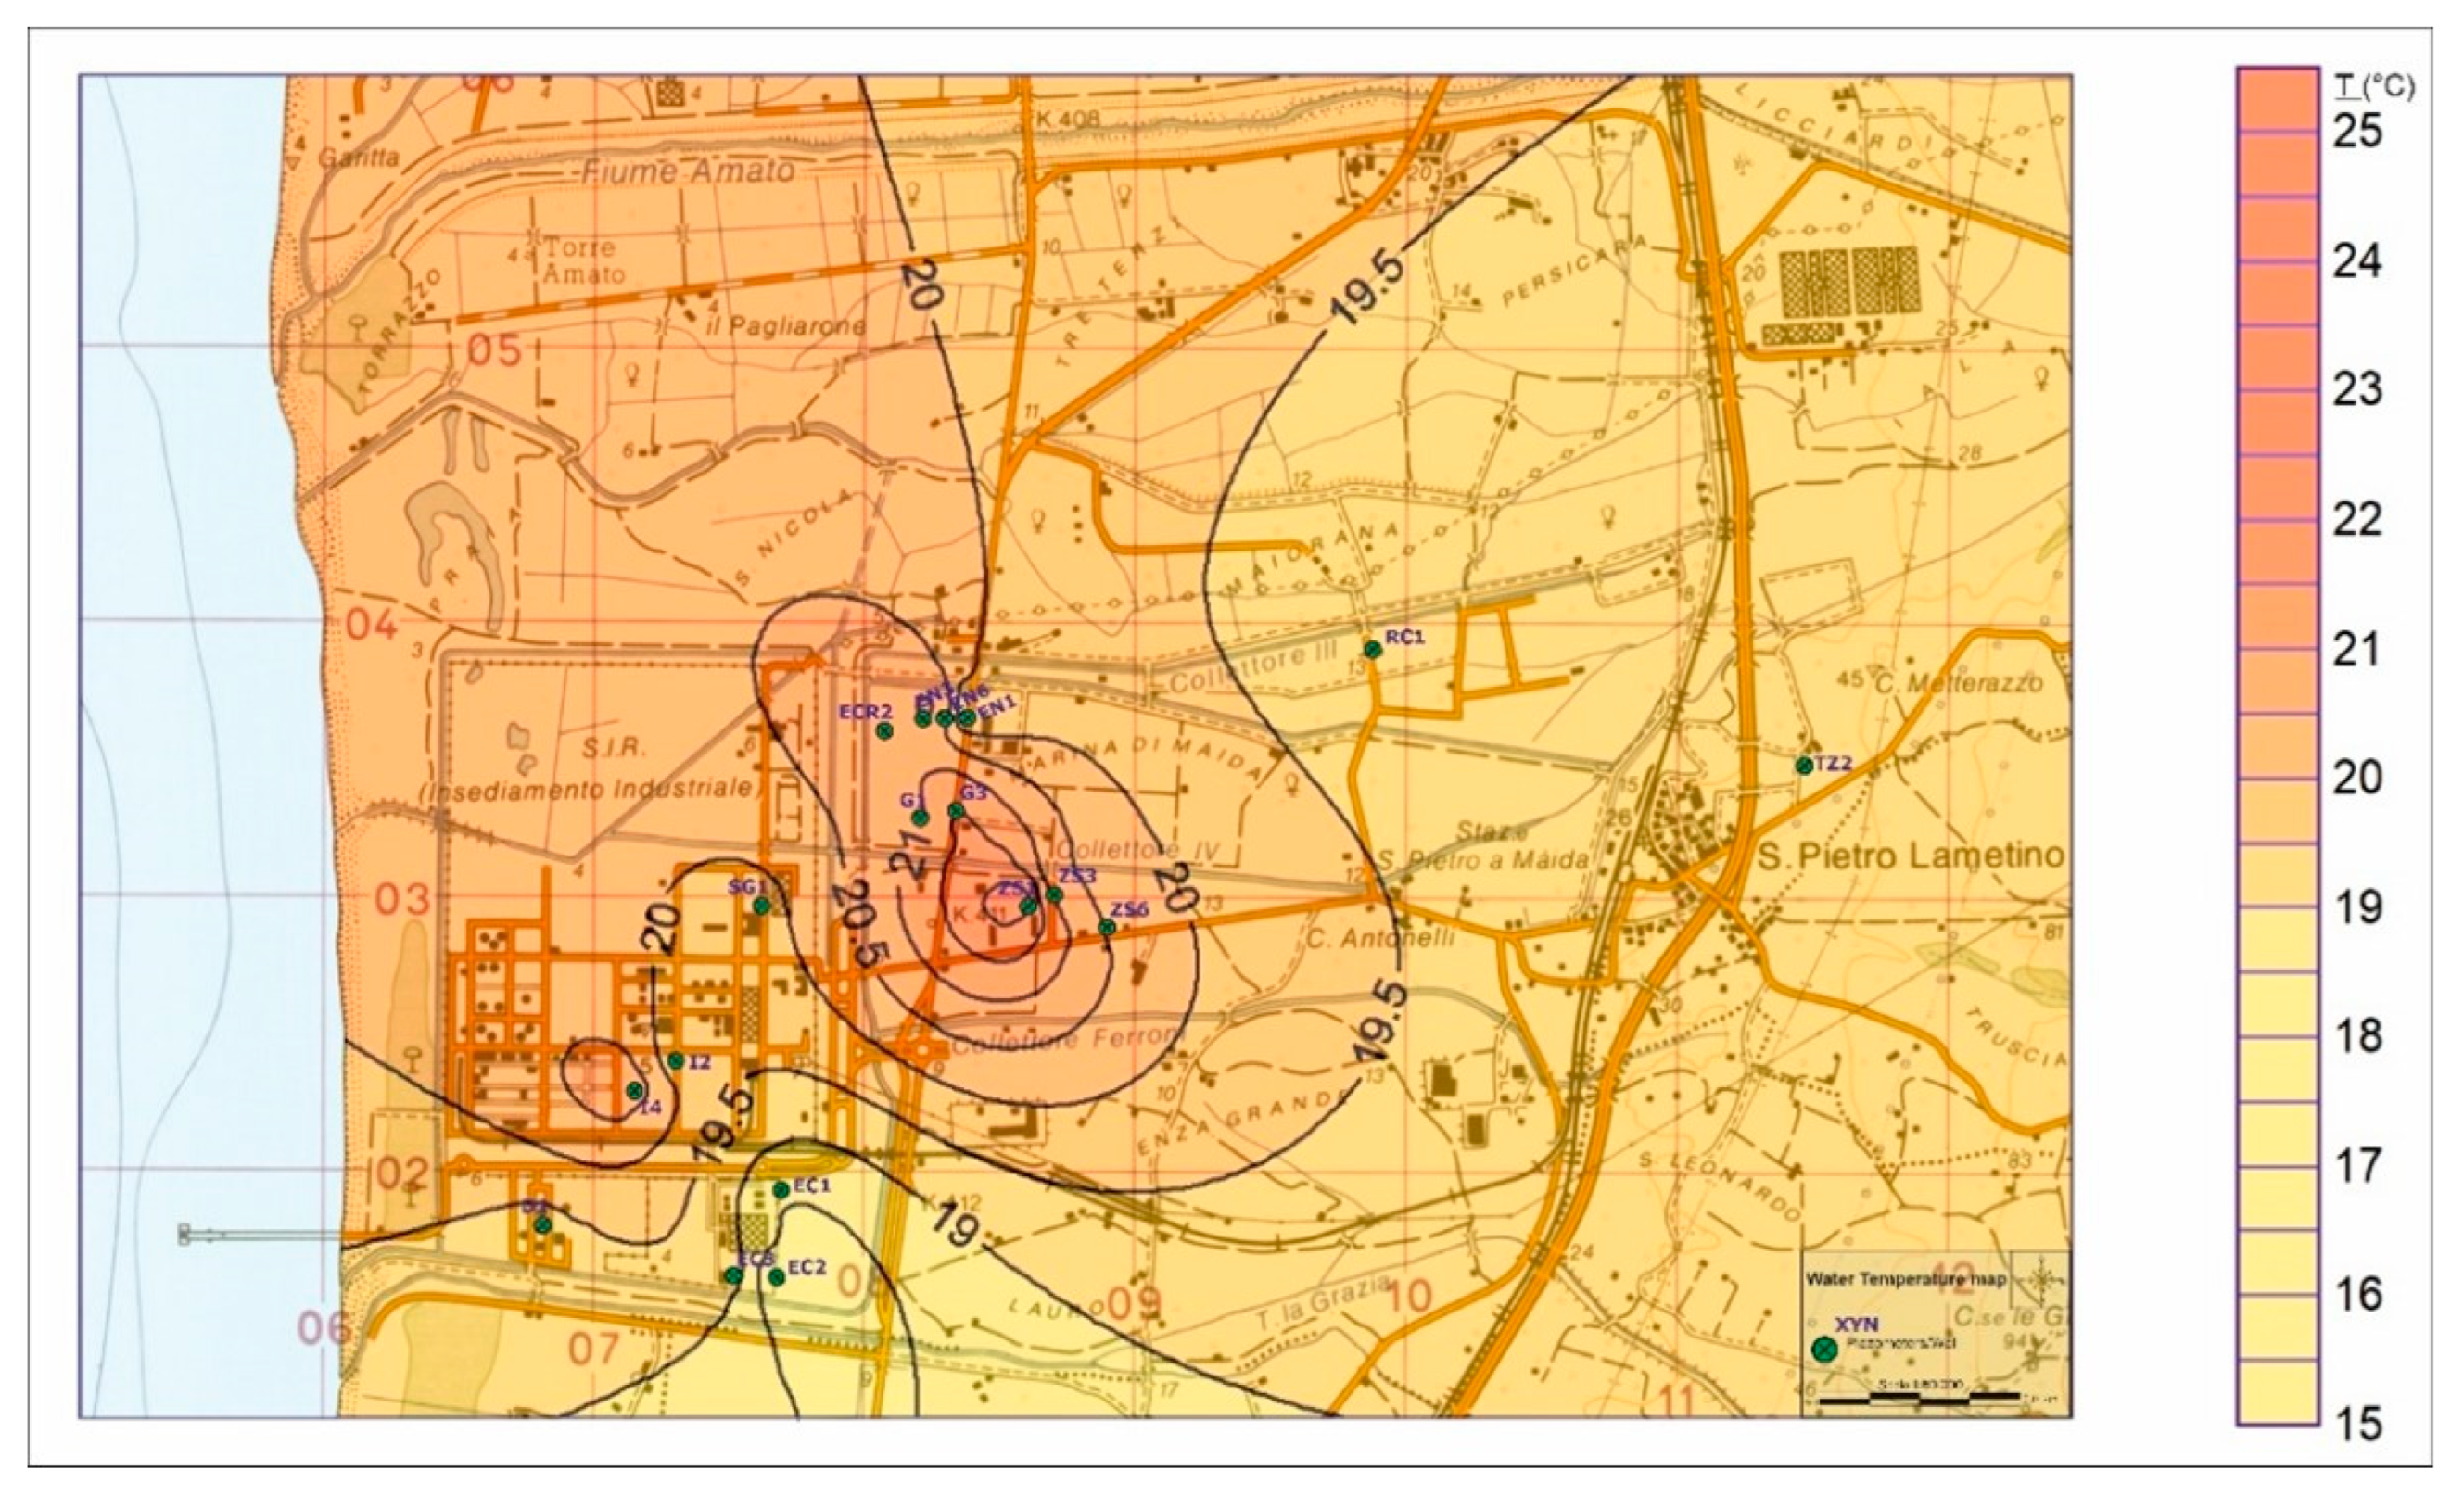
From the temperature map (Figure 10), a progressive increase in temperature can be observed from the inland sectors towards the coast.
3.1.4. Radiometric Analyses
Uranium behaves differently depending on the amount of oxygen present in the different sectors of the aquifer (reducing/oxidizing). In reducing environments, this radioisotope changes its oxidation state from +6 to +4, forming water-insoluble compounds precipitating in sediments or rocks. [4]. Instead, the concentration of radon activity is higher in the sectors of greater mobility in the aquifer [4]. Therefore, the study of this radionuclide and of the isotope ratio (234U/238U) allows for important information on the hydrodynamics of the aquifer to be obtained. The first radiometric indicator used was the concentration of volumetric activity of radon in water. Considering the influence of hydrogeological and climatic factors on the radon activity concentration in groundwater samples on a local scale [20], the distribution of radon activity concentration was estimated using the average value of measurements repeated for every piezometer due to the oscillations of the groundwater. Moreover, since radon is soluble in water and follows Ostwald’s law [5] (Figure 2), the radiometric measurements were corrected by measuring the temperature of the analyzed samples (Table 4).
Figure 11 shows the average concentration of volumetric radon activity detected in the monitored piezometers.
The parameter progressively decreases from the internal areas (PZT2) towards the coast (PZSG1). Subsequently, the uranium (234U/238U) isotope ratios were calculated, as reported in Table 5, where the average values of at least three measurements, performed on as many aliquots of the same sample, are indicated.
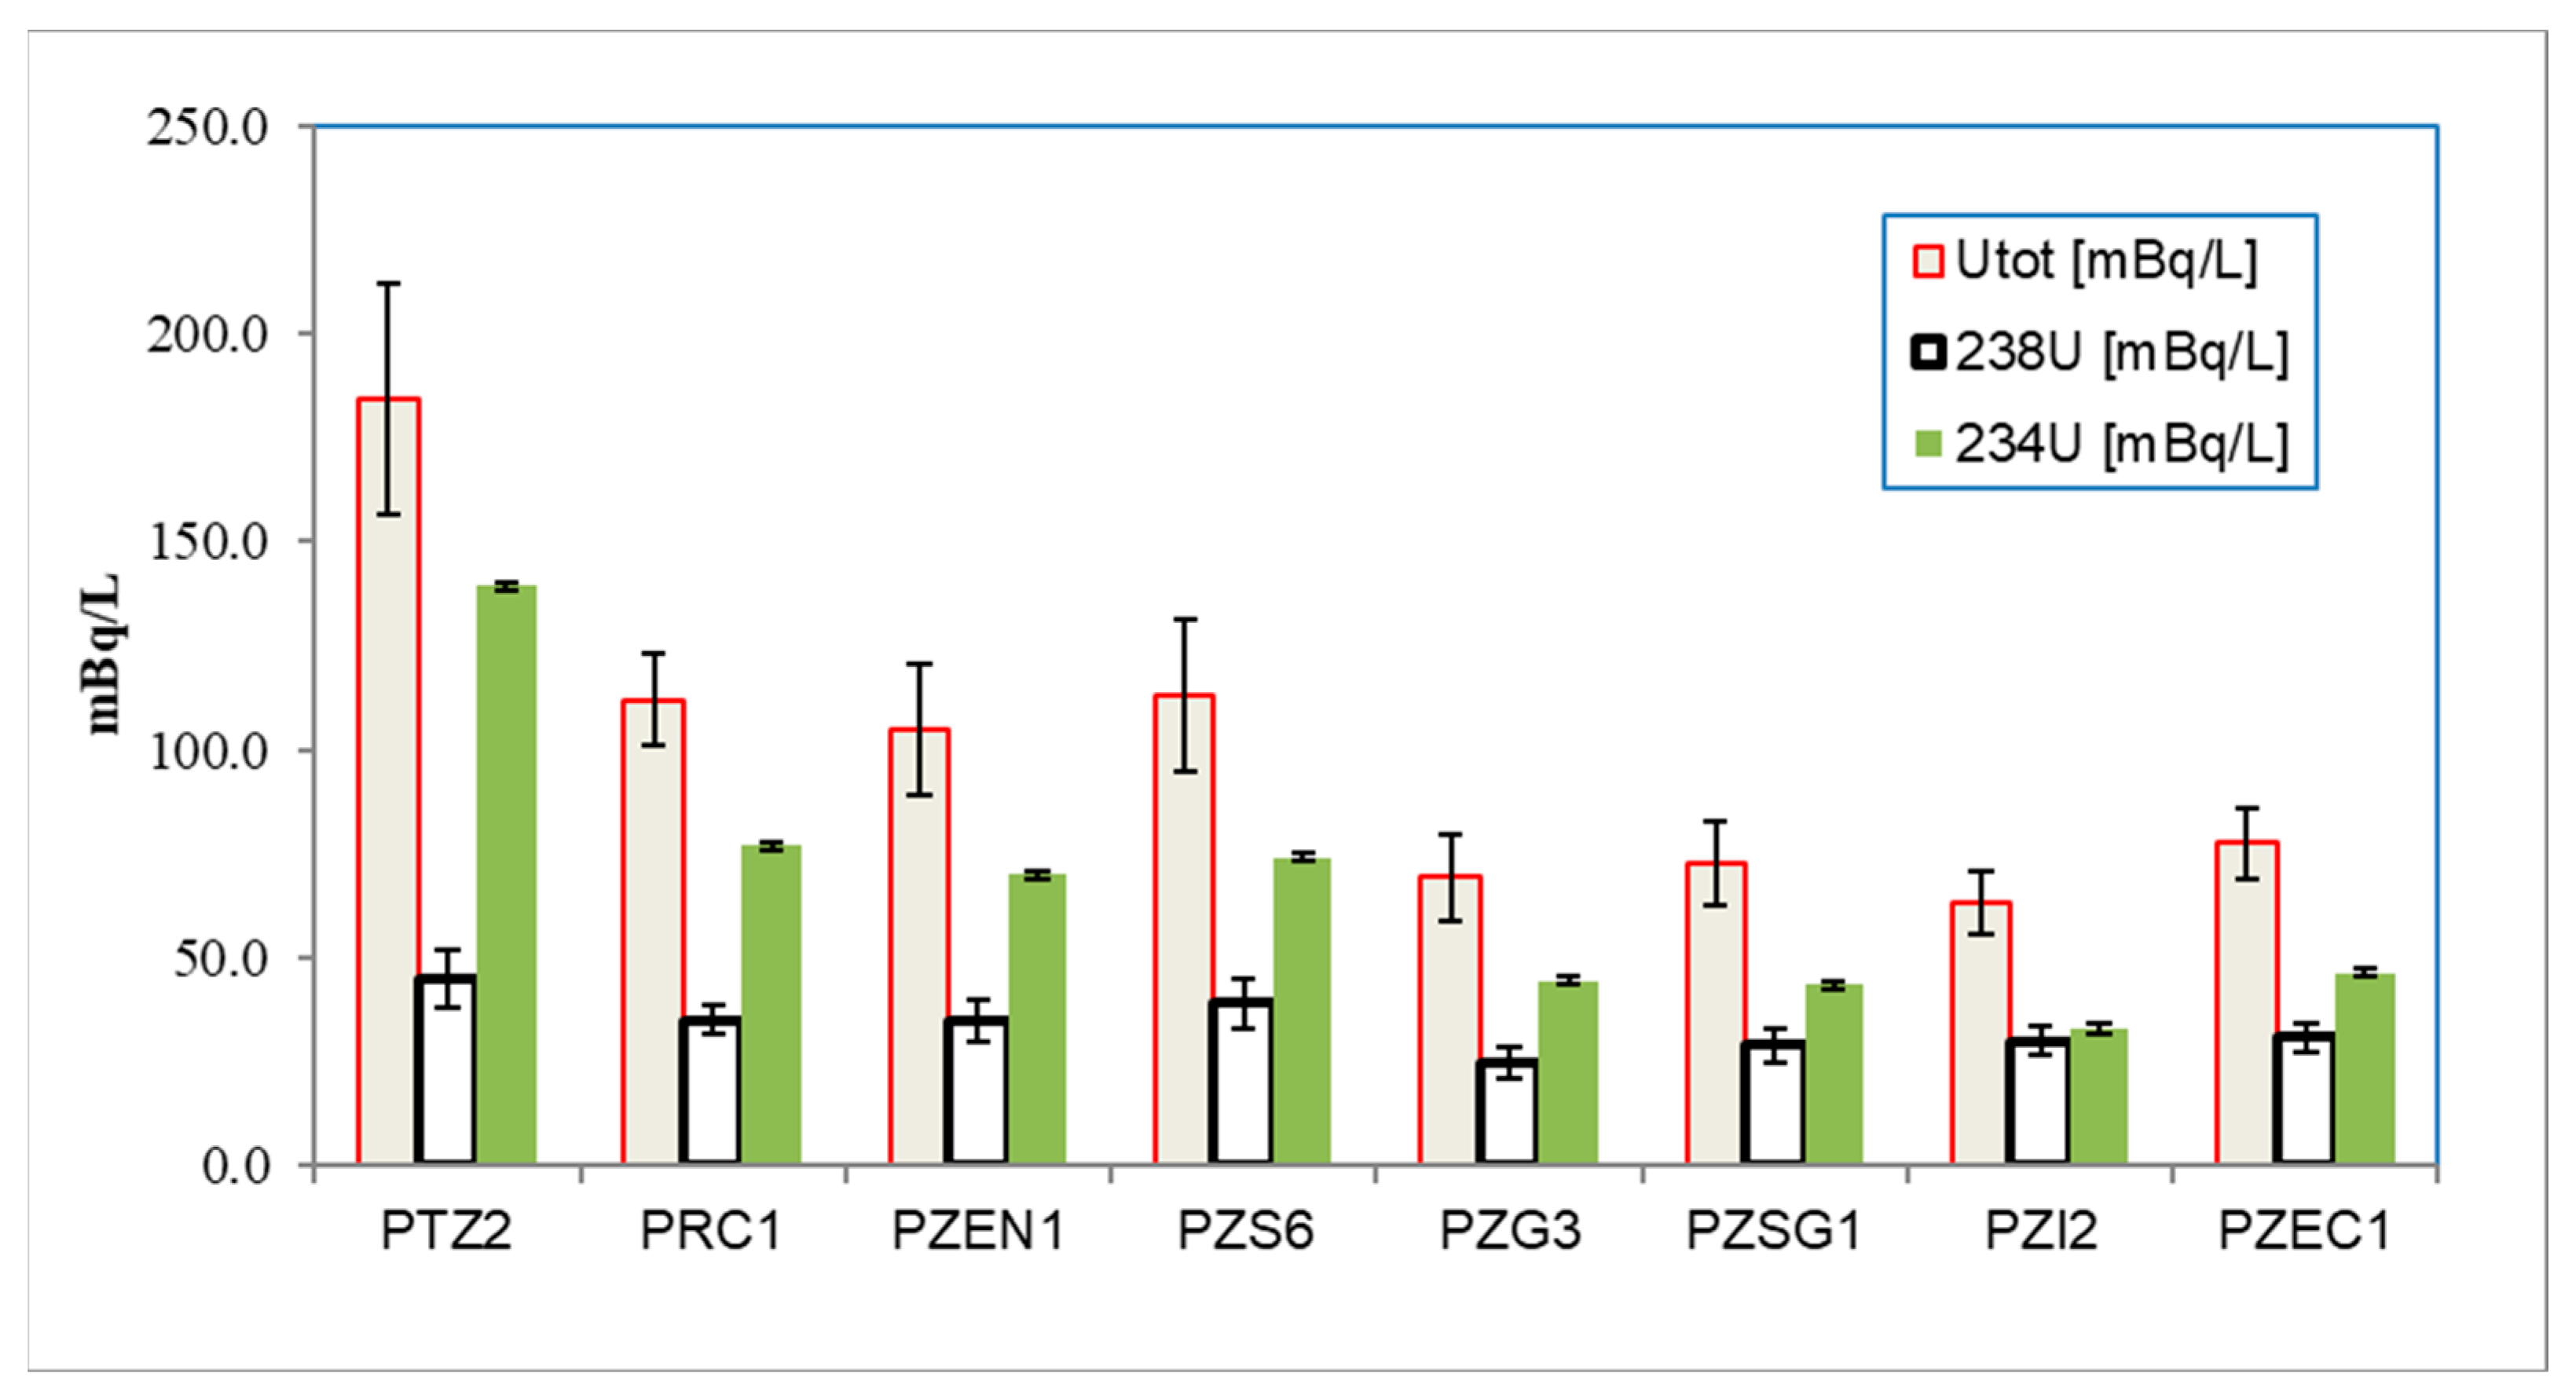
The uranium isotope ratios were related to the total uranium concentration in Figure 12, where a decreasing concentration gradient can be found, similar to that observed for the radon volumetric activity (Figure 12).
Regarding Figure 11 and Figure 12, it is clarified that the data reported in the study are the result of instrumental chains available at “Ettore Maiorana” Arpacal laboratory, which is accredited according to UNI CEI EN ISO/IEC 17025 and specific standards for physical tests.
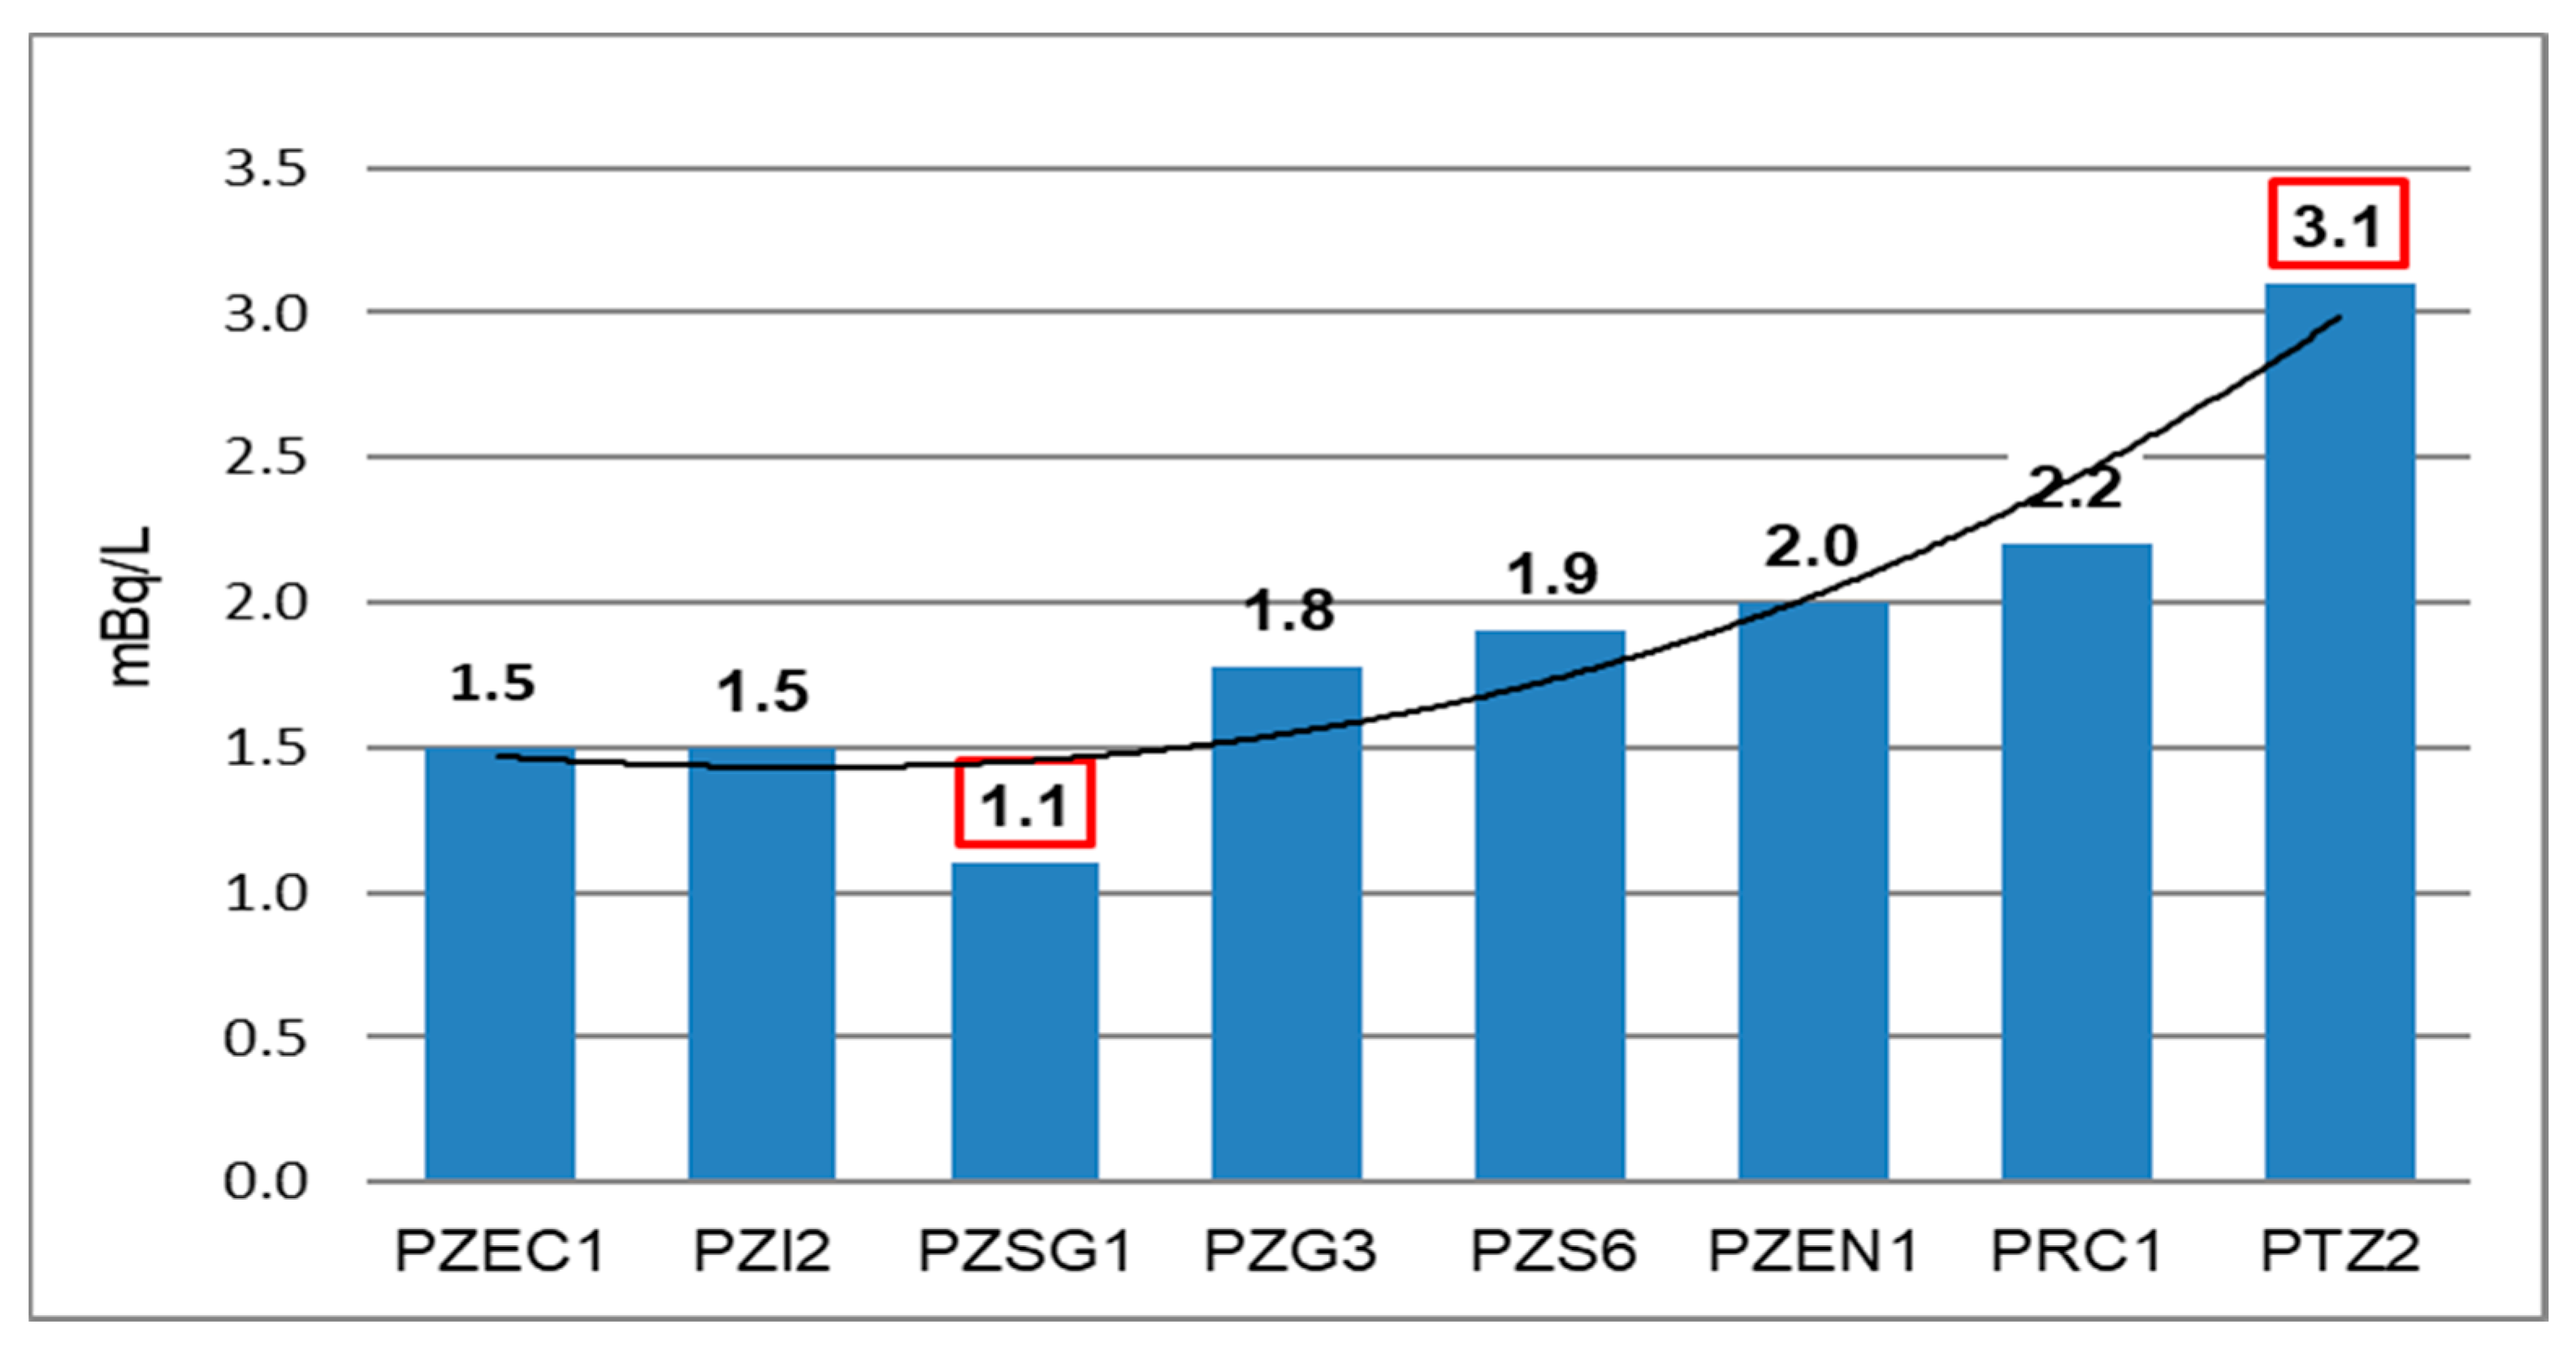
The trend found in the last two graphs is confirmed by the following figure (Figure 13), which provides a graph of the uranium (234U/238U) isotope ratios.
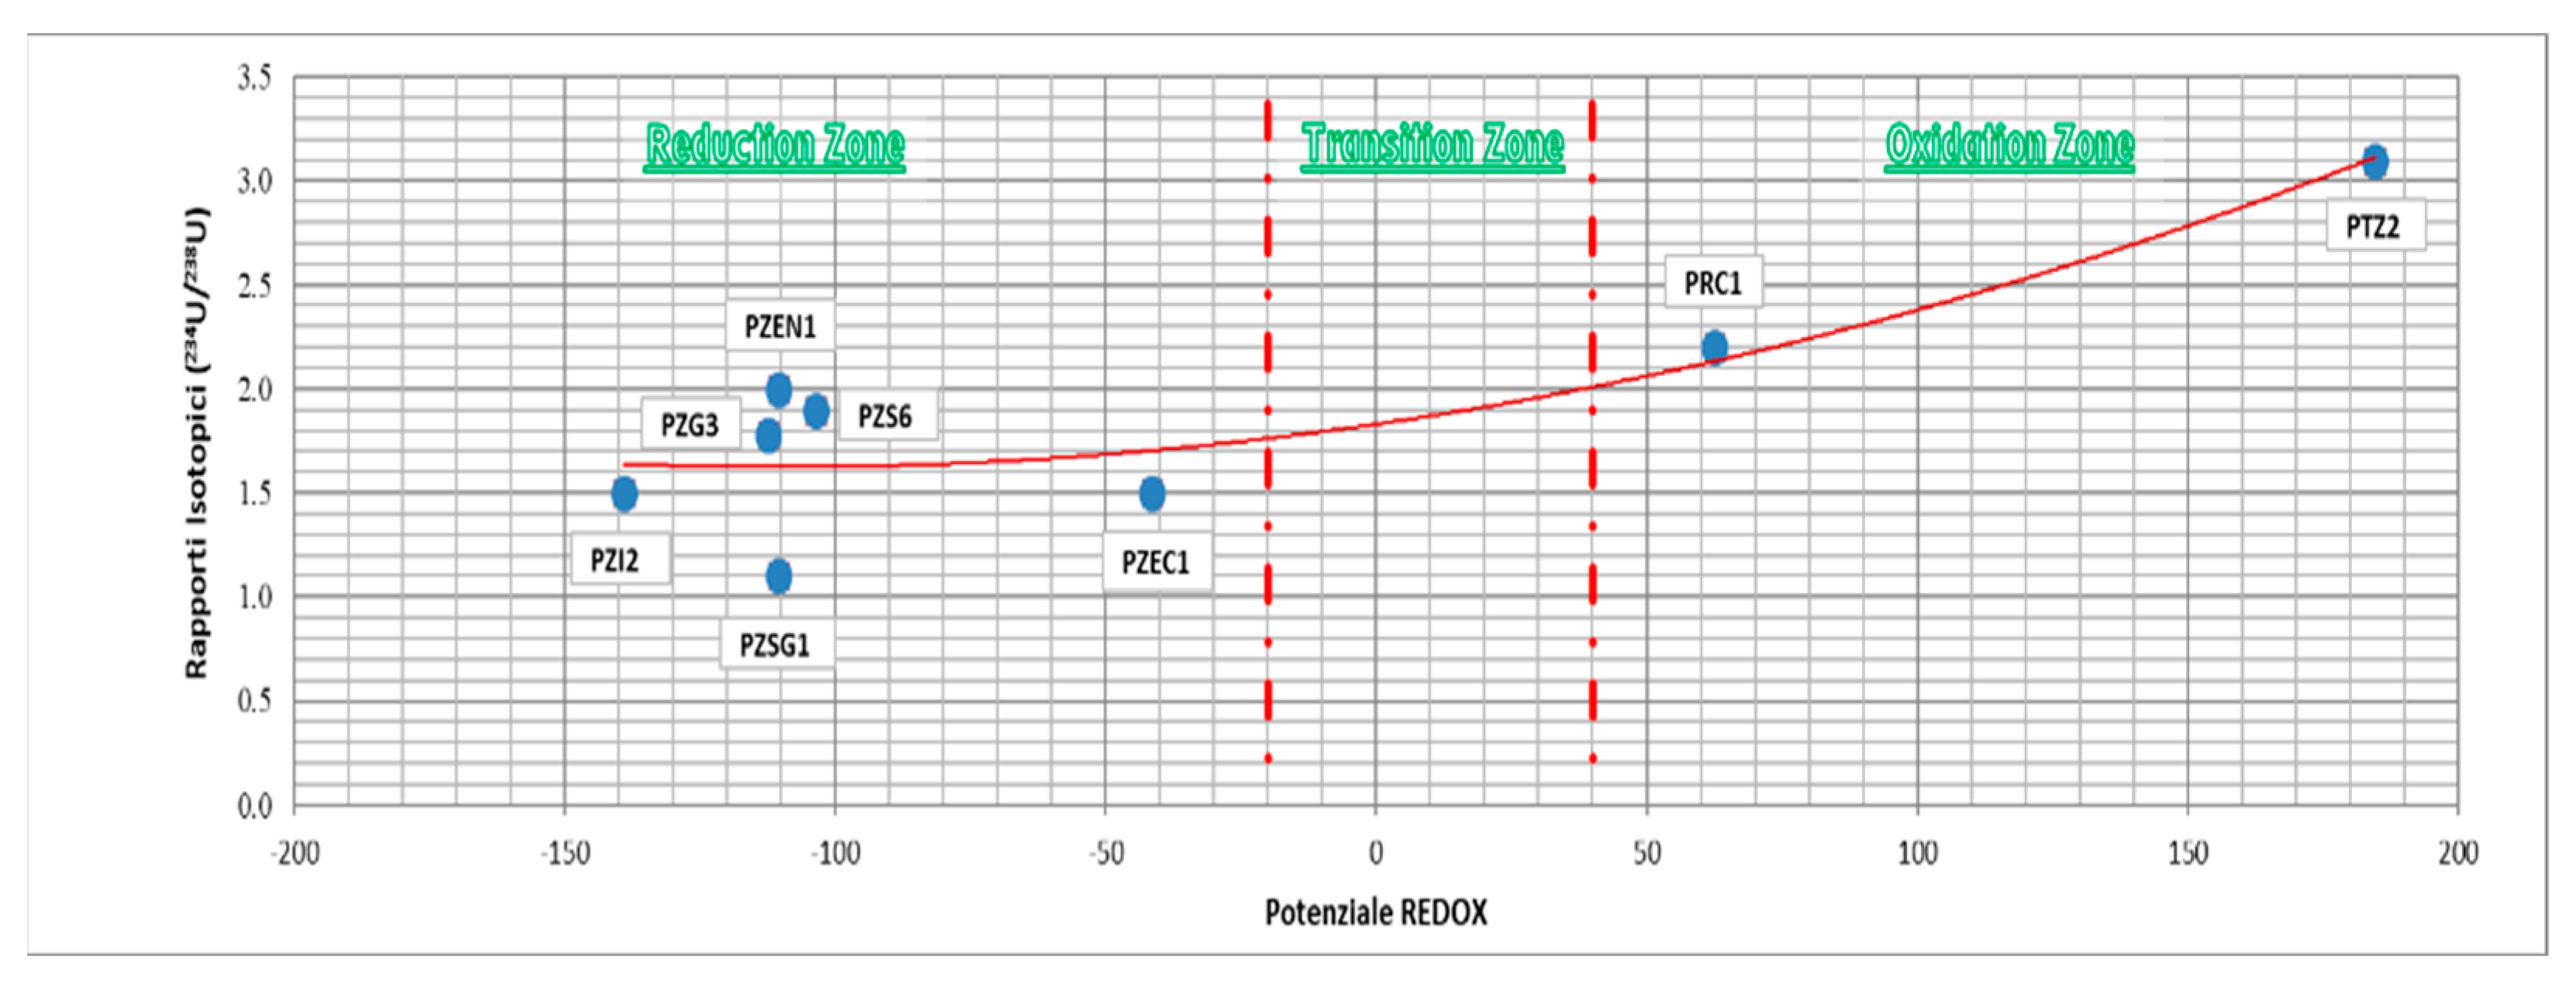
Finally, the uranium isotope ratios and the redox potential measured in the monitoring piezometers were mutually related (Figure 14).
The last graph highlights the presence of oxidizing and reducing zones within the aquifer underlying the study area. In particular, the higher uranium isotope ratios persist in the oxidizing stratum sector, while the lower values fall into the reducing zone.
Regarding Figure 13 and Figure 14, the data-related uncertainties are expanded uncertainties, with a coverage factor of k = 2, determined by the metrological criteria, which estimates the uncertainty of the variables constituting the measurand according to a Gaussian distribution. As for the development of the theoretical distributions for the approximation of the experimental data, in addition to the use of correlation coefficients, statistical significance was assessed by means of residue analysis. For such reasons, the theoretical distribution is able to describe the phenomenon.
4. Discussion
The indicators described above and depicted in the proposed maps were used to define a local hydrogeological model of the study area, the results of which are discussed below. This piezometric morphology suggests, on a study scale, the following model of underground water circulation (Figure 6):
- -
- A recharging area, located in the innermost zones of the northern sector where the rivers feed the shallow aquifer, with reduced hydraulic paths, high differences in levels, low transmissivity and hydraulic conductivity.
- -
- A draining area in the coastal strip of the study area where the shallow aquifer feeds the rivers characterized by greater hydraulic paths and low gradients, high transmissivity and hydraulic conductivity.
- -
- A transition area located between the previous two where the characters described progressively vary from East to West while passing from one zone to another.
Overall, the flow directions are oriented towards the sea. In particular, in the study area, three preferential drainage axes are visible (Figure 6): in the northern sector, along the collector III, in the southern sector, close to the coast, with a NW–SE vergence which likely corresponds to the paleo riverbed of the Turrina torrent, and in the central sector located between those mentioned above. Furthermore, from Figure 6 and Figure 15, we note the effects of the pumping of a number of wells in an industrial area, which induces a local reversal in terms of flow lines with respect to the general trend described above.
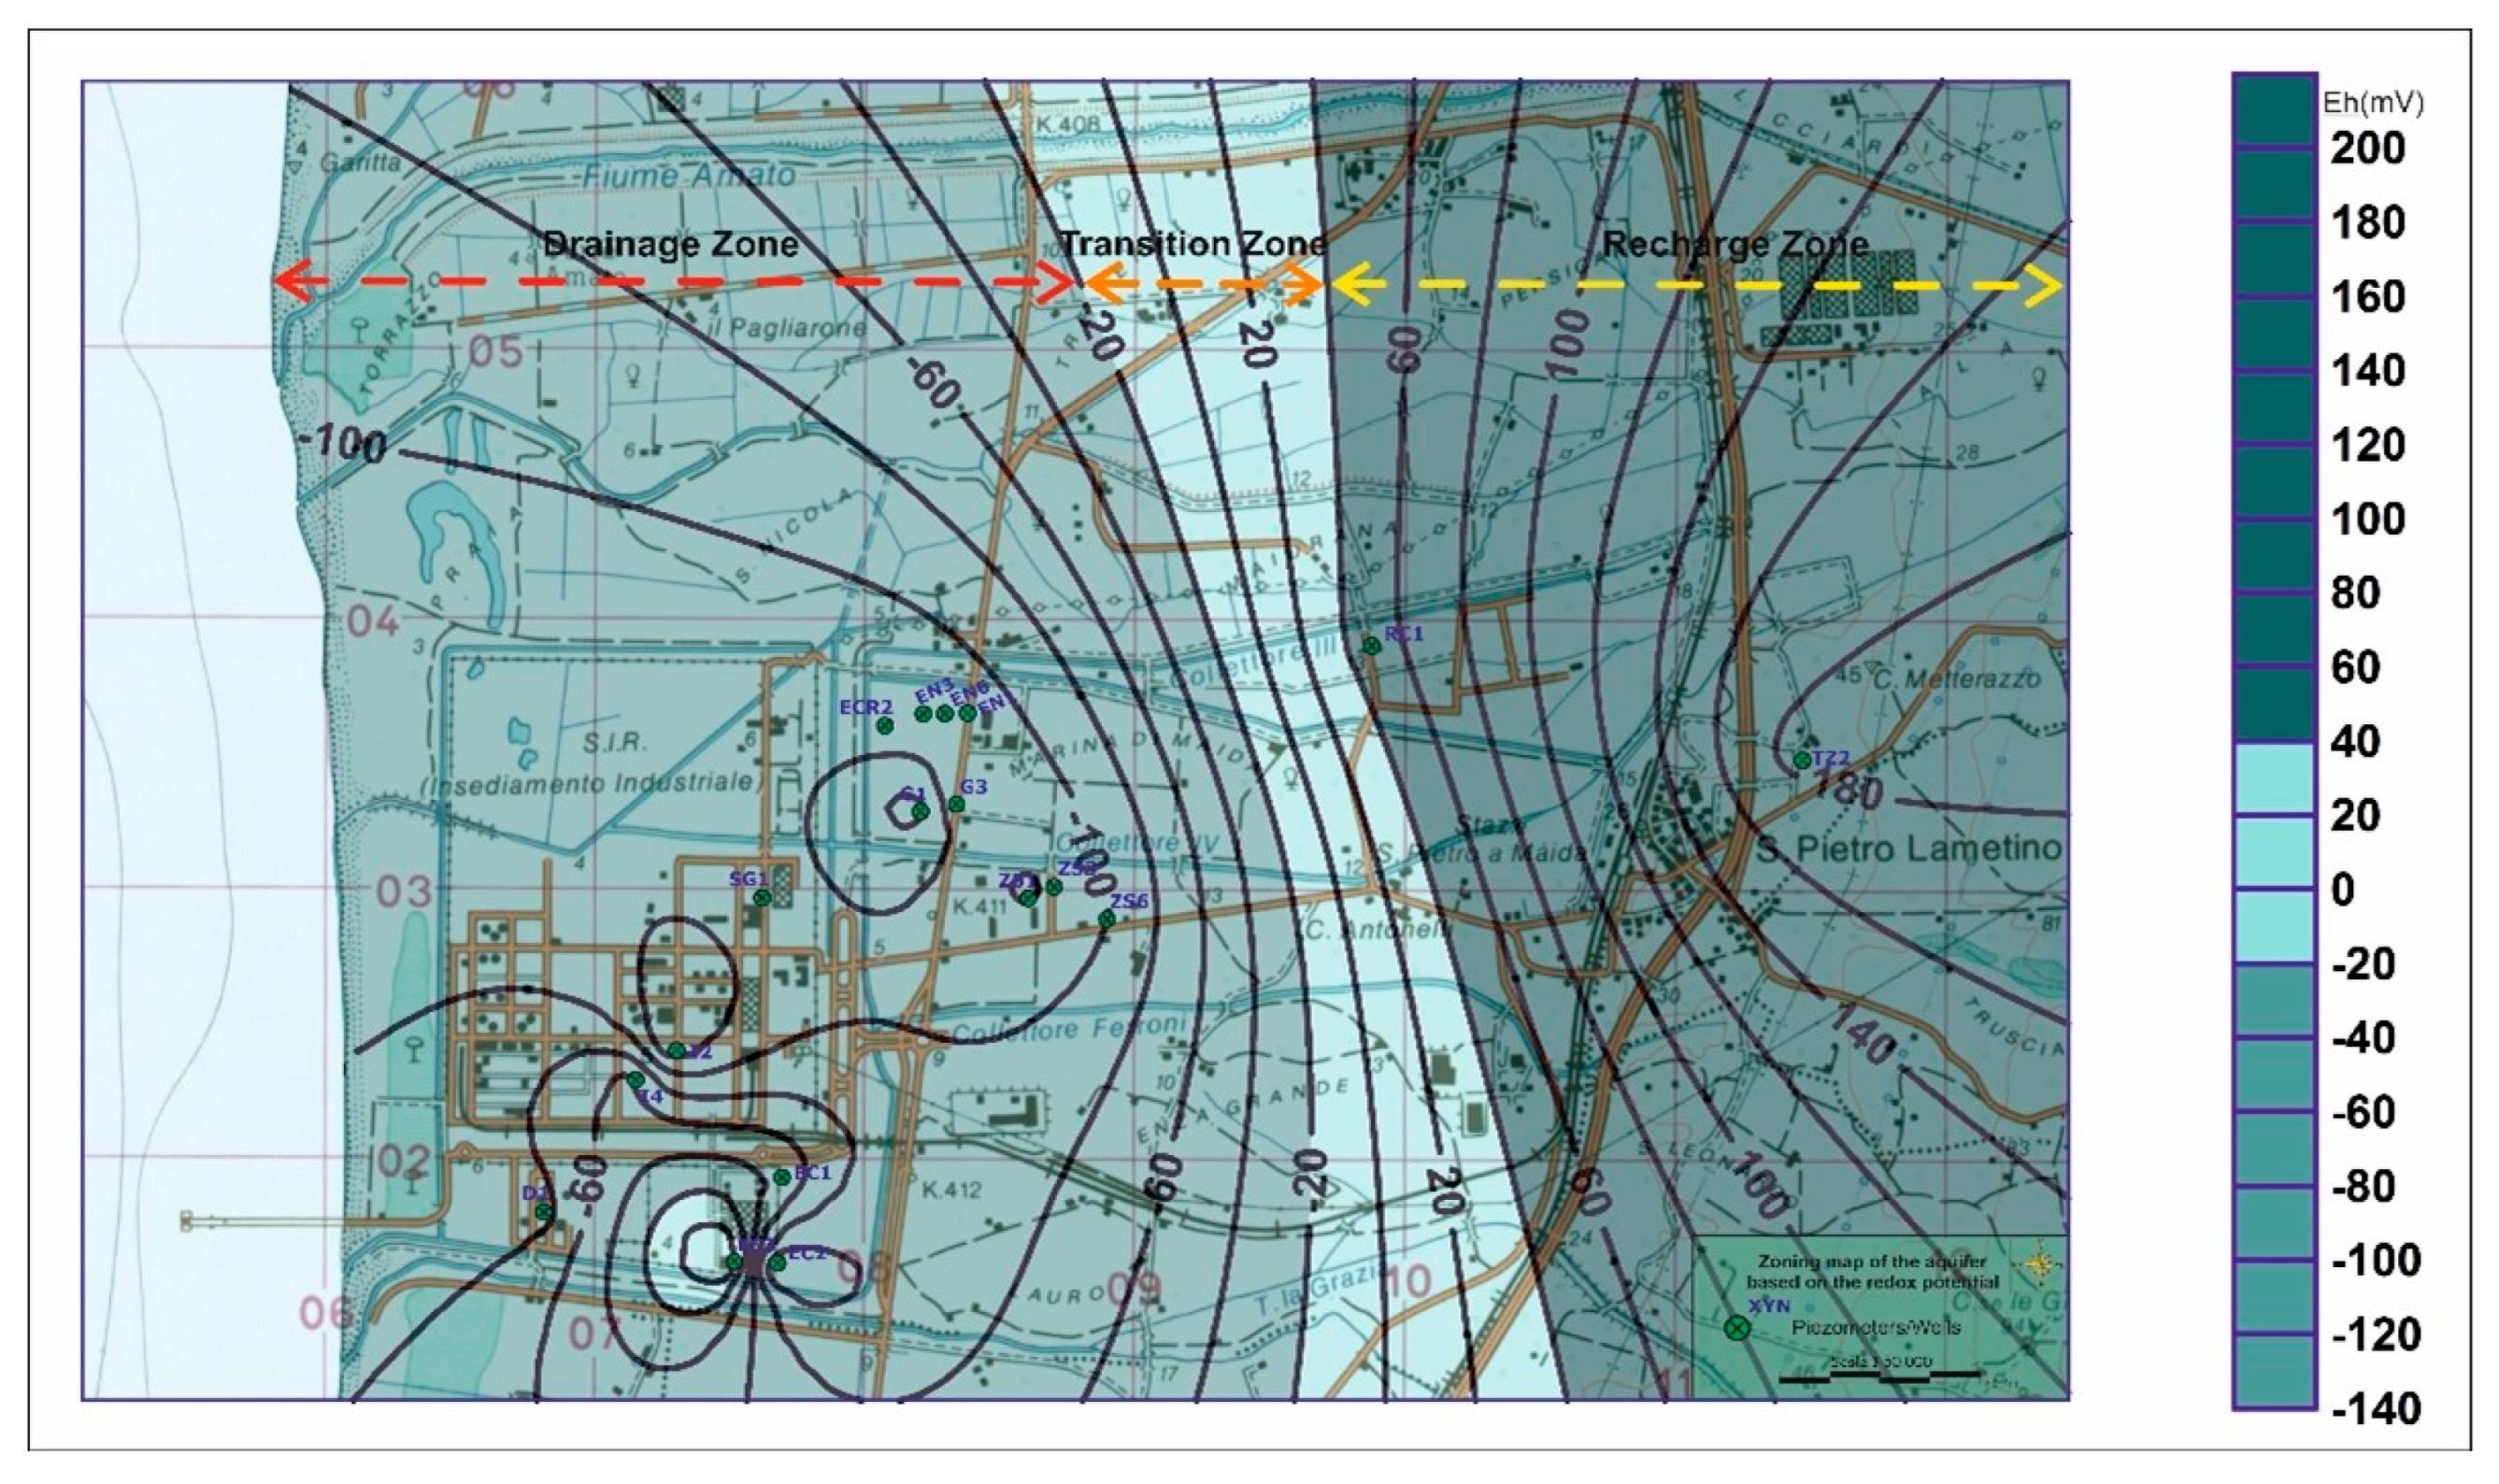
Finally, from the analysis of the Redox potential data, it was possible to return a zoning map of the groundwater (Figure 16).
This map shows more clearly the different sectors of the studied aquifer:
- -
- An innermost area, corresponding to the well (PZT2), where positive values in terms of the redox potential show the presence of an oxygenated area.
- -
- An external area along the coast, roughly between the piezometer (PZS6) and the well (PZD1), characterized by negative redox potential values, indicating the presence of a poorly oxygenated area in reducing conditions.
- -
- A transition zone, whose boundaries cannot be clearly defined, which lies between the other two areas and is roughly located between the well (PZRC1) and the piezometer (PZS6), where a progressive transition in terms of the redox potential towards negative values is observed.
This trend is accordant with the groundwater circulation model derived from the piezometric morphology (Figure 15).
Moreover, from the available stratigraphies, the greatest presence of peat was observed within the area with the lowest O2 concentration and Eh value [6]. The graph in Figure 9 highlights that positive redox potential values correspond to higher dissolved oxygen concentrations, while negative redox potential values generally correspond to lower O2 concentrations in the study area. The exceptions to this general trend are the values found in piezometers PZSG1 and PZI2. These anomalies should be investigated further; however, it can be assumed from a first evaluation that these differences are related to the hydrogeological structure of the area.
In particular, for the PZSG1 well, the values can be attributed to continuous pumping, which creates a turbulent motion around the sampling point and therefore greater water oxygenation. The PZI2 piezometer could instead be affected byits proximity to the paleo riverbed of the Turrina torrent, representing a preferential drainage axis with reduced transit times and therefore more oxygenated waters.
A comparison of the Eh isodistribution and O2 isoconcentration maps revealed the presence of:
- -
- An internal area, where high redox potential (Eh) and dissolved oxygen (O2) values indicate the presence of an oxygenated area.
- -
- An external area along the coast characterized by low Eh and O2 values, which indicate the presence of a poorly oxygenated area in reducing conditions.
- -
- A transition zone, whose boundaries cannot be clearly defined, which lies between the first two, where the progressive passage of the redox potential towards negative values corresponds to the decrease in the concentrations of dissolved oxygen.
The identification of aquifer sectors, based on the comparison of the Eh isodistribution and O2 isoconcentration maps, is in agreement with the underground water circulation model previously deduced from the piezometric morphology (Figure 6 and Figure 15) and the aquifer zoning map (Figure 16) derived from aquifer redox potential measurements. The groundwater temperature is a function of different elements and, even under the same conditions, varies according to groundwater mobility. Therefore, it increases due to the length of the hydraulic path, the period that the water is resident in the aquifer and its time in contact with lithotypes. Therefore, this parameter was also used as a natural tracer of the hydrodynamic characteristics of the aquifer, as it highlights areas with more active circulation. From the temperature map (Figure 10), a progressive increase in temperature can be observed from the inland sectors towards the coast. In particular, the innermost areas are characterized by lower temperatures compared to the other sectors of the aquifer under study. These features are common in the groundwater recharge areas. Indeed, in rainy months, rainwater crossing the recharge areas is colder and more oxygenated but also more mobile, with it following short hydraulic paths and travelling for short periods of time due to the high hydraulic gradients that characterize these areas. Approaching the coast, the temperature gradients increase, and waters, after passing through the previous area, become less cold due to their contact with crossed lithotypes. This phenomenon is particularly evident in the medium-low sector of the plain. All the characteristics described above are common in the drainage areas of the aquifer, which receive less oxygenated and slower waters, as they pass through these sectors according to higher hydraulic paths and longer times of travel determined by low hydraulic gradients. For these reasons, waters in the sectors mentioned above are also warmer, since they remain in contact with the casing lithotypes for longer. Thus, the distribution of temperatures also reflects the groundwater circulation pattern outlined above based on the other indicators previously analyzed. Indeed, the temperature trends highlight an internal area with reduced hydraulic paths and a high gradient [i]. These peculiarities induce an improved mobility and thus low contact times in colder and oxygenated rainwaters, with the lithotypes constituting the aquifer in this sector. However, towards the coast, greater hydraulic paths and low gradients make waters travel slower and therefore lengthen the time they are in contact with the lithotypes constituting the aquifer in these areas. This phenomenon is more evident in the medium-low sector of the plain, where the temperatures are the highest found (Figure 10) and the piezometric map (Figure 6) indicates a greater distance between the hydroisoipse, reflecting a longer hydraulic path and a lower gradient compared to the surrounding areas. Furthermore, according to the temperature map (Figure 10), temperatures progressively increase towards the coast along the flow guidelines identified by the piezometric map (Figure 6). This phenomenon indicates that colder and more oxygenated rainwater, coming from the innermost sectors that correspond to recharge areas, flows along these guidelines. Approaching the coast, along the same flow guidelines, the [T] values increase in the drainage area, since the waters reaching this sector of the aquifer become slower and reside longer in the area as the temperature increases. In particular, the highest temperatures can be observed in the medium-low range of the study area, corresponding to the drainage area in the piezometric map, which is characterized by low gradients and greater hydraulic paths, with a slower aquifer therefore receiving a minor intake of colder and more oxygenated rainwater. Instead, with regards to the radiometric parameters used (concentration of volumetric activity of radon in water and isotope ratio of uranium), these represent two reliable indicators, since the radioactive disintegration of natural elements with a long half-life [21,22] ensured they are correlated with the other aquifer indicators used, such as Eh, T and O2. By analyzing Table 4 and its relative graph in Figure 11, we observe a gradient in terms of the radon activity concentration from PZT2 to PZSG1, that identifies, in some contexts, such as the one in question, sectors of greater mobility in the aquifer. Therefore, according to the hypotheses explained in the introduction, the information obtained from the available radiometric data confirms the existence of oxidizing and reducing zones within the portion of the aquifer studied. From a radiometric point of view, the isotope of uranium with mass 234 is much more mobile than, and tends to exceed, the less mobile uranium 238. These reactions are facilitated under pH conditions between 5 and 6. In fact, more acidic solutions allow for the migration of uranium atoms regardless of the oxidation number of the uranium compound [21]. Therefore, the radiometric data available, when analyzed and organized into graphs and tables and compared with the other indicators detected, confirm the existence of oxidizing and reducing zones in the aquifer which correspond to the sectors of major and minor mobility in terms of the groundwater detectable in the maps, which are representative of hydrogeological surveys and parametric measurements taken in the field (Figure 6, Figure 7, Figure 8, Figure 10 and Figure 15).
5. Conclusions
The proposed method was tested in Calabria in the southern sector of the shallow aquifer of the Sant’Eufemia Lamezia plain (Calabria, Southern Italy), where the proposed integrated approach provided interesting information for the definition of the hydrogeological model of the study area. The use of the natural tracers identified (radiometric parameters, redox potential, dissolved oxygen concentration, groundwater temperature) allowed the indications of the hydrogeological survey to be verified, and provided information for the identification of recharge and drainage areas in the aquifer and preferential directions in terms of groundwater flow in order to implement the hydrogeological model of the area. In particular, within the studied aquifer, the following were identified:
- -
- A more internal sector characterized by colder and more mobile, well-oxygenated waters, with a positive redox potential, high value in terms of the uranium isotope ratio and high concentrations in terms of radon volumetric activity, with denser and convex isopiezometric lines, showing high hydraulic gradients and low transmissivity, and flow lines oriented towards the coast. This sector corresponds to the groundwater recharge area since these characteristics are common to the recharge areas of alluvial aquifers.
- -
- A coastal sector characterized by: warmer and slower waters, which are poorly oxygenated with a negative redox potential, low values in terms of the uranium isotope ratio and a low concentration in terms of radon volumetric activity, distinguished by more sparse and concave isopiezometric lines, showing low hydraulic gradients and high transmissivity, with flowing lines towards the coast. This sector corresponds to the drainage areas of the aquifer, as these characteristics are common in the drainage areas of alluvial aquifers. Furthermore, in this sector, from the available stratigraphies, the presence of peat was observed, which, acting as redox driver, amplifies the reaction, making Eh values more negative. Finally, also in this sector, by crossing the hydrogeological and temperature survey data, the paleo riverbed of the Turrina torrent was identified, with a NW–SE vergence.
- -
- A central sector characterized by intermediate values lying between those found in the two previous sectors for all the tracers used.
In conclusion, the present study supports the validity of the proposed methodology, highlighting the utility of an integrated approach for the study of aquifers in all those cases where the rigorous evaluation of hydrogeochemical and hydrogeological data is difficult due to both the complex framework of the analyzed processes and the associated considerable analytical and detection costs.
In this context, the hydrogeological survey data, integrated with techniques based on the use of natural tracers and parametric field measurements, represent a valid support for the definition of the hydrogeological models of aquifers, especially for the identification of groundwater recharge and drainage areas and preferential flow directions, not only in the context of hydrodynamic studies of groundwater but also proper territorial planning and the prevention of pollution.
Author Contributions
Conceptualization, E.C.; methodology, E.C.; validation, E.C. and S.P.; formal analysis, S.P.; investigation, E.C. and S.P., survey: E.C.; resources, E.C. and S.P., data curation, E.C. and S.P.; mapping: E.C.; writing—original draft preparation, E.C.; writing—review and editing, E.C.; visualization, E.C.; project administration, E.C. and S.P. All authors have read and agreed to the published version of the manuscript.
Funding
This research received no external funding except for the collection of baseline data derived from a previous study [6] funded by Regione Calabria.
Institutional Review Board Statement
Not applicable.
Informed Consent Statement
Not applicable.
Data Availability Statement
Not applicable.
Conflicts of Interest
The authors declare no conflict of interest. The funders had no role in the design of the study; in the collection, analyses or interpretation of data; in the writing of the manuscript or in the decision to publish the results.
References
- Cuiuli, E. Quick analysis of the characteristic hydrogeological parameters of an aquifer, using empirical forumlas and the implementation of the clay substrate map: The case study of the shallow aquifer of the S. Eufemia Lamezia plain (Central Calabria, Italy). Acque Sotter. Ital. J. Groundw. 2018, 4/154, 61–71. [Google Scholar] [CrossRef]
- Di Sabatino, V.; Manetta, M.; Sciannamblo, D.; Spizzico, M.; Tallini, M. Radon as a spring water tracer aimed at the vulnerability of complex carbonate aquifers: The example of the Rio Arno spring group (Gran Sasso, central Italy). Gior. di Geol. Appl. 2005, 2, 413–419. [Google Scholar] [CrossRef]
- UNSCEAR—VV.AA. Sources and Effects of Ionising Radiation—Annex B; United Nations: New York, NY, USA, 1977; 727p. [Google Scholar]
- Mebus Geyl. Enviromental Isotopes in the Hydrogeological Cycle—Principles and Applications; UNESCO: Paris, France, 2000; Volume IV, 196p. [Google Scholar]
- IUPAC. Data Series: Krypton, Xenon and Radon Gas-Solubilities; Clever, H.L., Ed.; Pergamon Press: Oxford, UK, 1979; Volume 2, 35p, ISBN 9781483285481. [Google Scholar]
- Cuiuli, E.; Costabile, A.; Reillo, O.; Migliorino, C. Study of anomalous concentration values of pollutants found in groundwater of Lamezia Terme Industrial Zone—Final Report. 2019; Agreement between Environment department of Calabria region and Regional Agency for the Protection of the Environment of Calabria (Rep.Reg. 689/17). Internal Document—Unpublished. [Google Scholar]
- ISO Standard n. 13164-3; Water Quality—Radon-222—Part 3: Test Method Using Emanometry. ISO—International Organization for Standardization: Geneva, Switzerland, 2013.
- Method C1345-08; Standard Test Method for Analysis of Total and Isotopic Uranium and Total Thorium in Soils by Inductively Coupled Plasma-Mass Spectrometry. ASTM: West Conshohocken, PA, USA, 2008.
- Amodio Morelli, L.; Bonardi, G.; Colonna, V.; Dietrich, D.; Giunta, G.; Ippolito, F.; Liguori, V.; Lorenzoni, S.; Paglionico, A.; Perrone, V.; et al. The Calabrian-Peloritanian Arc in the Apennine-Magrebid orogen. Mem. Soc. Geol. It. 1976, 17, 1–60. [Google Scholar]
- Gullà, G.; Antronico, L.; Sorriso-Valvo, M.; Tansi, C. Methodological proposal for the evaluation of indicators of hazard and landslide risk at intermediate scales: The area of the Catanzaro Graben (Calabria—Italy). Geol. Rom. 2005, 38, 97–121. [Google Scholar]
- Cuiuli, E. Remarks on the hydrogeological setting of S. Eufemia Lamezia Plain through the developement of the top surface of the intermediate confined aquifer. Acq. Sott. It. J. Groundwat. 2015, 141/3, 45–52. [Google Scholar] [CrossRef] [Green Version]
- Mouton, J. Special Project 26—Organic Study of Water Resources in Calabria—Atlas of Piezometric and Water Quality Maps (sc.1:25,000); Cassa per il Mezzogiorno; Poligrafica: Ercolano, Italy, 1978; 180p. [Google Scholar]
- Sappa, G.; Bianchini, B. Hydrogeological characterization of the S. Eufemia Plain using thermocoductometric methods. Ing. Geol. Degli Aquiferi 1999, 13, 19–294. [Google Scholar]
- Cuiuli, E. Contribution to the knowledge of the hydrogeological characteristics of S. Eufemia Lamezia Plain (Calabria)—First Results. Acq. Sott. It. J. Grounwat. 2012, 127, 19–32. [Google Scholar]
- Cuiuli, E. The intrinsic vulnerability map of the surface aquifer of the S. Eufemia Lamezia Plain (Calabria). Acq. Sott. It. J. Grounwat. 2013, 132/2, 15–23. [Google Scholar] [CrossRef]
- Celico, P.; De Vita, P.; Monacelli, G.; Scalise, A.R.; Tranfaglia, G. Illustrative Notes of the Hydrogeological Map of Southern Italy. [sc. 1:250,000]; APAT—Univ. Fed. II Na; Istituto Poligrafico e Zecca dello Stato S.p.A.: Roma, Italy, 2007; 211p, ISBN 88-448-0215-5. [Google Scholar]
- Castany, G. Prospection et Espoitation des Eaux Souterraines; Dunot: Paris, Italy, 1968; 718p. [Google Scholar]
- Celico, P. Hydrogeological Prospecting; Liguori Editore: Naples, Italy, 1986; Volume 1, 735p, ISBN 88-207-1331-4. [Google Scholar]
- Rotiroti, M.; Bonomi, T.; Fumagalli, L.; Azzoni, A.; Pisaroni, B.; Demicheli, G. Methodological approach in the analysis of Arsenic, Iron and Manganese contamination phenomena in shallow aquifer, the case of the Cremona area. Eng. Hydro Environ. Geol. 2012, 15, 117–128. [Google Scholar] [CrossRef]
- Israelson, C.; Bjork, S.; Hawkesworth, C.J.; Noe Nygaard, N. Uranium-series isotopes from Eemian lake deposits, Hollemp, Denmark. Bull. Geol. Soc. Den. 1998, 44, 173–179. [Google Scholar] [CrossRef]
- UNSCEAR—VV.AA. Sources and Effects of Ionising Radiation, Volume I—Sources—Annex E; United Nations: New York, NY, USA, 2000; 659p, ISBN 92-1-142238-8. [Google Scholar]
- Maringo, R.; Torretta, M. Stochastic modeling of radon gas distribution in the unsaturated as a function of groudwater depth. In Proceedings of the XXXVI Convegno Nazionale di Radioprotezione (AIRP), Palermo, Italy, 18–20 September 2013; ISBN 978-88-88648-38-5. [Google Scholar]
Figure 1.
Variation in Uranium Concentration and 234U/238U Isotope Ratio in the Oxidation, Transition and Reduction Zones of an Aquifer [4] (Redrawn).
Figure 1.
Variation in Uranium Concentration and 234U/238U Isotope Ratio in the Oxidation, Transition and Reduction Zones of an Aquifer [4] (Redrawn).

Figure 2.
Ostwald’s Coefficient as a Function of Temperature [5] (Redrawn).
Figure 2.
Ostwald’s Coefficient as a Function of Temperature [5] (Redrawn).

Figure 3.
Structural Lithological Map of the S. E. Lamezia Plain (Modified) [11].
Figure 3.
Structural Lithological Map of the S. E. Lamezia Plain (Modified) [11].

Figure 4.
Schematic Hydrogeological Section of the S. E. Lamezia Plain Aquifer (Modified) [11].
Figure 4.
Schematic Hydrogeological Section of the S. E. Lamezia Plain Aquifer (Modified) [11].

Figure 5.
Piezometric Map of the Surface Aquifer of the S. E. Lamezia Plain (Modified) [14].
Figure 5.
Piezometric Map of the Surface Aquifer of the S. E. Lamezia Plain (Modified) [14].

Figure 6.
Isopiezometric Map of the Study Area, with the Locations of Monitoring Points (Modified) [6].
Figure 6.
Isopiezometric Map of the Study Area, with the Locations of Monitoring Points (Modified) [6].

Figure 7.
Isodistribution Map of Redox Potential (Median Values) (Modified) [6].
Figure 7.
Isodistribution Map of Redox Potential (Median Values) (Modified) [6].

Figure 8.
Isodistribution Map of Dissolved Oxygen (Median Values) (Modified) [6].
Figure 8.
Isodistribution Map of Dissolved Oxygen (Median Values) (Modified) [6].

Figure 9.
Graph of the O2 Concentration–Redox Potential in the Monitoring Points (Median Values) [6].
Figure 9.
Graph of the O2 Concentration–Redox Potential in the Monitoring Points (Median Values) [6].

Figure 10.
Water Temperature Map in Monitoring Points (Median Values) (Data from [6]).
Figure 10.
Water Temperature Map in Monitoring Points (Median Values) (Data from [6]).

Figure 11.
Graph of Radon Volumetric Activity Concentration in Monitored Piezometers (Median Values) [6].
Figure 11.
Graph of Radon Volumetric Activity Concentration in Monitored Piezometers (Median Values) [6].

Figure 12.
Graph of Total and Isotopic Uranium Concentration in Monitored Piezometers (Median Values) [6].
Figure 12.
Graph of Total and Isotopic Uranium Concentration in Monitored Piezometers (Median Values) [6].

Figure 13.
Graph of Uranium Isotope Ratios (234U/238U) in Monitored Piezometers (Median Values) [6].
Figure 13.
Graph of Uranium Isotope Ratios (234U/238U) in Monitored Piezometers (Median Values) [6].

Figure 14.
Graph of Uranium–Potential Redox Isotope Ratios in Monitored Piezometers (Median Values) [6].
Figure 14.
Graph of Uranium–Potential Redox Isotope Ratios in Monitored Piezometers (Median Values) [6].

Figure 15.
Groundwater Circulation Model Derived from the Piezometric Morphology (Modified From [6]).
Figure 15.
Groundwater Circulation Model Derived from the Piezometric Morphology (Modified From [6]).

Figure 16.
Aquifer Zoning Map Derived from Redox Potential Measured at Monitoring Points (Median Values) (Modified from [6]).
Figure 16.
Aquifer Zoning Map Derived from Redox Potential Measured at Monitoring Points (Median Values) (Modified from [6]).


Table 1.
Radionuclides Concentrations in Rocks [3].
Table 1.
Radionuclides Concentrations in Rocks [3].
| Type of Rock | 238U [Bq kg −1] | 232 Th [Bq kg −1] | 40K [Bq kg −1] |
|---|---|---|---|
| Acidic Igneous Rocks | 59.2 | 81.4 | 999.0 |
| Middle Igneous Rocks | 22.9 | 32.6 | 703.0 |
| Mafic Igneous Rocks | 11.5 | 11.1 | 240.5 |
| Ultra-Basic Igneous Rocks | 0.4 | 24.4 | 148.0 |
| Limestones | 27.7 | 6.7 | 88.8 |
| Carbonatic Rocks | 26.6 | 7.8 | - |
| Sandstones | 18.5 | 11.1 | 370.0 |
| Mudstones | 44.4 | 44.4 | 703.0 |
Table 2.
Redox Potential and Dissolved Oxygen—Median Values [6].
Table 2.
Redox Potential and Dissolved Oxygen—Median Values [6].
| Piezometer | Redox Potential (mV) * | Dissolved Oxygen (mg O2/L) ** |
|---|---|---|
| PZEC1 | −41.5 | 0.45 |
| PZEC2 | −118.5 | 0.45 |
| PZEC3 | 28 | 0.95 |
| PZD1 | −87.5 | 1.5 |
| PZRC1 | 62.5 | 0.45 |
| PZSG1 | −110.5 | 2.3 |
| PZEN6 | −110.0 | 0.45 |
| PZEN3 | −114.0 | 0.90 |
| PZEN1 | −110.5 | 0.95 |
| PZECR2 | −114.5 | 0.40 |
| PZG1 | −69.0 | 0.50 |
| PZG3 | −112.5 | 0.40 |
| PZS1 | −122.5 | 0.45 |
| PZS3 | −119.0 | 0.75 |
| PZS6 | −103.5 | 0.40 |
| PZI2 | −139.0 | 5.1 |
| PZI4 | -57.0 | 0.45 |
| PZTZ2 | 184.5 | 6.35 |
* The redox value has a relative uncertainty of 0.3% in the measurement range at a temperature of 20 °C. ** The oxygen concentration has a relative uncertainty of 0.5% in the measurement range at a temperature of 20 °C.
Table 3.
Temperature—Median Values [6] *.
Table 3.
Temperature—Median Values [6] *.
| Piezometer | Temperature (°C) |
|---|---|
| PZEC1 | 18.55 |
| PZEC2 | 18.15 |
| PZEC3 | 19.4 |
| PZD1 | 19.0 |
| PZRC1 | 19.25 |
| PZSG1 | 19.8 |
| PZEN6 | 21.35 |
| PZEN3 | 20.9 |
| PZEN1 | 19.4 |
| PZECR2 | 20.9 |
| PZG1 | 20.75 |
| PZG3 | 21.65 |
| PZS1 | 22.45 |
| PZS3 | 20.75 |
| PZS6 | 20.5 |
| PZI2 | 19.75 |
| PZI4 | 20.95 |
| PZTZ2 | 19.4 |
* The temperature value has a relative uncertainty of 0.3% in the measurement range at a temperature of 20 °C.
Table 4.
Concentration Values of Radon Volumetric Activity (Median Values) [6].
Table 4.
Concentration Values of Radon Volumetric Activity (Median Values) [6].
| Piezometer | Concentration [Bq/L] | Measurement Uncertainty | Seasonal Factor |
|---|---|---|---|
| PZSG1 | 2.0 | 1.0 | 0.85 |
| PZI2 | 3.5 | 0.4 | 0.86 |
| PZG3 | 7.0 | 0.8 | 0.83 |
| PZS6 | 7.6 | 0.93 | 0.88 |
| PRC1 | 11.6 | 3.5 | 0.87 |
| PZEC1 | 12.8 | 1.9 | 0.81 |
| PZEN1 | 36.9 | 4.4 | 0.85 |
| PTZ2 | 158 | 25 | 0.85 |
Table 5.
Uranium Isotope Ratios Detected in the Monitored Piezometers (Median Values) [6].
Table 5.
Uranium Isotope Ratios Detected in the Monitored Piezometers (Median Values) [6].
| Piezometer | Uranium Isotope Ratios (234U/238U) [mBq/L] |
|---|---|
| PZEC1 | 1.5 |
| PZI2 | 1.5 |
| PSG1 | 1.1 |
| PZG3 | 1.8 |
| PZS6 | 1.9 |
| PZEN1 | 2.0 |
| PRC1 | 2.2 |
| PTZ2 | 3.1 |
Publisher’s Note: MDPI stays neutral with regard to jurisdictional claims in published maps and institutional affiliations. |
© 2022 by the authors. Licensee MDPI, Basel, Switzerland. This article is an open access article distributed under the terms and conditions of the Creative Commons Attribution (CC BY) license (https://creativecommons.org/licenses/by/4.0/).
Share and Cite
MDPI and ACS Style
Cuiuli, E.; Procopio, S. Hydrogeological Survey, Radiometric Analysis and Field Parametric Measurements: A Combined Tool for the Study of Porous Aquifers. Water 2022, 14, 2173. https://doi.org/10.3390/w14142173
AMA Style
Cuiuli E, Procopio S. Hydrogeological Survey, Radiometric Analysis and Field Parametric Measurements: A Combined Tool for the Study of Porous Aquifers. Water. 2022; 14(14):2173. https://doi.org/10.3390/w14142173
Chicago/Turabian StyleCuiuli, Enzo, and Salvatore Procopio. 2022. "Hydrogeological Survey, Radiometric Analysis and Field Parametric Measurements: A Combined Tool for the Study of Porous Aquifers" Water 14, no. 14: 2173. https://doi.org/10.3390/w14142173
Note that from the first issue of 2016, this journal uses article numbers instead of page numbers. See further details here.