Article

Nanoplastic-Induced Nanostructural, Nanomechanical, and Antioxidant Response of Marine Diatom Cylindrotheca closterium

by
Tea Mišić Radić
1,*,
Petra Vukosav
1,
Bruno Komazec
2,
Cécile Formosa-Dague
3,
Darija Domazet Jurašin
1,
Petra Peharec Štefanić
2,
Andrea Čačković
1,
Krunoslav Juraić
1 and
Nadica Ivošević DeNardis
1
1
Ruđer Bošković Institute, Bijenička 54, 10000 Zagreb, Croatia
2
Department of Biology, Faculty of Science, University of Zagreb, Horvatovac 102a, 10000 Zagreb, Croatia
3
Toulouse Biotechnology Institute, Université de Toulouse, Institut National des Sciences Appliquées, Institut National de la Recherche Agronomique et Environnementale, Centre National de la Recherche Scientifique, 31400 Toulouse, France
*
Author to whom correspondence should be addressed.
Water 2022, 14(14), 2163; https://doi.org/10.3390/w14142163
Submission received: 10 June 2022 / Revised: 3 July 2022 / Accepted: 5 July 2022 / Published: 8 July 2022

Abstract

:
The aim of this study was to examine the effect of positively charged (amine-modified) and negatively charged (carboxyl-modified) polystyrene nanoplastics (PS NPs) on the nanostructural, nanomechanical, and antioxidant responses of the marine diatom Cylindrotheca closterium. The results showed that both types of PS NPs, regardless of surface charge, significantly inhibited the growth of C. closterium during short-term exposure (3 and 4 days). However, longer exposure (14 days) to both PS NPs types did not significantly inhibit growth, which might be related to the detoxifying effect of the microalgal extracellular polymers (EPS) and the higher cell abundance per PS NPs concentration. The exposure of C. closterium to both types of PS NPs at concentrations above the corresponding concentrations that resulted in a 50% reduction of growth (EC50) demonstrated phytotoxic effects, mainly due to the excessive production of reactive oxygen species, resulting in increased oxidative damage to lipids and changes to antioxidant enzyme activities. Diatoms exposed to nanoplastics also showed a significant decrease in cell wall rigidity, which could make the cells more vulnerable. Atomic force microscopy images showed that positively charged PS NPs were mainly adsorbed on the cell surface, while both types of PS NPs were incorporated into the EPS that serves to protect the cells. Since microalgal EPS are an important food source for phytoplankton grazers and higher trophic levels, the incorporation of NPs into the EPS and interactions with the cell walls themselves may pose a major threat to marine microalgae and higher trophic levels and, consequently, to the health and stability of the marine ecosystem.

Graphical Abstract

1. Introduction

Following decades of widespread use and the careless disposal of plastic items, plastic debris is now ubiquitous on land as well as in freshwater and marine systems [1,2]. Moreover, in a recent study, plastic particles were even detected in human blood samples [3]. Because plastics are resistant to decomposition, as a result of biodegradation, weathering, and degradation by UV photooxidation [4,5], larger plastic waste undergoes fragmentation into smaller particles to form mesoplastics, microplastics, and nanoplastics, before being completely decomposed [6,7]. Polystyrene is one of the most commonly used plastics; it can persist in the environment for hundreds of years and is often considered a pollutant in aquatic ecosystems [8,9,10,11,12].
Over the past few years, research on the potential environmental impacts of nanoplastics has been increasing. However, the ecotoxicological effects of nanoplastics on marine microalgae have rarely been investigated [13,14]. Microalgae are primary producers that are frequently used when assessing the effects of toxins in aquatic environments [15]. Although small in size, diatoms (Bacillariophyta) are important primary producers, holding an essential position at the base of the aquatic food web and accounting for 25–40% of primary production in the oceans [16,17,18]. Diatoms can be used as environmental quality sensors because of their cosmopolitan nature, short life span, and fast response to both environmental and anthropogenic stress [19,20,21]. A growth inhibitory effect of nanoplastics was observed in the microalgae Dunaliella tertiolecta when exposed to polystyrene nanoparticles (PS NPs) (50 nm) [22] and to amine-modified polystyrene nanoparticles (PS-NH2 NPs) (50 nm) [23], whereas carboxyl-modified polystyrene nanoparticles (PS-COOH NPs) (40 nm) showed no effect, although PS-COOH NPs were adsorbed on microalgae [23]. Growth inhibition was also observed in other algal species exposed to PS-NH2 [24,25], plain PS [26,27,28,29] and poly(methyl methacrylate) (PMMA) nanoplastics [30]. In addition to the growth inhibitory effect of nanoplastics, the increased production of reactive oxygen species (ROS) and a reduction in photosynthetic yield have also been documented [23,31,32,33,34]. Investigating the effect of differently functionalized polystyrene nanoparticles (plain PS, PS-NH2, and PS-COOH) on the green algae Pseudokirchneriella subcapitata and Chlorella vulgaris, Nolte et al. [34] and Hazeem et al. [26], respectively, showed that positively charged and neutral PS NPs adhered to the cell wall more strongly than PS NPs that are negatively charged. Although a small number of recent studies have studied the impact of nanoplastics on microalgae [13,14], these studies were mostly focused on their inhibitory effect on growth; few studies were on oxidative stress and were less focused on their effects on diatoms [26,27,29,31,35].
The aim of the present study was to broaden the knowledge on the impact of polystyrene nanoparticles with opposite surface charges on the adaptation response of the marine diatom Cylindrotheca closterium at the population and single-cell level by monitoring growth inhibition, nanostructural, nanomechanical, and antioxidative response. In addition, the interaction of nanoplastic particles with released extracellular polymers was characterized.

2. Materials and Methods

2.1. Diatom Culture

The diatom Cylindrotheca closterium (Bacillariophyceae) (CCMP1554) was obtained from the Culture Collection of the Bigelow Laboratory for Ocean Sciences (East Boothbay, ME, USA). Diatoms were grown in Erlenmeyer flasks (250 mL) in 100 mL of f/2 medium [36]. Growth medium f/2 was prepared with seawater sampled in the Adriatic Sea (2 km offshore the island of Vis (43°01′00.3″ N, 16°15′48.6″ E) at a depth of 25 m) previously filtered through a cellulose nitrate membrane filter (Whatman, pore size of 0.2 µm; Cytiva, Marlborough, MA, USA). Diatom cultures were cultured in a constant shaking water bath (20 rpm, temperature 18 °C) with a 12:12 light:dark (L:D) cycle and an irradiance of 31 µmol photons m−2 s−1.

2.2. Polystyrene Nanoparticles

Polystyrene nanoparticles, both amine- and carboxyl-modified, were purchased from Polysciences (Warrington, PA, USA). The original suspensions were in the form of a 10% (PS-NH2 NPs) and 2.5% (PS-COOH NPs) solid suspension (w/v) in deionized water, with a small amount of surfactant (<0.05% sodium dodecyl sulfate (SDS)). The nominal diameters reported by the manufacturer for PS-NH2 and PS-COOH NPs were 51 nm and 49 nm, respectively.
The particle size and zeta-potential of PS NPs suspensions in ultrapure water (UPW) and filtered natural seawater (FSW, a salinity of 40, pH 8.0, dissolved organic carbon content (DOC) 0.91 mg C L−1) were measured using dynamic light scattering (DLS), electrophoretic light scattering (ELS), and atomic force microscopy (AFM). The original suspensions of polystyrene nanoparticles were vortexed for 1 min and then diluted with UPW or FSW to the final concentration of 50 µg mL−1 by magnetic stirring for 30 min. Polystyrene nanoparticle suspensions were characterized immediately (0 h) and then again after 24 h. DLS and ELS were conducted using a photon correlator spectrophotometer equipped with a 532 nm “green” laser (Zetasizer Nano ZS, Malvern Instruments Ltd., Malvern, UK) and for AFM imaging, a Multimode scanning probe microscope with a Nanoscope IIIa controller (Bruker, Billerica, MA, USA) was used.

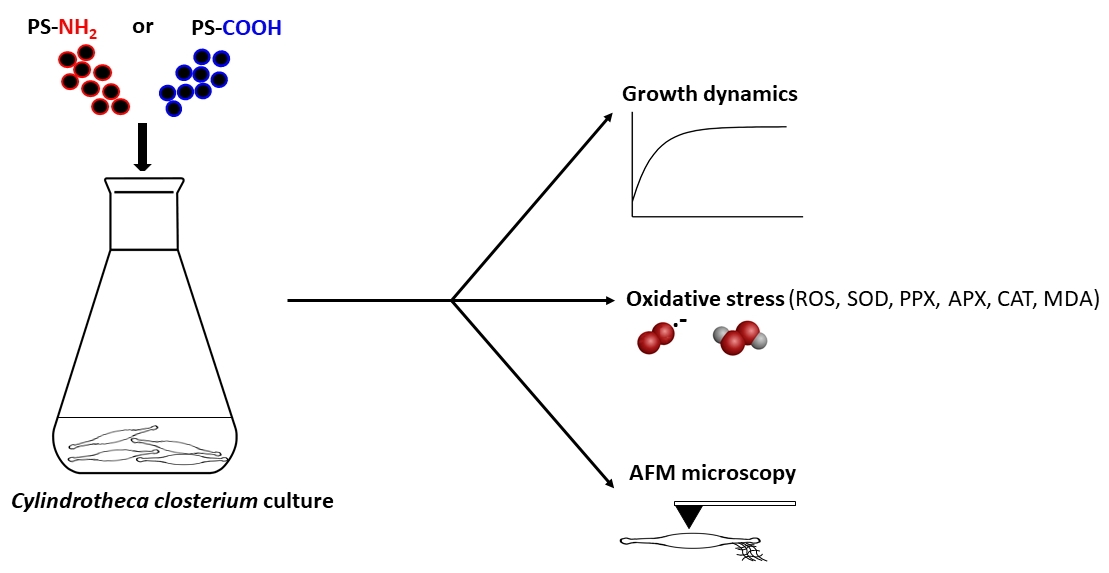
2.3. Exposure Experiment

Diatom monocultures were exposed to selected concentrations of PS-NH2 and PS-COOH NPs for 14 days in laboratory conditions. Erlenmeyer flasks containing f/2 medium were inoculated with the exponential growing algal culture (five days old) and spiked with PS NPs. The concentration range for NPs (both positively and negatively charged) was selected based on the preliminary experiments, in which EC50 values were determined for both PS-NH2 and PS-COOH NPs. The highest concentrations for exposure were chosen to be slightly higher than the corresponding EC50 values. The final concentrations of PS NPs in cultures were 1.5 µg mL−1, 2.5 µg mL−1, 3.5 µg mL−1, and 5 µg mL−1 for PS-NH2, and 10 µg mL−1, 50 µg mL−1, 100 µg mL−1 and 200 µg mL−1 for PS-COOH NPs. A culture grown without nanoplastics was considered the control culture. Predicted environmental concentrations of nanoplastics are in the range from 1 pg L−1 to 15 μg L−1 and are expected to be higher in environmental compartments where there is some degree of plastic particle accumulation [37]. As an upper limit for an environmentally relevant concentration of nanoplastics, a concentration of 250 μg mL−1 was used in other studies investigating the effects of NPs on microalgae [22,32]. For all tested PS NPs concentrations, an initial cellular concentration in the culture was ~105 cells mL−1. All cultures were grown in duplicates.

2.4. Growth Inhibition Determination

The algal cell density was counted microscopically, using a light microscope (Olympus model BX51 with a DP70 digital camera; Olympus, Tokyo, Japan) with a Fuchs-Rosenthal hemocytometer. For a given period of time, the average specific growth rate (µi–j) and the percentage of growth inhibition (%I) were calculated according to the following equations [38]:
µ i j = ln N j ln N i t j t i d 1
%   I = µ C µ T µ C × 100
where µi–j is the average specific growth rate (expressed in units of d−1) from time i to time j; ti and tj correspond to the times at the beginning and end of the period, respectively; Ni and Nj are the number of cells per culture volume at times i and j, respectively; % I is the growth inhibition, expressed as a percentage; µC is the average specific growth rate of the control group; µT is the specific growth rate for the treatment replicate. Effective concentrations of PS-NH2 and PS-COOH NPs that resulted in a 50% reduction of growth (EC50) were calculated by plotting the I value against the logarithm of the nanoplastics concentration and fitting it to a logistic equation [38].
For statistical analysis, cell density data values as a function of time for different parts of the exponential growth phase (days 0–3, 0–4, 0–9) were fitted to the following equation:
N j = N i   e µ i j   ( t j )
where the obtained fitted specific growth rates µi–j (µ(f)) within the tested time intervals for the exposed groups and the control groups were compared. The difference in growth rate between the exposed groups and the control group, if it was greater than ±2 standard deviations (SD), was considered to be statistically significant.

2.5. Reactive Oxygen Species (ROS) Determination

ROS levels in algae were measured using a fluorescent probe of dihydroethidium (DHE) following a modified procedure described by Cvjetko et al. [39], then using a 2′,7′-dichlorofluorescein diacetate (H2DCFDA) probe following a modified procedure described by Hong et al. [40]. For both fluorescent probes, 20 µL of 10 µM stock solution was added to 180 µL of the cell suspension to achieve final concentrations of 1 µM. Cell suspensions were left for 30 min in the dark, after which the fluorescence was measured at an excitation of 520 nm and an emission rate of 600 nm, or at an excitation of 504 nm and an emission rate of 550 nm for DHE or H2DCFDA, respectively, using a GloMax microplate reader (Promega, Madison, WI, USA). The obtained results were normalized by the number of cells in cell suspensions and were expressed as a percentage of the ROS level in control cells. Statistical analysis was performed using the STATISTICA 14.0.0.15 software package (TIBCO Software Inc., Palo Alto, CA, USA). The data were analyzed with a one-way analysis of variance (ANOVA), followed by the Newman-Keuls post hoc test. Differences between means were considered statistically significant at p ≤ 0.05.

2.6. Measurement of Enzyme Activities and Malondialdehyde (MDA) Content

2.6.1. Protein Extraction

The algal suspension was centrifuged at 2000× g at 20 °C for 3 min. After centrifugation, the pellet was washed three times with filtered seawater. After each washing, the cells were centrifuged at 2000× g at 20 °C for 3 min. Algal pellets were homogenized three times with the addition of glass beads (425–600 µm) using a Retsch mixer mill (MM200, Retsch, Haan, Germany) at 30 Hz for 3 min at +4 °C, in 500 μL of 50 mM potassium phosphate buffer (pH 7.0). The obtained homogenates were then centrifuged at 20,817× g at 4 °C for 15 min. Collected supernatants were centrifuged again at 20,817× g at 4 °C for 45 min and then used for the enzymatic activity assays.

2.6.2. Enzymatic Activity Assays

Enzymatic assays were performed at room temperature (25 °C), and spectrophotometric analyses were performed using a UV/visible spectrometer (ATI UNICAM UV4, Cambridge, UK). Specific enzymatic activities were expressed as a percentage of the activity of control samples.
Superoxide dismutase (SOD, E.C. 1.15.1.1) activity was determined as reported in the methodology used by Beauchamp and Fridovich [41]. The reaction mixture consisted of 13 mM methionine, 0.1 M ethylenediaminetetraacetic acid (EDTA), 75 μM nitroblue tetrazolium (NBT), and 2 mM riboflavin, to which different volumes of protein extracts in 50 mM phosphate buffer (pH 7.8) were added. The samples were then incubated for 8 min in a 15 W light box at room temperature, after which the amount of formazan that was formed via NBT photo reduction was read at 560 nm. The amount of enzyme causing a 50% inhibition of the reduction rate of NBT was defined as one unit of SOD activity.
Pyrogallol peroxidase (PPX, EC 1.11.1.7) activity was determined according to the protocol described by Nakano et al. [42]. Briefly, the oxidation of pyrogallol (ε = 2.6 mM−1 cm−1) in the presence of PPX enzymes results in an increase in absorbance at 430 nm. The reaction mixture was composed of 50 mM potassium phosphate buffer (pH 7.0), 20 mM pyrogallol, and 5 mM H2O2, with the addition of protein extract to a final concentration of 2% (v/v).
Ascorbate peroxidase (APX, EC 1.11.1.11) activity was analyzed by measuring the decrease in absorbance at a wavelength of 290 nm (ε = 2.8 mM−1 cm−1), as described by Nakano et al. [42]. The reaction mixture was composed of 50 mM potassium phosphate buffer (pH 7.0), 0.5 mM ascorbate, and 10 mM H2O2, with the addition of protein extract to a final concentration of 18% (v/v).
Catalase (CAT) (EC 1.11.1.6) activity was examined by analyzing the decrease in absorbance at 240 nm (ε = 36 mM−1 cm−1), as reported by Aebi et al. [43]. The reaction mixture was composed of 50 mM potassium phosphate buffer (pH 7.0) and 20 mM H2O2, with the addition of protein extract to a final concentration of 5% (v/v).
Statistical analysis was performed using a one-way ANOVA, followed by the Newman-Keuls post hoc test (p ≤ 0.05).

2.6.3. Malondialdehyde Content

Lipid peroxidation levels in algae were determined according to the modified method of Heath and Packer [44], i.e., by measuring the malondialdehyde (MDA) content. One hundred mL of cell suspensions were centrifuged at 2000× g at 20 °C for 3 min. After centrifugation, the pellet was washed three times with filtered seawater and was subsequently centrifuged again at 2000× g at 20 °C for 3 min. The cell pellet was homogenized 3 times, with the addition of glass beads (425–600 µm), using a Retsch mixer mill (MM200, Retsch, Haan, Germany) at 30 Hz for 3 min in 700 µL of 0.5% (w/v) 2-thiobarbituric acid prepared in trichloroacetic acid, with a final concentration of 20% (w/v), and was finally incubated at 95 °C for 30 min. The samples were then cooled and centrifuged at 14,000× g at + 4 °C for 30 min, after which their absorbance was measured at 532 nm. Furthermore, in order to make a correction for non-specific turbidities, the absorbance value measured at 600 nm was subtracted from the measured value at 532 nm. To calculate the lipid peroxide content, the obtained values were normalized to an equal number of cells among the samples; the results were presented as a percentage of control cells. Statistical analysis was performed using a one-way ANOVA, followed by a Newman-Keuls post hoc test (p ≤ 0.05).

2.7. Atomic Force Microscopy Working in Force Spectroscopy Mode

AFM measurements of the cell’s Young’s modulus were performed with a Nanowizard III AFM system (Bruker, Billerica, MA, USA). Force spectroscopy experiments were performed with MLCT cantilevers (Bruker, Billerica, MA, USA; nominal spring constants of 0.1 N m−1) using an applied force ranging from 1 to 3 nN, depending on the conditions. Young’s moduli were acquired from 40 nm indentation curves using the Hertz model [45], in which the force F, indentation (δ), and Young’s modulus (Ym) follow Equation (4):
F = 2 × Y m × tan α π × ( 1 υ 2 ) × δ ²
where α is the tip opening angle (17.5°), and υ is the Poisson ratio (arbitrarily assumed to be 0.5). The spring constants of cantilevers were obtained using the thermal noise method [46] before each experiment. In each condition, 400 force curves were recorded on 5 different cells; thus, a total of approximately 2000 curves were acquired per condition. Statistical comparisons of the results obtained in each case were performed using an unpaired t-test, allowing us to compare the means of two independent groups (p < 0.001).

2.8. Sample Preparation for Force Spectroscopy Measurements

For nanoindentation measurements, cells from control culture or from cultures exposed to nanoplastics were harvested by centrifugation (2000× g, 3 min), washed two times in FSW, and immobilized either on polyethyleneimine (PEI)-coated glass slides for cells in control conditions or on polydimethylsiloxane (PDMS) for cells exposed to nanoplastics. To modify the glass slides with PEI, 1 mL of 0.2% PEI was incubated on a plasma-oxygen-activated glass slide and allowed to stand overnight. The glass slide was then washed with ultrapure water and dried under nitrogen before cell immobilization. For both PEI and PDMS substrates, the cell suspensions (1 mL) were pipetted onto the surface and left to adsorb for at least 30 min, before rinsing with FSW.

2.9. Atomic Force Microscopy Imaging

The AFM imaging of C. closterium cells and the released extracellular polymers (EPS) was performed using a multimode scanning probe microscope with a NanoScope IIIa controller (Bruker, Billerica, MA, USA), equipped with a vertical engagement (JV) 125 µm scanner. During imaging, the linear scanning rate was adjusted to between 1.0 and 1.5 Hz for the tapping mode, and between 1.5 and 2.0 Hz for the contact mode, with a scan resolution of 512 samples per line. Imaging of the nanoparticle suspensions in UPW and FSW was performed in tapping mode using silicon probes (TESP-V2, Bruker, nominal resonance frequency, 320 kHz, nominal spring constant, 42 N m−1). The ratio of the set-point amplitude to the free amplitude (A/A0) was adjusted to 0.9 (light tapping) to minimize the interaction forces between the tip and the surface during imaging. Topographic images of the cell surface of C. closterium and the released EPS were acquired in contact mode, with silicon-nitride probes (DNP-10, Bruker, nominal frequency 12–24 kHz, spring constant of 0.06 N m−1). The processing and analysis of images were achieved using NanoScopeTM software (Bruker, NanoScope Analysis, version 2.0). All AFM images are presented as raw data, except for the first-order two-dimensional flattening. Measurements were performed in air at room temperature and in 30–40% relative humidity, leaving the samples with a small hydration layer, which helps in preserving the original structures [47].

2.10. Sample Preparation for AFM Imaging

For the preparation of the AFM samples of PS-NH2 and PS-COOH NPs suspensions in UPW, 5 µL of the prepared suspensions were deposited onto freshly cleaved mica immediately after mixing. The samples were then placed in enclosed Petri dishes to dry for 45 min. For the preparation of AFM samples of NPs suspensions in FSW, 5 µL of the prepared suspensions were also deposited onto freshly cleaved mica after 30 min of mixing and then incubated for 45 min. These samples were then rinsed three times with 50 µL of ultrapure water to remove the excess salt crystals and were finally placed in enclosed Petri dishes to dry. To test the temporal stability of the prepared suspensions in FSW, the suspensions were incubated at 18 °C for 24 h and then briefly mixed using a magnetic stirrer prior to AFM sample preparation, according to the protocol described above.
To prepare the samples of C. closterium for the AFM imaging of cells and released extracellular polymers, the direct-drop deposition method was used [48]. The cells used for AFM experiments were recovered during the exponential growth phase from the control culture and from cultures with the highest tested concentrations of PS-NH2 (5 µg mL−1) and PS-COOH (200 µg mL−1). Five µL of cell culture was deposited onto freshly cleaved mica and placed in enclosed Petri dishes for 45 min, to allow the cells to settle and adhere to the surface. The samples were rinsed three times in ultrapure water, then the samples were again placed in Petri dishes to evaporate the excess water. Throughout the described sample preparation procedure, the diatom cells remained firmly attached to the mica surface, allowing stable conditions for AFM measurements.

3. Results

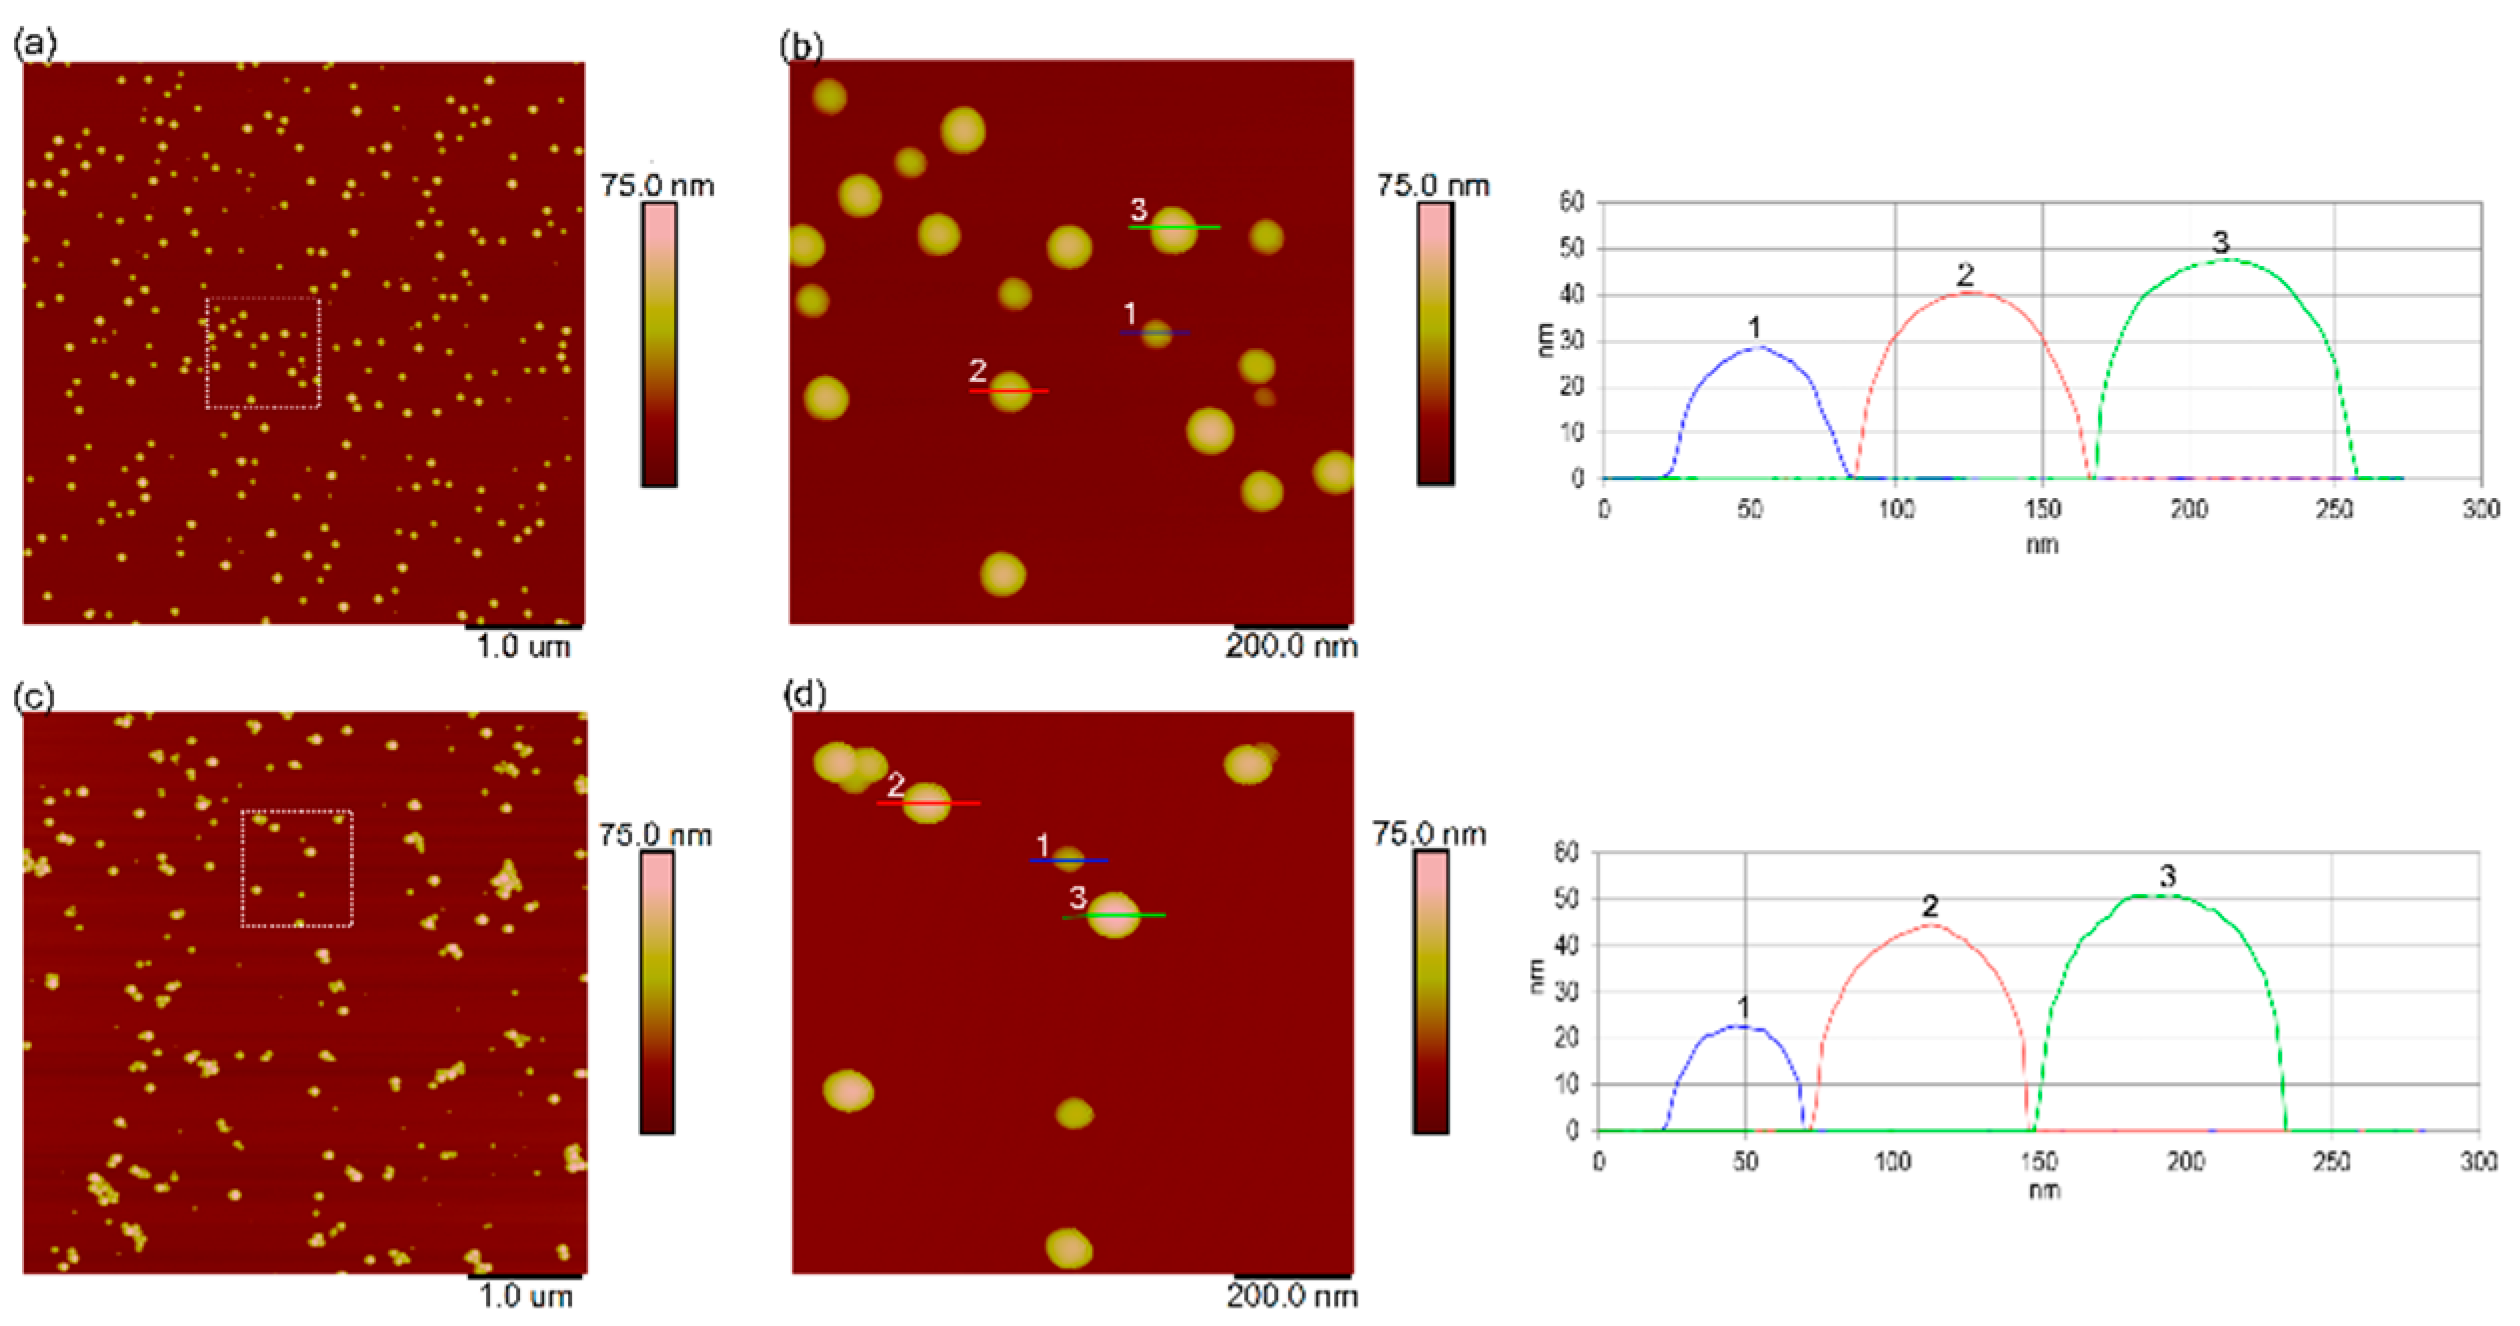
3.1. Characterization of Nanoplastics in Ultrapure Water and Natural Seawater

The physicochemical characterization of PS-NH2 and PS-COOH NPs that are suspended in ultrapure water and natural seawater is given in Table S1 (Supplementary Material). The size of the NPs suspended in ultrapure water was confirmed to be the average size provided by the supplier, with an average hydrodynamic diameter (dh) of 48.5 ± 0.4 nm for PS-NH2 and 54.5 ± 1.1 nm for PS-COOH NPs, determined using DLS. The presence of predominantly singly dispersed nanoparticles in both NPs suspensions in UPW was further confirmed by AFM (Figure 1), which shows nanoparticles with a height of 47.9 ± 6.2 nm and 51.8 ± 10.6 nm for PS-NH2 and PS-COOH NPs, respectively.
When suspended in filtered natural seawater, the dh of PS-NH2 NPs at time 0 remained similar to that of UPW (55.4 ± 1.1 nm), indicating the high stability of these particles. However, after 24 h, the dh of PS-NH2 NPs increased to 91.3 ± 5.1 nm (98%) and 4892.2 ± 167.0 nm (2%) (Supplementary Material, Table S1). The AFM images of PS-NH2 NPs in FSW revealed the presence of single nanoparticles; some of them were surrounded by a layer of smooth material (layer height of ~30 nm) (Figure 2a,b). In contrast, the PS-COOH NPs in FSW presented a significant increase in dh, reaching values of 1282.0 ± 59.7 nm (83.6%) and 4967.5 ± 813.1 nm (15.8%), indicating microscale aggregate formation (Supplementary Material Table S1). This increase in size is consistent with the observed microscale aggregates in the AFM images (Figure 2c,d). After 24 h, the DLS showed a higher aggregation of PS-COOH NPs in FSW, with a higher percentage of larger microaggregates (5102.6 ± 296.9 nm), in contrast to ultrapure water in which the dh value remained the same (55.8 ± 1.2 nm).
Regarding particle charge, lower absolute zeta potential (ζ-potential) values were determined for PS-NH2 and PS-COOH NPs in FSW, compared to UPW (Supplementary Material, Table S1). PS-NH2 NPs presented positive ζ-potential in UPW and FSW at both time points, with significantly lower values for particles suspended in FSW. On the other hand, the zeta potential of PS-COOH NPs had negative values in both UPW and FSW at times 0 h and 24 h, with lower absolute values in FSW.

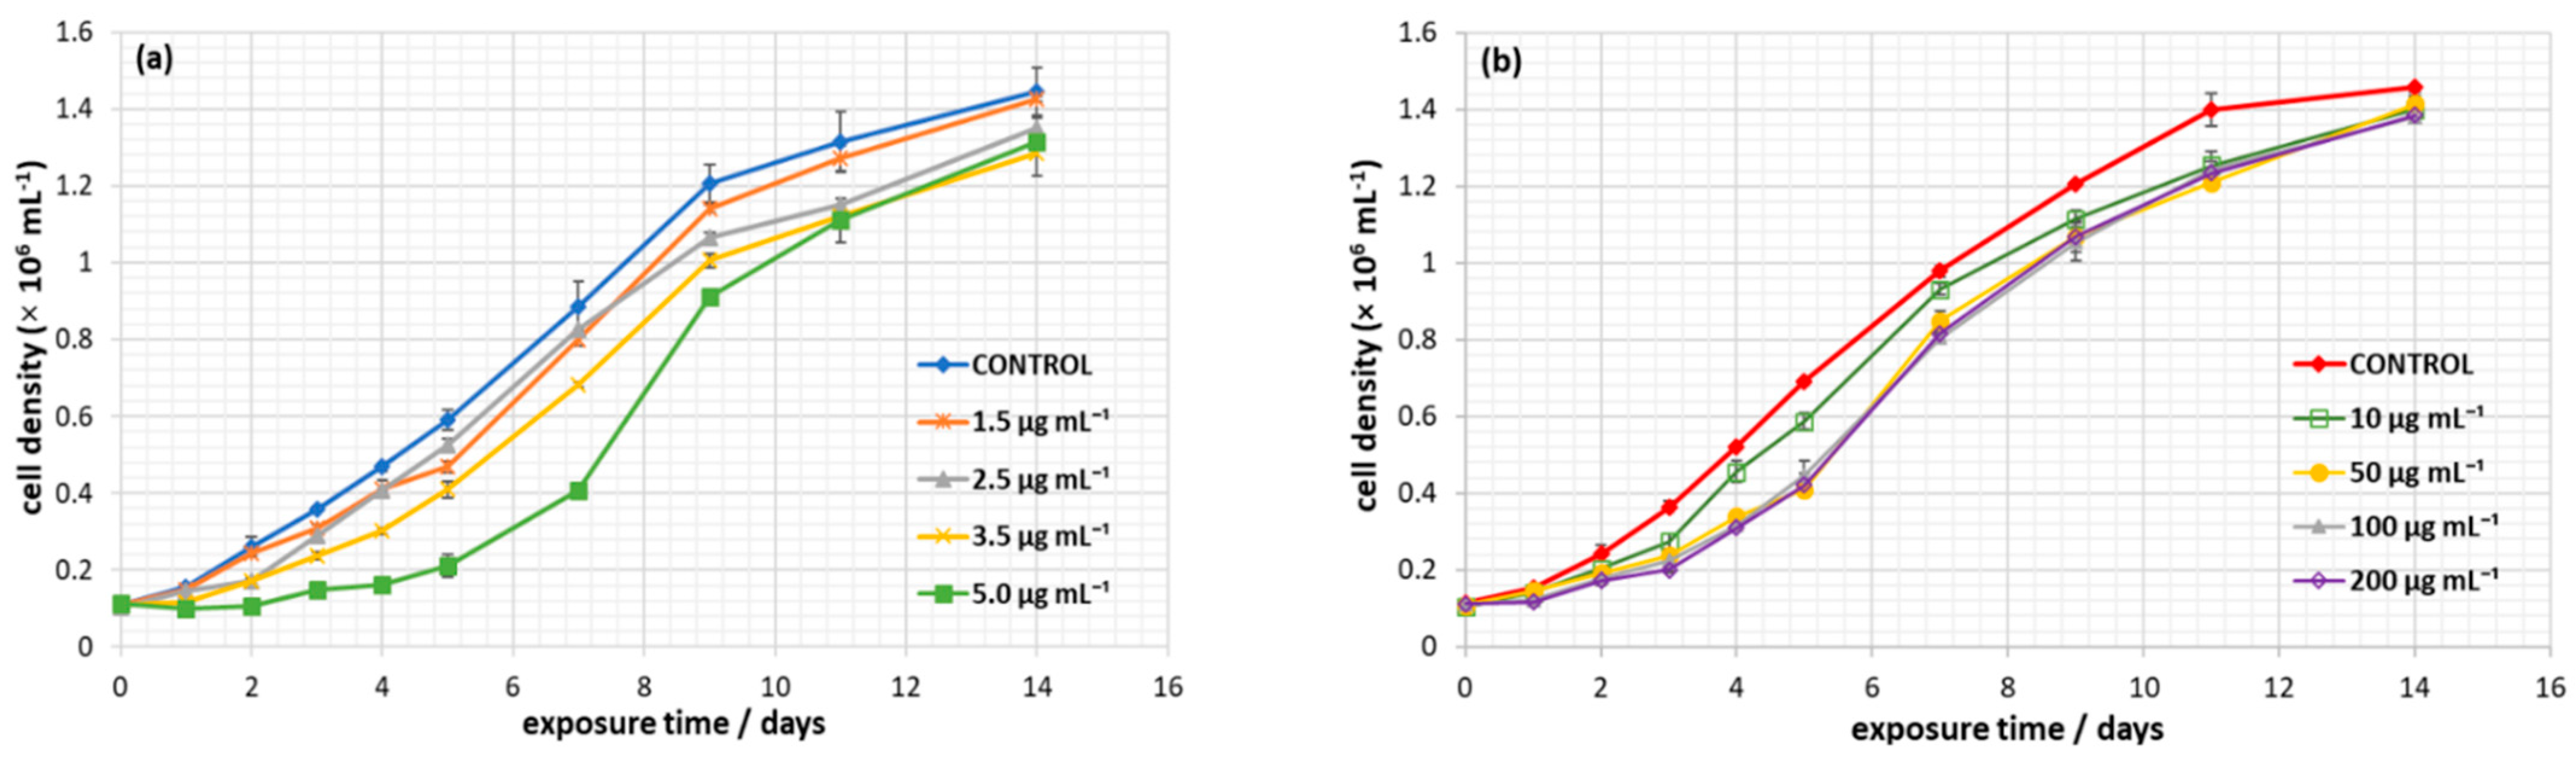
3.2. Effect of Nanoplastics on C. closterium Growth

The growth curves of C. closterium, exposed to charged polystyrene nanoplastics, are presented in Figure 3. At all tested concentrations of PS-NH2 and PS-COOH NPs, C. closterium cells were able to maintain positive growth. Growth curves show typical exponential growth from day 1 to day 9, followed by entering the stationary phase from day 9 to day 14, for the entire range of PS-NH2 and PS-COOH NPs concentrations tested.
Table 1 shows the specific growth rates (µ) and percentage of growth inhibition (%I) of C. closterium when exposed to different concentrations of PS-NH2 and PS-COOH NPs, as determined using Equations (1) and (2). In the cultures exposed to PS-NH2 NPs during the first 3 days (72 h) of the exponential phase, an increase in the PS-NH2 NPs concentration from 0 to 5 µg mL−1 resulted in a 4-fold decrease in the specific growth rate from 0.40 d−1 (corresponding to a division rate of 0.58 div d−1) in the control culture to 0.09 d−1 (corresponding to a division rate of 0.13 div d−1) in the culture exposed to the highest PS-NH2 NPs concentration (5 µg mL−1). Growth inhibition for the same period increased from 12.5% for the culture exposed to the lowest PS-NH2 NPs concentration (1.5 µg mL−1) to 77.5% for the culture exposed to the highest PS-NH2 NPs concentration (5 µg mL−1). After 4 days (96 h), the specific growth rate and inhibition showed the same trend as in the 3-day period, with an increase in inhibition from 8.3% for the culture exposed to 1.5 µg mL−1 PS-NH2 NPs to an inhibition of 75.0% for the culture exposed to 5 µg mL−1 PS-NH2 NPs. In the cultures exposed to PS-COOH NPs during the first 3 days of the exponential phase, increasing the PS-COOH NPs concentration from 0 to 200 µg mL−1 resulted in a 2-fold decrease in the specific growth rate, from 0.39 d−1 (corresponding to the division rate of 0.56 div d−1) in the control culture to 0.19 d−1 (corresponding to a division rate of 0.27 div d−1) in the culture exposed to the highest PS-COOH NPs concentration (200 µg mL−1). After 4 days, the specific growth rate and inhibition showed the same trend as in the 3-day period, with an increase in inhibition from 5.3% for the culture exposed to 10 µg mL−1 PS-COOH NPs to 34.2% for the culture exposed to 200 µg mL−1 PS-COOH NPs. With prolonged exposure time (9 and 14 days), the effect of nanoplastics on the specific growth rate was either much lower or no effect was observed. After 9 days, the growth inhibition ranged from 3.7% for the culture exposed to the lowest PS-NH2 NPs concentration (1.5 µg mL−1), to 14.8% for the culture exposed to the highest PS-NH2 NPs concentration (5 µg mL−1), whereas, after 14 days, there was no inhibition for all but the highest PS-NH2 NPs concentration (5.6% growth inhibition). A similar trend was also observed for PS-COOH nanoplastics, with a 3.8 % inhibition for cultures exposed to a concentration of 200 µg mL−1, while no inhibition was observed after 14 days for all PS-COOH NPs concentrations.
Regardless of NPs modification, the specific growth rate values during short-term exposure (3 and 4 days) decreased with increasing NPs concentration for both PS-NH2 and PS-COOH nanoplastics. The effective concentrations of nanoplastics that resulted in a 50% reduction in growth over a 3-day period (72 h EC50) were 3.88 µg mL−1 for PS-NH2 and 185 µg mL−1 for PS-COOH NPs.
The difference in specific growth rates was tested by fitting the cell density data values to Equation (3) as a function of time in the exponential growth phase (3, 4, and 9 days) for all tested concentrations of PS-NH2 and PS-COOH NPs and the control (Supplementary Material, Figures S1 and S2). Cultures exposed to all tested PS-NH2 concentrations showed a significant decrease in growth rate over a 3-day period (Supplementary Material, Figure S1a). For the 4-day period, only the cultures exposed to 3.5 µg mL−1 and 5 µg mL−1 PS-NH2 NPs showed a significant decrease in specific growth rate, compared to the control culture (Supplementary Material, Figure S1b). The specific growth rates of the cultures exposed to all tested PS-COOH NPs concentrations (10–200 µg mL−1) during short-term exposure (3 and 4 days) were significantly different from those of the control culture (Supplementary Material, Figure S2a,b). The inhibitory effect of PS-NH2 and PS-COOH on diatom growth during the exponential phase was strongest for cultures exposed to 5 µg mL−1 PS-NH2 and 200 µg mL−1 PS-COOH NPs during the 3-day period, resulting in a 77.5% and 51.3% growth inhibition, respectively. However, at longer exposure times (9 and 14 days), the cultures exposed to the whole range of concentrations of PS-NH2 and PS-COOH NPs showed no significant decrease in specific growth rate compared to the control culture (Table 1 and Supplementary Material, Figures S1c and S2c).

3.3. In Situ ROS Formation

The reaction of ROS with DHE and H2DCFDA allowed us to determine the level of oxidative stress in C. closterium cultures that are exposed to nanoplastics. DHE enters the cell, where it is oxidized into fluorescent ethidium by ROS. DHE has been shown to bind primarily to the superoxide radical (O2). H2DCFDA enters the cell, where it is converted to the highly fluorescent 2′,7′-dichlorofluorescein (DCF) after the cleavage of acetate groups by cell esterases and oxidation. H2DCFDA was shown to bind primarily to hydrogen peroxide (H2O2). The obtained results showed a statistically significant increase in the formation of ROS molecules (both O2 and H2O2) in algal cells exposed to the highest nanoplastic concentration (5 µg mL−1 for PS-NH2 and 200 µg mL−1 for PS-COOH) for seven days, compared to the control (Figure 4).

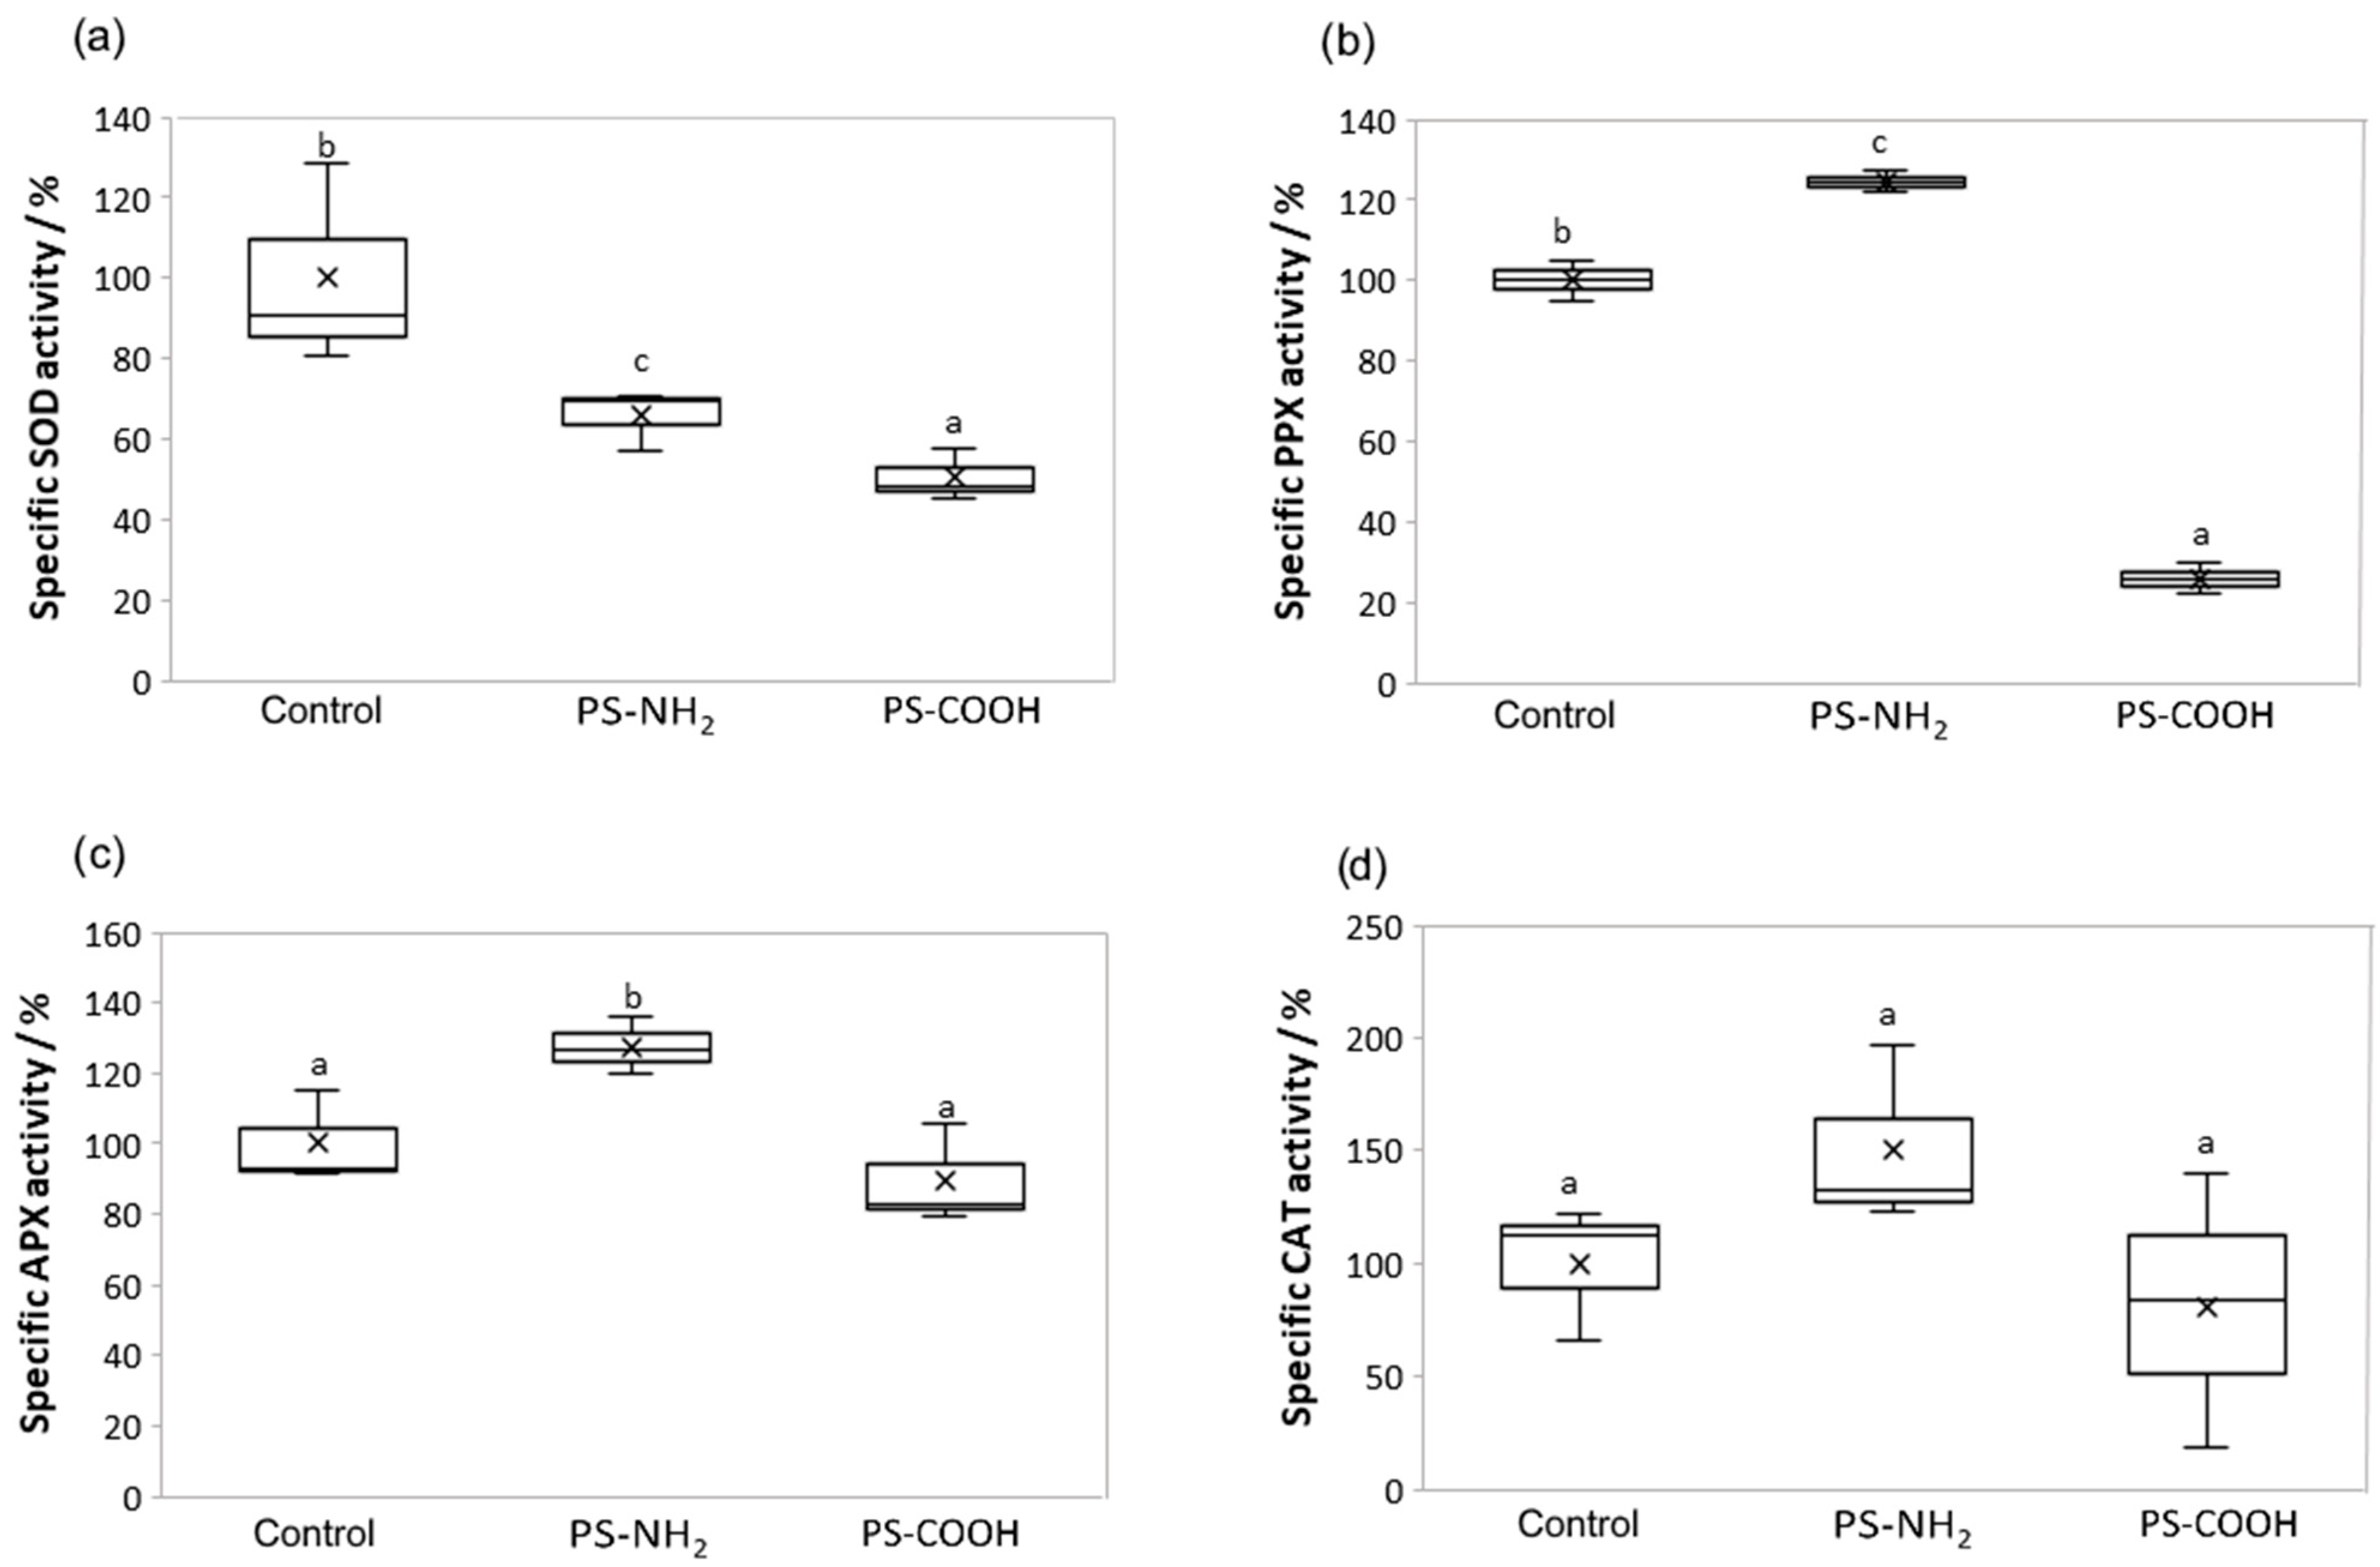
3.4. Effect on Antioxidant Enzyme Activity

In the algal cells, exposure to both NPs types significantly reduced the changes in SOD activity, compared with the control (Figure 5a). Conversely, PPX activity was significantly reduced after PS-COOH treatment, while PS-NH2 significantly increased PPX activity compared to control (Figure 5b). The APX activity was significantly increased only after PS-NH2 NPs exposure compared to the control, as well as to PS-COOH NPs exposure (Figure 5c). The CAT activity showed a similar pattern as the APX activity (Figure 5c,d). Namely, the activity of CAT was increased only after PS-NH2 NPs exposure, although the increase was not significant.

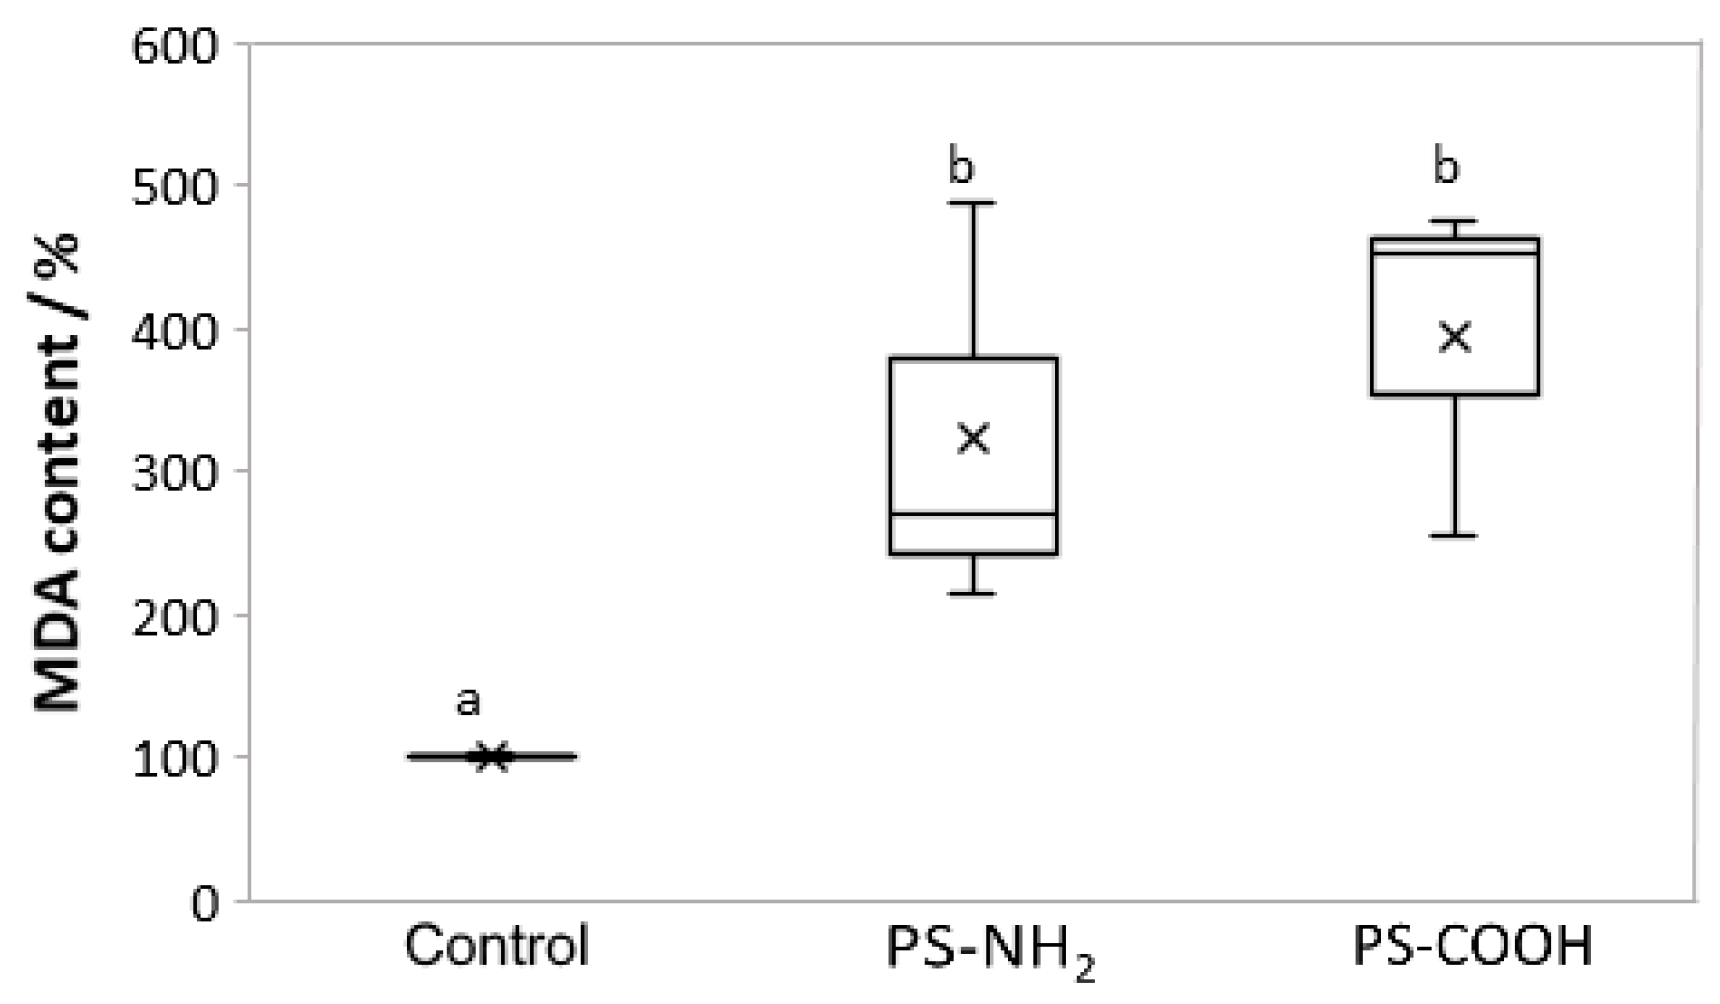
3.5. Effect on Lipid Perodixation

In algal cell cultures, the exposure to both NPs types (5 µg mL−1 for PS-NH2 and 200 µg mL−1 for PS-COOH) for seven days resulted in a significant increase in lipid peroxidation level, compared to the control (Figure 6).

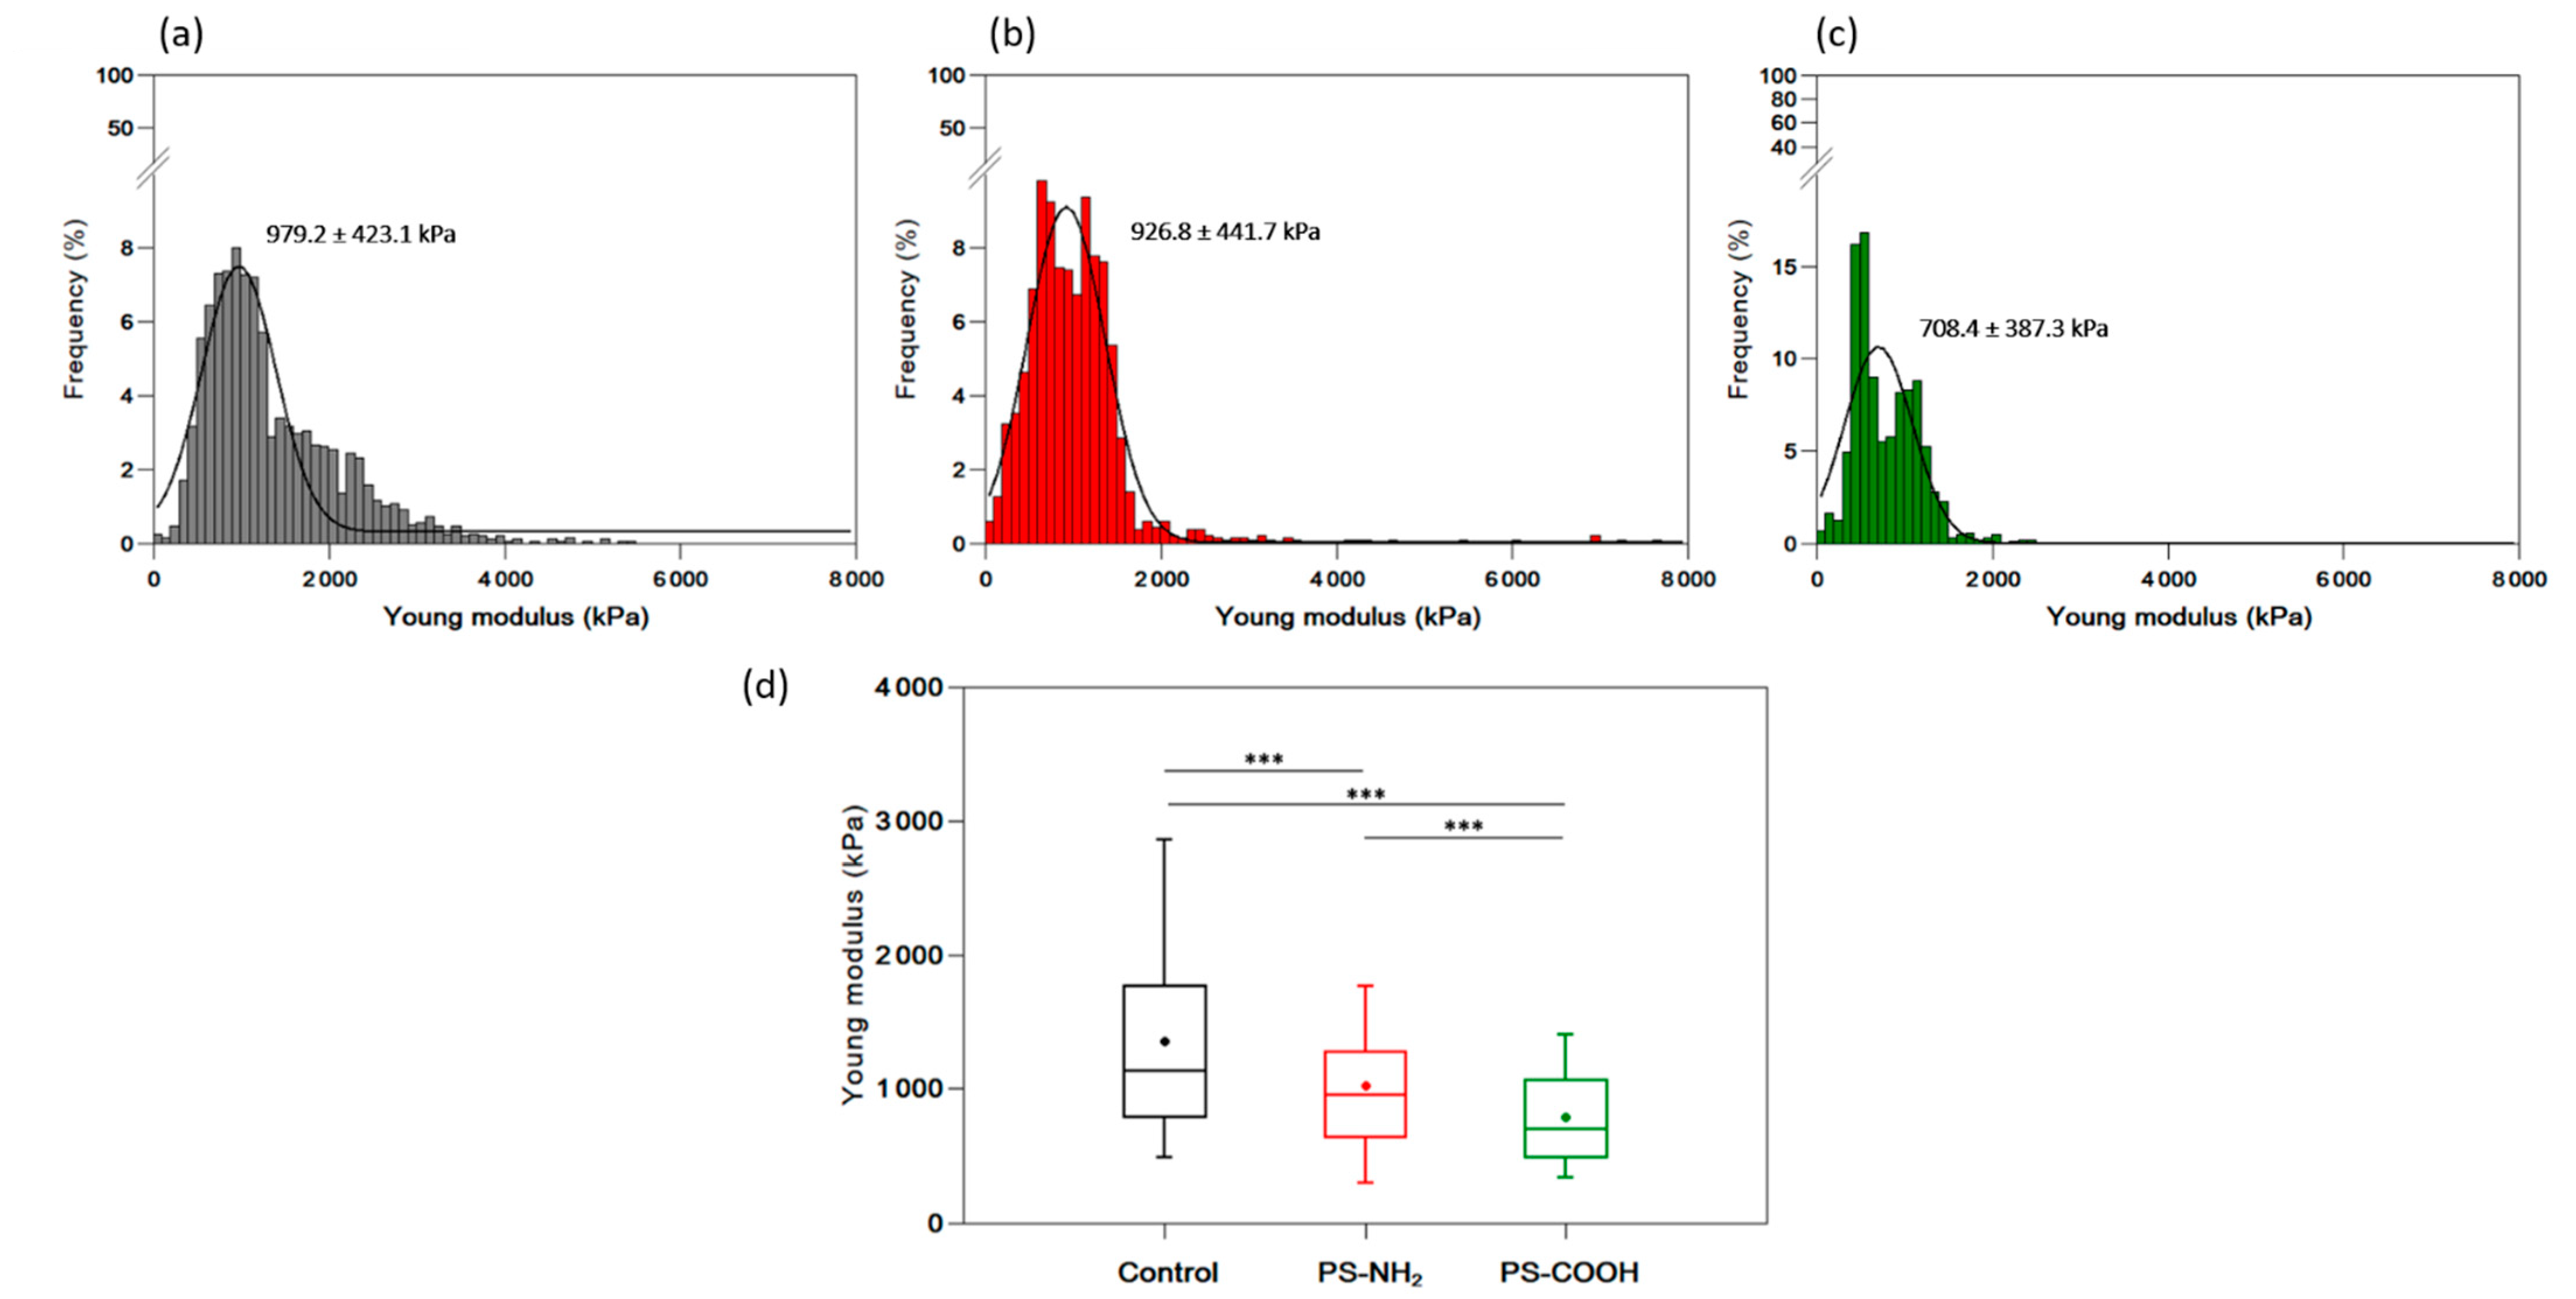
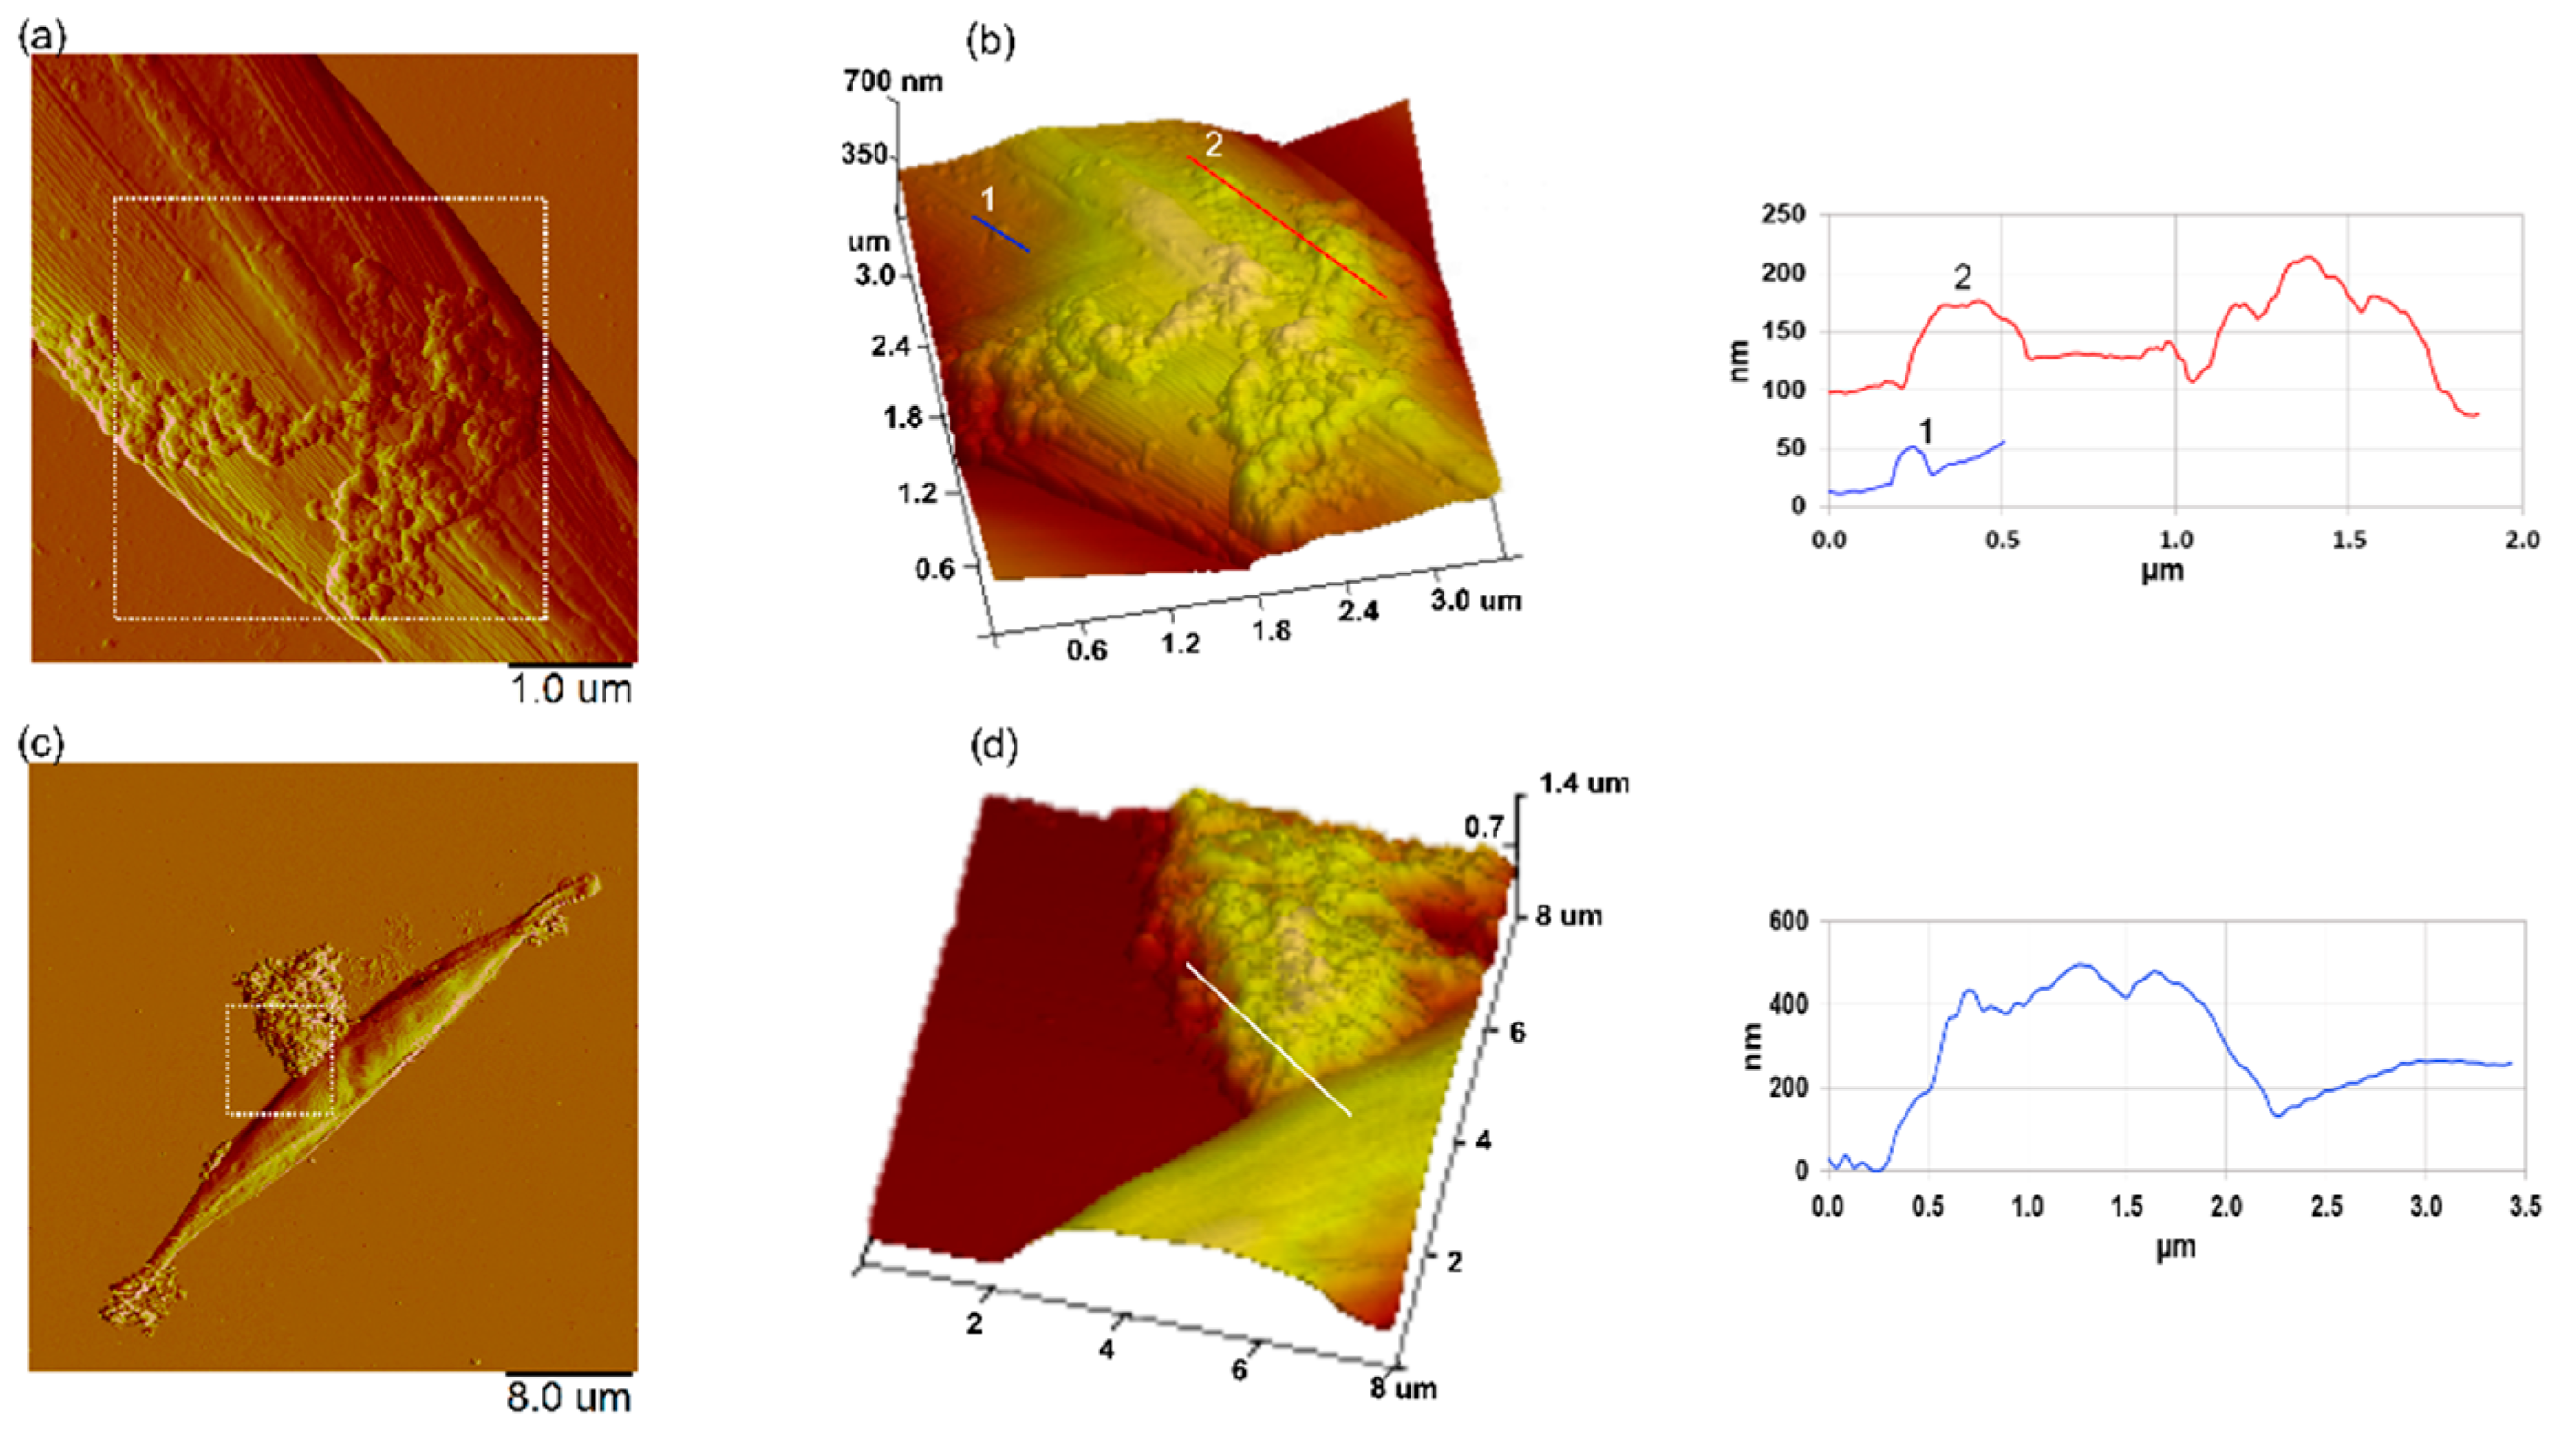
3.6. Effect of Nanoplastics on the Nanomechanical Properties of C. closterium

To obtain quantitative information on the nanomechanical properties of cells when exposed to nanoplastics, the Young modulus (Ym) of the C. closterium cell wall using AFM nanoindentation experiments was determined. Cells from the control culture and cultures exposed to PS-NH2 (5 µg mL−1) and PS-COOH NPs (200 µg mL−1) were harvested from exponentially growing cultures (day 3). In these experiments, a cantilever with known mechanical properties is pushed against the cell wall at a given force. The resistance of the cell wall to this compression is reflected by the Ym value: the higher it is, the stiffer the cell wall is. The results of these experiments are presented in Figure 7a–c. Cells in the control culture had an average Ym value of 979.2 ± 423.1 kPa (results obtained from 1989 force curves, recorded on 5 different cells), which decreased to 926.8 ± 441.7 kPa when the cells were exposed to PS-NH2 NPs (5 µg mL−1) (results obtained from 1367 curves, recorded on 5 different cells) and to 708.4 ± 387.3 kPa when the cells were exposed to PS-COOH NPs (200 µg mL−1) (results obtained from 1637 curves, recorded on 5 different cells). All data obtained for individual cells are presented in Table S2 (Supplementary Material). To see if these differences were significantly different, we plotted the data in a boxplot (Figure 7d) showing the differences in the distributions of the values obtained under each condition. Statistical analysis (an unpaired t-test) was performed using all values and showed that the decrease in Ym values for cells exposed to both types of nanoplastics was significant at a p-value < 0.001. Thus, the exposure of cells to PS-NH2 and PS-COOH NPs at concentrations slightly higher than the corresponding EC50 values had a significant effect on cell wall rigidity, which decreased significantly compared to cells grown without nanoplastics.

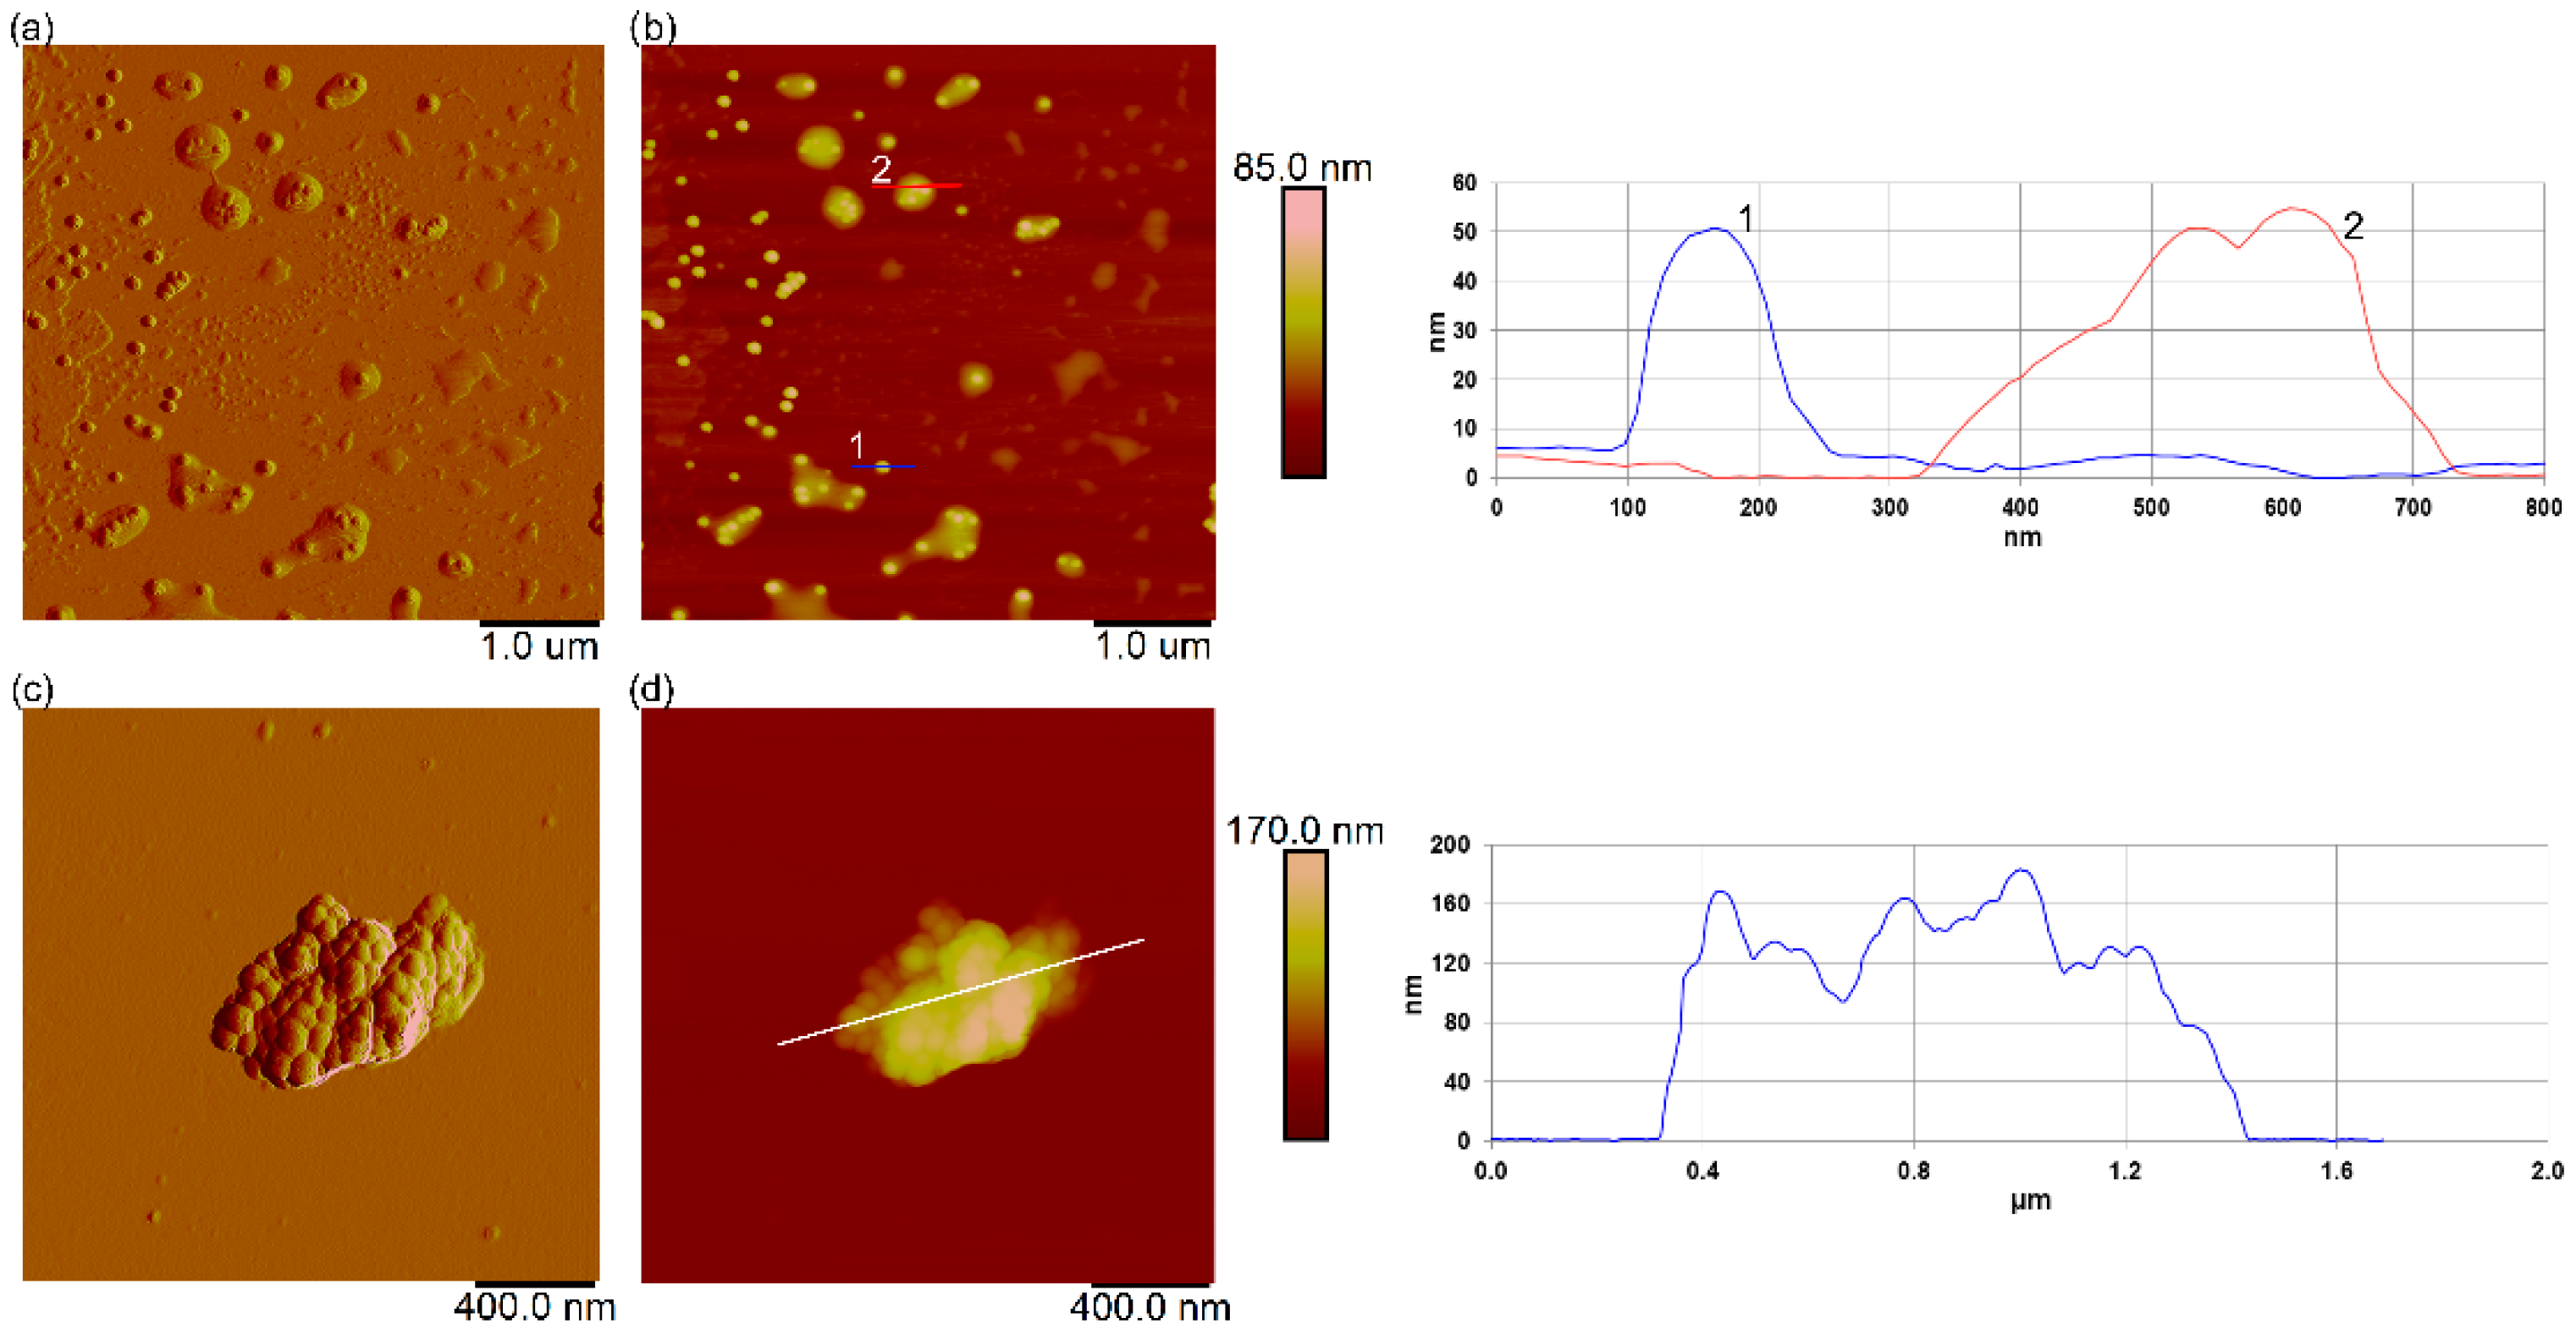
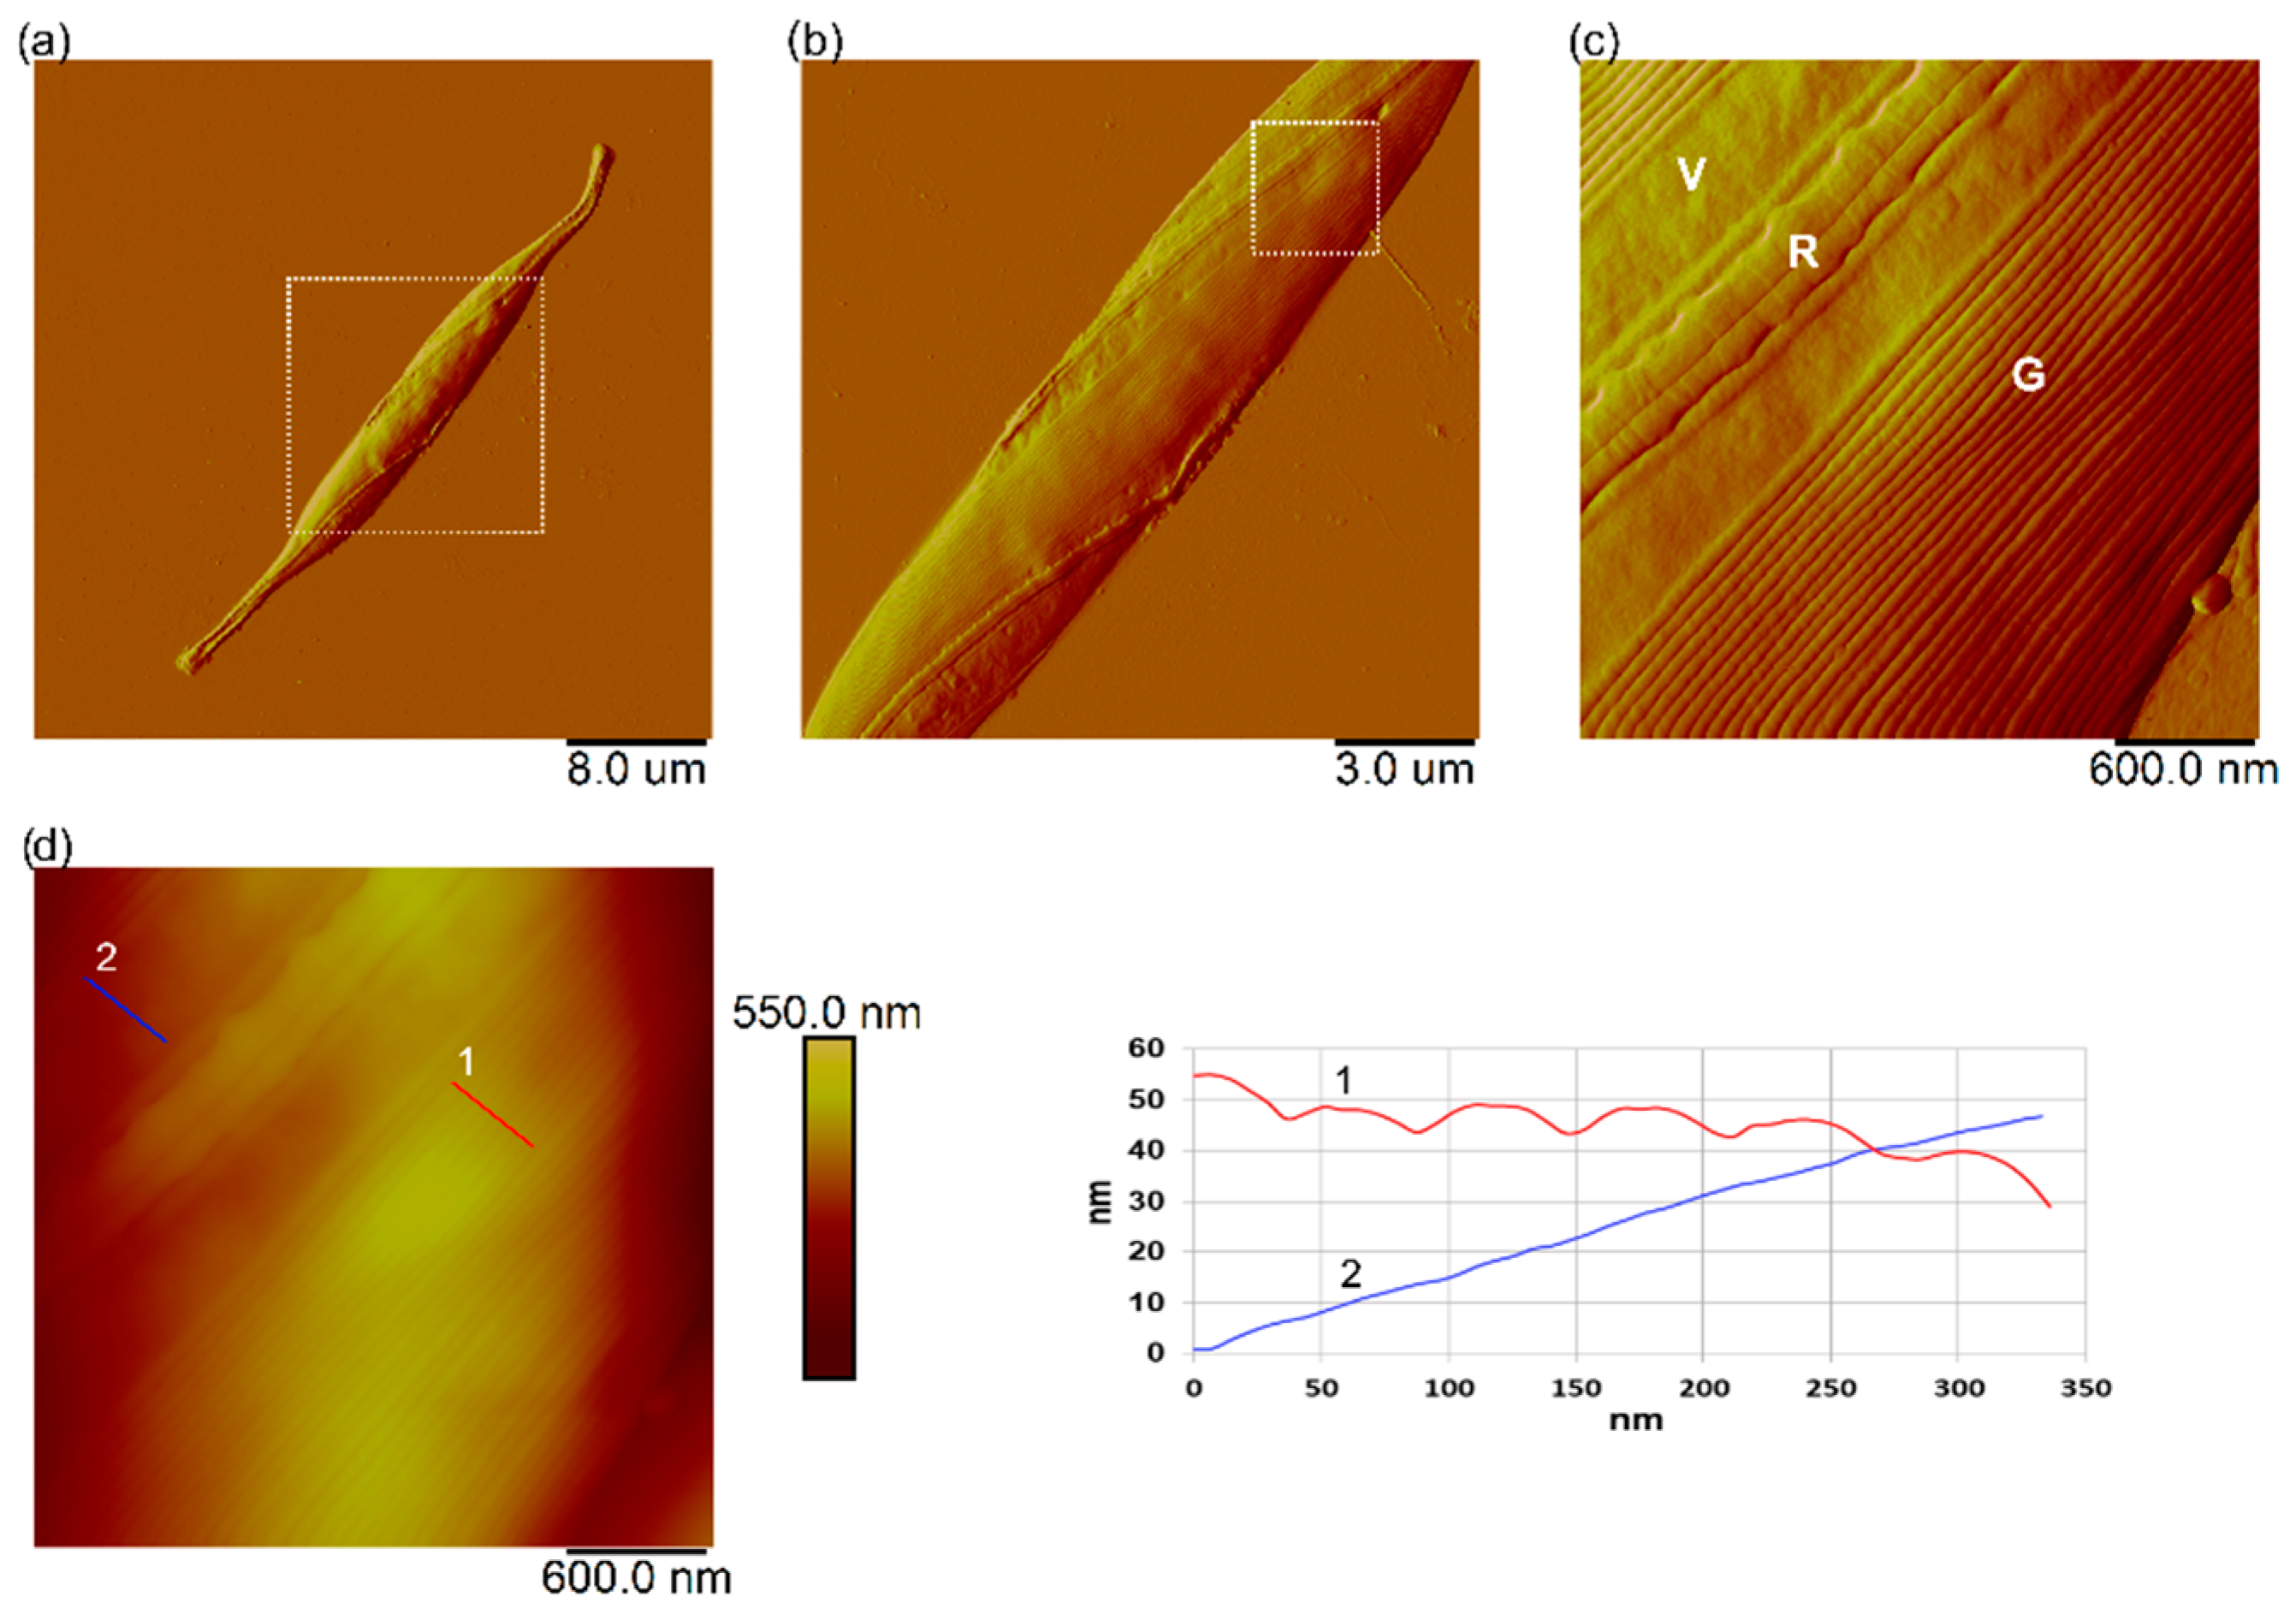
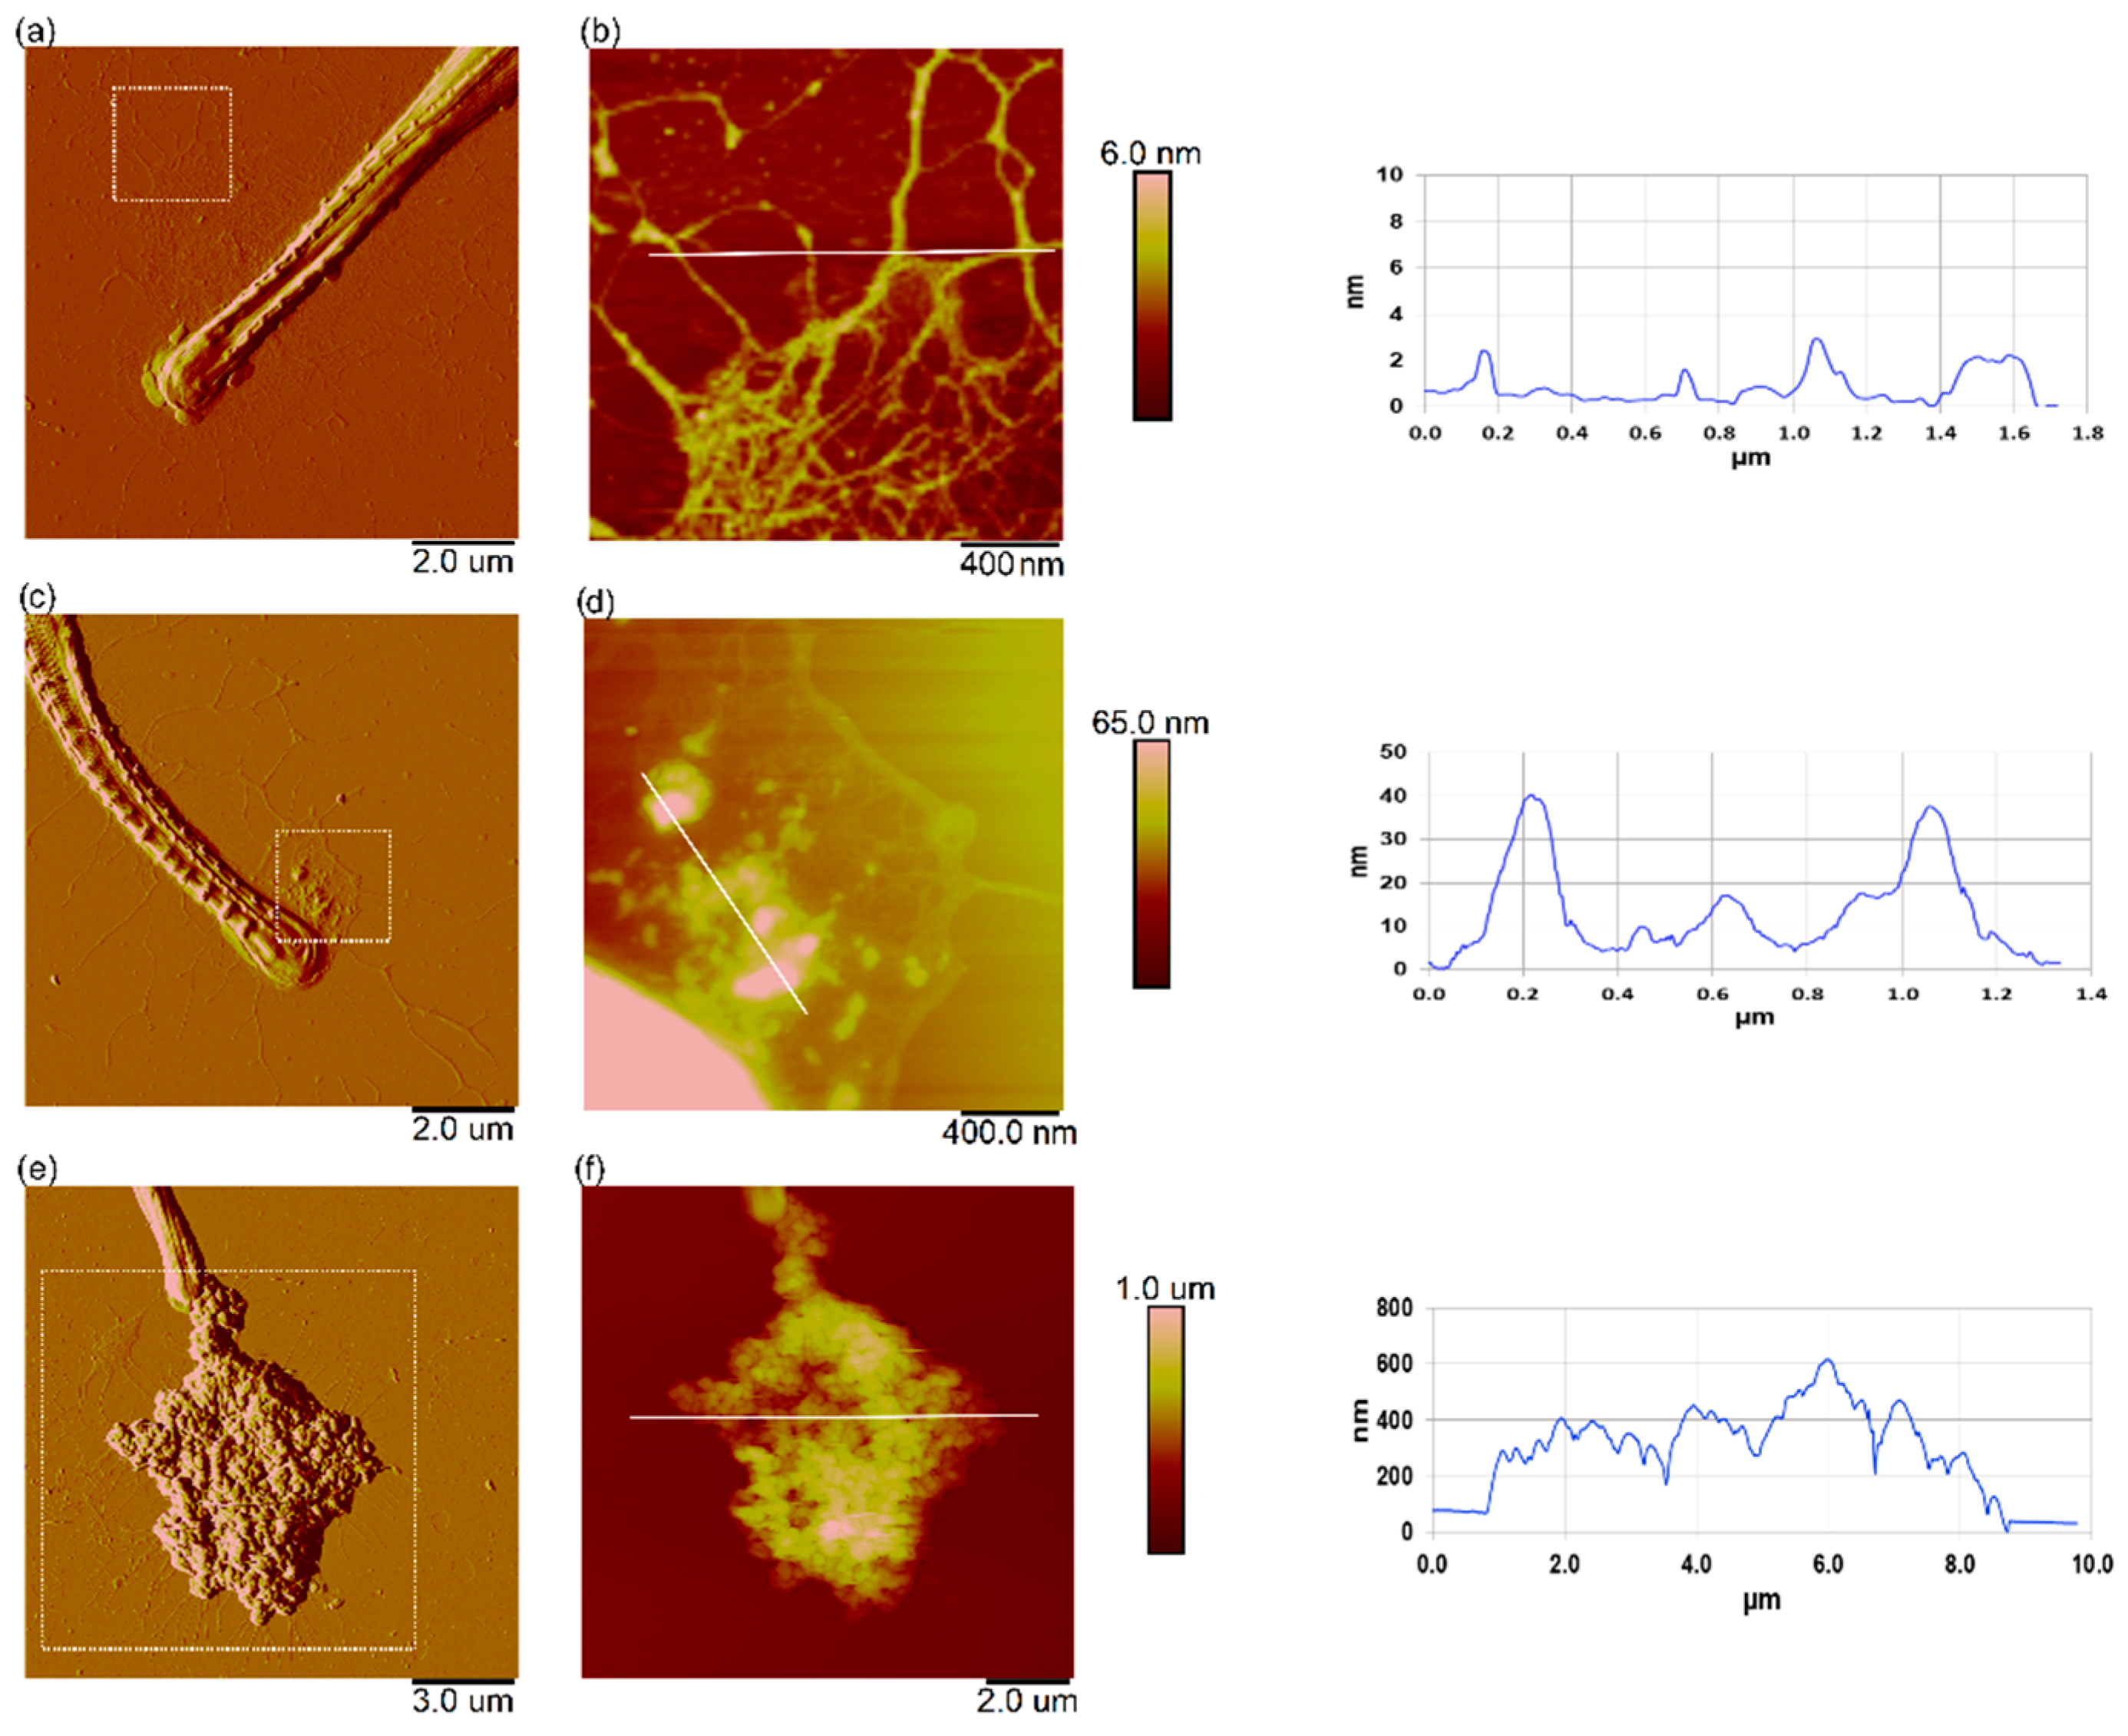
3.7. Interaction of Nanoplastics with C. closterium Cells and Released Extracellular Polymers

The cells of C. closterium exposed to the highest NPs concentration of PS-NH2 NPs (5 µg mL−1) and PS-COOH NPs (200 µg mL−1), as well as the cells from the control culture, were characterized at the single-cell level using AFM imaging. Cells were taken from the cultures at the exponential growth phase (day 3). Representative AFM images of C. closterium cells from the control culture are shown in Figure 8. The C. closterium cell has an elongated shape consisting of a central part and flexible rostrae, as previously reported [49]. The length of C. closterium cells ranged from 39.5 µm to 42.5 µm, the width of the cell at the central part varied from 3.1 µm to 4.8 µm, the height at the central part was in the range of 620–960 nm, while the height of the rostra was in the range of 180–300 nm. The central part has several structurally distinct regions: the girdle band, which consists of a set of bands, the valve, and the longitudinal slit raphe, which extends along the valve region and is bridged by the fibulae (Figure 8c).
Representative AFM images of the C. closterium cells exposed to PS-NH2 NPs (5 µg mL−1) and PS-COOH NPs (200 µg mL−1) are shown in Figure 9. C. closterium cells grown in a medium containing PS-NH2 or PS-COOH NPs did not show any morphological changes in terms of the surface nanostructure or cell size, compared to control. However, PS-NH2 nanoparticles were adsorbed onto the C. closterium cell, either as single particles or as aggregates (Figure 9a,b). When C. closterium cells were incubated with PS-COOH NPs, AFM images did not show the adsorption of PS-COOH nanoparticles or NPs aggregates on the cell (Figure 9c,d). Instead, PS-COOH NPs aggregates of various sizes were frequently found attached at the cell edge, which is probably as a result of the interaction of nanoplastic aggregates with excreted extracellular polymers surrounding the cell.
Figure 10 shows high-resolution AFM images of the extracellular polymeric material around the cells. Released EPS, in the form of a fibrillar network around the rostra part of C. closterium cells from the control culture, is shown in Figure 10a,b. Released EPS near the cell was very dense and changed from a network to fibrils when at a greater distance from the cell. The fibrils that form the network ranged from 0.6 to 4 nm. The EPS around C. closterium cells exposed to PS-NH2 NPs (Figure 10c,d) showed that nanoplastic particles were attached to the fibrils of the EPS network, either as single particles or as nanoscale aggregates (several hundred nm wide). Around the cells exposed to PS-COOH NPs, larger microscale nanoplastic aggregates were observed (around 10 µm wide and several hundred nm high), which were also attached to the EPS network (Figure 10e,f).

4. Discussion

In this work, the exposure of the diatom Cylindrotheca closterium to two oppositely charged polystyrene nanoplastics was investigated. Positively and negatively charged PS behaved differently in filtered seawater, which was used for the preparation of the f/2 growth medium. Thus, C. closterium in the growth medium was exposed to single particles and nanoscale aggregates of positively charged PS-NH2 NPs (<100 nm) and microaggregates (>1000 nm) of the negatively charged PS-COOH NPs (Figure 1 and Figure 2, Supplementary Material, Table S1). The formation of microscale aggregates of PS-COOH NPs in FSW is consistent with previously reported findings [24,50], probably resulting from the interaction between the negative surface charge of NPs and divalent cations naturally present in seawater (such as Ca2+ and Mg2+) [50,51,52] that resulted in lowering the zeta potential and charge-screening, leading to nanoplastic aggregation. The lower tendency for aggregation of PS-NH2 NPs was the result of the lower charge screening effect of the monovalent anions present in seawater, which kept these nanoparticles positively charged and, therefore, the repulsive forces between PS-NH2 particles were more pronounced [50]. The observed smooth layer around some PS-NH2 particles in seawater (singly dispersed or as aggregates) probably corresponds to a coating of organic matter (eco-corona) that was present in FSW [53,54]. Namely, since the major acidic functional groups in natural organic matter (NOM), carboxyl, and phenolic groups deprotonate at a pH > 3, NOM is negatively charged in natural waters [55] and is, therefore, expected to have a higher affinity for positively charged NPs.
Although both types of nanoplastics inhibited the growth of the diatom C. closterium in the exponential phase during short-term exposure (3 and 4 days), growth was inhibited at a much lower concentration of positively charged PS-NH2 NPs, compared to negatively charged PS-COOH NPs (Figure 3 and Table 1). As a result, the 72 h EC50 value for PS-NH2 NPs was ~50 times lower (3.88 µg mL−1) compared with the 72 h EC50 value for PS-COOH NPs (185 µg mL−1). These results show that positively charged PS-NH2 nanoplastics have higher toxicity to C. closterium than negatively charged PS-COOH nanoplastics. The lower toxicity of negatively charged PS NPs to microalgae was previously reported in the literature [23,24,35,56]. Bergami et al. [24] showed that PS-COOH NPs (40 nm) at concentrations of up to 50 µg mL−1 (their highest concentration) did not affect the growth of the microalgae D. tertiolecta, while PS-NH2 NPs (50 nm) inhibited algal growth (EC50 = 12.97 µg mL−1). Sjollema et al. [23] also found a reduced cell density of microalgae at a higher concentration of PS-COOH NPs (50 nm) (200 µg mL−1). The difference in toxicity of positive PS-NH2 and negative PS-COOH NPs probably results from the negative charge of the cell surface, due to anionic groups on the cell surface (carboxyl, sulfate groups, etc.) repelling negatively charged PS-COOH nanoplastics and adsorbing positively charged PS-NH2 nanoplastics through electrostatic interactions [33]. The higher affinity of PS-NH2 nanoplastics to the cell surface was also confirmed by our AFM imaging results, showing that PS-NH2 were adsorbed on the cell surface while PS-COOH NPs aggregates were attached to EPS near the cell edges (Figure 9). However, the effects on growth dynamics appear to be temporary for both the nanoplastic types tested, with an initial period of vulnerability at short-term exposure, followed by a recovery of growth after longer exposure. The latter could be related to the higher cell abundance per nanoplastic concentration, and could also be the result of the interaction of nanoplastics with the released microalgal EPS, which could scavenge nanoplastic particles, making them unavailable to newly divided algae.
Considering the results obtained from the growth inhibition test, further analysis, including oxidative stress response, cell elasticity measurement, and the nanoscale imaging of cells and released extracellular polymers were performed on microalgae at an exponential growth phase exposed to a concentration of NPs slightly above their corresponding EC50 values, 5 µg mL−1 and 200 µg mL−1, for PS-NH2 and PS-COOH NPs, respectively.
The exposure of C. closterium to nanoplastics triggered the production of ROS (Figure 4). In plant cells, ROS molecules can be formed as the by-products of metabolic functions seen primarily in peroxisomes, chloroplasts, and mitochondria during electron transport, as well as in small amounts in the endoplasmic reticulum. In this work, polystyrene nanoparticles were shown to induce increased ROS molecule synthesis in C. closterium cells, consistent with the results reported by Nugnes et al. [57], wherein polystyrene microparticles caused increased ROS molecule synthesis in C. dubia after only 24 h. ROS molecules can interact in cells, not only with biologically important molecules, such as proteins and DNA but also with lipids, leading to their peroxidation and, in cases of severe oxidative stress, leading to cell death [30,58]. We have shown that exposure to both types of polystyrene nanoparticles leads to lipid peroxidation (Figure 6), probably through the increased synthesis of ROS molecules, which consequently interact with lipid molecules, as is consistent with the results reported by Hazeem et al. [27]. For the cell to maintain redox balance, it uses non-enzymatic and enzymatic antioxidant mechanisms. CAT, PPX, and APX are antioxidant enzymes involved in the neutralization of hydrogen peroxide. Analysis of ROS molecules showed a greater increase in hydrogen peroxide synthesis after exposure to PS-NH2 NPs, compared with PS-COOH NPs exposure. At the same time, we showed that PS-NH2 treatment led to increased activity of the previously mentioned enzymes (Figure 5), which can be explained as an attempt by the algae to balance the redox state in the cell, i.e., to eliminate ROS molecules. Exposure to PS-COOH NPs led to an increase in hydrogen peroxide synthesis but did not induce a higher level of CAT, PPX, or APX enzyme activity (Figure 5). Similarly, both NPs induced the increased synthesis of superoxide radical, but increased activity of the enzyme SOD was not observed after either exposure (Figure 5). These results can be explained by the possibly increased activity of other complementary antioxidant enzymes that play a similar role, or the excessive synthesis of superoxide radicals and other ROS molecules in a relatively long treatment, resulting in decreased antioxidant capacity [29,59].
Another important property of the cell surface that may change, depending on growth conditions, is the rigidity of the cell wall. Indeed, several studies have shown that a specific stress or a change in environmental conditions (such as a change in pH, temperature, or salinity) can have an important effect on the composition or remodeling of the cell wall, thereby changing its nanomechanical properties [60,61,62,63,64,65,66]. Our nanoindentation measurements, performed on C. closterium cells exposed to nanoplastics, showed a significant decrease in cell wall rigidity compared to cells grown without nanoplastics (Figure 7). While to the best of our knowledge, only one study has investigated the effects of nanoplastics on microalgae using AFM [35], this is the first time that their effects on the cell nanomechanical properties have been probed using atomic force microscopy. For this reason, it is not possible to compare our data with other studies performed on microalgae. However, it is known that external stress factors can have an effect on microalgal cell wall rigidity. For example, Yap et al. [67] showed that changes in the nutrient composition of the culture medium can change the rigidity of cells with microalgal cells in N-deprived conditions, these having a 30% lower Young modulus than cells grown under normal conditions. A change in the Young modulus of cells was also observed when the pH of the culture medium changed, and it increased significantly at a higher pH [61]. In addition, previous studies by our group [64,65,68] have shown that the exposure of cells to temperature stress, salinity stress, and cadmium causes changes in cell rigidity, as a consequence of a molecular modification to the cell barrier. It is therefore not surprising that exposure to nanoplastics also alters the nanomechanical properties of cells. One possible explanation for this, at least in the case of PS-NH2 NPs, is that nanoplastics are able to adsorb onto the surface of cells, inducing changes in cell rigidity. While positively charged PS-NH2 nanoplastics were absorbed well at the surface of cells, negatively charged PS-COOH nanoparticles resulted in poor cell coverage, as confirmed by our AFM imaging results (Figure 9). Similar results were obtained in the study by Nolte et al. [35] where the authors used AFM to image Pseudokirchneriella subcapitata cells after exposure to positively and negatively charged nanoplastics, as is the case in this study. Therefore, the decrease in the Ym observed in this study, upon PS-COOH NPs exposure, probably cannot be explained by the direct adsorption of nanoplastics at the cell surface. However, for PS-COOH nanoplastics that have been shown to be toxic to cells and that inhibit growth, a change in nanomechanical properties may be one of the effects of this toxicity on cells caused by changes in cell physiology, including lipid damage due to oxidative stress.
Diatoms are known to excrete large amounts of EPS, both as a response to environmental conditions and as a function of their motility system [69,70]. The production of extracellular polymers by marine diatoms is an important pathway, by which photosynthetically produced organic carbon enters the trophic web; thus, the interaction of nanoplastics with EPS is of great importance. The interaction of nanoplastics with the cell and with released microalgal EPS surrounding the cell was revealed by high-resolution AFM imaging. The similar fibrillar network structure of the EPS of C. closterium was reported previously [71]. Our results showed that both types of nanoplastics interact with EPS. PS-NH2 nanoparticles were incorporated into the EPS network, attached to the fibrils of the network either as single nanoparticles or as nanoscale aggregates, whereas PS-COOH NPs aggregates were attached to the EPS network as microscale aggregates (Figure 10). It has been reported that EPS is mainly composed of polysaccharides, proteins, nucleic acids, and lipids, and is acidic and negatively charged due to the anionic components of the polysaccharide chains, such as the acetyl groups, uronic acids, and sulfates [72,73]. Therefore, the interaction of EPS with positively charged PS-NH2 NPs is probably dominated by electrostatic interaction, while in the case of negatively charged PS-COOH, the interaction is probably due to hydrophobic interaction [28]. The observed scavenging of nanoparticles by EPS can have a protective role by preventing the direct contact of nanoplastics with the cell. The incorporation of silver nanoparticles into the EPS of C. closterium has been previously reported in the literature [74], where it was also shown that EPS production increased as a feedback response to Ag NP exposure. A recent study by our team also showed that exposure to cadmium induced an increase in EPS production by C. closterium [49]. Although the EPS surrounding the cell could have an important protective function against toxic substances, including nanoplastics, by scavenging nanoplastic particles, conversely, the extracellular polymers of microalgae are an important food source for phytoplankton grazers and higher trophic levels; therefore, the incorporation of nanoparticles into EPS may have a significant impact on the entire marine food chain.

5. Conclusions

The presence of nanoplastics in the marine environment raises concerns about their impact on marine biota, including microalgae, as one of the most important primary producers in marine ecosystems and the base of the marine food chain. The exposure of Cylindrotheca closterium to both types of PS NPs (PS-COOH and PS-NH2 NPs) resulted not only in growth inhibition but also showed phytotoxic effects due to the excessive production of ROS, leading to increased oxidative damage to lipids and changes in antioxidant enzyme activities. Atomic force microscopy in force microscopy mode was used for the first time to characterize the effects of nanoplastics on the rigidity of the microalgal cell wall and showed a decrease in cell rigidity, due to the exposure of cells to nanoplastics. In addition, the AFM imaging of cells and their EPS at the single-cell level revealed the adsorption of PS-NH2 nanoplastics on the cell surface and the incorporation of both NPs types into the EPS network. The results of this study indicate that both types of nanoplastics, either via interactions with microalgal cell walls or with microalgal EPS, may pose a major threat to marine microalgae and higher trophic levels and, thus, to the health and stability of the marine ecosystem. Although the obtained results directly apply to C. closterium, they also provide the basis for further investigation of the effects of different nanoplastics on the nanostructural, nanomechanical, and antioxidant responses of other microalgal species at population and single-cell levels.

Supplementary Materials

The following supporting information can be downloaded at: https://www.mdpi.com/article/10.3390/w14142163/s1, Figure S1: Results of fitting to the exponential function (Equation (3)) of growth curves of Cylindrotheca closterium exposed to different PS-NH2 nanoparticle concentrations in the different parts of exponential growth phase, marked by grey rectangles (a) first 3 days (D3) (b) first 4 days (D4) and (c) first 9 days (D9); Figure S2. Results of fitting to the exponential function (Equation (3)) of the growth curves of Cylindrotheca closterium exposed to different PS-COOH nanoparticle concentrations in the different parts of the exponential growth phase, marked by red rectangles (rectangles (a) first 3 days (D3) (b) first 4 days (D4) and (c) first 9 days (D9); Table S1. Physicochemical characterization of PS-NH2 and PS-COOH nanoplastics (50 μg mL−1) in ultrapure water (UPW) and filtered natural seawater (FSW) by dynamic (DLS) and electrophoretic light scattering (ELS) and atomic force microscopy (AFM); Table S2. Average Young modulus values, obtained for Cylindrotheca closterium (5 cells) in the three different conditions tested in this study (control condition, exposure to 5 µg mL−1 PS-NH2, and to 200 µg mL−1 PS-COOH). Results are given in kPa.

Author Contributions

Conceptualization, T.M.R., P.V. and P.P.Š.; methodology, T.M.R., P.V., C.F.-D. and P.P.Š.; investigation, T.M.R., P.V., B.K., C.F.-D., D.D.J., P.P.Š., A.Č. and K.J.; writing—original draft preparation, T.M.R., P.V., B.K., C.F.-D., P.P.Š. and K.J.; writing—review and editing, T.M.R. and N.I.D.; supervision, T.M.R.; funding acquisition, T.M.R. and N.I.D. All authors have read and agreed to the published version of the manuscript.

Funding

This work was supported by the project “From algal cell surface properties to stress markers for aquatic ecosystems” (CELLSTRESS, IP-2018-01-5840), funded through the Croatian Science Foundation.

Institutional Review Board Statement

Not applicable.

Informed Consent Statement

Not applicable.

Data Availability Statement

Not applicable.

Acknowledgments

The authors thank Zdeslav Zovko and Jovica Lončar (Ruđer Bošković Institute, Zagreb, Croatia) for their analysis of dissolved organic carbon content in the seawater and for a discussion about growth inhibition data, respectively.

Conflicts of Interest

The authors declare no conflict of interest. The funders had no role in the design of the study; in the collection, analyses, or interpretation of data; in the writing of the manuscript, or in the decision to publish the results.

Abbreviations

AFMAtomic force microscopy
APXAscorbate peroxidase
CATCatalase
DLSDynamic light scattering
DOCDissolved organic carbon
dhHydrodynamic diameter
DHEDihydroethidium
EDTAEthylenediaminetetraacetic acid
ELSElectrophoretic light scattering
EC50Effective concentration of substance resulting in a 50% reduction in growth
EPSExtracellular polymers
FSWFiltered seawater
H2DCFDA2′,7′-dichlorofluorescein diacetate
IInhibition
MDAMalondialdehyde
NBTNitroblue tetrazolium
NPsNanoplastics
PDMSPolydimethylsiloxane
PEIPolyethylenimine
PMMAPoly(methyl methacrylate)
PPXPyrogallol peroxidase
PSPolystyrene
PS NPsPolystyrene nanoplastics
PS-COOHCarboxyl-modified polystyrene
PS-NH2 Amine-modified polystyrene
ROSReactive oxygen species
SDSSodium dodecyl sulfate
SODSuperoxide dismutase
UPWUltrapure water
YmYoung modulus
γMass concentration
ζ-potentialZeta potential
µSpecific growth rate

References

  1. Jambeck, J.R.; Andrady, A.; Geyer, R.; Narayan, R.; Perryman, M.; Siegler, T.; Wilcox, C.; Lavender Law, K. Plastic waste inputs from land into the ocean. Mar. Pollut. 2015, 347, 768–771. [Google Scholar] [CrossRef] [PubMed]
  2. Rochman, C.M. Microplastics research—From sink to source in freshwater systems. Science 2018, 360, 28–29. [Google Scholar] [CrossRef] [PubMed]
  3. Leslie, H.A.; van Velzen, M.J.M.; Brandsma, S.H.; Vethaak, A.D.; Garcia-Vallejo, J.J.; Lamoree, M.H. Discovery and quantification of plastic particle pollution in human blood. Environ. Int. 2022, 163, 107199. [Google Scholar] [CrossRef] [PubMed]
  4. Jahnke, A.; Arp, H.P.H.; Escher, B.I.; Gewert, B.; Gorokhova, E.; Kühnel, D.; Ogonowski, M.; Potthoff, A.; Rummel, C.; Schmitt-Jansen, M.; et al. Reducing uncertainty and confronting ignorance about the possible impacts of weathering plastic in the marine environment. Environ. Sci. Technol. Lett. 2017, 4, 85–90. [Google Scholar] [CrossRef]
  5. Prata, J.C.; da Costa, J.P.; Lopes, I.; Duarte, A.C.; Rocha-Santos, T. Effects of microplastics on microalgae populations: A critical review. Sci. Total Environ. 2019, 665, 400–405. [Google Scholar] [CrossRef]
  6. Gigault, J.; ter Halle, A.; Baudrimont, M.; Pascal, P.Y.; Gauffre, F.; Phi, T.L.; Hadri, H.E.; Grassl, B.; Reynaud, S. Current opinion: What is a nanoplastic? Environ. Pollut. 2018, 235, 1030–1034. [Google Scholar] [CrossRef]
  7. Thompson, R.C.; Olsen, Y.; Mitchell, R.P.; Davis, A.; Rowland, S.J.; John, A.W.G.; McGonigle, D.; Russell, A.E. Lost at sea: Where is all the plastic? Science 2004, 304, 838. [Google Scholar] [CrossRef]
  8. Kik, K.; Bukowska, B.; Sicińska, P. Polystyrene nanoparticles: Sources, occurrence in the environment, distribution in tissues, accumulation and toxicity to various organisms. Environ. Pollut. 2020, 262, 114297. [Google Scholar] [CrossRef]
  9. Laganà, P.; Caruso, G.; Corsi, I.; Bergami, E.; Venuti, V.; Majolino, D.; La Ferla, R.; Azzaro, M.; Cappello, S. Do plastics serve as a possible vector for the spread of antibiotic resistance? First insights from bacteria associated to a polystyrene piece from King George Island (Antarctica). Int. J. Hyg. Environ. Health 2019, 222, 89–100. [Google Scholar] [CrossRef]
  10. Lithner, D.; Larsson, A.; Dave, G. Environmental and health hazard ranking and assessment of plastic polymers based on chemical composition. Sci. Total Environ. 2011, 409, 3309–3324. [Google Scholar] [CrossRef]
  11. Syranidou, E.; Karkanorachaki, K.; Amorotti, F.; Franchini, M.; Repouskou, E.; Kaliva, M.; Vamvakaki, M.; Kolvenbach, B.; Fava, F.; Corvini, P.F.-X.; et al. Biodegradation of weathered polystyrene films in seawater microcosms. Sci. Rep. 2017, 7, 17991. [Google Scholar] [CrossRef] [PubMed]
  12. Wan, J.; Chu, W.; Kok, Y.; Lee, C. Distribution of microplastics and nanoplastics in aquatic ecosystems and their impacts on aquatic organisms, with emphasis on microalgae. In Reviews of Environmental Contamination and Toxicology; de Voogt, P., Ed.; Springer: Berlin/Heidelberg, Germany, 2018; Volume 246, pp. 133–158. [Google Scholar]
  13. Gonçalves, J.M.; Bebianno, M.J. Nanoplastics impact on marine biota: A review. Environ. Pollut. 2021, 273, 116426. [Google Scholar] [CrossRef] [PubMed]
  14. Zaki, M.R.M.; Aris, A.Z. An overview of the effects of nanoplastics on marine organisms. Sci. Total Environ. 2022, 831, 154757. [Google Scholar] [CrossRef] [PubMed]
  15. Bitton, G.; Dutka, B.J. Introduction and review of microbial and biochemical toxicity screening procedures. In Toxicity Test Using Microorganisms, 1st ed.; Bitton, G., Dutka, B.J., Eds.; CRC Press: New York, NY, USA, 1986; pp. 1–8. [Google Scholar]
  16. Armbrust, E.V. The life of diatoms in the world’s oceans. Nature 2009, 459, 185–192. [Google Scholar] [CrossRef] [PubMed]
  17. Falkowski, P.; Katz, M.E.; Knoll, A.H.; Quigg, A.; Raven, J.A.; Schofield, O.; Taylor, F.J.R. The evolution of modern eukaryotic phytoplankton. Science 2004, 305, 354–360. [Google Scholar] [CrossRef]
  18. Granum, E.; Raven, J.A.; Leegood, R.C. How do marine diatoms fix 10 billion tonnes of inorganic carbon per year? Can. J. Bot. 2005, 83, 898–908. [Google Scholar] [CrossRef]
  19. De Stefano, L.; Rotiroti, L.; De Stefano, M.; Lamberti, A.; Lettieri, S.; Setaro, A.; Maddalena, P. Marine diatoms as optical biosensors. Biosens. Bioelectron. 2009, 24, 1580–1584. [Google Scholar] [CrossRef]
  20. Rimet, F. Recent views on river pollution and diatoms. Hydrobiologia 2012, 683, 1–24. [Google Scholar] [CrossRef]
  21. Tudesque, L.; Grenouillet, G.; Gevrey, M.; Khazraie, K.; Brosse, S. Influence of small-scale gold mining on French Guiana streams: Are diatom assemblages valid disturbance sensors? Ecol. Indic. 2012, 14, 100–106. [Google Scholar] [CrossRef]
  22. Sjollema, S.B.; Redondo-Hasselerharm, P.; Leslie, H.A.; Kraak, M.H.S.; Vethaak, A.D. Do plastic particles affect microalgal photosynthesis and growth? Aquat. Toxicol. 2016, 170, 259–261. [Google Scholar] [CrossRef]
  23. Bergami, E.; Pugnalini, S.; Vannuccini, M.L.; Manfra, L.; Faleri, C.; Savorelli, F.; Dawson, K.A.; Corsi, I. Long-term toxicity of surface-charged polystyrene nanoplastics to marine planktonic species Dunaliella tertiolecta and Artemia franciscana. Aquat. Toxicol. 2017, 189, 159–169. [Google Scholar] [CrossRef] [PubMed]
  24. González-Fernández, C.; Le Grand, F.; Bideau, A.; Huvet, A.; Paul-Pont, I.; Soudant, P. Nanoplastics exposure modulate lipid and pigment compositions in diatoms. Environ. Pollut. 2020, 262, 114274. [Google Scholar] [CrossRef] [PubMed]
  25. Khoshnamvand, M.; Hanachi, P.; Ashtiani, S.; Walker, T.R. Toxic effects of polystyrene nanoplastics on microalgae Chlorella vulgaris: Changes in biomass, photosynthetic pigments and morphology. Chemosphere 2021, 280, 130725. [Google Scholar] [CrossRef]
  26. Hazeem, L.J.; Yesilay, G.; Bououdina, M.; Perna, S.; Cetin, D.; Suludere, Z.; Barras, A.; Boukherroub, R. Investigation of the toxic effects of different polystyrene micro-and nanoplastics on microalgae Chlorella vulgaris by analysis of cell viability, pigment content, oxidative stress and ultrastructural changes. Mar. Pollut. Bull. 2020, 156, 111278. [Google Scholar] [CrossRef] [PubMed]
  27. Sendra, M.; Staffieri, E.; Yeste, P.M.; Moreno-Garrido, I.; Gatica, J.M.; Corsi, I.; Julián Blasco, J. Are the primary characteristics of polystyrene nanoplastics responsible for toxicity and ad/absorption in the marine diatom Phaeodactylum tricornutum? Environ. Pollut. 2019, 249, 610–619. [Google Scholar] [CrossRef] [PubMed]
  28. Wang, S.C.; Liu, F.F.; Huang, T.Y.; Fan, J.L.; Gao, Z.Y.; Liu, G.Z. Effects of nanoplastics on the dinoflagellate Amphidinium Carterae Hulburt from the perspectives of algal growth, oxidative stress and hemolysin production. Nanomaterials 2021, 11, 2471. [Google Scholar] [CrossRef] [PubMed]
  29. Zhao, T.; Tan, L.; Zhu, X.; Huang, W.; Wang, J. Size-dependent oxidative stress effect of nano/micro-scaled polystyrene on Karenia mikimotoi. Mar. Pollut. Bull. 2020, 154, 111074. [Google Scholar] [CrossRef]
  30. Venâncio, C.; Ferreira, I.; Martins, M.A.; Soares, A.M.V.M.; Lopes, I.; Oliveira, M. The effects of nanoplastics on marine plankton: A case study with polymethylmethacrylate. Ecotoxicol. Environ. Saf. 2019, 184, 109632. [Google Scholar] [CrossRef]
  31. Bellingeri, A.; Bergami, E.; Grassi, G.; Faleri, C.; Redondo-Hasselerharm, P.; Koelmans, A.A.; Corsi, I. Combined effects of nanoplastics and copper on the freshwater alga Raphidocelis subcapitata. Aquat. Toxicol. 2019, 210, 179–187. [Google Scholar] [CrossRef]
  32. Bhattacharya, P.; Lin, S.; Turner, J.P.; Ke, P.C. Physical adsorption of charged plastic nanoparticles affects algal photosynthesis. J. Phys. Chem. C 2010, 114, 16556–16561. [Google Scholar] [CrossRef]
  33. Chae, Y.; Kim, D.; Kim, S.W.; An, Y.J. Trophic transfer and individual impact of nano-sized polystyrene in a four-species freshwater food chain. Sci. Rep. 2018, 8, 284. [Google Scholar] [CrossRef] [PubMed]
  34. Nolte, T.M.; Hartmann, N.B.; Kleijn, J.M.; Garnæs, J.; van de Meent, D.; Hendriks, A.J.; Baun, A. The toxicity of plastic nanoparticles to green algae as influenced by surface modification, medium hardness and cellular adsorption. Aquat. Toxicol. 2017, 183, 11–20. [Google Scholar] [CrossRef] [PubMed]
  35. Gomes, T.; Almeida, A.C.; Georgantzopoulou, A. Characterization of cell responses in Rhodomonas baltica exposed to PMMA nanoplastics. Sci. Total Environ. 2020, 726, 138547. [Google Scholar] [CrossRef] [PubMed]
  36. Guillard, R.R.L. Culture of phytoplankton for feeding marine invertebrates. In Culture of Marine Invertebrate Animals, Proceedings of the 1st Conference on Culture of Marine Invertebrate Animals Greenport, New York, NY, USA, October 1972; Smith, W.L., Chanley, M.H., Eds.; Springer: Boston, MA, USA, 1975; pp. 29–60. [Google Scholar]
  37. Al-Sid-Cheikh, M.; Rowland, S.J.; Stevenson, K.; Rouleau, C.; Henry, T.B.; Thompson, R.C. Uptake, whole-body distribution, and depuration of nanoplastics by the scallop Pecten maximus at environmentally realistic concentrations. Environ. Sci. Technol. 2018, 52, 14480–14486. [Google Scholar] [CrossRef]
  38. Organisation for Economic Cooperation and Development. OECD Test No. 201. Freshwater algae and cyanobacteria, growth inhibition test. In OECD Guidelines for the Testing of Chemicals, Section 2. Effects on Biotic Systems; Organisation for Economic Cooperation and Development: Paris, France, 2011. [Google Scholar]
  39. Cvjetko, P.; Milošić, A.; Domijan, A.M.; Vinković, I.V.; Tolić, S.; Štefanić, P.P.; Letofsky-Papst, I.; Tkalec, M.; Balen, B. Toxicity of silver ions and differently coated silver nanoparticles in Allium cepa roots. Ecotoxicol. Environ. Saf. 2017, 137, 18–28. [Google Scholar] [CrossRef]
  40. Hong, Y.; Hu, H.Y.; Xie, X.; Sakoda, A.; Sagehashi, M.; Li, F.M. Gramine-induced growth inhibition, oxidative damage and antioxidant responses in freshwater cyanobacterium Microcystis aeruginosa. Aquat. Toxicol. 2009, 91, 262–269. [Google Scholar] [CrossRef]
  41. Beauchamp, C.; Fridovich, I. Superoxide dismutase: Improved assay and an assay applicable to PAGE. Anal. Biochem. 1971, 44, 276–287. [Google Scholar] [CrossRef]
  42. Nakano, Y.; Asada, K. Hydrogen peroxide is scavenged by ascorbate-specific peroxidase in spinach chloroplasts. Plant Cell Physiol. 1981, 22, 867–880. [Google Scholar] [CrossRef]
  43. Aebi, H. Catalase in vitro. Methods Enzymol. 1984, 105, 121–126. [Google Scholar]
  44. Heath, R.L.; Packer, L. Photoperoxidation in isolated chloroplasts. I. Kinetics and stechiometry of fatty acid peroxidation. Arch. Biochem. Biophys. 1968, 125, 189–198. [Google Scholar] [CrossRef]
  45. Hertz, H. Über die Berührung fester elastischer Körper. Gruyter 2009, 92, 156–171. [Google Scholar] [CrossRef]
  46. Hutter, J.L.; Bechhoefer, J. Calibration of atomic-force microscope tips. Rev. Sci. Instrum. 1993, 64, 1868–1873. [Google Scholar] [CrossRef]
  47. Balnois, E.; Wilkinson, K.J. Sample preparation techniques for the observation of environmental biopolymers by atomic force microscopy. Colloid. Surf. A 2022, 207, 229–242. [Google Scholar] [CrossRef]
  48. Mišić Radić, T.; Svetličić, V.; Žutić, V.; Boulgaropoulos, B. Seawater at the nanoscale: Marine gel imaged by atomic force microscopy. J. Mol. Recognit. 2011, 24, 397–405. [Google Scholar] [CrossRef]
  49. Mišić Radić, T.; Čačković, A.; Penezić, A.; Dautović, J.; Lončar, J.; Omanović, D.; Juraić, K.; Ljubešić, Z. Physiological and morphological response of marine diatom Cylindrotheca closterium (Bacillariophyceae) exposed to cadmium. Eur. J. Phycol. 2021, 56, 24–36. [Google Scholar] [CrossRef]
  50. Tallec, K.; Blard, O.; González-Fernández, C.; Brotons, G.; Berchel, M.; Soudant, P.; Huvet, A.; Paul-Pont, I. Surface functionalization determines behavior of nanoplastic solutions in model aquatic environments. Chemosphere 2019, 225, 639–646. [Google Scholar] [CrossRef]
  51. El Badawy, A.M.; Luxton, T.P.; Silva, R.G.; Scheckel, K.G.; Suidan, M.T.; Tolaymat, T.M. Impact of environmental conditions (pH, ionic strength, and electrolyte type) on the surface charge and aggregation of silver nanoparticles suspensions. Environ. Sci. Technol. 2010, 44, 1260–1266. [Google Scholar] [CrossRef]
  52. Yu, S.J.; Shen, M.H.; Li, S.S.; Fu, Y.J.; Zhang, D.; Liu, H.Y.; Liu, J.F. Aggregation kinetics of different surface-modified polystyrene nanoparticles in monovalent and divalent electrolytes. Environ. Pollut. 2019, 255, 113302. [Google Scholar] [CrossRef]
  53. Saavedra, J.; Stoll, S.; Slaveykova, V.I. Influence of nanoplastic surface charge on eco-corona formation, aggregation and toxicity to freshwater zooplankton. Environ. Pollut. 2019, 252, 715–722. [Google Scholar] [CrossRef]
  54. Summers, S.; Gutierrez, T.; Henry, T. Agglomeration of nano- and microplastic particles in seawater by autochthonous and de novo-produced sources of exopolymeric substances. Mar. Pollut. Bull. 2018, 130, 258–267. [Google Scholar] [CrossRef]
  55. Lin, S.; Mortimer, M.; Chen, R.; Kakinen, A.; Riviere, J.E.; Davis, T.P.; Ding, F.; Ke, P.C. NanoEHS beyond toxicity–focusing on biocorona. Environ. Sci. Nano 2017, 4, 1433–1454. [Google Scholar] [CrossRef] [PubMed]
  56. Besseling, E.; Wang, B.; Lürling, M.; Koelmans, A.A. Nanoplastic affects growth of S. obliquus and reproduction of D. magna. Environ. Sci. Technol. 2014, 48, 12336–12343. [Google Scholar] [CrossRef] [PubMed]
  57. Nugnes, R.; Lavorgna, M.; Orlo, E.; Russo, C.; Isidori, M. Toxic impact of polystyrene microplastic particles in freshwater organisms. Chemosphere 2022, 299, 134373. [Google Scholar] [CrossRef] [PubMed]
  58. Biba, R.; Košpić, K.; Komazec, B.; Markulin, D.; Cvjetko, P.; Pavoković, D.; Peharec Štefanić, P.; Tkalec, M.; Balen, B. Surface coating-modulated phytotoxic responses of silver nanoparticles in plants and freshwater green algae. Nanomaterials 2022, 12, 24. [Google Scholar] [CrossRef]
  59. Liu, Z.; Huang, Y.; Jiao, Y.; Chen, Q.; Wu, D.; Yu, P.; Li, Y.; Cai, M.; Zhao, Y. Polystyrene nanoplastic induces ROS production and affects the MAPK-HIF-1/NFkB-mediated antioxidant system in Daphnia pulex. Aquat Toxicol. 2020, 220, 105420. [Google Scholar] [CrossRef]
  60. Demir, I.; Blockx, J.; Dague, E.; Guiraud, P.; Thielemans, W.; Muylaert, K.; Formosa-Dague, C. Nanoscale evidence unravels microalgae flocculation mechanism induced by chitosan. ACS Appl. Bio. Mater. 2020, 3, 8446–8459. [Google Scholar] [CrossRef]
  61. Formosa-Dague, C.; Gernigon, V.; Castelain, M.; Daboussi, F.; Guiraud, P. Towards a better understanding of the flocculation/flotation mechanism of the marine microalgae Phaeodactylum tricornutum under increased pH using atomic force microscopy. Algal Res. 2018, 33, 369–378. [Google Scholar] [CrossRef]
  62. Francius, G.; Tesson, B.; Dague, E.; Martin-Jézéquel, V.; Dufrêne, Y.F. Nanostructure and nanomechanics of live Phaeodactylum tricornutum morphotypes. Environ. Microbiol. 2018, 10, 1344–1356. [Google Scholar] [CrossRef]
  63. Ma, J.; Zhou, B.; Duan, D.; Pan, K. Salinity-dependent nanostructures and composition of cell surface and its relation to Cd toxicity in an estuarine diatom. Chemosphere 2019, 215, 807–814. [Google Scholar] [CrossRef]
  64. Novosel, N.; Mišić Radić, T.; Levak Zorinc, M.; Zemla, J.; Lekka, M.; Vrana, I.; Gašparović, B.; Horvat, L.; Kasum, D.; Legović, T.; et al. Salinity induced chemical, mechanical and behavioral changes in marine microalgae. J. Appl. Phycol. 2022, 34, 1293–1309. [Google Scholar] [CrossRef]
  65. Novosel, N.; Mišić Radić, T.; Zemla, J.; Lekka, M.; Čačković, A.; Kasum, D.; Legović, T.; Žutinić, P.; Gligora Udovič, M.; Ivošević DeNardis, N. Temperature-induced response in algal cell surface properties and behaviour: An experimental approach. J. Appl. Phycol. 2022, 34, 243–259. [Google Scholar] [CrossRef]
  66. Vrana, I.; Bakija Alempijević, S.; Novosel, N.; Ivošević DeNardis, N.; Žigon, D.; Ogrinc, N.; Gašparović, B. Hyposalinity induces significant polar lipid remodeling in the marine microalga Dunaliella tertiolecta (Chlorophyceae). J. Appl. Phycol. 2022, 34, 1457–1470. [Google Scholar] [CrossRef]
  67. Yap, B.H.J.; Crawford, S.A.; Dagastine, R.R.; Scales, P.J.; Martin, G.J.O. Nitrogen deprivation of microalgae: Effect on cell size, cell wall thickness, cell strength, and resistance to mechanical disruption. J. Ind. Microbiol. Biotechnol. 2016, 43, 1671–1680. [Google Scholar] [CrossRef]
  68. Ivošević DeNardis, N.; Pečar Ilić, J.; Ružić, I.; Novosel, N.; Mišić Radić, T.; Weber, A.; Kasum, D.; Pavlinska, Z.; Balogh, R.K.; Hajdu, B.; et al. Algal cell response to laboratory-induced cadmium stress: A multimethod approach. Eur. Biophys. J. 2019, 48, 231–248. [Google Scholar] [CrossRef]
  69. Underwood, G.J.C.; Boulcott, M.; Raines, C.A.; Waldron, K. Environmental effects on exopolymer production by marine benthic diatoms: Dynamics, changes in composition, and pathways of production. J. Phycol. 2004, 40, 293–304. [Google Scholar] [CrossRef]
  70. Underwood, G.J.C.; Paterson, D.M. The importance of extracellular carbohydrate production by marine epipelic diatoms. Adv. Bot. Res. 2003, 40, 184–240. [Google Scholar] [CrossRef]
  71. Pletikapić, G.; Mišić Radić, T.; Hozić Zimmermann, A.; Svetličić, V.; Pfannkuchen, M.; Marić, D.; Godrijan, J.; Žutić, V. AFM imaging of extracellular polymer release by marine diatom Cylindrotheca closterium (Ehrenberg) Reiman & J.C. Lewin. J. Mol. Recognit. 2011, 24, 436–445. [Google Scholar] [CrossRef]
  72. Urbani, R.; Magaletti, E.; Sist, P.; Cicero, A.M. Extracellular carbohydrates released by the marine diatoms Cylindrotheca closterium, Thalassiosira pseudonana and Skeletonema costatum: Effect of P-depletion and growth status. Sci. Total. Environ. 2005, 353, 300–306. [Google Scholar] [CrossRef]
  73. Mishra, A.; Kavita, K.; Jha, B. Characterization of extracellular polymeric substances produced by micro-algae Dunaliella salina. Carbohydr. Polym. 2011, 83, 852–857. [Google Scholar] [CrossRef]
  74. Pletikapić, G.; Vinković Vrček, I.; Žutić, V.; Svetličić, V. Atomic force microscopy characterization of silver nanoparticles interactions with marine diatom cells and extracellular polymeric substance. J. Mol. Recognit. 2012, 25, 309–317. [Google Scholar] [CrossRef]
Figure 1. AFM characterization of amine-modified polystyrene nanoparticles (PS-NH2 NPs) and carboxyl-modified polystyrene nanoparticles (PS-COOH NPs) in ultrapure water. AFM height images of PS-NH2 (a,b) and PS-COOH nanoplastics (c,d) in ultrapure water (50 mg L−1). The enlarged views of boxed areas in (a) and (c) are shown as (b) and (d), respectively. Vertical profiles of particles along indicated lines in (b,d) are shown next to the corresponding images (line crossing particle in AFM image and belonging vertical profile are shown in the same color and indicated by the same number). Images were acquired using the tapping mode in air, with scan sizes of 5 µm × 5 µm (a,c) and 1 µm × 1 µm (b,d), and a vertical scale of 75 nm.
Water 14 02163 g001
Figure 2. AFM characterization of PS-NH2 and PS-COOH nanoplastics in natural seawater. AFM images of PS-NH2 (a,b) and PS-COOH nanoplastics (c,d) in filtered natural seawater (50 mg L−1), with corresponding vertical profiles along the indicated lines in (b) and (d), respectively. Vertical profiles of particles along indicated lines in (b,d) are shown next to the corresponding image (line crossing particle in (b) and corresponding vertical profile is shown in the same color and indicated by the same number in the corresponding vertical profile). Images are acquired using the tapping mode in air and are presented as amplitude (a,c) and height data (b,d), with scan sizes of 5 µm × 5 µm (a,b); 2 µm × 2 µm (c,d) and vertical scales of 85 nm (b) and 170 nm (d).
Water 14 02163 g002
Figure 3. Growth dynamics of Cylindrotheca closterium when exposed to nanoplastics. Growth curves of C. closterium exposed to PS-NH2 (0–5 μg mL−1) (a) and PS-COOH (0–200 μg mL−1) nanoplastics (b), as measured by cell density over a 14-day period. Mean values of duplicate determinations with standard deviations are shown.
Water 14 02163 g003
Figure 4. ROS level in Cylindrotheca closterium exposed to PS-NH2 and PS-COOH nanoplastics. Boxplots showing ROS molecule content, quantified through fluorescence intensity quantification for dihydroethidium (DHE) (a) and 2′,7′-dichlorodihydrofluorescein diacetate (H2DCFDA) (b) in C. closterium cultures in the exponential growth phase (day 7), when exposed to PS-NH2 NPs (5 µg mL−1) and PS-COOH NPs (200 µg mL−1). Values are expressed as a percentage (%) of control; a box with whiskers represents a median ± interquartile range (Q3–Q1). If boxes are marked with different letters, the treatments are significantly different at p ≤ 0.05 (a general linear model, followed by the Newman–Keuls post hoc test).
Water 14 02163 g004
Figure 5. Antioxidant enzyme activities of Cylindrotheca closterium exposed to PS-NH2 and PS-COOH nanoplastics. Boxplots showing the differences in specific activity of superoxide dismutase (SOD) (a), pyrogallol peroxidase (PPX) (b), ascorbate peroxidase (APX) (c), and catalase (CAT) (d) in C. closterium cultures in the exponential growth phase (day 7), when exposed to PS-NH2 NPs (5 µg mL−1) and PS-COOH NPs (200 µg mL−1). Values are expressed as a percentage of control; a box with whiskers represents a median ± interquartile range (Q3–Q1). If boxes are marked with different letters, the treatments are significantly different at p ≤ 0.05 (general linear model, followed by the Newman-Keuls post hoc test).
Water 14 02163 g005
Figure 6. Lipid peroxidation levels in Cylindrotheca closterium when exposed to PS-NH2 and PS-COOH nanoplastics. Boxplots showing the content of malondialdehyde (MDA) in C. closterium cultures in the exponential growth phase (day 7) exposed to PS-NH2 NPs (5 µg mL−1) and PS-COOH NPs (200 µg mL−1). Values are expressed as a percentage of control; a box with whiskers represents a median ± interquartile range (Q3–Q1). If the boxes are marked with different letters, the treatments are significantly different at p ≤ 0.05 (a general linear model, followed by a Newman-Keuls post hoc test).
Water 14 02163 g006
Figure 7. Nanomechanical characterization of Cylindrotheca closterium exposed to PS-NH2 and PS-COOH nanoplastics. Histograms showing the distribution of Ym values of C. closterium cells in the exponential growth phase (day 7) in control culture (a), in the culture exposed to PS-NH2 NPs (5.0 µg mL−1) (b), and in the culture exposed to PS-COOH NPs (200 µg mL−1) (c), on 5 cells for each culture (all values are presented in the Supplementary Material, Table S2). Boxplots show the distribution of Ym values recorded in each case (d). A box with whiskers represents a median ± interquartile range (Q3–Q1). Statistical significance was obtained from an unpaired t-test at the level of 0.001 (*** p < 0.001).
Water 14 02163 g007
Figure 8. AFM images of Cylindrotheca closterium cell from control culture. AFM images of the whole C. closterium cell (a) and its morphological details (bd). Vertical profiles along indicated lines in (d) along girdle band (red line, number 1) and valve (blue line, number 2) are shown next to image. Images are acquired using contact mode in air with scan sizes: 40 µm × 40 µm (a), 15 µm × 15 µm (b), 3 µm × 3 µm (c,d) and presented as deflection (ac) and height data (d). Letters V, G, and R indicate the following features: valve, girdle band, and raphe opening, respectively.
Water 14 02163 g008
Figure 9. AFM images of a Cylindrotheca closterium cell exposed to PS-NH2 and PS-COOH nanoplastics. An AFM deflection image (a) and 3D height image of the boxed area (b) of C. closterium exposed to PS-NH2 (5 µg mL−1), with a vertical profile along the indicated line. Vertical profiles of nanoplastic particles along indicated lines in (b,d) are shown next to the corresponding image (line crossing particle in (b) and corresponding vertical profile is shown in the same color and indicated by the same number). The AFM deflection image (c) and 3D-height image of the boxed area (d) of C. closterium exposed to PS-COOH (200 µg mL−1), with a vertical profile along the indicated line. The images were acquired using the contact mode in air, with scan sizes of 5 µm × 5 µm (a), 3.5 µm × 3.5 µm, vertical scale 700 nm (b), 40 µm × 40 µm (c), and 8 µm × 8 µm, vertical scale 1.4 µm (d).
Water 14 02163 g009
Figure 10. Interaction of the extracellular polymers of Cylindrotheca closterium with PS-NH2 and PS-COOH nanoplastics. AFM images of the rostra part of Cylindrotheca closterium cells with excreted EPS, in control culture (a,b), in a culture exposed to PS-NH2 NPs (5 µg mL−1) (c,d), and in a culture exposed to PS-COOH NPs (200 µg mL−1) (e,f). Images are acquired using the contact mode in air and are presented as the deflection data (a,c,e) and height data (b,d,f) of areas indicated with a box in the corresponding deflection images (a,c,e), with belonging vertical profiles along the indicated lines in (b,d,f). Scan sizes: 10 µm × 10 µm (a), 2 µm × 2 µm, vertical scale 6 nm (b), 10 µm × 10 µm (c), 2 µm × 2 µm, vertical scale 65 nm (d), 15 µm × 15 µm (e), and 10 µm × 10 µm, vertical scale 1 µm (f).
Water 14 02163 g010
Table 1. Specific growth rates (µ) and growth inhibition (I) of Cylindrotheca closterium exposed to different concentrations of PS-NH2 and PS-COOH NPs between day 3 (D3), day 4 (D4), day 9 (D9), day 14 (D14), and day 0.
Nanoplasticsγ(NP)/µg mL−1Specific Growth Rates µ/d−1Growth Inhibitions I/%
D3D4D9D14D3D4D9D14
PS-NH200.400.360.270.18----
1.50.350.330.260.1812.58.33.70
2.50.340.340.260.1815.05.53.70
3.50.260.250.250.1835.030.57.40
5.00.090.090.230.1777.575.014.85.6
PS-COOH00.390.380.260.18----
100.330.370.260.1815.45.300
500.260.280.250.1833.326.33.80
1000.240.260.250.1838.531.63.80
2000.190.250.250.1851.334.23.80
Publisher’s Note: MDPI stays neutral with regard to jurisdictional claims in published maps and institutional affiliations.

