
Analysis of Regulatory Framework for Produced Water Management and Reuse in Major Oil- and Gas-Producing Regions in the United States


Department of Civil Engineering, New Mexico State University, Las Cruces, NM 88003, USA
*
Author to whom correspondence should be addressed.
Water 2022, 14(14), 2162; https://doi.org/10.3390/w14142162
Submission received: 28 May 2022
/
Revised: 26 June 2022
/
Accepted: 2 July 2022
/
Published: 8 July 2022
(This article belongs to the Special Issue Advanced Technologies for Produced Water Management, Treatment, and Reuse)
Abstract
:The rapid development of unconventional oil and gas (O&G) extraction around the world produces a significant amount of wastewater that requires appropriate management and disposal. Produced water (PW) is primarily disposed of through saltwater disposal wells, and other reuse/disposal methods include using PW for hydraulic fracturing, enhanced oil recovery, well drilling, evaporation ponds or seepage pits within the O&G field, and transferring PW offsite for management or reuse. Currently, 1–2% of PW in the U.S. is used outside the O&G field after treatment. With the considerable interest in PW reuse to reduce environmental implications and alleviate regional water scarcity, it is imperative to analyze the current regulatory framework for PW management and reuse. In the U.S., PW is subject to a complex set of federal, state, and sometimes local regulations to address the wide range of PW management, construction, and operation practices. Under the supervision of the U.S. Environment Protection Agency (U.S. EPA), different states have their own regulatory agencies and requirements based on state-specific practices and laws. This study analyzed the regulatory framework in major O&G-producing regions surrounding the management of PW, including relevant laws and jurisdictional illustrations of water rules and responsibilities, water quality standards, and PW disposal and current/potential beneficial reuse up to early 2022. The selected eastern states (based on the 98th meridian designated by the U.S. EPA as a tool to separate discharge permitting) include the Appalachian Basin (Marcellus and Utica shale areas of Pennsylvania, Ohio, and West Virginia), Oklahoma, and Texas; and the western states include California, Colorado, New Mexico, and Wyoming. These regions represent different regulations; climates; water quantities; quality diversities; and geologic, geographic, and hydrologic conditions. This review is particularly focused on the water quality standards, reuse practices and scenarios, risks assessment, knowledge gaps, and research needs for the potential reuse of treated PW outside of O&G fields. Given the complexity surrounding PW regulations and rules, this study is intended as preliminary guidance for PW management, and for identifying the knowledge gaps and research needs to reduce the potential impacts of treated PW reuse on the environment and public health. The regulations and experiences learned from these case studies would significantly benefit other states and countries with O&G sources for the protection of their environment and public health.
1. Introduction
A significant amount of produced water (PW) is brought to the land surface during oil and gas (O&G) exploration and production [1]. PW is primarily composed of reservoir water extracted from rock formation (i.e., formation water); it may also include a portion of the frac fluid returned to the surface after hydraulic fracturing (i.e., HF flowback water) or the water injected for enhanced oil recovery (EOR). PW contains the naturally occurring constituents from the hydrocarbon-bearing strata, such as salts, minerals, metals, ammonia, hydrogen sulfide, organics (e.g., oil and grease, total petroleum hydrocarbons, volatile and semi-volatile organic compounds), radionuclides, and any chemicals added downhole or during well drilling, production, or maintenance processes (e.g., acid, biocide, breaker, clay stabilizer, corrosion inhibitor, crosslinker, friction reducer, gelling agent, and surfactant).
Because of the complex chemistry characteristics of PW [2,3,4], the primary disposal option for PW in the U.S. and Canada is deep well injection [5,6,7]. Other reuse or disposal methods include using PW for HF, EOR, well drilling, evaporation ponds or seepage pits within the O&G field, transferring PW offsite for disposal, and discharge or reuse after proper treatment [3,8,9,10]. The non-injection methods are especially used in areas that lack deep injection wells (e.g., Pennsylvania in the U.S., Europe, and China) due to geological structure or regulations. In the U.S., approximately 1–2% of PW is used outside of the O&G field [11,12,13]. Reuse of PW with lower salinity mainly occurs in the western U.S., such as in California and Wyoming, because of the severe droughts and applicable regulations. Approximately 20 billion barrels (3180 × 106 m3) of PW will be generated by the onshore O&G activities in the U.S. in 2022. Approximately 41% of the PW will be reinjected for EOR, 47% will be disposed of using SWD wells, and 13% will be reused for fracking operations [8].
With the increased O&G development, underground disposal practices are not sustainable and have caused environmental concerns (e.g., seismicity activities and groundwater contamination) [14]. Further, because 38% of shale resources in the world are located in semi-arid or arid regions [15], the large amount of PW disposed of as waste has the potential to be treated and reused to alleviate regional chronic water scarcity [12,16]. It is recognized that PW reuse inside the O&G field, such as for HF, is the most promising approach because it requires minimal treatment and has relatively low risks of causing adverse effects on the ecosystem and human health [17,18]. However, the PW volume may exceed the water requirement for internal uses [19]. For example, it was estimated that the PW volume in the Delaware Basin, New Mexico, and Texas exceeded HF water demand by 3.7 times [20]. Thus, extra treated PW can be used outside of the O&G field for irrigation, livestock watering, land application, and other usages after proper treatment. The PW treatment methods are mainly based on water quality, such as suspended solids, total dissolved solids (TDS), metals, organic contaminants, and radionuclides. The commonly used methods include settling, filtration, coagulation, oxidation, distillation, and biological treatment [10,12]. The detailed PW characterization and treatment methods can be found in other reviews [3,10,21].
Another major concern for PW management is its possible contamination of soil, surface water, and groundwater through spills or leakages during its transportation for disposal, treatment, or recycling [6,22]. For example, 113 environmental spills of PW were reported in 2015 in the Duvernay shale region, Canada [23]. Moreover, recent studies raised concerns about the contamination of underground sources of drinking water due to acid stimulation and HF in the U.S., such as in the Pavillion Field, Wyoming [24], and the Permian Basin in West Texas [25]. Further, the laboratory data from the U.S. and Canada have shown that exposure to PW causes a series of problems, such as inhibiting the survival and reproduction of aquatic animals (e.g., zebrafish [26] and rainbow trout [27]), and results in functional impairment in exposed animals [28]. Another study assessed potential surface water impacts that could occur downstream of saltwater disposal well (SWD) injection facilities in West Virginia [29]. The study reported increased antagonist activities downstream of a SWD injection site, which could disrupt reproduction and/or development in aquatic animals [29].
Although numerous studies focused on the evaluation of reusing treated PW, the regulations for PW reuse from government agencies around the world are very limited [9]. Common water regulations or guidelines are focused on water applications, such as the United States Environmental Protection Agency (U.S. EPA) drinking water standards and guidelines for irrigation [30], and the European Union water quality directive for ground water (80/68/EEC). However, based on a study by Danforth et al. [31], more than 1000 chemicals in the PW have no U.S. EPA-approved analytical methods for detection or quantification in the regulatory context, which means the current regulations may not be sufficient to monitor treated PW quality to assure its safe reuse outside the O&G field. All these studies suggest that regulatory agencies should establish a comprehensive monitoring and evaluation program to assess the impacts and risks of reusing treated PW on groundwater, surface water, ecological systems, and potential public health before its reuse outside of the O&G field.
Critical review and analysis of PW management, regulations, and reuse scenarios (inside and outside the O&G field) in the major production regions in the U.S. would assist the O&G industry and regulators in better understanding the challenges for PW reuse, addressing the knowledge gap, and providing information to establish suitable regulations. The experiences learned from the case studies can be used by other states in the U.S. or countries and regions for establishing PW management and reuse programs. For example, in China, the study of the impact of the HF water cycle on the environment is in the early stage, and the research for solutions and regulations to achieve more sustainable unconventional O&G development has just emerged [9,32].
In the U.S., nearly every aspect of the PW cycle is subject to a complex set of federal, state, and sometimes local regulations to address the wide range of management, construction, and operation practices. Regulations are involved in permitting water sourcing (e.g., water rights), transportation (e.g., pipeline and trucking), storage (e.g., tank construction and secondary containment), disposition (e.g., discharge to surface water, wastewater treatment facilities, underground injection), and beneficial use within and outside of O&G fields. Figure 1 illustrates the key points for PW management and reuse.
In the U.S., two federal regulatory programs are associated with PW management, as shown in Figure 2. The first federal regulation is the National Pollutant Discharge Elimination System (NPDES) program. Through the Clean Water Act (CWA), the U.S. Congress directs the U.S. EPA to create an NPDES permitting, compliance, and enforcement program that regulates discharges of PW to surface water bodies (e.g., rivers, lakes, and streams). The NPDES program also regulates PW discharged to a municipal wastewater treatment facility to meet the requirements for pretreatment and any additional standards imposed by the facility. PW discharged to a centralized wastewater treatment (CWT) facility must meet standards established in its NPDES or state discharge permit. NPDES water quality permits are either issued by the U.S. EPA or by states that have been delegated by the U.S. EPA to issue their own permits. Most PW in the east of the 98th meridian (Figure 3) cannot be discharged directly from an O&G well site. It can be treated offsite in a CWT facility, and then discharged if the facility has been issued an NPDES (or state-equivalent) permit [17]. In contrast, for the wells located in the west of the 98th meridian, the NPDES exemption allows for the release of PW for beneficial uses such as wildlife or livestock watering or other agricultural uses if it is “of good enough quality”, meeting the minimum oil and grease limit of 35 mg/L and other parameters [33].
The second federal regulation is the Underground Injection Control (UIC) program. Through the Safe Drinking Water Act (SDWA), the U.S. Congress directs the U.S. EPA to develop the UIC program to regulate disposal in injection wells to protect America’s drinking water sources. Most oil- and gas-producing states have received the authority to implement UIC under agreements with the U.S. EPA. The UIC program is designed to protect underground drinking water aquifers through the regulation of six classes of injection wells. Wells used for injecting PW are Class II wells, including Class II-R wells for EOR and Class II-D wells for disposal in a formation below a drinking water aquifer and other than the producing formation.
PW is primarily regulated at the state level when the states receive primacy to administer the NPDES or UIC programs. The states can modify the regulatory programs based on state-specific practices and laws [33]. For example, some states do not allow moving water from one basin to another due to the constraints of water rights. Therefore, each of the 31 states with O&G production can have different regulations; they can be more restrictive than federal regulations, and can include regulations for activities not covered by federal regulations [33]. In addition to O&G agencies or state environmental protection agencies, public health agencies, state engineers, or regional water planning commissions may also be involved in regulating PW. Thus, in the U.S., it is imperative to analyze the current regulatory framework for PW management, which requires new levels of coordination and planning between federal and state agencies, inter-organizations, or across states for inter-state basins, such as the Permian and the Appalachian. The information and experience from different states can be used as references and guidelines for new PW reuse projects.
This study aims to provide an overview of current PW production, management practices with regulations, and reuse scenarios in the major production areas in the U.S. We analyzed the regulatory framework surrounding the management of PW, including relevant laws and jurisdictional illustrations of water rules and responsibilities, water quality standards, and PW disposal and beneficial reuse up to 2022. Given the complexity surrounding PW regulations and rules, this study is intended as preliminary guidance for PW management, and for identifying the knowledge gaps and research needs to reduce the potential impacts of PW reuse on the environment and public health. The establishment of regulations in the U.S. would significantly benefit other regions/countries with an interest to develop unconventional O&G.
2. Materials and Methods
The investigated production areas are selected based on the 98th meridian as shown in Figure 3. The 98th meridian has long been designated by the U.S. EPA as a tool to separate discharge-permitting under NPDES rules. The eastern states (east or on of the 98th meridian) include the Appalachian Basin (Marcellus and Utica shale areas of Pennsylvania, Ohio, and West Virginia), Oklahoma, and Texas; and the western states (west of the 98th meridian) include California, Colorado, New Mexico, and Wyoming. These regions are selected to represent different regulations; climates; water quantities; quality diversities; and geologic, geographic, and hydrologic conditions.
This study involves a comprehensive literature review from peer-reviewed manuscripts, technical reports, engineering contracts, government reports, news releases, databases of national and regional water resources and water quality, and information provided by the industry partners and regulatory agencies through the New Mexico Produced Water Research Consortium (NMPWRC). The NMPWRC was created by the New Mexico Environment Department (NMED) and New Mexico State University (NMSU) to develop a framework to fill scientific and technical knowledge gaps necessary to establish regulations and policies for the treatment and reuse of PW outside of the O&G fields. This study summarizes the existing regulatory framework, water quality standards, and risk assessment. It aims to identify the knowledge gaps to inform policy decisions for the potential safe reuse of treated PW outside of O&G fields.
3. Results and Discussion
Table 1 summarizes the PW regulatory agencies in the selected states with major O&G production activities. Table 2 summarizes the PW production and management practices in the selected states. The information in Table 1 and Table 2 will be discussed in detail in each section. Water quality limits for reusing PW for irrigation, wildlife and livestock watering, discharge to surface water, road application, dust control, and groundwater standards are discussed. The detailed application standards are summarized in Supporting Information.
3.1. PW Management in the East or on of the 98th Meridian
For the eastern states, because the direct discharge of PW to the surface water is prohibited, PW is usually managed through reuse within the O&G field, injection for EOR, disposal through SWD, and treatment in CWT facilities. In Pennsylvania, because of the poor geology for underground injection, a high percentage (~90%, in 2017) of PW is reused, and the rest is either treated through CWT facilities or sent to West Virginia and Ohio for disposal. More PW was injected for disposal in West Virginia and Ohio, ~56% and ~89%, respectively, in 2017. Ohio usually accepts PW from nearby states (Pennsylvania, New York, and West Virginia) for deep well injection because it has more SWD wells [13]. Although PW can be reused outside of the O&G field in the west part of Oklahoma and Texas (states on the 98th meridian), the feasibility is still under the investigation phase in these two states. Oklahoma has ample freshwater resources and SWD wells; thus, a large amount of PW was managed through deep well injection (41.7%) and injected for EOR (44.9%) in 2017. However, the increased seismicity activities urged the state to find alternative methods for PW management. Texas has a similar situation as Oklahoma; 46.1% and 36.2% of PW were injected for EOR and for disposal in 2017, respectively. With the increased seismicity activities, and part of west Texas currently being under a drought condition, the reuse of PW outside of the O&G field would also significantly benefit the society [13].
3.1.1. Appalachian Basin
PW Production, Disposal, and Management in Appalachian Basin
The Appalachian formations of the Marcellus and Utica shale areas include Pennsylvania, Ohio, and West Virginia (Figure 3). In 2020, the Appalachian Basin produced approximately 24 million barrels (MMbbls) of oil and 12.3 trillion cubic feet (tcf) of natural gas, making it the highest gas-producing region in the U.S. [34]. The Appalachian Basin produced 105 MMbbls (16.8 × 10⁶ m3) of PW in 2017 [13]. One factor in accelerating PW management is the poor geology for disposal wells. Pennsylvania has limited the number of disposal wells, and so far, only has less than ten permitted disposal wells for PW. Due to limited disposal options and high disposal costs, Marcellus and Utica operators in Pennsylvania became early adopters of PW reuse. In the Appalachian Basin, flowback water is almost entirely recycled and reused to hydraulically fracture new wells because formation water can only provide a small fraction of the water needed for HF in this area. Generally, the PW in the basin is highly diluted with additional freshwater to make up the necessary volumes, thereby decreasing the treatment requirement of PW for HF. A small percentage of the flowback water is disposed of through underground injection wells regulated by the state/EPA, or treated to drinking water standards at state-permitted facilities [33,35].
The PW from the Marcellus Shale has a high TDS concentration (40,000–90,000 mg/L with long-term >120,000 mg/L), moderate-to-high scaling tendency (high Ca and Mg), but low total suspended solids (around 160 mg/L), which makes filtration reasonable. Hence, the PW quality in the Marcellus Shale is manageable and attractive for reuse. Most CWT facilities, such as Hillstone, HydroRecovery, and Reserved Environmental Services, still utilize chemical precipitation.
Sharing PW among producing companies is most common in Pennsylvania and West Virginia. PW may be transferred from one company without enough nearby completion operations to another company needing PW for reuse. Agreements to exchange water can reduce costs for both companies while reducing truck miles driven and water disposal. For example, Antero Resources had the largest desalination plant for PW reuse in the industry. The 60,000 barrels per day capacity plant in West Virginia costs approximately $500 million. The company has a water system to gather PW and distribute the treated water for reuse. Yet, Antero’s Clear Water facility was shuttered in 2019 due to the current low commodity price environment and operation challenges. The company was conducting an evaluation to look at all options to determine the most cost-effective ways for operations. Those options included resumption of the water cleaning efforts at the facility, blending with fresh water, and reusing or trucking water to injection wells [36].
However, concerns have arisen about whether surface owners may make a monetary claim on water transferred among operators. A second concern is whether the liability for spills is fully passed to the receiving company. An example is that the Hillstone Central Station Facility takes the water title once it enters the facility from the truck. The client takes the title of the treated water as it exits the facility and enters their vehicle. If any spills occur between the inlet or outlet of the facility, the midstream company is responsible. Despite these concerns, water sharing among producers smooths out the peaks and valleys of individual company water demands [33].
Based on the 2017 data [13], in Pennsylvania, approximately 96% of PW was reused within the O&G industry, 1.6% was discharged to surface water through CWT facilities, and 1.1% was injected for disposal. In West Virginia, around 29% of PW was reused within the O&G industry, 14% was injected for EOR, and 56% was injected for disposal. In Ohio, around 89% (46% from Ohio wells and 43% from out-of-state wells) of PW was injected for disposal, 9.1% was reused within the O&G industry, and 1.3% was injected for EOR. Underground injection mainly occurs in Ohio because it has much more PW injection wells (217 wells) in the Appalachian area. In 2019, Ohio Class II Underground Injection wells received a total of 43.4 million barrels of PW. Among these, 25.3 million barrels (58%) were from Ohio and 18.2 million barrels (42%) were from outside of Ohio (Pennsylvania, West Virginia, and New York) [37]. The Pennsylvania Department of Environmental Protection (DEP) data suggest that exploration and production (E&P) only sent 4.8 million barrels PW to injection [37]; much of the remainder was sent by centralized processing facilities. If the facilities did not have an outlet for recycled water, they would pay shipment for disposal to make room for more E&P water. Pennsylvania regulations do not require tracking the water after it is dropped off at a centralized processing facility, making recycle volumes look artificially higher than they are.
Discharges of treated PW may occur through CWT facilities offsite from O&G operations under industrial effluent limitation guidelines in 40 CFR Part 437 (65 Fed. Reg. 81300 (22 December 2000)). The U.S. EPA released a report in May 2018 listing the facilities in the region of the Marcellus and Utica plays with the permit to discharge treated PW [38]. However, not all discharge permits are issued by the U.S. EPA. Some are permitted under Part 437, and some of them are not currently permitted under Part 437, but the revised permit is expected to contain Part 437 limitations, and there are some other discharge permits issued by state agencies.
In Pennsylvania, the NPDES water discharge permit is issued by the Pennsylvania DEP, whereas the UIC program is regulated by the U.S. EPA [33]. In Ohio, the storage, recycling, treatment, processing, and disposal of brine and other waste substances are regulated by the Ohio Department of Nature Resources (ODNR) [33]. PW discharge in West Virginia is regulated by the West Virginia DEP [39], and the UIC program is managed by the Office of Oil and Gas under West Virginia Code Chapter 22 “Environmental Resources” [40].
PW Reuse Standards and Case Studies in Appalachian Basin
In Ohio, relators seek a writ of mandamus to compel the Respondents State of Ohio, its Governor, and officers within ODNR to comply with ORC § 1509.22(C) by promulgating rules and regulations prior to issuance of so-called “Chief’s Orders.” Chief’s Orders are used by the ODNR to allow the operation of privately-owned facilities for the storage, recycling, treatment, processing, and disposal of brine and other waste substances associated with O&G drilling [41].
West Virginia does not have a specific process for centralized treatment facilities; instead, they must seek input from the West Virginia DEP. For example, the Hillstone Central Station Facility had to demonstrate a zero liquids discharge status to the water department. All process liquids and any precipitation that come into contact with O&G contamination should be directed to the facility for treatment and beneficial reuse. An air permit is also required because rich volatile organic compounds (VOCs) content in the PW could emit over-regulated values.
In January 2021, the Pennsylvania DEP renewed the General Permit WMGR123—Processing and Beneficial Use of Oil and Gas Liquid Waste (First issued in 2012), which was issued under the Bureau of Waste Management Authority. For wastewaters with low TDS (i.e., less than 500 mg/L) that comply with standards found in the permit (Supporting Information, Table S1), which was derived from drinking water standards, the operator does not have to manage the waste as residual waste, and should utilize existing designs for impoundments and handling of the water. This approach would work for water generated at a well site and stored before transport to a recycling facility, and for recycled water treated and transported to a well site for reuse. These wastewaters with low TDS no longer have to be transported as residual waste. However, for high-TDS wastewater, which does not comply with the General Permit WMGR123, as shown in Table S1, it must be managed as residual waste. Both the generators and users of the recycled water should comply with the regulations on storage and transportation found at 25 PA Code § 299 and the permitting and design requirements for impoundments found in 25 PA Code Section 299.141 through 299.145. If either the generator of the waste or the party beneficially reusing the waste wishes to store the waste before either shipment or reuse, they need to comply with storage requirements that are generally more stringent than the requirements under the O&G regulations. Moreover, the permit holder must comply with several other requirements associated with the general permit. They include a bonding requirement, sampling requirements to determine whether the wastewaters comply with Table S1, facility siting requirements, and inspection and records requirements.
The Marcellus and Utica region has led other basins in the development of commercial water treatment plants. The commercial plants, some starting operations as early as 2010, typically take water from multiple producers. The plants treat and may store the water until it is needed for reuse. For instance, Eureka Resources has three commercial water treatment plants in Pennsylvania, which have served unconventional O&G producers in the Marcellus Shale for ten years. Although two of the plants have a permit to discharge treated water to the Susquehanna River, most of the water is reused for other O&G operations. The plants have a treatment capacity of 10,000 barrels per day (1590 m3/day). The treatment process generates little to no disposal of liquids. In addition to treating the water, one plant is also removing methanol from the water and reselling it for natural gas operations in the area. Another Eureka plant recovers sodium chloride and calcium chloride for industrial sales, establishing marketing and sales channels for co-product sales and revenue generation. Eureka Resources possesses a US patent for treating wastewater and recovering the salts. The method includes the steps of receiving wastewater, screening the wastewater to determine the optimal treatment approach, and pretreating the wastewater to an acceptable quality for thermal–mechanical crystallization/evaporation. Another embodiment is applied to recovering calcium chloride and lithium carbonate from the fluid; it includes processing the fluid through a second stage thermal–mechanical evaporation/crystallization unit. This unit is configured to generate high-purity CaCl2, distilled water, and a mixed reject stream [42]. According to Eureka Resources, a 50,000 barrel per day Eureka facility would produce ~250,000 metric tons (MT) per year of high-purity NaCl, ~20,000 MT per year of CaCl2, and 1250 MT per year of LiCl. Recovering minerals from PW is anticipated to provide economic benefits to offset PW treatment costs and environmental benefits by eliminating mining and minimizing waste disposal [43].
Besides centralized facilities, onsite treatment using portable units stationed on well sites can significantly reduce the truck traffic carrying wastewater. For example, Aquatech tested evaporation/distill technology to treat PW in southwestern Pennsylvania to provide recycled distilled water at Marcellus Shale drilling sites [44]. Aquatech’s mobile treatment unit treats water to a TDS of less than 500 mg/L.
Technologically Enhanced Naturally Occurring Radioactive Material Management and Waste Disposal in Appalachian Basin
PW may contain different levels of naturally occurring radioactive materials (NORM). The Marcellus shale, underlying Ohio, Pennsylvania, West Virginia, and New York, has been tested, showing high NORM [45]. Tanks, filters, pumps, pipes, hoses, and trucks that brine touches can all become contaminated, with the radium building up into a hardened “scale,” concentrating as high as 400,000 picocuries (pCi) per gram [45]. With fracking, which involves sending pressurized fluid deep underground to break up shale layers, there is dirt and shattered rock, called drill cuttings, that can also be radioactive.
There have been discussions about the Technologically Enhanced Naturally Occurring Radioactive Material (TENORM) management and waste disposal in the Appalachian Basin. Ohio can only accept waste that is 6.99 pCi/g combined radium 226/228 above background levels. West Virginia can accept up to 50 pCi/g combined (plus uncertainty), but requires testing on a per box basis. However, lab testing relies on a 21-day ingrowth, so there is a general lack of rapid TENORM management testing. Pennsylvania landfills can receive TENORM levels that are below the Department of Transportation hazard classification. Still, each landfill is limited on a monthly tonnage managed by the Pennsylvania DEP. Virtually all lower level (less than 50 µR/h, microroentgen/hour) TENORM waste generated in the Appalachian Basin is disposed of in Pennsylvania landfills. The waste over 50 µR/h is sent to the Austin Masters Services or sent out west to facilities that can accept higher levels. The cost and regulatory burden of TENORM waste management in the Appalachian Basin are high, which can be as much as $350 per ton [46,47].
Summary
PW treatment and reuse are extensively implemented in the Appalachian Basin due to limited disposal options, high disposal cost, and environmental concerns about the impacts on the ecosystem and human health. Sharing PW among producing companies is most common in Pennsylvania and West Virginia, whereas Ohio has much more injection wells for PW from inside and outside of the state. Centralized facilities often treat PW to drinking water or distillate quality standards. The water is then reused for well completions, injected into the hydrogeological cycle for EOR, or sent to industrial and municipal facilities to be combined with wastewater for discharge.
In Ohio, Chief’s Orders are used by ODNR to allow the operation of privately-owned facilities for the storage, recycling, treatment, processing, and disposal of brine and other waste substances associated with O&G drilling. West Virginia does not have a specific process for centralized treatment facilities; instead, they seek input from the West Virginia DEP. The Pennsylvania DEP renewed General Permit WMGR123—Processing and Beneficial Use of Oil and Gas Liquid Waste. Owing to high radioactive signatures detected in the brine, there has been a long and detailed discussion about TENORM management and waste disposal in the Appalachian Basin.
3.1.2. Oklahoma
PW Production, Disposal, and Management in Oklahoma
Oklahoma has about 5% and 8% of the U.S. proved crude oil reserves and natural gas reserves, respectively. The state was the fourth-largest onshore crude oil producer; it produced 171 MMbbls of oil and 2.8 tcf of gas in 2020 [34]. The primary producing plays in Oklahoma are principally located in the state’s Anadarko Basin, as shown in Figure 3.
The Anadarko Basin in western Oklahoma has been the site of increased oil production in recent years [48]. PW across the state has different characteristics based on the plays, such as water quantity and quality (salinity). For example, the Mississippi Lime has a high water-to-oil ratio, and the water has the highest salinity in the state; the Granite Wash and Tonkawa areas produce less water with lower salinity. Detailed information regarding the PW volumes injected and the TDS by county in Oklahoma can be found in “Oklahoma Water for 2060 PW Reuse and Recycling, Table 2-1”.
In Oklahoma, freshwater is available and relatively inexpensive; most of PW is disposed into UIC Class II wells. In 2014, nearly 1500 MMbbls (240 × 106 m3) of PW were disposed of underground in Oklahoma. In 2016, the underground injection of PW was reduced due to the Oklahoma Corporation Commission (OCC) regulations in critical areas to limit the volume of injections correlated with the seismic events in Oklahoma [18]. In 2017, 2844 MMbbls (455 × 106 m3) of PW were generated in Oklahoma; 1185 MMbbls (41.7%, 192 × 106 m3) of PW were disposed of through underground injection, 44.9% was injected for EOR, and 13.4% was managed through offsite commercial disposal [13].
Based on the U.S. Geological Survey (USGS) information [49], the number of earthquakes in the central U.S. has increased dramatically from 2009 to 2016. There was an average of 25 earthquakes of M 3.0 and larger in the center and the eastern U.S. between 1973–2008. Since 2009, at least 58 earthquakes of this size have occurred each year, and at least 100 earthquakes of this size have occurred every year since 2013. The rate peaked in 2015, with 1010 M 3+ earthquakes. Oklahoma is the most affected region, including the M 5.8 and M 5.0 Cushing Oklahoma earthquakes that occurred in 2016. Many studies have indicated that the increased earthquakes were induced by HF [14] and wastewater injection [50,51].
PW Reuse in Oklahoma
To reduce the number of induced earthquakes, PW management in Oklahoma has become an imperative task. In December 2015, Oklahoma Governor Mary Fallin launched a project to study and recommend alternatives to manage PW from O&G operations in Oklahoma. The Oklahoma Water Resources Board led the project, and 17 expert members formed the Produced Water Working Group (PWWG). In April 2017, the final report, “Oklahoma Water for 2060 PW Reuse and Recycling,” was published. The report was designed to evaluate the data, issues, and opportunities with PW in Oklahoma. It had two objectives: (1) to reduce the use of freshwater in O&G production; and (2) to reduce PW injection, potentially creating new water sources.
In the study, the PWWG investigated PW production in 66 counties and water quality in 29 counties in Oklahoma, the top 40 major water users in the state based on water permits, and the PW treatment costs for various volume levels and water quality levels for eight selected companies in Oklahoma. The PWWG identified a total of 17 scenarios based on the correlation between high PW volumes and entities requiring significant volumes of non-potable water for irrigation, power, mining, O&G use, industrial use, aquifer storage and recovery (ASR), and surface water discharge, as shown in Table S2. The PWWG further evaluated the primary advantages and disadvantages of each PW reuse alternative, and then developed ten representative cases of PW reuse or recycling in Oklahoma with potential treatment and disposal costs ranging from $0.57/barrel ($3.59/m3) of water to over $7/barrel ($44/m3) of water, as shown in Table S3. Potential uses of PW for agriculture/irrigation, ASR, and mining were determined unfeasible in Oklahoma due to the cost, seasonality, and regulation challenges. Thus, these scenarios were excluded from the cost estimation [18].
In addition, the U.S. EPA’s report for PW management, “Final Report: Summary of Input on Oil and Gas Extraction Wastewater Management Practices Under the Clean Water Act”, was published in May 2020. The industry indicated that unless PW has TDS concentrations of less than a few thousand mg/L, treatment using membranes (e.g., reverse osmosis) or distillation would be necessary to generate water suitable for agricultural uses or discharge to surface waters. The cost of such treatment is not currently competitive, whereas other wastewater management options are available [17]. The key findings from the Oklahoma 2017 report include:
PW reuse by the O&G industry is the most viable, cost-effective alternative due to minimal water treatment needs and low treatment costs. Over time, expanding the water distribution systems would reduce conveyance costs and further facilitate PW use for HF. An increase in inter-organizational planning and sharing of resources to improve reuse viability is required.
The PWWG evaluated a particular case of using surplus PW from the Mississippi Lime play area around Alfalfa County. The surplus could be gathered and conveyed to Blaine County sites for O&G reuse. The analysis showed it has the potential to be financially competitive with the underground injection, although the project could be technically and commercially complex.
Water treatment and desalination techniques of PW should be further investigated and developed. For example, low-cost evaporation techniques should be developed that can potentially limit water conveyance and provide a viable alternative to disposal.
PW Regulations in Oklahoma
In December 2018, the Oklahoma Department of Environmental Quality (ODEQ) applied for authorization from the U.S. EPA to take over NPDES primary enforcement authority for certain wastewaters discharges, including PW. The application could give ODEQ the authorization to issue permits that would allow oil producers to dispose of oil field PW in above-ground waterways, and the application has been approved by the U.S. EPA.
In May 2020, Oklahoma Governor Kevin Stitt signed the “Oil and Gas Produced Water and Waste Recycling and Reuse Act” into law (S.B.1875), and it became effective on 1 November 2020. The Act designates who owns and is responsible for PW and waste from oil and natural gas drilling and production operations; it encourages PW recycling and reuses in Oklahoma by alleviating much of the uncertainty regarding ownership of PW, which will reduce freshwater demand and lower saltwater injection volumes.
Summary
Most of the PW was disposed of through deep well injection in Oklahoma because of the availability of freshwater and Class II disposal wells. However, the increased number of seismic events induced by HF and PW disposal raised concerns regarding PW management. In 2017, the final report, “Oklahoma Water for 2060 PW Reuse and Recycling”, was published. The report suggested that PW reuse in the O&G field is the most viable, cost-effective alternative, and evaporation techniques need further investigation and development. In 2020, the Oklahoma Governor signed the “Oil and Gas PW and Waste Recycling and Reuse Act” into law (S.B.1875). The Act designates who owns and is responsible for PW and waste from oil and natural gas drilling and production operations. It encourages the efforts of PW recycling and reuses in Oklahoma by alleviating much of the uncertainty regarding ownership of PW, which would reduce freshwater demand and lower saltwater injection volumes in the future.
3.1.3. Texas
PW Production, Disposal, and Management in Texas
Texas is a leader in oil production in the U.S. and a significant contributor to increasing gas supplies. It produced 1782 MMbbls of oil and 10 tcf of gas in 2020 [52]. The production areas in Texas are shown in Figure 3, including the Permian Basin in West Texas; the Anadarko Basin/Granite Wash and Palo Duro (or Bend) Basins in the Panhandle; the Barnett Shale in the Fort Worth Basin; the Western Gulf Coast Basin in southwest Texas (which includes the Eagle Ford Shale); and the historic East Texas Field, which contains the Haynesville–Bossier Shale [53].
The average water-to-oil ratio in Texas is estimated to be 7:1 [52]. In 2017, 9895 MMbbls (1583 × 106 m3) of PW were generated in Texas, and PW was primarily managed through injection for EOR (46.1%) or disposal through SWD (36.2%). The Railroad Commission of Texas (RRC) and Texas Commission on Environmental Quality (TCEQ) were delegated the authority to regulate the UIC wells in 1982. Monthly reporting of volumes and pressures began in Texas on 1 January 1983. Over the decades, Texas has issued more than 54,700 permitted O&G injection and disposal wells, with approximately 34,200 currently active as of July 2015. Of these 34,200 active injection and disposal wells, about 8100 are wells that are used for disposal; the remainder (about 26,100) are injection wells [54].
Regulations on PW Discharge and Reuse in Texas
The data of current PW volumes for treatment, recycling, and reuse in Texas are variable and difficult to verify. Based on the IHS Markit, approximately 4–5% of PW is “treated and recycled” in the industry, and this number is expected to increase by nearly 16% over the next 4–5 years [55]. The 2019 Groundwater Protection Council report also provided PW reuse data for key basins across the US, showing that PW reuse is over 10% in the Permian Basin, but only 1% in the Eagle Ford Basin and negligible in the Haynesville Basin [33].
Statewide Rule 8 and Chapter 4, Subchapter B (Commercial Recycling), have been written and amended to encourage recycling in the oil field. The Commercial Recycling rules are divided into six separate divisions based on the type of O&G waste being treated, and the location and duration of the treatment operations. The Commercial Recycling rules focus on recycling drilling fluids and drilling muds for reuse in the well completion process, and recycling drilling solids for reuse as road base [56]. PW is regulated by Division 5 and 6. Off-Lease Fluid Recycling is limited to any location for a maximum of two years. The information must be submitted in the permit application, including but not limited to a diagram of the facility processing information, storage, and liner information. Stationary Fluid Recycling facilities are permitted for one location for up to five years. After five years, renewal of the permit may be requested [57].
The Texas legislature passed HB 3246 in May 2019 to address the recycling of fluid oil field waste (PW). The bill states that when fluid O&G waste is produced and used by or transferred to a person who takes possession of that waste for treating the waste for subsequent beneficial use, the waste is considered the property of the person who takes possession of it for treating the waste for subsequent beneficial use until the person transfers the waste or treated waste to another person for disposal or use. The legislation focuses on waste regulation and ensures that PW can be readily recycled by O&G operators and service companies unless otherwise expressly provided by a legally binding document.
Texas has over 100 facilities that provide waste treatment from O&G fields for storage, reclamation, treatment, or disposal of fluids or solid wastes transported to the facility. In 2018, only two facilities listed specifically handle “Fluids Recycling,” and they were both located in the RRC District (Midland) [53]. Large, centralized systems can treat large quantities of PW per day, thus providing an opportunity for PW treatment and reuse.
The treatment processes for PW depend on the application purpose. For subsequent fracturing operations, the treatment processes only include necessary chemical and mechanical treatment to eliminate oils and suspended solids, with the additional biocide or oxidizer to remove dissolved substances and biologics that may damage wells. Further treatment is necessary if the product water will be released into the environment. This additional treatment level may include the removal of organics, dissolved solids, and heavy metals [53].
Due to the existing federal NPDES requirements for onshore O&G operations in Texas, few discharges of PW are authorized. Any discharge would require both federal and state agency permits. In 2018, TCEQ issued a permit for PW discharges of onshore O&G operation (NPDES Permit No. TX0134061). These activities are subject to the Oil and Gas Extraction Point Source Category (40 CFR Part 435). Agricultural and Wildlife Water Use Subcategory allows the discharge of PW from facilities west of the 98th meridian for agricultural and wildlife propagation. To ensure that this discharge is of sufficient quality for livestock and wildlife water use, and, therefore, meets the requirements, some permits established a more stringent oil and grease limit of 10 mg/L monthly average, with a daily maximum limit of 15 mg/L. The limit is based on best professional judgment in accordance with 40 CFR 125.3(h)(1) and is consistent with other PW permits issued by other EPA regions. The EPA has established average monthly oil and grease limitations of 15 mg/L for these draft permits based on the region’s long-standing use of the 15 mg/L standards to represent the concentration at which a visible oil sheen is likely to occur [58]. The criterion for pH is between 6.5 and 9.0 for the water segment under Texas Administrative Code Title 30, Chapter 307. The prohibition of the discharge of floating solids or visible foam other than trace amounts is established in the permit. In addition, there shall be no discharge of visible films of oil, globules of oil, grease, or solids in or on the water, or coatings on stream banks [59].
The 98th meridian bisects Texas into land roughly east or west of Dallas. Under the current federal regulatory scheme, onshore discharges east of the 98th meridian are typically not authorized. In the report by the Texas Alliance of Energy Producers and the Independent Petroleum Association of America, it is suggested, “Some may consider this division anachronistic and not reflective of the current technological advances in recycling nor the need for site-specific permit conditions independent of broad national controls” [53].
In May of 2019, the Texas legislature passed HB 2771, which transferred duties and authority to TCEQ upon NPDES delegation from the U.S. EPA, as opposed to the RRC, for issuing permits for the discharge of PW, hydrostatic test water, and gas plant effluent resulting from certain O&G activities. It also directs the TCEQ to submit a request to the U.S. EPA to seek federal NPDES delegation to Texas of these types of discharges, eliminating the duplication of federal and state oversight. On 15 January 2021, the U.S. EPA approved the request.
PW Reuse in Texas
The reuse of PW outside of Texas’s O&G sector is still in the research phase. A cotton-growing project was conducted in Pecos using recycled PW from nearby oil and natural gas activity in the Delaware Basin [60]. This project’s coalition included the RRC, Texas A&M AgriLife Research, and Anadarko Petroleum Corporation. This study evaluated cotton growth and yield response to irrigating with treated PW blended with groundwater (1:4 ratio), and investigated the effect of treated PW on soil chemical properties. The TDS concentration of groundwater was 3200 mg/L, and treated PW with 98 mg/L TDS concentration. After blending, the irrigation water had a TDS concentration of 2470 mg/L with sodium 766 mg/L, chloride 1450 mg/L, calcium 127 mg/L, magnesium 40 mg/L, and bicarbonate 122 mg/L. Boron concentration in the treated PW was 4 mg/L and diluted to 0.8 mg/L after blending with groundwater. The sodium adsorption ratio of the groundwater, treated PW, and blended water was 17.4, 4.9, and 15.2, respectively. The results suggested that irrigating with treated PW blended with groundwater did not reduce cotton yield or lint quality. In addition, compared to groundwater irrigation, the blended PW reduced soil salinity parameters, such as conductivity, sodium, and chloride. Further studies are still required for the agricultural reuse of PW.
To provide a new water source for beneficial use in Texas, House Bill 2545 [61] was introduced to incentivize water desalination by providing a franchise tax credit to desalination operators who treat high-salinity water. The proposed franchise tax credits are $1 for every 1000 gallons ($0.26/m3) of source water treated by the permit holder if TDS is more than 3000 mg/L, and $5 and $17 per 1000 gallons ($1.32/m3–$4.49/m3) if at least 50% of the source water is over 70,000, 90,000 mg/L TDS. The proposed franchise tax credit may then be transferred to another eligible tax liability for credit only after the original tax credit recipient has satisfied its qualified tax obligation(s). The tax credit recipient may carry forward its credit for five consecutive reports (i.e., six years). However, this bill did not pass in 2019.
In June 2021, the Texas Produced Water Consortium (TxPWC) was established by Senate Bill 601 to study the economics and technologies related to beneficial uses of PW, and provide guidance for establishing PW permitting, regulations, and rules to better enable the use of PW in Texas.
Summary
The large volume of PW generated in Texas is injected for EOR or disposed of through SWD. Statewide Rule 8 and Chapter 4, Subchapter B, Commercial Recycling, have been written and amended to encourage recycling of PW in the O&G field. The legislation was passed to amend the Natural Resources Code that specifies that a person will not be liable for a recycled product that has been transferred to another person with the contractual understanding that the treated product will be used in connection with the drilling for, or production of, oil or gas.
Due to the existing federal NPDES requirements for onshore O&G operations, few PW discharges are authorized. In 2019, the Texas legislature passed HB 2771, which transferred duties and authority to TCEQ upon NPDES delegation from the U.S. EPA, as opposed to the RRC, for issuing permits for the discharge of PW resulting from certain O&G activities. In 2021, the EPA approved Texas’ request to administer the NPDES program for PW discharges, hydrostatic test water, and gas plant effluent or O&G discharges within the state of Texas. In the same year 2021, the TxPWC was established to study the economics, technologies, and environmental and public health considerations related to the beneficial uses of PW, and to provide guidance for establishing PW permitting and regulations in Texas.
3.2. PW Management in the West of the 98th Meridian
The western U.S. has been under severe and chronic drought, and the water used for O&G well development aggravated the drought problem. The treatment and reuse of PW inside and outside of the O&G field would significantly benefit arid and semiarid regions in the west of the U.S. [12]. Based on the Oil and Gas Extraction Effluent Guidelines and Standards (40 CFR Part 435 Subpart E), the discharge of treated PW to surface water for agriculture or wildlife beneficial reuse is allowed in the west of the 98th meridian in the U.S., including California, Colorado, New Mexico, and Wyoming.
These western states are either using or working actively to investigate the feasibility of reusing PW outside of the O&G fields. Currently, PW reuse for agriculture is primarily occurring in California and Wyoming. PW reuse in California is predominantly in the San Joaquin Valley due to low salinity in PW; around 11% of PW was used outside of the O&G field in California, 2017 [13]. Research has proved that treated PW can be safely used for agriculture without harming crops [62]. PW generated from coalbed methane (CBM) in Wyoming usually has low salinity, and 37% was discharged to surface water in 2017 [13]. A lesser percentage (5.5%) of PW was reused outside of the O&G field in Colorado, 2017. The use of treated PW for agriculture is under active investigation in Colorado. However, some research found adverse effects of treated PW for the soil and plants [63,64,65]. These results suggested that more treatments and toxicity studies are required for PW before it can be used for irrigation; some advanced treatment methods, such as membrane-based techniques, are required. For New Mexico, approximately 10% of PW was reused inside the O&G field, and currently, there is no PW reused outside of the O&G field [66]. New Mexico regulatory agencies are working with academia, environmental groups, and the industry to find suitable methods to reuse treated PW outside of the O&G field [67].
Further, more regulation agencies are involved in monitoring PW quality and quantity in these western states compared to the eastern states because of the reuse potential of PW outside of the O&G field.
3.2.1. California
PW Production, Disposal, and Management in California
California ranked seventh among the U.S. for oil production and produced 144 MMbbls of oil and 0.17 tcf of gas in 2020 [34]. California has about 76,000 active O&G production wells; more than half are in Kern County, one of the top oil-producing counties in the U.S. [68].
California Geologic Energy Management Division [69,70] has primary responsibility for ensuring the safe and environmentally protective development and recovery of energy resources. Following the passage of Senate Bill 1281 in 2014 [71], the California water boards (the State Water Resources Control Board (SWRCB) and the nine Regional Water Quality Control Boards (RWQCB), including the Central Valley Regional Water Quality Control Board (CVRWQCB)) have been increasingly allocated the resources necessary to provide active water quality oversight related to oil production activities in California, thereby providing a clearer picture of PW management.
On average, California’s O&G fields produce fifteen times as much water as oil [72]. In 2017, around 3100 MMbbls (496 × 106 m3) of PW were generated in California. PW management in California can be classified as: (1) injection for EOR (59.3%); (2) underground injection for disposal (22.4%); (3) reuse outside of the O&G industry (10.0%); (4) reuse inside of the O&G industry (5.1%); (5) surface discharge and evaporation (1.1%) [13]. California has 1219 pits, of which, 587 are active; most of the pits (1062 total, 476 active) are in the Central Valley, primarily in Kern County.
PW Reuse for Agricultural Irrigation in California
In California, the SWRCB and the nine RWQCB are responsible for protecting California’s waters. Among their many functions and duties, the SWRCB sets statewide policy, and the Regional Boards adopt Water Quality Control Plans or Basin Plans. According to the Waste Discharge Requirements General Order for oil field discharge to land, the PW discharge cannot exceed the Basin Plan’s maximum salinity limits for electrical conductivity (EC, 1000 µmhos/cm), chloride (200 mg/L), and boron (1 mg/L) [73]. The RWQCB, including the CVRWQCB, have also been given the authority to gather additional information by requiring reporting of all additives used or supplied to operators who operate wells that supply treated PW for reuse within the region to further inform analysis of the practice (California Water Code §13267.5). Public concerns about using PW in agriculture have also prompted the CVRWQCB to establish a Food Safety Expert Panel consisting of academics, regulators, and consulting scientists to review the practice, assess risk, and make recommendations [74]. California regulators prohibited PW from fracking for irrigation; only PW from conventional oil drilling can be applied for irrigation [75,76].
As described in the “Final Report: Task 1” prepared by GSI International for the CVRWQCB [62], “from December 2017 through September 2018, CVRWQCB staff issued Orders under California Water Code sections 13267 and 13267.5 to oil companies and chemical manufacturers and distributors. These Orders required, under penalty of perjury, each recipient to submit the chemical make-up of additives used during petroleum exploration, production, and treatment at facilities that use PW for irrigation of crops for human consumption.” The receipt of this data aided the preparation of a report by the Food Safety Expert Panel with the mission of preparing a report describing risks associated with the use of treated PW for the irrigation of edible crops, with a focus on crops irrigated in the Kern Sierran Foothills Subregion.
PW reuse in California is predominantly in the San Joaquin Valley due to low salinity in PW. The discharges of PW in this area are regulated by the Waste Discharge Requirements that conditionally allow the water to be used for irrigation and require monitoring. Examples of PW treatment in Kern County include mechanical separation, sedimentation, air floatation, and filtration (walnut hull vessels). These processes can remove and reduce petroleum hydrocarbons and other chemicals used during oil production activities before delivery to a water district. Another example of PW reuse is in the Arroyo Grande Oil Field [77]. The Arroyo Grande PW Reclamation Facility treats PW from a nearby oil field. The product water from the facility goes to irrigation use, whereas the unused treated water is discharged into nearby Pismo Creek, with volumes not to exceed 0.84 million gallons per day, according to an NPDES permit.
Risk Assessment of PW Reuse in California
Given California’s severe and persistent drought, reclaimed PW is recognized as a viable water source for beneficial use that can be expanded to supplement surface and groundwater resources. Therefore, risk assessment tools should be applied to rapidly identify PW quality suitable for blending with other freshwater sources to be used as irrigation water. A study of PW in the Cawelo Water District near Bakersfield was conducted to evaluate whether chemical components found in the district’s irrigation waterfall are within acceptable health and safety levels for its intended agricultural use. There were over 70 chemicals tested, including petroleum hydrocarbons, heavy metals, and radioisotopes. The results suggested that all the tested 70 chemicals were found at concentrations well within drinking water standards, and do not threaten irrigated plants, food safety, or human health [78]. Risk assessment used to develop the risk-based comparison (RBC) evaluated the potential for human health effects from potential exposure to chemicals of interest (COIs) in crops because of deposition from irrigation water into the soil and subsequent uptake from the soil into plant tissues. According to the SWRCB, no studies to date have shown that irrigating food crops with reclaimed PW poses any threat to public health [78].
A recent report in 2020 from the CVRWQCB Food Safety Expert Panel presents the results of a human health risk assessment performed to establish RBC levels of COIs in irrigation water containing reclaimed PW [79]. To establish RBC levels, a screening process was conducted to identify COIs based on their potential toxicological significance, with other COIs added at the request of the state regulatory agency that approves the use of reclaimed PW for irrigation. The assessment derived the recommended RBC levels for blended irrigation water using the most stringent target risk thresholds applied by the U.S. EPA and the state regulatory agency: a theoretical upper-bound incremental cancer risk of 1 × 10⁻⁶, which is 100 times lower than the upper end of the acceptable risk range applied by the U.S. EPA and other agencies. The recommended irrigation water RBC levels are listed in Table S4 (Original Report Table 15 [79]). Concentrations above the recommended RBC levels in irrigation water would warrant further assessment to determine whether they fall within the U.S. EPA and other agencies’ acceptable risk range. Data available from the California RWQCB dataset in fall 2015 show that measured concentrations of the COIs in blended irrigation water are all below the recommended RBC levels, indicating that the crops (almonds, pistachios, citrus, grapes, potatoes, and carrots) are suitable for human consumption under the regulatory agency’s recommended target risk thresholds [79].
The injection of PW from O&G activities into groundwater aquifers is in the process of being exempted in California. Independent scientific studies of HF and well stimulation in California reported a potential risk on groundwater quality in the San Joaquin Valley and the Los Angeles Basin [80,81,82]. It is suggested that the criteria from Underground Sources of Drinking Water in the EPA’s UIC Program should be used as a baseline to protect fresh and brackish groundwater in all states [80,83].
In 2016, Shonkoff et al. evaluated the list of 173 chemicals reported as used in oil fields from which PW is deployed for irrigation, watering livestock, and recharging groundwater in the San Joaquin Valley of California [84]. In 2020, GSI Environmental Inc. conducted subsequent technical work under the oversight of the California CVRWQCB [85]. GSI reviewed 399 known chemical additives and naturally occurring chemicals in PW, and selected 143 COIs for further evaluation in the context of PW reuse in agriculture irrigation and other potential sources of these chemicals in the agricultural water supply. The report from GSI stated that there did not appear to be significant differences between blended irrigation water and known levels in other sources of surface or groundwater and other sources of these chemicals. The sampling and chemical analysis of all crops irrigated with PW in the Central Valley showed 30 analytes detected. Although there did not appear to be any evidence of a difference between treated and control samples that can be attributed to PW, there is a need to conduct more research to monitor and evaluate the long-term impact of using treated PW for agricultural uses regarding a full spectrum of organic, inorganic, and other chemicals of concern in plants, soil, wildlife, and groundwater.
Summary
California’s O&G fields produce fifteen times as much water as oil. PW management can be classified into underground injection, EOR, reuse inside and outside of O&G fields, and surface discharge and evaporation. In California, only PW from conventional oil drilling is permitted for irrigation, and PW from fracking is prohibited for agricultural uses. A small portion of PW has been applied for local agricultural irrigation, primarily in the Kern Sierran Foothills Subregion. The discharges of PW to these districts are regulated by the Waste Discharge Requirements that conditionally allow the water used for irrigation and require monitoring.
The CVRWQCB applied risk assessment tools to identify O&G fields with PW quality suitable for blending with irrigation water. A study suggested that the detected 70 chemicals were found at concentrations well within drinking water standards and were evaluated as not posing a threat to irrigated plants, food safety, or human health. Although some studies indicated that detected chemicals in PW might have potential risks for human health, the research result from GSI Environmental Inc. suggested that there did not appear to be any evidence of a difference between treated and control samples attributed to PW. However, more independent, third-party studies should be conducted to assure the safeness of the reuse of treated PW for irrigation.
3.2.2. Colorado
PW Production and Disposal in Colorado
Colorado ranked 7th in natural gas production, with the sixth-largest natural gas reserve and one-fourth of economically recoverable CBM reserves in the nation [34]. The state also holds nearly 4% of the nation’s crude oil reserves, and 90% of the oil production was in the Niobrara Denver-Julesburg Basin in 2018 (Figure 3) [86]. Colorado’s annual crude oil and gas production was 165 MMbbls and 2 tcf in 2020, respectively [34]. In 2017, Colorado generated 310 MMbbls (49.6 × 10⁶ m3) of PW, and around 32.5% was injected for EOR, 47.1% was disposed of by injection, 5.5% was discharged to surface water, 6.0% was disposed through evaporation, and 8.9% was reused within the O&G industry [13].
PW Regulations in Colorado
Colorado has a unique water rights system in the west, with its own water court system [87]. The management of the O&G industry involves multiple state agencies, including the Colorado Oil and Gas Conservation Commission (COGCC), the Colorado Division of Water Resources (CDWR), the Water Quality Control Commission (WQCC), and the Water Quality Control Division (WQCD). After passing the amended SB 19-181 in April 2019, local government control has been notably increased to regulate O&G development in Colorado, enabling the power of land-use authority to enact and manage more restrictive “necessary and reasonable” regulations than the state does within its jurisdiction.
According to the Colorado Oil and Gas Conservation Act, the COGCC is directed to “Regulate the development and production of the natural resources of oil and gas in the state of Colorado in a manner that protects public health, safety, and welfare, including protection of the environment and wildlife resources.” Regulating O&G drilling, production, treatment, and disposal of waste (except commercial disposal facilities) falls into the jurisdiction of the COGCC. The COGCC has jurisdiction over permitting the Class II UIC wells (22 wells approved in 2019), pits (three pits approved in 2019), and non-commercial centralized waste management facilities accepting waste from the O&G field (two new approved and 54 active facilities in 2019) [88]. Pursuant to the Commission Rule 205A of COGCC, mineral developers must disclose chemical additives for HF to FracFocus, within 60 days after the conclusion of HF treatment and no more than 120 days after commencement.
The WQCC is responsible for implementing water quality classifications and standards for surface water and groundwater, and developing specific state water regulations and quality policies. The WQCD enforces such regulations, regulates discharge permitting, and provides oversight of commercial waste disposal facilities. Generally, the CDWR has jurisdiction over water rights (i.e., appropriation and distribution) adjudicated by the water courts and determination of their beneficial use. The construction of groundwater wells requires a permit from the CDWR to prevent pollution to state waters. The extraction of groundwater from CBM wells is considered beneficial and requires a permit from the CDWR, regardless of a tributary or non-tributary status. Subsequent beneficial use of extracted CBM water requires a well permit from the CDWR, justifying its appropriation of a water right. The CDWR well-permitting of withdrawal and beneficial use of groundwater for CBM wells and non-CBM wells is exhibited in Table S5.
PW Management in Colorado
Mitigation of groundwater contamination. Spills of PW onto surface land have often been caused by equipment malfunction or human error [22]. The COGCC uses an electronic form-filling system, including a Spill/Release Report (Form 19), to collect spill incidents in Colorado. Operators shall, immediately upon discovery, control and contain all spills/releases of exploration and production waste, gas, or produced fluids. A spill of more than five barrels (0.79 m3), regardless of whether it is within containment or outside of containment, and more than one barrel (0.16 m3) spill out of secondary containment, shall be reported within 24 h after detection of the spill (CO CRS §34-60-130). Regarding spill/release prevention in Colorado, a secondary containment shall be installed around all PW tanks containing PW with TDS more than 3500 mg/L (CO CRS §34-60-603).
The evaluation of PW generation and PW spilled in Weld County demonstrated that the total surface of PW spill has a linear correlation with the scale of drilling production [89]. To understand and monitor potential groundwater contamination from drilling, mainly a result of surface spills and well casing failures [90,91], the COGCC sets concentration levels for both shallow (unconfined) and deep (confined) aquifers, along with the WQCC standards and classifications, to ensure compliance with groundwater standards (Table S6) and adjacent soils standards (Table S7).
Underground Injection Control (UIC). The COGCC, delegated by the U.S. EPA, has the authority to regulate Class II UIC wells by permitting and monitoring PW injection as “dedicated injection wells” for disposal or EOR. Thirty and twenty-two UIC well permits were issued in 2018 and 2019, respectively. The COGCC works closely with the WQCD to prevent groundwater contamination from UIC wells and, in union with the U.S. Geological Survey Earthquake Notification Service, to continuously monitor the potential local seismicity related to the PW injection. In 2017 and 2018, approximately 50% of PW was injected into Class II UIC wells either for disposal or EOR, and the percentage increased to 70% in 2019.
Dust Control. As industrial reuse of PW is generally viewed as a viable use in the Colorado Water Law system, the use of PW (TDS < 3500 mg/L and excluding flowback fluids) in dust and ice control, viewed as disposal, is allowed in the same geologic basin on operators’ lease roads without a permit, as long as it is from a non-tributary basin (CO CRS § 37-90-137). It is worth mentioning that the average TDS concentrations of CBM and the unconventional Niobrara Denver-Julesburg basin PW usually have TDS greater than 3500 mg/L, which is not suitable for land application or dust control. A relatively small amount of PW for dust suppression was reported in 2017 and 2018 on the O&G lease roads. The adjacent soil around the roads must meet the qualification requirements listed in Table S7 (CO CRS §34-60-910). Samples from comparable, nearby non-impacted native soil must be collected and analyzed for purposes of establishing background soil conditions, including pH and EC. Where the EC of the impacted soil exceeds 4 mS/cm or 2× background (Table S7), the sodium adsorption ratio (SAR) must also be determined.
Pits and surface water discharge. Most of the PW that is not injected through UIC wells is disposed of in pits through evaporation/percolation, with pretreatment to prevent crude oil and condensate from entering the properly permitted lined or unlined pit or surface discharge. Unlined pits have been restricted to a certain date (Rule 904a) and in certain conditions (Rule 902). Unlined pits shall not be constructed in areas where pathways for communication with groundwater or surface water are likely to exist, except as allowed under Rule 902. Permitting pits may be allowed on-site for various purposes, e.g., to contain drill cuttings and PW, and for reuse and recycling of PW. The COGCC is responsible for permitting (Form 15), monitoring and evaluation, and overseeing the closure of pits. New pit applications have significantly decreased (only two and three new approvals for 2018 and 2019, respectively), in coincidence with decreased O&G activities in areas with a tradition of PW disposal using pits, and the adoption of “pitless” drilling and completion activities in Colorado.
PW may also be discharged into state surface water bodies under a Colorado Discharge Permit System (CDPS) under the jurisdiction of the WQCD, in accordance with the national 40 CFR 435 and 437 standards. The CDPS general permit COG-840000 covers only PW (from conventional and CBM production) discharge to surface waters from the Centralized Exploration and Production Waste Management Facility, used exclusively by one owner/operator or by more operators under an operating agreement, and the Commercial Disposal Facility (offsite). The numerical limitations and monitoring are determined on a site-specific basis. The effluent limits (numeric and narrative) are based on several guidelines, including the 40 CFR 435 standards, the water quality standards of the receiving water, site-specific review of the disposal facility information, the state’s basic standards and methodologies for surface water, and the WQCD’s policies and guidelines. The applicable numeric limits are either statewide or site-specific, including general parameters, organic compounds, metals, radionuclide parameters, and other pollutants that are applicable, whereas the narrative water quality limits are mainly for the protection of irrigated crops, livestock watering (TDS < 3500 mg/L), and aquatic life (Whole Effluent Toxicity testing).
Reuse of PW outside of the O&G fields. PW has been widely reused inside the O&G fields in Colorado, including for EOR and drilling. The CDWR has jurisdiction over appropriations of water for various beneficial uses. The first beneficial reuse of PW outside of the O&G field was reported in Wellington [92]. The treated PW was used to augment the shallow aquifer to ensure adequate drinking water resources for a nearby city. Three major steps were required to secure the water right of PW reuse: (1) obtain a beneficial use permit from the CDWR (confirmed PW as non-tributary in this case); (2) pass preliminary effluent limit determination for surface discharge in WQCD, and obtain a discharge permit from the COGCC; and (3) obtain a vested water right from the water court.
Though using PW for irrigation purposes has not been adopted in Colorado, studies assessing such feasibility have been investigated [93]. A study investigated the utility and feasibility of treated PW from the Niobrara Denver-Julesburg basin as irrigation water for salt-tolerant crops, e.g., switchgrass and rapeseed. The results showed that treated PW with TDS < 3500 mg/L and relatively low organic content are necessary to maintain biomass yield and plant health [94].
Summary
The COGCC, WQCC, WQCD, and CDWR shared jurisdiction with local governments for the management of PW in Colorado. Groundwater contamination associated with PW is a primary environmental concern in Colorado, with its monitoring and mitigation administrated by the COGCC. The disposal of PW occurs primarily through Class II UIC well injection, pits, and surface discharge, plus a small fraction for dust suppression applied on the O&G lease roads. Colorado recognizes the reuse of PW as a viable beneficial use, e.g., aquifer recharge. Currently, the application of PW for agricultural irrigation is under active investigation.
3.2.3. Wyoming
CBM PW Production in Wyoming
Wyoming is in a semiarid climate and occasionally experiences water shortage in some areas affected by the current drought cycle. Wyoming’s annual crude oil and gas production was 89 MMbbls and 1.4 tcf in 2020, respectively [34]. CBM wells are treated separately from conventional natural gas production. According to the Wyoming State Geological Survey, the total recoverable CBM resources are estimated at 31.7 tcf, equal to one-third of the total recoverable CBM resources in the U.S. [95]. PW from coal seams has been a vital groundwater resource suitable for beneficial reuse. The relatively low TDS content of the CBM PW in Wyoming often enables subsequent discharge into surface streams or beneficial reuse, such as agricultural irrigation, aquifer recharge, and land application. In 2017, 1700 MMbbls (272 × 106 m3) of PW were generated in Wyoming, and 46% was injected for EOR, 14% was injected for disposal, 37% was discharged to surface water, and the rest was managed by evaporation or offsite commercial disposal [13].
CBM PW Regulations in Wyoming
The O&G industry is under the oversight of the Wyoming Oil and Gas Conservation Commission (WOGCC). The WOGCC holds the authority to regulate drilling and plugging wells to protect O&G formation from water intrusion, prevent contamination of freshwater resources, and regulate PW containment, storage, treatment, and disposal inside O&G fields. In Wyoming statutes, PW includes formation water from the O&G reservoir, injected water, and any chemical additives added during the production and treatment process.
The Wyoming State Engineer’s Office (WSEO) supervises the allocation of water resources (quantity). The CBM PW has been designated as a beneficial use of groundwater in Wyoming for decades, and follows the same application process for groundwater within the jurisdiction of WSEO to appropriate the groundwater, in conjunction with a permit from the WOGCC for CBM production. The WSEO must approve the application for a Permit to Appropriate Ground Water (Form U.W.5) before drilling any CBM well. It details specific management scenarios of CBM PW when it is further used as a direct source for another beneficial use, such as water production for CBM only (no additional permit required); for stock watering; for discharge into surface reservoir directly; for O&G well drilling and stimulation/enhancement, dust control, and compaction; for industrial processes; for irrigation; and for aquifer and recovery wells. If not proposed for further beneficial use by any developer, CBM PW is considered as surface supply (i.e., discharge to surface or to new/existing reservoir), and is governed by laws about surface water, which requires additional permitting requirements from the WSEO Surface Water Division. Once CBM PW becomes the water of the state (passed an NPDES discharge point), no permit is required for land applications.
The Wyoming Department of Environmental Quality (WDEQ) also participates in the discharge and use of all PW (quality). A discharge permit from WDEQ is required for the O&G production facility to meet specific standards and requirements. Moreover, the discharge of treated PW must comply with the U.S. EPA effluent guidelines and NPDES standards. After the discharge point, treated PW is considered the property of the state. In the western states, the split of property regimes is common, where land ownership (surface) and estate minerals (underlying) belong to separate entities [96,97], which expands the number of stakeholders involved during O&G development [98]. A legal contract including a description of surface use and damage agreements is required in Wyoming between the surface owner and mineral developer, which highlights the prominent role of landowners during O&G activities [98].
Only Colorado and Wyoming in the Rocky Mountain states require water rights for CBM production. The water rights system in Wyoming focuses on permitting to protect prior appropriation (ensuring senior water rights are not interfered with by CBM PW production). It allows simple disposal for O&G producers once the water reaches the surface [99], whereas further beneficial use of CBM PW or reservation/storage for future use is viewed as a disposal option for producers, and has been a challenge. In doing so, most of the PW extracted has been wasted/disposed of after CBM production, which, if appropriately reused, could preserve household and livestock well capacities for future beneficial use [100].
CBM PW Management and Reuse in Wyoming
The quality of CBM PW in the PRB declines from the south and east basin edges, with water quality close to drinking water level and EC and SAR suitable for irrigation. The west and north regions have relatively low water quality, including one or more water quality parameters exceeding reuse standards (e.g., TDS for drinking, EC for irrigation of sensitive plants, and SAR for irrigation) [95,101]. In practice, surface discharge and irrigation are executed in eastern PRB.
Surface water discharge. The discharge of CBM PW into surface streams is allowed in Wyoming as long as it bears “good enough quality” for watering livestock or wildlife. Effluent limits are required for CBM PW surface discharge to protect livestock and wildlife consumption, including chloride 2000 mg/L, sulfate 3000 mg/L, specific conductance 7500 μS/cm, oil and grease 10 mg/L, pH 6.5–9.0, and total recoverable radium 226 of 60 pCi/L.
The WDEQ can grant a temporary surface discharge of CBM PW under two conditions: less than a six-month discharge (additional one-time six-months extension/renewal) into a reservoir for livestock watering, as emergency water to livestock; or a 15-day discharge permit for CBM PW characterization, which must occur greater than 0.5 miles from a perennial water body with a discharge rate less than 0.5 cubic feet per second. The effluent limits include 1000 µg/L dissolved iron, pH 6.5–9, chloride 2000 mg/L, total recoverable arsenic 150 µg/L, and specific conductivity 7500 µS/cm.
Groundwater injection. The CBM PW can be injected into shallow aquifers bearing TDS < 10,000 mg/L or <5000 mg/L through UIC Class V wells by mineral developers administered by the WDEQ. Rules and regulations in chapter sixteen of the Wyoming Water Quality Division must be met to obtain the injection permit to construct and operate a CBM PW injection well. The injection is not common in the PRB due to the complex management of multiple producing zones and numerous mineral developers [102], except in the city of Gillette, which uses CBM PW for partial replenishment of the city’s potable water resource [103].
Dust control and road application. Although no permit was required under the NPDES program for the application of CBM PW for dust control, approval from the WOGCC must be obtained. CBM PW spreading on roads for dust control is usually mixed with magnesium chloride. In addition, dust control activities on public lands must comply with applicable Bureau of Land Management requirements and local government requirements.
WDEQ also stated that “When no other alternative is reasonably available for disposal of limited quantities of wastewater or exploration and production exempt oily wastes, a Road Application of Waste or Wastewater permit may be requested.” The water quality analysis of PW and PW-contaminated soils includes radium 226, benzene, TDS, arsenic, total metals, and other constituents determined to be appropriate by the WOGCC (Table S8).
Irrigation. Due to the continuous drought in the PRB, irrigation using CBM PW is encouraged. Most of the CBM PW directly used for agricultural irrigation does not satisfy sustainability criteria for irrigation water, and, therefore, a managed irrigation system is required [104]. Table S9 summarizes the scenarios of CBM PW used for irrigation in Wyoming.
The WDEQ has set up a permitting guideline in the PRB for the discharge of CBM PW to irrigated lands under different scenarios. SAR and salinity are the primary concerns, particularly for the ephemeral channel (SAR limit 3–10) (Table S9). Scenario 3 in Table S9 provides guidelines for ephemeral streams that previously conveyed flood irrigation water that leached salts out of the soil. Turning an ephemeral stream into a perennial stream by CBM PW discharge may adversely affect the soil and plants (i.e., salt mobilization from poor quality soil, bank erosion, disruption to the existing ecosystem) [99]. A significant increase in EC, SAR, and exchangeable sodium percent was reported in fine-textured soil after 1~4 years of irrigation of CBM PW [105]. Therefore, the EC threshold is calculated by dividing the median value tested or the published soil EC threshold value by 1.5 (Table S9).
CBM PW treatment and soil amendment are general approaches for the managed irrigation system, e.g., lowering Na+ content, SAR, and alkalinity in CBM water; application of gypsum (exchange Na+) and sulfur (alkalinity reduction) to soil [106]. Gypsum can increase Ca2+ content in the soil system, competing for exchange sites on a clay surface, with Na+ to be leached out by flooding and irrigation events [107]. The application of elemental sulfur can decrease the soil pH and promote the dissolution of calcite to release Ca2+.
Land application. A land application permit is required for each site, along with the landowner’s approval in Wyoming. The land application of CBM PW was reported to increase forage production and enhance recharging shallow groundwater aquifers [102]. However, multi-year direct land application of CBM PW can alter soil characteristics with a continuous increase of soil EC and SAR, and decrease native plant species [108,109]. The biological effects of CBM PW land applications were complex and site-specific, indicating site-specific management approaches for land applications.
The previous land application permits focused on general water chemistry and inorganic constitutes. The new permit (WDEQ Permit No. 19-283, issued to Encore Green, LLC, 2020), although specified for treated PW in Laramie County outside of PRB, signified a much more stringent trend, including a numeric limit on a total of 159 water constituents the treated PW shall not exceed before land applications: general, inorganic, and radionuclides (43); volatile organic compounds, semi-volatile organic compounds, and polyaromatic hydrocarbons (91); and pesticides (25). The new permit for land application in Wyoming added a substantial number of organic contaminants. The details of the constituents and permitted range/limit are summarized in Table S10.
Impoundment. The practice of impoundment is for the disposal of CBM PW through infiltration and evaporation, not genuinely constituting beneficial use [99], except occasionally for livestock watering. Impoundment must be approved by WOGCC and WDEQ; the CBM PW quality is regulated by the WDEQ’s Wyoming Pollutant Discharge Elimination System. The potential pollution of groundwater has been identified due to unlined infiltration impoundment of CBM PW in Wyoming, primarily due to the infiltrating water acting as a solvent to leach constituents (e.g., sulfate salts, selenium) in the subsurface and transporting them into groundwater [95,110].
Summary
In the PRB, several management options have been executed, including impoundment, surface discharge, aquifer injection, road spreading, irrigation, and land application. The discharge of CBM PW into surface streams is allowed in Wyoming. The CBM PW can be injected into shallow aquifers through Class V wells, and no permit is required for road spreading. The direct use of CBM PW for irrigation may result in soil salinity and sodicity. The feasibility of using CBM PW for managed irrigation has been demonstrated with appropriate soil physical/chemical amendments. The direct land application of CBM PW does not meet irrigation water sustainability criteria and requires water, soil, and plant management. The new land application permit in Wyoming contains much more stringent requirements with a substantial number of water constituents.
The management of PW is three-fold in Wyoming, with WOGCC regulating activities inside the O&G field, the WSEO supervising appropriation and distribution (quantity), and the WDEQ managing the discharge and use of PW (quality).
3.2.4. New Mexico
PW Production, Disposal, and Management in New Mexico
New Mexico (NM) has more than 7% and 5% of the nation’s proved crude oil reserves and natural gas reserves, respectively. It is the second-largest onshore oil-producing state and accounted for more than 9% of the nation’s crude oil production [111]. In 2020, the total oil production of NM reached 380 MMbbls, which has increased more than five-fold since 2009 (61 MMbbls). In 2020, NM was the eighth-largest gas-producing state and produced more than 2.0 trillion cubic feet or about 5% of the U.S. gross withdrawals of natural gas [111]. The Permian Basin, located in the eastern NM and western Texas (Figure 3), is one of the most prolific petroleum-producing areas in the U.S. and the world [112].
Advanced drilling and oil recovery technologies have increased oil production in the Permian Basin. However, the large amount of water used for HF, along with the large volumes of PW generated during well production, has brought concerns in NM, a semiarid state that suffers from chronic droughts and water shortage [113]. It is estimated that up to 10 million gallons (38,000 m3) of water may be needed to frack one well, depending on several factors, such as its location, well type, and the operator [114,115]. In NM, freshwater comes from either surface water or groundwater, e.g., the Pecos River and Ogallala Aquifer in the Permian Basin. In order to reduce stress on NM’s water resources due to O&G production, effective on 13 October 2020, OCD Rule 19.15.16.19(B) requires that producers shall disclose water use (quantity for PW, freshwater, brackish water, and saline water) to the OCD within 45 days after completion, recompletion, or other HF of a well. According to the OCD Water Use Report Summary, as of 30 December 2021, the average freshwater use for HF was reduced from 20% in 2020 to 10% in 2021.
In the Permian Basin, three to four times of PW may be generated for every barrel of oil produced. In 2019, about 1203 MMbbls (191 × 106 m3) and 37 MMbbls (5.9 × 10⁶ m3) of PW were generated in the NM Permian Basin and San Juan Basin, respectively [115,116]. However, in 2019, only about 10% of all PW generated in NM was being reused or recycled in O&G operations; eventually, all PW was treated as wastewater and was discharged through permitted UIC wells for EOR or disposal by SWD wells [117]. No PW has been permitted for use outside of O&G production activities in NM. With continued O&G development, underground disposal practices are not sustainable and have been linked to other environmental challenges (e.g., seismicity activities) [14]. Because freshwater supplies are dwindling, the reuse of the billions of gallons of treated PW may significantly benefit arid regions such as NM. One key factor that affects treated PW reuse is its quality, such as TDS, pH, organic contaminants, metals, naturally occurring radioactive material (NORM), chemicals added during HF, and toxicity [4]. The average TDS concentration varies based on the location and place, but is typically about 100,000–120,000 mg/L.
Produced Water Regulation in New Mexico
Under the Oil and Gas Act (Chapter 70 NMSA 1978), the Oil Conservation Division (OCD) within the Energy, Minerals and Natural Resources Department (EMNRD) regulates the handling and disposal of PW within the O&G industry in NM. This includes UIC wells for PW disposal, reuse through enhanced recovery operations, and recycling and reuse in O&G drilling operations. The OCD encourages the recycling and reuse of PW within the O&G industry by specifically exempting from permitting the disposition of PW for use in “drilling, completion, producing, secondary recovery, pressure maintenance or plugging of wells.”
New Mexico House Bill 546 (HB 546), which includes the Produced Water Act, went into effect on 1 July 2019. PW is defined in the Produced Water Act as “fluid that is an incidental byproduct from drilling for or the production of oil and gas.” The Produced Water Act addresses the reuse and recycling of PW and establishes that no water right is created from PW. “Recycled produced water” is defined as “produced water that is reconditioned by a recycling facility permitted by the oil conservation division of the energy, minerals and natural resources department.” PW recycling within the O&G industry reduces the use of freshwater for O&G applications. A key provision of HB 546 is that it removes obstacles related to the recycling of PW in NW, and encourages recycling by the industry while minimizing freshwater usage. Therefore, NM expects the volumes of PW recycled for oil production will increase in the coming years. The Produced Water Act also specifically directs the Water Quality Control Commission (WQCC) to “adopt regulations to be administered by the department of environment for the discharge, handling, transport, storage, recycling or treatment for the disposition of treated PW, including disposition in road construction maintenance, roadway ice or dust control or other construction, or in the application of treated PW to land, for activities unrelated to the exploration, drilling, production, treatment or refinement of oil or gas.” The Act provides that the WQCC “may adopt regulations to be administered by the department of environment for surface water discharges.”
Surface water discharges are currently regulated through EPA Region 6, and state-certified by the New Mexico Environment Department (NMED)’s Surface Water Quality Bureau because NM does not yet have primacy over the NPDES program. NMED’s Ground Water Quality Bureau issues and manages discharge permits that have the potential to impact groundwater. The Office of the State Engineer (OSE) has no authority over PW, and no water right shall be established by the disposition of PW, recycled PW, or treated PW. All PW that is produced from an O&G well is the responsibility of and under the control of the working interest owners and operators. However, a transferee shall have control of and responsibility for the PW when it is transferred, sold, or conveyed. Thus, the control of and responsibility of PW transfers with PW.
Implementation of Produced Water Act in New Mexico
To collect input from the public on the Produced Water Act, in the fall of 2019, NMED initiated and conducted public engagement activities across NM in coordination with EMNRD and OSE. The collected input is used to inform future regulatory and research efforts related to NMED’s authority to regulate the treatment and use of PW outside of the O&G industry. In total, NMED generated a public input catalog containing 2296 statements. The public concern or opinion is roughly split between regulation needs (59%) and research needs (41%). Most input (56%) generally expressed concern regarding the unknowns surrounding PW use outside of O&G. The remaining (44%) either expressed direct support (6%) or opposition (38%) to one or more PW topics [66].
The level of treatment necessary to protect human health and the environment depends upon the intended end use of the treated PW. Emerging technologies to effectively treat PW are potentially making the PW reuse inside and outside of the O&G industry possible with targeted research and regulation. “Fit for purpose” research to support future regulations will address the range of factors that vary based on the end-use. In 2019, NMED and New Mexico State University (NMSU) launched the New Mexico Produced Water Research Consortium (NMPWRC) to assist the state in filling scientific and technical knowledge gaps necessary to establish regulations and policies for the treatment and reuse of treated PW. The NMPWRC leads an extensive research program to explore desalination and other technologies needed to adequately treat PW for potential fit-for-purpose reuse; characterize physical, chemical, and biological properties of PW and treated PW; assess the technical, societal, environmental, and economic effects of the use of treated PW, including risks and toxicity to public health and the environment; and develop public outreach and education programs to improve the public understanding of the potential impacts of using treated PW on public and environmental health and safety.
Summary
Currently, most of the PW was disposed of through deep well injection in NM, and no PW has been permitted for use outside of O&G production activities. However, to encourage the O&G industry to reuse and recycle the PW instead of relying on limited freshwater resources, the Produced Water Act was passed in 2019. The Produced Water Act clarified ambiguity regarding jurisdiction over PW reuse, and assigned it clearly to OCD when inside the O&G industry. The Act also clarified that the use of treated PW outside of the O&G industry is subject to the state Water Quality Act and must comply with the WQCC regulations administered by the NMED. The responsibility and liability for PW go with the water when it is transferred, and PW does not come with, nor does it affect, water rights. The NMPWRC was established to promote scientific research to fill scientific and technical knowledge gaps, necessary to develop regulations and policies for the treatment and reuse of PW.
4. Conclusions and Perspectives
This study analyzes the current regulatory framework for PW production, management, and reuse in the major oil and gas production areas in the U.S., including Appalachian Basin, California, Colorado, New Mexico, Oklahoma, Texas, and Wyoming. Most of the PW is injected either for EOR or by disposal wells. States in the east of the 98th meridian reuse more PW inside of the O&G fields due to the current U.S. EPA regulations. States in the west of the 98th meridian have been planning to reuse treated PW outside of the O&G fields because of the droughts and the exemptions from U.S. EPA regulations. Different states may need to develop their own regulations pertinent to their unique geographic locations, state-specific practices and laws, and the differences between the PW quality and quantity. This review summarizes the PW regulations, examples of PW reuse practices, water quality standards, and risk assessment studies in different states, which can be used as guidelines and support regulatory development for other states or countries with proper modifications.
Recently, more regulations on PW management and reuse have been established by state regulators. Pennsylvania renewed the General Permit WMGR123 in 2021 to guide the reuse of PW inside the O&G field. The Oklahoma Governor signed the “Oil and Gas PW and Waste Recycling and Reuse Act” into law (S.B.1875) in 2020. The Act encourages the efforts of PW recycling and reuses in Oklahoma by alleviating much of the uncertainty regarding ownership of PW, which would reduce freshwater demand and lower saltwater injection volumes. In 2021, the U.S. EPA approved Texas’ request to administer the NPDES program for PW discharges within the state of Texas, and the Texas legislature passed HB 2771, which transferred duties and authority to TCEQ upon NPDES delegation from the U.S. EPA for issuing permits for the discharge of PW in 2019. NM passed HB 546 in 2019 to encourage the treatment, reuse, and recycling of treated PW within and outside of O&G fields.
Reuse of treated PW for agriculture mainly happens in California and Wyoming because of the “good” quality of the PW. Research from California suggested that the treated PW with high quality or after blending can be used for irrigation. Colorado recognizes the reuse of treated PW as a viable beneficial use, e.g., aquifer recharge. Currently, most of the PW was disposed of through deep well injection in NM, and no PW has been permitted for use outside of O&G production activities due to a lack of understanding of the risks associated with the reuse of treated PW. The NMPWRC was established to promote scientific research to inform future regulations and policies. A report from Wyoming demonstrated the feasibility of using CBM PW for managed irrigation with appropriate soil physical/chemical amendments. The feasibility of reusing treated PW for irrigation in Colorado, New Mexico, and Texas is under intensive investigation.
The treatment effectiveness for removing the chemical constituents in PW needs to be demonstrated to protect the environment and public health during beneficial use. Because of varying levels of oil residues, salts, suspended solids, petroleum hydrocarbons, metals, NORM, and other chemicals and potential toxins, PW must be treated to meet the water quality requirements for fit-for-purpose uses. There are many PW pre-treatment and treatment processes available that include modular and scalable components [118,119]. However, current treatment technologies are often not cost-competitive as compared to the options of SWD well disposal or water reuse for HF. Advancements in water treatment technology can create new and more cost-effective, energy-efficient opportunities to treat and reuse PW, such as using innovative, high-performance materials and technologies; selective removal and separation of constituents of concern; and the use of renewable energy and waste heat to reduce energy consumption and greenhouse gas emissions [120,121,122,123]. In addition, technologies are needed to achieve zero-waste-disposal and support the extraction or recovery of specific minerals in PW or treatment residuals as commodities [124,125].
A significant concern of reusing treated PW is the chemical additives put down wells during fracturing. Many chemical products are protected by patents that result in restrictions on the manufacturer providing useful information regarding the chemical formulation of the product. As manufacturers are unwilling to reveal key details about the chemical additives due to trade secrets, it makes it difficult to identify these chemicals and assess their associated risks during reuse. For risks and toxicology assessment, it is imperative that the chemical additives be disclosed, as well as the volume and frequency of their use. The CVRWQCB worked around this restriction by making it clear that O&G operations must disclose the chemical formulation if they were to receive a permit for discharging PW thereby providing the incentive to manufacturers for disclosing of product formulations. However, this was only accomplished with the CVRWQCB agreeing that they would review the formulations but that they also would maintain confidential any information regarding the formulation. This is an important issue that needs to be addressed by a standardized practice that will provide the required information to regulators and for risk assessment but also will protect the economic interests of the party holding the product formulation patent, most likely the manufacturer.
It is also critical to investigate the chemicals’ breakdown products during fracking. Chemicals are injected under high temperature and pressure into oil and gas reservoirs, where they interact with other compounds in the formation and may be transformed into other types of chemical constituents. Up to date, there are limited studies and no established tools to monitor these unknown transformation compounds and understand the toxicity effects of the chemical interactions during reuse applications. Currently, researchers and the industry are identifying greener chemical additives in HF and minimizing the use of chemicals with less-desirable environmental, safety, and health concerns. However, the proposed alternative chemicals also need to be evaluated regarding their potential impacts on public health and environmental risks, the efficacy and compatibility with other naturally occurring formation chemistries, operating conditions, as well as commercial availability and costs [126].
The U.S. EPA has developed the National Water Reuse Action Plan (WRAP) to support water security, sustainability, and resilience. Actions in the plan are intended to drive progress on reuse and address local and national barriers across a range of topics, including technical, institutional, and financial. To address the challenges of reusing treated PW outside of oil and gas fields, the U.S. EPA, in collaboration with partners in academia, state agencies, and the industry, leads a national program to study the safety of PW and develop cutting-edge analytical methods for evaluating the complex mixtures of contaminants, and for predicting the potential toxicological effects of PW and treated PW intended for reuse. The study includes targeted and nontargeted chemical analysis to identify the constituents and correlate molecular targets to identified chemical constituents using gene expression biomarkers and comparison with known targets examined in human cell lines. The study aims to fill the knowledge gaps in detecting and assessing risks to human and ecological health caused by chemicals in PW, and help identify fit-for-purpose reuse options outside of the oilfield. The program will provide valuable information and data to inform future permitting requirements by understanding the chemicals present and potential risks during reuse applications.
The reuse of PW inside and outside of the O&G fields would benefit society and the environment. However, the risks associated with reusing treated PW still require intensive research. Given PW is a new, non-traditional water source, and the water chemistry is complex with naturally occurring constituents and chemical additions during the well stimulation process, water quality standards for different reuse applications should consider the known and unknown chemicals and toxicological characteristics of PW and treated PW. Intensive research is needed to provide scientific and technical knowledge to establish science-based regulations and develop well-informed permitting programs for the safe reuse of treated PW outside of the O&G fields.
Supplementary Materials
The following supporting information can be downloaded at: https://www.mdpi.com/article/10.3390/w14142162/s1, Table S1: General Permit WMGR123 Appendix A (39 constituents) from Pennsylvania; Table S2: Alternative screening matrix for the produced water reuse in Oklahoma, prepared by the Produced Water Working Group; Table S3: Cost estimates for ten produced water use scenarios in Oklahoma, prepared by the Produced Water Working Group; Table S4: Recommended Irrigation Water Risk-Based Comparison (RBC) Levels (mg/L) in California; Table S5: Oil and Gas wells permitting in Colorado Division of Water Resources; Table S6. Groundwater standards in Colorado; Table S7: Soil quality criteria for road spreading of produced water in Colorado; Table S8: Regulatory guidelines for road application of waste and wastewater in Wyoming; Table S9: CBM permitting guideline for discharges to irrigated drainages of the Powder River Basin, Wyoming; Table S10. Wyoming Department of Environmental Quality parameter list for produced water for beneficial use for land application.
Author Contributions
Conceptualization, methodology, formal analysis, investigation, resources, writing—original draft preparation, writing—review and editing, W.J., L.L., X.X., H.W. and P.X.; supervision and project administration, P.X. All authors have read and agreed to the published version of the manuscript.
Funding
The research was supported by the New Mexico Produced Water Research Consortium.
Data Availability Statement
Not applicable.
Acknowledgments
The authors acknowledge the New Mexico Produced Water Research Consortium and the New Mexico Environment Department for supporting this study and providing technical reviews of the case studies. The authors are also grateful to Karl Longley with Fresno State University for preparing and reviewing the California case study.
Conflicts of Interest
The authors declare no conflict of interest.
References
- Nicot, J.-P.; Scanlon, B.R. Water use for shale-gas production in Texas, US. Environ. Sci. Technol. 2012, 46, 3580–3586. [Google Scholar] [CrossRef] [PubMed]
- Khan, N.A.; Engle, M.; Dungan, B.; Holguin, F.O.; Xu, P.; Carroll, K.C. Volatile-organic molecular characterization of shale-oil produced water from the Permian Basin. Chemosphere 2016, 148, 126–136. [Google Scholar] [CrossRef] [PubMed]
- Jiang, W.; Lin, L.; Xu, X.; Cheng, X.; Zhang, Y.; Hall, R.; Xu, P. A Critical Review of Analytical Methods for Comprehensive Characterization of Produced Water. Water 2021, 13, 183. [Google Scholar] [CrossRef]
- Hu, L.; Jiang, W.; Xu, X.; Wang, H.; Carroll, K.C.; Xu, P.; Zhang, Y. Toxicological characterization of produced water from the Permian Basin. Sci. Total Environ. 2022, 815, 152943. [Google Scholar] [CrossRef]
- Jiang, W.; Xu, X.; Hall, R.; Zhang, Y.; Carroll, K.C.; Ramos, F.; Engle, M.A.; Lin, L.; Wang, H.; Sayer, M. Characterization of produced water and surrounding surface water in the Permian Basin, the United States. J. Hazard. Mater. 2022, 430, 128409. [Google Scholar] [CrossRef]
- Sun, C.; Zhang, Y.; Alessi, D.S.; Martin, J.W. Nontarget profiling of organic compounds in a temporal series of hydraulic fracturing flowback and produced waters. Environ. Int. 2019, 131, 104944. [Google Scholar] [CrossRef]
- U.S. EPA. Class II Oil and Gas Related Injection Wells. Available online: https://www.epa.gov/uic/class-ii-oil-and-gas-related-injection-wells (accessed on 18 June 2021).
- IHS Markit. Produced Water from Onshore US Oil and Gas Activities to Decline to Nearly 20 Billion Barrels Annually; Reach $28 Billion in Value by 2022, IHS Markit Says. Available online: https://news.ihsmarkit.com/prviewer/release_only/slug/2020-04-02-produced-water-from-onshore-us-oil-and-gas-activities-to-decline-to-nearly-20-billion-barrels-annually-reach-28-billion-in-value-by-2022-ihs-markit-says (accessed on 10 February 2021).
- Zhong, C.; Zolfaghari, A.; Hou, D.; Goss, G.G.; Lanoil, B.D.; Gehman, J.; Tsang, D.C.; He, Y.; Alessi, D.S. Comparison of the hydraulic fracturing water cycle in China and North America: A critical review. Environ. Sci. Technol. 2021, 55, 7167–7185. [Google Scholar] [CrossRef]
- Chang, H.; Li, T.; Liu, B.; Vidic, R.D.; Elimelech, M.; Crittenden, J.C. Potential and implemented membrane-based technologies for the treatment and reuse of flowback and produced water from shale gas and oil plays: A review. Desalination 2019, 455, 34–57. [Google Scholar] [CrossRef]
- U.S. EPA. Summary of Input on Oil and Gas Extraction Wastewater Management Practices Under the Clean Water Act Final Report. 2020. Available online: https://www.epa.gov/eg/summary-input-oil-and-gas-extraction-wastewater-management-practices-under-clean-water-act-final (accessed on 7 April 2021).
- Jiang, W.; Pokharel, B.; Lin, L.; Cao, H.; Carroll, K.C.; Zhang, Y.; Galdeano, C.; Musale, D.A.; Ghurye, G.L.; Xu, P. Analysis and prediction of produced water quantity and quality in the Permian Basin using machine learning techniques. Sci. Total Environ. 2021, 149693. [Google Scholar] [CrossRef]
- Veil, J.U.S. Produced Water Volumes and Management Practices in 2017. Available online: http://www.veilenvironmental.com/publications/pw/pw_report_2017_final.pdf (accessed on 12 August 2021).
- Skoumal, R.J.; Ries, R.; Brudzinski, M.R.; Barbour, A.J.; Currie, B.S. Earthquakes induced by hydraulic fracturing are pervasive in Oklahoma. J. Geophys. Res. Solid Earth 2018, 123, 10,918–910,935. [Google Scholar] [CrossRef]
- Reig, P.; Luo, T.; Proctor, J.N. Global Shale Gas Development: Water Availability & Business Risks; World Resources Institute. 2014. Available online: https://www.wri.org/research/global-shale-gas-development-water-availability-business-risks#:~:text=This%20report%20reveals%20that%20lack,extremely%20high%20seasonal%20variability%3B%20and (accessed on 12 July 2021).
- Scanlon, B.R.; Reedy, R.C.; Xu, P.; Engle, M.; Nicot, J.P.; Yang, Q.; Ikonnikova, S. Can we Beneficially Reuse Produced Water from Oil and Gas Extraction in the U.S.? Sci. Total Environ. 2020, 717, 137085. [Google Scholar] [CrossRef] [PubMed]
- U.S. EPA. Final Report: Summary of Input on Oil and Gas Extraction Wastewater Management Practices under the Clean Water Act; U.S. EPA. 2020. Available online: https://www.epa.gov/sites/default/files/2020-05/documents/oil-gas-final-report-2020.pdf (accessed on 21 July 2021).
- Strong, J.; Cunningham, J.; Dunkel, M. Oklahoma Water for 2060: Produced Water Reuse and Recycling; Okla. City. 2017. Available online: https://www.owrb.ok.gov/2060/PWWG/pwwgfinalreport.pdf (accessed on 21 July 2021).
- Shaffer, D.L.; Arias Chavez, L.H.; Ben-Sasson, M.; Romero-Vargas Castrilloón, S.; Yip, N.Y.; Elimelech, M. Desalination and reuse of high-salinity shale gas produced water: Drivers, technologies, and future directions. Environ. Sci. Technol. 2013, 47, 9569–9583. [Google Scholar] [CrossRef] [PubMed]
- Scanlon, B.R.; Ikonnikova, S.; Yang, Q.; Reedy, R.C. Will water issues constrain oil and gas production in the United States? Environ. Sci. Technol. 2020, 54, 3510–3519. [Google Scholar] [CrossRef] [PubMed]
- Jiménez, S.; Micó, M.; Arnaldos, M.; Medina, F.; Contreras, S. State of the art of produced water treatment. Chemosphere 2018, 192, 186–208. [Google Scholar] [CrossRef] [PubMed]
- Patterson, L.A.; Konschnik, K.E.; Wiseman, H.; Fargione, J.; Maloney, K.O.; Kiesecker, J.; Nicot, J.-P.; Baruch-Mordo, S.; Entrekin, S.; Trainor, A. Unconventional oil and gas spills: Risks, mitigation priorities, and state reporting requirements. Environ. Sci. Technol. 2017, 51, 2563–2573. [Google Scholar] [CrossRef] [PubMed]
- Alessi, D.S.; Zolfaghari, A.; Kletke, S.; Gehman, J.; Allen, D.M.; Goss, G.G. Comparative analysis of hydraulic fracturing wastewater practices in unconventional shale development: Water sourcing, treatment and disposal practices. Can. Water Resour. J./Rev. Can. Des Ressour. Hydr. 2017, 42, 105–121. [Google Scholar] [CrossRef]
- DiGiulio, D.C.; Jackson, R.B. Impact to Underground Sources of Drinking Water and Domestic Wells from Production Well Stimulation and Completion Practices in the Pavillion, Wyoming, Field. Environ. Sci. Technol. 2016, 50, 4524–4536. [Google Scholar] [CrossRef]
- Rodriguez, J.; Heo, J.; Kim, K.H. The Impact of Hydraulic Fracturing on Groundwater Quality in the Permian Basin, West Texas, USA. Water 2020, 12, 796. [Google Scholar] [CrossRef] [Green Version]
- He, Y.; Sun, C.; Zhang, Y.; Folkerts, E.J.; Martin, J.W.; Goss, G.G. Developmental toxicity of the organic fraction from hydraulic fracturing flowback and produced waters to early life stages of zebrafish (Danio rerio). Environ. Sci. Technol. 2018, 52, 3820–3830. [Google Scholar] [CrossRef]
- He, Y.; Folkerts, E.J.; Zhang, Y.; Martin, J.W.; Alessi, D.S.; Goss, G.G. Effects on biotransformation, oxidative stress, and endocrine disruption in rainbow trout (Oncorhynchus mykiss) exposed to hydraulic fracturing flowback and produced water. Environ. Sci. Technol. 2017, 51, 940–947. [Google Scholar] [CrossRef] [PubMed]
- Blewett, T.A.; Weinrauch, A.M.; Delompré, P.L.; Goss, G.G. The effect of hydraulic flowback and produced water on gill morphology, oxidative stress and antioxidant response in rainbow trout (Oncorhynchus mykiss). Sci. Rep. 2017, 7, 46582. [Google Scholar] [CrossRef] [PubMed] [Green Version]
- Kassotis, C.D.; Iwanowicz, L.R.; Akob, D.M.; Cozzarelli, I.M.; Mumford, A.C.; Orem, W.H.; Nagel, S.C. Endocrine disrupting activities of surface water associated with a West Virginia oil and gas industry wastewater disposal site. Sci. Total Environ. 2016, 557, 901–910. [Google Scholar] [CrossRef]
- US. EPA. Guidelines for Water Reuse; U.S. EPA; 2012. Available online: https://www.epa.gov/sites/default/files/2019-08/documents/2012-guidelines-water-reuse.pdf (accessed on 21 July 2021).
- Danforth, C.; Chiu, W.A.; Rusyn, I.; Schultz, K.; Bolden, A.; Kwiatkowski, C.; Craft, E. An integrative method for identification and prioritization of constituents of concern in produced water from onshore oil and gas extraction. Environ. Int. 2020, 134, 105280. [Google Scholar] [CrossRef]
- China National Energy Administration. National Energy Administration Circular on the Issuance of Shale Gas Development Plan (2016–2020); China National Energy Administration. Available online: https://policy.asiapacificenergy.org/node/30502016 (accessed on 21 July 2021). (In Chinese)
- GWPC. Produced Water Report: Regulations, Current Practices, and Research Needs. Available online: https://www.gwpc.org/sites/gwpc/uploads/documents/Research/Produced_Water_Full_Report___Digital_Use.pdf (accessed on 7 April 2020).
- U.S. EIA. Lower 48 States Shale Plays. Available online: https://www.eia.gov/analysis/studies/usshalegas/ (accessed on 1 July 2022).
- U.S. EPA. Study of Oil and Gas Extraction Wastewater Management under the Clean Water Act. 2019 EPA-821-R19-001. Available online: https://www.epa.gov/sites/production/files/2019-05/documents/oil-and-gas-study_draft_05-2019.pdf (accessed on 7 April 2020).
- Sentinel, N.A. Clearwater Facility Idled for Evaluation. Available online: https://www.newsandsentinel.com/news/local-news/2019/09/clearwater-facility-idled-for-evaluation/ (accessed on 20 June 2021).
- PADEP. Pennsylvania Department of Environmental Protection. PA DEP Oil & Gas Reporting Website—Production/Waste Reports. Available online: https://www.dep.pa.gov/DataandTools/Reports/Oil%20and%20Gas%20Reports/pages/default.aspx (accessed on 5 April 2020).
- U.S. EPA. Detailed Study of the Centralized Waste Treatment Point Source Category for Facilities Managing Oil and Gas Extraction Wastes. EPA-821-R-18-004. Available online: https://www.epa.gov/sites/production/files/2018-05/documents/cwt-study_may-2018.pdf (accessed on 3 October 2020).
- West Virginia Department of Environmental Protection Office of Oil and Gas. General Water Pollution Control Permit Permit Number: GP-WV-1-07. Available online: http://dep.wv.gov/oil-and-gas/Documents/Fact%20Sheet%20GP-WV-1-07.pdf (accessed on 10 April 2020).
- GWPC. State of West Virginia Class II UIC Program Peer Review. Available online: http://www.gwpc.org/sites/default/files/West%20Virginia%20Class%20II%20Peer%20Review%20Report%20Final.pdf (accessed on 10 April 2020).
- FWAP. State of Ohio and FreshWater Accountability Project. In the Court of Appeals of Franklin County, Ohio. Available online: https://fwap.org/wp-content/uploads/2014/11/Complt-FINAL-FINAL-complet.pdf (accessed on 7 April 2020).
- Ertel, D.J.; McManus, K.; Bogdan, J. Method and System for Treating Wastewater. US10202286B2, 2019. Available online: https://patents.google.com/patent/US10202286B2/en (accessed on 21 July 2021).
- Office of Fossil Energy and Carbon Management. Produced Water: From a Waste to a Resource. 2020. Available online: https://www.energy.gov/fecm/articles/produced-water-waste-resource (accessed on 21 July 2021).
- Jacobs, N.; Marcellus Shale Operators Ahead of the Game on Produced Water Management. EnergyInDepth Appalachian Basin. Available online: https://www.energyindepth.org/marcellus-shale-operators-ahead-of-the-game-on-wastewater-management/ (accessed on 7 April 2020).
- Nobel, J. America’s Radioactive Secret. Available online: https://www.rollingstone.com/politics/politics-features/oil-gas-fracking-radioactive-investigation-937389/ (accessed on 10 April 2021).
- Allard, D.J. TENORM—PA Study & Regulatory Framework. Available online: https://www.nrc.gov/docs/ML1727/ML17278A725.pdf (accessed on 10 April 2020).
- Tomastik, T.E.; Daniel, J. Challenges Facing Class II Disposal Well Operations in the Appalachian Basin. Available online: http://www.gwpc.org/sites/default/files/event-sessions/Class%20II-VI%20-%20Tom%20Tomastik.pdf (accessed on 10 April 2020).
- U.S. EIA. Crude Oil and Natural Gas Production in Texas and Oklahoma’s Anadarko Region Is Growing. 2017. Available online: https://www.eia.gov/todayinenergy/detail.php?id=32672#:~:text=According%20to%20EIA’s%20DPR%2C%20oil,over%20the%20next%2016%20months (accessed on 10 June 2020).
- USGS. Induced Earthquakes. Available online: https://www.usgs.gov/natural-hazards/earthquake-hazards/induced-earthquakes?qt-science_support_page_related_con=4#qt-science_support_page_related_con (accessed on 18 June 2020).
- Keranen, K.M.; Weingarten, M.; Abers, G.A.; Bekins, B.A.; Ge, S. Sharp increase in central Oklahoma seismicity since 2008 induced by massive wastewater injection. Science 2014, 345, 448–451. [Google Scholar] [CrossRef]
- Langenbruch, C.; Zoback, M.D. How will induced seismicity in Oklahoma respond to decreased saltwater injection rates? Sci. Adv. 2016, 2, e1601542. [Google Scholar] [CrossRef] [Green Version]
- U.S. EIA. Petroleum & Other Liquids: Crude Oil Production. Available online: https://www.eia.gov/dnav/pet/pet_crd_crpdn_adc_mbblpd_a.htm (accessed on 10 August 2021).
- Lyons, B.; Tintera, J.; Wright, K. Sustainable ProducedWater Policy, Regulatory Framework, and Management in the Texas Oil and Natural Gas Industry: 2019 and Beyond. Available online: https://documentcloud.adobe.com/link/track/?uri=urn%3Aaaid%3Ascds%3AUS%3A2c7b5154-f581-47dc-9c19-314d82c8de05&pageNum=1 (accessed on 5 April 2020).
- RRC. Railroad Commission of Texas. Injection and Disposal Wells. Available online: https://www.rrc.state.tx.us/about-us/resource-center/faqs/oil-gas-faqs/faq-injection-and-disposal-wells/ (accessed on 30 October 2020).
- Vaucher, D. Water Market for Upstream Oil and Gas Operations in the United States Worth an Estimated $33.6 Billion in 2018. Enerrgy & Natural Resources Research & Annalysis. Available online: https://ihsmarkit.com/research-analysis/water-market-for-upstream-oil-gas-operations-in-us.html (accessed on 10 April 2020).
- RRC. Railroad Commission of Texas. Recycling. Environmental Permit Types & Information. Available online: https://www.rrc.state.tx.us/oil-gas/applications-and-permits/environmental-permit-types-information/recycling/ (accessed on 10 April 2020).
- TOSS. Office of the Secretary of State. Texas Administrative Code. Available online: https://texreg.sos.state.tx.us/public/readtac$ext.ViewTAC?tac_view=5&ti=16&pt=1&ch=4&sch=B (accessed on 10 February 2021).
- U.S. EPA. NPDES General Permit to Discharge to Waters of the United States. Available online: https://www3.epa.gov/region1/npdes/hydrogp/HydroGPFactSheet.pdf (accessed on 18 June 2021).
- U.S. EPA. NPDES Permit No. TX0134061 Fact Sheet. Available online: https://www.epa.gov/sites/default/files/2018-01/documents/tx0134061_fact_sheet.pdf (accessed on 3 October 2020).
- Lewis, K.; Moore, J.; Weathersby, B. Agricultural Reuse of Treated Produced Water. Available online: https://www.owrb.ok.gov/2060/PWWG/Resources/Lewis_Katie.pdf (accessed on 10 April 2020).
- Guillen, R.; Hinojosa, J. Texas HB No. 2545. 2019. Available online: https://legiscan.com/TX/bill/HB2545/2019 (accessed on 10 April 2020).
- Scofield, R.; Beckerman, B. Final Report: Task 1, Identification of Chemicals of Interest Related to the Reuse of Produced Water for Agricultural Irrigation of Edible Crops. Prepared by GSI Environmental for the California Central Valley Region Regional Water Quality Control Board. March 2020. Available online: https://www.waterboards.ca.gov/centralvalley/water_issues/oil_fields/food_safety/data/task1_report_final.pdf (accessed on 7 April 2020).
- Sedlacko, E.M.; Jahn, C.E.; Heuberger, A.L.; Sindt, N.M.; Miller, H.M.; Borch, T.; Blaine, A.C.; Cath, T.Y.; Higgins, C.P. Potential for Beneficial Reuse of Oil and Gas–Derived Produced Water in Agriculture: Physiological and Morphological Responses in Spring Wheat (Triticum aestivum). Environ. Toxicol. Chem. 2019, 38, 1756–1769. [Google Scholar] [CrossRef]
- Sedlacko, E.M.; Chaparro, J.M.; Heuberger, A.L.; Cath, T.Y.; Higgins, C.P. Effect of produced water treatment technologies on irrigation-induced metal and salt accumulation in wheat (Triticum aestivum) and sunflower (Helianthus annuus). Sci. Total Environ. 2020, 740, 140003. [Google Scholar] [CrossRef]
- Miller, H.; Dias, K.; Hare, H.; Borton, M.A.; Blotevogel, J.; Danforth, C.; Wrighton, K.C.; Ippolito, J.A.; Borch, T. Reusing oil and gas produced water for agricultural irrigation: Effects on soil health and the soil microbiome. Sci. Total Environ. 2020, 722, 137888. [Google Scholar] [CrossRef]
- New Mexico Environment Department. Summary of Initial Public Input on Produced Water. Available online: https://www.env.nm.gov/new-mexico-produced-water/public-participation-2/ (accessed on 10 April 2021).
- New Mexico Legislature. Fluid Oil & Gas Waste Act. Available online: https://nmlegis.gov/Legislation/Legislation?Chamber=H&LegType=B&LegNo=546&year=19 (accessed on 10 June 2021).
- CCST. California Council on Science & Technology, An Independent Scientific Assessment of Well Stimulation in California, Volume II: Potential Environmental Impacts of Hydraulic Fracturing and Acid Stimulations in the Oil and Gas Industry. Available online: https://ccst.us/reports/an-independent-scientific-assessment-of-well-stimulation-in-california-volume-2/ (accessed on 7 April 2020).
- CalGEM. California Department of Conservation: Geologic Energy Management Division. Available online: https://www.conservation.ca.gov/calgem (accessed on 7 April 2020).
- CDC. California Announces New Oil and Gas Initiatives. Actions Reflect Expanded Mission and Vision for Regulators. News Release #2019-05. Available online: https://www.conservation.ca.gov/index/Pages/News/California-Establishes-Moratorium-on-High-Pressure-Extraction.aspx (accessed on 7 April 2020).
- California Senate. California Senate Bill No. 1281, Pavley, Oil and Gas Production: Water Use: Reporting, (2013–2014). Available online: http://leginfo.legislature.ca.gov/faces/billNavClient.xhtml?bill_id=201320140SB1281 (accessed on 7 April 2020).
- Shonkoff, S.B. Oil and Gas Wastewater Reuse in California: Considerations and Risks. Available online: https://www.healthandenvironment.org/docs/SethShonkoffSlides2018-5-31.pdf (accessed on 7 April 2020).
- CRWQCB. California Regional Water Quality Control Board, Central Valley Region, Order R5-2017-0036. Waste Discharge Requirements General Order for Oil Field Discharges to Land General Order Number Three. Available online: https://www.waterboards.ca.gov/centralvalley/board_decisions/adopted_orders/general_orders/r5-2017-0036.pdf (accessed on 7 April 2020).
- CVRWQCB. Central Valley Regional Water Quality Control Board. Food Safety—Oil Field Wastewater Reuse Expert Panel. Final Version. Available online: https://www.waterboards.ca.gov/centralvalley/water_issues/oil_fields/food_safety/information/offsep_charter.pdf (accessed on 7 April 2020).
- Gross, L. California Regulators Banned Fracking Wastewater for Irrigation, but Allow Wastewater from Oil Drilling. Scientists Say There’s Little Difference. Available online: https://insideclimatenews.org/news/24042022/california-produced-water/ (accessed on 15 May 2022).
- California Regional Water Quality Control Board Central Valley Region. California Regional Water Quality Control Board Central Valley Region Order No. R5-2019-0024. Available online: https://www.waterboards.ca.gov/centralvalley/board_decisions/adopted_orders/kern/r5-2019-0024.pdf (accessed on 20 May 2022).
- RWQCB. Waste Discharge Fequirements for Plains Exploration and Production, Arroyo Grande Produced Water Reclamation Facility. Available online: https://www.waterboards.ca.gov/centralcoast/board_decisions/adopted_orders/2008/2008_0004_wdr_arroyo_grande_wrf.pdf (accessed on 10 April 2020).
- Robles, H. Irrigation Water Quality Evaluation Report. 2016. Available online: https://www.cawelowd.org/wp-content/uploads/2018/06/final-irrigation-water-quality-eval-report-07-april-2016.pdf (accessed on 7 April 2020).
- Navarro, L.; Jones, M.; NMulhearn, S. Development of Risk-Based Comparison Levels for Chemicals in Agricultural Irrigation Water. Sponnsored by California Resources Corporation. Available online: https://www.waterboards.ca.gov/centralvalley/water_issues/oil_fields/food_safety/data/studies/erm_riskassrpt.pdf (accessed on 7 April 2020).
- Jordan, P.; Brandt, A.; Ferrar, K.; Feinstein, L.; Phillips, S. A case study of the potential risks associated with hydraulic fracturing in existing oil fields in the san Joaquin basin. Indep. Sci. Assess. Well Stimul. Calif. 2015, 3, 267. [Google Scholar]
- Shonkoff, S.; Jordan, P.; Brandt, A.; Ferrar, K.; Maddalena, R.; Greenfield, B. A Case Study of the Petroleum Geological Potential and Potential Public Health Risks Associated with Hydraulic Fracturing and Oil and Gas Development in the Los Angeles Basin. Indep. Sci. Assess. Well Stimul. Calif. 2015. Available online: https://ccst.us/wp-content/uploads/160708-sb4-vol-III-4.pdf (accessed on 7 April 2020).
- Stringfellow, W.T.; Camarillo, M.K.; Domen, J.K.; Shonkoff, S.B. Comparison of chemical-use between hydraulic fracturing, acidizing, and routine oil and gas development. PLoS ONE 2017, 12, e0175344. [Google Scholar]
- DiGiulio, D.C.; Shonkoff, S.B.; Jackson, R.B. The need to protect fresh and brackish groundwater resources during unconventional oil and gas development. Curr. Opin. Environ. Sci. Health 2018, 3, 1–7. [Google Scholar] [CrossRef]
- Shonkoff, S.B. Hazard Assessment of Chemical Additives Used in Oil Fields that Reuse Produced Water for Agricultural Irrigation, Livestock Watering, and Groundwater Recharge in the San Joaquin Valley of California: Preliminary Results; Technical Report; PSE Healthy Energy, Inc.: Oakland, CA, USA, 2016. [Google Scholar]
- Scofield, R.; Beckerman, B. Assessment of Produced Water for Agricultural Irrigation of Edible Crops Progress Report. February 2020—Public Meeting of the Food Safety Expert Panel. Available online: https://www.waterboards.ca.gov/centralvalley/water_issues/oil_fields/food_safety/#docsreports%3E (accessed on 30 October 2020).
- Kharaka, Y.; Gans, K.; Thordsen, J.; Blondes, M.; Engle, M. Geochemical data for produced waters from conventional and unconventional oil and gas wells: Results from Colorado, USA. In E3S Web of Conferences; EDP Sciences: Les Ulis, France, 2019; Volume 98, p. 03002. [Google Scholar]
- McIntyre, W.C.; Mays, D.C. Roles of the water court and the state engineer for water administration in Colorado. Water Policy 2017, 19, 837–850. [Google Scholar] [CrossRef]
- COGCC. Colorado Oil and Gas Conservation Commission (COGCC), 2019 Annual Report. 2019. Available online: https://spl.cde.state.co.us/artemis/nrserials/nr1011internet/nr10112019internet.pdf (accessed on 30 October 2020).
- Shores, A.; Laituri, M. The state of produced water generation and risk for groundwater contamination in Weld County, Colorado. Environ. Sci. Pollut. Res. 2018, 25, 30390–30400. [Google Scholar] [CrossRef] [PubMed]
- Li, H.; Son, J.-H.; Carlson, K.H. Concurrence of aqueous and gas phase contamination of groundwater in the Wattenberg oil and gas field of northern Colorado. Water Res. 2016, 88, 458–466. [Google Scholar] [CrossRef]
- Sherwood, O.A.; Rogers, J.D.; Lackey, G.; Burke, T.L.; Osborn, S.G.; Ryan, J.N. Groundwater methane in relation to oil and gas development and shallow coal seams in the Denver-Julesburg Basin of Colorado. Proc. Natl. Acad. Sci. USA 2016, 113, 8391–8396. [Google Scholar] [CrossRef] [Green Version]
- Produced Water Treatment and Beneficial Use Information Center. Produced Water Beneficial Use Case Studies. 2011. Available online: http://aqwatec.mines.edu/produced_water/assessbu/case/ (accessed on 1 July 2022).
- Dolan, F.C.; Cath, T.Y.; Hogue, T.S. Assessing the feasibility of using produced water for irrigation in Colorado. Sci. Total Environ. 2018, 640, 619–628. [Google Scholar] [CrossRef]
- Pica, N.E.; Carlson, K.; Steiner, J.J.; Waskom, R. Produced water reuse for irrigation of non-food biofuel crops: Effects on switchgrass and rapeseed germination, physiology and biomass yield. Ind. Crops Prod. 2017, 100, 65–76. [Google Scholar] [CrossRef] [Green Version]
- Coupal, R.; Lieske, S.N.; Miller, S.N.; Reddy, K. Water Production from Coalbed Methane Development in Wyoming: A Summary of Quantity, Quality, and Management. Available online: https://www.uwyo.edu/haub/_files/_docs/ruckelshaus/pubs/2005-cbm-water-final-report.pdf (accessed on 10 April 2020).
- Jacquet, J.; Witt, K.; Rifkin, W.; Haggerty, J.H. A complex adaptive system or just a tangled mess? In Governing Shale Gas: Development, Citizen Participation and Decision Making in the US, Canada, Australia and Europe, 1st ed.; Routledge: Oxford, UK, 2018; p. 14. [Google Scholar]
- Walsh, K.B. Split estate and Wyoming’s orphaned well crisis: The case of coalbed methane reclamation in the Powder River Basin, Wyoming. Case Stud. Environ. 2017, 1, 1–8. [Google Scholar] [CrossRef]
- Walsh, K.B.; Haggerty, J.H. Social license to operate during Wyoming’s coalbed methane boom: Implications of private participation. Energy Policy 2020, 138, 111217. [Google Scholar] [CrossRef]
- MacKinnon, A.; Fox, K. Demanding beneficial use: Opportunities and obligations for Wyoming regulators in coalbed methane. Wyo. Law Rev. 2006, 6, 369. [Google Scholar]
- Valorz, N.J. Need for Codification of Wyoming’s Coal Bed Methane Produced Groundwater Laws. Wyo. Law Rev. 2010, 10, 115. [Google Scholar]
- Jackson, R.E.; Reddy, K. Geochemistry of coalbed natural gas (CBNG) produced water in Powder River Basin, Wyoming: Salinity and sodicity. Water Air Soil Pollut. 2007, 184, 49–61. [Google Scholar] [CrossRef]
- Vance, G.F.; Ganjegunte, G.K. Utilization of coalbed natural gas water: Issues, implications, and management. Coalbed Methane Energy Environ. 2010, chapter 14. 303–336. [Google Scholar]
- Robertson, J. Redefining CSG “waste” water: New opportunities for managed aquifer recharge. Environ. Plan. Law J. 2018, 35, 188–211. [Google Scholar]
- Johnston, C.; Vance, G.; Ganjegunte, G. Soil property changes following irrigation with coalbed natural gas water: Role of water treatments, soil amendments and land suitability. Land Degrad. Dev. 2013, 24, 350–362. [Google Scholar] [CrossRef]
- Ganjegunte, G.K.; King, L.A.; Vance, G.F. Cumulative soil chemistry changes from land application of saline–sodic waters. J. Environ. Qual. 2008, 37, S-128-S-138. [Google Scholar] [CrossRef] [Green Version]
- Brinck, E.; Frost, C. Evaluation of amendments used to prevent sodification of irrigated fields. Appl. Geochem. 2009, 24, 2113–2122. [Google Scholar] [CrossRef]
- Amezketa, E.; Aragüés, R.; Gazol, R. Efficiency of sulfuric acid, mined gypsum, and two gypsum by-products in soil crusting prevention and sodic soil reclamation. Agron. J. 2005, 97, 983–989. [Google Scholar] [CrossRef]
- King, L.; Vance, G.; Ganjegunte, G. Use of coalbed natural gas (CBNG) waters: Soil and plant responses. In Proceedings of the 22nd National American Society of Mining and Reclamation Symposium Annual Meetings, Breckenridge, CO, USA, 19–23 June 2005; Barnhisel, R., Ed.; Raising Reclamation to New Heights: Lexington, KY, USA, 2005; pp. 607–622. [Google Scholar]
- Phelps, S.; Bauder, J.W. The Role of Plants in the Bioremediation of Coalbed Methane Product Water; Department of Land Resources and Environmental Sciences, Montana State University: Bozeman, MT, USA, 2003. [Google Scholar]
- Healy, R.W.; Bartos, T.T.; Rice, C.A.; McKinley, M.P.; Smith, B.D. Groundwater chemistry near an impoundment for produced water, Powder River Basin, Wyoming, USA. J. Hydrol. 2011, 403, 37–48. [Google Scholar] [CrossRef]
- U.S. EIA. Petroleum & Other Liquids. Available online: https://www.eia.gov/dnav/pet/hist/LeafHandler.ashx?n=pet&s=mcrfpnm1&f=a (accessed on 20 October 2021).
- Scanlon, B.R.; Reedy, R.C.; Male, F.; Walsh, M. Water issues related to transitioning from conventional to unconventional oil production in the Permian Basin. Environ. Sci. Technol. 2017, 51, 10903–10912. [Google Scholar] [CrossRef] [PubMed]
- Riganti, C.U.S. Drought Monitor New Mexico. Available online: https://droughtmonitor.unl.edu/CurrentMap/StateDroughtMonitor.aspx?NM (accessed on 16 June 2021).
- USGS. How Much Water Does the Typical Hydraulically Fractured Well Require? Available online: https://www.usgs.gov/faqs/how-much-water-does-typical-hydraulically-fractured-well-require?qt-news_science_products=0#qt-news_science_products (accessed on 10 February 2021).
- Bruce, M.; Thomson, J.M.C. Analysis of the Relationship Between Water, Oil & Gas in New Mexico: Investigation of Past and Future Trends; New Mexico Water Resources Research Institute: Las Cruces, NM, USA, 2021; Available online: https://www.worldcat.org/title/analysis-of-the-relationship-between-water-oil-gas-in-new-mexico-investigation-of-past-and-future-trends/oclc/1249753650 (accessed on 10 February 2021).
- NMOCD. OCD Data and Statistics. Available online: http://www.emnrd.state.nm.us/OCD/statistics.html (accessed on 10 June 2021).
- New Mexico Environment Department. Public Involvement Plan (PIP) for the Implementation of House Bill 546, the Produced Water Act. Available online: https://www.env.nm.gov/wp-content/uploads/sites/16/2019/10/Produced-Water-PIP-20191015-FINAL.pdf (accessed on 10 June 2021).
- Geza, M.; Ma, G.; Kim, H.; Cath, T.Y.; Xu, P. iDST: An integrated decision support tool for treatment and beneficial use of non-traditional water supplies—Part I. Methodology. J. Water Process Eng. 2018, 25, 236–246. [Google Scholar] [CrossRef]
- Ma, G.; Geza, M.; Cath, T.Y.; Drewes, J.E.; Xu, P. iDST: An integrated decision support tool for treatment and beneficial use of non-traditional water supplies—Part II. Marcellus and Barnett Shale case studies. J. Water Process Eng. 2018, 25, 258–268. [Google Scholar] [CrossRef]
- Chen, L.; Xu, P.; Wang, H. Photocatalytic membrane reactors for produced water treatment and reuse: Fundamentals, affecting factors, rational design, and evaluation metrics. J. Hazard. Mater. 2022, 424, 127493. [Google Scholar] [CrossRef]
- Sedlak, D.; Mauter, M.; Macknick, J.; Stokes-Draut, J.; Fiske, P.; Agarwal, D.; Borch, T.; Breckenridge, R.; Cath, T.; Chellam, S.; et al. National Alliance for Water Innovation (NAWI) Master Technology Roadmap; National Renewable Energy Lab. (NREL): Golden, CO, USA, 2021. [CrossRef]
- Chen, L.; Xu, P.; Kota, K.; Kuravi, S.; Wang, H. Solar distillation of highly saline produced water using low-cost and high-performance carbon black and airlaid paper-based evaporator (CAPER). Chemosphere 2021, 269, 129372. [Google Scholar] [CrossRef] [PubMed]
- Lin, L.; Jiang, W.; Chen, L.; Xu, P.; Wang, H. Treatment of Produced Water with Photocatalysis: Recent Advances, Affecting Factors and Future Research Prospects. Catalysts 2020, 10, 924. [Google Scholar] [CrossRef]
- Hu, L.; Wang, H.; Xu, P.; Zhang, Y. Biomineralization of hypersaline produced water using microbially induced calcite precipitation. Water Res. 2020, 190, 116753. [Google Scholar] [CrossRef] [PubMed]
- Hu, L.; Yu, J.; Luo, H.; Wang, H.; Xu, P.; Zhang, Y. Simultaneous recovery of ammonium, potassium and magnesium from produced water by struvite precipitation. Chem. Eng. J. 2020, 382, 123001. [Google Scholar] [CrossRef]
- Harry, D.; Horton, D.; Durham, D.; Constable, D.J.C.; Gaffney, S.; Moore, J.; Todd, B.; Martinez, I. Grand Challenges and Opportunities for Greener Chemical Alternatives in Hydraulic Fracturing: A Perspective from the ACS Green Chemistry Institute Oilfield Chemistry Roundtable. Energy Fuels 2020, 34, 7837–7846. [Google Scholar] [CrossRef]
Figure 1.
Schematic diagram of produced water management and reuse.

Figure 2.
The U.S. legal and regulatory framework for produced water management.

Figure 3.
Major oil and gas production regions in the U.S. with 98th meridian. Source: U.S. Energy Information Administration [34].
Figure 3.
Major oil and gas production regions in the U.S. with 98th meridian. Source: U.S. Energy Information Administration [34].


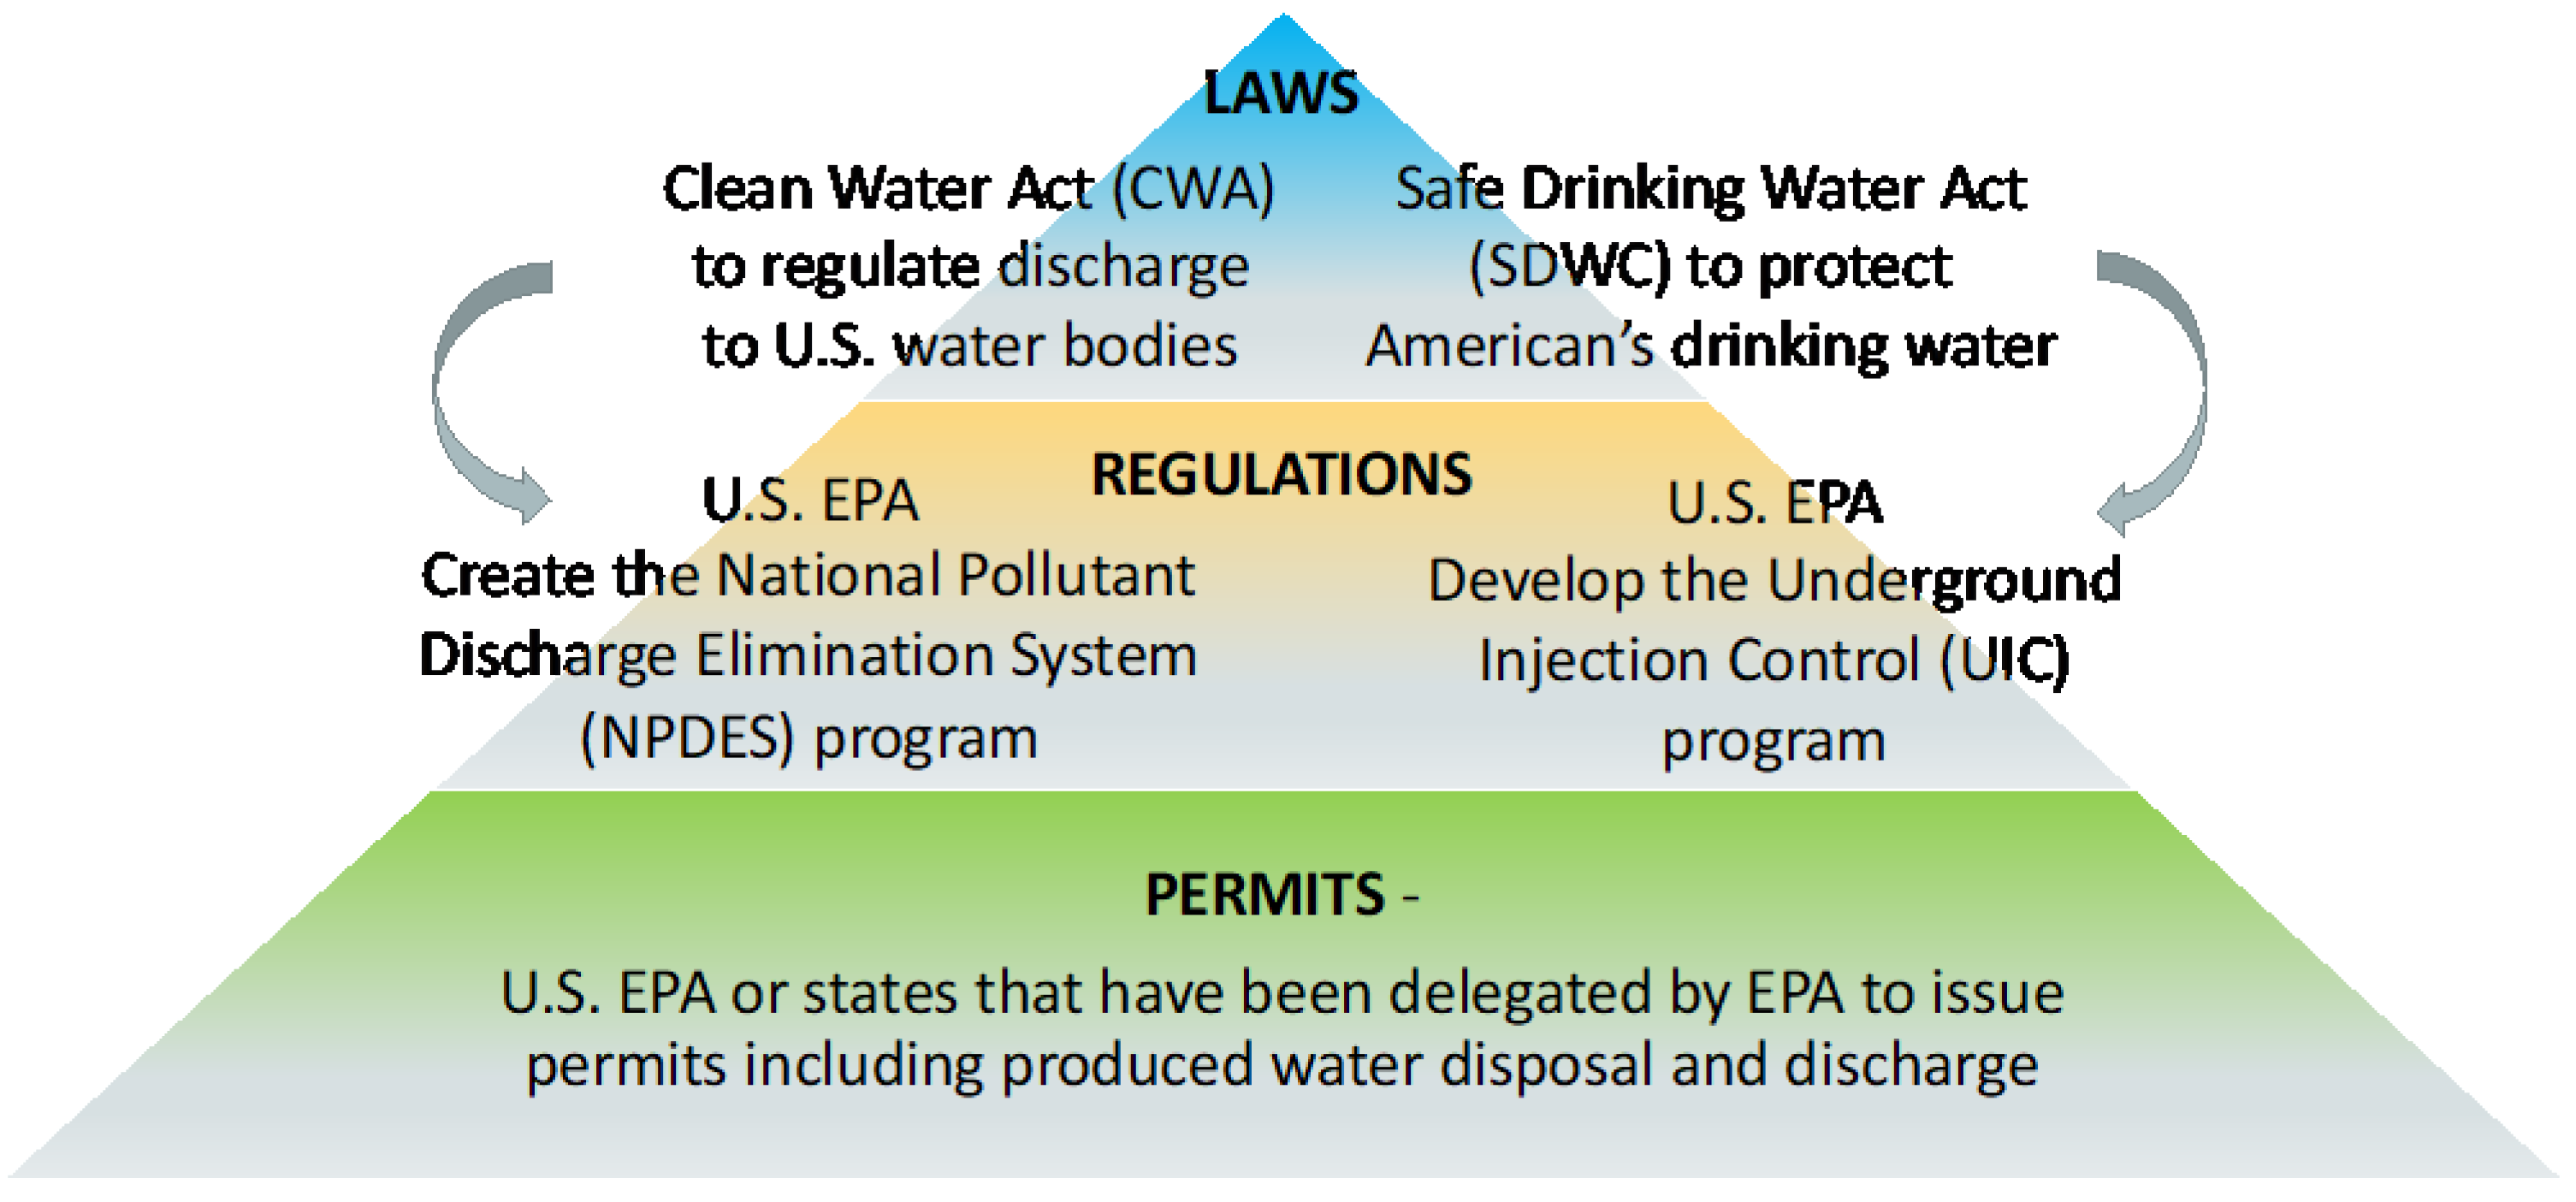
Table 1.
Regulatory agencies for produced water management in the selected states.
| State | Underground Injection Control Wells (Class II) | Reuse Inside of the O&G Fields | Commercial Facility | Discharge to Surface Water via NPDES |
|---|---|---|---|---|
| Pennsylvania | U.S. Environmental Protection Agency (EPA) | Pennsylvania Department of Environmental Protection (PADEP) | EPA | PADEP |
| Ohio | Ohio Department of Nature Resources (ODNR) | ODNR | ODNR | Ohio EPA Division of Surface Water (DSW) |
| West Virginia | West Virginia Department of Environmental Protection (WVDEP) | WVDEP | WVDEP | WVDEP |
| Texas | Railroad Commission of Texas (TRRC) | TRRC | TRRC | Texas Commission on Environmental Quality (TCEQ) |
| Oklahoma | Oklahoma Corporation Commission (OCC) | OCC | OCC | Oklahoma Department of Environmental Quality (ODEQ) |
| Wyoming | Wyoming Oil and Gas Conservation Commission (WOGCC) | WOGCC | WOGCC | Wyoming Department of Environmental Quality (WDEQ) |
| Colorado | Colorado Oil and Gas Conservation Commission (COGCC) | COGCC | COGCC | Colorado Department of Public Health and Environment (CDPHE) |
| New Mexico | New Mexico Oil Conservation Division (OCD) | OCD | OCD | U.S. EPA |
| California | California Geologic Energy Management Division (CalGEM) | California Waterboards (State water board and nine regional water boards) | California Waterboards | California Waterboards |
Note(s): The U.S. EPA issues NPDES permits for federally owned facilities, on tribal lands, and in Massachusetts, New Hampshire, New Mexico, and the District of Columbia. Other permits are issued by state regulators if not issued by the U.S. EPA.
Table 2.
Produced water production and management practices in the selected states.
| Region | PW Production (2017) | PW Disposal (Deep Well Injection) | PW Reuse Inside O&G Field | PW Reuse for EOR | PW Reuse/ Dispose Outside O&G Field | Examples of PW Reuse Outside O&G Field |
|---|---|---|---|---|---|---|
| Appalachian Basin | 105 MMbbls (16.8 × 10⁶ m3) | PA: 1.1%, WV: 56%, OH: 89%. | PA: 96%, WV: 29%, OH: 9.1%. | PA: n/a, WV: 14%, OH: 1.3%. | PA: 1.6%, WV: n/a, OH: n/a. | n/a |
| Oklahoma | 2844 MMbbls (455 × 106 m3) | 41.7% | n/a | 44.9% | 13.4% | n/a |
| Texas | 9895 MMbbls (1583 × 106 m3) | 36.2% | n/a | 46.1% | 17.6% | n/a |
| California | 3100 MMbbls (496 × 106 m3) | 22.4% | 5.1% | 59.3% | 11.1% | Irrigation |
| Colorado | 310 MMbbls (49.6 × 10⁶ m3) | 47.1% | 8.9% | 32.5% | 11.5% | Dust control; aquifer recharge and recovery; pits and surface water discharge. |
| Wyoming | 1700 MMbbls (272 × 106 m3) | 14% | n/a | 46% | 37% | Surface water discharge; groundwater injection; dust control and road application; irrigation; land application; impoundment. |
| New Mexico | 1240 MMbbls (196.9 × 10⁶ m3, 2019) | 51% | 10% | 40% | n/a | n/a |
Note(s): PW: produced water; MMbbls: million barrels; PA: Pennsylvania; OH: Ohio; WV: West Virginia; n/a: not available.
Publisher’s Note: MDPI stays neutral with regard to jurisdictional claims in published maps and institutional affiliations. |
© 2022 by the authors. Licensee MDPI, Basel, Switzerland. This article is an open access article distributed under the terms and conditions of the Creative Commons Attribution (CC BY) license (https://creativecommons.org/licenses/by/4.0/).
Share and Cite
MDPI and ACS Style
Jiang, W.; Lin, L.; Xu, X.; Wang, H.; Xu, P. Analysis of Regulatory Framework for Produced Water Management and Reuse in Major Oil- and Gas-Producing Regions in the United States. Water 2022, 14, 2162. https://doi.org/10.3390/w14142162
AMA Style
Jiang W, Lin L, Xu X, Wang H, Xu P. Analysis of Regulatory Framework for Produced Water Management and Reuse in Major Oil- and Gas-Producing Regions in the United States. Water. 2022; 14(14):2162. https://doi.org/10.3390/w14142162
Chicago/Turabian StyleJiang, Wenbin, Lu Lin, Xuesong Xu, Huiyao Wang, and Pei Xu. 2022. "Analysis of Regulatory Framework for Produced Water Management and Reuse in Major Oil- and Gas-Producing Regions in the United States" Water 14, no. 14: 2162. https://doi.org/10.3390/w14142162
Note that from the first issue of 2016, this journal uses article numbers instead of page numbers. See further details here.