Article

Willingness to Pay for Improved Urban Domestic Water Supply System: The Case of Hanoi, Vietnam

1
Faculty of Environment, Hanoi University of Natural Resources and Environment (HUNRE), No. 41A Phudien Street, North Tuliem District, Hanoi City 100000, Vietnam
2
Department of Geography and Environmental Science, University of Southampton, Southampton SO17 1BJ, UK
3
Department of Tourism Management, University of Santo Tomas, España Blvd, Sampaloc, Manila 1008, Philippines
4
Disaster Prevention Research Institute, Kyoto University, Kyoto 606-8501, Japan
5
Faculty of Science and Technology, University of Central Lancashire, Preston PR1 2HE, UK
6
TNTU Sciences & Technology Cooperation, Hanoi City 100000, Vietnam
7
National Center for Water Resources Planning and Investigation, Ministry of Natural Resources and Environment, Hanoi City 100000, Vietnam
*
Author to whom correspondence should be addressed.
Water 2022, 14(14), 2161; https://doi.org/10.3390/w14142161
Submission received: 1 May 2022 / Revised: 1 June 2022 / Accepted: 14 June 2022 / Published: 8 July 2022
(This article belongs to the Special Issue Urban Water-Related Problems)

Abstract

:
Access to a reliable and safe domestic water supply is a serious challenge for many developing countries worldwide. In the capital of Vietnam, Hanoi, the municipal government is facing a number of difficulties in providing sufficient water in a sustainable manner due to the increasing urban population and the serious pollution of both surface and groundwater resources, but this is also due to a lack of resources to invest in the supply system. This study aimed to investigate water users’ willingness to pay for the improvement of Hanoi’s domestic water supply system. A contingent valuation process based on a survey of 402 respondents was used to explore citizens’ willingness to pay (WTP) for the improvement of their urban water supply. The results show that Hanoi’s urban communities (more than 90%) were generally satisfied with the quantity of their water supply, but tended to be dissatisfied with its quality, with 80% of the respondents using advanced water purifiers before drinking and cooking. Respondents were also concerned about the overall reliability of the service, with 40% of respondents indicating that they received no check and maintenance service. A WTP regression model was developed based on the survey findings. The average WTP is 281,000 dong/household/month (approximately 12.2 USD at the exchange rate of 1 USD to about 23,000 VND), equivalent to 1.4% of the average household income at the end of 2019, indicating the level of affordability of monthly water payments among Hanoi citizens.

1. Introduction

A shortage of clean water is one of the world’s most pressing concerns. According to United Nations Water, in 2014 water scarcity affected approximately 700 million people worldwide, with this figure likely to increase to approximately 1.8 billion people by 2025 [1]. Furthermore, two-thirds of the world’s population live in areas with severe water scarcity [1], particularly those living in urban areas [2,3]. Aside from physical water scarcity, there is also economic water scarcity, which means that water supply is inadequate due to the lack of, or poor water infrastructure, management, and policy [4]. There is, therefore, a strong imperative to improve domestic water supplies in many urban areas around the world [5]. Several studies have demonstrated that investment in the domestic water supply can deliver a range of direct and indirect economic co-benefits, including lower healthcare expenditure, time-saving non-health-related benefits (e.g., no queuing at shared water facilities or walking a distance to a water collection site), and water resource protection, among others [6]. According to the definition of the Joint Monitoring Programme, improved water sources include piped water into dwellings, plots or yards, public taps or standpipes, boreholed, a protected dug well, a protected spring, or rainwater collection, all of which are likely to provide safe drinking-water for communities. Thus, improved domestic water supplies in urban areas should seek to deliver three basic goals, namely: sufficiency in quantity, safe quality of water, and reliable management and service.
Although many households in developing countries lack access to improved domestic water supplies, governments in these countries often cannot afford to offer substantially subsidized improved domestic water to all, or even to the majority of their populations [7]. As a result, improvements in the domestic water supply in these countries frequently relies mainly on financial contributions (payment of water bills) from households. However, such contributions depend not only on each household’s willingness to pay (WTP), i.e., the maximum amount that households are able to pay for their water supply [8], but also on each household’s capacity to pay, i.e., the total household income minus the amount to cover basic needs [9,10]. WTP information may be used by planners at all levels (national, provincial, city, and rural) to evaluate a project’s economic feasibility, set affordable tariffs, evaluate policy alternatives, assess financial sustainability, and design socially equitable subsidies. Moreover, a cost–benefit analysis would be inadequate without such WTP data; the net economic benefits of an improved domestic water supply are calculated as the difference between the consumers’ maximum WTP for better services and the actual cost of the services [11]. To estimate the WTP, the Contingent Valuation Method (CVM) is often used. CVM is an economic, non-market valuation method which is particularly useful for determining human preferences for public goods that have no monetary value in the market. CVM is an established method and has found many applications in water-related fields, such as assessing the social value of increasing water quality, reducing risks from drinking water and groundwater contamination, and the provision of drinking water services in developing countries [12]. In CVM applications to water supply services [13,14,15,16,17,18,19] the main objectives are to estimate the WTP to improve current water supply services and to explore the factors controlling WTP values via empirical statistical modelling. Mostly, the WTP regression models in these CVM applications are similar in terms of their selection of the WTP as a dependent variable and typically employ demographic factors (usually age, gender, education, income, family size, etc.) as independent variables.
Similar to other developing countries, Vietnam has limited improved domestic water supply, especially in urban areas [20]. According to the National Environment Report [21], it is estimated that only about 70% of the population has access to potable water. Hanoi, Vietnam’s capital city, is now facing several water scarcity issues connected to its urban water supply. The fast rate of urbanization and rapid increase in the city’s population (~3.4%/year) are significantly inflating the demand for clean water [22]. Meanwhile, the quality of the water resources that are being used to supply Hanoi is decreasing. Domestic and industrial effluents have polluted surface water sources in river basins of many major rivers, such as the Red, Nhue, and Day Rivers located in the Red River Delta. It is estimated that between 100,000 and 150,000 m3/day of untreated industrial wastewater flows directly into the rivers in Hanoi alone [23]. Furthermore, upstream of the administrative area of Hanoi, the quality and quantity of water resources are significantly affected, affecting abstraction possibilities. Hanoi’s water issues are exacerbated further by high water loss rates, averaging 23% [24]. As a result, it is critical to improve the water supply system in Hanoi by investing in the necessary supporting infrastructure, adjusting water allocations to fulfill residents’ demands reasonably, and by improving the quality of water supplied so that it meets the Vietnam Ministry of Health Quality Standard QCVN 02-BYT. Thus, the socialization of investment capital is critical to offer financial support for these activities, especially in developing countries [25].
This study explores these issues within the context of the case study of Hanoi by developing a CVM-based process that focuses on three important points: (1) a naturally exploring WTP technique aligning with the way in which humans think, (2) determining whether the results of the CVM’s social investigation are consistent and reliable, and (3) finding the appropriate variables to include in the WTP regression model based on the groups of key factors that significantly affect WTP and the current circumstances of Hanoi’s urban domestic water supply system’s (HUDWSS) performance. With the application of the developed CVM-based process to Hanoi, it is possible to examine the factors affecting residents’ WTP, thus providing an essential first step in the improvement of the domestic water supply and community expectations in Hanoi.

2. Study Area

Figure 1 displays the study location, consisting of ten urban districts, and the main rivers and lakes of Hanoi. As the economic, political, and social center of the country, Hanoi’s population and its density are very high compared to other developed cities in Vietnam. In 2020, the total population of Hanoi was approximately eight million people; female and male residents accounted for a similar proportion, and almost half of the total population was comprised of urban residents, according to the General Statistics Office of Vietnam. Average monthly income per capita in Hanoi was an estimated 6.3 million dong (about 280 US dollars).
Hanoi’s Urban Domestic Water Supply System (HUDWSS) faces a number of significant challenges in delivering its plans to supply improved water to all residents before 2030. Currently, the per capita average urban water demand is approximately 200 L/day [26] However, the municipal government is facing several challenges in providing sufficient water sustainably due to: (i) the ever-increasing urban population and density; (ii) serious pollution of both the surface and groundwater resources that serve as the main input water sources for HUDWSS‘s operation, and especially; (iii) the large losses of water (due to leakage) that can then not be used to generate any revenue.
Regarding the first challenge, the rapid urban growth places great pressure on natural resources and the environment, putting particular stress on HUDWSS to meet the growing water demand of customers, causing the fragmentation of Hanoi’s urban water infrastructure [27]. In recent years, Hanoi’s population has increased rapidly; the density of the nine urban districts has increased up to 11,759 people/km2, while the urbanization rate reached 40.5% in 2013 [26]. In recent years, the population grew by approximately 3.4% per year. In just two years, from 2015 to 2017 the population grew from 7.2 to 7.7 million people, and the population density rose from 2000 to 2209 people/km2 [28]. The city’s water distribution system, including new and old networks, has a long history of construction and rehabilitation. Hanoi Water Limited Company (HAWACO) is the city’s largest water distribution enterprise and has legal status under the Hanoi Transportation Department. The company was established under Decision No. 546/QDUB dated 4 April 1994 of the People’s Committee of Hanoi, with a history that can be traced back to the nineteenth century. Currently, Hanoi has 12 main water plants and, (including the district of Ha Dong) eight water supply zones managed by HAWACO, Vietnam’s Freshwater Business and Construction Investment Joint Stock Company (VIWACO), and Ha Dong Waterworks [29]. As reported by HAWACO, the average water supply capacity is 1,462,000 m3/month, of which 35% is distributed to the old network, which mainly serves the Old Quarter’s communities; and 65% is distributed to the new network, which covers the inner, the west, and the southeast regions of Hanoi, see Figure 1 [30]. HAWACO is failing to meet current water needs. With the per capita water demand in the urban districts at approximately 130 L/person/day, the public water utilities failed to supply urban districts approximately every two days per month in 2016 [30]. Consequently, as mentioned by HAWACO [31], just 55% of the city’s population has access to HUDWSS even though the public distribution network fully covers all of the urban districts. However, around 30% of urban households use freely accessible well water sources [32].
Regarding the second challenge, both surface and groundwater resources for HUDWSS are seriously degraded and polluted. This critical situation challenges the water enterprises in terms of how to provide a high-quality water supply for local communities. The majority of input water sources for HUDWSS consist of groundwater harvested from Pleistocene aquifers. Groundwater resources are distributed unevenly, with the largest recharge of 700,000 m3/day in the south and the smallest of 66,000 m3/day in the Soc Son district (Figure 1). The disastrous situation of seriously degraded groundwater quantity and quality as a consequence of inappropriate usage and management has been comprehensively presented in a number of previous studies [33,34,35]. In addition, the surface water sources in rivers and lakes are also seriously contaminated due to solid waste dumping, and domestic and industrial wastewater flowing directly into the water bodies without treatment. The total domestic and industrial wastewater volume in the central area of Hanoi is approximately 600,000–700,000 m3/day; the combined capacity of all the water treatment plants in Hanoi, however, is only around 245,000 m3/day. Hence, two-thirds of the generated wastewater is not treated before being discharged into rivers and lakes [12]. Consequently, water quality parameters are far below the national water quality standards. For instance, as reported by HAWACO in 2016, the observed values of an important water quality parameter of chemical oxygen demand of Quynh lake, which is located in our targeted urban district Hai Ba Trung, is extremely high at 136 mg/L, compared to the recommended value of 10 mg/L, which is the national standard for good surface water quality. Moreover, major rivers such as the Red River, Da River, and Day River are interprovincial water resources, and they have a great impact on the quality and reserves from the watersheds; thus, it is difficult to use these water resources.
Regarding the third challenge, according to HAWACO [30], the most pressing issue for the Hanoi water supply sector is the large volume of non-revenue water, which is approximately 23%. In fact, considering around 600,000 customers and the total capacity of plants of 534,500 m3/day, it is estimated that the quantity of per day non-revenue water is approximately 2.8 times the existing supply capacity. The rate of non-revenue water loss was substantially reduced from 38% in 2007 to 23% in 2015 as a result of the efforts of HAWACO’s management. The average water price as of 2020 is 7000 dong/m3 (~USD 0.31/m3) in urban districts; thus, this massive wasted budget could be estimated as more than 1 billion dong per day (~USD 43,700/day), while the residents still lack a water supply. The main reasons for this huge loss include the poor maintenance of water pipelines, inaccurate water meters leading to the incorrect recording of water use, or even water theft or illegal water tapping, as observed in other developing countries [36]. This critical circumstance threatens the sustainability of the financial situation of HUDWSS and thus challenges the ability of HUDWSS to meet the goal of achieving a sufficient water supply for all, as mentioned in the global sustainable development goals.

3. Contingent Valuation Method-Based Process for Exploring the Factors Affecting the WTP of Hanoi’s Urban Domestic Water System

The CVM used here employed a survey of Hanoi water supply service customers (see Appendix A) that consisted of five main sections: (1) a section asking questions concerning respondents’ public awareness of the water supply service situation, with the aim to understand the community’s response to the service; (2) the presentation of the CVM scenario; (3) several questions for those who do not use HUDWSS; (4) a question asking about the respondent’s WTP for the improvement of the water supply service, and; (5) a series of demographic questions. This survey outline follows the general process of the application of CVM to elicit WTP based on a range of previous studies [37,38,39]. We further developed these general sections to apply them to the specific situation of HUDWSS. The main objectives addressed in the questionnaire were (i) to understand the current situation, public perception, and satisfaction regarding the domestic water supply among local communities; (ii) to explore the WTP of local residents for water supply improvement; and (iii) to enable the subsequent analysis of the key factors affecting the WTP. Conducting a comprehensive investigation, we finally had 402 respondents, which as discussed in Section 3.3, is sufficient to give adequate statistical power.
In the application of the CVM developed in this study, we developed three methodological innovations. First, we improved the technique of determining the respondents’ WTP values step by step, logically and naturally, in line with natural thinking patterns; the so-called ‘naturally exploring’ WTP technique. Secondly, we checked whether the obtained responses from the CVM social investigation were acceptably consistent and reliable, and this step is essential since the social investigation is usually carried out in diverse situations. Thus, its reliability and consistency are uncertain, depending on awareness, the convenience of the interview process, and even the personalities of both interviewers and respondents. We then clarified the groups of main factors affecting WTP, which have not been mentioned in the previous literature. This step is also crucial because it provides us with the background to propose a list of appropriate variables that should be included in the WTP regression model. The details of these three points are explained in the following subsections.

3.1. Questionnaire Design

In order to gain a better understanding of the current domestic water use situation in urban communities in Hanoi, this study conducted a social investigation based on a questionnaire survey and a face-to-face interview. The questionnaire was set up and completed in two phases. The first phase was a pilot survey, in which 10 samples were collected to test how the respondents understood the primary list of questions and how much information the interviewers could collect from the face-to-face interviews. After the pilot survey, a few questions were changed, making them easier to understand for the respondents and thereby increasing the effectiveness in approaching the problem.
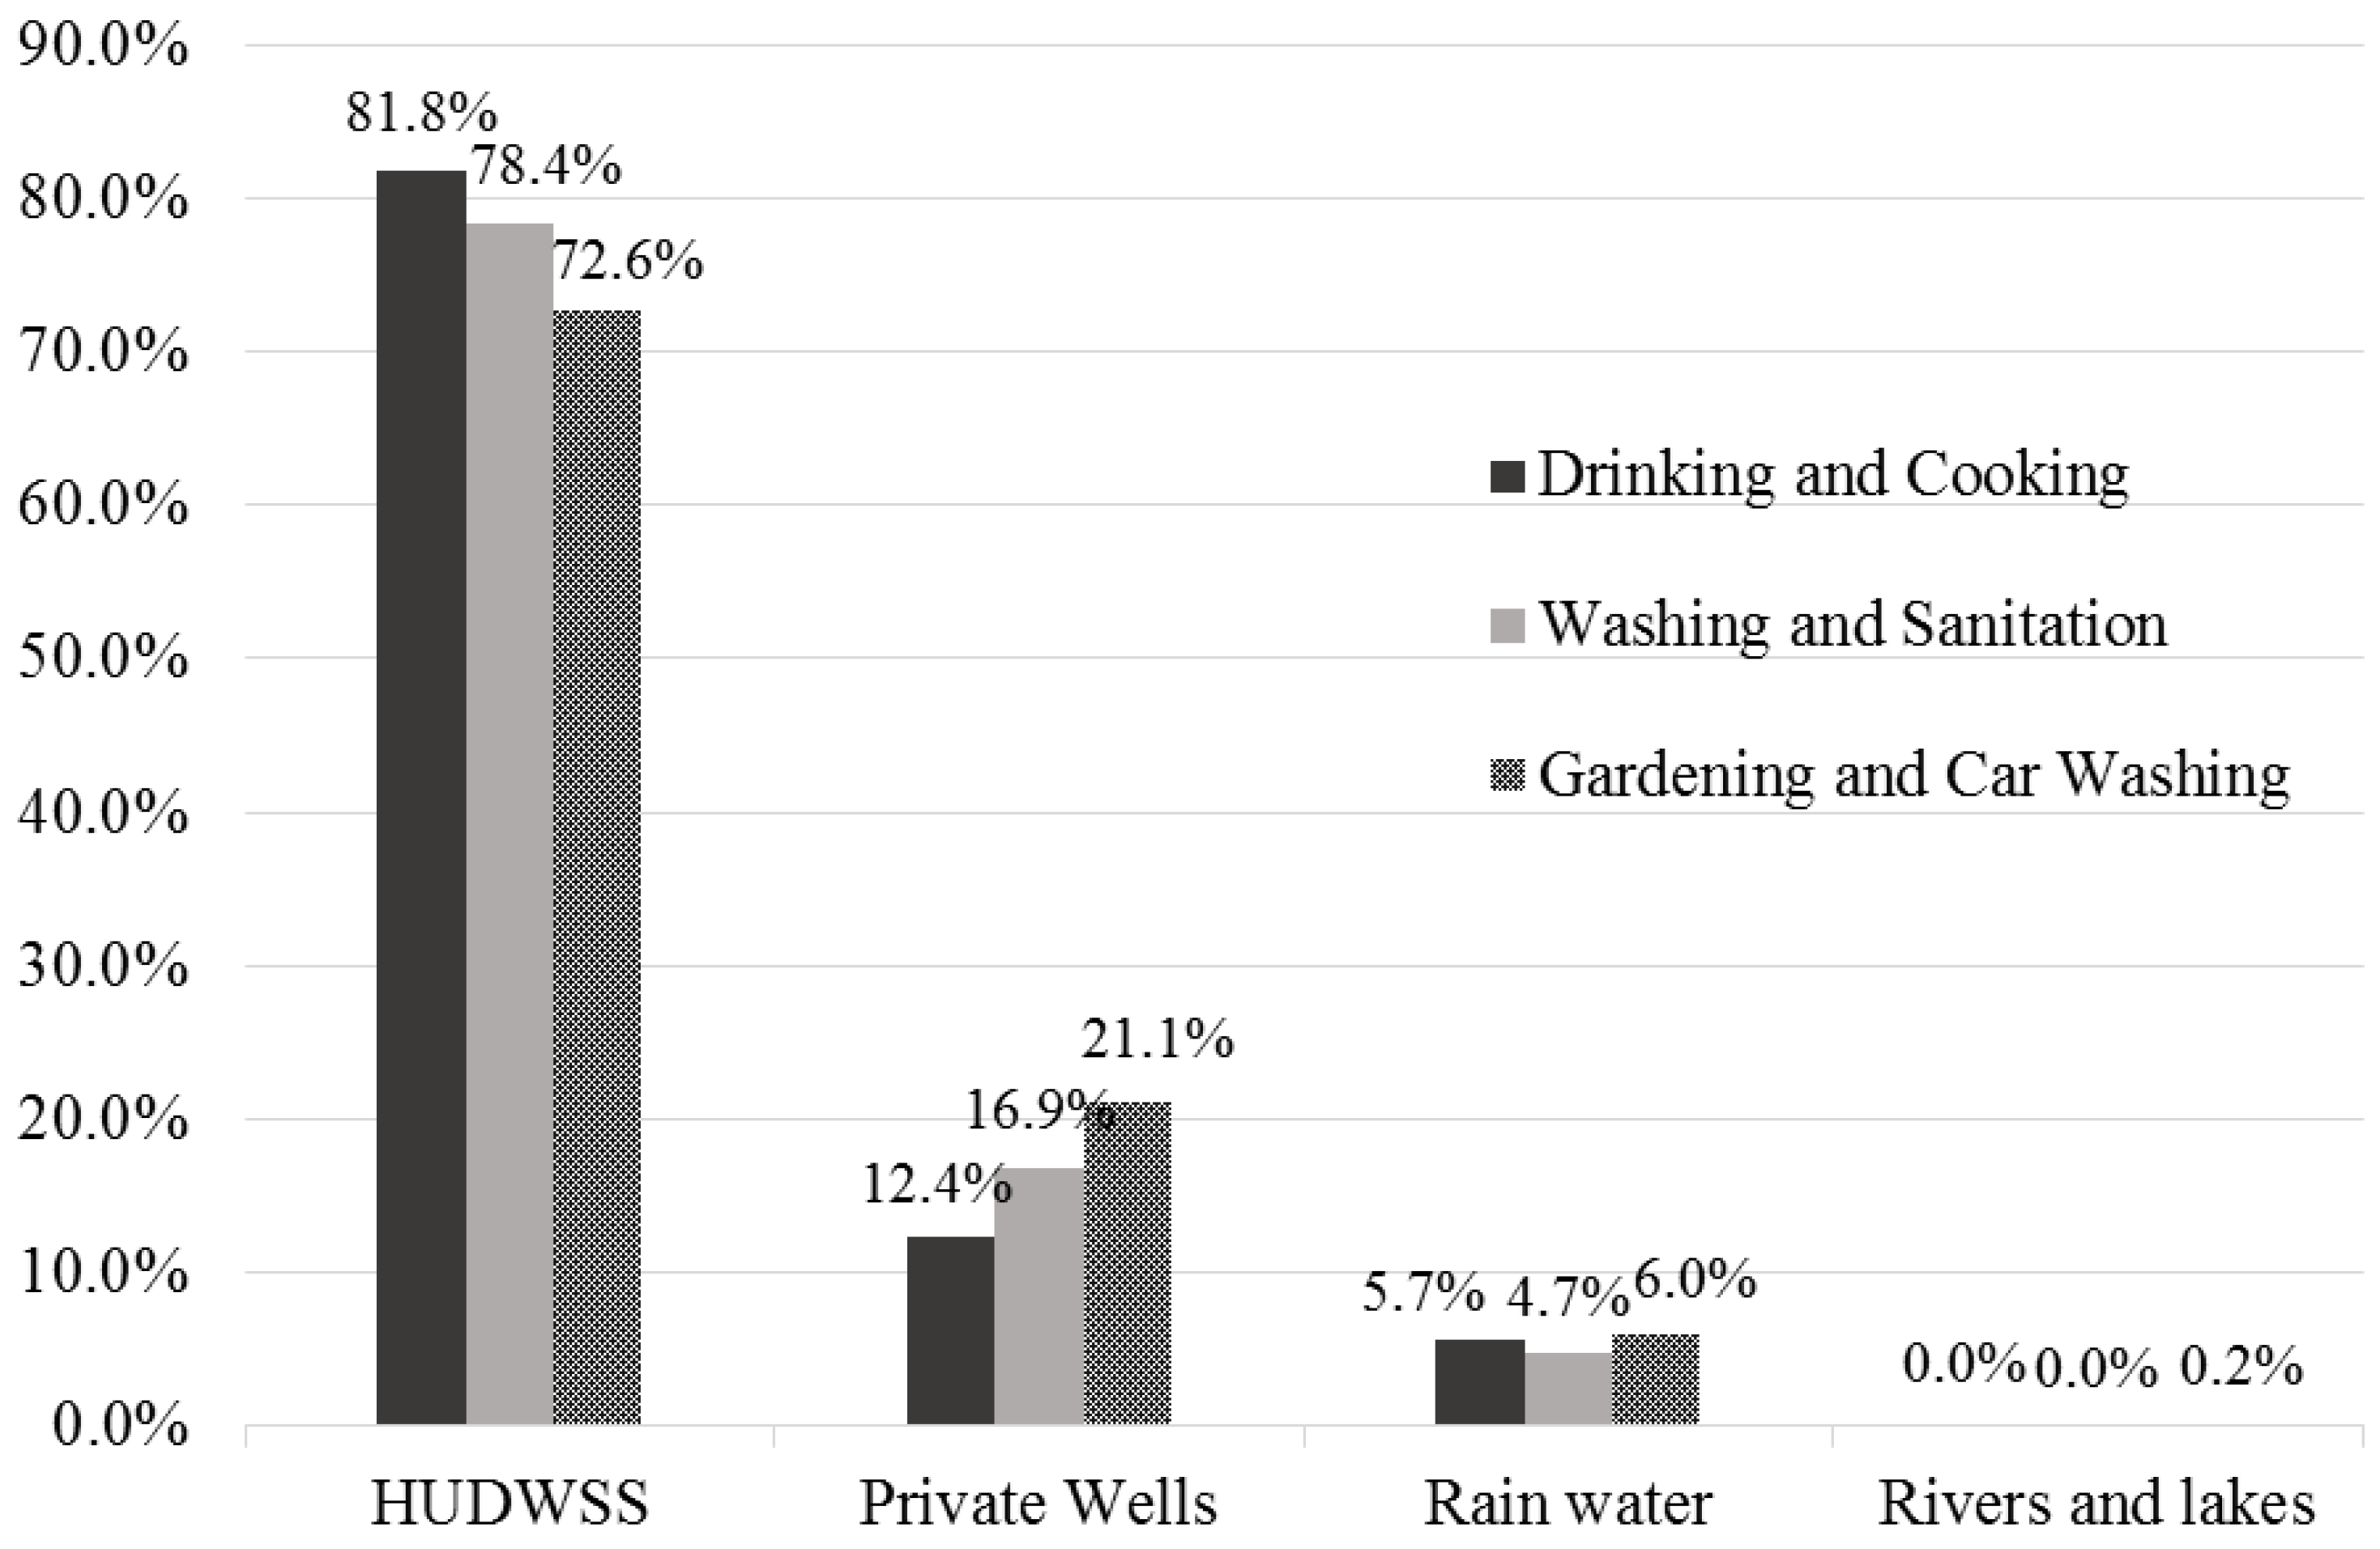
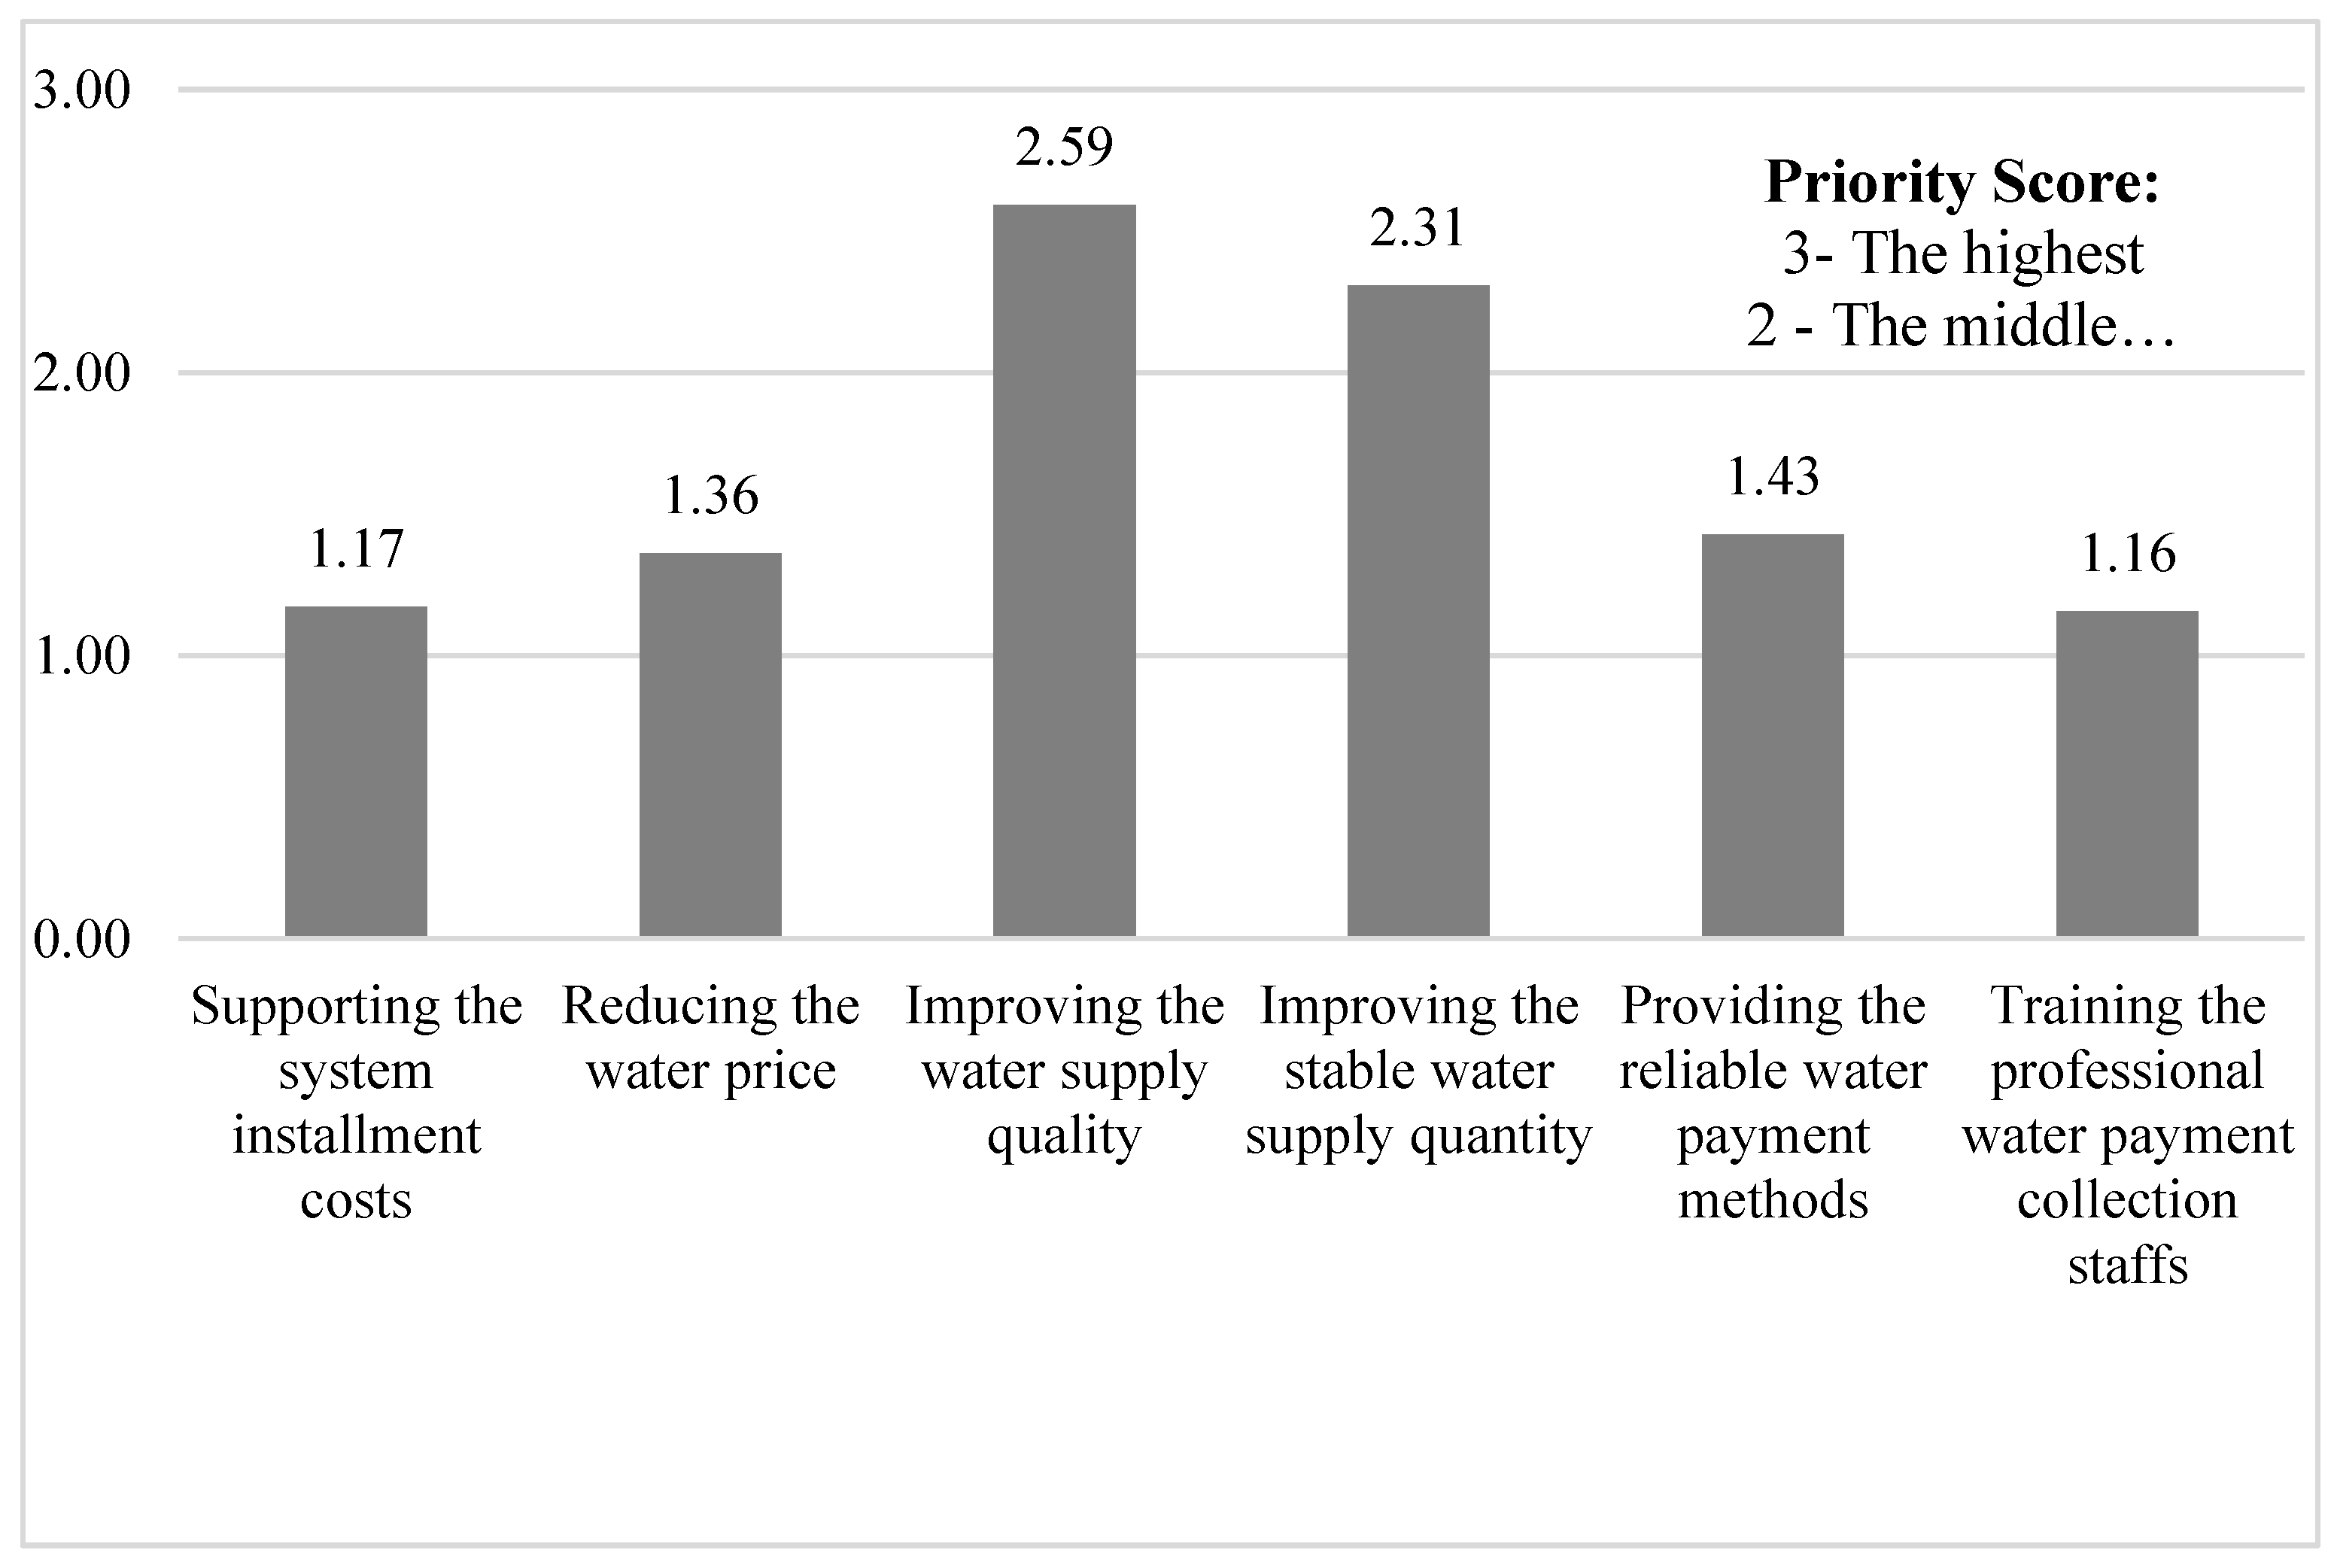
The final questionnaire consisted of five parts, as we needed to deal with respondents with and without a water supply from HUDWSS. The first part sought to understand which water sources were used for domestic purposes; the second part aimed to provide a list of questions for those who used water from HUDWSS. Here, we attempted to measure the satisfaction of the communities in terms of the quantity, quality, and management of the current domestic water supply; the third part addressed communities that did not use water from HUDWSS; the fourth part enquired about which aspects the communities wished to improve regarding the performance of HUDWSS and the amount that the communities were willing to pay for this improvement in the future; and the final part focused on the residential demographic variables such as age, gender, education level, and monthly income. The demographic information provided the basis for understanding the factors affecting the respondents’ WTP for the HUDWSS improvement.

3.2. The Naturally Exploring WTP Technique

To determine respondents’ WTP, one of the most widely used WTP questioning techniques is open-ended questions [37,39,40,41,42,43,44]. In an open-ended question, the respondents are asked to state the maximum amount they could pay for water-targeted improvement. The advantage of this technique is that the question is easy to understand and gives the respondents freedom in giving their WTP values. However, as highlighted in a previous study [38], the open-ended question technique can result in several “zero bids”, i.e., respondents indicating a WTP of zero. Therefore, to avoid this zero-WTP situation in our investigation, before asking about the residents’ WTP, we provided them with information about the price they are currently paying for 1 m3 of water supplied by HUDWSS. By doing this, their WTP values were at least equal to their current price for water use, the so-called WTP0. Thus, in practice, we used three consecutive questions to determine WTP values as the maximum amount that they were willing to contribute. The first question was “To improve the current HUDWSS to the level of your expectations, are you willing to support the water price?”. Upon answering YES to this question, they were asked the second question, “The current price of water supply is 7000 dong/m3, how much do you think that this current price could be increased to have a better budget for HUDWSS improvement?”. When answering the second question, respondents were offered several levels by which the current water price WTP
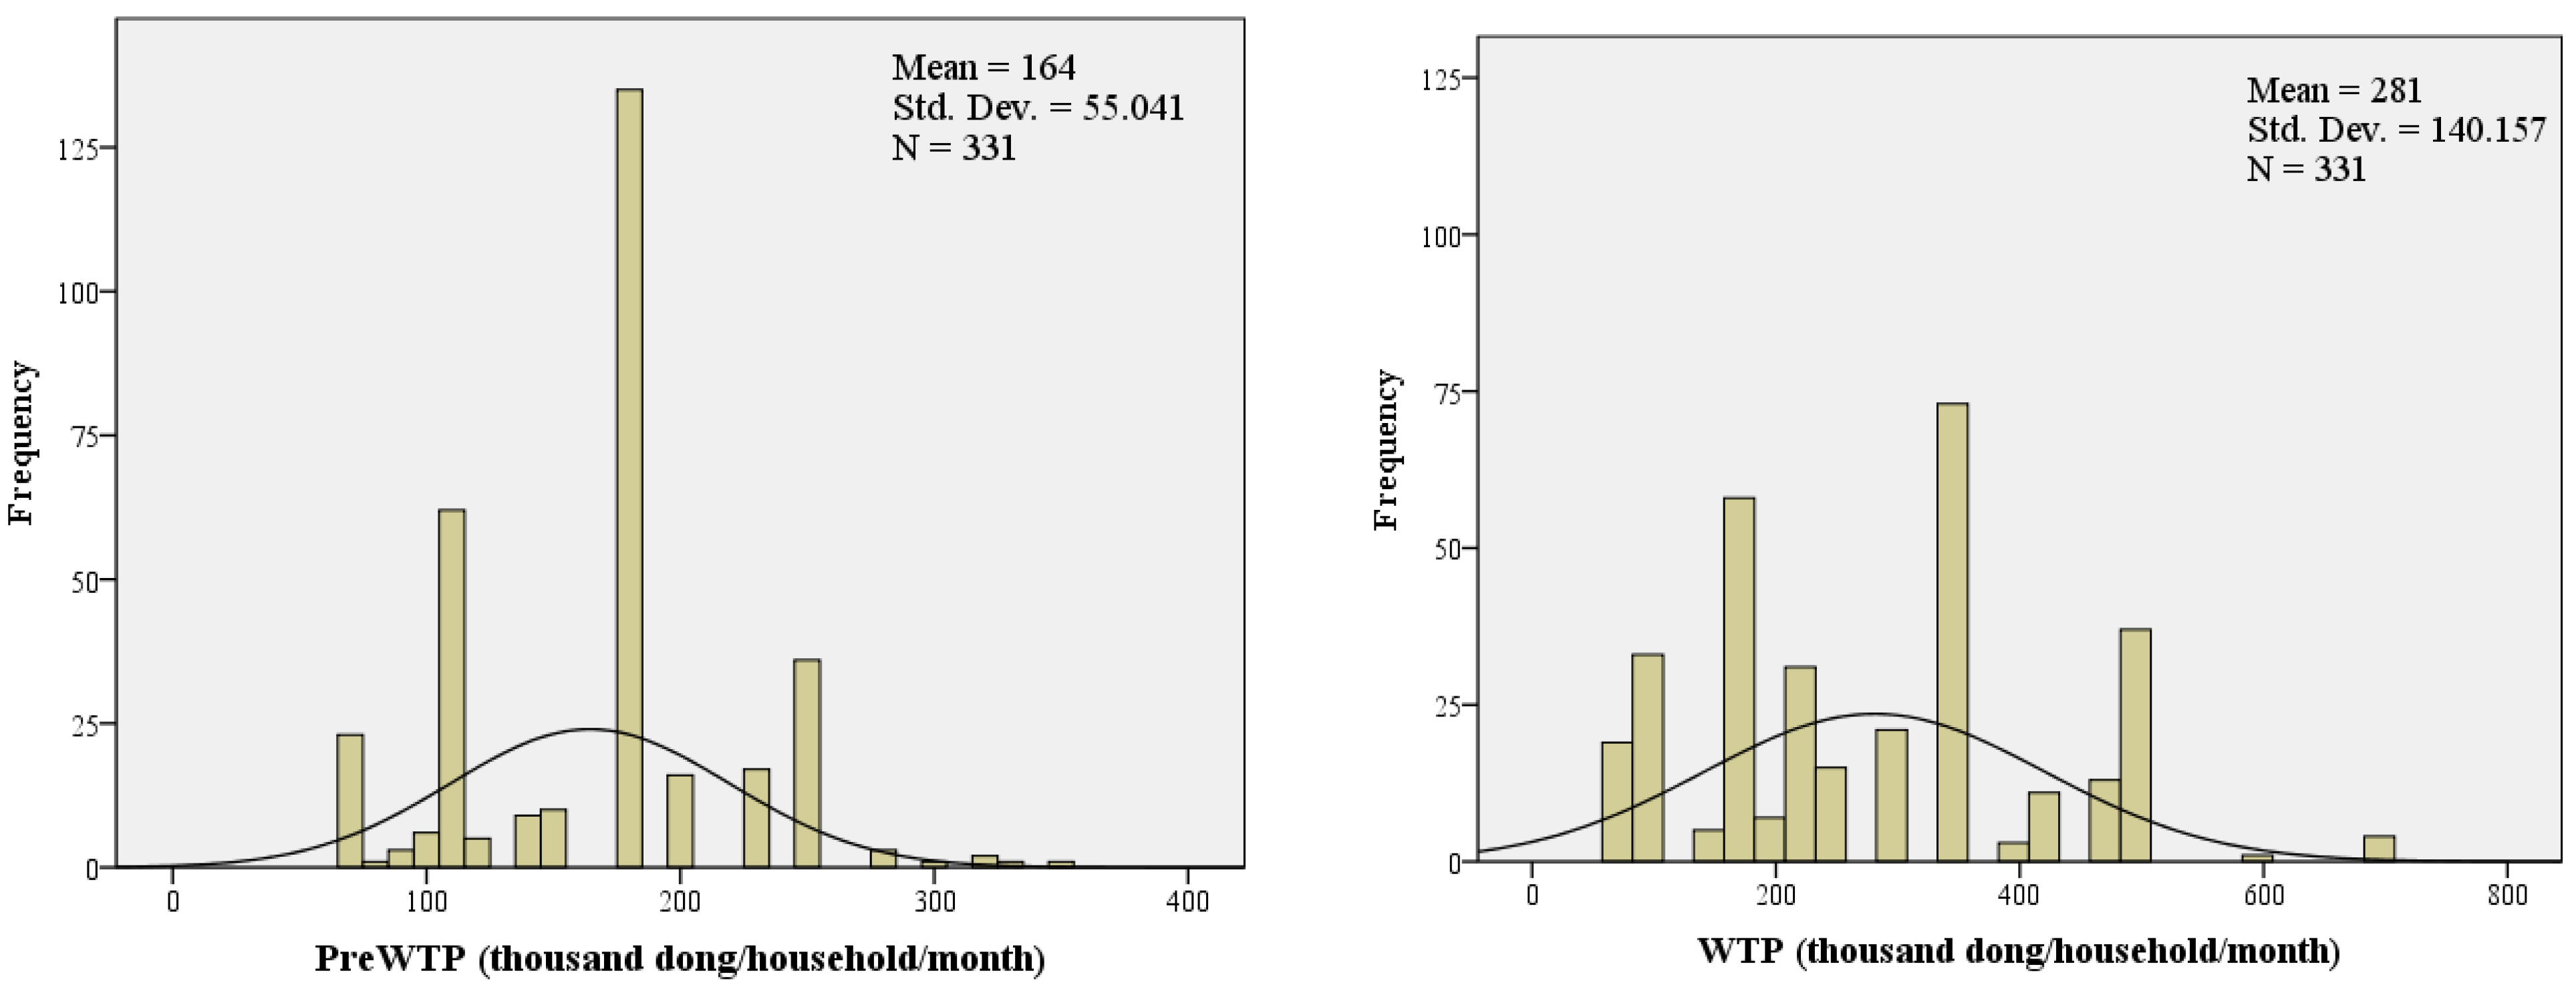
0 could be increased, resulting in pre-WTP values. The third question, “What is the maximum amount which you are willing to support to improve HUDWSS’s performance?”, was used to determine the maximum amount that the respondents were willing to pay, which is referred as their actual WTP values.

3.3. Sampling

The minimum sample size was determined according to Krejcie and Morgan [45]; for large areas, the number of participants required for the survey was calculated as follows:
s = X 2 N P 1 P d 2 N 1 + X 2 P 1 P
in which S: minimum sample size; X2: the table value of Chi-square for 1 degree of freedom at the desired confidence level (3.841); N: the population size; P: the population proportion (assumed to be 0.5 since this would provide the maximum sample size); d: the degree of accuracy expressed as a proportion (0.05).
The estimated population in these Hanoi urban communities was 3,962,310 in 2019. Thus, the minimum sample size was calculated as 384 samples. In this study, we first conducted a pre-test survey of ten samples of several staff working at the Hanoi University of Natural Resources and Environment and the residents living near this university in order to determine whether our questionnaire was understandable and appropriate. We then finalized the questionnaire and started conducting the comprehensive social investigation in the three most urbanized district representatives in Hanoi urban communities, including the newly urbanized Ha Dong and two old inner-city districts of Thanh Xuan and Hai Ba Trung (Figure 1). After three months of surveying from November and December of 2019 to January of 2020, we had randomly collected 454 samples. Among these, we could not use 52 samples, mainly due to missing information for more than 30% of the questions. Hence, the final data set comprised 402 samples, of which 91 samples were from the Ha Dong district (353,200 residents in 2019), 155 samples were from the Thanh Xuan district (286,700 residents in 2019), and 156 samples were from the Hai Ba Trung district (311,800 residents in 2019).

3.4. The Theoretical WTP Regression Model

In the literature, we found that 21 main factors/variables that could be considered to affect the WTP for water supply and water-related service improvement. These factors/variables could be divided into four groups: demographic factors, water supply quantity, quality, and service, as shown in Table 1. Therefore, the theoretical WTP regression model could be formulated as in Equation (2).
WTP = f(De; Quan; Qual; Ser) = CDe × De + CQuan × Quan + CQual × Qual + CSer × Ser + e
in which WTP is the dependent variable; De are demographic variables; Quan, Qual, and Ser are variables regarding water supply quantity, quality, and service, respectively; CDe, CQuan, CQual, CSer are coefficients; and e is the random error. The IBM Statistical Package for the Social Sciences (SPSS) was used to generate the WTP regression model and perform data analysis.
Selection of factors/variables in each group: Depending on the targeted water supply issues and the public preferences in a specific study area, the factors/variables of water supply quantity, quality, and service groups could be selected. In terms of demographic factors, this selection depended on the characteristics of the communities that the researchers wished to test for their correlations with the WTP.

3.5. Reliability Check

To validate the reliability of the responses in the questionnaire, we used a statistical measure of confidence consistency, namely Cronbach’s alpha coefficient, for a given sample. The coefficient formula is according to Equation (3), as indicated in [79].
α = K K 1 1 i = 1 K   σ Y i 2 σ X 2
in which K is the number of components (usual questions); σ X 2 is the variance of the observed total test scores, and σ Y i 2 is the variance of component i for the sample.
Reliability scale: As mentioned in [79], the coefficient values in the range of (0.9; 1.0), (0.8; 0.9), (0.7; 0.8), (0.6; 0.7), (0.5; 0.6), and (0; 0.5) indicate respectively excellent, good, acceptable, questionable, poor, and unacceptable internal consistency.

3.6. Application for HUDWSS

Applying our CVM-based process, we obtained 402 useable samples from the three urban districts. Using Equation (3), we find a value for α of 0.879 for the responses to the group of questions regarding the type of water used daily; 0.863 for the responses to the questions regarding the residential satisfaction towards HUDWSS‘s water consumption; 0.943 for the responses to the questions regarding the residential satisfaction towards HUDWSS’s water quality; and 0.865 for the responses to the questions regarding the residential satisfaction towards HUDWSS’s service and management. These coefficients are all higher than a threshold value of 0.8, indicating that the obtained responses are internally consistent and reliable. Therefore, the data set obtained from these 402 reliable responses was used for further analysis.
Table 2 provides further details about the characteristics and status of the survey sample. From the total of 402 people interviewed, 208 (51.7%) were female, and 194 (48.3%) were male. The majority of the respondents’ ages were in the range of 24 to 55 years (66.9%), and only one respondent was under 18 years old (0.2%). Of the five occupation groups mentioned in the questionnaire, business was the most common, accounting for 46.3% of all occupations. The level of education of the surveyed subjects was partly reflected through their occupation. The more educated subjects were aware of the importance of clean water and the impact of inadequate water quality on their health. It was observed during the pilot survey that interviewees did not wish to disclose their actual incomes due to various personal reasons. Consequently, dividing the total family income into ranges of values in this study made the respondents more comfortable in indicating their relative income. The number of respondents with a total family income of between 10 to 30 million VND (approximately between 434 to 1304 USD) accounted for half (51.7%) of the sample.

4. Results and Discussion

Here we first present the current public awareness, satisfaction, and expectations of HUDWSS quantity, quality, and service that are described to allow for a better understanding of the urban community perceptions and to evaluate the use of the naturally exploring WTP technique on Hanoi’s dataset. This is followed by a comparison of the usual statistic variation in both Pre-WTP and WTP values. Finally, we describe the establishment of the WTP regression model based on the theoretical regression framework presented in the methodology to assess how the community’s maximum willingness to pay was affected by demographic and domestic water-related factors.

4.1. Social Satisfaction of the HUDWSS’s Quantity, Quality, and Service

We divided the sample into two groups: households using water from HUDWSS, comprising 331 respondents (82.3%), and households not using water from HUDWSS, comprising 71 respondents (17.7%). Hence, water from HUDWSS, or “tap water”, is most widely used in the inner city of Hanoi (Figure 2). The percentage of those using tap water for cooking and eating purposes accounted for 81.8%, while some households still used well water (12.4%) and rainwater (5.7%). For other purposes, such as bathing, sanitation, gardening, and car washing, the percentage of water usage remained at the highest levels, at 78.4% and 72.6%, respectively. The reason for this was that there were 35 households (approximately 8.7% of the total 331 households using water from HUDWSS) using two or more water sources along with water from HUDWSS. Using alternative water sources is considered to be more advantageous because of their convenience and the low cost of installation. Around 17.7% of households did not have access to tap water for various reasons. There were three subjective reasons discovered through the survey: (i) unstable, dripping, and limited water supply; (ii) no water quality guarantee; and (iii) the limited maintenance service of the supply system.

4.2. Residential Satisfaction of Domestic Water Quantity

The ability to provide a sufficient amount of water by HUDWSS to consumers depends on many factors and was examined objectively through direct interviews with the residents. The survey results show that monthly water consumption and water cut-off status directly influenced the extent to which residents’ consumption needs were met. Most (55%) of the surveyed households usually used 20 to 30 m3 daily, and water consumption was gradually reduced with the number of members in the household and the use purpose. However, there were still a small number (7.9%) of households with a high water demand of over 30 m3 per day, usually for business and production purposes. In general, the amount of water consumption was relatively high, and this is expected to rise in the future. Therefore, a calculation based on the number of days and monthly times of water cut-off was performed to evaluate whether the water supply was adequate. The amount of water supplied by the city water supply companies was considered to be relatively sufficient. In particular, 77.3% of the surveyed respondents said that the water was sufficiently supplied. In addition, the households with a water cut-off of 1 day, 2 days, and 3 days per month accounted for 15.4%, 6.6%, and 0.6%, respectively (Table 3).
Most of the subjects were relatively satisfied with the amount of water provided. The ability to meet from 80% to 100% of the demand for users accounted for 74% of the total population surveyed. In addition, the amount of water meeting more than 100% of the water consumption demand accounted for 18.7% of the total population surveyed. The remaining residents considered that the supplied water was insufficient for use. The survey results show that households that used less water had enough water to use. As for some cases where households required large amounts of water (>30 m3) or had frequent water cut-offs, respondents were not satisfied and underestimated the water supply capacity of HUDWSS (Table 3).

4.3. Residential Satisfaction of Domestic Water Quality

According to the survey results, the households using water from HUDWSS responded that they used clean water. Approximately 9.4% of the households mentioned that the water sometimes had a different color or taste, and others commented that the water was cloudy (3.9%). Besides the general public response regarding domestic water supply quality, the water quality nevertheless still could not meet the residents’ standards because, according to our results, 80.4% of households use advanced water purifiers before cooking and drinking. For the rest, depending on the household income and also the perceptions of the household decision-makers, households boiling their water before use accounted for 15.4%, and households that did not use any kind of treatment accounted for only 4.2%. The results reveal that there is a need to improve HUDWSS to meet the standards of the local communities. For further information on health impacts related to water supply quality, we also considered waterborne diseases such as diarrhea, skin diseases, gynecological diseases, dengue fever, Japanese encephalopathy, and helminthic infection in the three urban districts. As shown in Table 4, the proportion of residents who had not suffered from any waterborne disease accounted for 90%, but 10% of the respondents had been affected by the aforementioned water-borne diseases.

4.4. Residential Satisfaction of Domestic Water Service

The questionnaire survey for households using the water supply from HUDWSS showed that the service is relatively acceptable. In terms of the water bills, approximately 60% of respondents’ monthly payments ranged from 200,000 to 500,000 dong/month (approximately 9 to 22 USD at the exchange rate of 1 USD to about 23,000 VND on the first day of 2020); 35% had to pay less than 200,000 dong/month (mostly households with few members and households who used water from alternative water sources, such as private wells, rivers, and lakes); and approximately 5% were mainly business-based households and paid more than 500,000 dong/month.
Convenient and multiple payment methods are crucial in increasing residents’ satisfaction with HUDWSS’ service quality. As investigated in our study, there were three main payment methods, with those utilizing smartphone apps and computers accounting for 38.1%, those using home-visiting staff accounting for 35%, and those using supermarkets/post offices accounting for 26.9% (Table 5). This shows that modern payment methods via apps and third-party stakeholders have taken a strong foothold over the traditional home-visiting payment method. The transition is quite important for busy urban households in Hanoi, where modern residents spend most of their time away from their houses.
Regarding water scarcity in urban districts and the limitation of the water supply system’s capacity, especially during the summer season, urban districts in Hanoi sometimes face several days without water supply. We found that the urban communities in Hanoi wish to receive water cut-off notifications from the suppliers. In this study, water cut-off notification refers to the interruption announcement of water supply. Most households (77.3%) did not experience days without a water supply. However, around 11.5% of households received water cut-off notifications from the community’s bulletin and only 0.6% of them received written notices from the water companies. Among the residents who experienced days without a water supply, around 6.6% of households said that they did not receive any notification before this happened (Table 5).
Furthermore, we found a lack of regular checks and maintenance for HUDWSS even though these services are essential to ensure that the system is still working well. As observed in our study, almost two-thirds of the respondents (58%) confirmed that the local water system had existed for more than ten years, and 11.5% relied on a system that had even been installed more than fifteen years ago. New systems, which had been installed less than five years ago, accounted for only about 10% of the respondents. However, almost 40% of the respondents complained that there was no maintenance service. Only half of the local systems were regularly checked and maintained (Table 5). The lack of maintenance service explains why the non-revenue water proportion in Hanoi remains high, despite recent efforts to reduce it, as shown in Section 2.

4.5. Social Needs Priorities for HUDWSS Improvement

Given the current state of HUDWSS, with its many shortcomings, an important issue is how residents’ would like the quality of the water supply services to be improved. We examined the work needed to improve the HUDWSS in the questionnaire, which the respondents evaluated based on the priority of the tasks to be carried out (Figure 3). According to the community’s assessment, “improving the quality of water supply” should be prioritized first, followed by “the amount of water needs to be stabilized regularly”. Other issues related to the management and service quality were not a priority but still need to be dealt with in the future. Therefore, to realize these improvements, the question is as follows: Are residents willing to pay higher water prices to obtain more funding in order to improve the quality and quantity of the water supply?

4.6. Household Positive Pre-WTP and WTP for Improved HUDWSS

Among the 402 survey respondents corresponding to 402 households, 331 used water from HUDWSS and the remaining 71 did not. Therefore, resulting from the naturally exploring WTP technique, both the Pre-WTP values—resulting from the answer to the question on how many of the respondents think the current price could be increased—and WTP values—resulting from the question on the maximum willingness to pay—were evaluated based on the interview results of the 331 households that used water from HUDWSS. The changes in the respondents’ willingness from Pre-WTP to WTP are shown in Table 6 and Figure 4. When answering the question about Pre-WTP, around 71% of households stated that their willingness was equal to the current water supply price of WTP0 = 7000 dong/m3 (approximately 0.3 USD). Around half of these households increased their willingness to pay higher values when stating their maximum levels of WTP. This change indicates that 35.6% of households were willing to pay 14,000 dong/m3 (approximately 0.6 USD). The highest pre-WTP value of 13,000 dong/m3 was replaced by 20,000 dong/m3 as the highest value of WTP. By multiplying the obtained pre-WTP and WTP values per m3 of water supply with the corresponding average monthly water use of the households, the pre-WTP and WTP values per month could be evaluated. Thus, as seen in Figure 4, the pre-WTP mean also increased from 164,000 dong/household/month (approximately 7 USD) to a mean WTP of 281,000 dong/household/month (about 12.2 USD). A substantial proportion (22.1%) of households were willing to pay the highest amount, equivalent to 350,000 dong/household/month (about 15 USD). For each targeted district, the mean WTP in the Thanh Xuan district was approximately 278,000 dong/household/month (about 12.1 USD), equivalent to 1.4% of the total average income of households; in Hai Ba Trung district, the mean WTP was the highest, approximately 286,000 dong/household/month (about 12.4 USD), equivalent to 1.5%; and the mean WTP in Ha Dong district was the lowest, at approximately 270,000 dong/household/month (about 11.7 USD), equivalent to 1.4% of the total average household income. Overall, the mean WTP of all three districts was equivalent to approximately 281,000 dong/household/month (about 12.2 USD), which is equivalent to 1.4% of the total average income of households. In this case, our proposed WTP exploring technique helped the respondents to determine their maximum willingness values, offering them the freedom to provide their figures rather than selecting from a set of proposed values. This allowed the respondents to carefully consider their needs in order to obtain water at their recommended rates. The average estimated WTP value of the three districts in general, and the value of each district, in particular, did not exceed 2.5%, as established by the United States Environmental Protection Agency (US EPA) as an indicator of the affordability of monthly water payments among citizens.

4.7. Determining and Analyzing the Factors Affecting the WTP Values of the Respondents

Determining the variables included in the WTP regression model is important to understand the factors that affect WTP. In this study, the variables were determined and selected based on two criteria. First, based on the synthesis of 21 common factors grouped into four categories, as shown in Table 1, this study also clarified the main factors from these four common groups. In the first group of demographics, we considered the five variables of gender, age, income, family size, and occupation, as these variables are usually measured in the literature regarding CVM applications. Second, based on the actual situation of HUDWSS’ performance, the variables of water supply quantity, quality, and service were selected and proposed in this study. For the group of water supply quantity, the water use variable referred to the average monthly amount of water consumption in households; regarding the quantity variable, this measured how satisfied the respondents were with the water supply quantity. The water supply quality group included the quality variable, which measured whether the water met the quality standards of the communities, and the treatment variable, which referred to the water purification methods that the households usually used before cooking and drinking. The water supply service here consisted of three variables measuring how well and conveniently the HUDWSS’ service could assist their customers in using the water supply. The payment method variable considered the way in which the households paid their monthly water bills. The maintenance variable evaluated how often the household’s water supply equipment was checked and maintained to prevent non-revenue water. The notification variable measured whether the communities were informed before the water supply was cut off. As a result, 12 independent variables were selected and proposed to affect the WTP for improving the quality of the HUDWSS service. The descriptions of these variables are also given in Table 7. Moreover, the dataset obtained from any social questionnaire survey is usually complex, causing skewing problems. In this study, we thus applied the log transformation method for the values obtained for the income and WTP variables in order to reduce the data complexity. The transformation rules for all the dependent and independent variables of the WTP regression model are described in detail in Table 7.
Regression analysis for 331 households using water from HUDWSS was conducted. The results of the regression model are shown in Table 8. The specified regression function fit the estimated mean WTP of individual respondents, as indicated by an R2 estimated at 0.314, and the standard error of this estimation is approximately 0.208. The results show that age significantly (at 0.1 significance level) affects the mean WTP of respondents. More specifically, the older the respondent, the higher their mean WTP. As expected, similar to the situation in many other developing countries [19,36,37,56,58,63], income affects the mean WTP of respondents significantly (at 0.05 significance level); the higher the household income, the higher the mean WTP of the respondent. The results also confirm economic theory, which states that an individual/household’s demand for a particular commodity depends on his/her income [38]. The effects of gender are significant (at 0.05) and negative, implying that men are willing to pay more for improved HUDWSS than women. This is contrary to the assumption that women are more likely to pay more because they invest more time in household activities and have a greater need for water for domestic purposes, as suggested by the findings of Ayanshola et al. [80]. The effect of water use is significant (at 0.01 level) and positive, and the greater the amount of water used by a household influences the WTP for the improvement of the HUDWSS service. It is interesting to note that the payment methods and maintenance variables, which were proposed for the first time in this study for the targeted HUDWSS, appear to positively affect the respondents’ WTP and are also respectively significant, at 0.1 and 0.01 levels. This implies that households that used modern payment methods were willing to pay more to improve the water supply service, and households that have regular water supply system maintenance checks by staff are also willing to pay more to improve the water supply service than other households whose water supply systems are not maintained.
The other variables seem to be insignificant in the level of p = 0.1 influencing respondents’ WTP. Specifically, the occupation of respondents does not seem to have a significant impact. This finding is similar to other related studies conducted using CVM for the improvement of the domestic water supply system in Nigeria [38] and in Palestine [49]. The number of people in each household (family size) usually appears to positively affect WTP, as found by Byambadorj and Han [54]; Akeju et al. [38] and Fujita et al. [55]. However, in our study, this variable negatively affected the respondents’ WTP and is statistically insignificant at (p-value = 0.1). The water quantity and water quality satisfaction seem to positively affect the respondents’ WTP but are also not significant at (p-value = 0.1). Moreover, the effect of the treatment variable was negative and is statistically insignificant at (p-value = 0.1), as similarly found by Rodríguez-Tapia et al. [39]; Guilfoos et al. [75]; Orgill et al. [76] and Odwori [68]. The effects of the water cut-off notifications were positive and do not seem to be significant at the level of p-value = 0.1.

5. Conclusions

This study successfully proposes a CVM-based process and tests its effectiveness in an investigation of Hanoi urban communities WTP regarding the improvement of HUDWSS. Our results show that Hanoi urban communities were essentially satisfied with the water supply quantity, as our investigation found that more than 90% of surveyed respondents considered their water supply to be mostly sufficient. The water quality was still lower than the quality expectations of the urban residents since most households (80.4%) used advanced purifiers to treat the tap water before drinking and cooking. Almost half of the respondents complained about the lack of maintenance services. From the regression model results, we found that significant factors (at p-value = 0.1, 0.05, and even 0.01) affecting the WTP are gender, age, income, water use, payment method, and maintenance; meanwhile, occupation, family size, quantity and quality satisfaction, treatment, and notification were found to be insignificant factors (at p-value = 0.1). These findings reveal the crucial role of understanding the target problems in selecting and proposing appropriate variables to increase the effectiveness of the WTP regression model. Our results also show that the naturally exploring WTP technique proposed in this study makes it easier for both respondents and interview conductors in determining the WTP values. The average WTP is approximately 1.4% of the average household income, well below the 2.5% threshold established by the US EPA as an indicator of the affordability of monthly water payments among citizens. However, the implementation of policies will take several years, especially in developing countries such as Vietnam, where the average household income is considered low compared to other developed countries, and should take into account the varying income levels among households. This shows the practicality of a future social investment fund contributed to by the communities that is used for upgrading and improving the quality of Hanoi’s urban water supply services. The willingness to pay (WTP) technique offered genuine results that helped to make realistic recommendations to the policy- and decision-makers without any complications. The methodology that we developed for this study can be applied to any similar area, without any geographical limitations, in several STEM and social science subjects and multidisciplinary fields. These characteristics make this model unique and easy to use in all circumstances.
Following are several remarks about how to get highly reliable data in such CVM applications. One thing was asking the cooperative residents who were willing to spend more than 15 min to finish the questionnaire. This thing mainly depended on how the interview conductors started asking the questions. Another factor involved about the investigation approach, which significantly affected the reliability of the collected data. Using email and Google Forms i could reduce the survey time and make it more convenient to complete, but the reliability of the obtained data is usually low in comparison to the face-to-face interviewing approach. In this study, the face-to-face interviewing approach was employed to maximize the possibility of obtaining highly reliable data. The reason is that the respondents usually do not fully understand all the questions, thus the interview process should be like a friendly discussion. Particularly in the CVM investigation, the respondents should imagine the unreal market and give the most proper payment for the goods (domestic water supply, in this case). The friendly face-to-face discussion was thus crucial to help the respondents in finding their appropriate WTPs. Moreover, as experienced from our investigation, mentioning the current water price of WTP0 = 7000 dong when asking about the WTP really affected the respondent’s opinions. All of the obtained Pre-WTPs and WTPs were higher than WTP0. That means that the respondents thought of the WTP0 as their acceptable minimum payment for 1 m3 of water. In addition, the WTP0 could also give us the possible variation range of respondent WTPs. In our case, no respondents gave a WTP of more than three times the WTP0 (i.e., about 21,000 dong). Therefore, in order to obtain a highly reliable data set, it is possible to eliminate the response where the WTPs are higher than 3*WTP0. Regarding future research, we would like to apply the same methodology by combining physical (water quality and quantity) and social science (people income, employment, gender) components in other similar areas in Vietnam. Moreover, we would like to expand our study area to other South Asian countries, such as India, the Philippines, Sri Lanka, and China. Our collaborators have also shown interest in applying this unique method to the countries mentioned above.

Author Contributions

Conceptualization, N.T.B., D.D.B., J.M.R.M., S.D., K.K. and T.N.T.; methodology, N.T.B., T.T.H.N. and H.T.H.; software, T.Q.V.; validation, N.T.B. and T.Q.V.; formal analysis, N.T.B. and T.Q.V.; investigation, N.T.B. and T.Q.V.; resources, N.T.B. and T.Q.V.; data curation, N.T.B. and T.Q.V.; writing—original draft preparation, N.T.B., J.M.R.M., T.T.H.N., T.T.P.B. and T.Q.V.; writing—review and editing, J.M.R.M., S.D. and K.K.; visualization, N.T.B., T.N.T. and T.Q.V.; supervision, S.D. and D.D.B.; project administration, S.D. and D.D.B.; funding acquisition, S.D. and D.D.B. All authors have read and agreed to the published version of the manuscript.

Funding

This research was funded by the Vingroup Innovation Foundation, grant number VI-NIF.2019.DA17 and the UK Natural Environment Research Council (NE/S002847/1).

Institutional Review Board Statement

The authors certify that all data collected during the study are presented in this manuscript; no data has been or will be published separately. The researcher team has an obligation to conduct this research with integrity and transparency. The researcher team has protected and respected all personal data provided by participants through rigorous and appropriate procedures for confidentiality and anonymisation. The research was approved by the Hanoi University of Natural Resources and Environment with approval code 1873/TDDHHN.

Informed Consent Statement

Informed consent was obtained from all subjects involved in the study.

Data Availability Statement

The data presented in this study are available on request from the corresponding author.

Acknowledgments

The authors would like to express our gratitude to Lucia Wright Contreras at URBANgrad, Technical University of Darmstadt, Germany for her excellent comments; to Hoang Nam Nguyen at the Faculty of Urban and Environmental Natural Resource Economics & Management, National Economics University for his guidance; and to the students of class DH7QM1 (Nga, Nguyen, Tinh, Hoan) at the Faculty of Environment, Hanoi University of Natural Resources and Environment, Vietnam, in conducting the field survey.

Conflicts of Interest

The authors declare that they have no conflict of interest.

Appendix A

HANOI UNIVERSITY OF
NATURAL RESOURCES &
ENVIRONMENT
  SOCIALIST REPUBLIC OF VIETNAM
Independence—Freedom—Happiness
Water 14 02161 i001
QUESTIONNAIRE FOR HANOI URBAN COMMUNITIES TO IMPROVE
THE DOMESTIC WATER SUPPLY SERVICE
(Translated from the Vietnamese version)
Safe drinking water in both quantity and quality is an essential need of all communities. With a densely populated population like the capital Hanoi, ensuring a high quality source of drinking water for the communities becomes more urgent than ever. In order to improve the domestic water supply service for the capital, we are a research team from Hanoi University of Natural Resources and Environment. We would like to conduct a survey to have a better understanding of the current situation of Hanoi urban domestic water supply service. Filling out this survey will take about 15 min from Sirs/Madams. The research team commits that all information Sirs/Madams provide by filling this questionnaire will be treated as confidential and will be used for scientific purposes only.
Thank you very much for your kind cooperation!
(Please put an X mark in the bank square in front of your choices)

Appendix A.1. Questions about Water Resources Used for Domestic Purposes

Appendix A.1.1. What Is the Main Source of Water You Use for Cooking and Eating?

Water supply from city water company
Well water
River and lake water
Rain water

Appendix A.1.2. What Is the Main Source of Water That You Use for Washing and Sanitation?

Water supply from city water company
Well water
River and lake water
Rain water

Appendix A.1.3. What Is the Main Source of Water You Use for Gardening and Car Washing?

Water supply from city water company
Well water
River and lake water
Rain water

Appendix A.2. Questions for Those Who Use the Hanoi Urban Domestic Water Supply

Appendix A.2.1. Could You Please Tell Me, How Much in % the Amount of Supply Water Meets Your Family’s Water Need?

Less than 50%  50–60%  60–80%  80–100%  Over 100%

Appendix A.2.2. How Much Is Your Family’s Monthly Water Consumption?

Less than 10 m3  10–20 m3  20–30 m3  Over 30 m3

Appendix A.2.3. How Much Is Your Monthly Water Bill?

Less than 200,000 dong  200,000–500,000 dong
500,000–1,000,000 dong  Over 1,000,000 dong

Appendix A.2.4. How Many Days Does Your Family Have No Domestic Water Supply in a Month?

No water cut-off
1 day/month
2 day/month Over
3 day/month

Appendix A.2.5. During the Water Cut Off Day, How Long Is the Period of Water Cut-Off?

Within 6 h
Within 12 h

Appendix A.2.6. Did You Receive Notice before Water Cut-Off Day? If Yes, What Is the Method of Notification?

No notification
Receive from water supply company (HAWACO) website
Receive from the community’s radio
Receive from the community’s bulletin
Receive from HAWACO documents

Appendix A.2.7. How Do You Feel about the Current Water Quality?

Clean water (colorless, odorless, and tasteless)
Water is cloudy, scum
Water sometimes has color/smell/taste
Water often has a strange color/smell/taste

Appendix A.2.8. How Do You Treat Water before Drinking/Cooking?

Advanced water purifiers
Just boiling
No treatment, just use directly

Appendix A.2.9. The Following Are 06 Water Borne Diseases. Have You or Anyone in Your Family Suffered from Any of the Water Borne Diseases?

Not yet
Slightly
Diarrhea
Skin disease
Gynecological diseases
Dengue fever, Japanese encephalopathy
Helminthic infection

Appendix A.2.10. For How Long the Water Supply System You Are Using Has Been Installed?

Less than 5 years  5–10 years  10–15 years  Over 15 years

Appendix A.2.11. Has Your Water Supply System Been Regularly Maintained?

Don’t know
No maintenance service
Regularly checked and maintained

Appendix A.2.12. What Is Your Family’s Water Monthly Payment Method?

Via home-visiting staff
Via supermarket/Post office
Via apps on smart- phone/computer

Appendix A.3. Questions for Those Who Do Not Use Hanoi Water Supply

Appendix A.3.1. What Are Your Main Reasons for Not Using The Water Supply?

Expensive installation cost
Too high water price compared to our water affordability
The water quality is not high enough
Unstable and dripping water
Unreliable water payment methods

Appendix A.3.2. Under the Difficulty of the Current Polluted Natural Water Sources in and nearby Hanoi, Do You Use One of the Following Treatment Methods before Using Water for Drinking Purposes?

Advanced water purifiers
A sand gravel filter
Just boiling

Appendix A.3.3. Do You Plan to Use the Water Supply for Domestic Purpose in the Near Future?

No
Yes, we will

Appendix A.4. Questions of Which Aspects of Hanoi Water Supply System the Communities Expect to Be Improved

Appendix A.4.1. Please Number in Descending Order of Priority (3—The Highest Priority; 2—Igh Priority; 1—No Priority) the Things to Do to Improve Hanoi Water Supply System Service?

Supporting the system installment costs
Reducing the water price
Improving the water supply quality
Improving the stable water supply quantity
Providing the reliable water payment methods
Training the professional water payment collection staffs

Appendix A.4.2. To Improve the Performance of Hanoi Urban Domestic Water Supply System as You Expected, Are You Willing to Support the Water Price?

Yes
No, my family’s income is low
No, I’m afraid our support will not be used properly

Appendix A.4.3. The Current Price of Water Supply Is 7000 dong/m3, How Much Do You Think That This Current Price Could Be Increased to Have a Better Budget for HUDWSS Improvement?

….………………………..
What is the maximum amount which you are willing to support to improve HUDWSS’s performance?
….………………………..

Appendix A.5. Questions of Personal Information

a. Living area (District): ………………………………………
b. Gender: ……………………………………...
c. Age:
Less than 18 years old  18–24 years old
24–55 years old  Over 55 years old
d. Current job:
StudentWorker
Employees and officer  Work at home
Business
e. Number of people in your family: …………… people
f. Total family income:
Less than 3 million dong  3–5 million dong
5–10 million dong  10–30 million dong
Over 30 million dong
Thank you very much for your kind assistance!

References

  1. UN-Water. Water Scarcity; United Nations Water: San Francisco, CA, USA, 2014. [Google Scholar]
  2. Vairavamoorthy, K.; Gorantiwar, S.D.; Pathirana, A. Managing urban water supplies in developing countries—Climate change and water scarcity scenarios. Phys. Chem. Earth 2008, 33, 330–339. [Google Scholar] [CrossRef]
  3. He, C.; Liu, Z.; Wu, J.; Pan, X.; Fang, Z.; Li, J.; Bryan, B.A. Future global urban water scarcity and potential solutions. Nat. Commun. 2021, 12, 4667. [Google Scholar] [CrossRef] [PubMed]
  4. FAO. Coping with Water Scarcity: Challenge of the Twenty-First Century; Food and Agriculture Organization of the United Nations, FAO Regional Office for the Near East: Cairo, Egypt, 2007. [Google Scholar]
  5. Suzenet, G.; Tal, A.; Boymanns, D. Sustainable Water Management for the City: Technologies for Improving Domestic Water Supply. Built Environ. 2002, 28, 138–151. Available online: http://www.jstor.org/stable/23288797 (accessed on 19 September 2021).
  6. Hutton, G.; Haller, L.; Bartram, J. Global cost-benefit analysis of water supply and sanitation interventions. J. Water Health 2007, 5, 481–502. [Google Scholar] [CrossRef] [Green Version]
  7. Briscoe, J. The Financing of Hydropower, Irrigation and Water Supply Infrastructure in Developing Countries. Int. J. Water Resour. Dev. 1999, 15, 459–491. [Google Scholar] [CrossRef]
  8. Varian, H.R. Microeconomic Analysis; W. W. Norton & Co Inc.: New York, NY, USA, 1992. [Google Scholar]
  9. Platt, J.; Piper, S. Willingness and Ability to Pay for Rural Water. In Water Policy and Management: Solving the Problems; ASCE: Reston, VA, USA, 1994. [Google Scholar]
  10. Al-Ghuraiz, Y.; Enshassi, A. Ability and willingness to pay for water supply service in the Gaza Strip. Build. Environ. 2005, 40, 1093–1102. [Google Scholar] [CrossRef]
  11. Gunatilake, H.; Yang, J.C.; Pattanayak, S.; Berg, C. Willingness-to-Pay and Design of Water Supply and Sanitation Projects: A Case Study; Asian Development Bank: Mandaluyong, Philippines, 2006; Available online: http://hdl.handle.net/11540/2351 (accessed on 19 September 2021).
  12. Carson, R.T. Contingent Valuation: A User’s Guide; University of California at San Diego, Economics Working Paper Series qt2mw607q7; Department of Economics, UC San Diego: San Diego, CA, USA, 1999. [Google Scholar]
  13. Meunier, S.; Manning, D.T.; Quéval, L.; Cherni, J.A.; Dessante, P.; Zimmerle, D. Determinants of the marginal willingness to pay for improved domestic water and irrigation in partially electrified Rwandan villages. Int. J. Sustain. Dev. World Ecol. 2019, 26, 547–559. [Google Scholar] [CrossRef] [Green Version]
  14. Kaliba, A.R.M.; Norman, D.W.; Chang, Y.-M. Willingness to pay to improve domestic water supply in rural areas of Central Tanzania: Implications for policy. Int. J. Sustain. Dev. World Ecol. 2003, 10, 119–132. [Google Scholar] [CrossRef]
  15. Ayenew, B.; Belay, A.; Tesfay, Y. Economic Value of Wondo Genet Catchment Forest in Domestic Water Supply Services, Southern Ethiopia. J. Econ. Sustain. Dev. 2015, 6, 9. [Google Scholar]
  16. Mezgebo, G.K.; Ewnetu, Z. Households willingness to pay for improved water services in urban areas: A case study from Nebelet town, Ethiopia. JDAE 2015, 7, 12–19. [Google Scholar] [CrossRef] [Green Version]
  17. Makwinja, R.; Kosamu, I.B.M.; Kaonga, C.C. Determinants and Values of Willingness to Pay for Water Quality Improvement: Insights from Chia Lagoon, Malawi. Sustainability 2019, 11, 4690. [Google Scholar] [CrossRef] [Green Version]
  18. Omole, D.O.; Okunowo, O.S. People Perception of Domestic Water Supply Situation in Ogun State, Nigeria. Res. J. Appl. Sci. Eng. Technol. 2016, 12, 94–99. [Google Scholar] [CrossRef]
  19. So, Y.K.; Seung, H.Y.; Chang, S.K. Measuring the Willingness to Pay for Tap Water Quality Improvements: Results of a Contingent Valuation Survey in Pusan. Water 2013, 5, 1638–1652. [Google Scholar] [CrossRef] [Green Version]
  20. Reis, N. Tracing and Making the State: Policy Practices and Domestic Water Supply in the Mekong Delta, Vietnam; LIT Verlag Münster: Berlin, Germany, 2012. [Google Scholar]
  21. MONRE. National Environment Report 2016—Urban Environment; Ministry of Natural Resources and Environment: Hanoi, Vietnam, 2016.
  22. Khoi, D.D. Hanoi Metropolitan Area. In Urban Development in Asia and Africa; 2017 edition; Springer: New York, NY, USA, 2017; pp. 131–150. [Google Scholar]
  23. MONRE. National Environment Report 2018—Water Environment in River Basins; Ministry of Natural Resources and Environment: Hanoi, Vietnam, 2018.
  24. HAWACO. Annual Report; Hanoi Water Limited Company: Hanoi, Vietnam, 2015. [Google Scholar]
  25. Whittington, D.; Briscoe, J.; Mu, X.; Barron, W. Estimating the Willingness to Pay for Water Services in Developing Countries: A Case Study of the Use of Contingent Valuation Surveys in Southern Haiti. Econ. Dev. Cult. Chang. 1990, 38, 293–311. [Google Scholar] [CrossRef]
  26. VIWASE. The Report of Drainage Planning of Hanoi Capital up to 2030, Vision to 2050; Vietnam Water, Sanitation and Environment Joint Stock Company: Hanoi, Vietnam, 2013. (In Vietnamese) [Google Scholar]
  27. Wright-Contreras, L.; March, H.; Schramm, S. Fragmented landscapes of water supply in suburban Hanoi. Habitat Int. 2017, 61, 64–74. [Google Scholar] [CrossRef]
  28. GSO. Statistical Summary Book of Vietnam; General Statistic Office of Vietnam, Statistical Publishing House: Hanoi, Vietnam, 2017; p. 49. [Google Scholar]
  29. Wright-Contreras, L. A transnational urban political ecology of water infrastructures: Global water policies and water management in Hanoi. Public Works Manag. Policy 2019, 24, 195–212. [Google Scholar]
  30. HAWACO. Temporary Water Shut-Off Schedule; Hanoi Water Limited Company: Hanoi, Vietnam, 2016; Available online: http://hawacom.vn/?cat=67 (accessed on 16 October 2020).
  31. HAWACO. Hanoi water supply system. In Proceedings of the Part of the Guided Visit to HAWACO’s Hoa Binh WTP at the 37th WEDC International Conference: Sustainable Water and Sanitation Services for all in a Fast Changing World, Co-Hosted by Loughborough University and the National University of Civil Engineering (NUCE), Hanoi, Vietnam, 15–19 September 2014. [Google Scholar]
  32. UNDP. Urban Poverty Assessment in Hanoi and Ho Chi Minh City; United Nations Development Programme. 2010. Available online: http://www.vn.undp.org/content/vietnam/en/home/library/poverty/urban-poverty-assessment-in-ha-noi-and-ho-chi-minh-city.html (accessed on 14 September 2017).
  33. Du Bui, D.; Kawamura, A.; Tong, T.N.; Amaguchi, H.; Nakagawa, N. Spatio-temporal analysis of recent groundwater-level trends in the Red River Delta, Vietnam. Hydrogeol. J. 2012, 20, 1635–1650. [Google Scholar] [CrossRef]
  34. Du Bui, D.; Kawamura, A.; Tong, T.N.; Amaguchi, H.; Trinh, T.M. Aquifer system for potential groundwater resources in Hanoi, Vietnam. Hydrol. Process. 2012, 26, 932–946. [Google Scholar] [CrossRef]
  35. Bui, N.T.; Kawamura, A.; Bui, D.D.; Amaguchi, H.; Bui, D.D.; Truong, N.T.; Do, H.H.T.; Nguyen, C.T. Groundwater sustainability assessment framework: A demonstration of environmental sustainability index for Hanoi, Vietnam. J. Environ. Manag. 2019, 241, 479–487. [Google Scholar] [CrossRef] [PubMed]
  36. Jiang, Y.; Rohendi, A. Domestic water supply, residential water use behaviour, and household willingness to pay: The case of Banda Aceh, Indonesia after ten years since the 2004 Indian Ocean Tsunami. Environ. Sci. Policy 2018, 89, 10–22. [Google Scholar] [CrossRef]
  37. Rananga, H.T.; Gumbo, J.R. Willingness to Pay for Water Services in Two Communities of Mutale Local Municipality, South Africa: A Case Study. J. Hum. Ecol. 2015, 49, 231–243. [Google Scholar] [CrossRef]
  38. Akeju, T.J.; Oladehinde, G.J.; Abubakar, K. An Analysis of Willingness to Pay (WTP) for Improved Water Supply in Owo Local Government, Ondo State, Nigeria. Asian Res. J. Soc. Sci. 2018, 5, 1–15. [Google Scholar] [CrossRef]
  39. Rodríguez-Tapia, L.; Revollo-Fernández, D.A.; Morales-Novelo, J.A. Household’s Perception of Water Quality and Willingness to Pay for Clean Water in Mexico City. Economies 2017, 5, 12. [Google Scholar] [CrossRef] [Green Version]
  40. Wahid, N.A.; Hooi, C.K. Factors Determining Household Consumer’s Willingness to Pay for Water Consumption in Malaysia. Asian Soc. Sci. 2015, 11, 26. [Google Scholar] [CrossRef]
  41. Khan, H.; Iqbal, F.; Saeed, I. Estimating willingness to pay for improvements in drinking water quality: Evidence from Peshawar, Northern Pakistan. Environ. Econ. 2010, 1, 38–43. [Google Scholar]
  42. Saker, M.A.R.; Alam, K. Willingness to Pay for Improved Water Services in Rajshahi City, Bangladesh. Asian J. Water Environ. Pollut. 2013, 10, 41–49. [Google Scholar]
  43. Salazar, S.S.; Gómez, F.G.; Guardiola, J. Willingness to pay to improve urban water supply: The case of Sucre, Bolivia. Water Policy 2015, 17, 112–125. [Google Scholar] [CrossRef]
  44. Parveen, S.; Ahmad, J.; Rahman, M.U. Estimating Willingness to Pay for Drinking Water Quality in Nowshera Pakistan: A Domestic Study for Public Health. JAAS 2016, 19, 48–56. [Google Scholar]
  45. Venkatachalam, L. Factors influencing household willingness to pay (WTP) for drinking water in peri-urban areas: A case study in the Indian context. Water Policy 2006, 8, 461–473. [Google Scholar] [CrossRef]
  46. Krejcie, R.V.; Morgan, D.W. Determining Sample Size for Research Activities. Educ. Psychol. Meas. 1970, 30, 607–610. [Google Scholar] [CrossRef]
  47. Eridadi, H.M.; Yoshihiko, I.; Alemayehu, E.; Kiwanuka, M. Evaluation of willingness to pay toward improving water supply services in Sebeta town, Ethiopia. J. Water Sanit. Hyg. Dev. 2021, 11, 282–294. [Google Scholar] [CrossRef]
  48. Ogunniyi, L.T.; Sanusi, W.A.; Ezekiel, A.A. Determinants of rural household willingness to pay for safe water in Kwara State, Nigeria. AACL Bioflux 2011, 4, 660–669. [Google Scholar]
  49. Awad, I.; Holländer, R. Applying Contingent Valuation Method to Measure the Total Economic Value of Domestic Water Services: A Case Study in Ramallah Governorate, Palestine. Eur. J. Econ. Financ. Adm. Sci. 2010, 20, 76–93. [Google Scholar]
  50. Groothuis, P.A.; Cockerill, K.; Mohr, T.M. Water does not flow up hill: Determinants of willingness to pay for water conservation measures in the mountains of western North Carolina. J. Behav. Exp. Econ. 2015, 59, 88–95. [Google Scholar] [CrossRef]
  51. Beyene, F.; Lema, Z. Willingness to Pay for Improved Rural Water Supply in Goro-Gutu District of Eastern Ethiopia: An Application of Contingent Valuation. J. Econ. Sustain. Dev. 2012, 3, 145–159. [Google Scholar]
  52. Pham, K.N.; Tran, V.H.S. Household Demand for Improved Water Services in Ho Chi Minh City: A Comparison of Contin-gent Valuation and Choice Modeling Estimates. In Economy and Environment Program for Southeast Asia (EEPSEA) 2005; EEPSEA Research Report rr2005063; EEPSEA: Ho Chi Minh City, Vietnam, 2005. [Google Scholar]
  53. Pattanayak, S.K.; Jui, C.Y.; Whittington, D.; Bal Kumar, K.C. Coping with unreliable public water supplies: Averting expenditures by households in Kathmandu, Nepal. Water Resour. Res. 2005, 41, W0201. [Google Scholar] [CrossRef] [Green Version]
  54. Byambadorj, A.; Han, S.L. Household Willingness to Pay for Wastewater Treatment and Water Supply System Improvement in a Ger Area in Ulaanbaatar City, Mongolia. Water 2019, 11, 1856. [Google Scholar] [CrossRef] [Green Version]
  55. Fujita, Y.; Fujii, A.; Furukawa, S.; Ogawa, T. Estimation of Willingness-to-Pay (WTP) for Water and Sanitation Services through Contingent Valuation Method (CVM): A Case Study in Iquitos City, The Republic of Peru. BICI Rev. 2005, 11, 59–87. [Google Scholar]
  56. Hernández, J.R.; Salazar, S.S. Estimating the non-market benefits of water quality improvement for a case study in Spain: A contingent valuation approach. Environ. Sci. Policy 2012, 22, 47–59. [Google Scholar] [CrossRef]
  57. Tussupova, K.; Berndtsson, R.; Bramryd, T.; Beisenova, R. Investigating Willingness to Pay to Improve Water Supply Services: Application of Contingent Valuation Method. Water 2015, 7, 3024–3039. [Google Scholar] [CrossRef] [Green Version]
  58. Brox, J.A.; Kumar, R.C.; Stollery, K.R. Willingness to pay for water quality and supply enhancements in the Grand River Watershed. Can. Water Resour. J. 1996, 21, 275–288. [Google Scholar] [CrossRef] [Green Version]
  59. Chatterjee, C.; Triplett, R.; Johnson, C.K.; Ahmed, P. Willingness to pay for safe drinking water: A contingent valuation study in Jacksonville, FL. J. Environ. Manag. 2017, 203, 413–421. [Google Scholar] [CrossRef] [PubMed]
  60. Majumdar, C.; Gupta, G. Willingness to pay and municipal water pricing in transition: A case study. J. Integr. Environ. Sci. 2009, 6, 247–260. [Google Scholar] [CrossRef]
  61. Casey, J.F.; Kahn, R.K.; Rivas, A. Willingness to pay for improved water service in Manaus, Amazonas. Brazil. Ecol. Econ. 2006, 58, 365–372. [Google Scholar] [CrossRef]
  62. Sule, B.F.; Okeola, O.G. Measuring willingness to pay for improved urban water supply in Offa City, Kwara State, Nigeria. Water Sci. Technol. Water Supply 2010, 10, 933–941. [Google Scholar] [CrossRef]
  63. Wang, H.; Shi, Y.; Kim, Y.; Kamata, T. Valuing water quality improvement in China: A case study of Lake Puzhehei in Yun-nan Province. Ecol. Econ. 2013, 94, 56–65. [Google Scholar] [CrossRef] [Green Version]
  64. Ahmad, I.; Haq, M.; Sattar, A. Factors Determining Public Demand for Safe Drinking Water (A Case Study of District Peshawar); Pakistan Institute of Development Economics Islamabad: Islamabad, Pakistan, 2010. [Google Scholar]
  65. Hundie, S.K.; Abdisa, L.T. Households’ Willingness to Pay for Improved Water Supply: Application of the Contingent Valuation Method: Evidence from Jigjiga Town, Ethiopia. Rom. Econ. J. 2016, 19, 191–214. [Google Scholar]
  66. Dhungana, A.R.; Baral, B. Factors Affecting Willingness to Pay for Improved Water Supply System in Rural Tanahu, Nepal. Janapriya J. Interdiscip. Stud. 2017, 5, 1–13. [Google Scholar] [CrossRef]
  67. Haq, M.; Mustafa, U.; Ahmad, I. Household’s Willingness to Pay for Safe Drinking Water: A Case Study of Abbottabad District. Pak. Dev. Rev. 2007, 46, 1137–1153. [Google Scholar] [CrossRef] [Green Version]
  68. Odwori, E.O. Factors Determining Households’ Willingness to Pay for Improved Water Supply Services in Nzoia River Basin, Kenya. Int. J. Innov. Res. Adv. Stud. IJIRAS 2020, 7, 165–176. Available online: http://www.ijiras.com/2020/Vol_7-Issue_7/paper_22.pdf (accessed on 19 September 2021).
  69. Vásquez, W.F.; Raheem, N.; Quiroga, D.; Ochoa-Herrera, V. Household preferences for improved water services in the Galápagos Islands. Water Resour. Econ. 2021, 34, 100180. [Google Scholar] [CrossRef]
  70. Wondimu, S.; Bekele, W. Determinants of individual willingness to pay for quality water supply: The case of Wonji Shoa Sugar Estate, Ethiopa. WIT Trans. Ecol. Environ. 2011, 153, 59–72. [Google Scholar]
  71. Danh, V.T.; Khai, H.V. Estimating residents’ willingness to pay for groundwater protection in the Vietnamese Mekong Delta. Appl. Water Sci. 2017, 7, 421–431. [Google Scholar]
  72. Rahman, M.M.; Alam, K.; Karim, R.; Islam, M.K. Willingness to Pay for Improved Water Supply: A Policy Implications for Future Water Security. Am. J. Environ. Resour. Econ. 2017, 2, 116–122. [Google Scholar] [CrossRef]
  73. Jianjun, J.; Wenyu, W.; Ying, F.; Xiaomin, W. Measuring the willingness to pay for drinking water quality improvements: Results of a contingent valuation survey in Songzi, China. J. Water Health 2016, 14, 504–512. [Google Scholar] [CrossRef] [Green Version]
  74. Akhtar, S.; Sohail, A.; Tariq, U.; Khan, F.A.; Asghar, S. Willingness to pay for improved drinking water facility in Samsani Khui, Johar Town, Lahore, Pakistan. AAES 2017, 2, 187–193. [Google Scholar]
  75. Guilfoos, T.; Hayden, S.; Uchida, E.; Oyanedel-Craver, V. WTP for water filters and water quality testing services in Guatemala. Water Resour. Econ. 2019, 31, 100139. [Google Scholar] [CrossRef]
  76. Orgill, J.; Shaheed, A.; Brown, J.; Jeuland, M. Water quality perceptions and willingness to pay for clean water in peri-urban Cambodian communities. J. Water Health 2013, 11, 489–506. [Google Scholar] [CrossRef]
  77. Olajuyigbe, A.E.; Fasakin, J.O. Citizens’ Willingness to Pay for Improved Sustainable Water Supply in a Medium-Sized City in South Western Nigeria. Curr. Res. J. Soc. Sci. 2010, 2, 41–50. [Google Scholar]
  78. Adenike, A.A.; Titus, O.B. Determinants of Willingness to Pay for Improved Water Supply in Osogbo Metropolis; Osun State, Nigeria. Res. J. Soc. Sci. 2009, 4, 1–6. [Google Scholar]
  79. Vintró, C.; Sanmiquel, L.; Freijo, M. Environmental sustainability in the mining sector: Evidence from Catalan companies. J. Clean Prod. 2014, 84, 155–163. [Google Scholar] [CrossRef] [Green Version]
  80. Ayanshola, A.M.; Sule, B.F.; Salami, A.W. Evaluation of Willingness to Pay for Reliable and Sustainable household Water Use in Ilorin, Nigeria. Ethiop. J. Environ. Stud. Manag. 2013, 6, 754. [Google Scholar] [CrossRef] [Green Version]
Figure 1. Study area and main rivers in Hanoi.
Water 14 02161 g001
Figure 2. The main water sources used for basic purposes among the studied households.
Water 14 02161 g002
Figure 3. Prioritizing the tasks needed in order to improve HUDWSS.
Water 14 02161 g003
Figure 4. Pre-WTP and WTP histograms.
Water 14 02161 g004
Table 1. Classification of 21 factors/variables considered to affect WTP according to the literature.
ClassificationFactors/VariablesPublications
Demographic Factors (8)Gender[13,14,15,16,17,18,19] *
Age[46,47,48,49,50] *
Education level[25,39,51,52] *
Family size[19,53,54,55] *, [56]
Children[57], [58,59,60] *
Occupation[48,54], [61,62] *
Income[36,37,56,58,63] *
Wealth of the household[14] *, [64]
Water Supply Quantity
(3)
Water source[51], [65,66,67] *
Water reliability[50,68,69,70] *
Water use quantity[13,47,48,55] *, [71]
Water Supply Quality (4)Clean water awareness[43] *, [71], [72,73] *
Water quality care[37], [39,44,49] *, [74]
Water-borne diseases[38,66,75] *
Water treatment measures[39,68,76,77,78]
Water Supply Service (6)Bid value[15,50] *, [65], [70] *
Monthly water bill[55], [61] *, [77]
Household location[48] *, [51], [67] *, [71]
Distance to water source[16] *, [25]*, [77]
Time for water connection[41,47,53], [55] *
Water connection charges[54,57,68] *, [78]
Note: The studies with “*” are the ones in which the corresponding factors/variables are significant at a 0.05 confidence level.
Table 2. Basic characteristics of the sample (N = 402).
CharacteristicsIn Number (Persons)In Percentage (%)
AgeLess than 18 years old10.2%
From 18 to 24 years old5012.4%
From 24 to 55 years old26966.9%
Over 55 years old8220.4%
GenderFemale20851.7%
Male19448.3%
OccupationStudent297.2%
Employees and officers6415.9%
Business18646.3%
Worker5212.9%
Work at home7117.7%
Total incomeLess than 3 million VND10.2%
3–5 million VND92.2%
5–10 million VND7719.2%
10–30 million VND20851.7%
Over 30 million VND10726.6%
Table 3. Household responses regarding domestic water quantity.
In Terms ofNumber of ResponsesPercentage (%)
Monthly water consumption
Less than 10 m33310.0%
From 10 to 20 m39027.2%
From 20 to 30 m318255.0%
More than 30 m3267.9%
Domestic water cut-off frequency
1 day/month5115.4%
2 day/month226.6%
>3 day/month20.6%
No water cut-off25677.3%
Domestic water use quantity satisfaction
<50%00.0%
50–60%61.8%
60–80%185.4%
80–100%24574.0%
>100%6218.7%
Total331100%
Table 4. Household responses regarding domestic water quality.
In Terms ofNumber of ResponsesPercentage (%)
Public awareness of domestic water quality
Clean27984.3%
Color/smell/taste sometimes319.4%
Cloudy133.9%
Strange color/smell/taste82.4%
Water treatment used
Advanced water purifiers26680.4%
Just boiling5115.4%
None144.2%
Water-borne diseases affected
Not yet29789.7%
Slightly92.7%
Skin disease123.6%
Diarrhea/Gynecological diseases/Dengue fever/Japanese encephalopathy/Helminthic infection133.9%
Total331100%
Table 5. Household responses regarding domestic water management and service.
In Terms ofNumber of ResponsesPercentage (%)
Payment method
Via apps on smartphone/computer12638.1%
Via home-visiting staff11635.0%
Via Supermarket/Post office8926.9%
Receiving water cut-off notifications
From HAWACO website51.5%
From HAWACO document20.6%
From the community’s radio82.4%
From the community’s bulletin3811.5%
No notification226.6%
No water cut-off25677.3%
How long has the local water supply system been installed?
Less than 5 years3811.5%
5–10 years9428.4%
10–15 years15446.5%
Over 15 years3811.5%
Don’t know72.1%
Maintenance service
Don’t know236.9%
Regularly checked and maintained17653.2%
No maintenance service13239.9%
Total331100%
Table 6. Pre-WTP and WTP of the respondents.
Pre-WTP Value
(dong/m3/Household)
Number of ResponsesPercentage (%)WTP Value
(dong/m3/Household)
Number of ResponsesPercentage (%)
700023470.7700011835.6
800020.614,00011835.6
900051.515,00020.6
10,000195.716,00030.9
12,000164.817,000195.7
13,0005516.619,000164.8
20,0005516.6
Total 331100Total 331100
Table 7. Description of variables used in regression analysis.
VariableDescription
Dependent variable
Log_WTPContinuous variable denoting the natural log value of each respondent WTP
Independent variables
Demographic variableGenderDummy variable equal to 1 for male and 0 for female
AgeDummy variable equal to 1 if age of respondent is in the range of 24 to 55 years old and 0 otherwise
Log_IncomeContinuous variable denoting the natural log value of each household’s monthly income
Family SizeDummy variable equal to 1 if household has more than normal size of four members and 0 otherwise
OccupationDiscrete variable denoting the respondent’s occupation type
Water supply quantityWater useDummy variable equal to 1 if the monthly household water consumption is in the range of 20 to 30 m3 and 0 otherwise
QuantityDummy variable equal to 1 if the water supply meets more than 80% of the household’s water needs and 0 otherwise
Water supply qualityQualityDummy variable equal to 1 for clean water response and 0 otherwise
TreatmentDummy variable equal to 1 if household uses water treatment and 0 if household uses no water treatment
Water supply servicePayment MethodDiscrete variable denoting the household’s water payment method
MaintenanceDummy variable equal to 1 if household’s water supply system is regularly maintained and 0 otherwise
NotificationDummy variable equal to 1 if household receives a notification before water cut-off day and 0 otherwise
Table 8. WTP regression results for HUDWSS improvement.
Independent VariableEstimated Coefficientp-ValueStandard Error
(Constant) 0.0000.376
Gender−0.1010.032 **0.023
Age0.0890.079 *0.027
Log_Income0.1260.013 **0.052
Family Size−0.0540.2590.024
Occupation0.0090.8550.011
Water_use0.3190.000 ***0.027
Quantity0.0440.3910.049
Quality0.0460.3760.035
Treatment−0.0110.8190.058
Payment Method0.0920.053 *0.015
Maintainance0.2280.000 ***0.028
Notification0.0030.9530.034
Dependent variable: Log_WTP; R2 = 0.314; Adjusted R2 = 0.288; Standard error of the estimate: 0.208; *** statistically significant at 0.01, ** statistically significant at 0.05, and * statistically significant at 0.1.
Publisher’s Note: MDPI stays neutral with regard to jurisdictional claims in published maps and institutional affiliations.

