
Insight into Groundwater Resources along the Coast of Benin (West Africa) through Geochemistry and Isotope Hydrology; Recommendations for Improved Management

 , , ,
, , ,
Abstract
:1. Introduction
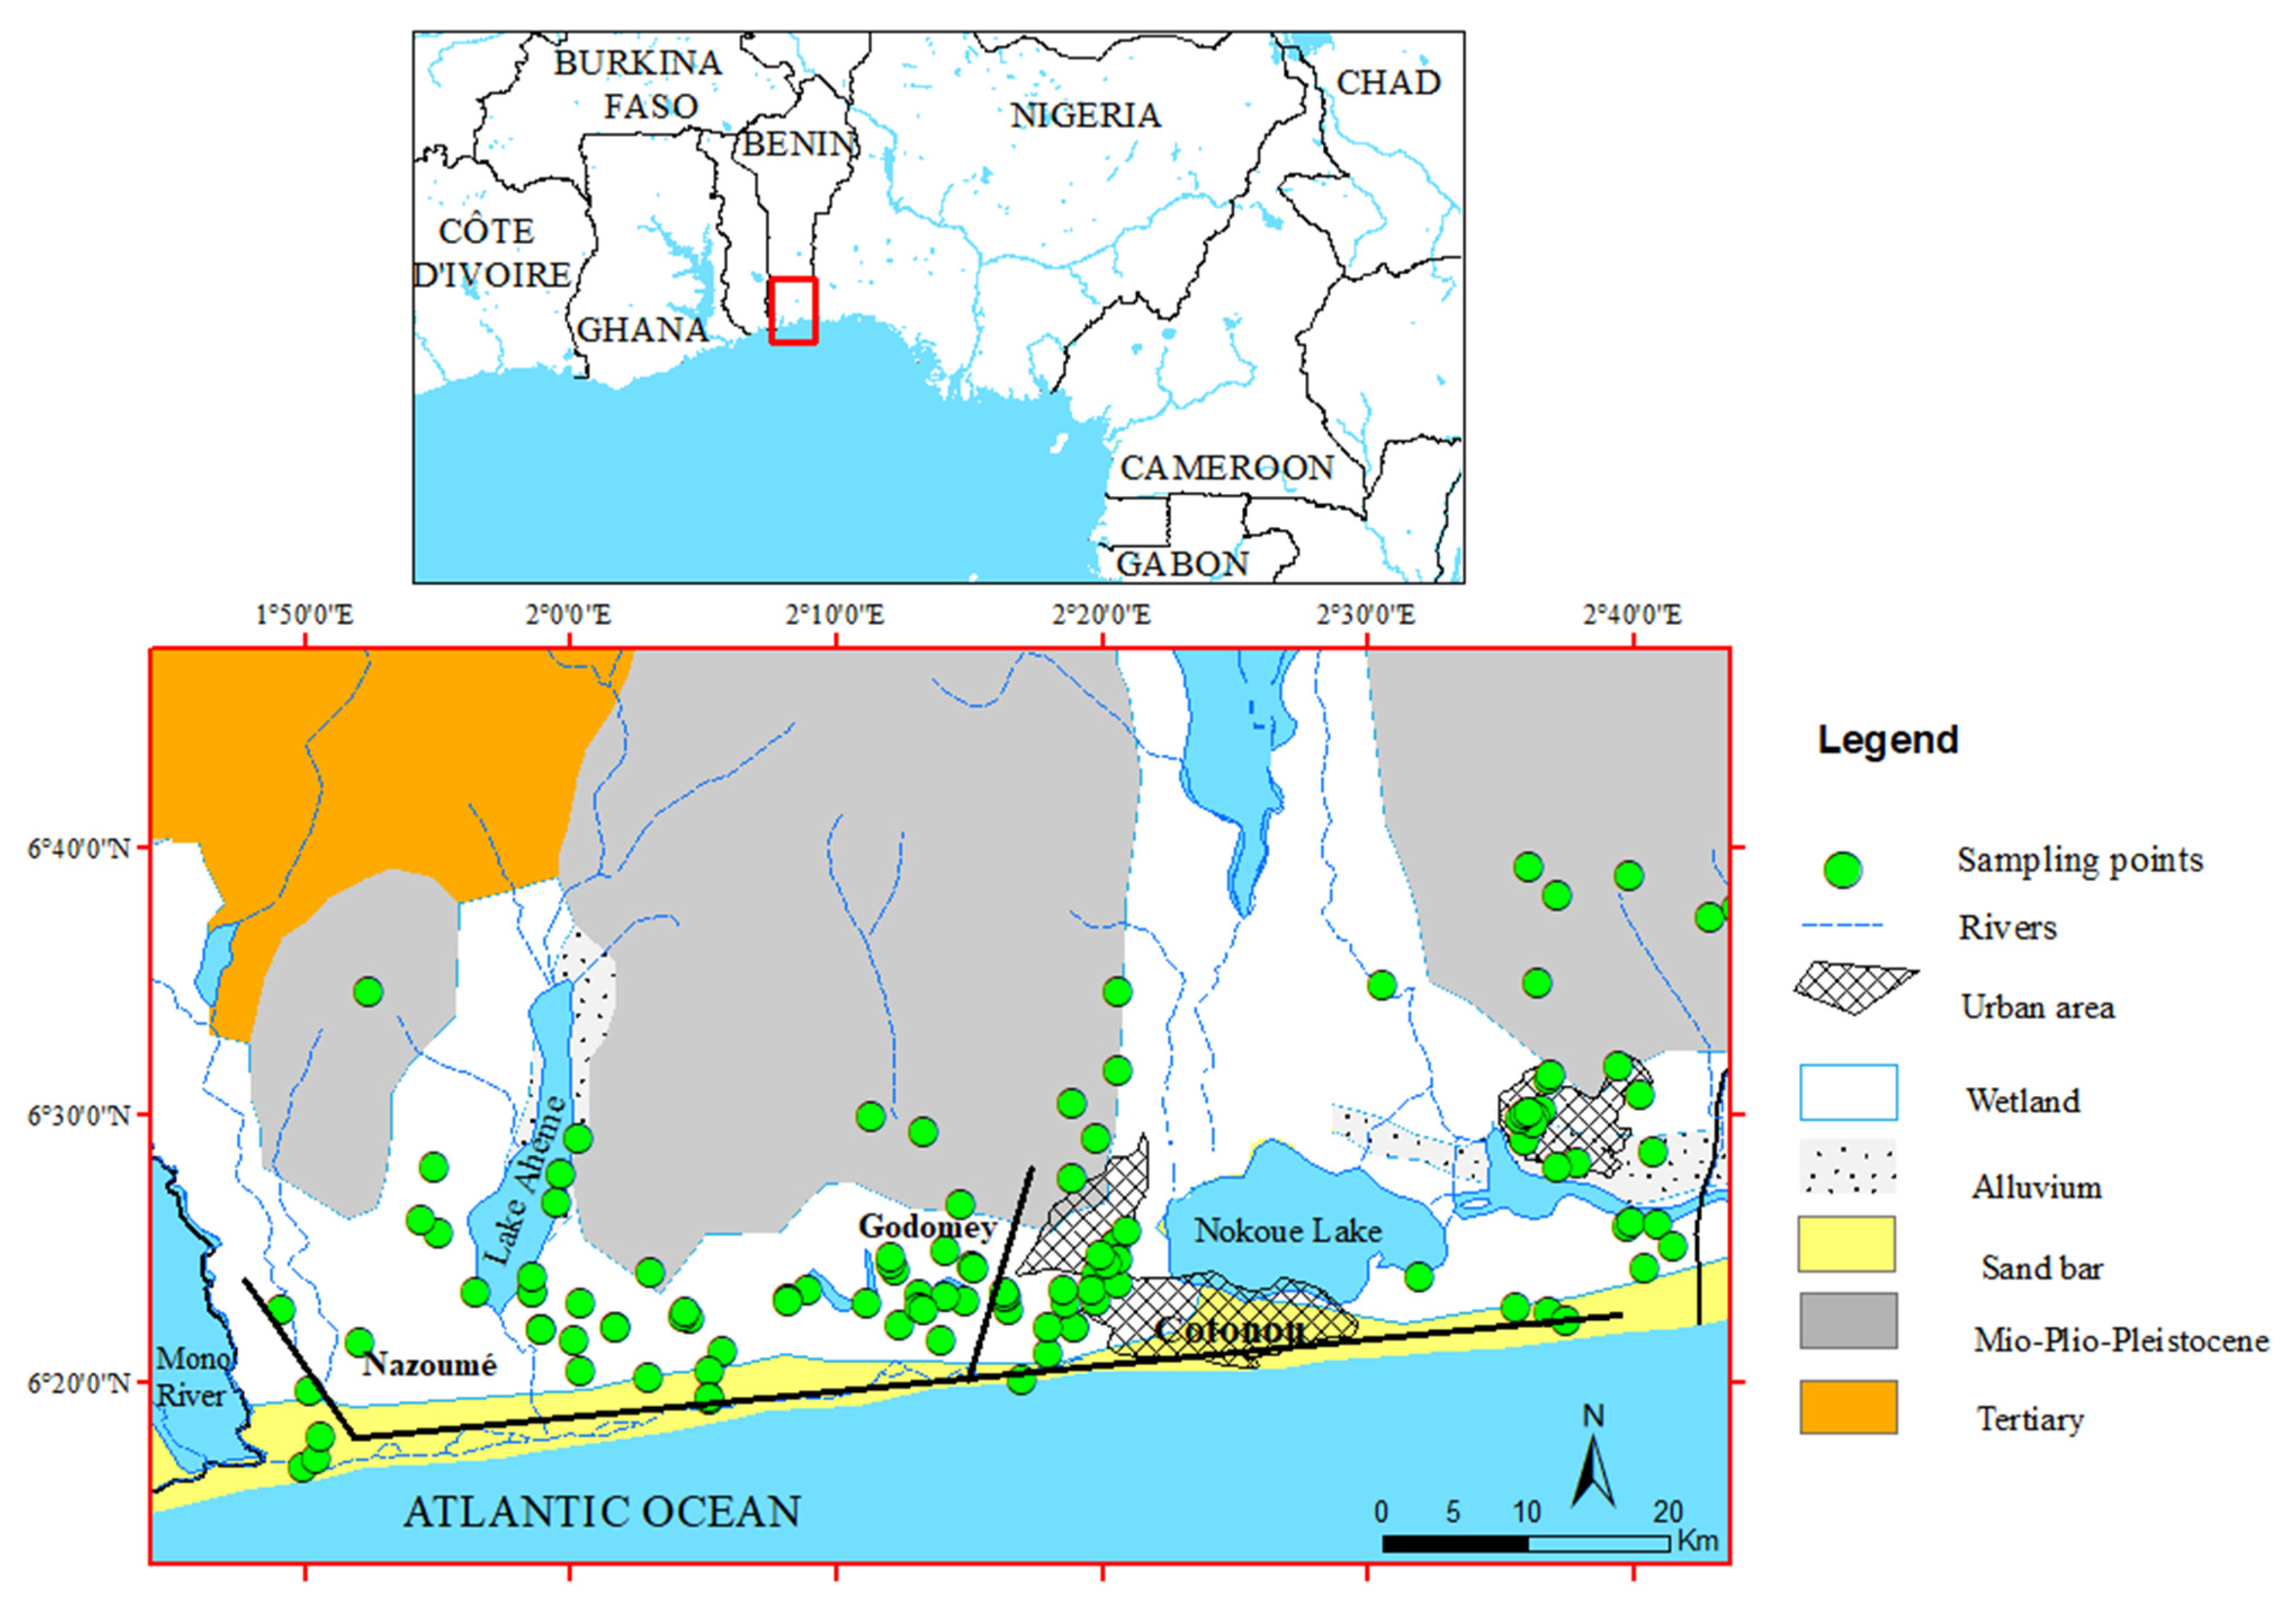
2. Study Area
2.1. General Features
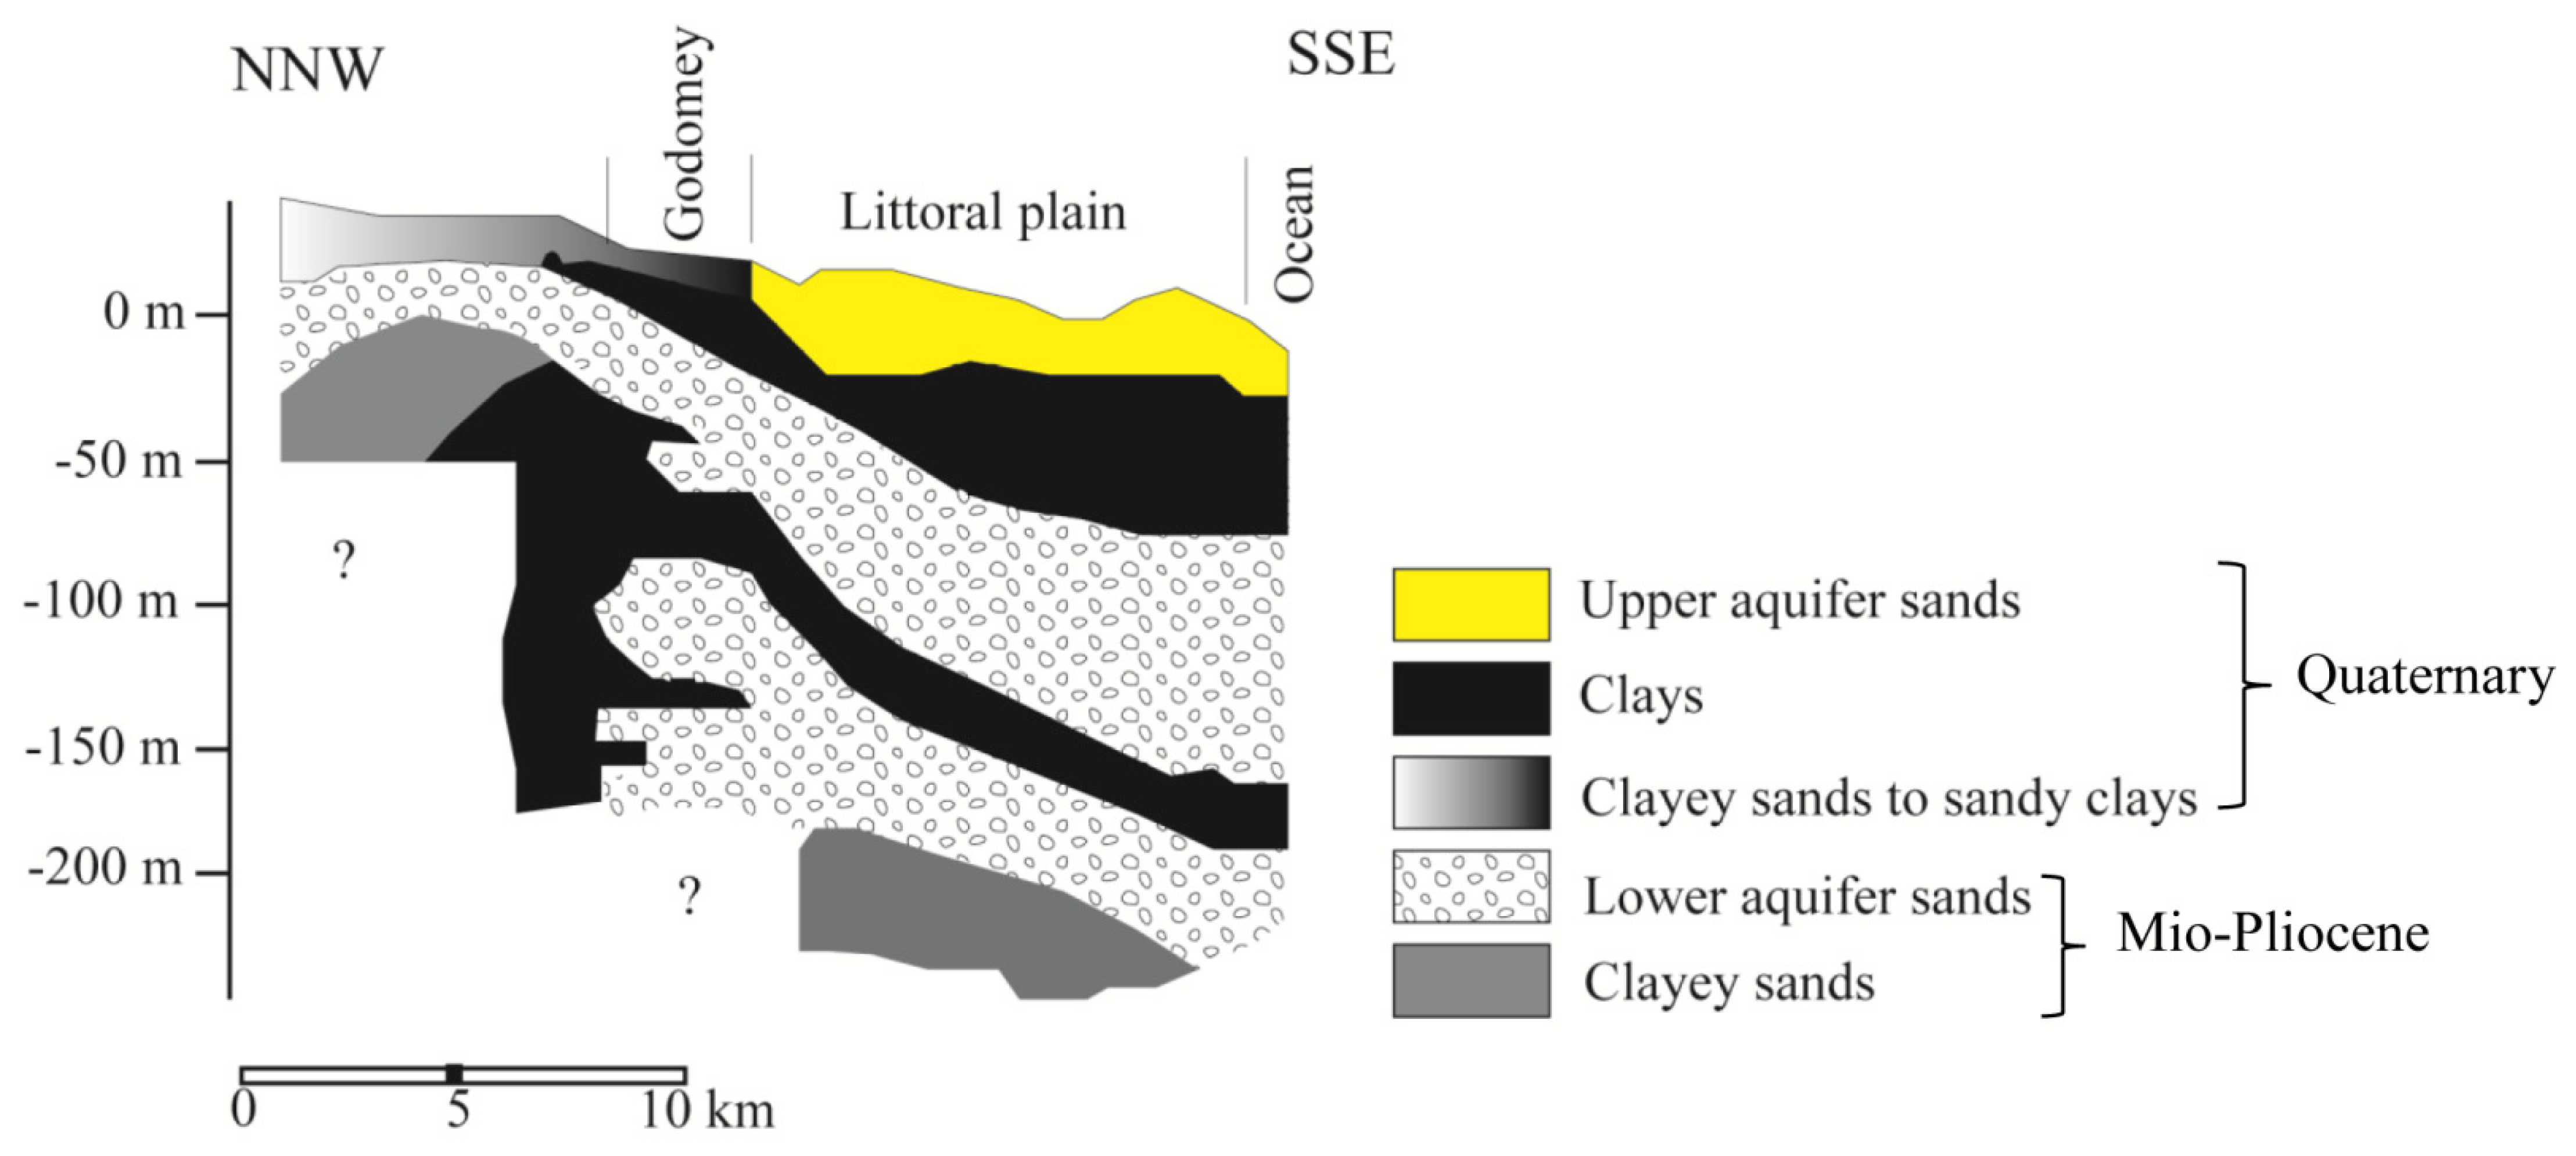
2.2. Geological and Hydrogeological Settings
3. Material and Methods
4. Results
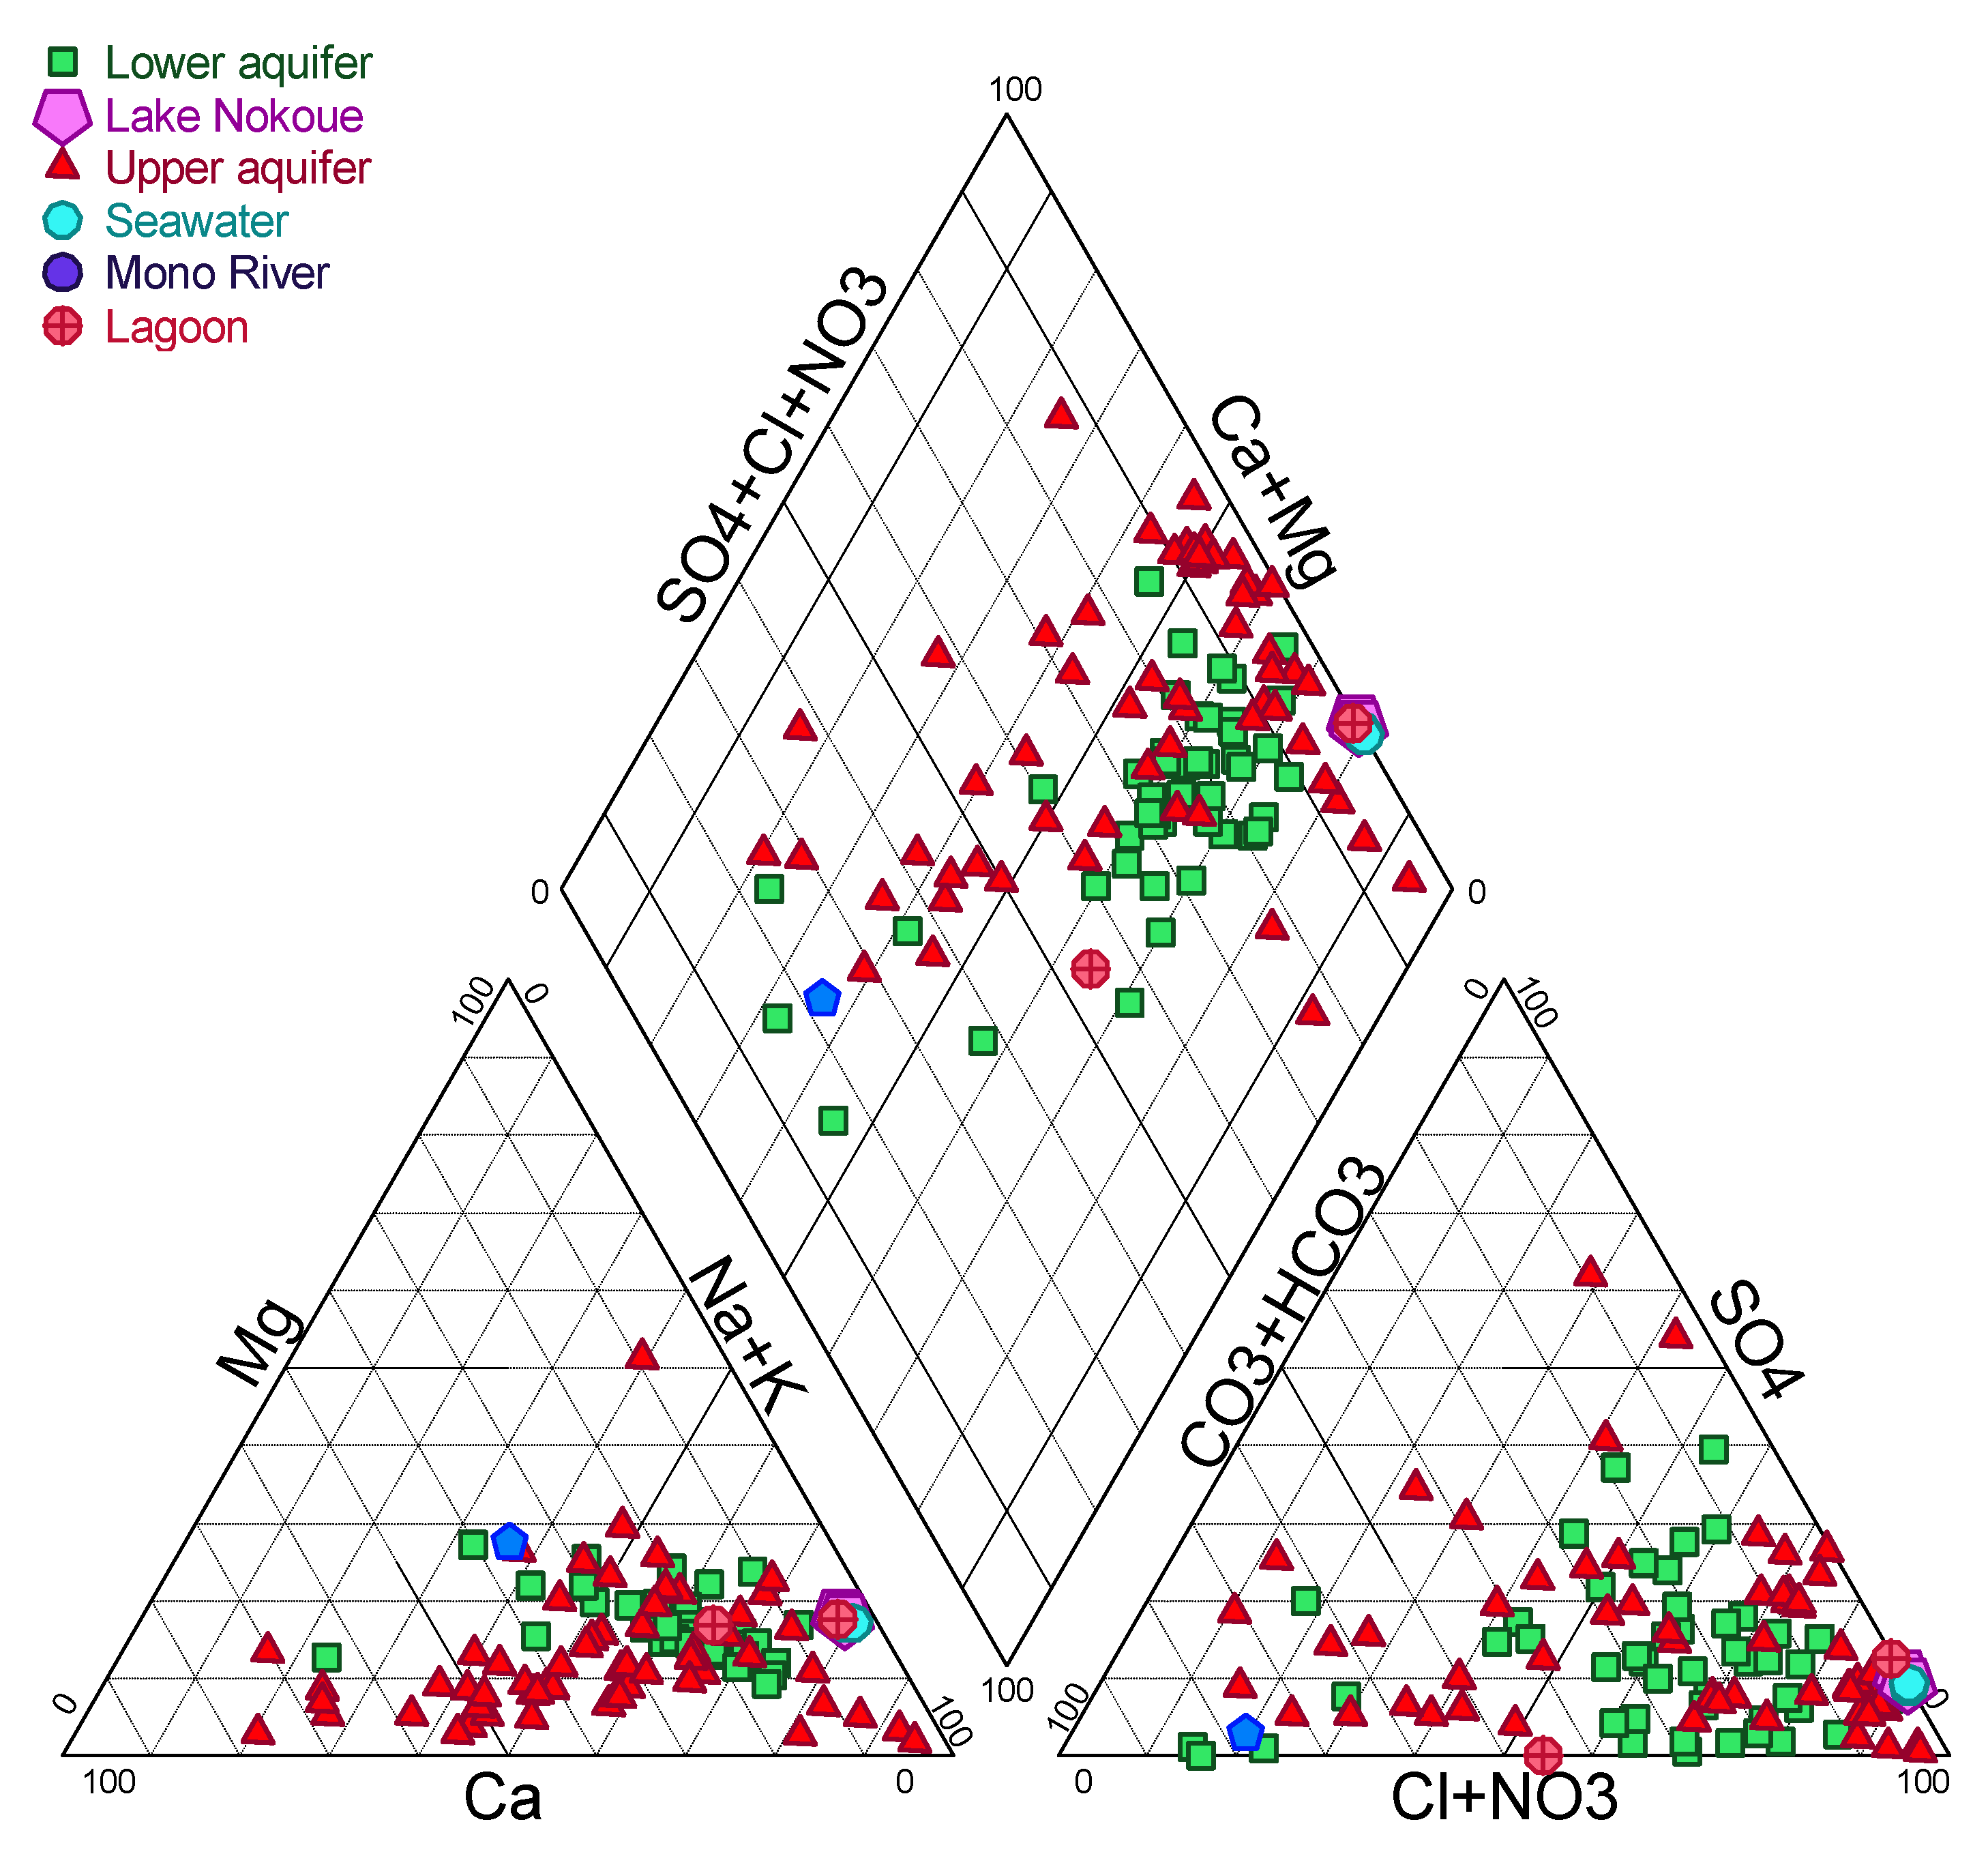
4.1. Water Chemistry
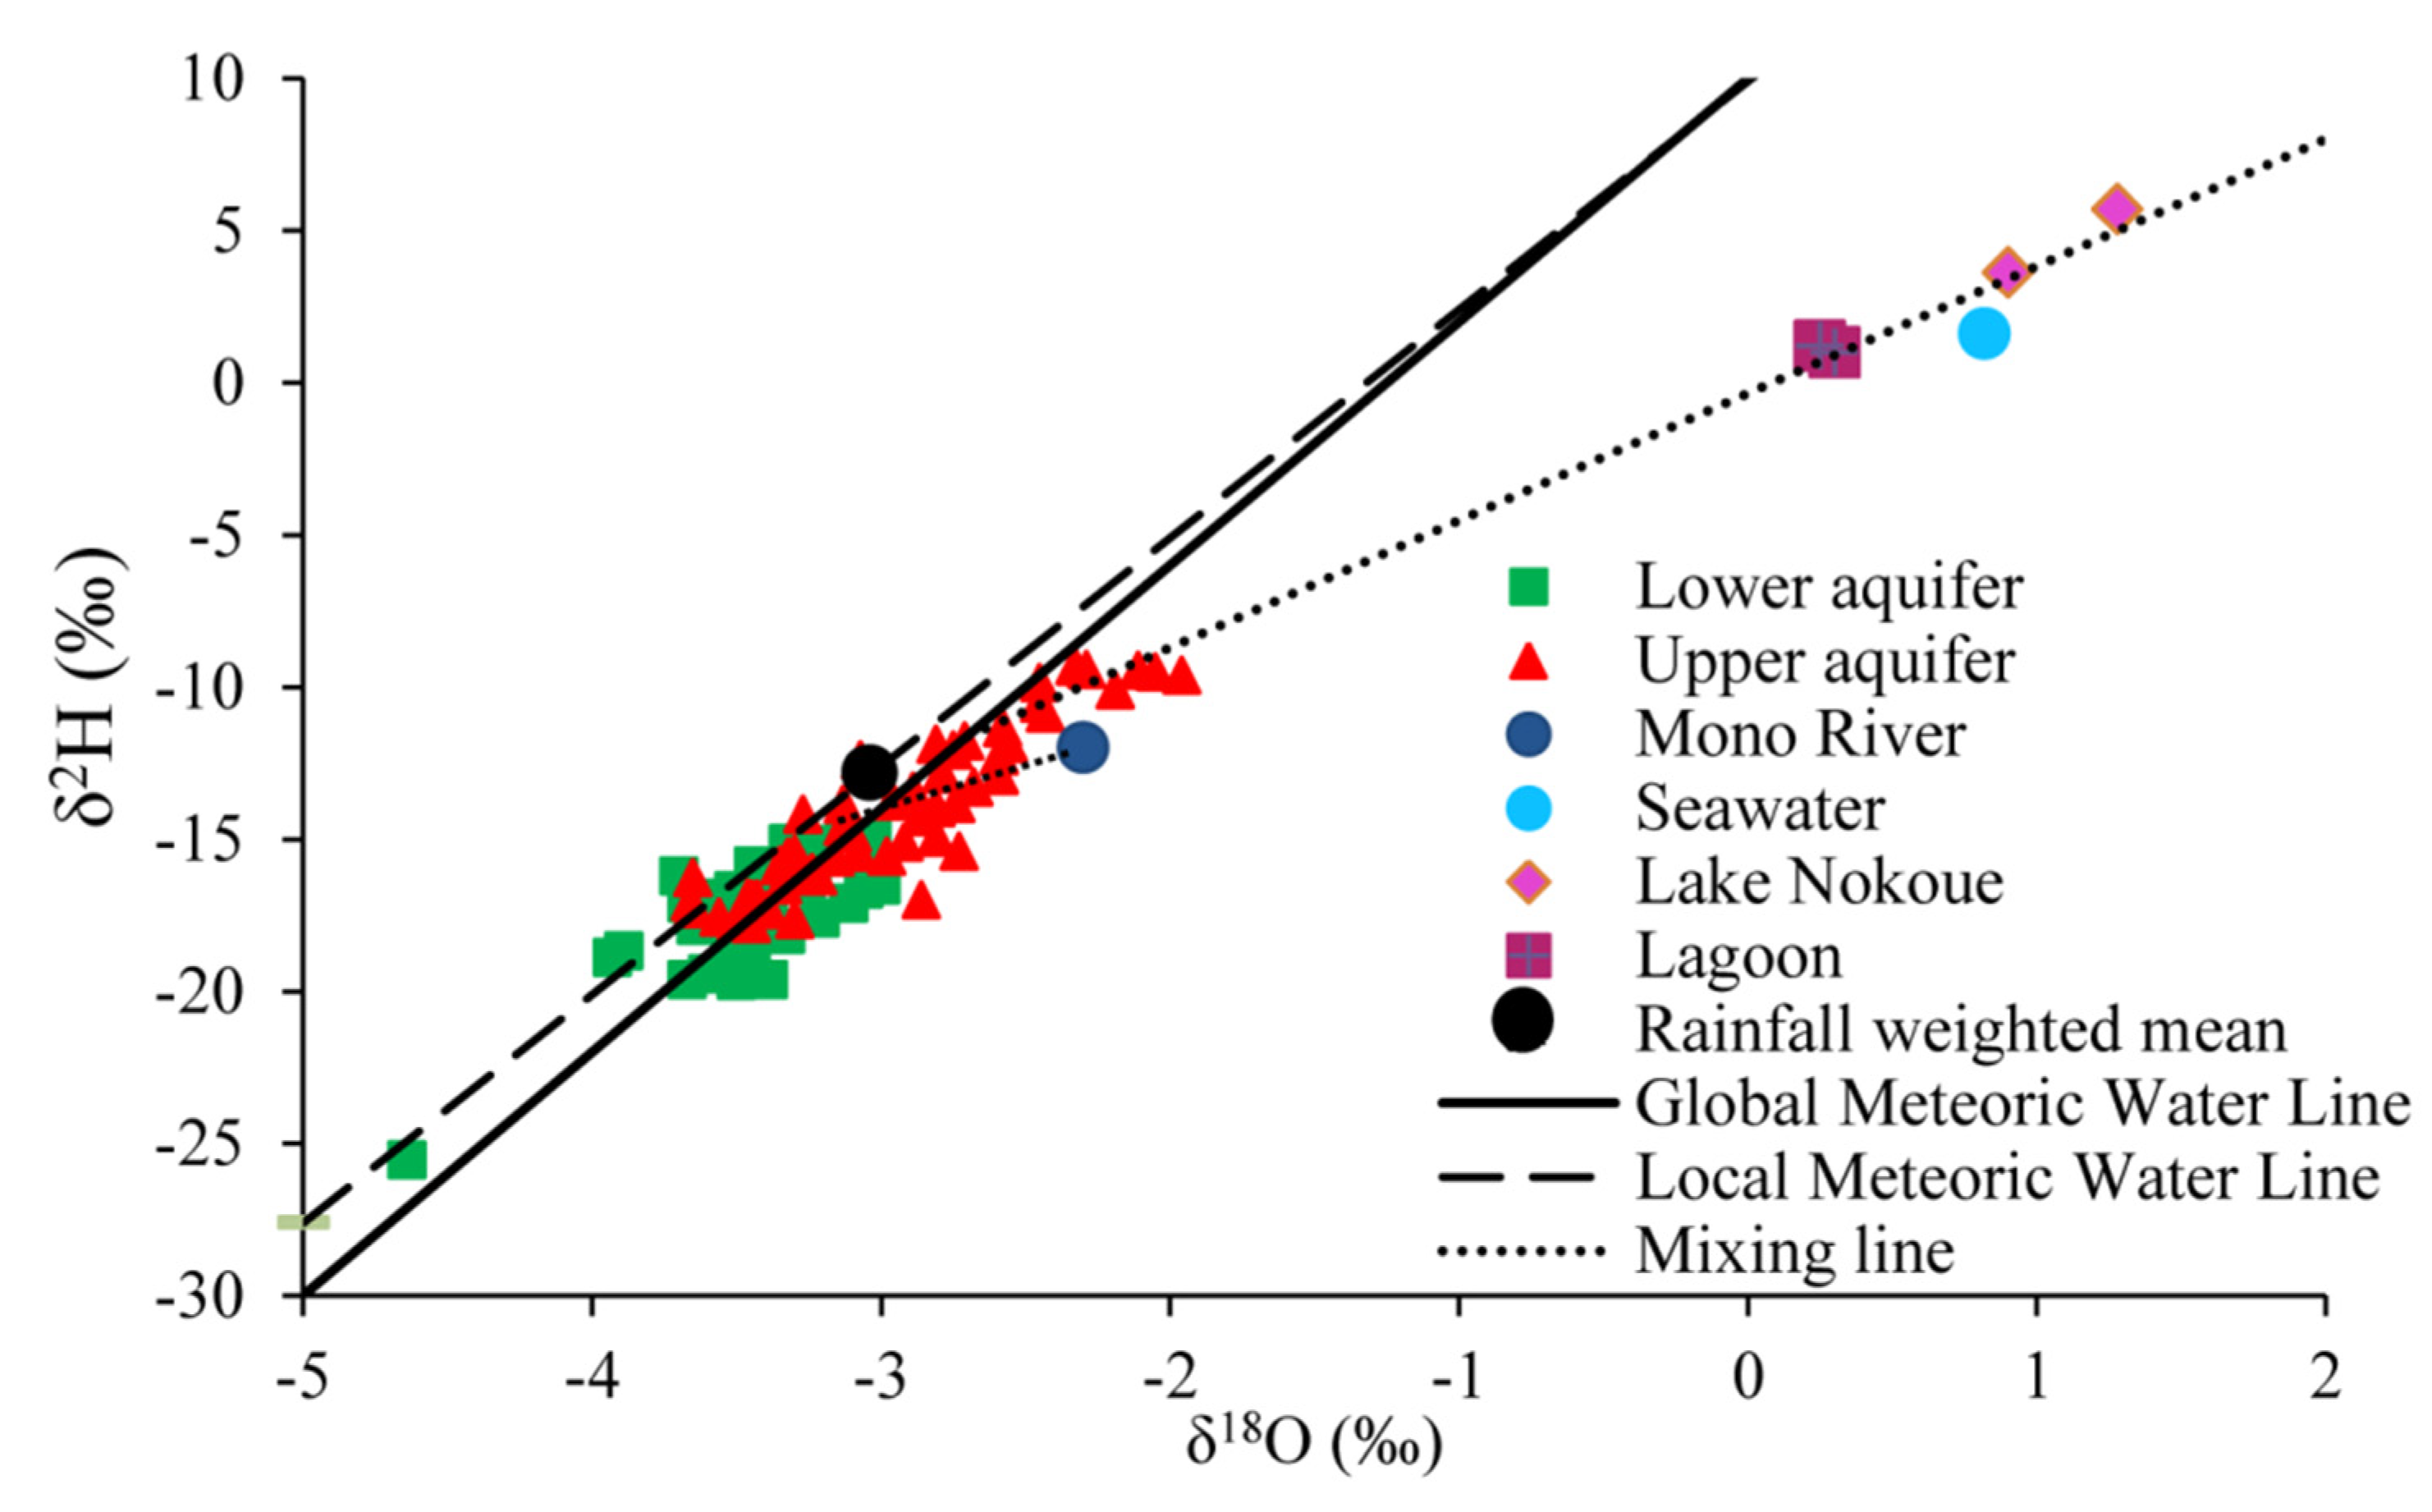
4.2. Water Stable Isotopes
5. Discussion
5.1. Groundwater Recharge and Mechanisms Involved
5.2. Groundwater Recharge and Mechanisms Involved
5.2.1. Anthropogenic Input
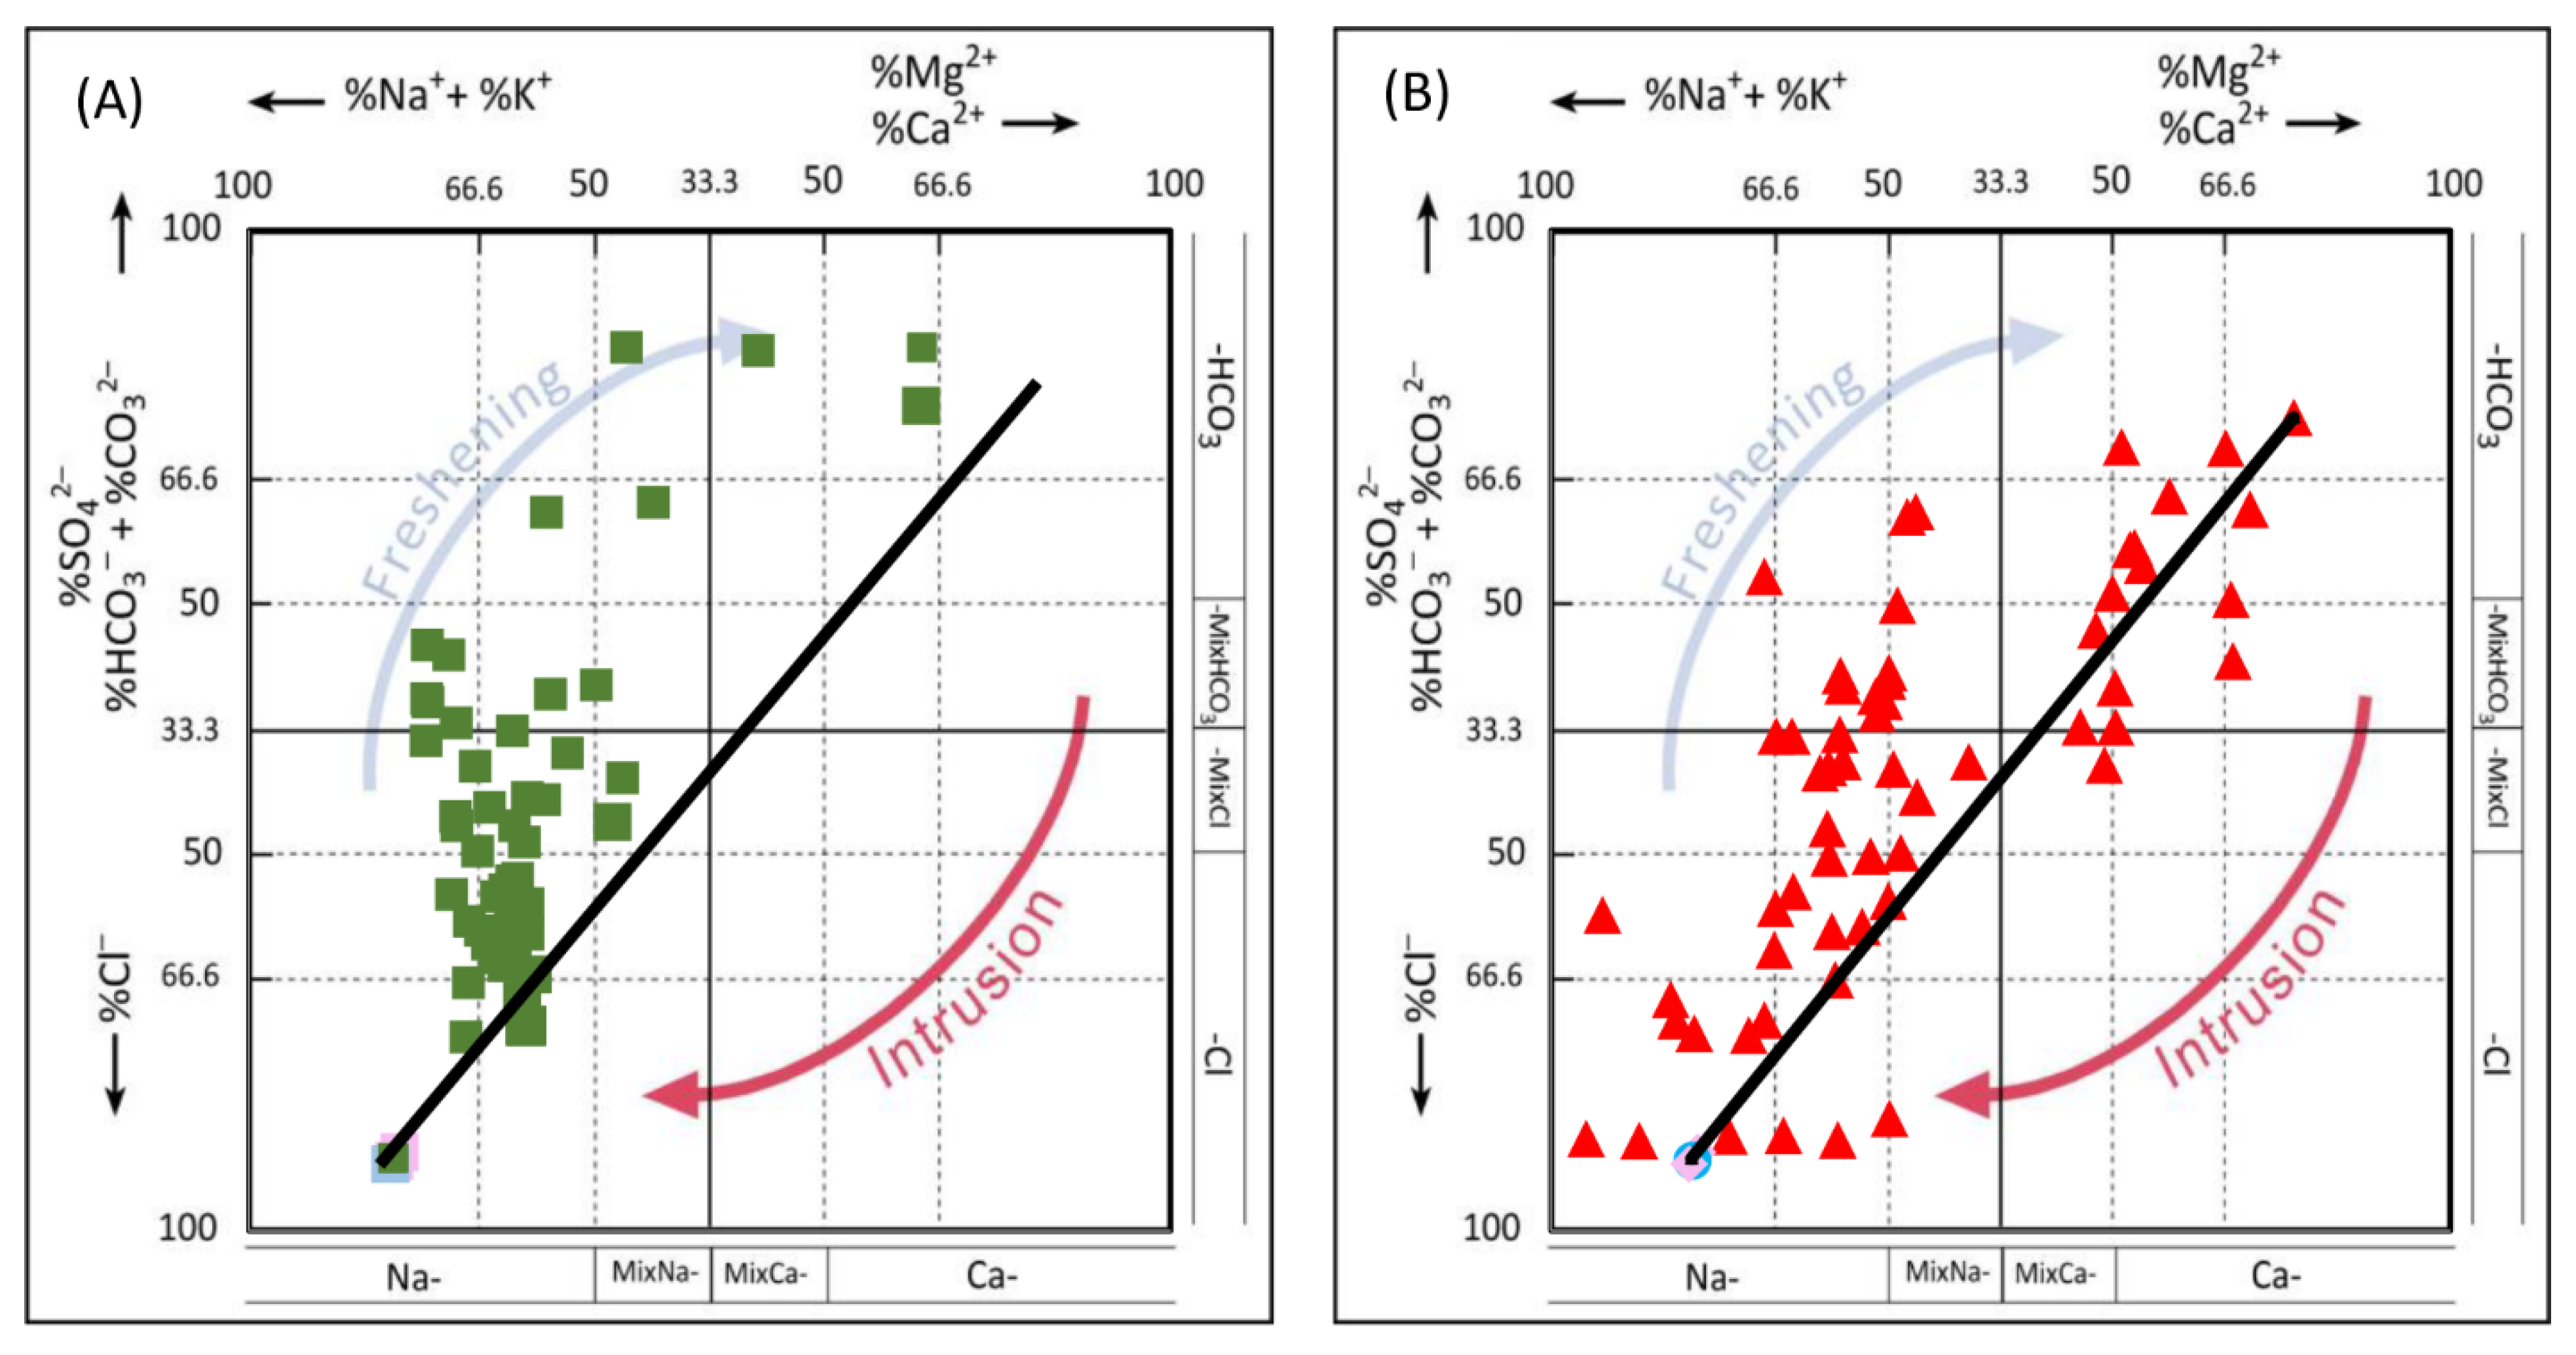
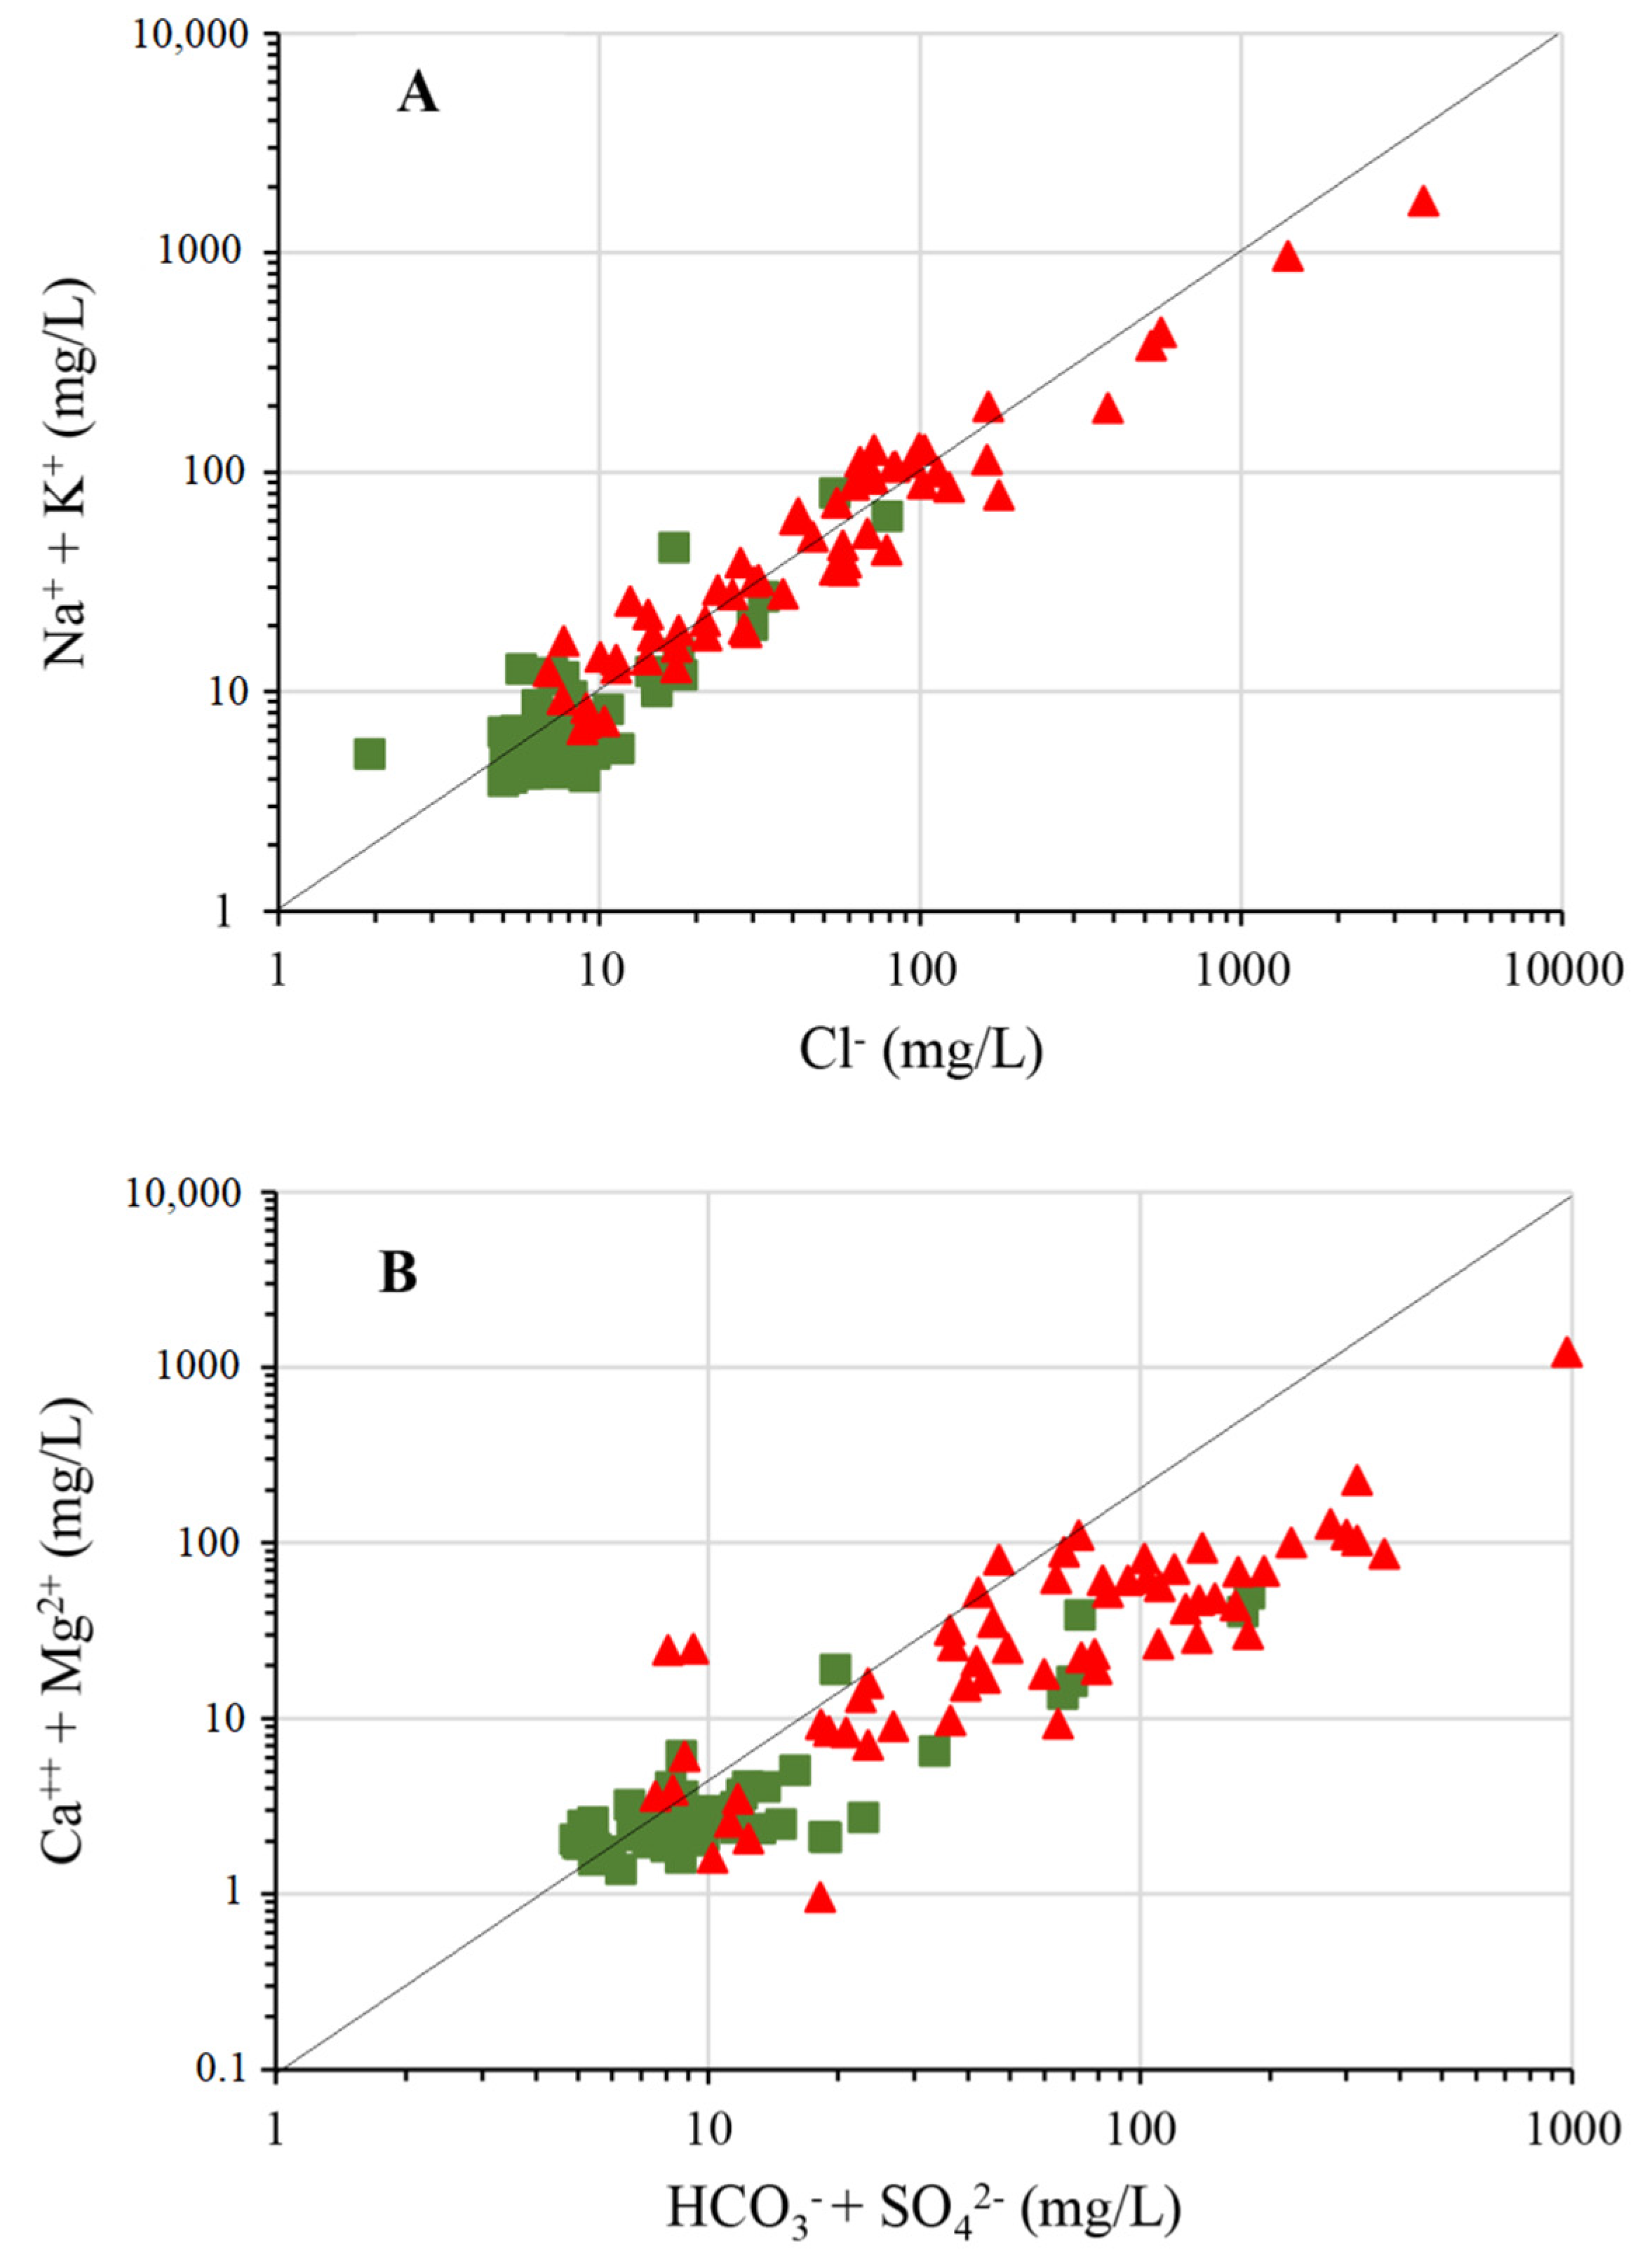
5.2.2. Salinity and Seawater Intrusion Processes
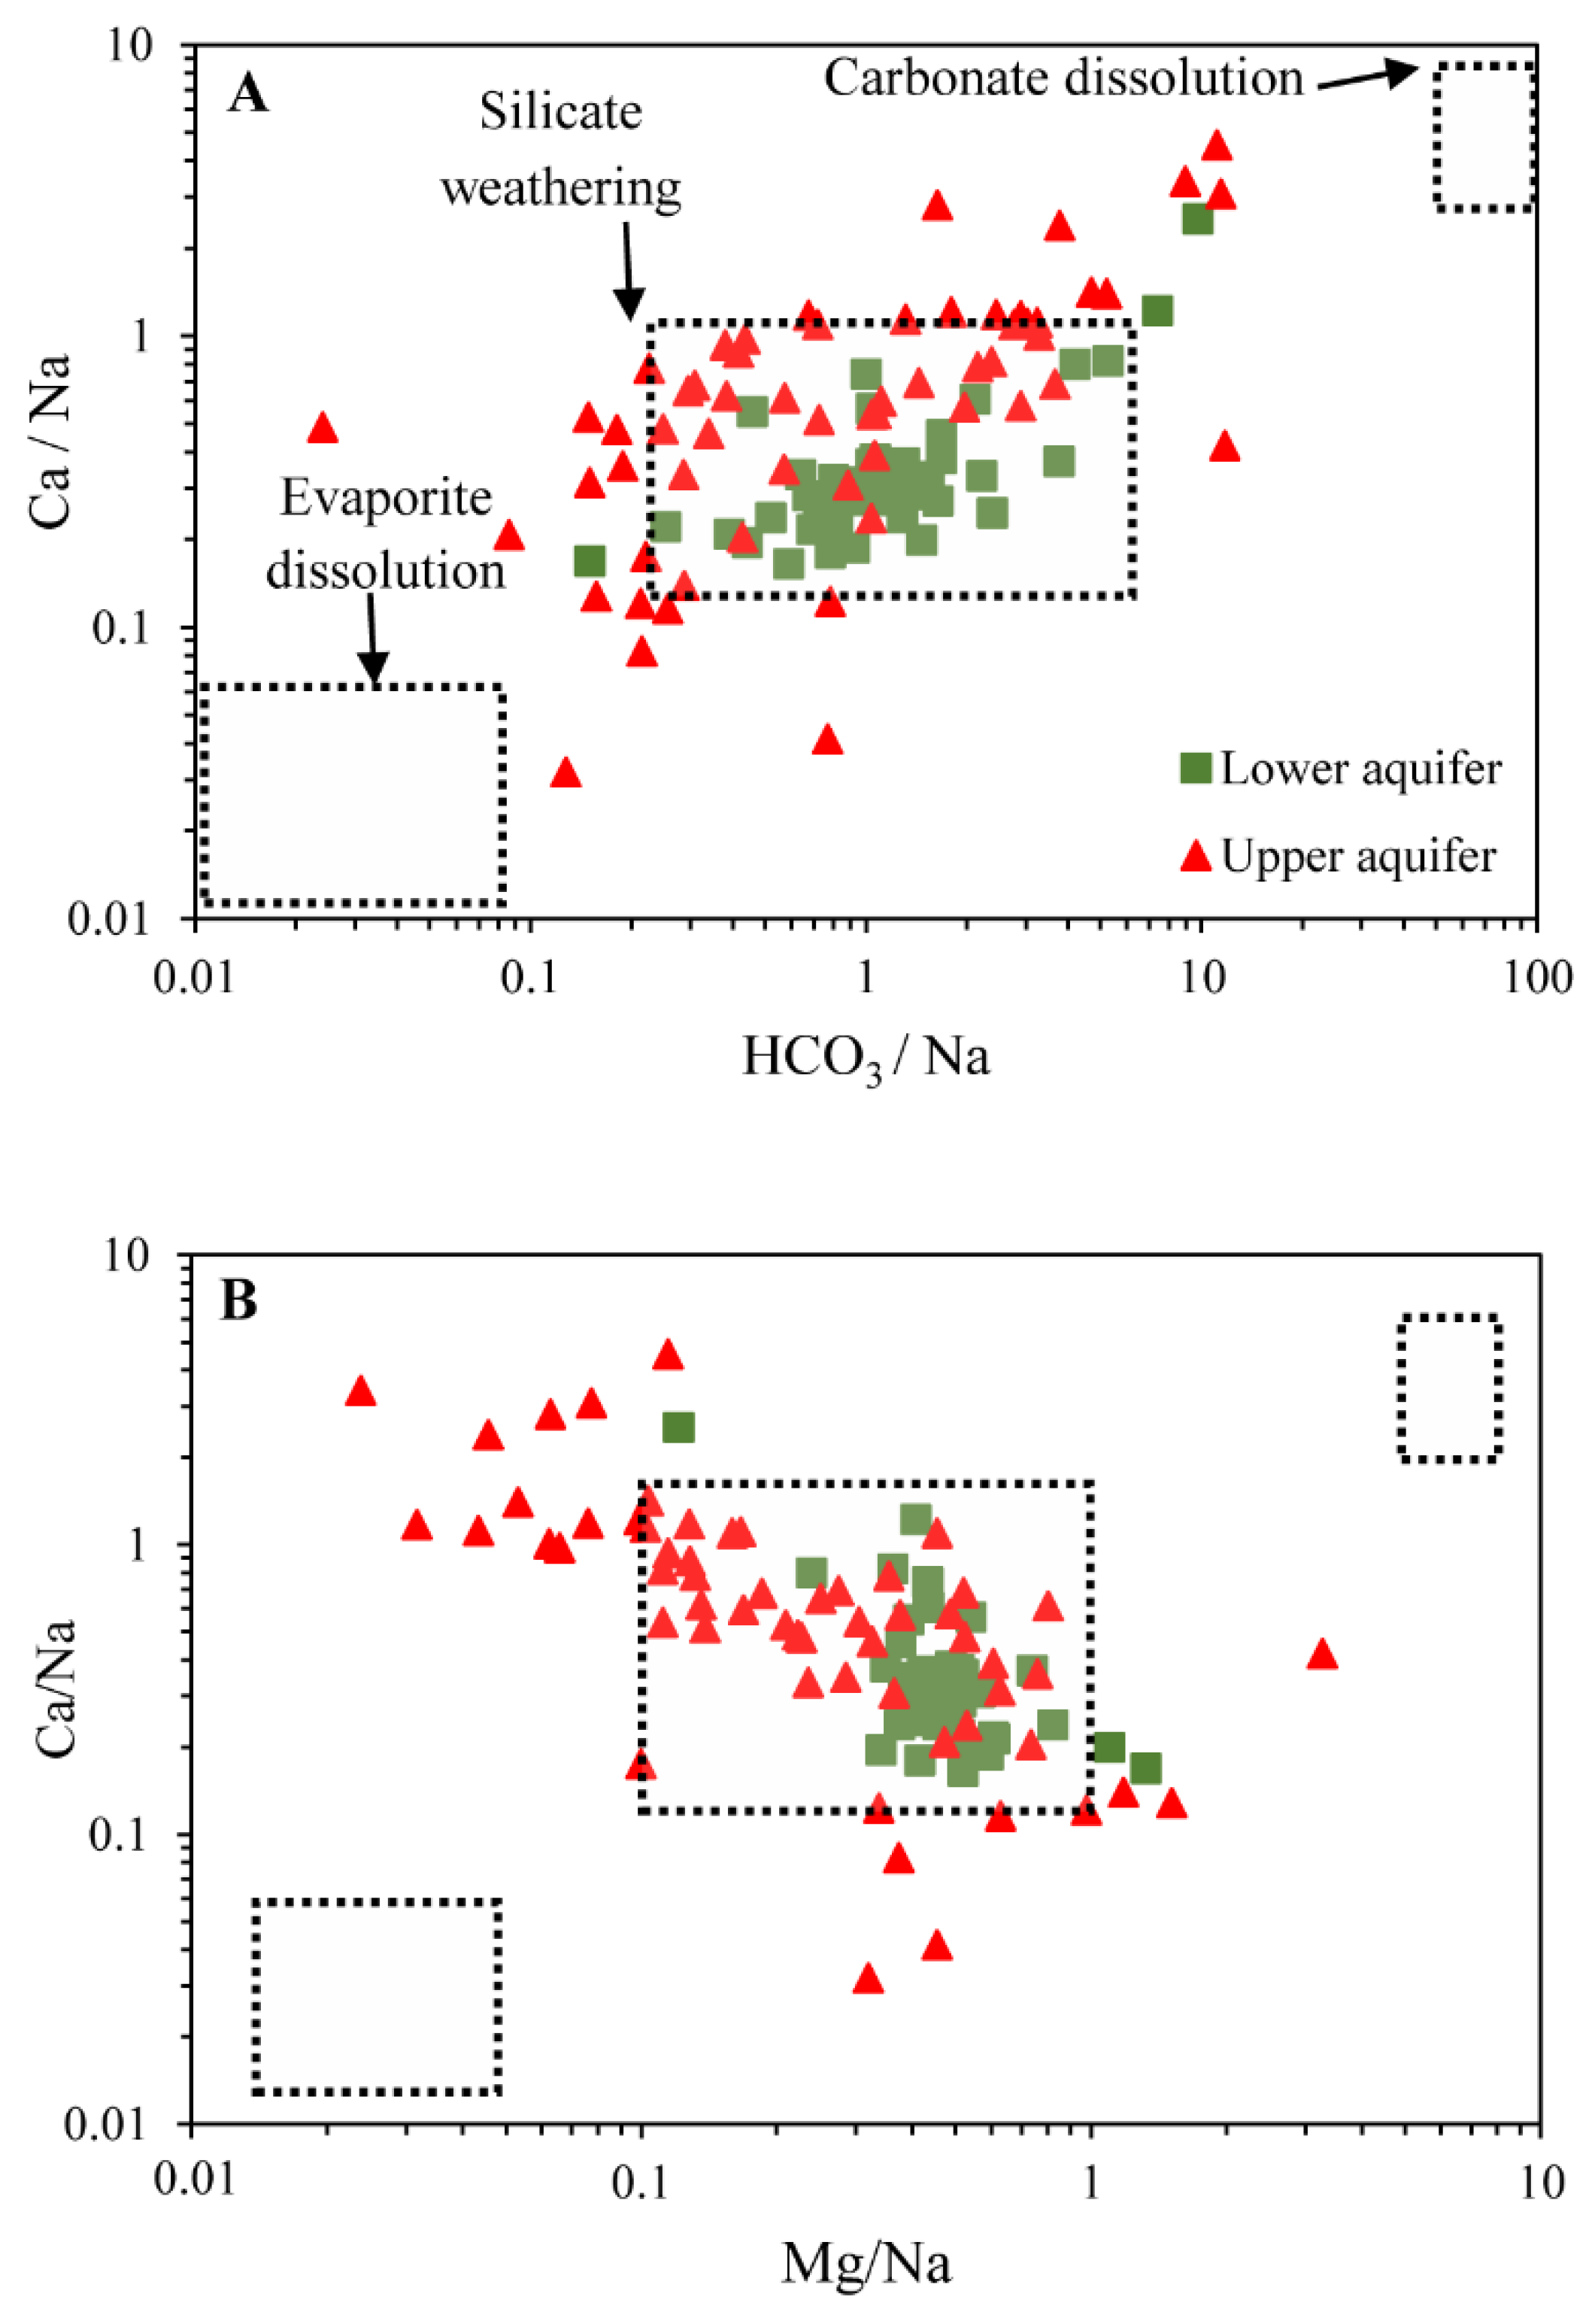
5.2.3. Water–Rock Interactions
5.3. Hydrogeological Synthesis and Sustainability of Beninese Coastal Groundwater
6. Conclusions
Supplementary Materials
Author Contributions
Funding
Institutional Review Board Statement
Informed Consent Statement
Data Availability Statement
Conflicts of Interest
References
- UNEP-WCMC. United Nations Environment-World Conservation Monitoring Centre: Global Distribution of Coastal and Oceanic Habitats. Available online: http://data.unep-wcmc.org/datasets (accessed on 5 March 2021).
- Neumann, B.; Vafeidis, A.T.; Zimmermann, J.; Nicholls, R.J. Future coastal population growth and exposure to sea-level rise and coastal flooding-a global assessment. PLoS ONE 2015, 10, e0118571. [Google Scholar]
- Lincke, D.; Hinkel, J. Economically robust protection against 21st century sea-level rise. Glob. Environ. Chang. 2018, 51, 67–73. [Google Scholar] [CrossRef]
- Lu, C.; Werner, A.; Simmons, C. Threats to coastal aquifers. Nat. Clim. Chang. 2013, 3, 605. [Google Scholar] [CrossRef]
- Pulido-Bosch, A.; Tahiri, A.; Vallejos, A. Hydrogeochemical characteristics of processes in the Temara aquifer in northwestern Morocco. Water Air Soil Pollut. 1999, 114, 323–337. [Google Scholar] [CrossRef]
- Alfarrah, N.; Walraevens, K. Groundwater Overexploitation and Seawater Intrusion in Coastal Areas of Arid and Semi-Arid Regions. Water 2018, 10, 143. [Google Scholar] [CrossRef] [Green Version]
- Mahlknecht, J.; Merchán, D.; Rosner, M.; Meixner, A.; Ledesma-Ruiz, R. Assessing seawater intrusion in an arid coastal aquifer under high anthropogenic influence using major constituents, Sr and B isotopes in groundwater. Sci. Total Environ. 2017, 587, 282–295. [Google Scholar] [CrossRef]
- Kafri, U.; Goldman, M.; Lyakhovsky, V.; Scholl, C.; Helwig, S.; Tezkan, B. The configuration of the fresh–saline groundwater interface within the regional Judea Group carbonate aquifer in northern Israel between the Mediterranean and the Dead Sea base levels as delineated by deep geoelectromagnetic soundings. J. Hydrol. 2007, 344, 123–134. [Google Scholar] [CrossRef]
- Steyl, G.; Dennis, I. Review of coastal-area aquifers in Africa. Hydrogeol. J. 2009, 18, 217–225. [Google Scholar] [CrossRef]
- Comte, J.-C.; Cassidy, R.; Obando, J.; Robins, N.; Ibrahim, K.; Melchioly, S.; Mjemah, I.; Shauri, H.; Bourhane, A.; Mohamed, I.; et al. Challenges in groundwater resource management in coastal aquifers of East Africa: Investigations and lessons learnt in the Comoros Islands, Kenya and Tanzania. J. Hydrol. Reg. Stud. 2016, 179, 2214–5818. [Google Scholar] [CrossRef]
- Nlend, B.; Celle-Jeanton, H.; Huneau, F.; Ketchemen-Tandia, B.; Fantong, W.Y.; Boum-Nkot, S.N.; Etame, J. The impact of urban development on aquifers in large coastal cities of West Africa: Present status and future challenges. Land Use Policy 2018, 75, 352–363. [Google Scholar] [CrossRef]
- Jenkins, R.; Edwards, C. The economic impacts of China and India on sub-Saharan Africa: Trends and prospects. J. Asian Econ. 2006, 17, 207–215. [Google Scholar] [CrossRef]
- Lagos Water Corporation. Stakeholder/CSO Interaction Policy with LSWC; Nigeria Network of NGOs: Lagos, Nigeria, 2016. [Google Scholar]
- Camwater. Planification et Maîtrise du Developpement Urbain: Passer des Idées Aux Actes; 1st National Urban Forum: Yaounde, Cameroon, 2014. (In French) [Google Scholar]
- SONEB. Alimentation en Eau Potable Des Populations au Bénin. 2013. Available online: http://wwwsonebcom/soneb2/99-archives/2016-01/10ans-yayiphp (accessed on 5 March 2021).
- SODECI. 1960/2010: Cinquante Ans au Service de la Cote D’Ivoire; SODECI: Abidjan, Côte d’Ivoire, Document Spécial; 2011; p. 51. (In French) [Google Scholar]
- Re, V.; Cissé Faye, S.; Faye, A.; Faye, S.; Gaye, C.B.; Sacchi, E.; Zuppi, G.M. Water quality decline in coastal aquifers under anthropic pressure: The case of a suburban area of Dakar (Senegal). Environ. Monit. Assess. 2011, 172, 605–622. [Google Scholar] [CrossRef]
- Houéménou, H.; Tweed, S.; Dobigny, G.; Mama, D.; Alassane, A.; Silmer, R.; Babic, M.; Ruy, S.; Chaigneau, A.; Gauthier, P.; et al. Degradation of Groundwater Quality in Expanding Cities in West Africa. A Case Study of the Unregulated Shallow Aquifer in Cotonou. J. Hydrol. 2020, 582, 124438. [Google Scholar] [CrossRef]
- Hounsinou, S.P. Assessment of potential seawater intrusion in a coastal aquifer system at Abomey-Calavi, Benin. Heliyon 2020, 6, e03173. [Google Scholar] [CrossRef]
- Maliki, R. Etude Hydrogéologique du Littoral Béninois Dans la Région de Cotonou (AO). Ph.D. Thesis, University of Cheick Anta Diop, Dakar, Senegal, 1993; p. 162. [Google Scholar]
- Boukari, M. Fonctionnement du Système Aquifère Exploité Pour L’approvisionnement en Eau de la Ville de Cotonou sur le Littoral Béninois. Impact du Développement Urbain sur la Qualité Des Ressources. Ph.D. Thesis, University of Cheick Anta Diop, Dakar, Senegal, 1998. [Google Scholar]
- McInnis, D.; Silliman, S.; Boukari, M.; Yalo, N.; Orou-Pete, S.; Fertenbaugh, C.; Sarre, K.; Fayomi, H. Combined Application of Electrical Resistivity and Shallow Groundwater Sampling to Assess Salinity in a Shallow Coastal Aquifer in Benin, West Africa. J. Hydrol. 2013, 505, 335–345. [Google Scholar] [CrossRef]
- Alassane, A.; Trabelsi, R.; Dovonon, L.F.; Odeloui, D.J.; Boukari, M.; Zouari, K.; Mama, D. Chemical evolution of the continental terminal shallow aquifer in the south of the coastal sedimentary basin of Benin (West Africa) using multivariate factor analysis. J. Water Resour. Prot. 2015, 7, 496–515. [Google Scholar] [CrossRef] [Green Version]
- Boukari, M.; Gaye, C.B.; Faye, A.; Faye, S. The Impact of Urban Development on Coastal Aquifers near Cotonou, Benin. J. Afr. Earth Sci. 1996, 22, 403–408. [Google Scholar] [CrossRef]
- Alahacoon, N.; Edirisinghe, M.; Simwanda, M.; Perera, E.; Nyirenda, V.R.; Ranagalage, M. Rainfall Variability and Trends over the African Continent Using TAMSAT Data (1983–2020): Towards Climate Change Resilience and Adaptation. Remote Sens. 2022, 14, 96. [Google Scholar] [CrossRef]
- Alassane, A. Etude Hydrogéologique du Continental Terminal et des Formations de la Plaine Littorale Dans la Région de Porto-Novo (Sud du Bénin): Identification des Aquifères et Vulnérabilité de la Nappe Superficielle. Ph.D. Thesis, University of Cheick Anta Diop, Dakar, Sénégal, 2004; p. 145. [Google Scholar]
- Chouti, W.; Mama, D.; Alapini, F. Étude des variations spatio-temporelles de la pollution des eaux de la lagune de Porto-Novo (sud Bénin). Int. J. Biol. Chem. Sci. 2010, 4, 1017–1029. [Google Scholar] [CrossRef]
- Mama, D.; Deluchat, V.; Bowen, J.; Chouti, W.; Yao, B.; Gnon, B.; Baudu, M. Caractérisation d’un Système Lagunaire en Zone Tropicale: Cas du lac Nokoué (Bénin). Eur. J. Sci. Res. 2011, 56, 516–528. [Google Scholar]
- Amoussou, E.; Camberlin, P.; Totin, S.H.; Tramblay, Y.; Houndenou, C.; Mahé, G.; Paturel, J.-E.; Boko, M. Evolution des précipitations extrêmes dans le bassin versant du mono (bénin-togo) en contexte de variabilité/changement climatique. In Climat: Système & Interactions. 27ème Colloque de l’Association Internationale de Climatologie; Association Internationale de Climatologie: Dijon, France, 2014. (In France) [Google Scholar]
- Slansky, M. Contribution à L’étude Géologique du Bassin Sédimentaire Côtier du Dahomey et du Togo; série 59, 165. Mém; BRGM n°11: Orléans, France, 1962. [Google Scholar]
- Oyédé, L.M. Dynamique Sédimentaire Actuelle et Messages Enregistrés Dans Les Séquences Quartenaires et Néogènes Du Domaine Margino Littoral Du Bénin (l’Afrique de l’Ouest). Ph.D. Thesis, Université de Bourgogne, Dijon, France, 1991. [Google Scholar]
- Lang, J.; Anthony, E.-J.; Oyédé, L.-M. Late quaternary sediments in incised coastal valleys in Benin: A preliminary sequence-stratigraphic interpretation. Quat. Int. 1995, 29, 31–39. [Google Scholar] [CrossRef]
- Penman, H.L. The dependence on transpiration on weather and soil conditions. J. Soil Sci. 1949, 1, 74. [Google Scholar] [CrossRef]
- Pallas, P. Contribution à L’étude des Ressources en Eau Souterraine du Bassin Côtier du Bénin. Confrontation Ressources—Besoins; Rapport du Projet PNUD: Cotonou, Bénin, 1988. [Google Scholar]
- Penna, D.; Stenni, B.; Sanda, M.; Wrede, S.; Bogaard, T.A.; Gobbi, A.; Borga, M.; Fischer, B.M.C.; Bonazza, M.; Charova, Z. On the reproducibility and repeatability of laser absorption spectroscopy measurements for δ2H and δ18O isotopic analysis. Hydrol. Earth Syst. Sci. Discuss. 2010, 14, 2975–3014. [Google Scholar] [CrossRef] [Green Version]
- Davis, S.; DeWiest, R.M. Hydrogeology; Wiley: New York, NY, USA, 1966. [Google Scholar]
- Foster, S.S.D.; Hirata, R.; Gomes, D.; D’Elia, M.; Paris, M. Groundwater Quality Protection: A Guide for Water Utilities, Municipal Authorities and Environment Agencies; World Bank: Washington, DC, USA, 2003. [Google Scholar]
- Craig, H. Isotopic variation in meteoric waters. Science 1961, 1133, 1702–1703. [Google Scholar] [CrossRef] [PubMed]
- Dansgaard, W. Stable isotopes in precipitation. Tellus 1964, 16, 436–468. [Google Scholar] [CrossRef]
- Winter, T.C.; Harvey, O.; Franke, L.; Alley, W. Ground Water and Surface Water: A Single Resource; U.S. Geological Survey Circular: Denver, CO, USA, 1998; Volume 1139. [Google Scholar]
- Sophocleous, M. Interactions between groundwater and surface water: The state of the science. Hydrogeol. J. 2002, 10, 52–67. [Google Scholar] [CrossRef]
- Winter, T.C. Relation of streams, lakes, and wetlands to groundwater flow systems. Hydrogeol. J. 1999, 7, 28–45. [Google Scholar] [CrossRef]
- WHO. Guidelines for Drinking Water Quality, 4th ed.; World Health Organization: Geneva, Switzerland, 2011. [Google Scholar]
- McArthur, J.M.; Sikdar, P.K.; Hoque, M.A.; Ghosal, U. Waste-water impacts on groundwater: Cl/Br ratios and implications for arsenic pollution of groundwater in the Bengal Basin and Red River Basin, Vietnam. Sci. Total Environ. 2012, 437, 390–402. [Google Scholar] [CrossRef] [Green Version]
- Aladejana, J.A.; Kalin, R.M.; Sentenac, P.; Hassan, I. Assessing the Impact of Climate Change on Groundwater Quality of the Shallow Coastal Aquifer of Eastern Dahomey Basin, Southwestern Nigeria. Water 2020, 12, 224. [Google Scholar] [CrossRef] [Green Version]
- Vengosh, A.; Ben-Zvi, A. Formation of salt plume in the coastal plain aquifer of Israel: The Be’er Toviyya region. J. Hydrol. 1994, 160, 21–52. [Google Scholar] [CrossRef]
- Vengosh, A.; Rosenthal, E. Saline groundwater in Israel: Its bearing on the water crisis in the country. J. Hydrol. 1994, 156, 389–430. [Google Scholar] [CrossRef]
- Raghunath, H.M. Text Book of Ground Water, 3rd ed.; New Age International Publishers: New Delhi, India, 2005. [Google Scholar]
- Metcalf and Eddy Consultant Co. (Camp Dresser and McKee Inc.). Coastal Aquifer Management Program, Integrated Aquifer Management Plan (Gaza Strip); Metcalf and Eddy Consultant Co. (Camp Dresser and McKee Inc.): Gaza, Palestine, 2001. [Google Scholar]
- Ghabayen, S.M.S.; McKee, M.; Kemblowski, M. Ionic and isotopic ratios for identification of salinity sources and missing data in the Gaza aquifer. J. Hydrol. 2006, 318, 360–373. [Google Scholar] [CrossRef]
- Maurya, P.; Kumari, R.; Mukherjee, S. Hydrochemistry in integration with stable isotopes (δ18O and δD) to assess seawater intrusion in coastal aquifers of Kachchh district, Gujarat, India. J. Geochem. Explor. 2019, 196, 42–56. [Google Scholar] [CrossRef]
- Stuyfzand, P.J. Base exchange indices as indicators of salinization or freshening of (coastal) aquifers. In Proceedings of the 20th Salt Water Intrusion Meeting, Naples, FL, USA, 23–27 June 2008; pp. 262–265. Available online: http://www.swim-site.nl/pdf/swim20/file281-284.pdf (accessed on 12 April 2021).
- Appelo, C.A.J.; Postma, D. Geochemistry, Groundwater and Pollution, 2nd ed.; Appelo, C.A.J., Postma, D., Eds.; CRC Press: Boca Raton, FL, USA, 2005. [Google Scholar] [CrossRef]
- Rina, K.; Datta, P.S.; Singh, C.; Mukherjee, S. Characterization and evaluation of processes governing the groundwater quality in parts of the Sabarmati basin, Gujarat using hydrochemistry integrated with GIS. Hydrol. Processes 2011, 26, 1538–1551. [Google Scholar] [CrossRef]
- Han, G.; Liu, C.-Q. Water geochemistry controlled by carbonate dissolution: A study of the river waters draining karst-dominated terrain, Guizhou Province, China. Chem. Geol. 2004, 204, 1–21. [Google Scholar] [CrossRef]
- Nlend, B.; Celle-Jeanton, H.; Huneau, F.; Garel, E.; Boum-Nkot, S.; Etame, J. Shallow urban aquifers under hyper-recharge equatorial conditions and strong anthropogenic constrains. Implications in terms of groundwater resources potential and integrated water resources management strategies. Sci. Total Environ. 2021, 757, 143887. [Google Scholar] [CrossRef]
- Chung, I.M.; Sophocleous, M.A.; Mitiku, D.B.; Kim, N.W. Estimating groundwater recharge in the humid and semi-arid African regions: Review. Geosci. J. 2016, 20, 731–744. [Google Scholar] [CrossRef]
- N’Tcha M’Po, Y.; Lawin, E.A.; Yao, B.K.; Oyerinde, G.T.; Attogouinon, A.; Afouda, A.A. Decreasing Past and Mid-Century Rainfall Indices over the Ouémé River Basin, Benin (West Africa). Climate 2017, 5, 74. [Google Scholar] [CrossRef] [Green Version]
- Onwuka, M.; Adekile, D. Demand-Recharge Study of the Groundwater Resources of the Ikeja Area of Lagos State, Nigeria. In Proceedings of the 1st Annual Symposium on Aquifer Vulnerability and Risk, Lagos, Nigeria; Nigeria Water and Sanitation Association: Lagos, Nigeria, 1986; pp. 175–197. [Google Scholar]


| pH | EC | T | Na+ | K+ | Mg2+ | Ca2+ | Cl− | Br− | NO3− | SO42− | HCO3− | δ18O | δ2H | D-Excess | ||
|---|---|---|---|---|---|---|---|---|---|---|---|---|---|---|---|---|
| Upper aquifer (n = 59) | Min | 3.4 | 57.7 | 27.5 | 5.2 | 0.1 | 0.3 | 0.7 | 6.9 | 0.0 | 0.0 | 0.8 | 2.4 | 0.7 | 0.0 | 5.9 |
| Max | 7.9 | 12,360.0 | 31.2 | 1678.3 | 97.5 | 420.2 | 803.1 | 3693.2 | 23.3 | 215.2 | 557.6 | 414.8 | 2.3 | 18.9 | 13.9 | |
| Median | 5.8 | 391.0 | 28.9 | 36.4 | 5.4 | 5.0 | 22.5 | 46.1 | 0.2 | 11.8 | 17.3 | 34.2 | 1.3 | 1.7 | 9.7 | |
| Average | 5.8 | 766.5 | 28.9 | 98.6 | 12.7 | 16.7 | 46.7 | 157.4 | 0.8 | 48.6 | 49.3 | 55.9 | 1.3 | 2.3 | 9.5 | |
| SD | 0.8 | 711.9 | 0.6 | 105.9 | 12.0 | 20.2 | 40.9 | 196.3 | 1.0 | 54.3 | 50.6 | 48.6 | 0.3 | 1.4 | 1.2 | |
| Lower aquifer (n = 48) | Min | 4.2 | 31.1 | 28.1 | 3.3 | 0.1 | 0.4 | 1.0 | 1.9 | 0.0 | 0.0 | 0.0 | 2.4 | −4.6 | −25.5 | 7.5 |
| Max | 7.1 | 483.0 | 32.1 | 48.9 | 44.0 | 11.8 | 45.9 | 78.5 | 0.2 | 81.8 | 36.0 | 176.9 | −3.0 | −15.0 | 13.4 | |
| Median | 5.0 | 52.6 | 29.8 | 5.7 | 0.4 | 0.8 | 1.7 | 7.8 | 0.0 | 2.2 | 2.8 | 7.3 | −3.4 | −17.1 | 10.1 | |
| Average | 5.1 | 90.6 | 29.9 | 9.1 | 2.1 | 1.7 | 4.4 | 11.6 | 0.0 | 7.4 | 4.3 | 16.6 | −3.4 | −17.4 | 10.1 | |
| SD | 0.4 | 57.2 | 0.7 | 5.7 | 2.7 | 1.5 | 4.6 | 7.2 | 0.0 | 8.7 | 3.4 | 17.6 | 0.2 | 1.2 | 1.1 | |
| Effective rainfall | Min | - | 24.9 | - | 1.2 | 0.4 | 0.2 | 0.9 | 2.2 | 0.02 | 1.0 | 1.8 | 1.7 | - | - | - |
| Max | - | 115.6 | - | 3.8 | 2.1 | 0.6 | 3.5 | 6.2 | 0.04 | 3.6 | 5.6 | 17.4 | - | - | - | |
| Median | - | 68.0 | - | 2.2 | 1.0 | 0.4 | 2.0 | 4.2 | 0.03 | 2.1 | 3.4 | 6.6 | - | - | - | |
| Average | - | 67.6 | - | 2.2 | 1.2 | 0.4 | 2.1 | 4.2 | 0.03 | 2.0 | 3.5 | 8.5 | - | - | - | |
| SD | - | 29.0 | - | 0.3 | 0.2 | 0.1 | 0.8 | 1.3 | 0.01 | 0.9 | 1.3 | 6.2 | - | - | - |
Publisher’s Note: MDPI stays neutral with regard to jurisdictional claims in published maps and institutional affiliations. |
© 2022 by the authors. Licensee MDPI, Basel, Switzerland. This article is an open access article distributed under the terms and conditions of the Creative Commons Attribution (CC BY) license (https://creativecommons.org/licenses/by/4.0/).
Share and Cite
Odeloui, D.; Nlend, B.; Huneau, F.; Celle, H.; Garel, E.; Alassane, A.; Boukari, M.; Sambienou, G. Insight into Groundwater Resources along the Coast of Benin (West Africa) through Geochemistry and Isotope Hydrology; Recommendations for Improved Management. Water 2022, 14, 2154. https://doi.org/10.3390/w14142154
Odeloui D, Nlend B, Huneau F, Celle H, Garel E, Alassane A, Boukari M, Sambienou G. Insight into Groundwater Resources along the Coast of Benin (West Africa) through Geochemistry and Isotope Hydrology; Recommendations for Improved Management. Water. 2022; 14(14):2154. https://doi.org/10.3390/w14142154
Chicago/Turabian StyleOdeloui, Diane, Bertil Nlend, Frédéric Huneau, Hélène Celle, Emilie Garel, Abdoukarim Alassane, Moussa Boukari, and Gédéon Sambienou. 2022. "Insight into Groundwater Resources along the Coast of Benin (West Africa) through Geochemistry and Isotope Hydrology; Recommendations for Improved Management" Water 14, no. 14: 2154. https://doi.org/10.3390/w14142154