Article

Structural Characteristics of Periphytic Algal Community and Its Relationship with Environmental Factors in the Taiyuan Region of the Fenhe River

Shanxi Key Laboratory for Research and Development of Regional Plants, School of Life Science, Shanxi University, Taiyuan 030006, China
*
Author to whom correspondence should be addressed.
Water 2022, 14(14), 2151; https://doi.org/10.3390/w14142151
Submission received: 17 May 2022 / Revised: 16 June 2022 / Accepted: 5 July 2022 / Published: 6 July 2022
(This article belongs to the Special Issue Water Pollution and Its Impact on Human Health)

Abstract

:
In order to explore the characteristics of the periphytic algae community structure and its relationship with environmental factors in the Taiyuan region of the Fenhe River, a total of six sampling sites were investigated in July and December 2021. The effects of water quality status and environmental factors at each sampling point on the community structure of epiphytes were detected. The results showed that a total of 7 phyla and 54 genera of periphytic algae were identified in the Taiyuan region of the Fenhe River, and the species composition was mainly Bacillariophyta, Cyanophyta, and Chlorophyta. According to the analysis results of the biodiversity index, the water body of the Taiyuan region of the Fenhe River is in a state of moderate pollution. The correlation analysis between the epiphytic algae and environmental factors showed that the cell density of algae was significantly correlated with dissolved oxygen (DO), phosphate ( PO 4 3 -P), chemical oxygen demand (COD), total phosphorus (TP), and transparency (SD) in the wet season. The algal cell density in the dry season was significantly correlated with water temperature (WT), TP, PO 4 3 -P, and COD. According to the redundancy analysis, the community distribution of the epiphytic algae in the Taiyuan region of the Fenhe River was closely related to physical and chemical factors such as COD, nitrate nitrogen ( NO 3   -N), WT, dissolved organic carbon (DOC), total nitrogen (TN), and TP, and COD is the main environmental factor driving the change in the community distribution of the periphytic algae in the wet season. TN is the main control factor driving the change in the biological community distribution of periphytic algae in the dry season.

1. Introduction

Periphytic algae refer to microscopic plant communities attached to various artificial or natural substrates on the surface of all objects in water [1]. According to the different substrates attached, the periphytic algae can be divided into epipelic algae, epilithic algae, and epixylic algae [2]. Periphytic algae are important primary producers of river ecosystems [3], which widely exist in various water bodies and play a key role in the aquatic ecosystem, with diverse habitat types, a large number of species, and a complex community structure [4]. Because of its short life cycle, it can have a rapid response to river water quality or environmental change, and different algae have different tolerances, sensitivities, and adaptabilities to different pollutants, which has become one of the main research objects of river ecology [5]. Periphytic algae are widely associated with specific environments in different geographical regions [6]. Some studies have shown that habitat complexity has a positive impact on the diversity of epiphytic algae communities, and complex habitats promote the diversity and availability of resources [7]. The composition and structure distribution of attached algae communities are highly correlated with the seasonal changes in the environment, which are reflected in the changes in water physicochemical properties, hydrological rhythm, climate, and other factors based on space and time [8].
The Fenhe River is the largest river in Shanxi Province in northern China and the second largest tributary of the Yellow River. It originated in Ningwu County, Xinzhou, Shanxi Province, with a total length of 713 km and a drainage area of 39,721 km2, accounting for about a quarter of the total area of the province. The Taiyuan urban section of the Fenhe River is located in the middle section of the Fenhe River, with a total length of about 30 km, running through the five major regions of the Taiyuan. With the development of urban industry and the rapid expansion of the population, untreated domestic sewage, industrial, and agricultural wastewater are continuously discharged into the water body of the Fenhe River, resulting in the deterioration of the water quality and the increasingly serious eutrophication of the water body [9]. At present, there have been many reports on the biological monitoring of the Taiyuan urban section of the Fenhe River, but most of them use phytoplankton and protozoa as monitoring indicators [10]; there are few reports on the distribution of the periphytic algae in the Taiyuan region of the Fenhe River. DeNicola believes that periphytic algae may monitor the impact of fixed-point pollution sources around lakes or coastal developments faster than planktonic algae [3]. By contrast, planktonic algae can be taken away from other areas by means of water flow, and wind and wave migration, to avoid being in an unfavorable environment for a long time, while periphytic algae are relatively fixed in their habitats and will be affected by other factors throughout their life cycle. The continuous impact of physical, chemical, and biological environmental changes in the habitat area makes it difficult to avoid the impact of adverse environmental stress [11]. Therefore, the periphytic algae may have a better response to the continuous changes in the water environment. In this study, we studied the community structure characteristics of the periphytic algae in the Taiyuan region of the Fenhe River, as well as the impact of environmental factors on the periphytic algae in the wet season (summer) and the dry season (winter). The differences in physical and chemical properties of water and algal cell density in time and space were also explored. The primary objectives of the study were to answer the following questions. (1) What is the composition of the periphytic algae community structure in the Taiyuan urban section of Fenhe River? (2) How does the periphytic algae community respond to seasonal changes? (3) What are the key environmental factors affecting the distribution of periphytic algae communities? The answers to these questions can help us reveal the response of periphytic algae to the environment, to provide a scientific theoretical basis for water quality monitoring and protection in the Taiyuan region of the Fenhe River.

2. Materials and Methods
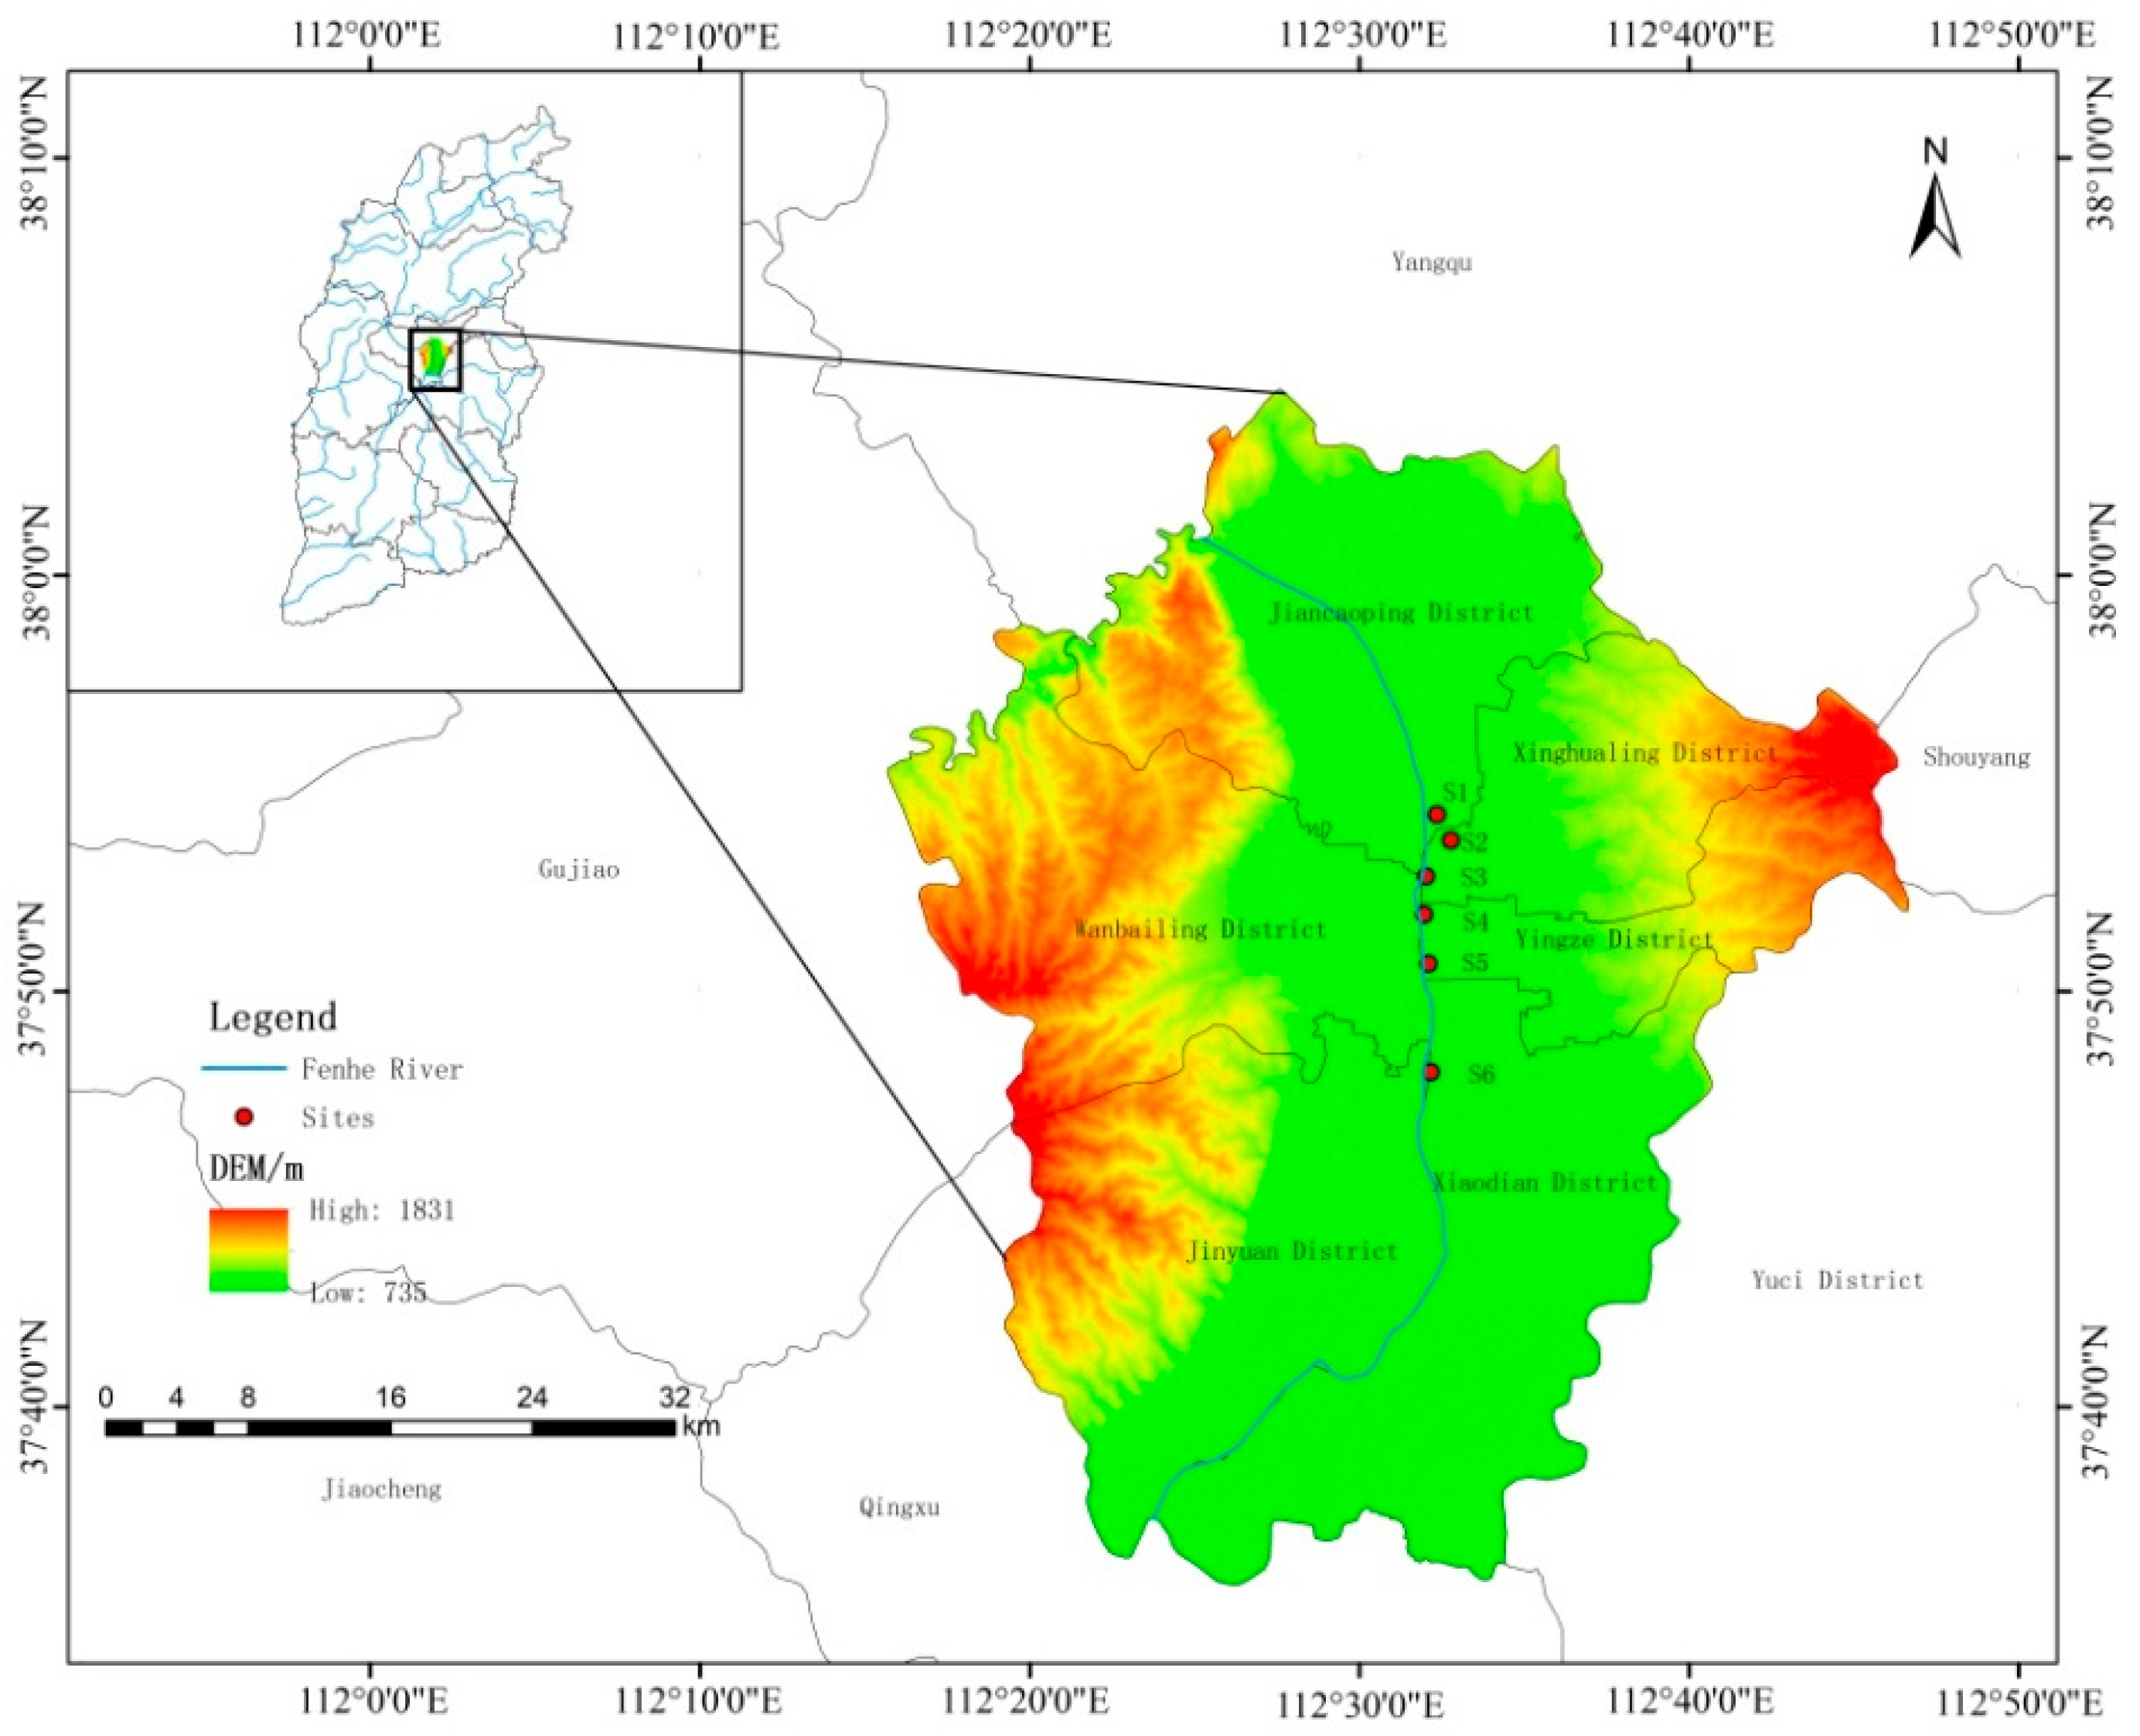
2.1. Study Area

The structure of the periphytic algal community in the Taiyuan urban section of the Fenhe River was investigated in July (wet season) and December (dry season) in 2021. A total of 6 sampling points were set from upstream to downstream according to the sewage culvert. S1 and S2 are located in the wetland park, and there are artificial planting emergent plants and artificial breeding aquatic animals in the river. S4 and S5 are located in the middle and lower reaches of Taiyuan section of Fenhe River, respectively, with a small flow velocity and relatively dense residential areas. Because of its landscape, the population flows more and faces serious environmental protection in dealing with the water pollution. The river width of each sample point is about 350–450 m, which is located in the section of the revetment treatment and sewage interception project. There are underground drainage culverts along the rivers on both sides of the river in the east and west of the river, which intercept all the tributaries or flood discharge channels on both sides of the river, and there is no confluence of tributaries on the whole line. The domestic sewage along the line is discharged into the sewage treatment plant through the sewage pipe network and pumping station. Due to the imperfect sewage pipe network and the nondiversion of rain and sewage in the city, the treatment capacity of the pumping station is limited in the case of heavy rainfall on rainy days. Some sewage cannot enter the sewage treatment plant and discharge directly into the river, resulting in river water pollution. The main pollutants in the urban section of the Fenhe River in Taiyuan are industrial wastewater and domestic sewage [12]. The specific locations of sampling points are shown in Figure 1.

2.2. Sample Collection

As it is difficult to collect natural substrates in the Taiyuan urban section of the Fenhe River, standard glass slides (25.4 × 76.2 mm) were selected as artificial substrates for collecting algal samples. The placement depth of the artificial substrate (10 fixed pieces of standard glass slides on glass slide rack to make diatom meter) sampler is generally 20 cm so that it can obtain appropriate light. At least two artificial substrates are placed at each sampling point to ensure the success of sample collection. The placement time is generally 20–30 days. After 2–4 weeks of cultivation, the artificial substrate can represent the living algae community on the natural substrate [13]. On every sampling date, ten slides were randomly collected from each site. These slides were scrubbed with a nylon brush on the site in a known volume of water and fixed immediately with a 15% Lugol’s solution [14]. Then, the algal cell density was counted in a cell counting chamber (0.1 mL) using a microscope (OlympusBX51) at 400× magnification. The cell numbers of different algae species in 100 random fields were determined [15]. Species taxonomic identification was carried out under a microscope, and the algae were identified as a genus according to their morphology by referring to “The freshwater algae of China: systematics, taxonomy and ecology” [16]. The periphytic algae abundance calculation formula is as follows:
N = n × (A/Ac) × (V/Va)
where N is the number of periphytic algae per liter of water (cells L1), A is the area of the counting frame (400 mm2), Ac is the counting area (mm2), V is the volume of remaining water after the concentration of each liter of water sample (30 mL), Va is the volume of the counting frame (0.1 mL), and n is the periphytic algae cell number obtained by counting.

2.3. Determination of Environmental Parameters

The water samples were collected at 0.5 m below the water surface of each sample site and collected three times in parallel. After sealing, the samples were sent back to the laboratory for determination. The YSI portable water quality monitor was used to measure water temperature (WT), electrical conductivity (SPC), pH, salinity (SAL), total dissolved solids (TDS), and dissolved oxygen (DO), and transparency (SD) was measured using a Seville transparency disc. Some chemical indicators such as total nitrogen (TN), total phosphorus (TP), phosphate (PO-P), nitrate nitrogen ( NO 3 -N), ammonia nitrogen ( NH 4 + -N), chemical oxygen demand (COD), and dissolved organic carbon (DOC) were determined following the methods in Wang et al. [17].

2.4. Data Analysis

After identification and enumeration of periphytic algae, the Shannon–Wiener diversity index (H’), Pielou evenness index (J), and Margalef richness index (d) were used to analyze the biodiversity index of each sample point [18]. The calculation formula is as follows:
  • Shannon–Wiener diversity index (H’):
H’ = −∑Pi × lnPi
2.
Pielou evenness index (J):
J = H’/lnS
3.
Margalef richness index (d):
d = (S − 1)/lnN
4.
Dominance index formula (Y):
Y = fi × Pi
where Pi = Ni/N, Ni is the number of individuals of the i species of algae, and N is the sum of the individual numbers of all species of algae. S is the number of algal species. The fi is the frequency of occurrence of the specie i at each point.
The redundancy analysis was carried out using CANOCO5 software to clarify the relationship between the changes in attached algae and environmental factors. One-way ANOVA and correlation analysis were performed using SPSS21.0 software, and Origin2018 software was used for graphing.

3. Results

3.1. Physical and Chemical Conditions

The environmental factors of each sampling point in the Taiyuan urban section are shown in Table 1. It can be seen from the table that in summer, the highest temperature reached 28.15 °C and the lowest temperature was 25.05 °C. In winter, the highest temperature was 6.10 °C and the lowest was 4.05 °C. The pH value was between 8.61 and 9.12 in the wet season and between 7.27 and 8.31 in the dry season. They are weakly alkaline. The DO concentration was between 7.75 and 9.43 mg/L in the wet season and between 13.01 and 19.93 mg/L in the dry season. With the decrease in water volume from the wet season to dry season, PO 4 3 -P, COD, and DOC all decreased to different degrees, while TN, NO 3 -N, NH 4 + -N, and TP all increased. The average value of TN, TP, NO 3 -N, and NH 4 + -N was 0.57 mg/L, 0.08 mg/L, 0.09 mg/L, and 0.36 mg/L, respectively, in the wet season, and 2.53 mg/L, 0.10 mg/L, 0.13 mg/L, and 0.48 mg/L, respectively, in the dry season. According to the one-way analysis of variance test, the environmental factors TN, NO 3 -N, NH 4 + -N, and TP had significant differences between the dry season and the wet season (p < 0.05).

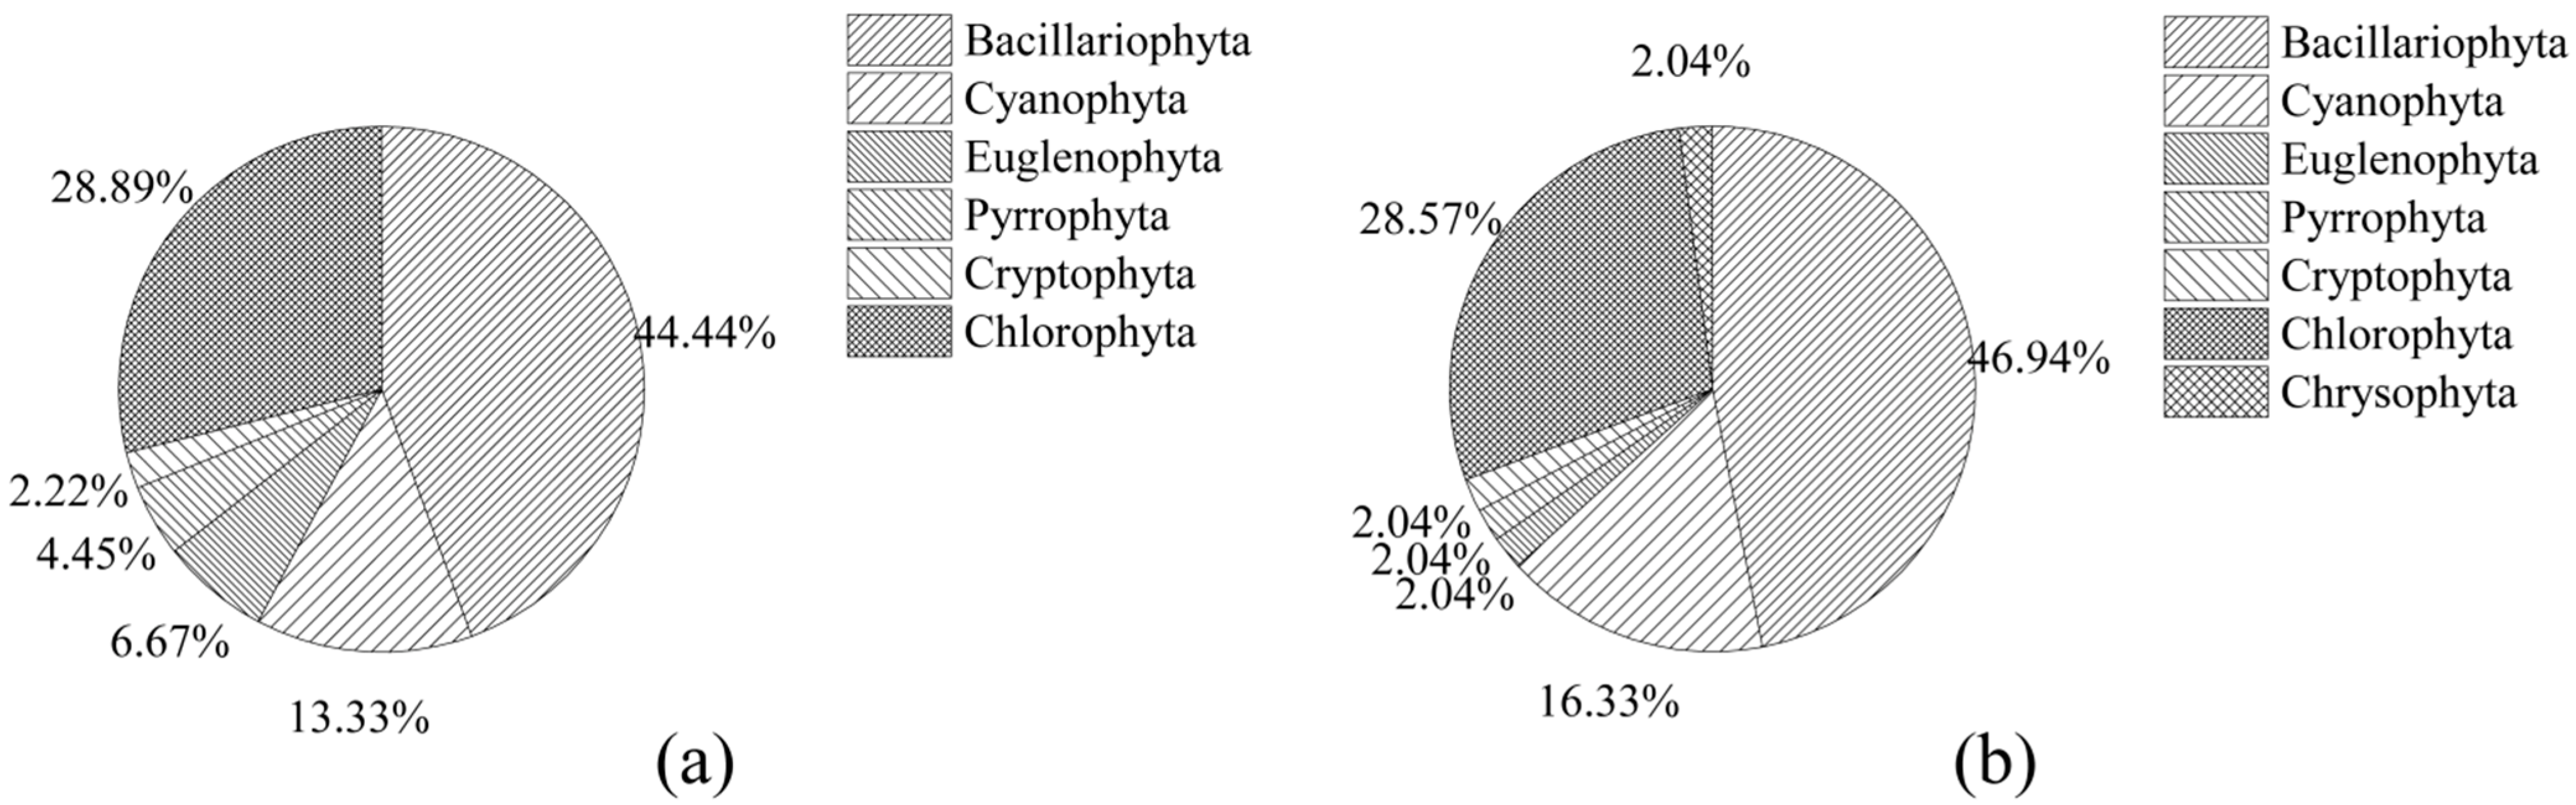
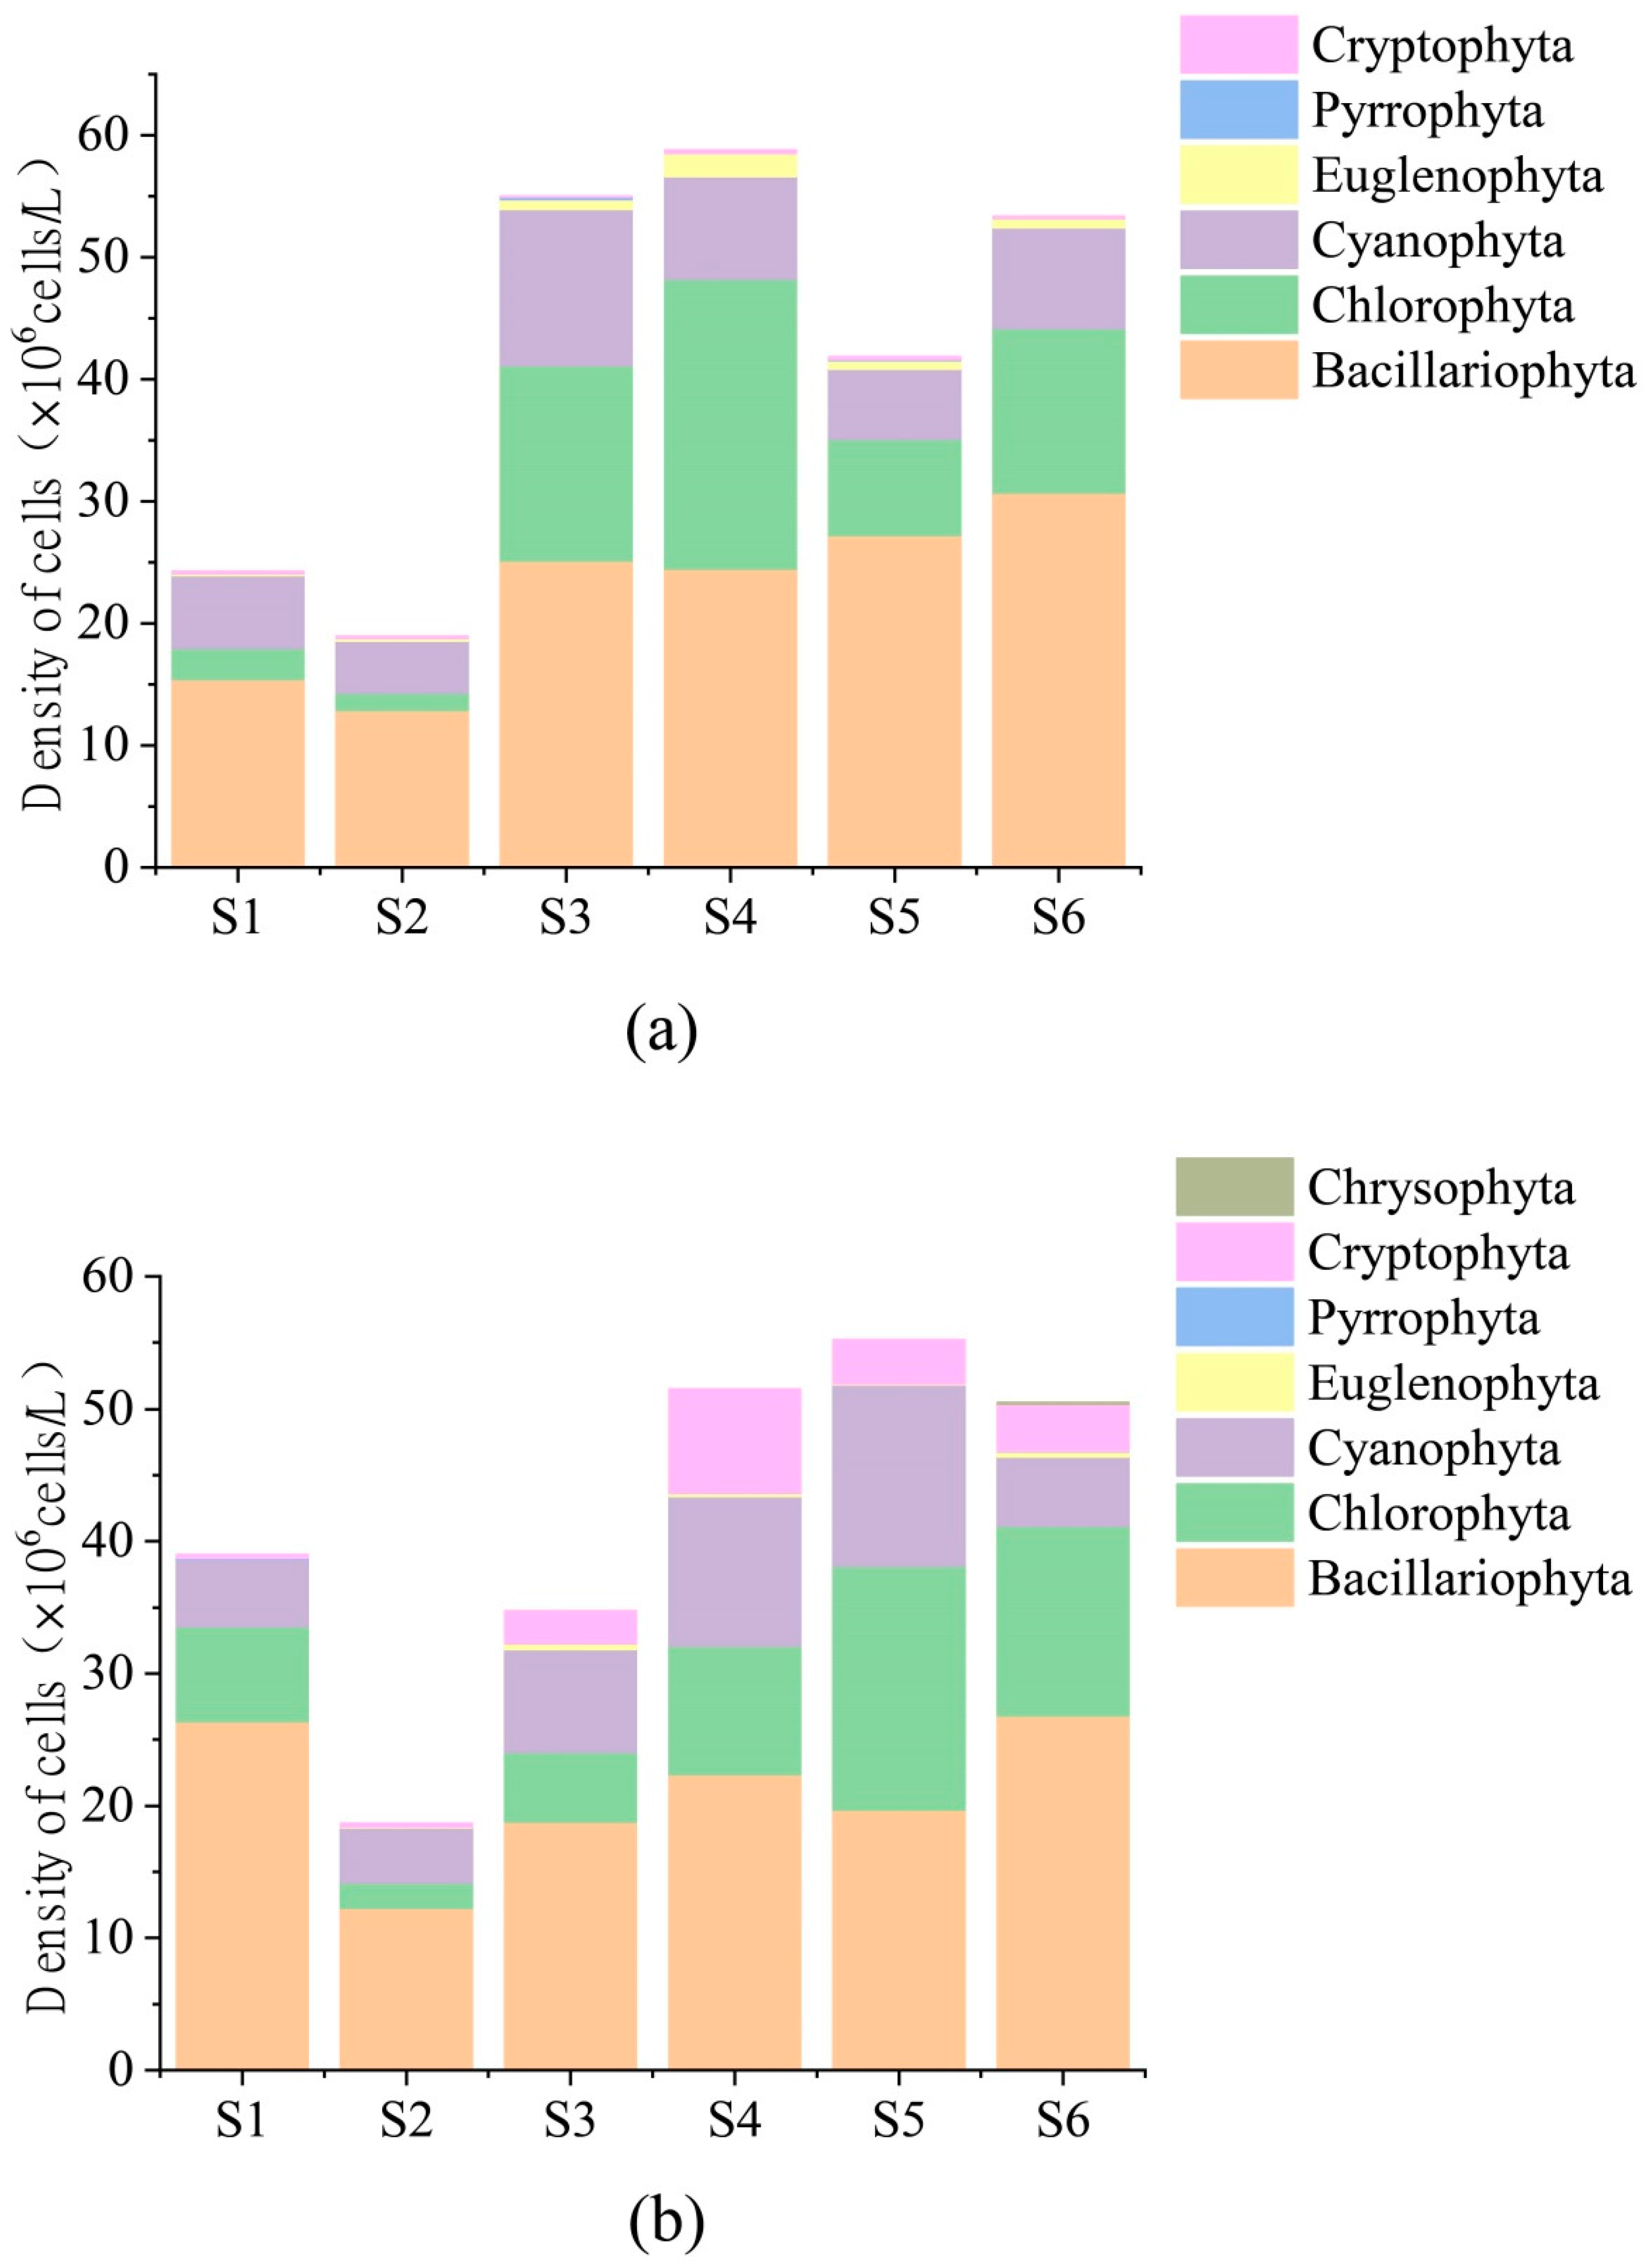
3.2. Characteristics of Periphytic Algal Community Structure

According to the sampling results of this survey (Figure 2), 45 genera of 6 phyla of periphytic algae were identified in summer, including 6 genera of Cyanophyta, accounting for 13.33%; 20 genera of Bacillariophyta, accounting for 44.44%; 13 genera of Chlorophyta, accounting for 28.89%, 1 genus of Cryptophyta, accounting for 2.22%, 3 genera of Euglenophyta, accounting for 6.67%; 2 genera of Pyrrophyta, accounting for 4.45%. A total of 49 genera of 7 phyla were identified in the dry season, including 8 genera of Cyanophyta, accounting for 16.33%; 23 genera of Bacillariophyta, accounting for 46.94%; 14 genera of Chlorophyta, accounting for 28.57%. Cryptophyta, Euglenophyta, Pyrrophyta, and Chrysophyta were identified as 1 genus, each accounting for 2.04%. From the proportion of each phylum, it can be seen that the epiphytic algae in the urban section of Fenhe Taiyuan were mainly Bacillariophyta, followed by Chlorophyta and Cyanophyta; compared with the dry season, the proportion of Bacillariophyta during the wet season decreased, while the proportion of Chlorophyta increased. Chrysophyta was found in the dry season, and the frequency of Euglenophyta and Pyrrophyta increased greatly in the wet season.
The densities of epiphytic algae cells at each sampling point are shown in Figure 3. The cell density of each sampling point was dominated by Bacillariophyta. During the wet season, the density of epiphytic algal cells varied in the range of 0.42 × 10⁶–135.8 × 10⁶ cells/L, and the average abundance was 42.03 × 10⁶ cells/L. The cell density of sampling point S4 was highest, which was 58.78 × 10⁶ cells/L, and the abundance of epiphytic algae at each sampling point was S4 > S3 > S6 > S5 > S1 > S2. In summer, Bacillariophyta and Chlorophyta were the main groups, of which Bacillariophyta had obvious advantages, accounting for 53.84% of the total abundance. Chlorophyta accounted for 25.84% of the total cell density. The variation range of algal cell density during the dry season was 0.1 × 10⁶–126.3 × 10⁶ cells/L. The average abundance was 35.66 × 10⁶ cells/L, and the cell density of sampling point S5 was highest, which was 55.20 × 10⁶ cells/L. The abundance of epiphytic algae at each sampling point was S5 > S4 > S6 > S1 > S3 > S2. Bacillariophyta and Chlorophyta were the principal groups in winter, and they accounted for 73.4% of the total cell density.

3.3. Diversity of Periphytic Algal Community and Water Quality Assessment

The biological index of periphytic algae in the wet season and dry season is shown in Figure 4. In the wet season, the mean value of the Shannon diversity index (H’) was 1.18 and the variation range was 1.15–1.25. The mean value of the Pielou evenness index (J) was 0.34 and the range of variation was 0.32–0.35. The mean value of the Margalef richness index (d) was 4.28 and the variation range was 4.38–5.07. In the dry season, the mean H’ of the periphytic algae was 1.13 and the range of variation was 1.05–1.17; the mean value of J index was 0.32 and the variation range was 0.30–0.33; the d-mean was 4.44 and the variation range was 3.91 to 4.85. It is generally considered that when H’ is 3 > H’ > 1, the water is moderately polluted. When J is 0.5 > J > 0.1, the water was moderately polluted. When d > 3, the water is lightly polluted or not polluted [19]. According to the H’ and J index, it can be seen that the water quality of the Taiyuan urban section of the Fenhe River was moderately polluted, and the pollution degree in summer was slightly higher than that in winter. ANOVA analysis based on the biodiversity index showed that there were significant differences in algae communities between the wet season and the dry seasons (p < 0.05). According to the d index, the community structure in the dry season was more complex and stable.

3.4. Correlation between Periphytic Algal Community Structure and Environmental Factors

Through the analysis of the correlation between the periphytic algae and environmental factors in the wet season (Figure 5a), it was found that the diatom cell density had a very significant negative correlation with DO, PO 4 3 -P, and COD (p < 0.01); TP had a significant positive correlation (p < 0.05). Cyanobacterial cell density was significantly negatively correlated with DO, PO 4 3 -P (p < 0.01), and COD (p < 0.05). There was a significant positive correlation with SD (p < 0.01). Chlorophyta had a significant negative correlation with DO (p < 0.01), whereas it had a significant negative correlation with PO 4 3 -P (p < 0.05).
Through the analysis of the correlation between the periphytic algae and environmental factors in the dry season (Figure 5b), it was found that the diatom cell density had a significant positive correlation with WT (p < 0.05), while it had a negative correlation with TP (p < 0.05). Cyanobacterial cell density had a significant positive correlation with WT (p < 0.05). Chlorophyta had a significant positive correlation with WT (p < 0.01) and PO 4 3 -P (p < 0.05), whereas it had a negative correlation with COD (p < 0.05).

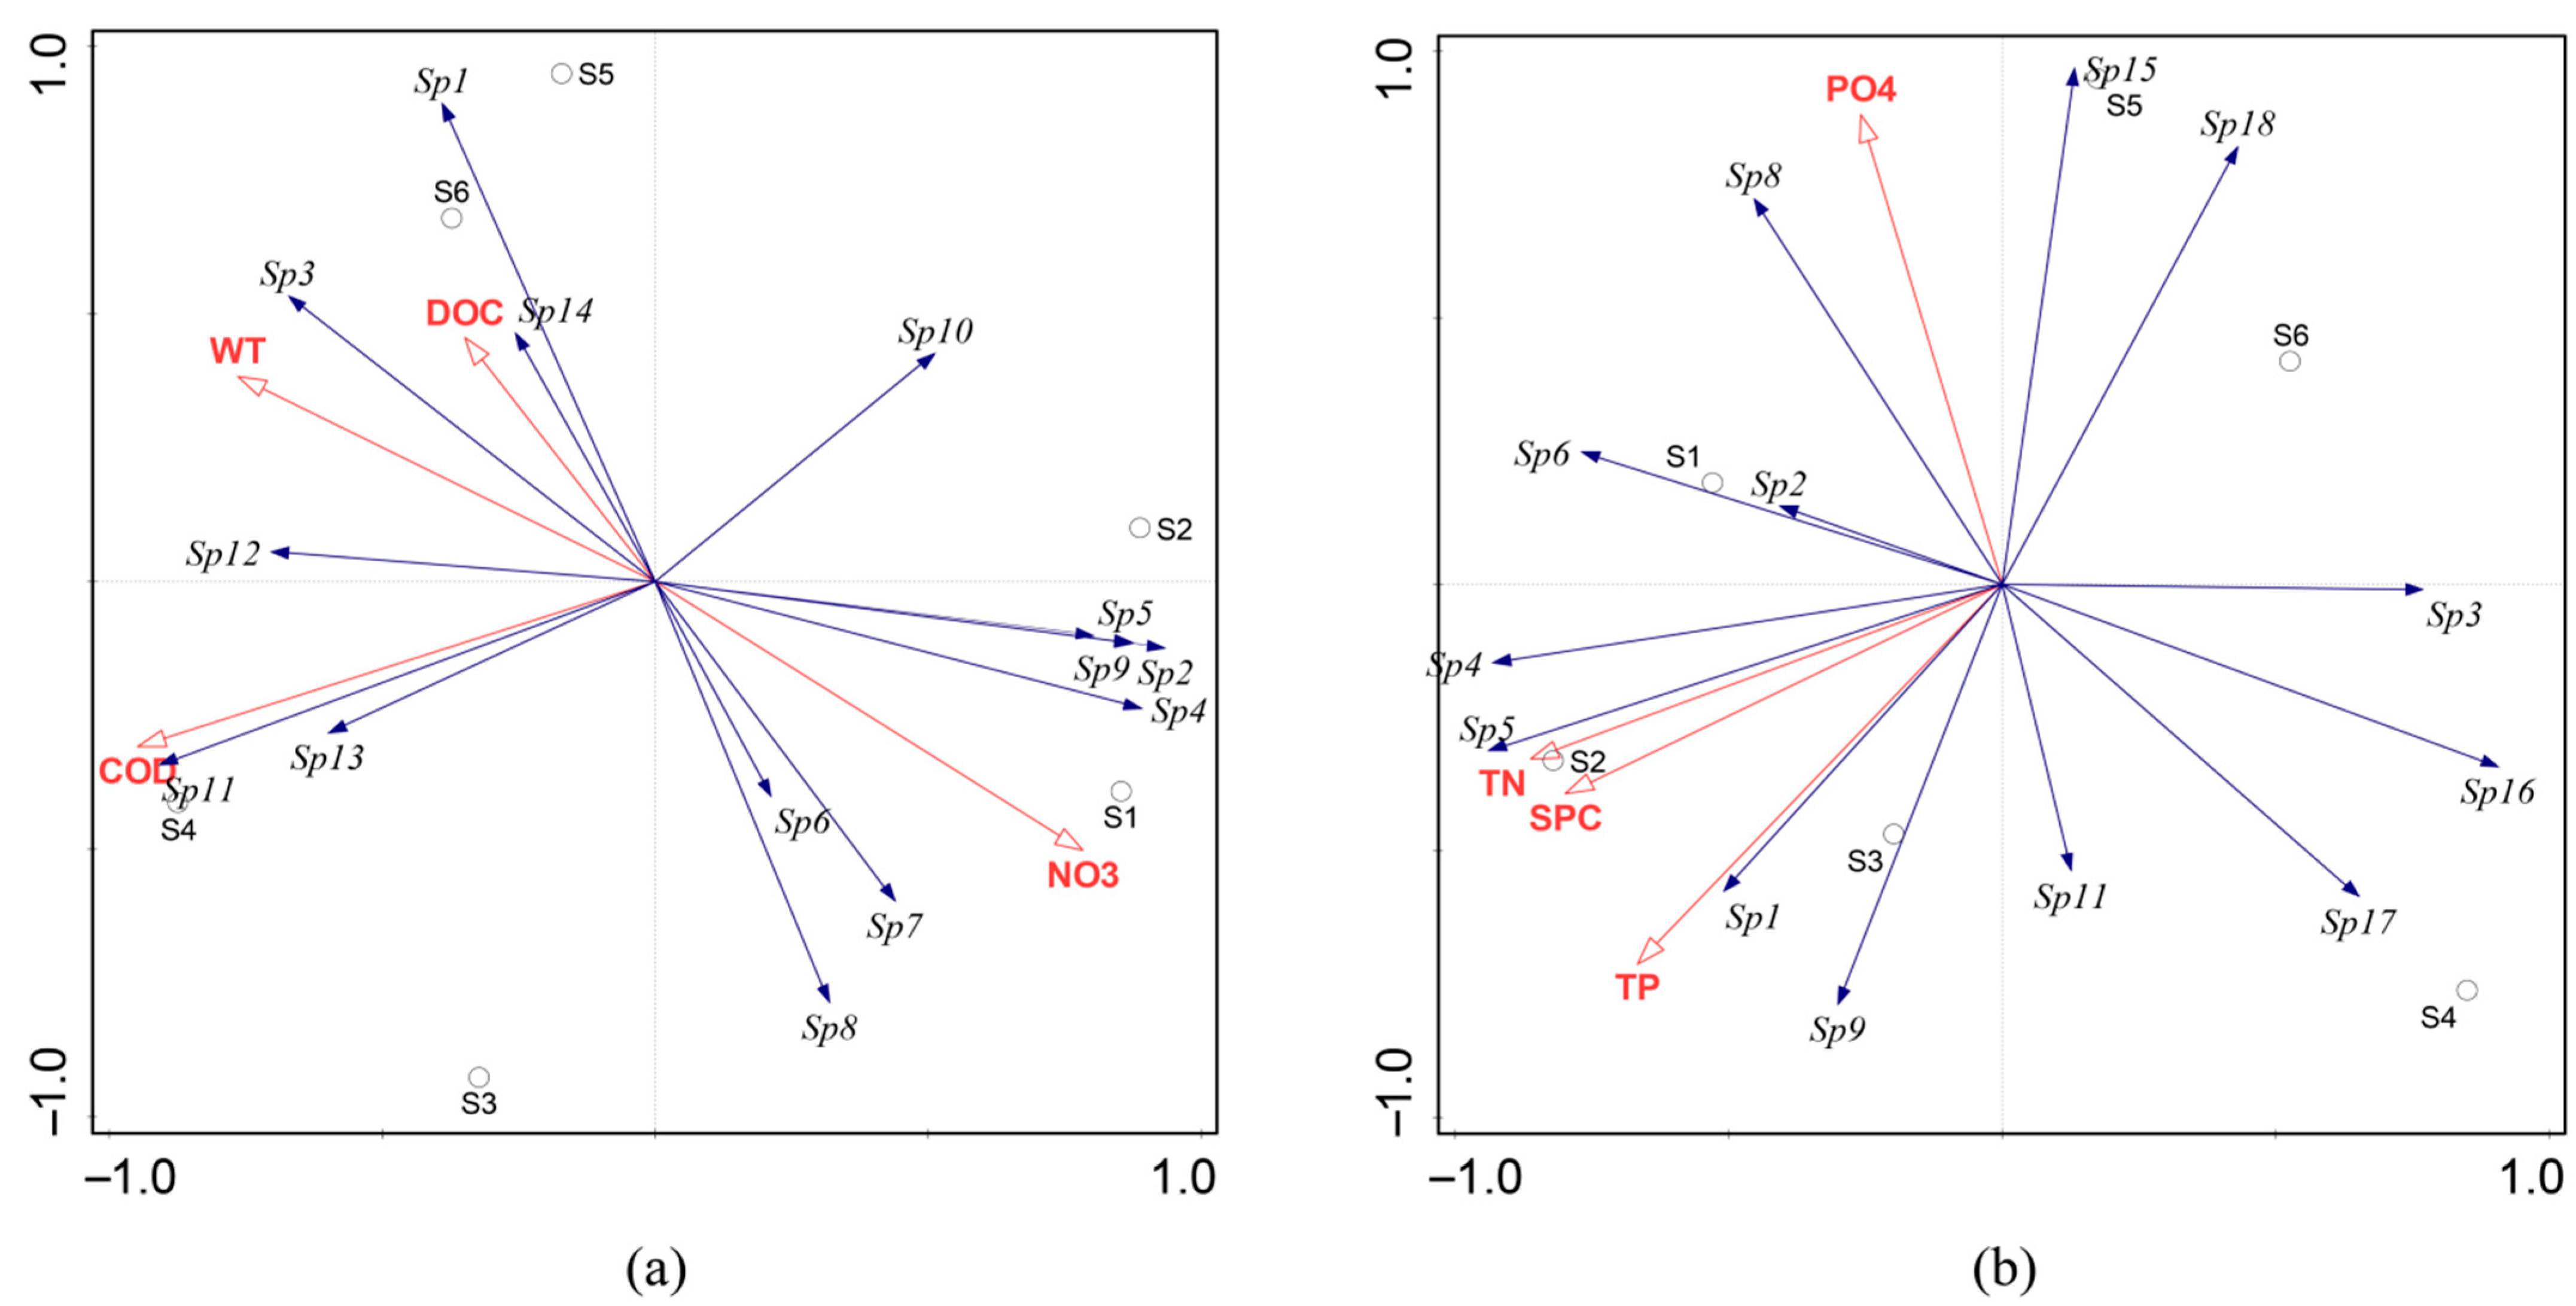
3.5. Redundancy Analysis of Periphytic Algal Community Structure and Environmental Factors

According to the dominance index, the epiphytic algae with Y > 0.02 were listed as the dominant species. The dominant species of epiphytic algae and environmental factors were sorted and analyzed. The species and codes of epiphytic algae used for sorting are shown in Table 2. Using the data of the dominant species of epiphytic algae as the response variable, the detrended correspondence analysis (DCA) analysis was performed first. The DCA analysis results showed that the largest length gradient in the ranking axis of the wet season was 1.48; the largest length gradient in the ranking axis of the dry season was 1.37. All are suitable for linear model redundancy analysis (RDA) to explain the driving effect of environmental factors on the periphytic algal biome.
The converted data of the epiphytic algal biome and environmental factors in the wet season were formed into a data matrix, and the RDA ranking analysis was carried out (Figure 6a). The adjusted variance explained 72.7%, and the eigenvalues of axis 1 and axis 2 were 0.571 and 0.233, which explained 60.39% and 24.67% of the cumulative percentage of the species–environment relationship variation, respectively. In addition, the species–environment correlation coefficients were 0.9991 and 0.9844, respectively. Among the environmental factors, COD, NO 3 -N, WT, and DOC had higher explanation rates for the distribution of periphytic algae communities. The interpretation rate of COD on community variation was 53.5% and reached a significant level (p = 0.004 < 0.05), which could be considered as the main environmental factor driving the distribution of attached algae in the wet season. NO 3 -N was positively correlated with the first sorting axis and negatively correlated with the second sorting axis, WT and DOC were positively correlated with axis two, and COD was negatively correlated with axis one and two. Most algae were distributed in the second and fourth quadrants. Among the dominant algae, Cyclotella, Melosira, Pediastrum, and Oocystis were positively correlated with DOC and WT. Among them, the genus Oocystis had the strongest correlation with DOC. Tetrastrum and Scenedesmus were positively correlated with COD and Scenedesmus had the strongest correlation with COD. The distribution of each sampling point was relatively dispersed. Among them, S1 was closely related to NO 3 -N; S4 was closely related to COD and S6 was closely related to DOC. The relationship between other sample points and environmental factors is not clear.
The RDA ranking analysis was carried out on the data of periphytic algal biomes and environmental factors during the dry season (Figure 6b), and the adjusted variance explained 75.2%. The eigenvalues for Axis 1 (0.469) and Axis 2 (0.302) were calculated, which explained 49.37% and 31.77% of the cumulative percentage of the species–environment relationship variation, respectively. The species–environmental correlation coefficients were 0.9948 and 0.9946, respectively. The correlation coefficients between species–environments were relatively high, indicating that there was a close relationship between the composition of periphytic algae species and environmental factors in the Taiyuan urban section of the Fenhe River. TN, SPC, TP, and PO 4 3 -P had a higher explanation rate for the distribution of the attached algal community. TN had the greatest impact on the attached algae and explained 39.3% of the community variation (p = 0.048 < 0.05). It could be considered as the main environmental factor driving the changes in the distribution of the periphytic algae biological community in winter. PO 4 3 -P was positively correlated with the second ordination axis. TN, SPC, and TP were negatively correlated with axis one and axis two. Cyclotella, Gomphonema, Synedra, and Oscillatoria were positively correlated with PO 4 3 -P, among which Oscillatoria had the strongest correlation. Navicula, Nitzschia, Cyclotella, and Planktothrix were positively correlated with TN, SPC, and TP. Nitzschia had the strongest correlation with TN. Cyclotella was most closely related to TP. The distribution of each sampling point was also scattered. S1 was distributed in the second quadrant and closely related to PO 4 3 -P; S2 and S3 were distributed in the third quadrant and were closely related to TN, SPC, and TP; S5 and S6 were distributed in the first quadrant, S4 was distributed in the fourth quadrant, and the relationship with environmental factors was not clear.

4. Discussion

The river is an important part of the ecosystem. However, river ecosystems are increasingly affected by environmental pressures, with urbanization and industrialization leading to increased river pollution [20]. Algae are an important part of maintaining the health of aquatic ecosystems. Epiphytic algae widely exist in various water bodies and play an inestimable role in regulating the concentration of nutrients and maintaining the ecological balance of a water body [2]. In this study, the species of attached algae in the Taiyuan urban section of Fenhe River were mainly composed of diatoms. Many studies have shown that the composition and structure of epiphytic algae communities are affected by various environmental variables [21]. We found that COD and TN were the key environmental factors affecting the distribution of attached algae community.

4.1. Structural Characteristics of Periphytic Algae Community

In this study, a total of 54 genera of periphytic algae were identified in the wet season and dry season of the Taiyuan urban section of the Fenhe River. The species composition is dominated by diatoms, cyanobacteria, and green algae. There are many kinds of diatoms, and their reproductive ability and adaptability to the environment are strong [22]. Compared with the dry season, the proportion of diatoms decreased and the proportion of green algae increased during the wet season. The possible reason for this is that diatoms and Chrysophyta are suitable for growth and development in cold water, green algae are suitable for moderate water temperature, and cyanobacteria are suitable for growth in warm water [1]. As the temperature increases, high temperature will damage algae cells for living in cold water, while cyanobacteria and green algae can grow and reproduce normally [23]. The total cell density of the attached algae was 252.16 × 10⁶ cells/L in summer and 249.64 × 10⁶ cells/L in winter. In the wet season, the abundance of epiphytes at each sampling point is S4 > S3 > S6 > S5 > S1 > S2, while the abundance sequence of S5 > S4 > S6 > S1 > S3 > S2 occurs in the dry season. The abundance of each sampling point is not consistent, which may be related to the environmental physical and chemical factors. Different water environments will also have a certain impact on the growth and development of epiphytic algae [24]. For example, nutrients have a certain effect on the growth of algae. It has been found that the growth of algae will be inhibited when the total nitrogen concentration is too high or the nutrient concentration is too low [25]. The pH and salinity [26] in the water also have certain effects on the growth and development of epiphytic algae.

4.2. Biodiversity Index of Periphytic Algae and Water Quality Evaluation

In the water quality evaluation system, the biodiversity index is an important parameter to indicate and evaluate the health and nutritional status of water bodies [27]. Generally speaking, the three indices can confirm each other in response to water quality, but in our study, the river water quality indicated by the three indices is different. This may be due to the discovery of Chrysophyta in the dry season, which grows in water with high transparency, low temperature, and low organic matter content, and is sensitive to temperature changes [28]. Physical and chemical parameters have a significant impact on water quality and determine the water ecology of rivers. From the survey data, it is found that the average values of TN and TP in winter are several times higher than those in summer, and higher nutrient levels are more likely to drive the mass reproduction of algae [29]. A low d index in summer means low community stability, and the problem of algae community structure has gradually become prominent [30]. The reason why algal species richness is low during the wet season may be the effect of associated water properties, such as water flow rate and salinity, which are detrimental to ecological habitats and thus have an impact on the algal community structure [31]. In some studies, there are also differences in the water quality of rivers indicated by the three biodiversity indices. For example, Jun et al. [32] found that the biodiversity index was low in the study on the structural characteristics of phytoplankton community, and it was not applicable to evaluate the water environment in the Lhasa River Basin by using the biodiversity index. When evaluating water quality according to the biodiversity index, the indicators used can only reflect one or several aspects of the water environment and water ecology, and there is no scientific and systematic classification and comprehensive analysis of many indicators such as algae community structure [33]. Therefore, the evaluation of Fenhe Taiyuan urban water also needs to be combined with other indicators for comprehensive evaluation.

4.3. The Relationship between Periphytic Algae and Environmental Factors

Changes in environmental factors have a direct or indirect impact on the growth of algae [34]. Algae communities in different habitats have different community characteristics [35]. For example, Medeiros et al. [36] found that under the combined action of physical and chemical factors and water flow, the spatial differences of algae were significant. Shevchenko et al. [37] found that the species composition of epiphytic algae changed due to different flow velocities, water level fluctuations, and wind-driven waves in different waters of reservoirs and rivers, and cell density and biomass were significantly different. In our study, environmental factors such as DO, PO 4 3 -P, COD, SD, WT, and TP were found to have an impact on the algae growth distribution of the Fenhe Taiyuan urban area, according to the correlation analysis between epiphytic algae and environmental factors (Figure 5). In the wet season, the density of algal cells was significantly correlated with DO. The change in dissolved oxygen content was closely related to the growth of algae [38]. In summer, with the increase in light, photosynthesis continues to increase. When the oxygen production rate of photosynthesis by algae exceeds the oxygen consumption rate of respiration, the generated oxygen is dissolved in water, resulting in the increase in DO in water. The temperature in summer is significantly higher than that in winter, and the concentration of dissolved oxygen in water is affected by temperature and has both a seasonal and a daily cycle. Cold water tends to accumulate dissolved oxygen more easily than warm water, i.e., when the water temperature is low, the dissolved oxygen concentration is often high. Therefore, when the water temperature is high in summer, the dissolved oxygen concentration is usually low [14]. In the dry season, there is a significant correlation between the density of algal cells and WT, and the suitable temperature for each species is different. The wider the suitable temperature range, the more likely the algae are to become dominant species. At the same time, the competition of rapidly growing algae for nitrate nitrogen is enhanced [39]. The growth of algae is affected by a variety of environmental factors, and environmental factors are also affected by time and space changes, so water quality and algae show different structural characteristics with time and space changes. Rhomad et al. [40] showed that nitrate nitrogen is one of the key factors controlling the distribution of algae. Chou et al. [41] believed that phosphorus had an important effect on algal biomass. With the increase in phosphorus load, algal biomass would increase significantly in summer.
In our study, it can be seen from the redundant analysis that COD (wet season) and TN (dry season) had the greatest impact on the attached algae. COD in summer (28.31 mg/L) was significantly higher than that in winter (17.86 mg/L). TN in winter (2.53 mg/L) was significantly higher than that in summer (0.57 mg/L). Chemical oxygen demand represents the content of organic matter in water, and the higher the value is, the more seriously the organic pollution in water and the algae community will be affected [42]. The COD of water species is large, indicating that there are more reducing substances, organic matter, and microorganisms in water, and the DO will thus be very low, which is consistent with the measured DO value. On the one hand, high temperatures in summer can promote the growth of algae, which weaken the self-purification capacity of water and cause water pollution to varying degrees [43]. On the other hand, there is a lot of rainfall in the wet season, and nitrogen and phosphorus are released from the sediments due to the water disturbance [44]. It was possible that some species could adapt to living conditions in sewage and accumulate in large quantities, leading to a decline in algal density [45]. Our result is similar to related research results. For example, Yu et al. [46] through redundancy analysis showed that time was the main factor to promote the succession of the algae community structure. DO, NH 4 + -N, TN, TP, BOD, and COD are also important environmental variables affecting the community structure of algae. Yang et al.’s [47] research and analysis showed that total dissolved solids, permanganate index, TN, and TP were the environmental factors driving the epiphytic algal community structure in Taizi River Basin. In our study, it was found that the environmental factors affecting the structure of the epiphytic algal community were different in the wet season and the dry season. The possible reason is that the different sampling seasons and times will change the environmental factors that form the spatial pattern of the algal community structure in the river [48]. Some environmental factors are limiting factors in a certain period, but their limiting factors also change with the changes in seasons and time [49].

5. Conclusions

The analysis of the physical and chemical properties of water and the quantitative analysis of the algae diversity of six monitoring stations in the Taiyuan urban section of Fenhe River showed that seasonal changes can affect the aquatic ecosystem. A total of 54 genera of attached algae were identified, and the main species were diatoms, cyanobacteria, and green algae. The species and total cell density of attached algae were different in each sampling point. In summer (wet season), the abundance of epiphytes at each sampling point was S4 > S3 > S6 > S5 > S1 > S2, while the abundance of S5 > S4 > S6 > S1 > S3 > S2 occurred in winter (dry season). According to the analysis of the biodiversity index, the water body is in a state of moderate pollution, but further comprehensive evaluation needs to be carried out in combination with other indicators. Correlation analysis showed that attached algae were closely related to environmental factors. The explanation rates of COD (wet season) and TN (dry season) on the distribution of the attached algae community reached the significant indigenous level, which was the main environmental factor driving the distribution change in the periphytic algae community.

Author Contributions

Funding acquisition, S.X. and J.F.; methodology, J.Y., K.Z. and J.L.; visualization, Q.L. and X.L.; writing–original draft, K.Z. and J.Y. All authors have read and agreed to the published version of the manuscript.

Funding

This study is funded by the National Nature Science Foundation of China (No. 31770223) and the Excellent Achievement Cultivation Project of Higher education in Shanxi (No. 2020KJ029).

Institutional Review Board Statement

Not applicable.

Informed Consent Statement

Not applicable.

Data Availability Statement

Not applicable.

Acknowledgments

The first author thanks Wei Wang, Enhui Liu, and Shihua Feng for physical assistance in the process of collecting samples.

Conflicts of Interest

The authors declare no conflict of interest.

References

  1. Nalley, J.O.; O’Donnell, D.R.; Litchman, E. Temperature effects on growth rates and fatty acid content in freshwater algae and cyanobacteria. Algal Res. 2018, 35, 500–507. [Google Scholar] [CrossRef]
  2. Song, Y.Z.; Zhang, Y.D.; Deng, J.W. Periphytic algae ecology in freshwater lake: A review. Chin. J. Ecol. 2016, 35, 534–541. [Google Scholar]
  3. DeNicola, D.M.; Kelly, M. Role of periphyton in ecological assessment of lakes. Freshw. Sci. 2014, 33, 619–638. [Google Scholar] [CrossRef]
  4. Yang, S.; Bertuzzo, E.; Büttner, O.; Borchardt, D.; Rao, P.S.C. Emergent spatial patterns of competing benthic and pelagic algae in a river network: A parsimonious basin-scale modeling analysis. Water Res. 2021, 193, 116887. [Google Scholar] [CrossRef] [PubMed]
  5. Jäger, C.G.; Borchardt, D. Longitudinal patterns and response lengths of algae in riverine ecosystems: A model analysis emphasising benthic-pelagic interactions. J. Theor. Biol. 2018, 442, 66–78. [Google Scholar] [CrossRef]
  6. Dunck, B.; Felisberto, S.A.; Nogueira, I.S. Effects of freshwater eutrophication on species and functional beta diversity of periphytic algae. Hydrobiologia 2019, 837, 195–204. [Google Scholar] [CrossRef]
  7. Casartelli, M.R.; Ferragut, C. The efects of habitat complexity on periphyton biomass accumulation and taxonomic structure during colonization. Hydrobiologia 2018, 807, 233–246. [Google Scholar] [CrossRef]
  8. Liu, Y.; Fu, J.; Cheng, D.; Lin, Q.; Su, P.; Wang, X.; Sun, H. The spatial pattern of periphytic algae communities and its corresponding mechanism to environmental variables in the Weihe River Basin, China. Hydrol. Res. 2020, 51, 1036–1047. [Google Scholar] [CrossRef]
  9. Wang, J.; Shi, Y.; Liu, Q.; Li, Z.; Zhang, M.; Xie, S.L. Taxonomic and molecular phylogenetics of bloom-forming algae from the Taiyuan section of Fenhe River, China. J. Lake Sci. 2018, 30, 1332–1342. [Google Scholar]
  10. Wang, J.; Feng, J.; Xie, S.L.; Zhang, J.M.; Cheng, G.; Lian, Y.J. Phytoplankton diversity and off-flavor-producing Microcystis in the Taiyuan region of the Fenhe River. Acta Ecol. Sin. 2015, 35, 3357–3363. [Google Scholar]
  11. Liu, Y.Y.; Ayi, Q.L.; Zhang, S.R.; Wu, X.R.; Wan, B.N.; Zhang, X.P.; Zeng, B. Comparative study on the suitability of periphytic algae and phytoplankton in river health assessment. Acta Ecol. Sin. 2020, 40, 3833–3843. [Google Scholar]
  12. Gao, J.H.; Liu, Y.; Li, K.N.; Yuan, Y.; Li, Y.J.; Zhang, L. Dynamic changes in rotifer diversity and community structure in the Taiyuan section of Fenhe River. J. Hydroecol. 2021, 42, 77–84. [Google Scholar]
  13. Vlaičević, B.; Matoničkin Kepčija, R.; Gulin, V.; Turković Čakalić, I.; Kepec, M.; Čerba, D. Key drivers influencing the colonization of periphytic ciliates and their functional role in hydrologically dynamic floodplain lake ecosystem. Knowl. Manag. Aquat. Ecosyst. 2021, 422, 33. [Google Scholar] [CrossRef]
  14. Yang, J.; Wang, F.; Lv, J.; Liu, Q.; Nan, F.; Liu, X.; Xu, L.; Xie, S.; Feng, J. The spatiotemporal contribution of the phytoplankton community and environmental variables to the carbon sequestration potential in an urban river. Environ. Sci. Pollut. Res. Int. 2020, 27, 4814–4829. [Google Scholar] [CrossRef] [PubMed]
  15. Zhao, H.J.; Wang, Y.; Yang, L.L.; Yuan, L.W.; Peng, D.C. Relationship between phytoplankton and environmental factors in landscape water supplemented with reclaimed water. Ecol. Indic. 2015, 58, 113–121. [Google Scholar] [CrossRef]
  16. Hu, H.J.; Wei, Y.X. The Freshwater Algae of China: Systematics, Taxonomy and Ecology; Beijing Science Press: Beijing, China, 2006. [Google Scholar]
  17. Wang, X.; Zhang, F.; Kung, H.T.; Ghulam, A.; Trumbo, A.L.; Yang, J.; Ren, Y.; Jing, Y. Evaluation and estimation of surface water quality in an arid region based on EEM-PARAFAC and 3D fluorescence spectral index: A case study of the Ebinur Lake Watershed, China. Catena 2017, 155, 62–74. [Google Scholar] [CrossRef]
  18. Das, M.; Semy, K.; Kuotsu, K. Seasonal monitoring of algal diversity and spatiotemporal variation in water properties of Simsang river at South Garo Hills, Meghalaya, India. Sustain. Water Resour. Manag. 2022, 8, 16. [Google Scholar] [CrossRef]
  19. Zhang, Z.S.; Huang, X.F. Research Methods of Freshwater Plankton; Beijing Press: Beijing, China, 1991. [Google Scholar]
  20. Song, J.; Yang, X.; Zhang, J.; Long, Y.; Zhang, Y.; Zhang, T. Assessing the variability of heavy metal concentrations in liquid-solid two-phase and related environmental risks in the Weihe River of Shaanxi province, China. Int. J. Environ. Res. Public Health 2015, 12, 8243–8262. [Google Scholar] [CrossRef]
  21. Mirzahasanlou, J.P.; Ramezanpour, Z.; Nejadsattari, T.; Namin, J.I.; Asri, Y. Temporal and spatial distribution of diatom assemblages and their relationship with environmental factors in Balikhli River (NW Iran). Ecohydrol. Hydrobiol. 2020, 20, 102–111. [Google Scholar] [CrossRef]
  22. Stevenson, J.; Graham, L. Ecological assessments with algae: A review and synthesis. J. Phycol. 2014, 50, 437–461. [Google Scholar] [CrossRef]
  23. Huisman, J.; Codd, G.A.; Paerl, H.W.; Ibelings, B.W.; Verspagen, J.M.; Visser, P.M. Cyanobacterial blooms. Nat. Rev. Microbiol. 2018, 16, 471–483. [Google Scholar] [CrossRef] [PubMed]
  24. Osorio, N.C.; Cunha, E.R.; Tramonte, R.P.; Mormul, R.P.; Rodrigues, L. Habitat complexity drives the turnover and nestedness patterns in a periphytic algae community. Limnology 2019, 20, 297–307. [Google Scholar] [CrossRef]
  25. Blanco, S.; Olenici, A.; Ortega, F.; Jiménez-Gómez, F.; Guerrero, F. Identifying environmental drivers of benthic diatom diversity: The case of Mediterranean mountain ponds. PeerJ 2020, 8, e8825. [Google Scholar] [CrossRef] [PubMed] [Green Version]
  26. Gunde-Cimerman, N.; Plemenitaš, A.; Oren, A. Strategies of adaptation of microorganisms of the three domains of life to high salt concentrations. FEMS Microbiol. Rev. 2018, 42, 353–375. [Google Scholar] [CrossRef]
  27. Jiao, J.D.; Deng, J.F.; Li, F.K.; Sun, L.P. Analysis for growth characteristics and phosphorus nutrient dynamics of alage in mesohalinous water. Environ. Pollut. Control. 2017, 39, 726–729. [Google Scholar]
  28. Korneva, L.G.; Solovyeva, V.V. Golden algae (Chrysophyta) in plankton of the Volga River reservoirs: Taxonomic structure, dynamics of diversity, and abundance. Inland Water Biol. 2017, 10, 168–175. [Google Scholar] [CrossRef]
  29. Seeta, Y.; Reddy, M. Algal diversity and water quality in the rivers of Telangana. Int. J. Recent Sci. Res. 2020, 11, 37702–37704. [Google Scholar]
  30. Filstrup, C.T.; Hillebrand, H.; Heathcote, A.J.; Harpole, W.S.; Downing, J.A. Cyanobacteria dominance influences resource use efficiency and community turnover in phytoplankton and zooplankton communities. Ecol. Lett. 2014, 17, 464–474. [Google Scholar] [CrossRef]
  31. Ozer, T.; Erkaya, I.A.; Solak, C.N.; Udoh, A.U. Diversity and ecology of algae from Melen River (western black sea river catchment) in Turkey. Turk. J. Fish. Aquat. Sci. 2018, 18, 1187–1194. [Google Scholar] [CrossRef]
  32. Jun, S.; Wang, D.B.; Zhou, J.H.; Bai, X.; Bai, K. Community structures of phytoplankton and its relationship with environmental factors in the Lhasa River. Acta Ecol. Sin. 2019, 39, 787–798. [Google Scholar]
  33. Zhao, G.N.; Pan, B.Z.; Li, Y.; He, H.R.; Zhang, L. Research progress on phytoplankton and periphyton ecology of the waterbodies in the Loess Plateau. Sichuan Environ. 2021, 40, 235–240. [Google Scholar]
  34. Hao, B.; Wu, H.; Li, W.; Xing, W. Periphytic algae mediate interactions between neighbor and target submerged macrophytes along a nutrient gradient. Ecol. Indic. 2020, 110, 1–8. [Google Scholar] [CrossRef]
  35. Prieto-Barajas, C.M.; Valencia-Cantero, E.; Santoyo, G. Microbial mat ecosystems: Structure types, functional diversity, and biotechnological application. Electron. J. Biotechnol. 2018, 31, 48–56. [Google Scholar] [CrossRef]
  36. Medeiros, G.; Padial, A.A.; Amaral, M.W.W.; Ludwig, T.A.V.; Bueno, N.C. Environmental variables likely influence the periphytic diatom community in a subtropical lotic environment. Limnologica 2020, 80, 125718. [Google Scholar] [CrossRef]
  37. Shevchenko, T.F.; Klochenko, P.D.; Timchenko, V.M.; Dubnyak, S.S. Epiphyton of a cascade plain reservoir under different hydrodynamic conditions. Ecohydrol. Hydrobiol. 2019, 19, 407–416. [Google Scholar] [CrossRef]
  38. Wang, Q.; Li, X.; Yan, T.; Song, J.; Yu, R.; Zhou, M. Laboratory simulation of dissolved oxygen reduction and ammonia nitrogen generation in the decay stage of harmful algae bloom. J. Oceanol. Limnol. 2021, 39, 500–507. [Google Scholar] [CrossRef]
  39. Baragi, L.V.; Khandeparker, L.; Anil, A.C. Influence of elevated temperature and pCO2 on the marine periphytic diatom Navicula distans and its associated organisms in culture. Hydrobiologia 2015, 762, 127–142. [Google Scholar] [CrossRef]
  40. Rhomad, H.; Khalil, K.; Neves, R.; Bougadir, B.; Elkalay, K. Modeling investigation of the nutrients and phytoplankton dynamics in the Moroccan Atlantic coast: A case study of Agadir coast. Ecol. Model. 2021, 447, 109510. [Google Scholar] [CrossRef]
  41. Chou, Q.; Nielsen, A.; Andersen, T.K.; Hu, F.; Chen, W.; Zhang, X.; Cao, T.; Ni, L.; Jeppesen, E.; Trolle, D. Assessing impacts of changes in external nutrient loadings on a temperate Chinese drinking water reservoir. Front. Environ. Sci. 2021, 2, 9–23. [Google Scholar] [CrossRef]
  42. Du, Y.N. The Effect of Dissolved Organic Matter and Aquatic Plant Humidification on Chemical Oxygen Demand in Yilong Lake. Master’s Thesis, Kunming University of Scince and Technology, Kunming, China, 2019. [Google Scholar]
  43. Shevchenko, T.F.; Klochenko, P.D.; Bilous, O.P. Response of epiphytic algae to heavy pollution of water bodies. Water Environ. Res. 2018, 90, 706–718. [Google Scholar] [CrossRef]
  44. Oliveira, L.F.V.; Margis, R. The source of the river as anursery for microbial diversity. PLoS ONE 2015, 10, e0120608. [Google Scholar]
  45. Wang, L.; Zhang, J.; Li, H.; Yang, H.; Peng, C.; Peng, Z.; Lu, L. Shift in the microbial community composition of surface water and sediment along an urban river. Sci. Total Environ. 2018, 627, 600–612. [Google Scholar] [CrossRef] [PubMed]
  46. Yu, Z.L.; Chen, W.; Zhao, R.; Li, Z.Y.; Dong, Y.L.; Zhang, R.; Wang, Y.Y.; Jin, X.W. Periphytic algae community structure and its relation to environment factors in the main stream of the Songhua River from 2014 to 2019. Huan Jing Ke Xue 2021, 42, 819–830. [Google Scholar] [PubMed]
  47. Yang, L.; Li, J.X.; Qian, T.Y.; Yin, X.W.; Ruan, Y.J. Quantitative analysis of nitrogen and phosphorus nutrients for periphyton population in Taizi River. Asian J. Ecotoxicol. 2019, 14, 104–117. [Google Scholar]
  48. Wang, Z.; Wang, W.K.; Zhang, Z.Y.; Hou, X.; Ma, Z.; Chen, B. River-groundwater interaction affected species composition and diversity perpendicular to a regulated river in an arid riparian zone. Glob. Ecol. Conserv. 2021, 27, e01595. [Google Scholar] [CrossRef]
  49. Cui, L.; Lu, X.; Dong, Y.; Cen, J.; Cao, R.; Pan, L.; Lu, S.; Ou, L. Relationship between phytoplankton community succession and environmental parameters in Qinhuangdao coastal areas, China: A region with recurrent brown tide outbreaks. Ecotoxicol. Environ. Saf. 2018, 159, 85–93. [Google Scholar] [CrossRef]
Figure 1. Distribution of sampling points in Taiyuan urban section of Fenhe River.
Water 14 02151 g001
Figure 2. Community structure of periphytic algae during the wet season (a) and dry season (b).
Water 14 02151 g002
Figure 3. Changes in abundance of periphytic algae at each sampling point during the wet (a) and dry (b) seasons.
Water 14 02151 g003
Figure 4. Biodiversity index of periphytic algae. Shannon–Wiener diversity index (a), Pielou evenness index (b), Margalef richness index (c).
Water 14 02151 g004
Figure 5. Correlation heat map of periphytic algae and environmental factors in summer (a) and winter (b).
Water 14 02151 g005
Figure 6. RDA analysis of periphytic algae and environmental factors in summer (a) and winter (b).
Water 14 02151 g006
Table 1. Monthly values (mean ± SD, N = 6) of water parameters at six sampling sites in the Taiyuan urban section of the Fenhe River.
FactorsS1S2S3S4S5S6
SummerWinterSummerWinterSummerWinterSummerWinterSummerWinterSummerWinter
WT (°C)25.05 ± 0.554.50 ± 1.8027.10 ± 1.004.05 ± 1.2527.15 ± 0.855.05 ± 1.8528.15 ± 0.154.15 ± 1.1527.75 ± 0.155.45 ± 2.4528.05 ± 0.056.10 ± 2.30
pH8.61 ± 0.328.31 ± 0.698.69 ± 0.348.02 ± 0.389.11 ± 0.057.91 ± 0.428.81 ± 0.367.87 ± 0.309.12 ± 0.067.87 ± 0.428.76 ± 0.307.27 ± 0.04
SPC (us/cm)869.50 ± 17.501036.05 ± 316.95855.00 ± 19.00990.65 ± 340.35848.00 ± 39.00795.90 ± 227.10809.50 ± 38.50653.90 ± 142.70797.00 ± 11.00538.50 ± 36.10860.00 ± 14.00661.35 ± 1.05
SAL (ppt)0.43 ± 0.010.51 ± 0.1600.42 ± 0.010.49 ± 0.170.41 ± 0.020.39 ± 0.110.40 ± 0.020.32 ± 0.070.38 ± 0.020.26 ± 0.020.42 ± 0.010.32 ± 0.01
DO (mg/L)7.75 ± 0.7715.40 ± 0.628.71 ± 3.1417.70 ± 2.778.97 ± 3.3318.71 ± 4.948.84 ± 3.5219.93 ± 2.039.30 ± 1.4717.54 ± 1.999.43 ± 3.7913.01 ± 0.20
TDS (mg/L)565.55 ± 12.95675.68 ± 208.33605.75 ± 40.25643.83 ± 220.68552.50 ± 26.00516.43 ± 146.58529.75 ± 22.75425.10 ± 92.95520.00 ± 6.50350.35 ± 23.40559.01 ± 6.45429.65 ± 0.65
SD (cm)0.60 ± 0.100.76 ± 0.140.46 ± 0.080.68 ± 0.160.55 ± 0.200.63 ± 0.030.48 ± 0.060.95 ± 0.150.50 ± 0.020.94 ± 0.220.51 ± 0.010.95 ± 0.15
TN (mg/L)0.53 ± 0.063.67 ± 2.440.59 ± 0.183.16 ± 2.140.53 ± 0.112.98 ± 2.390.51 ± 0.051.94 ± 1.160.49 ± 0.051.83 ± 0.940.78 ± 0.041.61 ± 0.72
NH 4 + (mg/L)0.31 ± 0.051.14 ± 0.050.32 ± 0.060.94 ± 0.240.30 ± 0.020.38 ± 0.320.38 ± 0.070.30 ± 0.260.34 ± 0.030.09 ± 0.010.50 ± 0.250.04 ± 0.01
NO 3 (mg/L)0.17 ± 0.010.16 ± 0.020.11 ± 0.050.15 ± 0.030.09 ± 0.020.13 ± 0.030.07 ± 0.010.12 ± 0.020.06 ± 0.010.10 ± 0.010.06 ± 0.010.13 ± 0.01
TP (mg/L)0.04 ± 0.010.10 ± 0.030.07 ± 0.030.13 ± 0.060.06 ± 0.030.12 ± 0.010.07 ± 0.030.10 ± 0.010.09 ± 0.020.08 ± 0.010.15 ± 0.090.08 ± 0.01
PO 4 3 (mg/L)0.02 ± 0.010.01 ± 0.010.05 ± 0.040.01 ± 0.010.05 ± 0.040.01 ± 0.010.06 ± 0.040.01 ± 0.000.05 ± 0.030.01 ± 0.010.04 ± 0.020.01 ± 0.00
COD (mg/L)21.67 ± 13.2014.67 ± 5.6721.17 ± 5.7415.67 ± 7.6734.33 ± 12.4722.17 ± 5.5037.00 ± 4.2916.00 ± 7.0026.83 ± 19.2821.67 ± 6.6728.83 ± 20.0417.00 ± 6.33
DOC (mg/L)6.08 ± 0.155.93 ± 0.375.69 ± 0.186.28 ± 0.565.72 ± 0.075.70 ± 0.026.08 ± 0.555.70 ± 0.126.08 ± 0.235.70 ± 0.086.13 ± 0.405.64 ± 0.15
Table 2. Species and numbers of periphytic algal communities in the RDA ranking map.
NumberDominant SpeciesNumberDominant Species
Sp1CyclotellaSp10Fragilaria
Sp2GomphonemaSp11Scenedesmus
Sp3MelosiraSp12Pediastrum
Sp4NaviculaSp13Tetrastrum
Sp5NitzschiaSp14Oocystis
Sp6SynedraSp15Ulothrix
Sp7PinnulariaSp16Cryptomonas
Sp8OscillatoriaSp17Merismopedia
Sp9PlanktothrixSp18Oedogonium
Publisher’s Note: MDPI stays neutral with regard to jurisdictional claims in published maps and institutional affiliations.

