
Nitrogen and Phosphorous Retention in Tropical Eutrophic Reservoirs with Water Level Fluctuations: A Case Study Using Mass Balances on a Long-Term Series

 , , ,
, , ,  , ,
, ,
Abstract
:1. Introduction
2. Materials and Methods
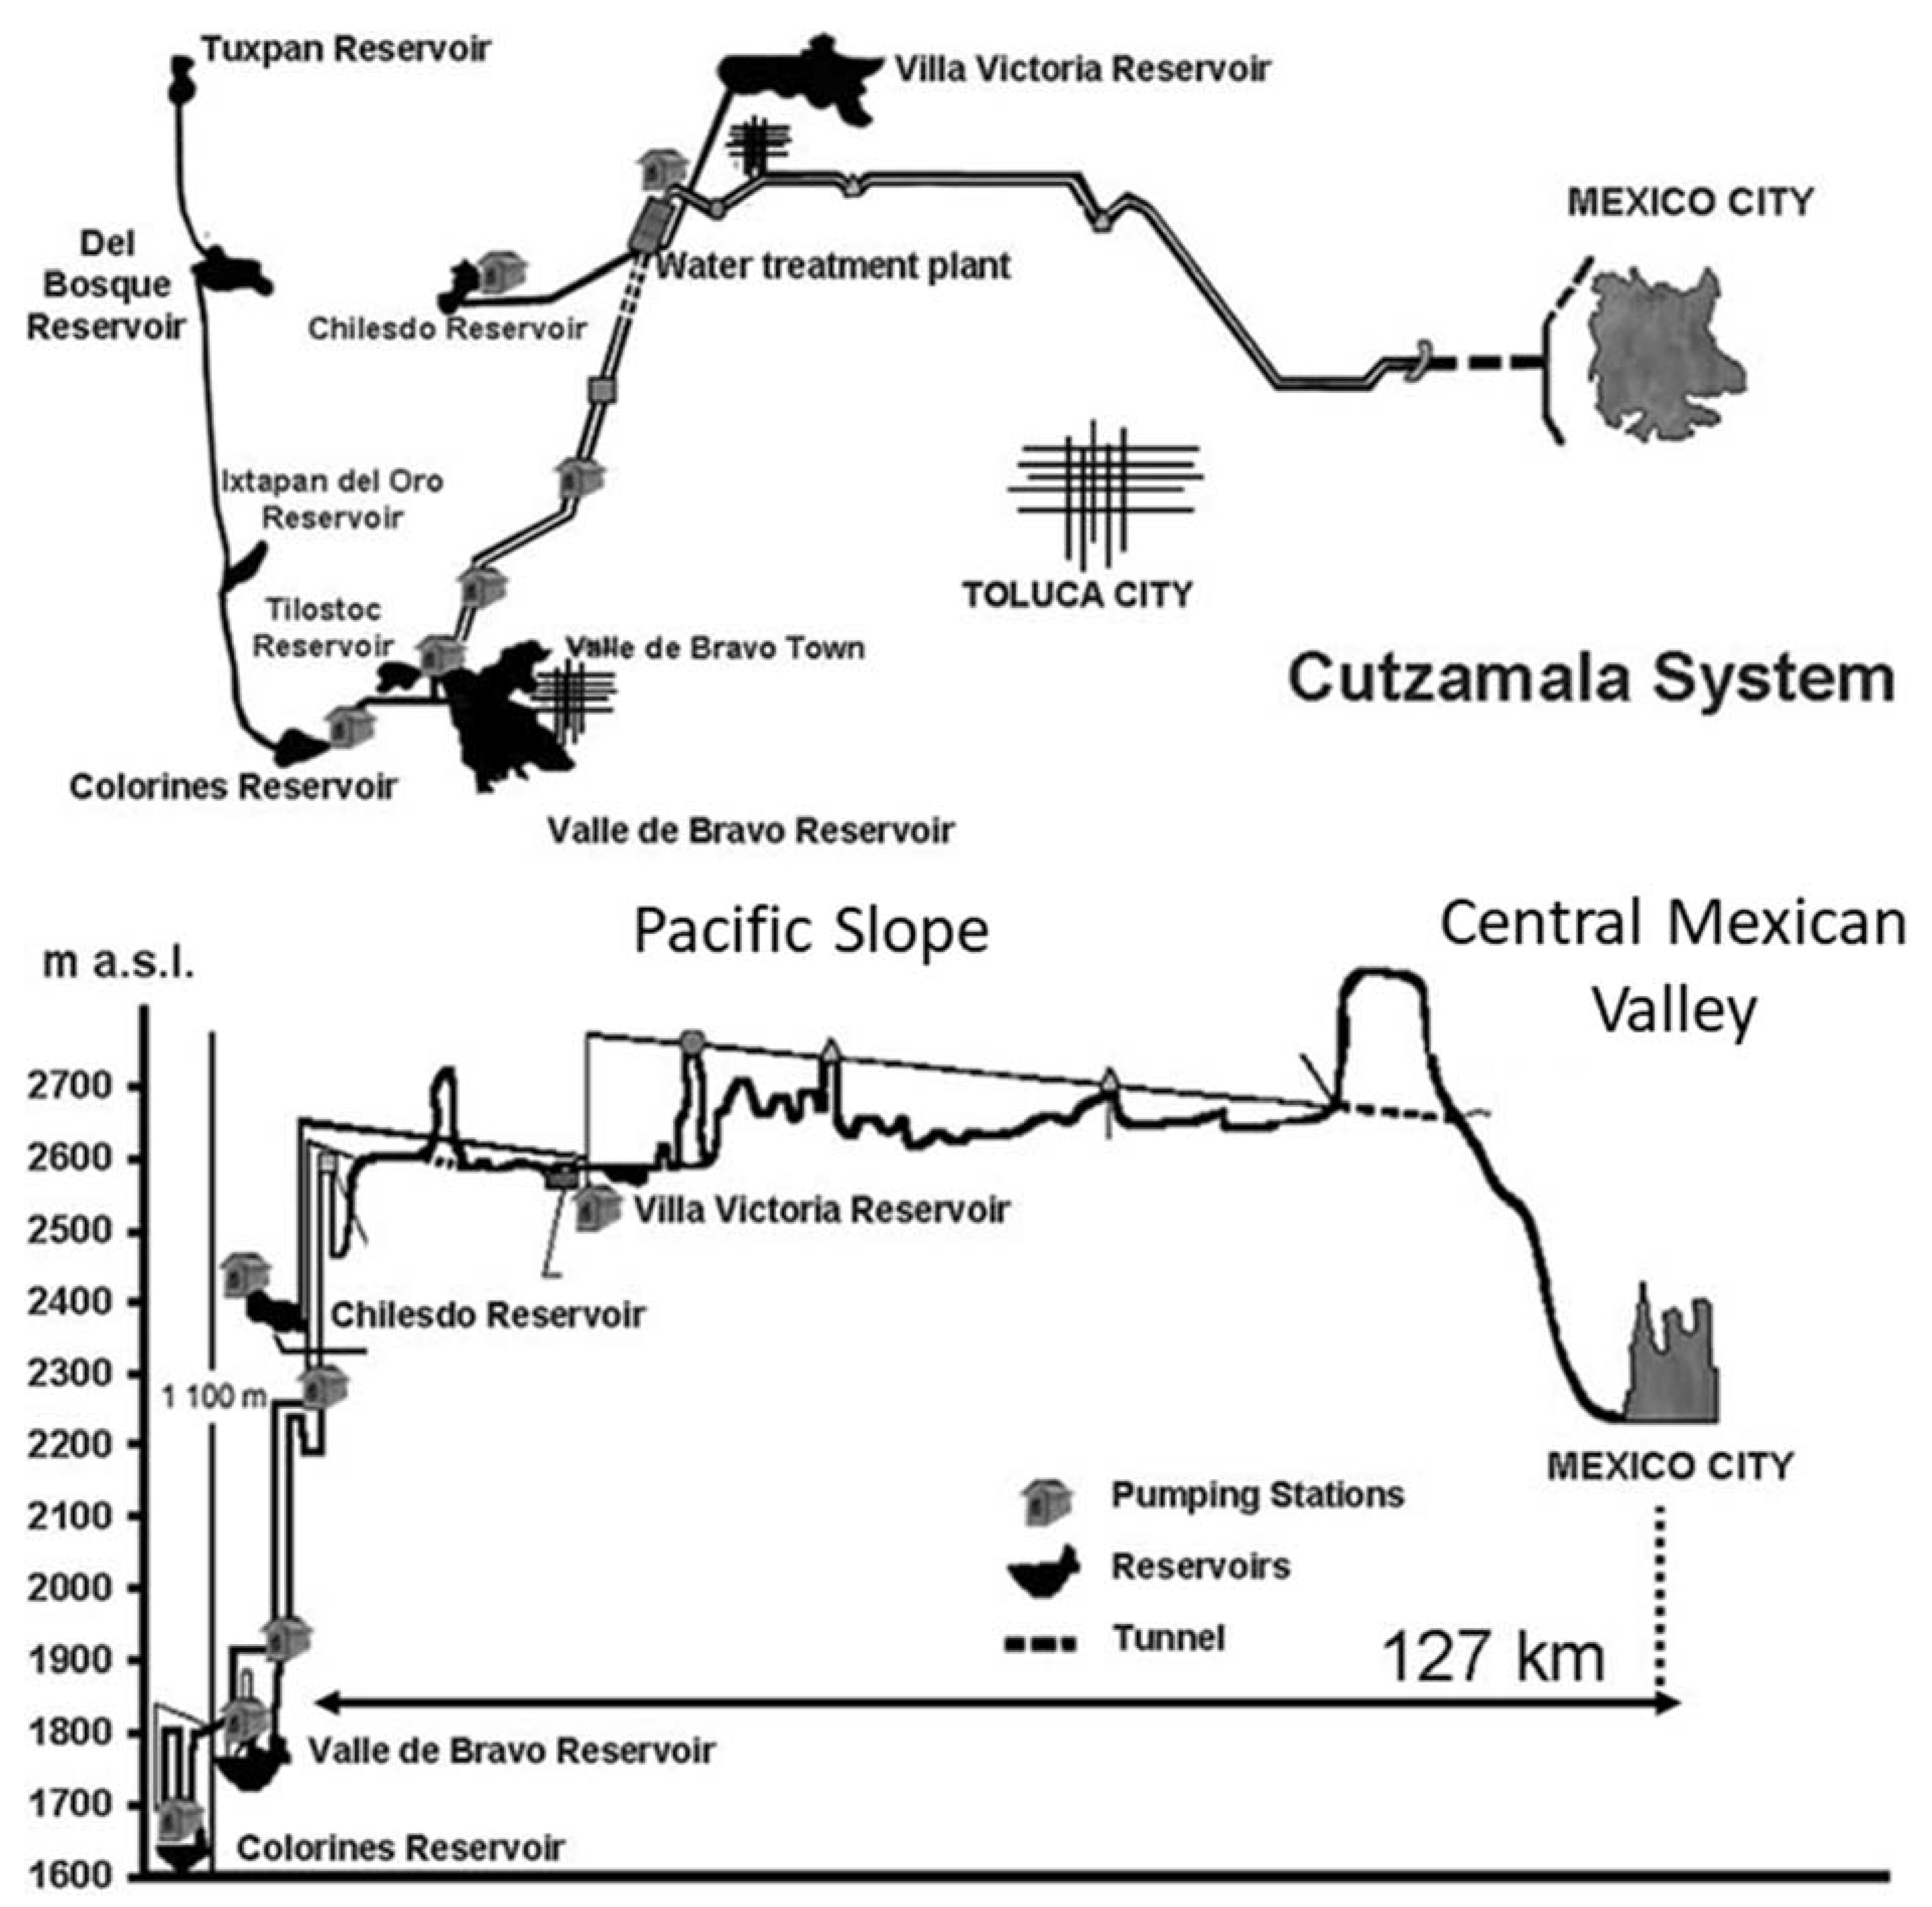
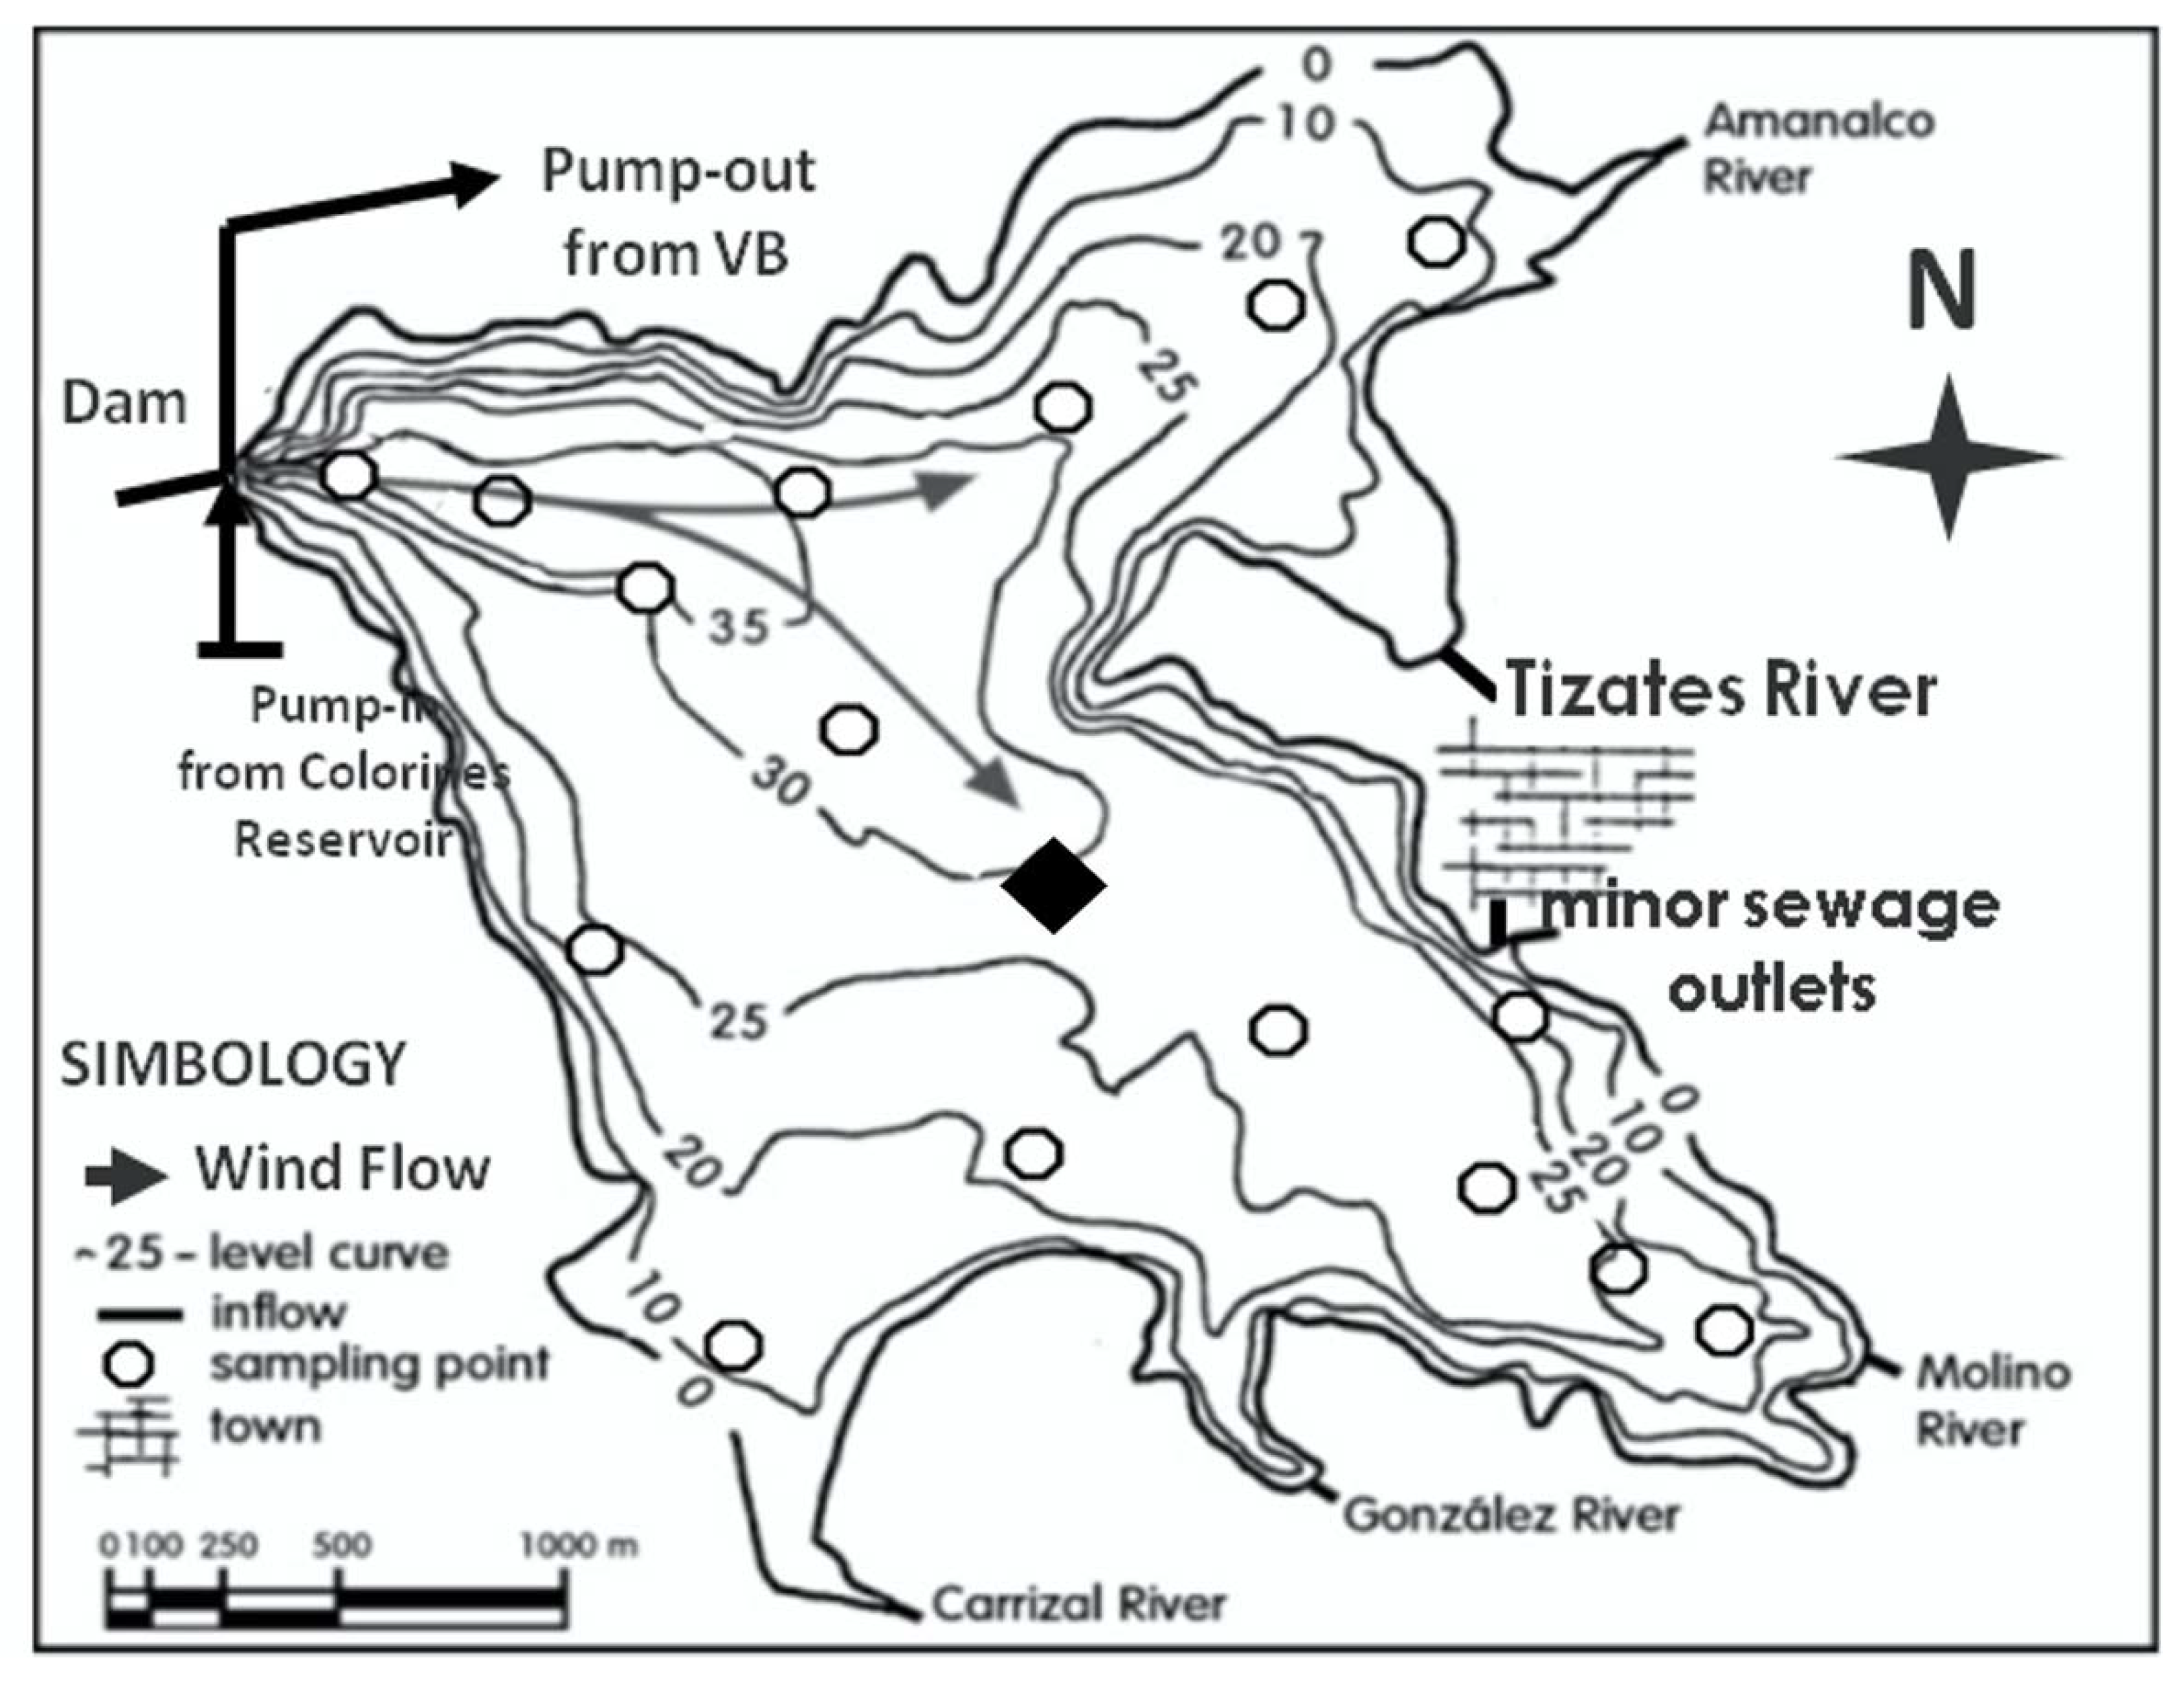
2.1. Study Area: Valle de Bravo
2.2. Samples and Data
2.3. Nutrient Analysis
2.4. Mass Balance Approach
2.5. Estimation of N and P Net Internal Fluxes
2.6. Data Statistical Analysis and Data Visualization
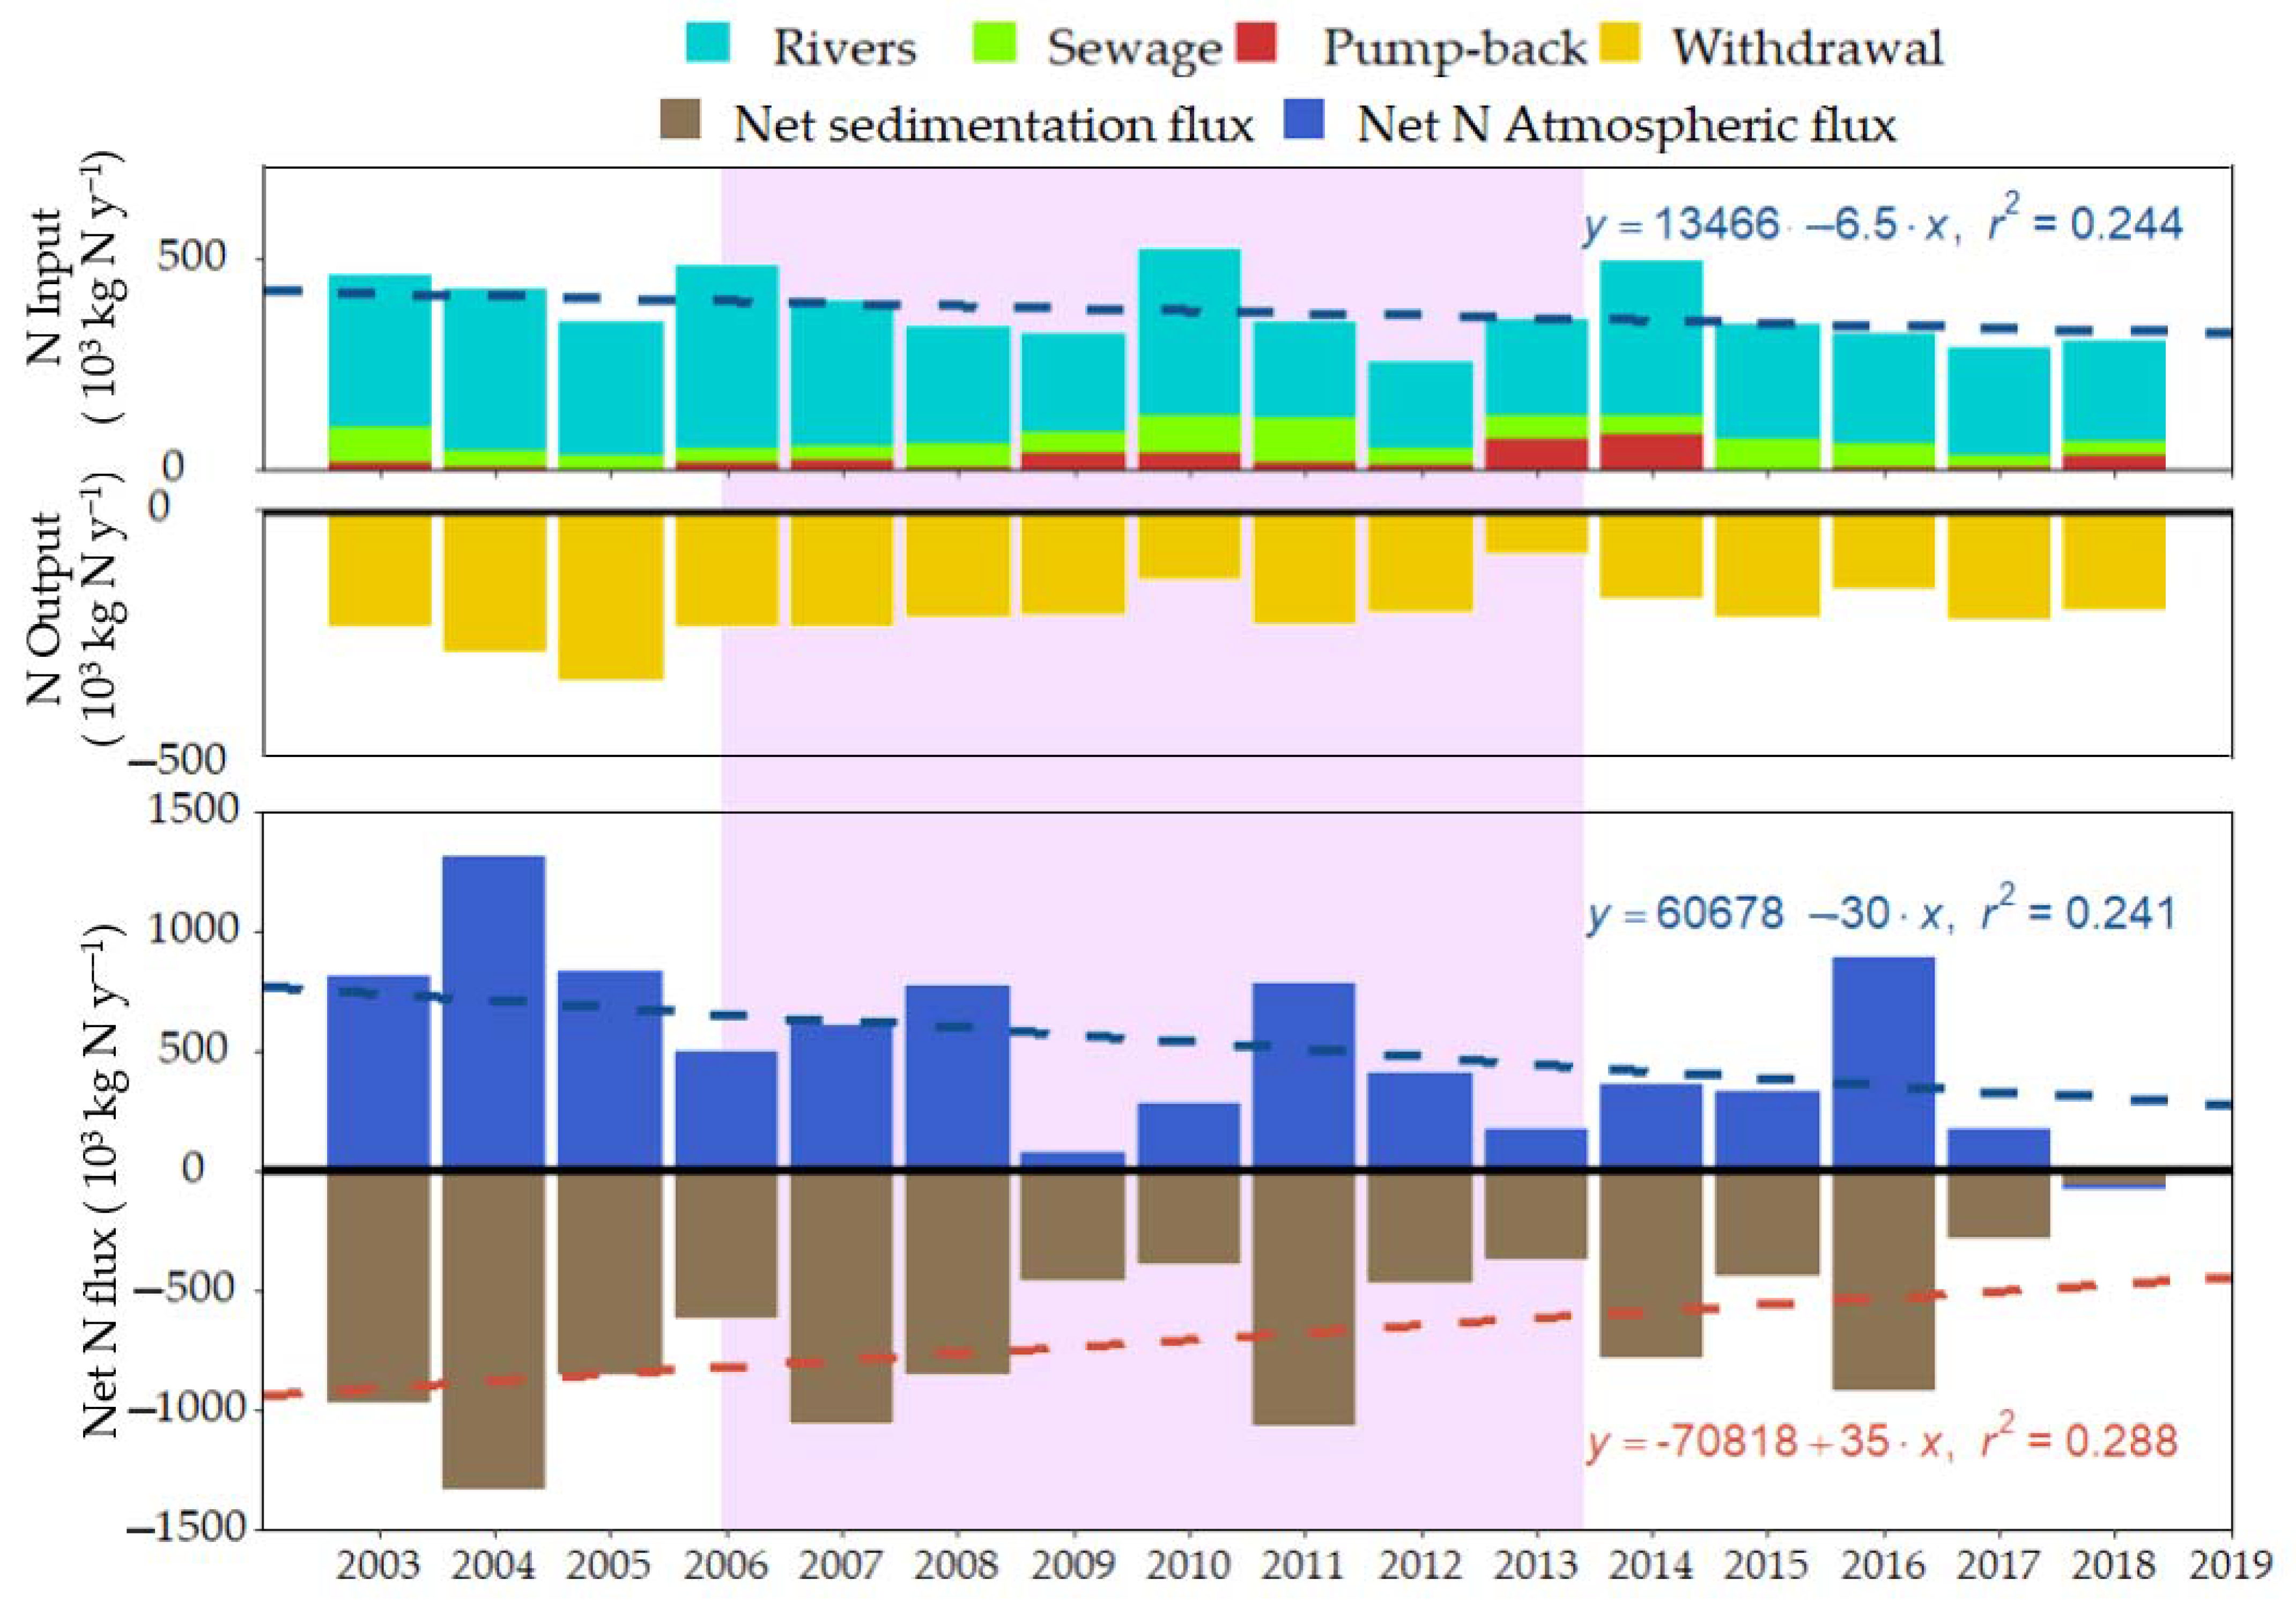
3. Results
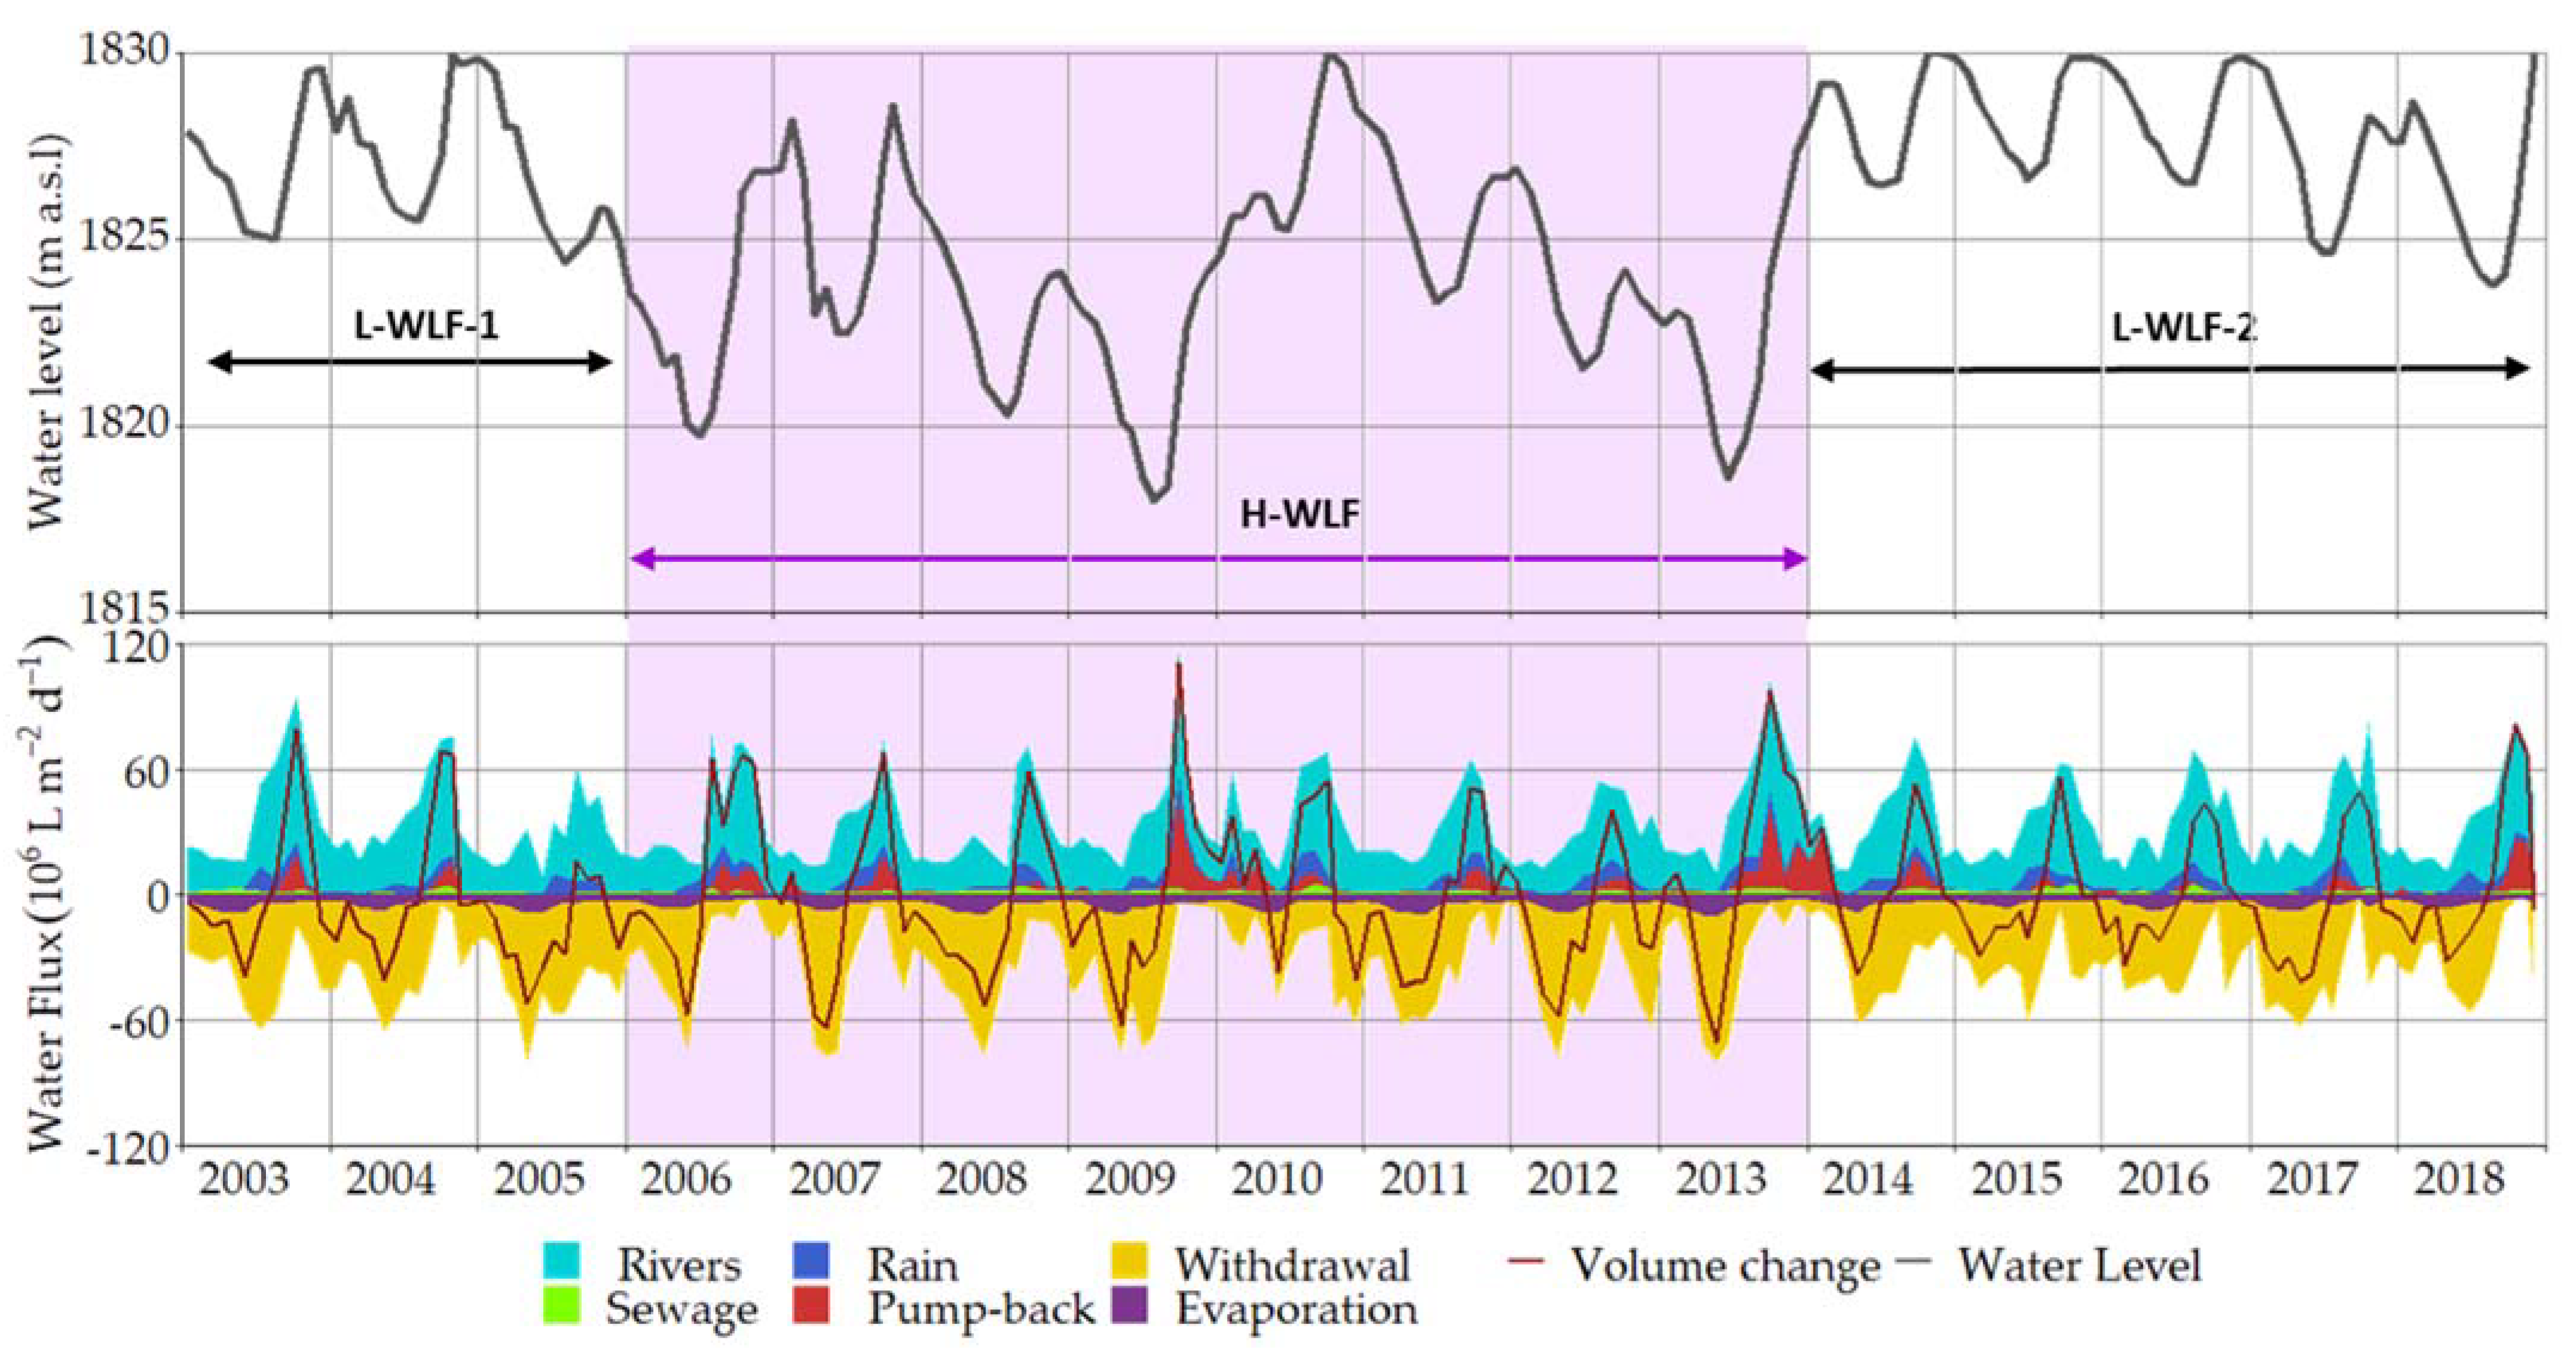
3.1. Water Budget
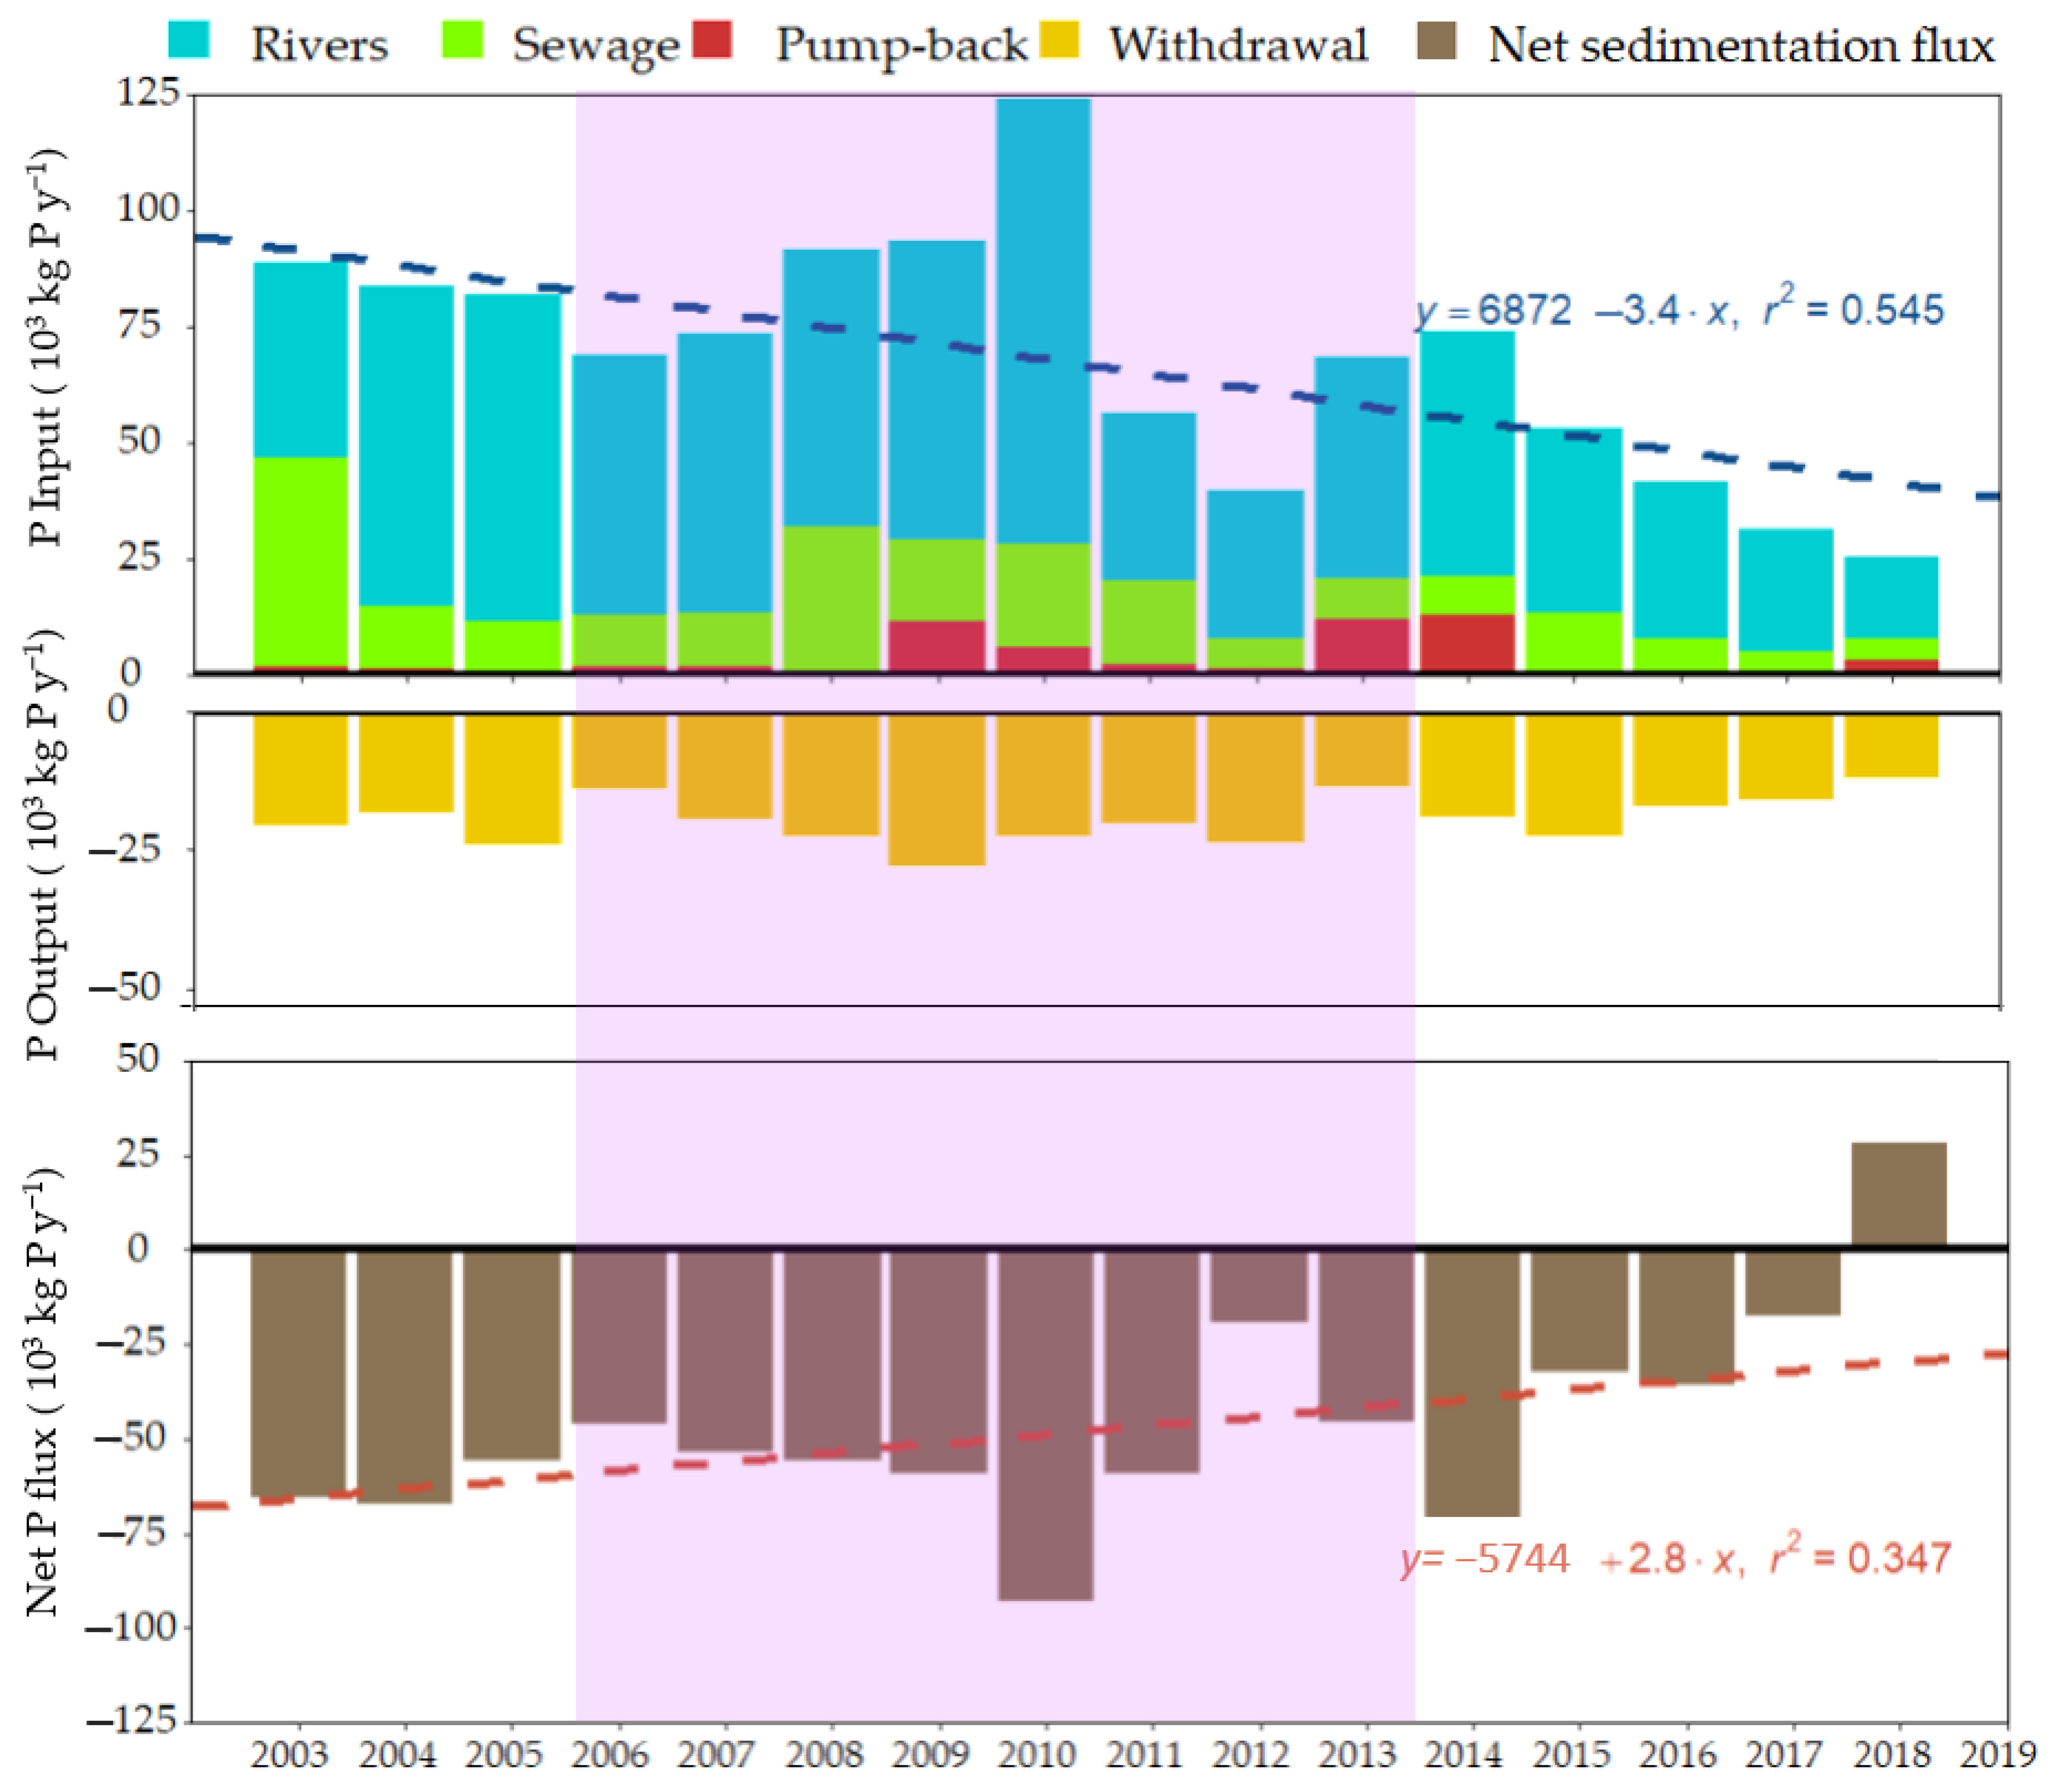
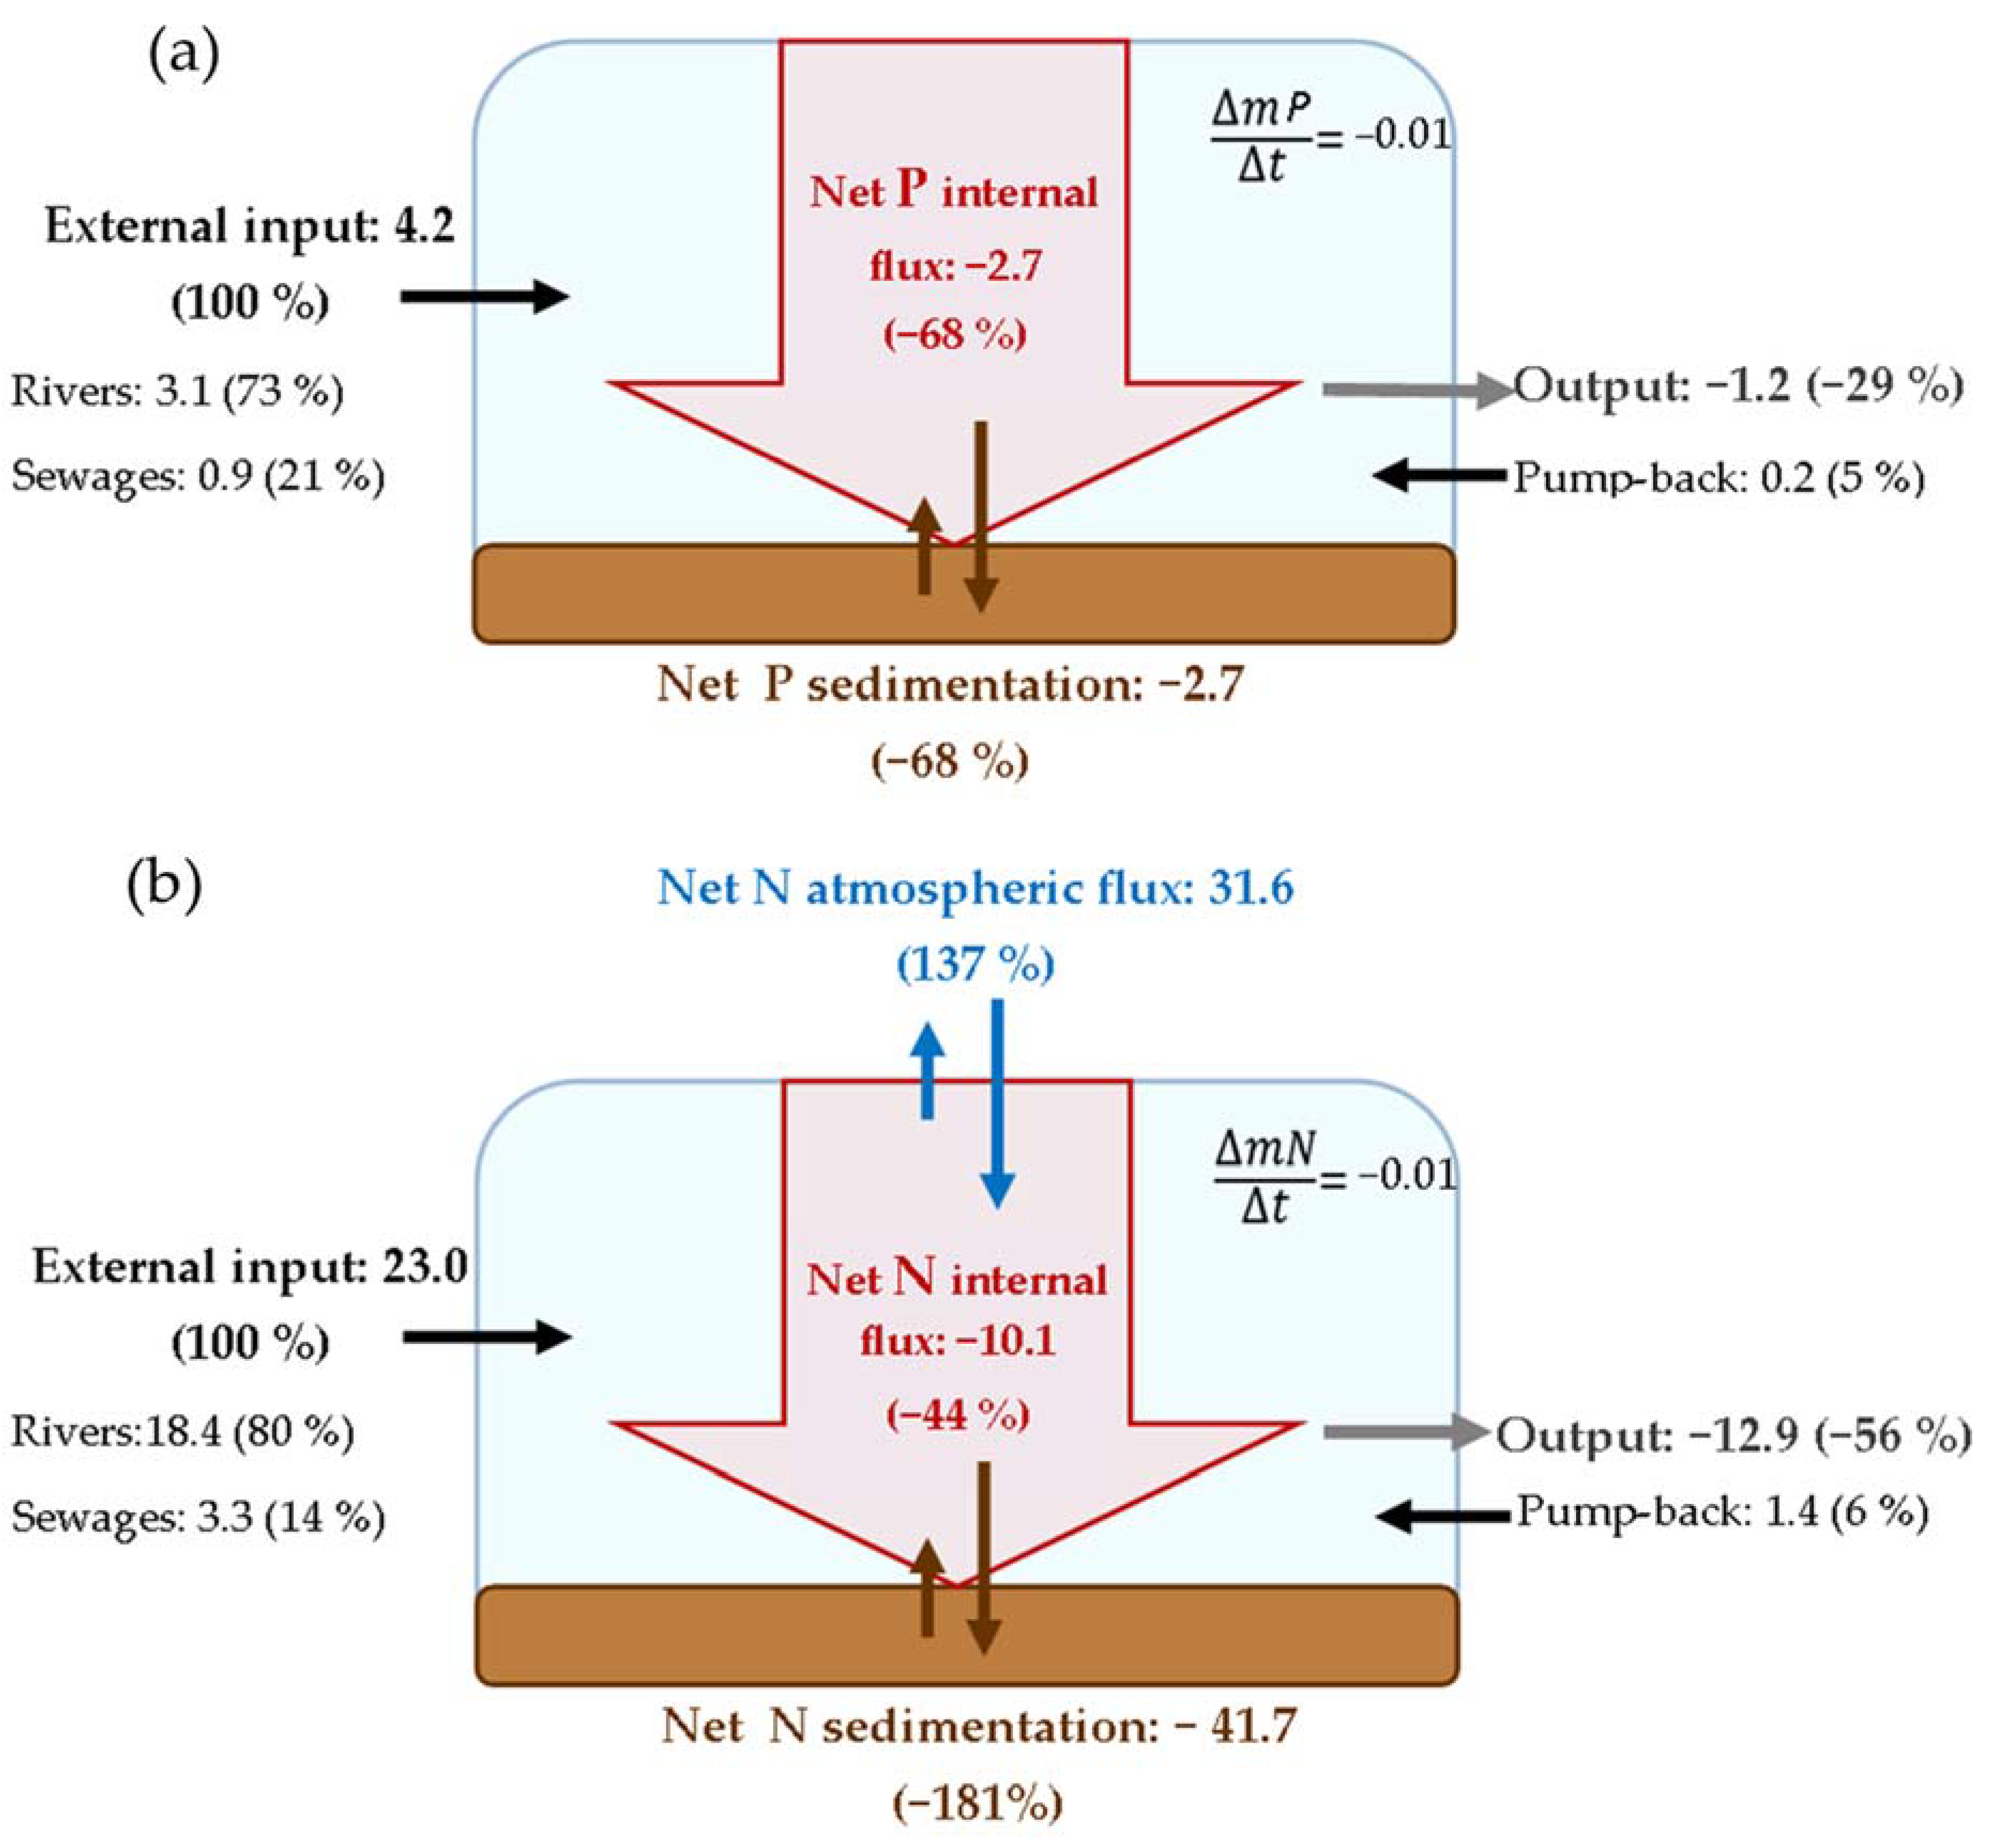
3.2. N and P Mass Budgets
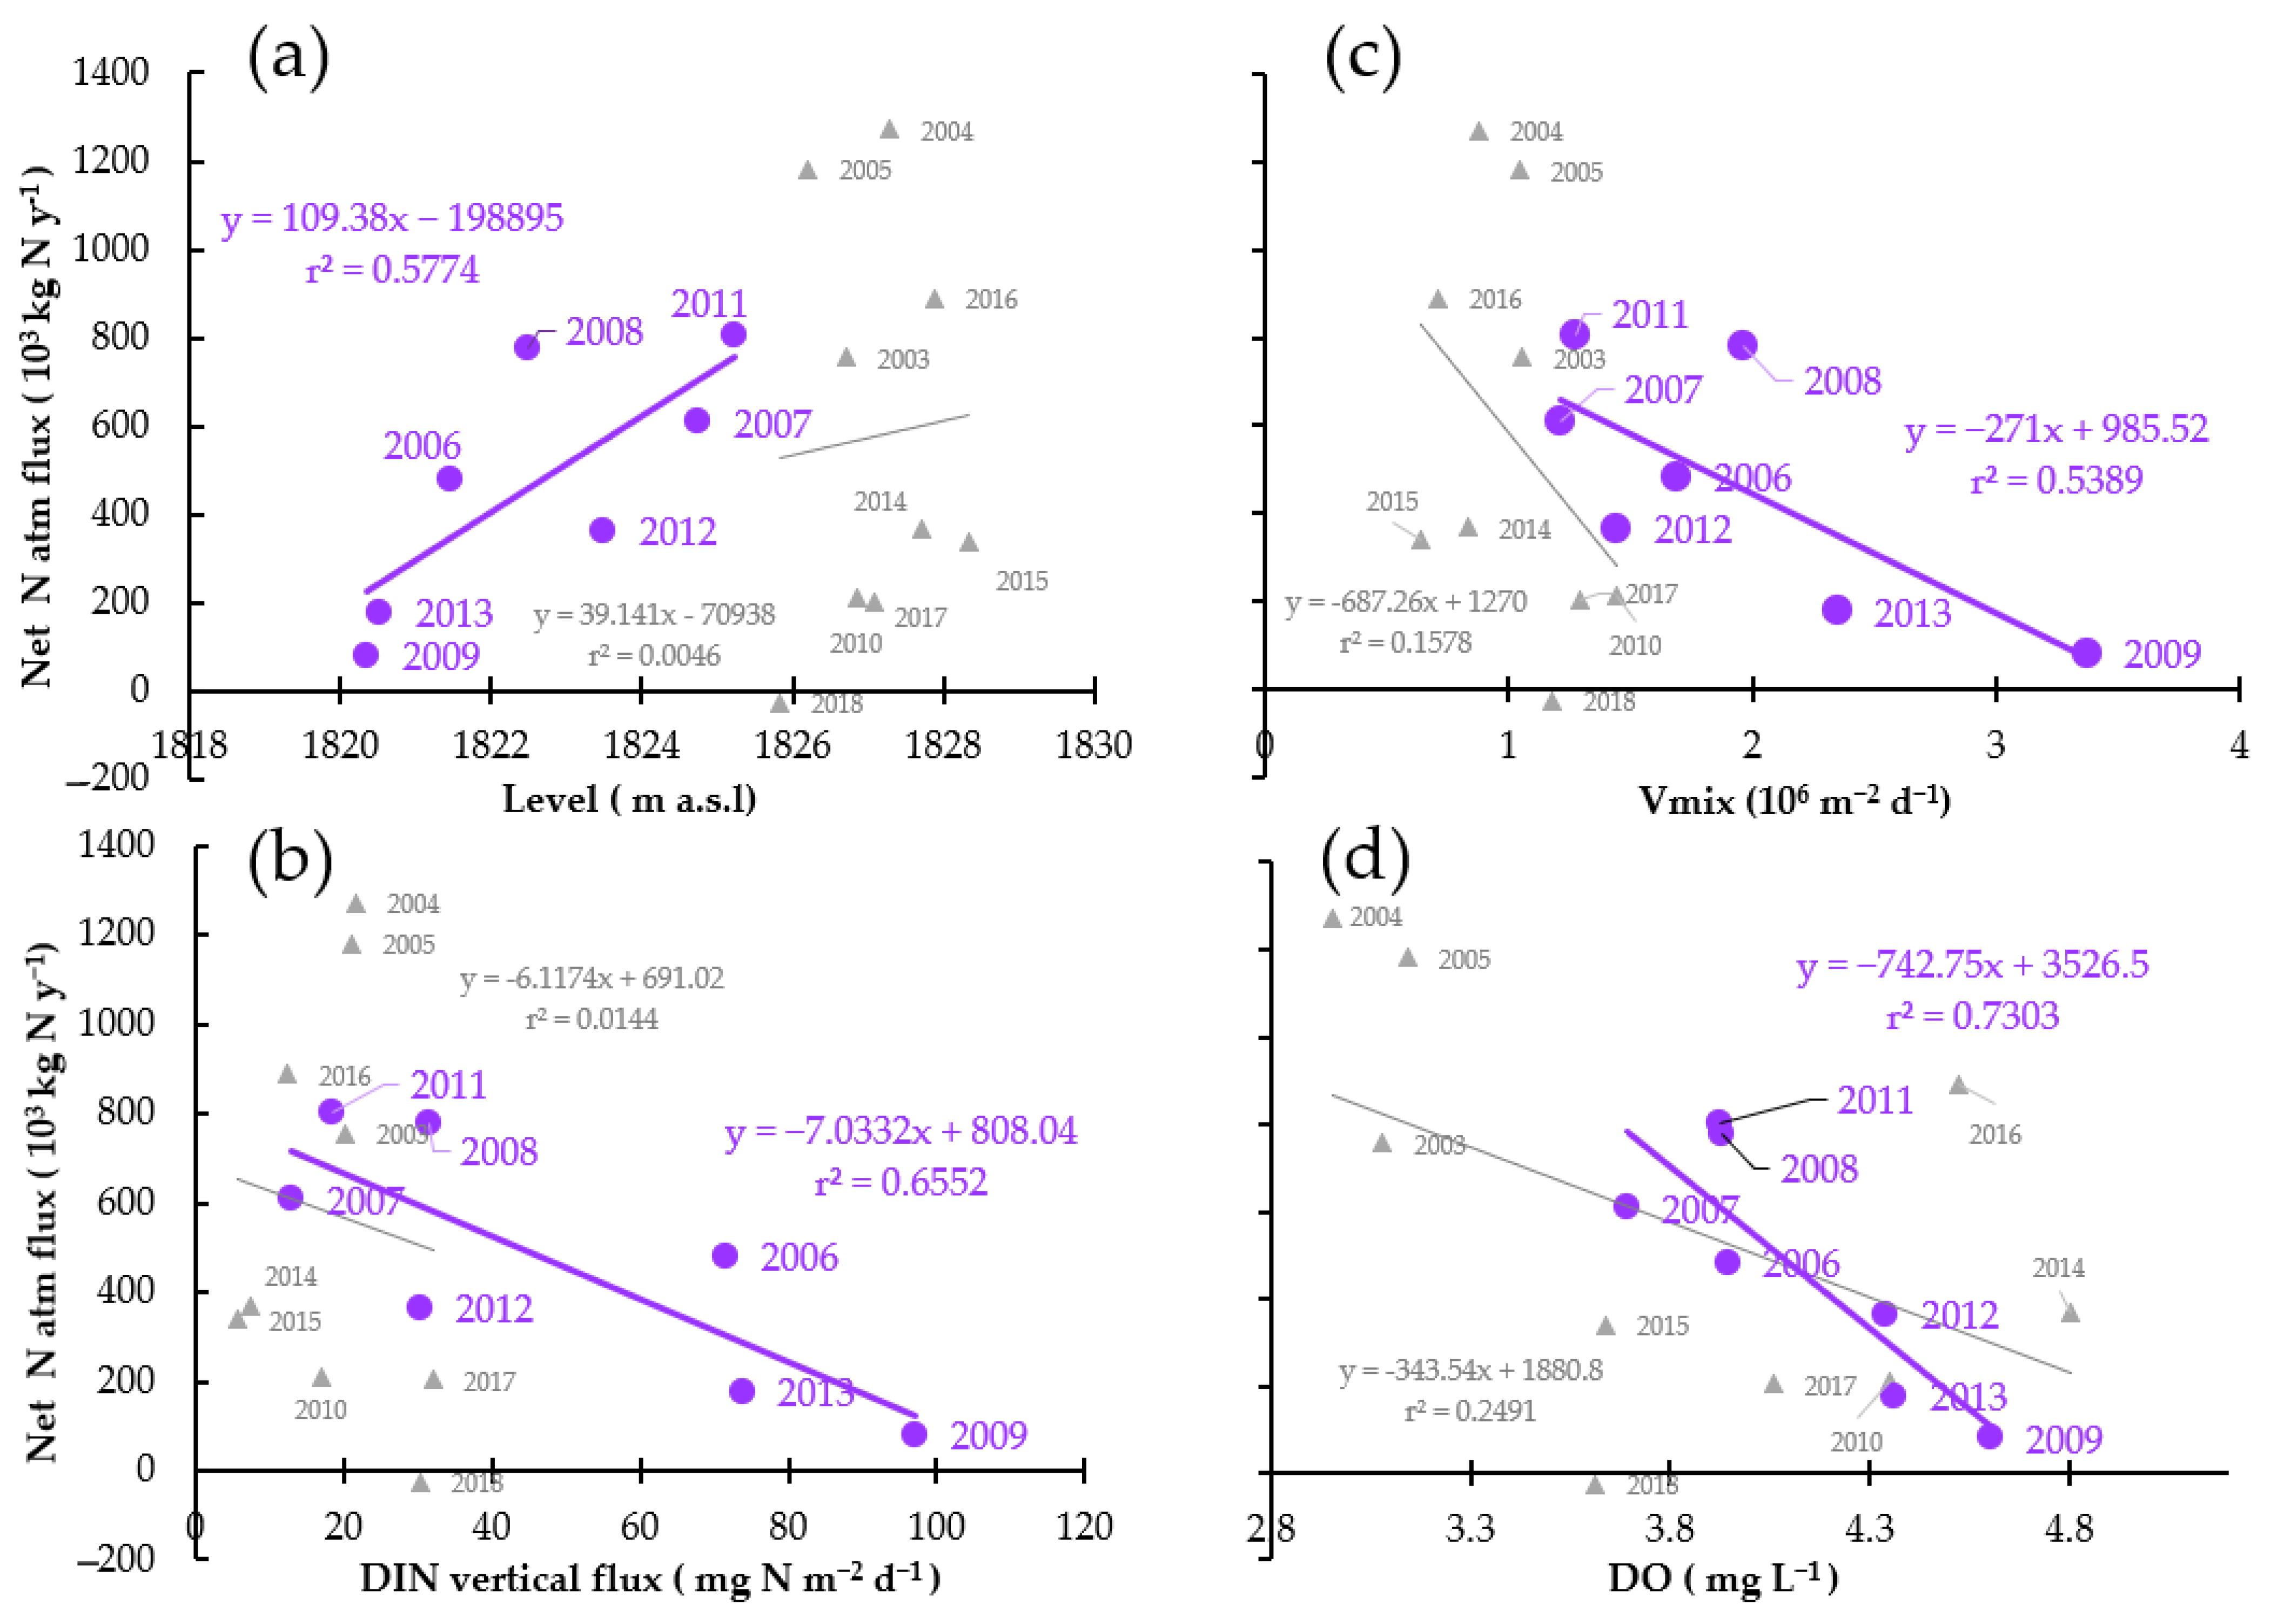
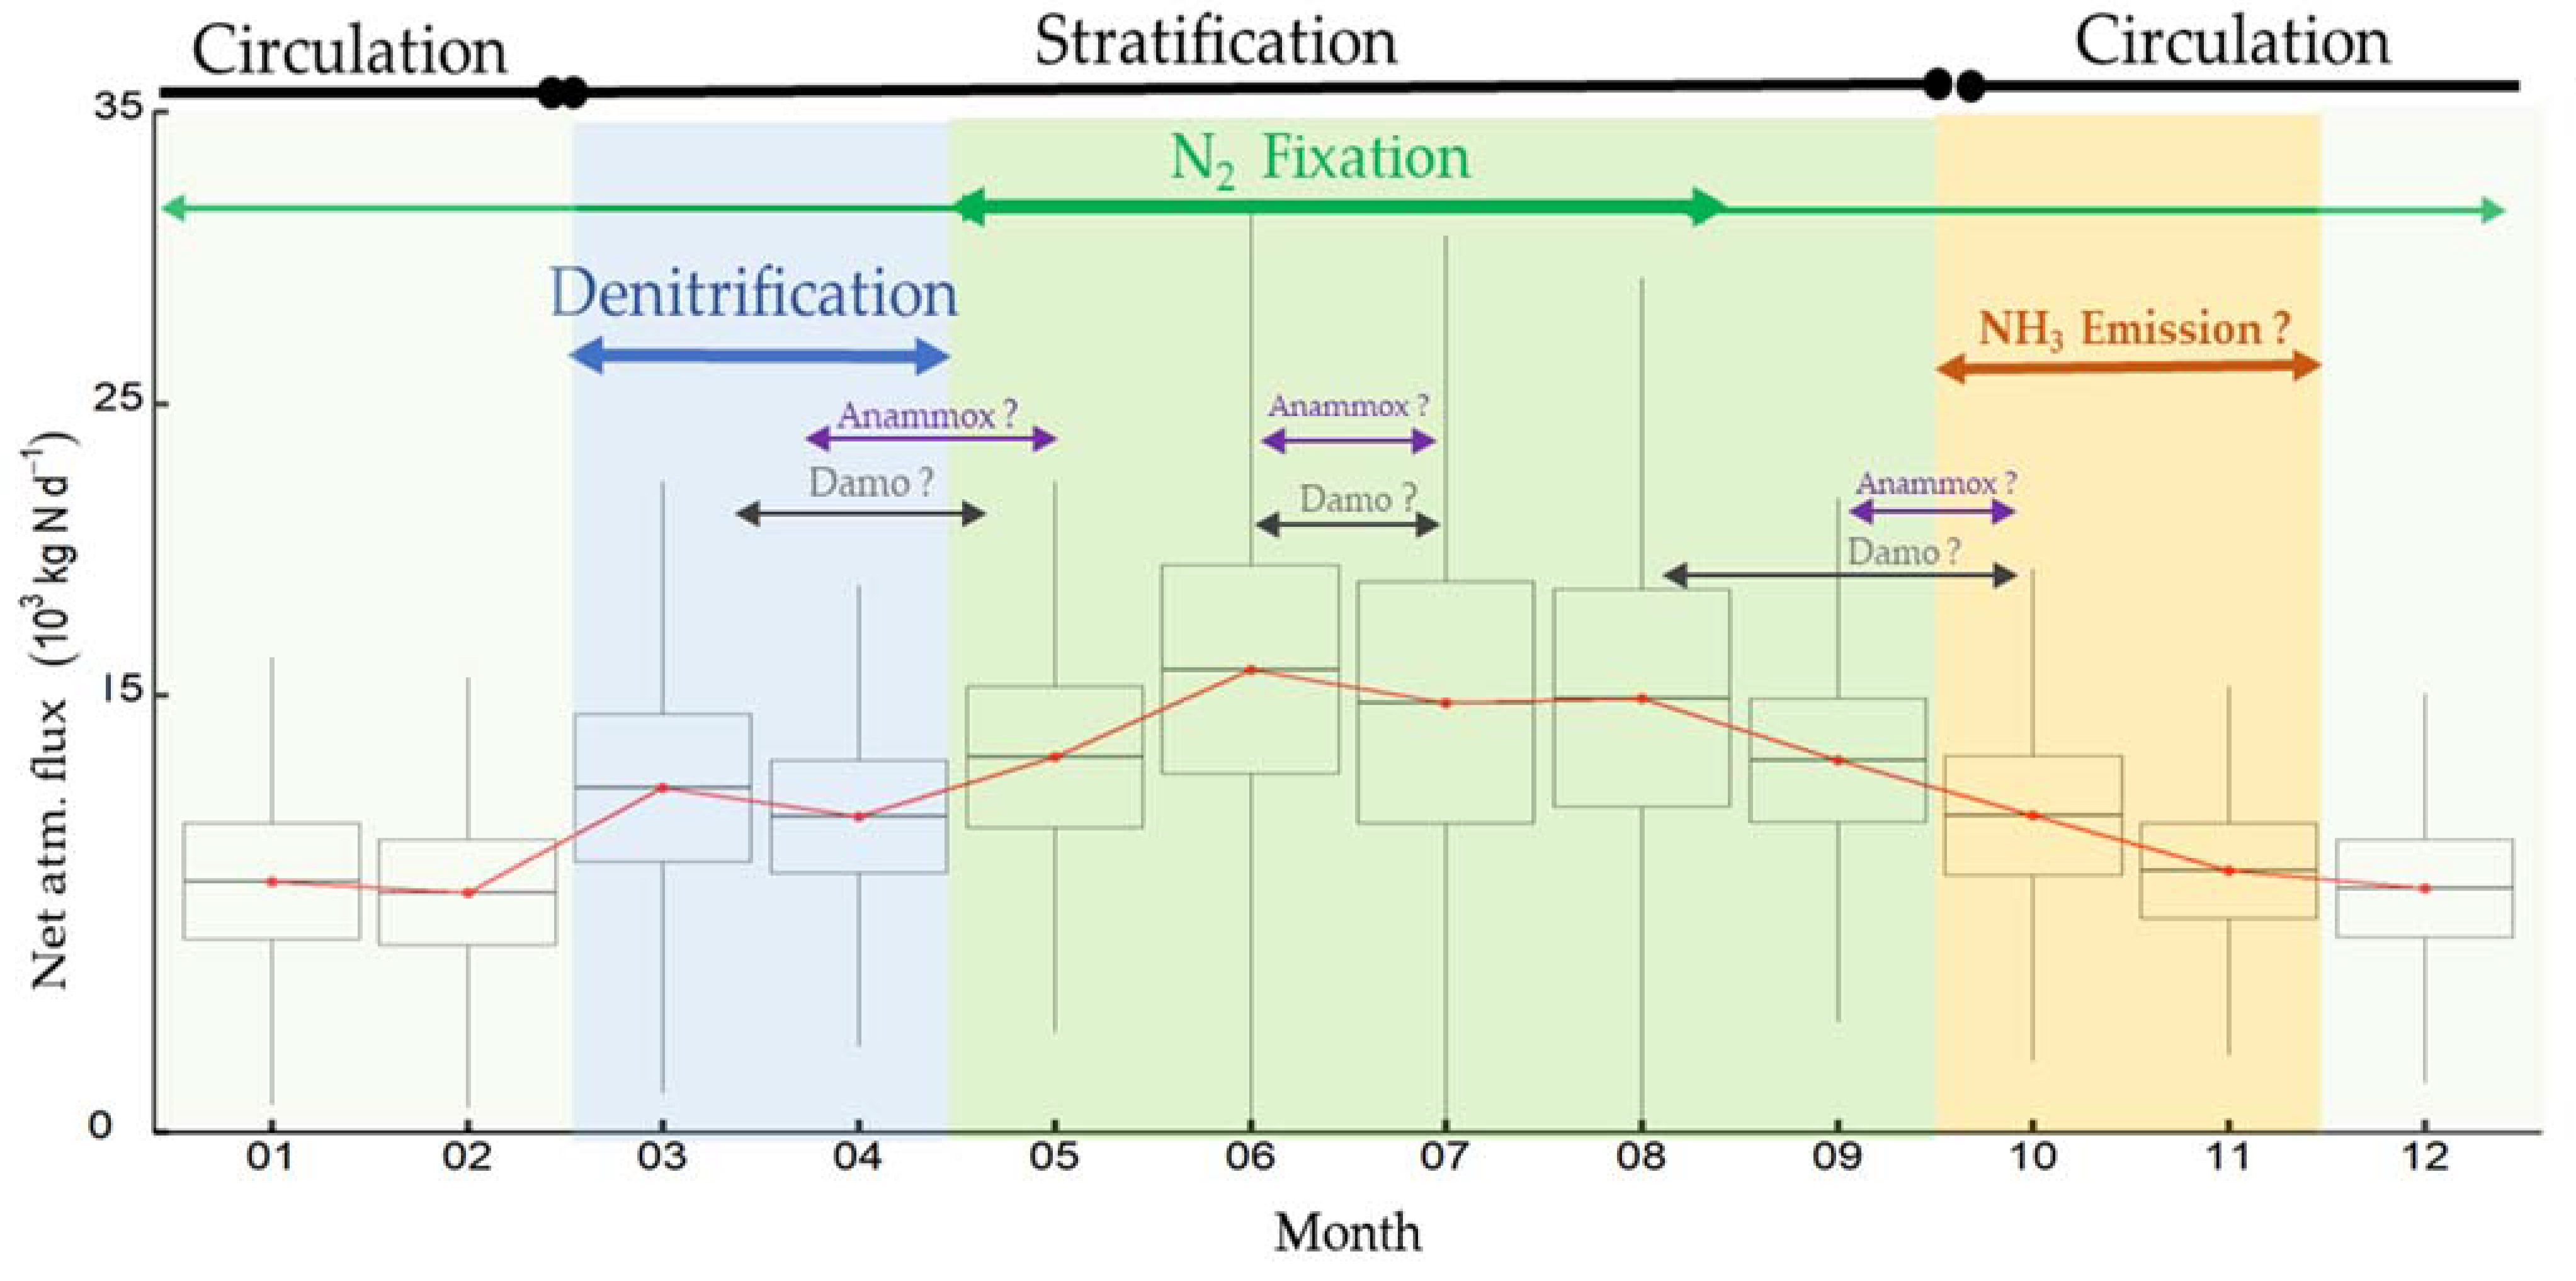
4. Discussion
4.1. Most of the External Load Translates into Net Sedimentation
4.2. Net N Atmospheric Flux Was Lower during High Water Level Fluctuations
5. Conclusions
Supplementary Materials
Author Contributions
Funding
Institutional Review Board Statement
Informed Consent Statement
Data Availability Statement
Acknowledgments
Conflicts of Interest
References
- Rockström, J.; Steffen, W.; Noone, K.; Persson, Å.; Chapin, F.S.; Lambin, E.F.; Lenton, T.M.; Scheffer, M.; Folke, C.; Schellnhuber, H.J.; et al. A Safe Operating Space for Humanity. Nature 2009, 461, 472–475. [Google Scholar] [CrossRef]
- Mackenzie, F.T.; Ver, L.M.; Lerman, A. Century-Scale Nitrogen and Phosphorus Controls of the Carbon Cycle. Chem. Geol. 2002, 190, 13–32. [Google Scholar] [CrossRef]
- Raimi, M.O.; Abiola, I.; Alima, O.; Omini, D.E.; Gift, R.A. Exploring How Human Activities Disturb the Balance of Biogeochemical Cycles: Evidence from the Carbon, Nitrogen and Hydrologic Cycles. Nitrogen Hydrol. Cycles 2021. [Google Scholar] [CrossRef]
- Gruber, N.; Galloway, J.N. An Earth-System Perspective of the Global Nitrogen Cycle. Nature 2008, 451, 293–296. [Google Scholar] [CrossRef] [PubMed]
- Shafiei, F. Nutrient Mass Balance of a Large Riverine Reservoir in the Context of Water Residence Time Variability. Environ. Sci. Pollut. Res. 2021, 28, 39082–39100. [Google Scholar] [CrossRef] [PubMed]
- Ward, M.H. Too Much of a Good Thing? Nitrate from Nitrogen Fertilizers and Cancer: President’s Cancer. Rev. Environ. Health 2009, 24, 357. [Google Scholar] [CrossRef]
- Zhang, H.; Xu, L.; Huang, T.; Yan, M.; Liu, K.; Miao, Y.; He, H.; Li, S.; Sekar, R. Combined Effects of Seasonality and Stagnation on Tap Water Quality: Changes in Chemical Parameters, Metabolic Activity and Co-Existence in Bacterial Community. J. Hazard. Mater. 2021, 403, 124018. [Google Scholar] [CrossRef]
- Carey, C.C.; Hanson, P.C.; Thomas, R.Q.; Gerling, A.B.; Hounshell, A.G.; Lewis, A.S.L.; Lofton, M.E.; McClure, R.P.; Wander, H.L.; Woelmer, W.M.; et al. Anoxia Decreases the Magnitude of the Carbon, Nitrogen, and Phosphorus Sink in Freshwaters. Glob. Change Biol. 2022. [Google Scholar] [CrossRef]
- Cui, G.; Li, X.-D.; Li, S.; Ding, S.; Li, Q.; Yang, M.; Lv, H.; Wang, Y. Varying Water Column Stability Controls the Denitrification Process in a Subtropical Reservoir, Southwest China. J. Environ. Sci. 2022, 111, 208–219. [Google Scholar] [CrossRef]
- Maavara, T.; Chen, Q.; van Meter, K.; Brown, L.E.; Zhang, J.; Ni, J.; Zarfl, C. River Dam Impacts on Biogeochemical Cycling. Nat. Rev. Earth Environ. 2020, 1, 103–116. [Google Scholar] [CrossRef]
- De Vicente, I. Biogeochemistry of Mediterranean Wetlands: A Review about the Effects of Water-Level Fluctuations on Phosphorus Cycling and Greenhouse Gas Emissions. Water 2021, 13, 1510. [Google Scholar] [CrossRef]
- Saunders, D.L.; Kalff, J. Nitrogen Retention in Wetlands, Lakes and Rivers. Hydrobiologia 2001, 443, 205–212. [Google Scholar] [CrossRef]
- Kuypers, M.M.M.; Marchant, H.K.; Kartal, B. The Microbial Nitrogen-Cycling Network. Nat. Rev. Microbiol. 2018, 16, 263–276. [Google Scholar] [CrossRef] [PubMed]
- Thamdrup, B. New Pathways and Processes in the Global Nitrogen Cycle. Annu. Rev. Ecol. Evol. Syst. 2012, 43, 407–428. [Google Scholar] [CrossRef]
- Harrison, J.A.; Maranger, R.J.; Alexander, R.B.; Giblin, A.E.; Jacinthe, P.A.; Mayorga, E.; Seitzinger, S.P.; Sobota, D.J.; Wollheim, W.M. The Regional and Global Significance of Nitrogen Removal in Lakes and Reservoirs. Biogeochemistry 2009, 93, 143–157. [Google Scholar] [CrossRef]
- Wollheim, W.M.; Vörösmarty, C.J.; Bouwman, A.F.; Green, P.; Harrison, J.; Linder, E.; Peterson, B.J.; Seitzinger, S.P.; Syvitski, J.P.M. Global N Removal by Freshwater Aquatic Systems Using a Spatially Distributed, within-Basin Approach. Glob. Biogeochem. Cycles 2008, 22. [Google Scholar] [CrossRef] [Green Version]
- Downing, J.A.; Prairie, Y.T.; Cole, J.J.; Duarte, C.M.; Tranvik, L.J.; Striegl, R.G.; McDowell, W.H.; Kortelainen, P.; Caraco, N.F.; Melack, J.M. The Global Abundance and Size Distribution of Lakes, Ponds, and Impoundments. Limnol. Oceanogr. 2006, 51, 2388–2397. [Google Scholar] [CrossRef] [Green Version]
- Seitzinger, S.; Harrison, J.A.; Böhlke, J.K.; Bouwman, A.F.; Lowrance, R.; Peterson, B.; Tobias, C.; Van Drecht, G. Denitrification across Landscapes and Waterscapes: A Synthesis. Ecol. Appl. 2006, 16, 2064–2090. [Google Scholar] [CrossRef] [Green Version]
- Piña-Ochoa, E.; Álvarez-Cobelas, M. Denitrification in Aquatic Environments: A Cross-System Analysis. Biogeochemistry 2006, 81, 111–130. [Google Scholar] [CrossRef]
- Berga, L.; Buil, J.M.; Bofill, E.; de Cea, J.C.; Perez, J.A.G.; Mañueco, G.; Polimon, J.; Soriano, A.; Yagüe, J. Dams and Reservoirs, Societies and Environment in the 21st Century, Two Volume Set: Proceedings of the International Symposium on Dams in the Societies of the 21st Century, 22nd International Congress on Large Dams (ICOLD), Barcelona, Spain, 18 June 2006; CRC Press: Boca Raton, FL, USA, 2006; ISBN 1482262916. [Google Scholar]
- Lewis, W.M. Tropical Lakes: How Latitude Makes a Difference. In Perspectives in Tropical Limnology; SPB Academic Publishing: Amsterdam, The Netherlands, 1996; pp. 43–64. [Google Scholar]
- Kunz, M.J.; Anselmetti, F.S.; West, A.; Wehrli, B.; Vollenweider, A.; Thüring, S.; Senn, D.B. Sediment Accumulation and Carbon, Nitrogen, and Phosphorus Deposition in the Large Tropical Reservoir Lake Kariba (Zambia/Zimbabwe). J. Geophys. Res. Biogeosciences 2011, 116, 1–13. [Google Scholar] [CrossRef] [Green Version]
- Alcocer, J.; Merino-Ibarra, M.; Escobar-Briones, E. Tendencias de Investigación En Limnología Tropical; Asociación Mexicana de Limnología, A.C., Instituto de Ciencias del Mar y Limnología, UNAM: Mexico City, Mexico, 2015; ISBN 9786070271991. [Google Scholar]
- Qin, B.; Zhou, J.; Elser, J.J.; Gardner, W.S.; Deng, J.; Brookes, J.D. Water Depth Underpins the Relative Roles and Fates of Nitrogen and Phosphorus in Lakes. Environ. Sci. Technol. 2020, 54, 3191–3198. [Google Scholar] [CrossRef]
- Merino, M.; Monroy, E.; Castillo, S.; Ramírez, J.; Gallegos, M.E.; Alcocer, J. Wind-Driven Upwelling Indicated by Hydrological Variability in a Tropical Eutrophied Reservoir, Valle de Bravo, Mexico. In Proceedings of the 4th International Conference on Reservoir Limnology and Water Quality; E. Schweizerbart: Stuttgart, Germany, 2003; pp. 228–231. [Google Scholar]
- Merino-Ibarra, M.; Monroy-Ríos, E.; Vilaclara, G.; Castillo, F.S.; Gallegos, M.E.; Ramírez-Zierold, J. Physical and Chemical Limnology of a Wind-Swept Tropical Highland Reservoir. Aquat. Ecol. 2008, 42, 335–345. [Google Scholar] [CrossRef]
- Nandini, S.; Merino-Ibarra, M.; Sarma, S.S.S. Seasonal Changes in the Zooplankton Abundances of the Reservoir Valle de Bravo (State of Mexico, Mexico). Lake Reserv. Manag. 2008, 24, 321–330. [Google Scholar] [CrossRef] [Green Version]
- Ramírez-Zierold, J.; Merino-Ibarra, M.; SergioCastillo-Sandoval; Monroy-Ríos, E.; Lopez-Gomez, L.M.; Quintanilla-Terminel, J.G.; Valdespino-Castillo, P.M.; Jiménez-Contreras, J.; Valeriano–Riveros, M.E.; Vilaclara, G.; et al. Variabilidad de La Mezcla Vertical y El Flujo de Nutrientes Asociado En Un Embalse Estratificado, Valle de Bravo, México. In Tendencias de Investigación en Limnología Tropical: Perspectivas Universitarias en Latinoamérica; Asociación Mexicana de Limnología, A.C., Instituto de Ciencias del Mar y Limnología, UNAM: Mexico City, Mexico, 2015; p. 39. [Google Scholar]
- Ramírez-Zierold, J.A.; Merino-Ibarra, M.; Monroy-Ríos, E.; Olson, M.; Castillo, F.S.; Gallegos, M.E.; Vilaclara, G. Changing Water, Phosphorus and Nitrogen Budgets for Valle de Bravo Reservoir, Water Supply for Mexico City Metropolitan Area. Lake Reserv. Manag. 2010, 26, 23–34. [Google Scholar] [CrossRef]
- Valdespino-Castillo, P.M.; Merino-Ibarra, M.; Jiménez-Contreras, J.; Castillo-Sandoval, F.S.; Ramírez-Zierold, J.A. Community Metabolism in a Deep (Stratified) Tropical Reservoir during a Period of High Water-Level Fluctuations. Environ. Monit. Assess. 2014, 186, 6505–6520. [Google Scholar] [CrossRef] [Green Version]
- Valeriano-Riveros, M.E.; Vilaclara, G.; Castillo-Sandoval, F.S.; Merino-Ibarra, M. Phytoplankton Composition Changes during Water Level Fluctuations in a High-Altitude, Tropical Reservoir. Inland Waters 2014, 4, 337–348. [Google Scholar] [CrossRef]
- Contreras, J.J.; Sarma, S.S.S.; Merino-Ibarra, M.; Nandini, S. Seasonal Changes in the Rotifer (Rotifera) Diversity from a Tropical High Altitude Reservoir (Valle de Bravo, Mexico). J. Environ. Biol. 2009, 30, 191–195. [Google Scholar]
- Merino-Ibarra, M.; Ramírez-Zierold, J.A.; Valdespino-Castillo, P.M.; Castillo-Sandoval, F.S.; Guzmán-Arias, A.P.; Barjau-Aguilar, M.; Monroy-Ríos, E.; Gómez, L.M.L.; Sacristán-Ramírez, A.; Quintanilla-Terminel, J.G.; et al. Vertical Boundary Mixing Events during Stratification Govern Heat and Nutrient Dynamics in Windy Tropical Lakes with High Water-Level Fluctuations: A Long-Term (2001–2018) Study. Preprints 2021. [Google Scholar] [CrossRef]
- Comisión Nacional del Agua. Estadísticas del Agua en México, 2017th ed.; Comisión Nacional del Agua, Ed.; Secretaría de Medio Ambiente y Recursos Naturales: Mexico City, Mexico, 2017; pp. 0–170.
- Olvera Viascán, V. Estudio de Eutroficación de La Presa Valle de Bravo, México. Ingeniería Hidráulica en México 1992, 7, 148–161. [Google Scholar]
- Gaytan-Herrera, M.L.; Martinez-Almeida, V.; Oliva-Martinez, M.G.; Duran-Diaz, Á.; Ramirez-Garcia, P. Temporal Variation of Phytoplankton from the Tropical Reservoir Valle de Bravo, Mexico. J. Environ. Biol. 2011, 32, 117–126. [Google Scholar]
- Alillo-Sánchez, J.L.; Gaytán-Herrera, M.L.; Martínez-Almeida, V.M.; Ramírez-García, P. Microcystin-LR Equivalents and Their Correlation with Anabaena Spp. in the Main Reservoir of a Hydraulic System of Central Mexico. Inland Waters 2014, 4, 327–336. [Google Scholar] [CrossRef]
- Calderón Cendejas, J.; Madrid Ramírez, L.; Ramírez Zierold, J.; Díaz Valenzuela, J.; Merino Ibarra, M.; Morató Sánchez de Tagle, S.; Chino Téllez, A. Evaluation of the Impacts of Land Use in Water Quality and the Role of Nature-Based Solutions: A Citizen Science-Based Study. Sustainability 2021, 13, 10519. [Google Scholar] [CrossRef]
- Pichardo Pagaza, I. El Agua Ciclo de Un Destino, 1st ed.; Biblioteca Mexiquense del Bicentenario: Toluca, Mexico, 2007; ISBN 9684846630. [Google Scholar]
- Guimarais-Bermejo, M.O.; Merino-Ibarra, M.; Valdespino-Castillo, P.M.; Castillo-Sandoval, F.S.; Ramírez-Zierold, J.A. Metabolism in a Deep Hypertrophic Aquatic Ecosystem with High Water-Level Fluctuations: A Decade of Records Confirms Sustained Net Heterotrophy. PeerJ 2018, 6, e5205. [Google Scholar] [CrossRef] [Green Version]
- Barjau-Aguilar, M. Estimación de Los Procesos Internos Netos (NIP) de P y N Mediante Balances de Masa En El Embalse Tropical de Valle de Bravo Durante 2011–2015; Universidad Nacional Autónoma de México: Mexico City, Mexico, 2018. [Google Scholar]
- Valderrama, J.C. The Simultaneous Analysis of Total Nitrogen and Total Phosphorus in Natural Waters. Mar. Chem. 1981, 10, 109–122. [Google Scholar] [CrossRef]
- Kirkwood, D.S. Sanplus Segmented Flow Analyzer and Its Applications. Seawater Analysis. Skalar. Amst. 1994, 51, 1747–1771. [Google Scholar]
- Grasshoff, K.; Ehrhardt, M.; Kremling, K. Sea Water Analysis, 2nd ed.; Verlag Chemie: Weinheim, Germany, 1983. [Google Scholar]
- Wickham, H. Ggplot2, 2nd ed.; Springer: New York, NY, USA, 2009; ISBN 978-0-387-98140-6. [Google Scholar]
- Wickham, H.; Averick, M.; Bryan, J.; Chang, W.; McGowan, L.; François, R.; Grolemund, G.; Hayes, A.; Henry, L.; Hester, J.; et al. Welcome to the Tidyverse. J. Open Source Softw. 2019, 4, 1686. [Google Scholar] [CrossRef]
- RStudio Team. RStudio: Integrated Development for R. Available online: http://www.rstudio.com/ (accessed on 11 May 2022).
- Gerardo-Nieto, O.; Merino-Ibarra, M.; Sanchez-Carrillo, S.; Guzmán-Arias, A.; Castillo-Sandoval, S.F.; Barjau-Aguilar, M.; Valdespino-Castillo, P.M.; Lestayo-González, J.A.; Díaz-Valenzuela, J.; Ramírez-Zierold, J.; et al. Limnological Dynamics of Methane and Carbon Dioxide Emissions from a Tropical Hypertrophic Reservoir. J. Water Clim. Chang. 2022; submitted. [Google Scholar]
- Chen, J.; Li, W.; Qiao, P.; Li, Y.; Zheng, K.; Wang, Y.; Dong, X.; Wang, S.; Tan, L.; Chu, F.; et al. Characterizing Ammonia Emissions from Water Bodies Using Dynamic Floating Chambers. Sci. Total Environ. 2021, 796, 148978. [Google Scholar] [CrossRef]
- Ramírez-Zierold, J.; Merino-Ibarra, M.; Castillo-Sandoval, F.S.; Vilaclara-Fatjó, G.; Monroy-Ríos, E.; Gallegos, M.; Olson, M.; López-Gómez, L.M. Boletín del Patronato Pro-Valle de Bravo; Pro-Valle de Bravo: Valle de Bravo, Mexico, 2007; pp. 6–9. [Google Scholar]
- IMTA. Plan Estratégico Para La Recuperación Ambiental de La Cuenca Amanalco-Valle de Bravo: Actualización; IMTA: Guiyang, China, 2012. [Google Scholar]
- Ramírez-Zierold, J.; Merino-Ibarra, M.; Valdespino-Castillo, P.; Castillo-Sandoval, F.S.; Ardiles, V.; Monroy-Ríos, E.; López-Gómez, L.M.; Quintanilla-Terminel, J.G.; Jiménez, J.; Valeriano-Riveros, M.; et al. Boletín del Patronato Pro-Valle de Bravo; Pro-Valle de Bravo: Valle de Bravo, Mexico, 2013; pp. 2–12. [Google Scholar]
- Kunz, M.J.; Wüest, A.; Wehrli, B.; Landert, J.; Senn, D.B. Impact of a Large Tropical Reservoir on Riverine Transport of Sediment, Carbon, and Nutrients to Downstream Wetlands. Water Resour. Res. 2011, 47, 1–16. [Google Scholar] [CrossRef] [Green Version]
- Wu, Y.; Wen, Y.; Zhou, J.; Wu, Y. Phosphorus Release from Lake Sediments: Effects of PH, Temperature and Dissolved Oxygen. KSCE J. Civ. Eng. 2014, 18, 323–329. [Google Scholar] [CrossRef]
- Carnero-Bravo, V.; Merino-Ibarra, M.; Ruiz-Fernández, A.C.; Sanchez-Cabeza, J.A.; Ghaleb, B. Sedimentary Record of Water Column Trophic Conditions and Sediment Carbon Fluxes in a Tropical Water Reservoir (Valle de Bravo, Mexico). Environ. Sci. Pollut. Res. 2015, 22, 4680–4694. [Google Scholar] [CrossRef]
- Valadez, F.; Oliva, G.; Vilaclara, G.; Caballero, M.; Rodríguez, D.C. On the Presence of Stephanodiscus Niagarae Ehrenberg in Central Mexico. J. Paleolimnol. 2005, 34, 147–157. [Google Scholar] [CrossRef]
- Nandini, S.; Sánchez-Zamora, C.; Sarma, S.S.S. Toxicity of Cyanobacterial Blooms from the Reservoir Valle de Bravo (Mexico): A Case Study on the Rotifer Brachionus Calyciflorus. Sci. Total Environ. 2019, 688, 1348–1358. [Google Scholar] [CrossRef]
- Canfield, D.E.; Kristensen, E.; Thamdrup, B. The Nitrogen Cycle. In Aquatic Geomicrobiology; Canfield, D.E., Kristensen, E., Thamdrup, B., Eds.; Academic Press: Cambridge, MA, USA, 2005; Volume 48, pp. 205–267. ISBN 0065-2881. [Google Scholar]
- Peters, B.D.; Babbin, A.R.; Lettmann, K.A.; Mordy, C.W.; Ulloa, O.; Ward, B.B.; Casciotti, K.L. Vertical Modeling of the Nitrogen Cycle in the Eastern Tropical South Pacific Oxygen Deficient Zone Using High-Resolution Concentration and Isotope Measurements. Glob. Biogeochem. Cycles 2016, 30, 1661–1681. [Google Scholar] [CrossRef]
- Rysgaard, S.; Christensen, P.B.; Nielsen, L.P. Seasonal Variation in Nitrification and Denitrification in Estuarine Sediment Colonized by Benthic Microalgae and Bioturbating Infauna. Mar. Ecol. Prog. Ser. 1995, 126, 111–121. [Google Scholar] [CrossRef]
- Heiskanen, A.; Kononen, K. Sedimentation of Vernal and Late Summer Phytoplankton Communities in the Coastal Baltic Sea. Arch. Hydrobiol. 1994, 131, 175. [Google Scholar] [CrossRef]
- Sommer, U. Sedimentation of Principal Phytoplankton Species in Lake Constance. J. Plankton Res. 1984, 6, 1–14. [Google Scholar] [CrossRef]
- Walsby, A.E.; McAllister, G.K. Buoyancy Regulation by Microcystis in Lake Okaro. Mar. Freshw. Res. 1987, 21, 521–524. [Google Scholar] [CrossRef]
- Walsby, A.E. Cyanobacteria: Planktonic Gas-Vacuolate Forms BT—The Prokaryotes: A Handbook on Habitats, Isolation, and Identification of Bacteria; Starr, M.P., Stolp, H., Trüper, H.G., Balows, A., Schlegel, H.G., Eds.; Springer: Berlin/Heidelberg, Germany, 1981; pp. 224–235. ISBN 978-3-662-13187-9. [Google Scholar]
- Li, H.; Song, C.L.; Cao, X.Y.; Zhou, Y.Y. The Phosphorus Release Pathways and Their Mechanisms Driven by Organic Carbon and Nitrogen in Sediments of Eutrophic Shallow Lakes. Sci. Total Environ. 2016, 572, 280–288. [Google Scholar] [CrossRef]
- Liu, L.; Huang, Q.; Qin, B. Characteristics and Roles of Microcystis Extracellular Polymeric Substances (EPS) in Cyanobacterial Blooms: A Short Review. J. Freshw. Ecol. 2018, 33, 183–193. [Google Scholar] [CrossRef] [Green Version]


| L-WLF-1 | H-WLF | L-WLF-2 | Overall | ||
|---|---|---|---|---|---|
| TP | (2003–2005) | (2006–2013) | (2014–2018) | (2003–2018) | |
| Mean mass reservoir (103 kg P) | 26.3 | 30.8 | 26.5 | 28.6 | |
| Δ mass (103 kg P y−1) | 1.3 | 2.7 | 1.7 | 2.1 | |
| Fluxes (103 kg P y−1) | % Input | ||||
| Rivers | 60.7 | 56.4 | 34.0 | 50.2 | 73% |
| Sewage | 23.2 | 15.9 | 7.5 | 14.7 | 21% |
| Pump-back | 1.1 | 4.7 | 3.7 | 3.7 | 5% |
| Total input | 85.0 | 77.1 | 45.2 | 68.6 | 100% |
| Output | −21.0 | −20.5 | −17.4 | −19.6 | −29% |
| Input−Output | 64.0 | 56.6 | 27.8 | 49.0 | 71% |
| Net internal flux | −62.7 | −53.9 | −26.1 | −46.9 | −68% |
| Net sedimentation | −62.7 | −53.9 | −26.1 | −46.9 | −68% |
| TN | % Input | ||||
| Mean mass reservoir (103 kg N) | 382.6 | 289.0 | 288.6 | 306.4 | |
| Δ mass (103 kg N y−1) | 65.1 | −22.7 | −0.3 | 0.8 | |
| Fluxes (103 kg N y−1) | |||||
| Rivers | 354.6 | 293.3 | 281.0 | 300.9 | 80% |
| Sewage | 51.7 | 58.5 | 46.0 | 53.3 | 14% |
| Pump-back | 8.0 | 27.7 | 26.0 | 23.5 | 6% |
| Total input | 414.3 | 379.5 | 353.0 | 377.7 | 100% |
| Output | −286.4 | −194.0 | −194.7 | −211.6 | −56% |
| Input−Output | 127.9 | 185.4 | 158.3 | 166.2 | 44% |
| Net internal flux | −62.8 | −208.2 | −158.5 | −165.4 | −44% |
| NOP: POPhipo | 36 | 26 | 33 | 29.9 | 8% |
| Net sedimentation | −1049.9 | −662.4 | −497.4 | −683.5 | −181% |
| Atmosphere−water fluxes | 987.2 | 454.2 | 338.8 | 518.1 | 137% |
Publisher’s Note: MDPI stays neutral with regard to jurisdictional claims in published maps and institutional affiliations. |
© 2022 by the authors. Licensee MDPI, Basel, Switzerland. This article is an open access article distributed under the terms and conditions of the Creative Commons Attribution (CC BY) license (https://creativecommons.org/licenses/by/4.0/).
Share and Cite
Barjau-Aguilar, M.; Merino-Ibarra, M.; Ramírez-Zierold, J.A.; Castillo-Sandoval, S.F.; Vilaclara-Fatjó, G.; Guzmán-Arias, A.P.; Macek, M.; Alcántara-Hernández, R.J.; Sánchez-Carrillo, S.; Valdespino-Castillo, P.M.; et al. Nitrogen and Phosphorous Retention in Tropical Eutrophic Reservoirs with Water Level Fluctuations: A Case Study Using Mass Balances on a Long-Term Series. Water 2022, 14, 2144. https://doi.org/10.3390/w14142144
Barjau-Aguilar M, Merino-Ibarra M, Ramírez-Zierold JA, Castillo-Sandoval SF, Vilaclara-Fatjó G, Guzmán-Arias AP, Macek M, Alcántara-Hernández RJ, Sánchez-Carrillo S, Valdespino-Castillo PM, et al. Nitrogen and Phosphorous Retention in Tropical Eutrophic Reservoirs with Water Level Fluctuations: A Case Study Using Mass Balances on a Long-Term Series. Water. 2022; 14(14):2144. https://doi.org/10.3390/w14142144
Chicago/Turabian StyleBarjau-Aguilar, Mariel, Martín Merino-Ibarra, Jorge A. Ramírez-Zierold, Sergio F. Castillo-Sandoval, Gloria Vilaclara-Fatjó, Andrea P. Guzmán-Arias, Miroslav Macek, Rocío J. Alcántara-Hernández, Salvador Sánchez-Carrillo, Patricia M. Valdespino-Castillo, and et al. 2022. "Nitrogen and Phosphorous Retention in Tropical Eutrophic Reservoirs with Water Level Fluctuations: A Case Study Using Mass Balances on a Long-Term Series" Water 14, no. 14: 2144. https://doi.org/10.3390/w14142144