
Influence of Precipitation Characteristics and Vegetation on Runoff and Sediment: A Case on the Basin in the Three Gorges Reservoir Region


1
Key Laboratory of Mountain Surface Processes and Ecological Regulation, Institute of Mountain Hazards and Environment, Chinese Academy of Sciences, Chengdu 610041, China
2
University of Chinese Academy of Sciences, Beijing 100049, China
*
Author to whom correspondence should be addressed.
Water 2022, 14(13), 2141; https://doi.org/10.3390/w14132141
Submission received: 5 June 2022
/
Revised: 29 June 2022
/
Accepted: 30 June 2022
/
Published: 5 July 2022
(This article belongs to the Section Wastewater Treatment and Reuse)
Abstract
:Sediment is the main carrier of pollutants in river channels. This study analyzed the distribution characteristics of precipitation, runoff, and sediment and their response characteristics in the Daning River basin. Based on daily precipitation (1979–2017), runoff (1989–2017), and sediment (1997–2017) time series, the Gini concentration index, precipitation concentration index (PCI), precipitation concentration degree (PCD), and precipitation concentration period were applied to assess the concentration characteristics of precipitation, runoff, and sediment on the daily, monthly, and seasonal scales. At each intensity level, precipitation was negatively correlated to the PCI and PCD. The normalized difference vegetation index (NDVI) values had strong negative correlations with rainy days with light precipitation (0.1–9.9 mm). The degrees of concentration were in the same order for the multiscale analysis: runoff < precipitation < sediment. Although the amount of daily precipitation of more than 25 mm displayed a significant increasing trend, suggesting an increased risk of flood and soil erosion, the significantly improved vegetation cover reduced the sediment-carrying capacity of the surface runoff, with significant decreases in the total amount and multiscale concentration degrees of sediment being observed. The results of the study provide a reference for the improvement of the potable water safety and ecological environment in the Three Gorges Reservoir region.
1. Introduction
With the intensification of urbanization and the increasing amounts of agricultural wastewater in the Three Gorges Reservoir area, the sources of water pollution in the region have increased [1,2]. One of the functions of the reservoir is supplying potable water to downstream regions, so the safety of water resources is a vital issue for the Three Gorges Reservoir area. Sediment is the main carrier of river pollutants [3]. For the water source of water plants, climate change and sediment are significant risk factors affecting the quality of potable water at a high level [4]. Runoff and sediment play vital roles in maintaining the ecosystem environment [5]. Therefore, the analysis of climate change characteristics and trends in runoff and sediment characteristics is of great significance for water source protection and water treatment technology.
In recent years, the runoff and sediment discharge in a large number of major rivers around the world have exhibited significantly decreasing trends [6], including the Mississippi River [7], the Yellow River [8], the Nile River, the Colorado River, and the Yangtze River [9]. The Yangtze River provides a large amount of water resources in southern China and is rich in hydropower resources. Some studies have reported that the decreased sediment was mainly the result of regulation by dams, which reduced the sediment discharge in the upper regions of the Yangtze River by more than 97% [10].
In China, there are projects aimed at improving the vegetation cover to reduce soil erosion. In past decades, human activities have contributed to the improved vegetation coverage in the upper regions of the Yangtze River. In addition, the contributions that climate change has made to the growth of vegetation cannot be ignored. There are also climate models that have suggested that global warming may lead to more complex changes [11]. The temporal distribution of daily precipitation has been detected by researchers [12,13]. Additionally, changes in the monthly precipitation have been analyzed in some areas [14,15]. The changes in precipitation may affect the annual amount of runoff and sediment as well as the characteristics of these within the year (e.g., seasonal distribution) [16].
This work evaluated the temporal characteristics of the distribution of precipitation, runoff, and sediment on daily, monthly, and seasonal scales in the Daning River basin. The relationships between precipitation concentration indices at different intensities and the amount of precipitation, the NDVI value, and precipitation characteristics were also analyzed. The response of the runoff and sediment characteristics to precipitation and vegetation cover was revealed.
2. Materials and Methods
2.1. Study Area
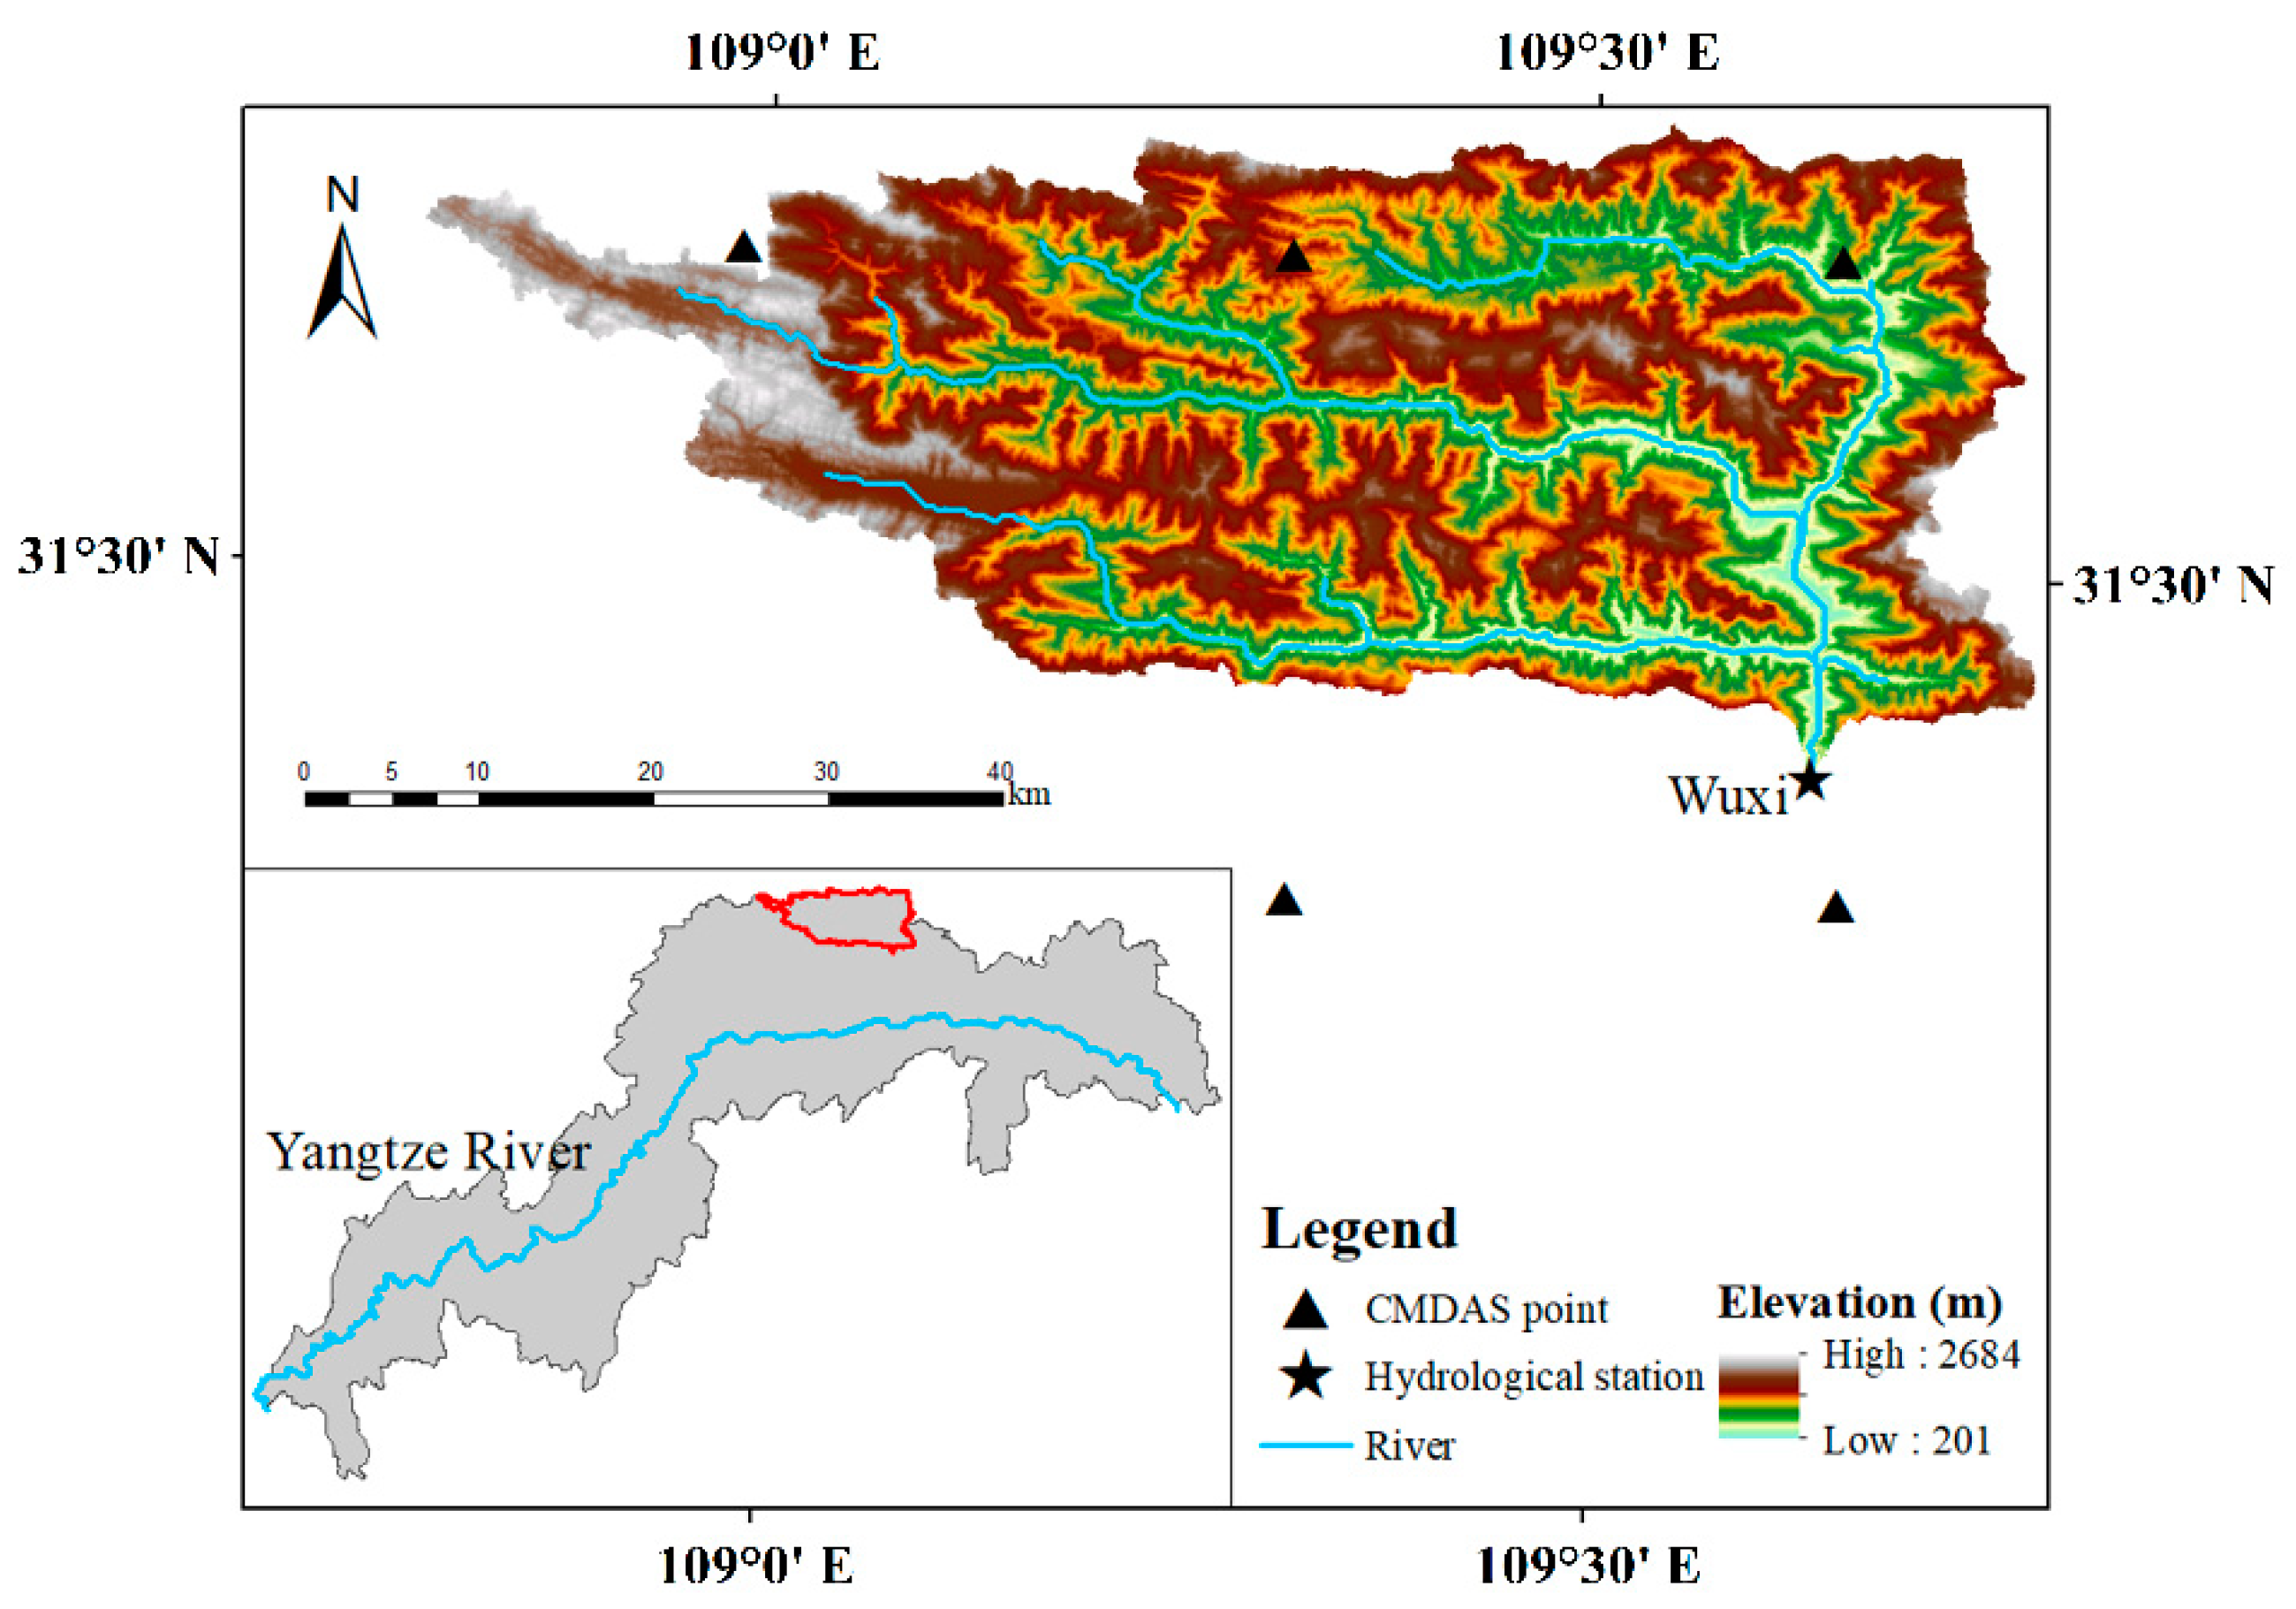
The Daning River basin, located in the center of the Three Gorges Reservoir area, lies between 108°44′ E and 110°11′ E, and 31°4′ N and 31°44′ N. It is a main tributary on the left bank of the Yangtze River. In this paper, the research area covered the basin from the headwater region and extended to the Wuxi hydrological station (Figure 1). The study area had an area of about 2001 km2. The Daning River basin is located in the subtropical monsoon zone and is wet during the flood season. The annual average precipitation in the area is 1047 mm, and 80% of the annual precipitation occurs during the wet season (from May to October). The annual average minimum temperature is 7.4 °C, and the annual average maximum temperature is 14.4 °C. The main land cover types in the study area are forestland, farmland, and grassland, with forestland accounting for more than 60% of the area. The average runoff at the Wuxi hydrological station is 19.37 × 10⁸ m3, and the average sediment load is 102.06 × 10⁴ t.
2.2. Data
Daily precipitation data for the Daning River basin were derived from CMADS datasets [17] (http://www.cmads.org (accessed on 6 July 2020)). The source of the CMADS series of datasets included nearly 40,000 regional automatic stations operated under China’s 2421 national automatic and business assessment centers [18]. The datasets performed with high quality [19,20,21] and were found to match the actual observation data from the national observation stations very well [22]. In this study, 39 years’ worth (1979–2017) of daily precipitation data were available for the study area from the CMADS dataset. The data series was continuous, and no data were missing. The homogeneity tests that were conducted on the observed data were performed using the RclimDex software package (http://etccdi.pacificclimate.org/software.shtml (accessed on 19 December 2021)).
The NDVI is an index that is widely used to express vegetation cover and can detect good correlations with biomass and vegetation cover density [23]. NDVI datasets were available from China’s monthly vegetation index (NDVI) spatial distribution dataset [24] and China’s annual vegetation index (NDVI) spatial distribution dataset [25]. Based on the 10-day SPOT/VEGETATION PROBA-V PRODUCTS vegetation index data which had a spatial resolution of 1 km × 1 km, a monthly vegetation index dataset starting from 1998 was generated using the maximum value composites (MVC) method. Additionally, an annual vegetation index dataset covering the period starting from 1999 was generated using the MVC method based on the monthly vegetation index dataset.
The observed daily streamflow and sediment data of the Wuxi station were obtained from the Hydrology Bureau of the Yangtze River Conservancy Commission. The streamflow series covered the period from 1989 to 2017, and the sediment series covered the period from 1997 to 2017.
2.3. Methods
2.3.1. Precipitation Grades
According to the National Standard (i.e., grade of precipitation (GB/T 28592–2012)), 0.1 mm/d was the threshold for distinguishing between wet and dry days in this study. The above standard categorized the daily precipitation into several intensity groups: light precipitation (0.1–9.9 mm/d), moderate precipitation (MP) (10–24.9 mm/d), heavy precipitation (HP) (25–49.9 mm/d), extreme precipitation (50–99.9 mm/d), heavy extreme precipitation (100–249.9 mm/d), and heavy extreme storms (≥250 mm/d). Since heavy extreme precipitation and heavy extreme storms occur at low frequencies in this basin, we defined daily precipitation ≥ 50 mm/d as extreme precipitation (EP). To better understand the characteristics of small rainfall events and their impact on runoff and sediment, light precipitation was categorized into slight precipitation (SP) (0.1–0.9 mm/d) and light precipitation (LP) (1–9.9 mm/d) in this study. In this study, extreme rainfall was the total amount of precipitation when the daily precipitation was higher than the 95th percentile of precipitation for wet days during the period of 1981–2010 and is denoted as R95P.
2.3.2. Precipitation Concentration Index
The precipitation concentration index (PCI) is an index proposed by Oliver [26] to characterize the heterogeneity of monthly precipitation. The PCI is defined as follows:
In addition, the PCI was calculated on a seasonal scale [15] for the wet season (PCIw) and dry season (PCId), which can be expressed as follows:
where PCIa and PCIw/d are the annual and wet/dry season PCI, respectively, and Pi is the total precipitation in month (i). On the annual and seasonal scales, the minimum PCI value was 8.3. In addition, a PCI value of 16.7 denoted that precipitation was concentrated within half of the period, and a PCI value of 25 indicated that precipitation occurred within 1/3 of the period [27]. Oliver [26] suggested that an annual PCI (PCIa) value less than 10 indicated a relatively uniform monthly precipitation distribution, a value from 11 to 20 indicated a seasonal precipitation concentration, and a value above 20 indicated a strongly irregular precipitation distribution. In this study, we calculated the PCIa and PCIw/d at each intensity level [28]. Additionally, we proposed the use of PCI to evaluate the runoff and sediment characteristics, which uses are denoted as RCI and SCI, respectively.
2.3.3. Precipitation Concentration Degree and Precipitation Concentration Period
The precipitation concentration degree (PCD) and precipitation concentration period (PCP) were proposed by Zhang et al. [29] to characterize the annual precipitation distribution and to determine the period in which the maximum amount of precipitation occurred. It was developed based on the assumption that the monthly total precipitation is a vector that contains both magnitude and direction and that it forms a 360° circle [30,31]. The PCD and PCP can be calculated as follows:
where PCD denotes the degree of the monthly precipitation concentration over a 12-month period, PCP represents the period in which the total precipitation is concentrated during the year, i is the month of that year, ri is the amount of precipitation in that month, θi is the azimuth of the month, and R is the total annual precipitation amount. When the annual precipitation is evenly distributed in each month of the year, the PCD value is 0. When the annual precipitation is distributed in only one month, the PCD is equal to its maximum value of 1 [32]. Furthermore, the PCP value is a direction angle of a total synthetic component, varying from 0° (January 15) to 360° [29]. In this study, we calculated the PCD and PCP at each intensity level [28]. Additionally, we proposed the use of PCD and PCP to estimate the runoff and sediment characteristics, which uses are denoted as RCD (RCP) and SCD (SCP), respectively.
2.3.4. Gini Concentration Index
The Gini concentration index (G) was proposed by Martin-Vide [33] to evaluate the inequal distribution of precipitation. It has also been used to assess the variations in the daily streamflow [16] throughout the year.
To calculate G, 1 mm was used as the precipitation class interval to classify the values in ascending order. The irregularity of the precipitation distribution was measured by the cumulative percentage of the precipitation contribution by the cumulative percentage of rainy days falling in each class. The Lorenz curve was plotted against X versus Y, which can be described as follows:
where a and b are constants that can be estimated by the least-squares method. Then, G was defined as:
where A is the area enclosed by the bisector of the quadrant, and the Lorenz curve can be evaluated as follows:
The G value ranges from 0 to 1. The greater the G value, the higher the concentrated daily precipitation [27]. Moreover, we used G to estimate the runoff and sediment concentration characteristics, which uses are denoted as RG and SG, respectively.
2.3.5. Trend Analysis
In this study, the Mann–Kendall (MK) trend test [34,35] was applied to evaluate the temporal trend of the above series. The S in the MK test can be calculated as follows:
where n is the number of data points, and xi and xj are the data values at the given time. The variance of S is defined as follows:
where m is the number of connection groups, and ti is the number of data values in group m. The standard normal variable Z is calculated as follows:
When the Z value is positive, it indicates an increasing trend, and when the Z value is negative, it indicates a decreasing trend. If the absolute value of Z is higher than 2.58, 1.96, or 1.65, the null hypothesis is rejected at the significance levels of 1%, 5%, and 10%, respectively.
The slope of the data points was evaluated using Sen’s slope [36], which can be calculated using the following formula:
where xj and xk are the data values at times j and k, respectively. A positive Qmed shows an increasing trend, and a negative value shows a decreasing trend. In this study, we multiplied Qmed by 10 to express the trend per 10 years (/10 a).
3. Results
3.1. Temporal Precipitation Characteristics
3.1.1. Annual Precipitation Characteristics
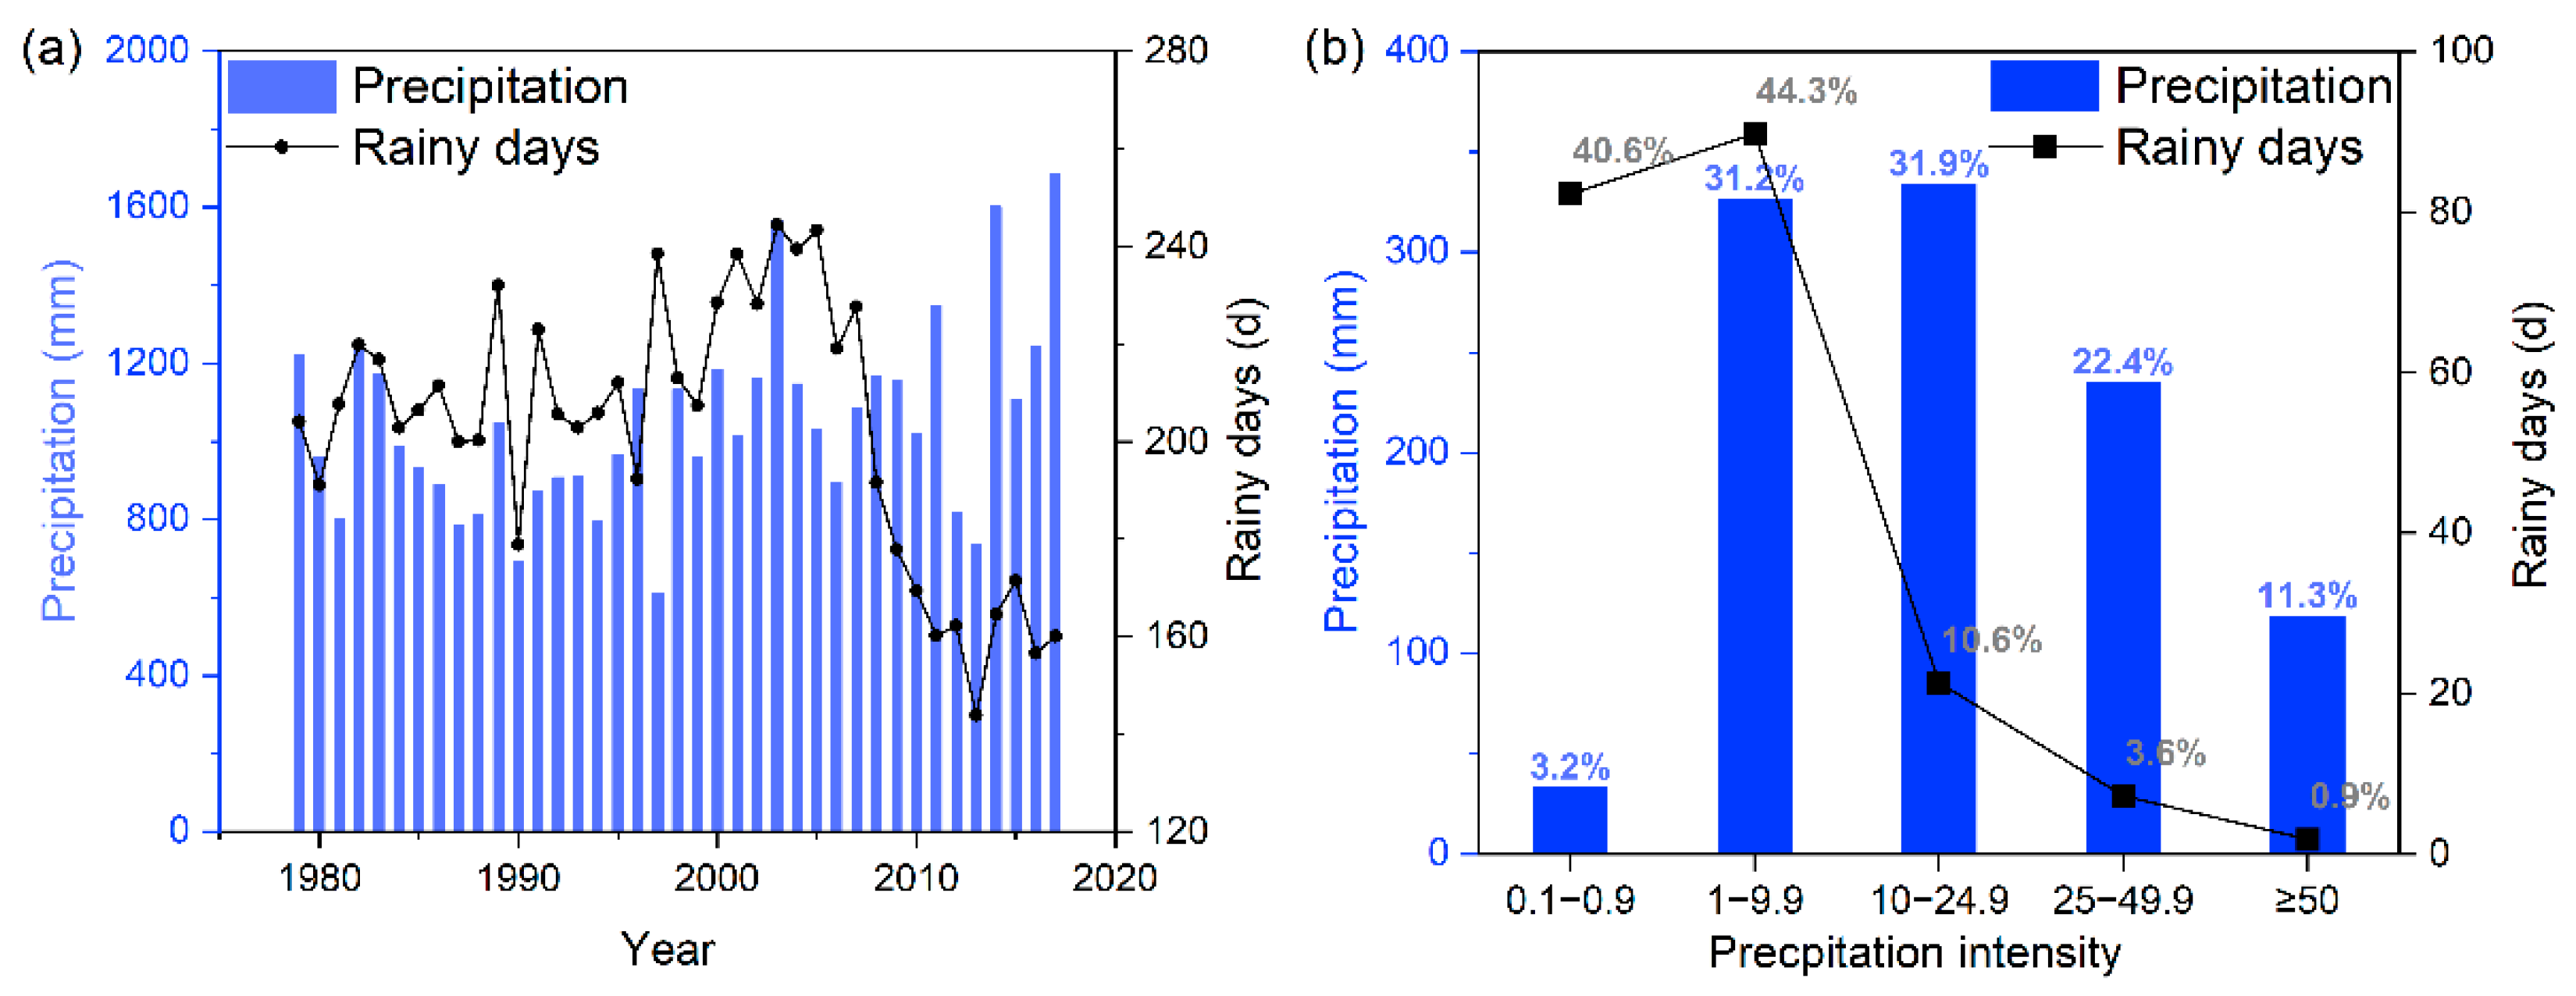
From 1979 to 2017, the average annual amount of precipitation in the Daning River basin was 1056.2 mm, and the number of rainy days was 200.9. The trends for the annual precipitation and rainy days are shown in Figure 2a. From 2008 onwards, a significant decreasing trend in the number of wet days and a slight upward trend in precipitation were observed. Figure 2b presents the annual amounts of precipitation and numbers of rainy days at each intensity level. MP (10–24.9 mm) and LP (1–9.9 mm) contributed to over 63% of the annual total precipitation. Moreover, there were significant differences in the distribution of the number of rainy days at each intensity level. The rainy days with LP and SP (0.1–0.9 mm) accounted for more than 40% of the total annual wet days, and the contribution of rainy days with MP, HP, and EP (≥50 mm) decreased as the precipitation intensity increased.
The precipitation, rainy days, and simple precipitation intensity index (SDII) trends over the Daning River from 1979 to 2017 are displayed in Table 1. Significant increasing trends were detected in the total precipitation and SDII, while a significant decrease occurred in the number of annual rainy days. A large, significant upward trend was detected for precipitation above heavy precipitation (PA25) (80.05 mm/10 a, p < 0.01), leading to an increase in precipitation throughout the year. The rainy days with SP (−7.03 d/10 a, p < 0.05) and LP (−5.36 d/10 a, p < 0.01) showed obviously negative trends, with the annual total rainy days being dominated by a downward trend. It is worth nothing that both the rainy days and the SDII with EP showed large, significantly increasing trends.
3.1.2. Characteristics of Seasonal/Monthly Precipitation
Figure 3 shows the temporal distribution patterns of the monthly precipitation and rainy days over the Daning River basin. High amounts of precipitation during the wet season were characteristic of the basin, with 61.9% of rainy days contributing to 80.5% of the precipitation. SP was uniformly distributed throughout the year, while the MP, HP, and EP were concentrated mainly in the wet season. The amount of precipitation and number of rainy days in July made a noticeable contribution throughout the year. PA25 mostly occurred in the wet season, accounting for 92.4% of the rainy days in that period.
Table 2 shows the trends in precipitation, rainy days, and SDII for the wet and dry seasons over the Daning River. Significantly increasing trends in PA25 were observed in the wet season and dominated precipitation changes in the wet season. Decreasing trends were observed in SP, LP, and MP during the wet season. In the dry season, upward trends were detected in the precipitation at each intensity level, leading to a significantly increasing trend. With the exception of the SDII of MP in the dry season, significant upward trends were observed in SDII at all intensities, and a large increasing trend was observed in the SDII of EP (3.93 (mm/d)/10 a, p < 0.01). In addition, the contributions of precipitation in the wet season showed a decreasing trend (−2.32%/10 a, p < 0.05), and a negative trend was observed in the number of rainy days (−1.91%/10 a, p < 0.01). Meanwhile, precipitation and rainy days in the dry season showed equally increasing trends. Because of the increase in high-intensity precipitation, both the dry and wet seasons became wetter, especially during the dry season in the basin.
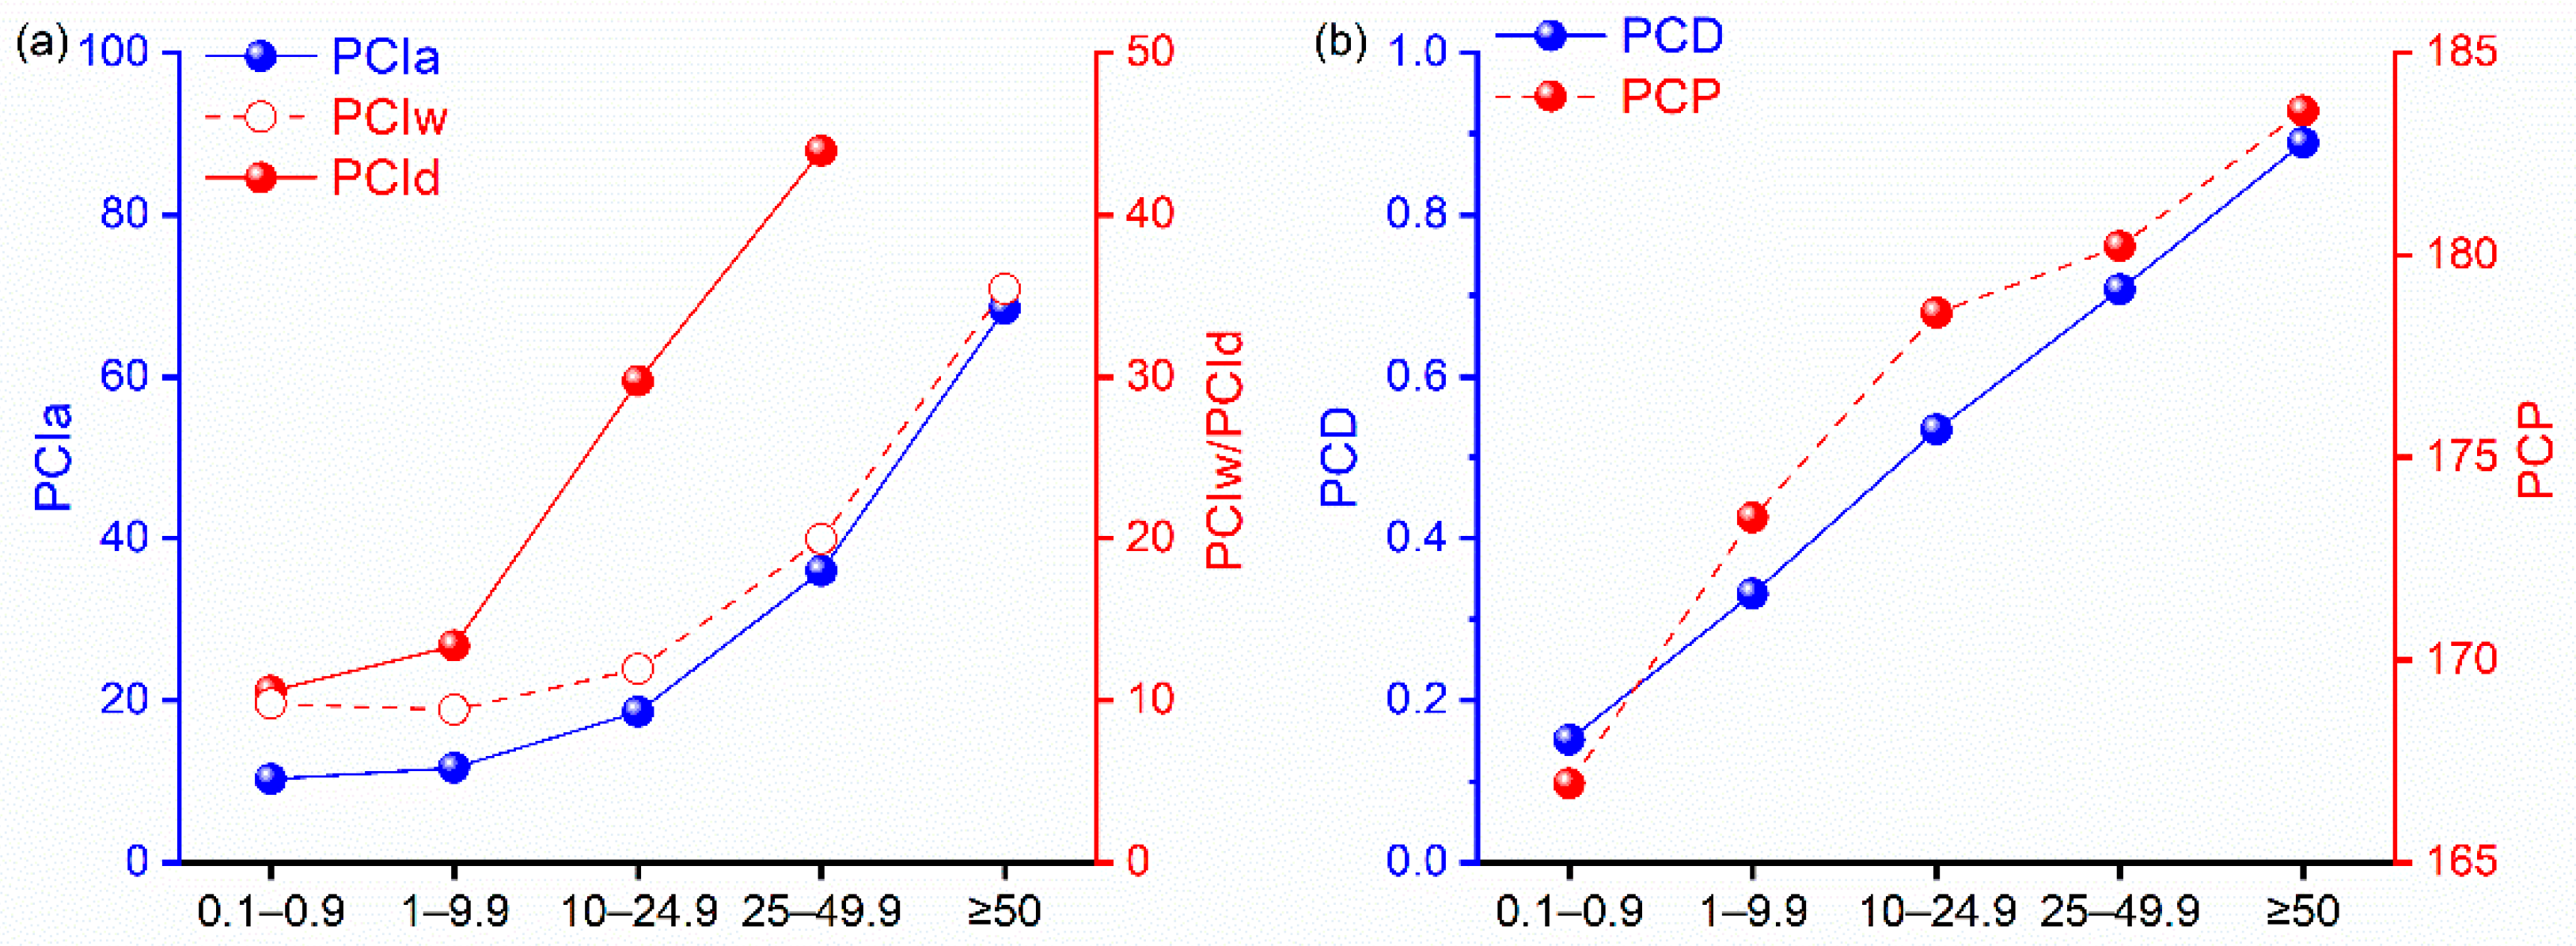
The PCI, PCD, and PCP at each intensity level were also calculated. The PCI for the annual and seasonal values at each intensity levels increased as the precipitation intensities increased (Figure 4a). Changes also occurred in the PCD and PCP values (Figure 4b). The PCIa for the total precipitation was 14.8, and the seasonal PCIs in the wet and dry seasons were 10.4 and 15.4, respectively. Both the PCIs for the annual and seasonal total precipitation values were higher than the PCI of LP and lower than the PCI of MP. The PCId values for MP (29.7) and HP (44.0) were much higher than the values for SP (10.6) and LP (13.4), which indicates that MP and HP mainly happened during a period of less than two months in the dry season. The amount of MP and HP in April accounted for 46.6% and 59.8% of the precipitation in the dry season, respectively, explaining the above results. There were some differences in the change in the values of the PCD at the different intensities. The average total annual precipitation of the PCD was 0.49, and no significant differences were observed in the greater PCD values of the higher intensities. In addition, the PCP values increased at higher intensities. For the PCP, the average annual total precipitation was 179.5°, and the PCP values varied from 166.9 to 183.6° in the intensities increased. This indicates that the concentration period occurred from 18 June to 6 July.
3.1.3. Relationships between Concentration and Amount
To better understand the various precipitation concentration indices, the correlations between the amounts of precipitation at each intensity and their PCI, PCD, and PCP values were analyzed and are shown in Table 3. No significant correlations were observed between the annual total precipitation and the PCI and PCD. However, the amount of precipitation at each intensity demonstrated a significant negative correlation to the PCI and PCD, indicating that there was more precipitation with a more uniform precipitation distribution. The precipitation had a larger correlations with the PCI than with the PCD at each intensity level. Meanwhile, there was a significant positive correlation between the annual total precipitation and the PCP, indicating that more precipitation led to the concentration period being later. However, at various intensity levels, the relationship with precipitation was weak. The correlations between the PCI and PCD at the same intensity levels showed significant positive trends and coefficients ranging from 0.581 to 0.738, suggesting that there were still some differences between the PCI and PCD.
In addition, the correlations between the PCI and PCD and the contribution of the maximum amount of monthly precipitation, as well as those between the PCI and PCD and the amount of precipitation in the wet season, were compared. There was a significantly positive correlation between the PCI and the contribution of the maximum amount of monthly precipitation (r = 0.89, p < 0.01), while of the correlation with the contribution of precipitation during the wet season was weak (r = 0.47, p < 0.01). Meanwhile, there was a significantly positive correlation between the PCD and the contribution of precipitation during the wet season (r = 0.82, p < 0.01), while that between the PCD and the maximum amount of monthly precipitation was weak (r = 0.48, p < 0.01). The PCI was greatly affected by the maximum amount of monthly precipitation, while the PCD was dominated by the seasonal precipitation. This result may explain the limited correlations between the PCI and PCD. Therefore, the PCI was defined as the concentration index at the monthly scale, and the PCD was defined as the concentration index at the seasonal scale.
3.2. Variation of the Vegetation Cover
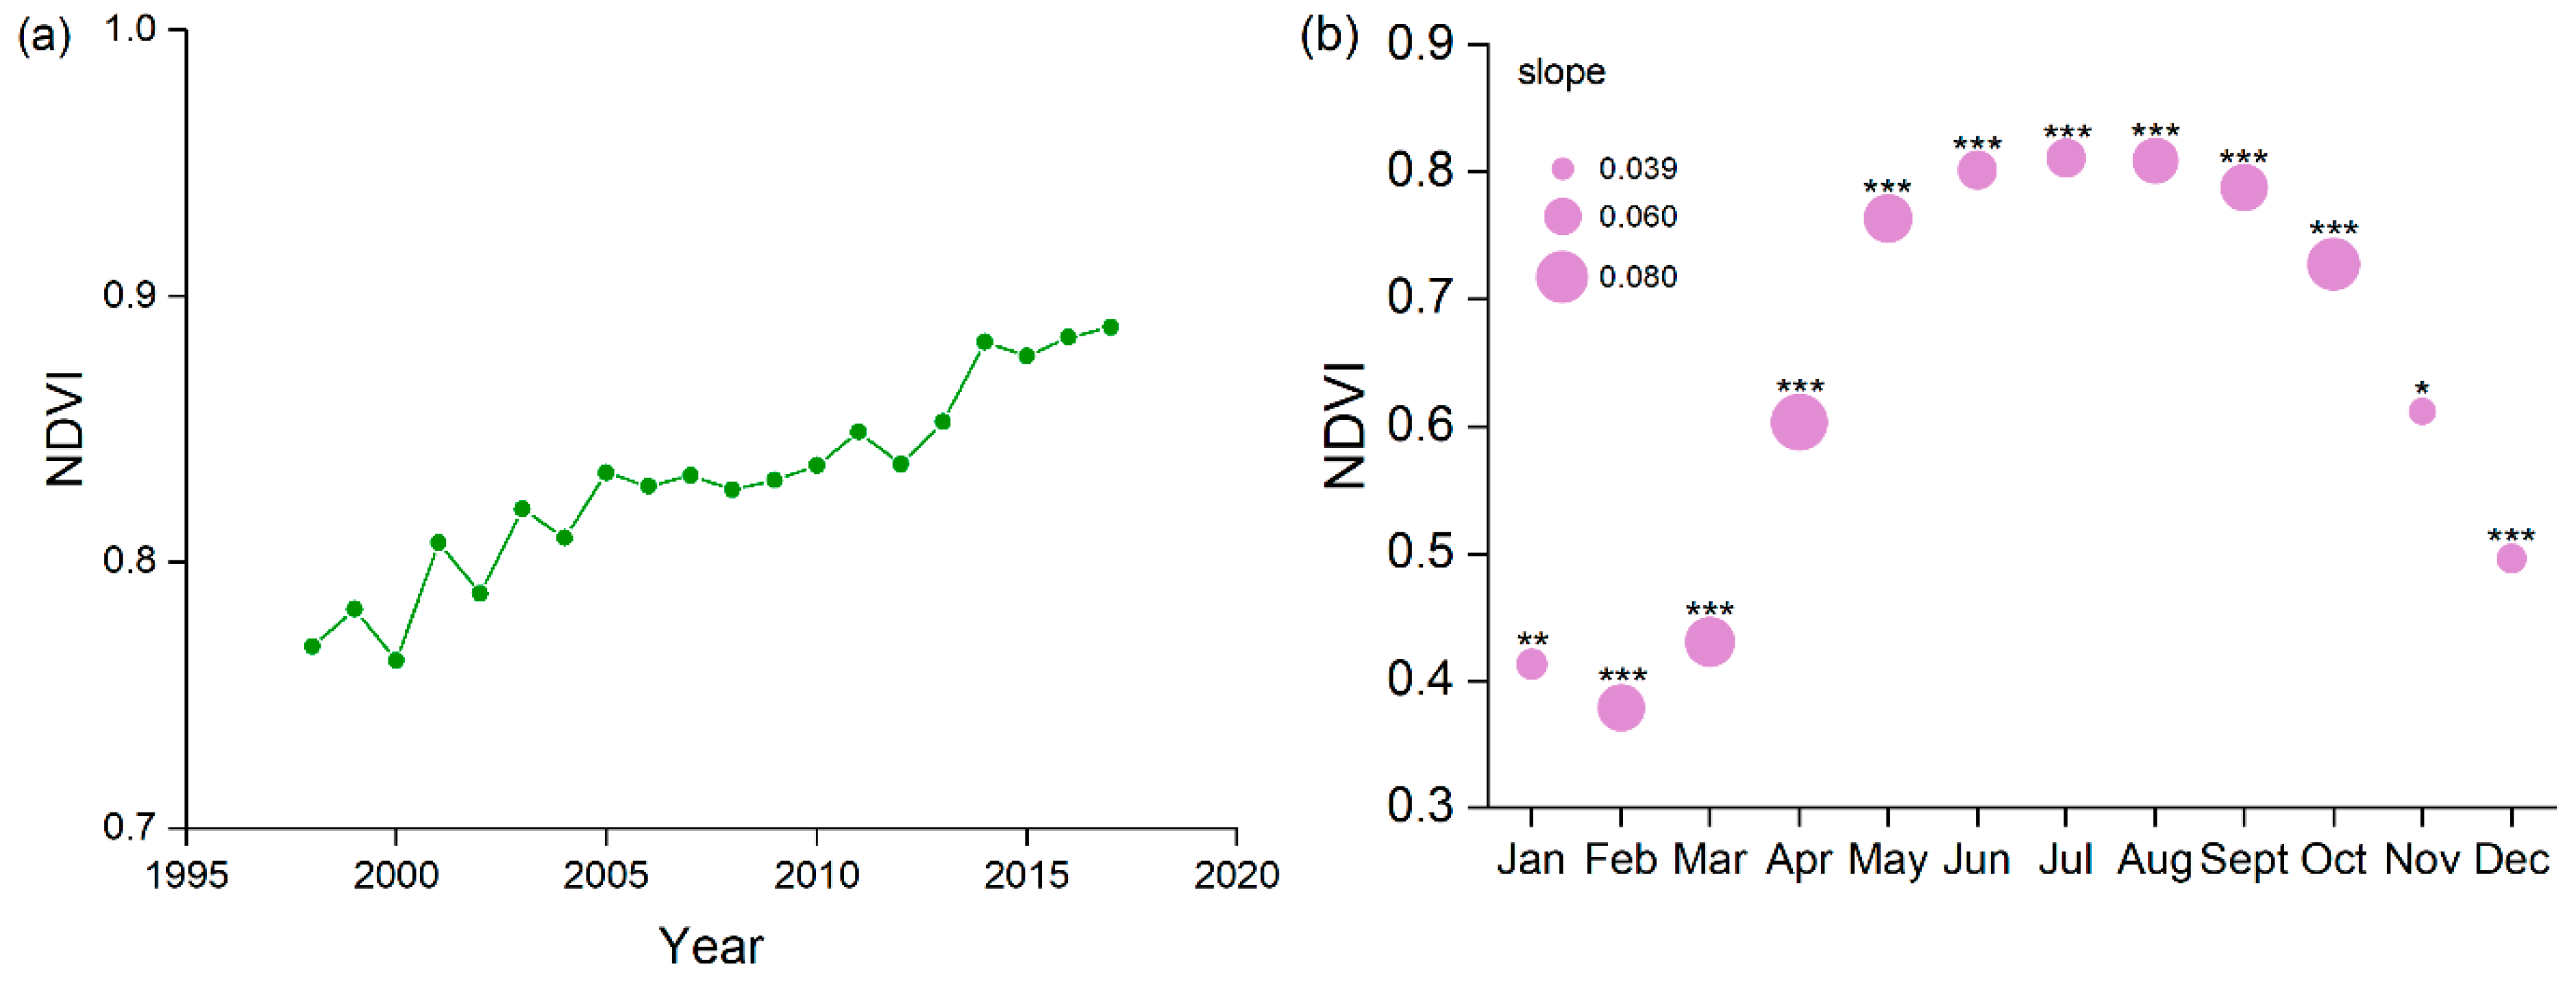
Figure 5a indicates that the annual mean NDVI over the Daning River basin showed a significant upward trend, with a slope of 0.058/10 a (p < 0.01) from 1998 to 2017. The annual NDVI was between 0.763 and 0.888. From 1998 to 2005, the value of the NDVI demonstrated a sharp increasing trend, and the increasing trend slowed from 2006 to 2013. After 2014, the NDVI value increased to 0.880. The monthly NDVI also indicated significant increases in each month (Figure 5b). In the wet season, the monthly NDVI values were higher than 0.728. The highest NDVI value was 0.811 in July, and the lowest NDVI value was 0.379 in February. The NDVI increased the most in April, with a slope of 0.080/10 a (p < 0.01).
Figure 6 displays that the rainy days at the different intensities and the PCI of SP had significant correlation relationships with the NDVI in the Daning River basin, while the amount of precipitation had no significant correlation with the NDVI. The annual NDVI value exhibited a significantly positive correlation with the PCIw of SP (r = 0.67, p < 0.01) but a significantly negative correlation with the rainy days with SP and LP (r = − 0.63–0.66, p < 0.01). There were significant correlations between the NDVI in the wet season (May to October) and the characteristics of SP. Meanwhile, we found that the NDVI value was positively correlated with the rainy days with EP (r = 0.52, p < 0.05). The rainy days with PA25 showed significant correlations only in a few months.
3.3. Characteristics of Runoff and Sediment
3.3.1. Annual Runoff and Sediment
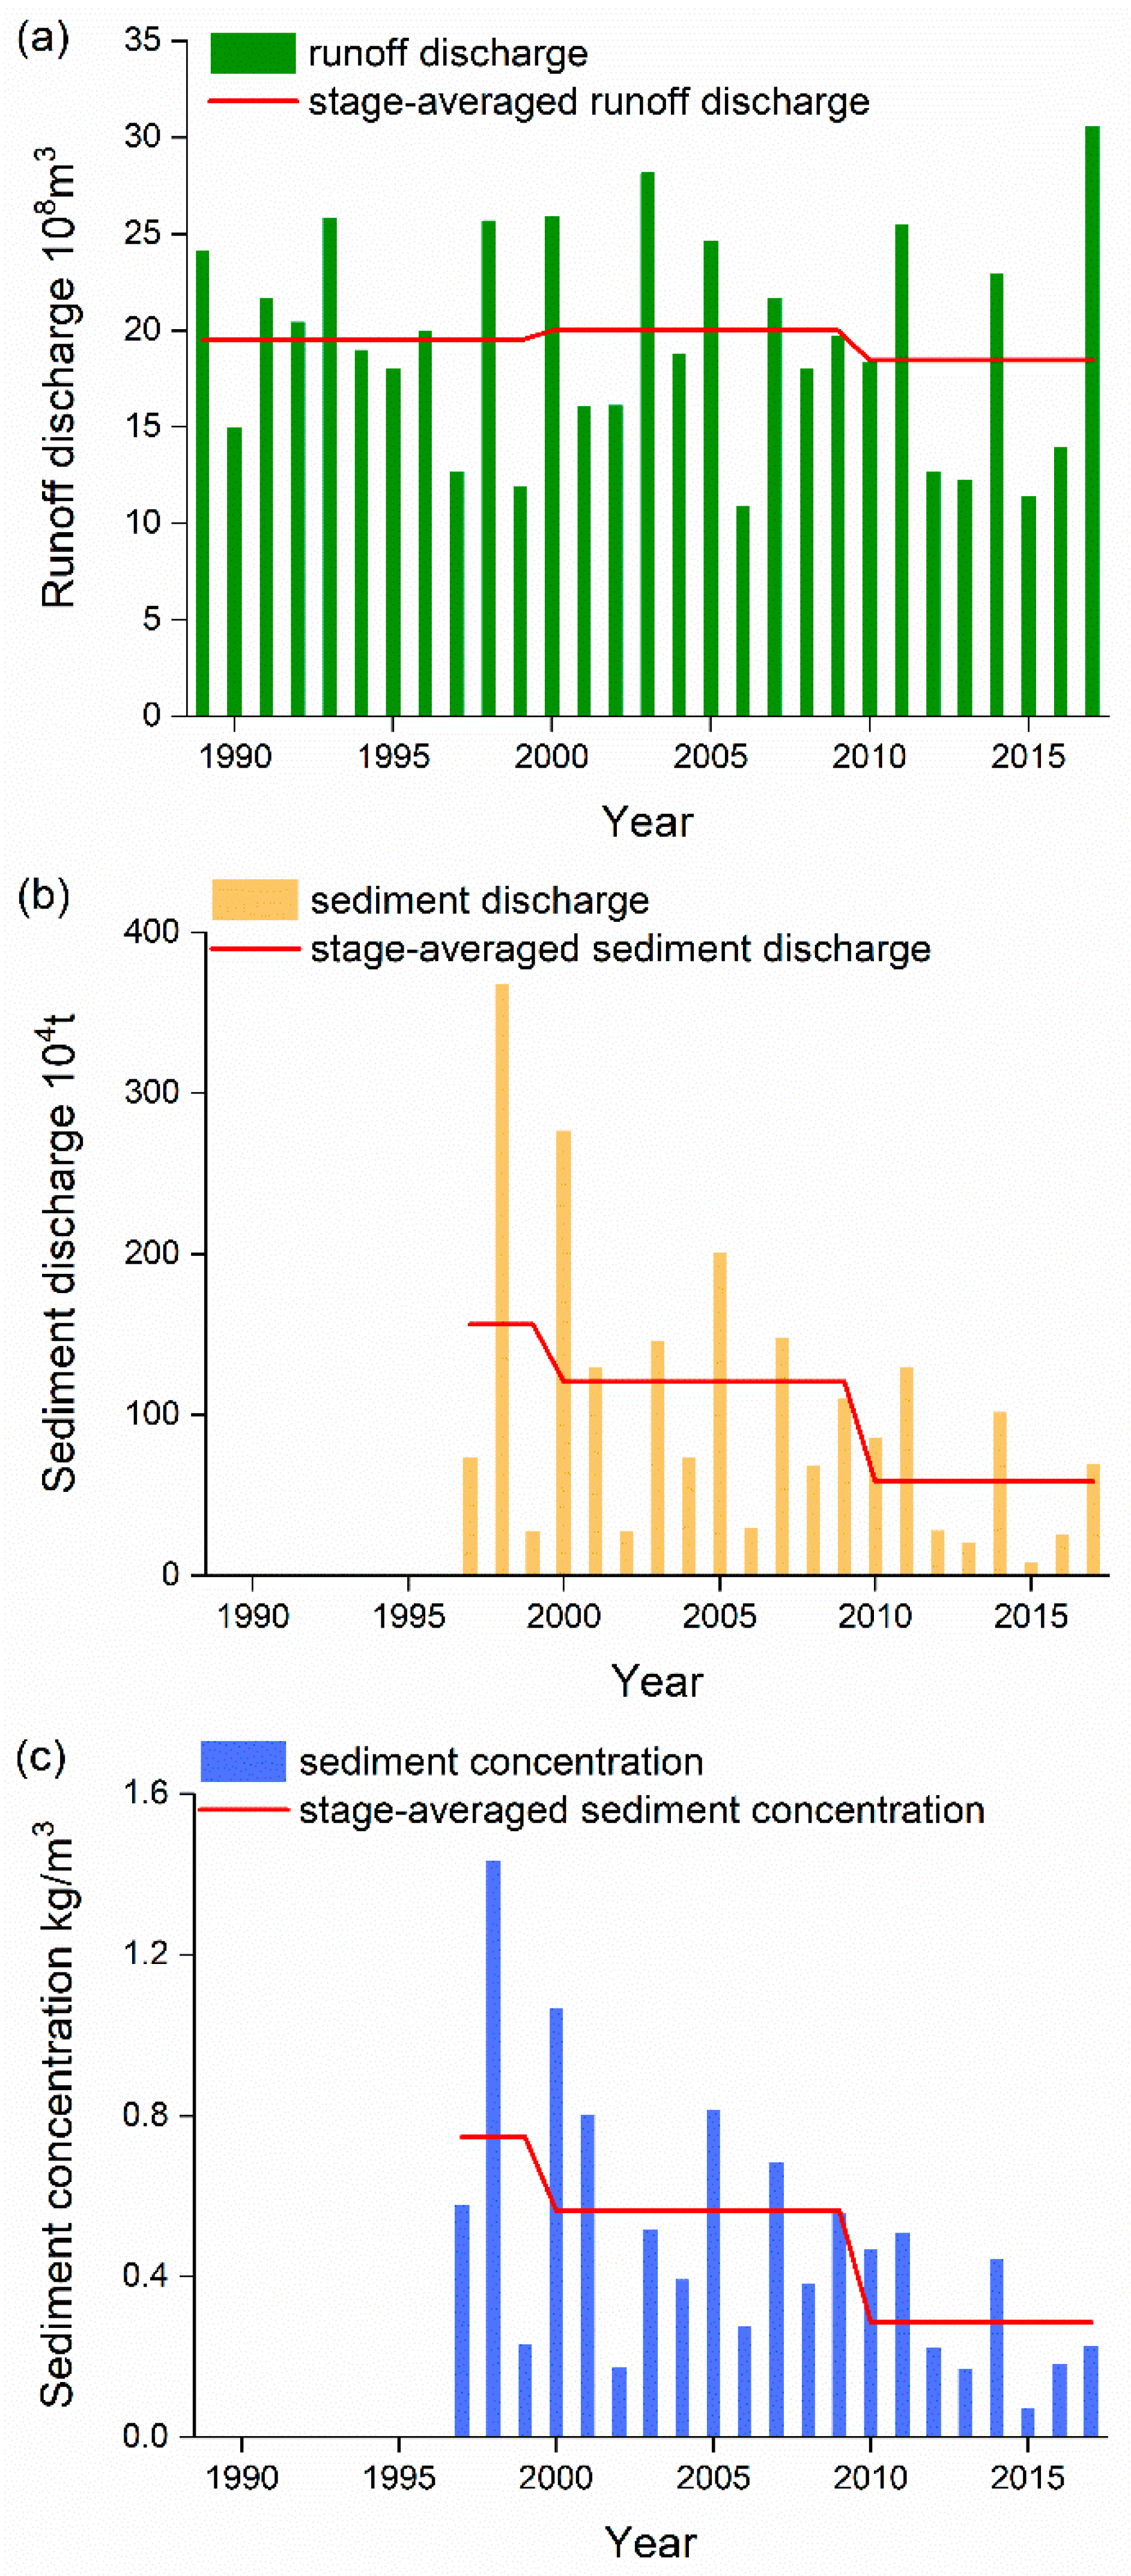
To determine the temporal variation in the water and contaminant carrier discharge in the Daning River basin, the runoff and sediment records of the Wuxi hydrological station were used to characterize the changes. Figure 7 showed slight variation in the annual runoff from 1989 to 2017, and its coefficient of variation was 0.28. The difference in the runoff in different years was less than 1 × 10⁸ m³. Significant changes were observed in the sediment discharge, and the coefficient of variation of the sediment discharge was 0.89. The annual average sediment discharge reduced from 186.3 × 10⁴ t in 1997–2000 to 58.4 × 10⁴ t in 2010–2017, decreasing by 63.6%. The results of the MK test showed that annual sediment discharge exhibited a significant downward trend (−53.9 × 10⁴ t/10 a, p < 0.1). Meanwhile, there was a significant decreasing trend observed in the sediment concentration (−0.293 (kg/m3)/10 a, p < 0.01). It can be preliminarily judged that decreases in sediment discharge were mainly caused by a decreasing trend in the suspended sediment concentration rather than a change in the amount of water discharge.
3.3.2. Seasonal/Monthly Runoff and Sediment
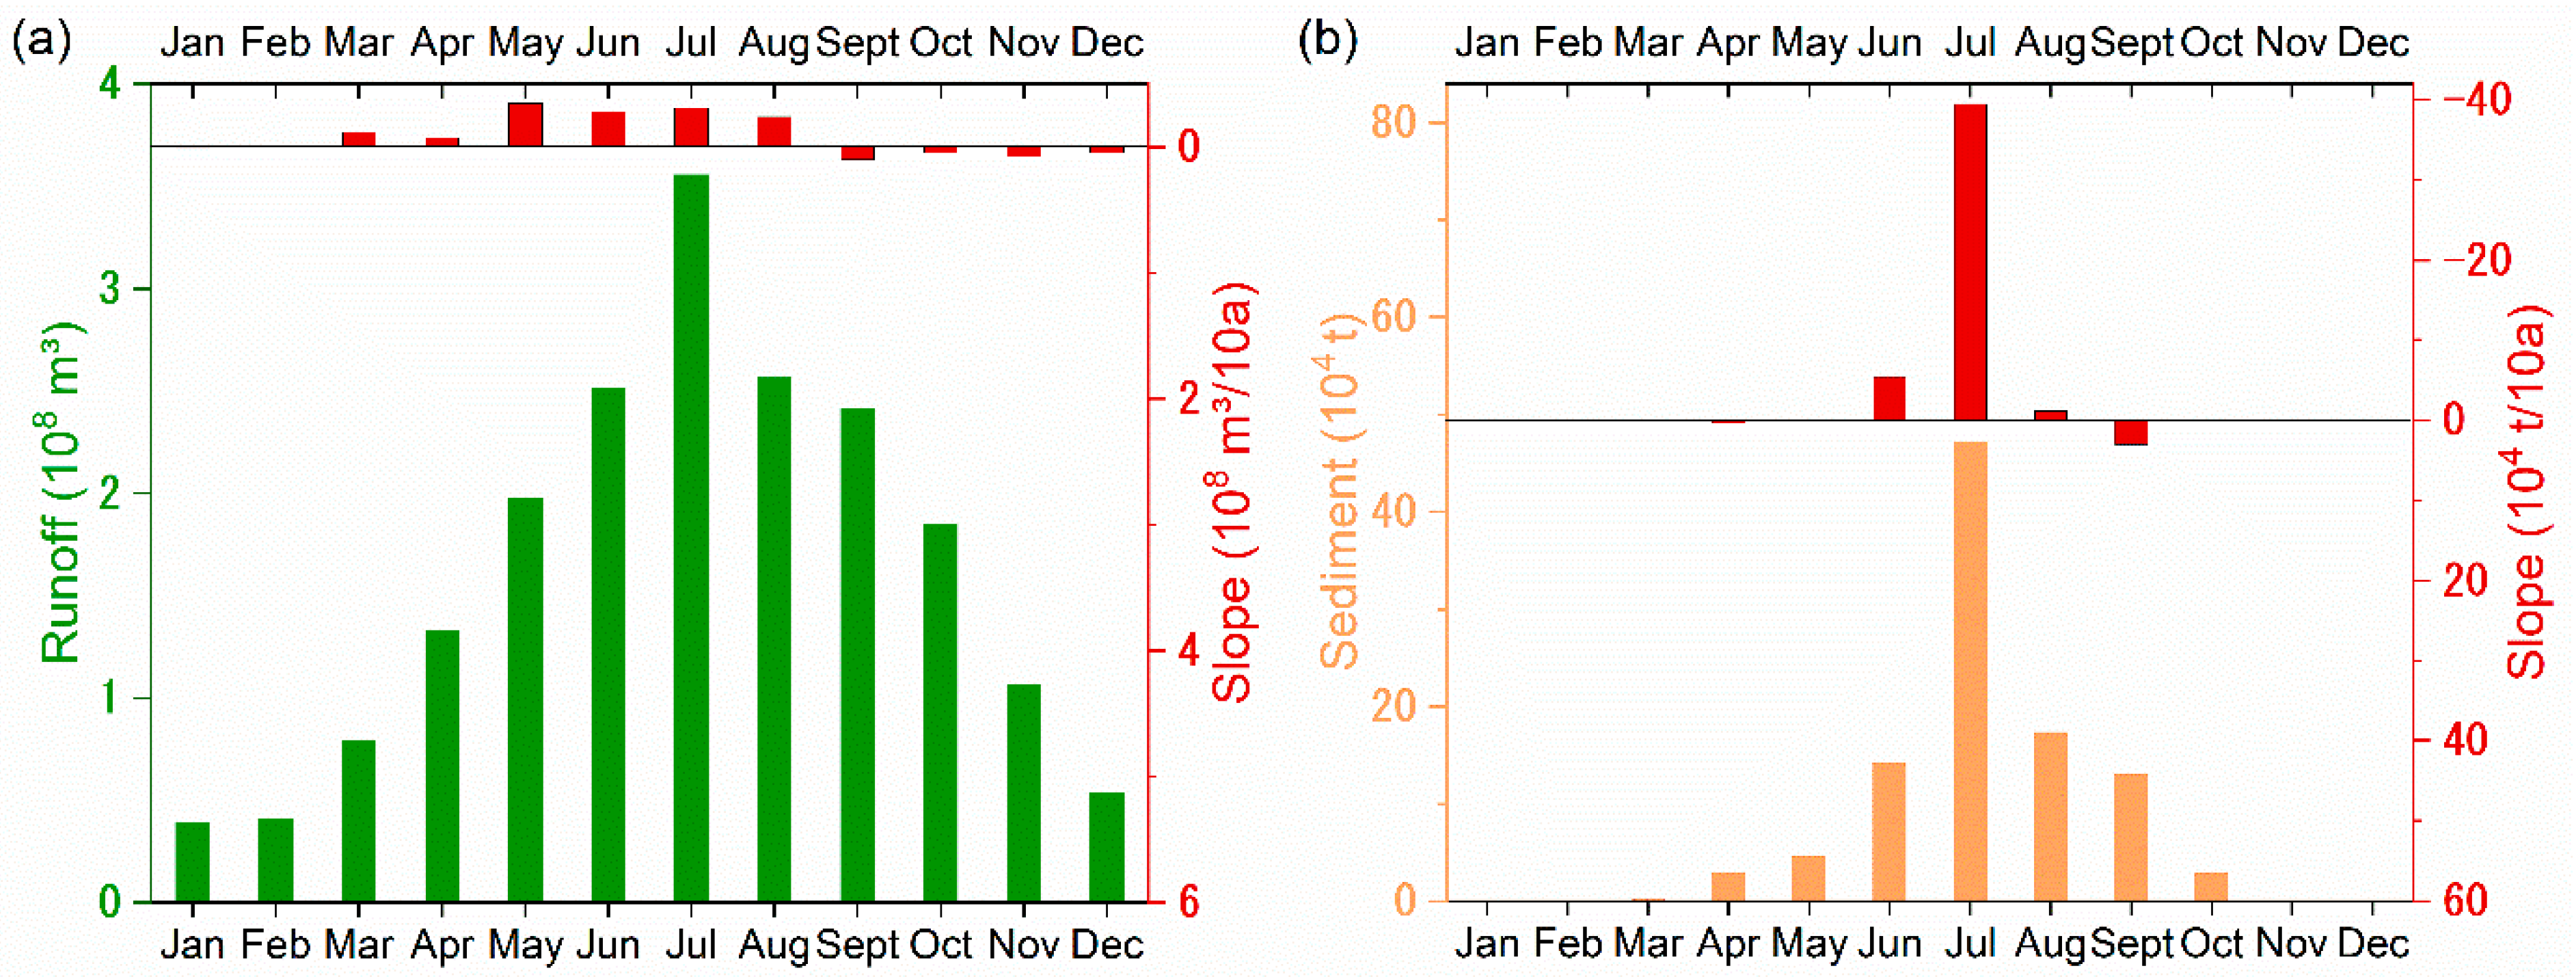
In terms of runoff and sediment discharge, there were obvious differences between the wet and the dry seasons, especially for sediment discharge (Figure 8). The amount of runoff during the wet season accounted for 76.7% of the runoff during the whole year, and the largest amount of monthly runoff was observed in July, when the proportion was 18.3%. The amount of sediment during the wet season accounted for 97.1% of the sediment discharged during the whole year, and the sediment discharged in July accounted for 46.2% of the sediment discharged during the whole year. The variation trends (Figure 8) showed that the runoff from March to August exhibited decreasing trends and that the amount of runoff in May was significantly decreased (−0.343 × 10⁴ t/10 a, p < 0.1). The monthly sediment discharge from June to August also showed downward trends, and a significant slope (−39.5 × 10⁴ t/10 a, p < 0.05) was detected from the sediment in July.
3.4. Response of Runoff and Sediment to the Changing Environment
3.4.1. Response of Sediment to NDVI
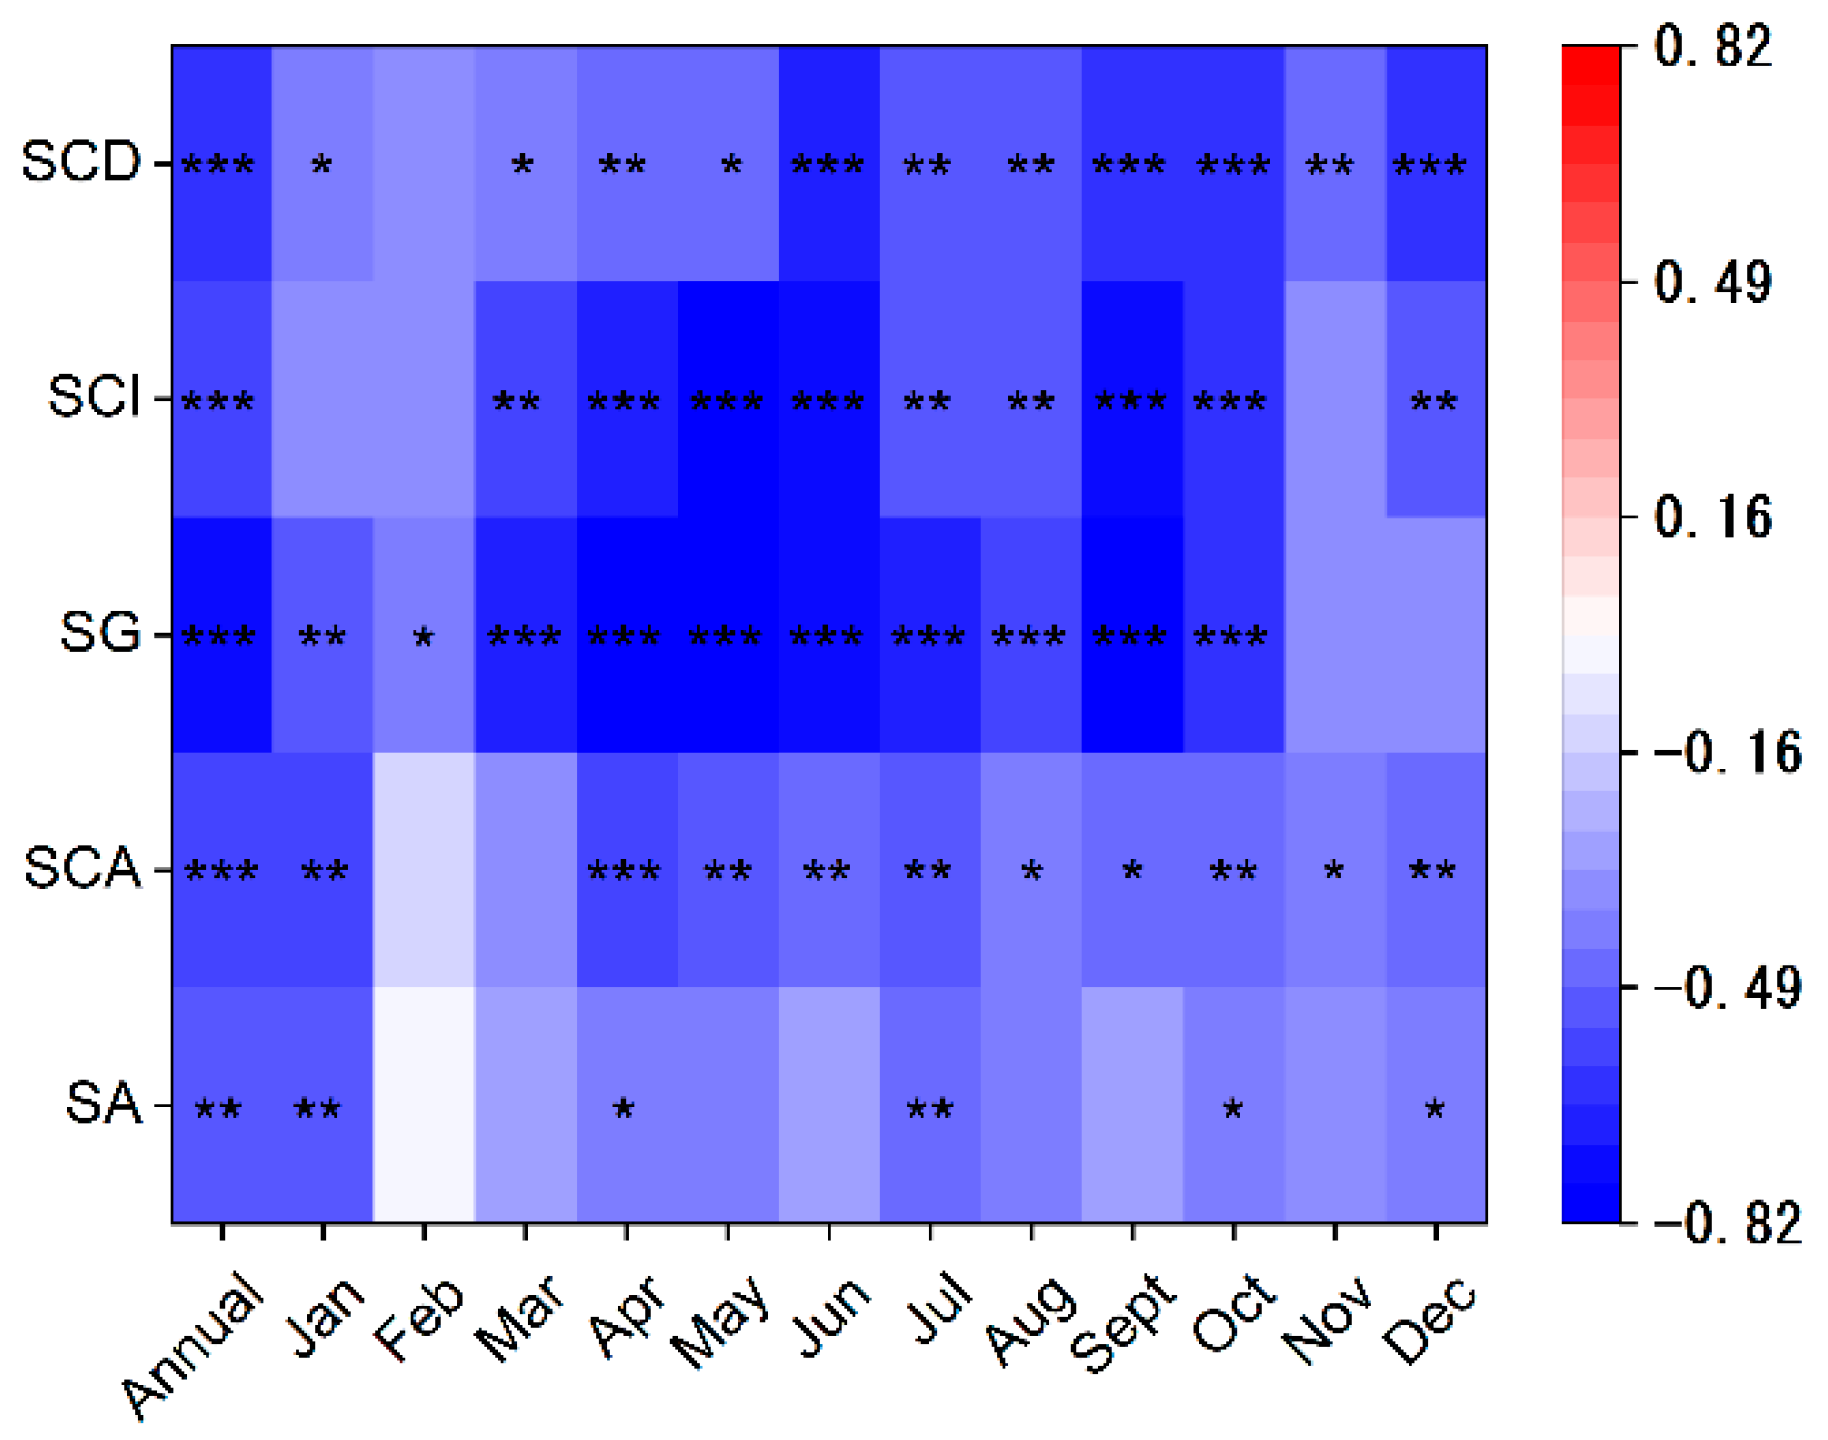
Negative correlations were observed between the annual sediment discharge (SA), annual suspended sediment concentration (SCA), and the annual and monthly NDVI values, and among these, the sediment concentration correlated most significantly with NDVI (r = −0.58, p < 0.01) (Figure 9). We also found that there were significant correlations between the NDVI and sediment concentration at different time scales. The SG for the daily sediment concentration exhibited higher correlations with the NDVI than the SCI and SCD did, and the highest correlation coefficient was observed in May (r = −0.82, p < 0.01). Higher NDVI values indicate better vegetation coverage and a more uniform sediment concentration. However, the amount of runoff and its concentration indices showed no significant correlations with the NDVI values. The growth of vegetation had a greater influence on the sediment distribution than runoff.
3.4.2. Response of Runoff and Sediment to Precipitation
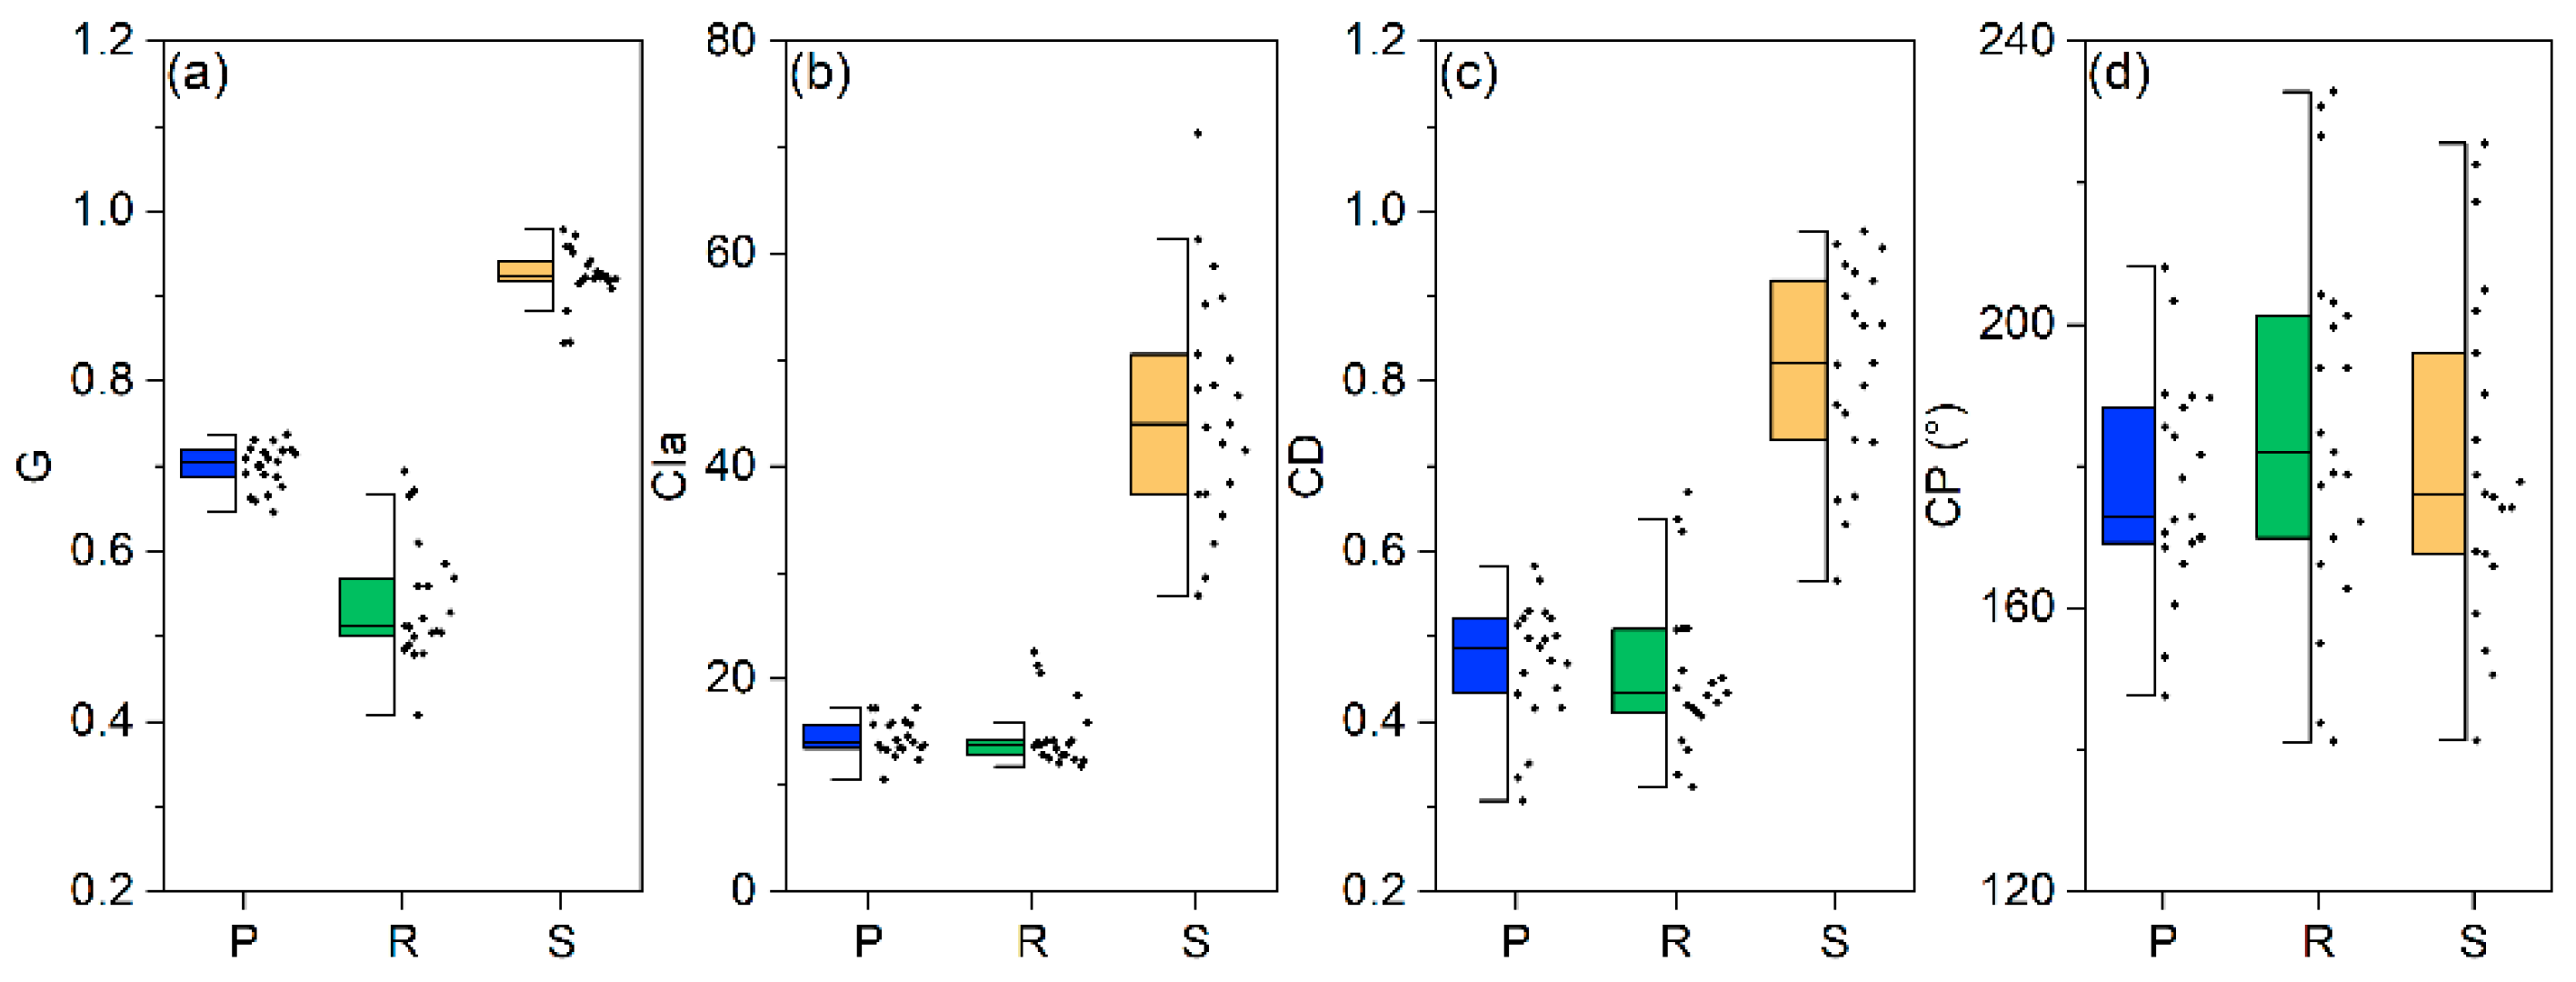
Figure 10 shows the G, CIa, CD, and CP for precipitation, runoff, and sediment behaviors. A clear difference was highlighted by the values of the concentration indices, which indicated the distribution characteristics of precipitation, runoff, and sediment. The G values of daily precipitation, runoff, and sediment were 0.700, 0.540, and 0.924, respectively, from 1997 to 2017. Similarly to the G values, an order was observed in the CIa and CD: runoff < precipitation < sediment. The PCIa was almost equal to the RCIa. The concentration indices of sediment were much higher than those for precipitation and runoff on both the daily and seasonal scales. However, the CD values for precipitation, runoff, and sediment were 177.2°, 185.7°, and 181.2°, respectively. Unlike the concentration distribution, the order of the CD values was precipitation < sediment < runoff, and their concentration period occurred later or earlier in different years.
We also analyzed the variation trends in the concentration index for precipitation, runoff, and sediment over the Daning River basin (Table 4), and the results exhibited various trends. The trends in the concentration indices for sediment were significantly decreasing, while the trends for precipitation and runoff were very weak. The PCD presented a significantly decreasing trend, indicating that the seasonal distribution of the precipitation was more uniform. However, opposite and insignificant trends were observed in the distributions of the daily precipitation and monthly precipitation. The concentration indices of runoff on the different time scales also showed various trends, and the changes were not completely consistent with the changes in the precipitation concentration indices. The G, CI, and CD values for sediment displayed significant downward trends, suggesting that the sediment distribution on the daily, monthly, and seasonal time scales was becoming even.
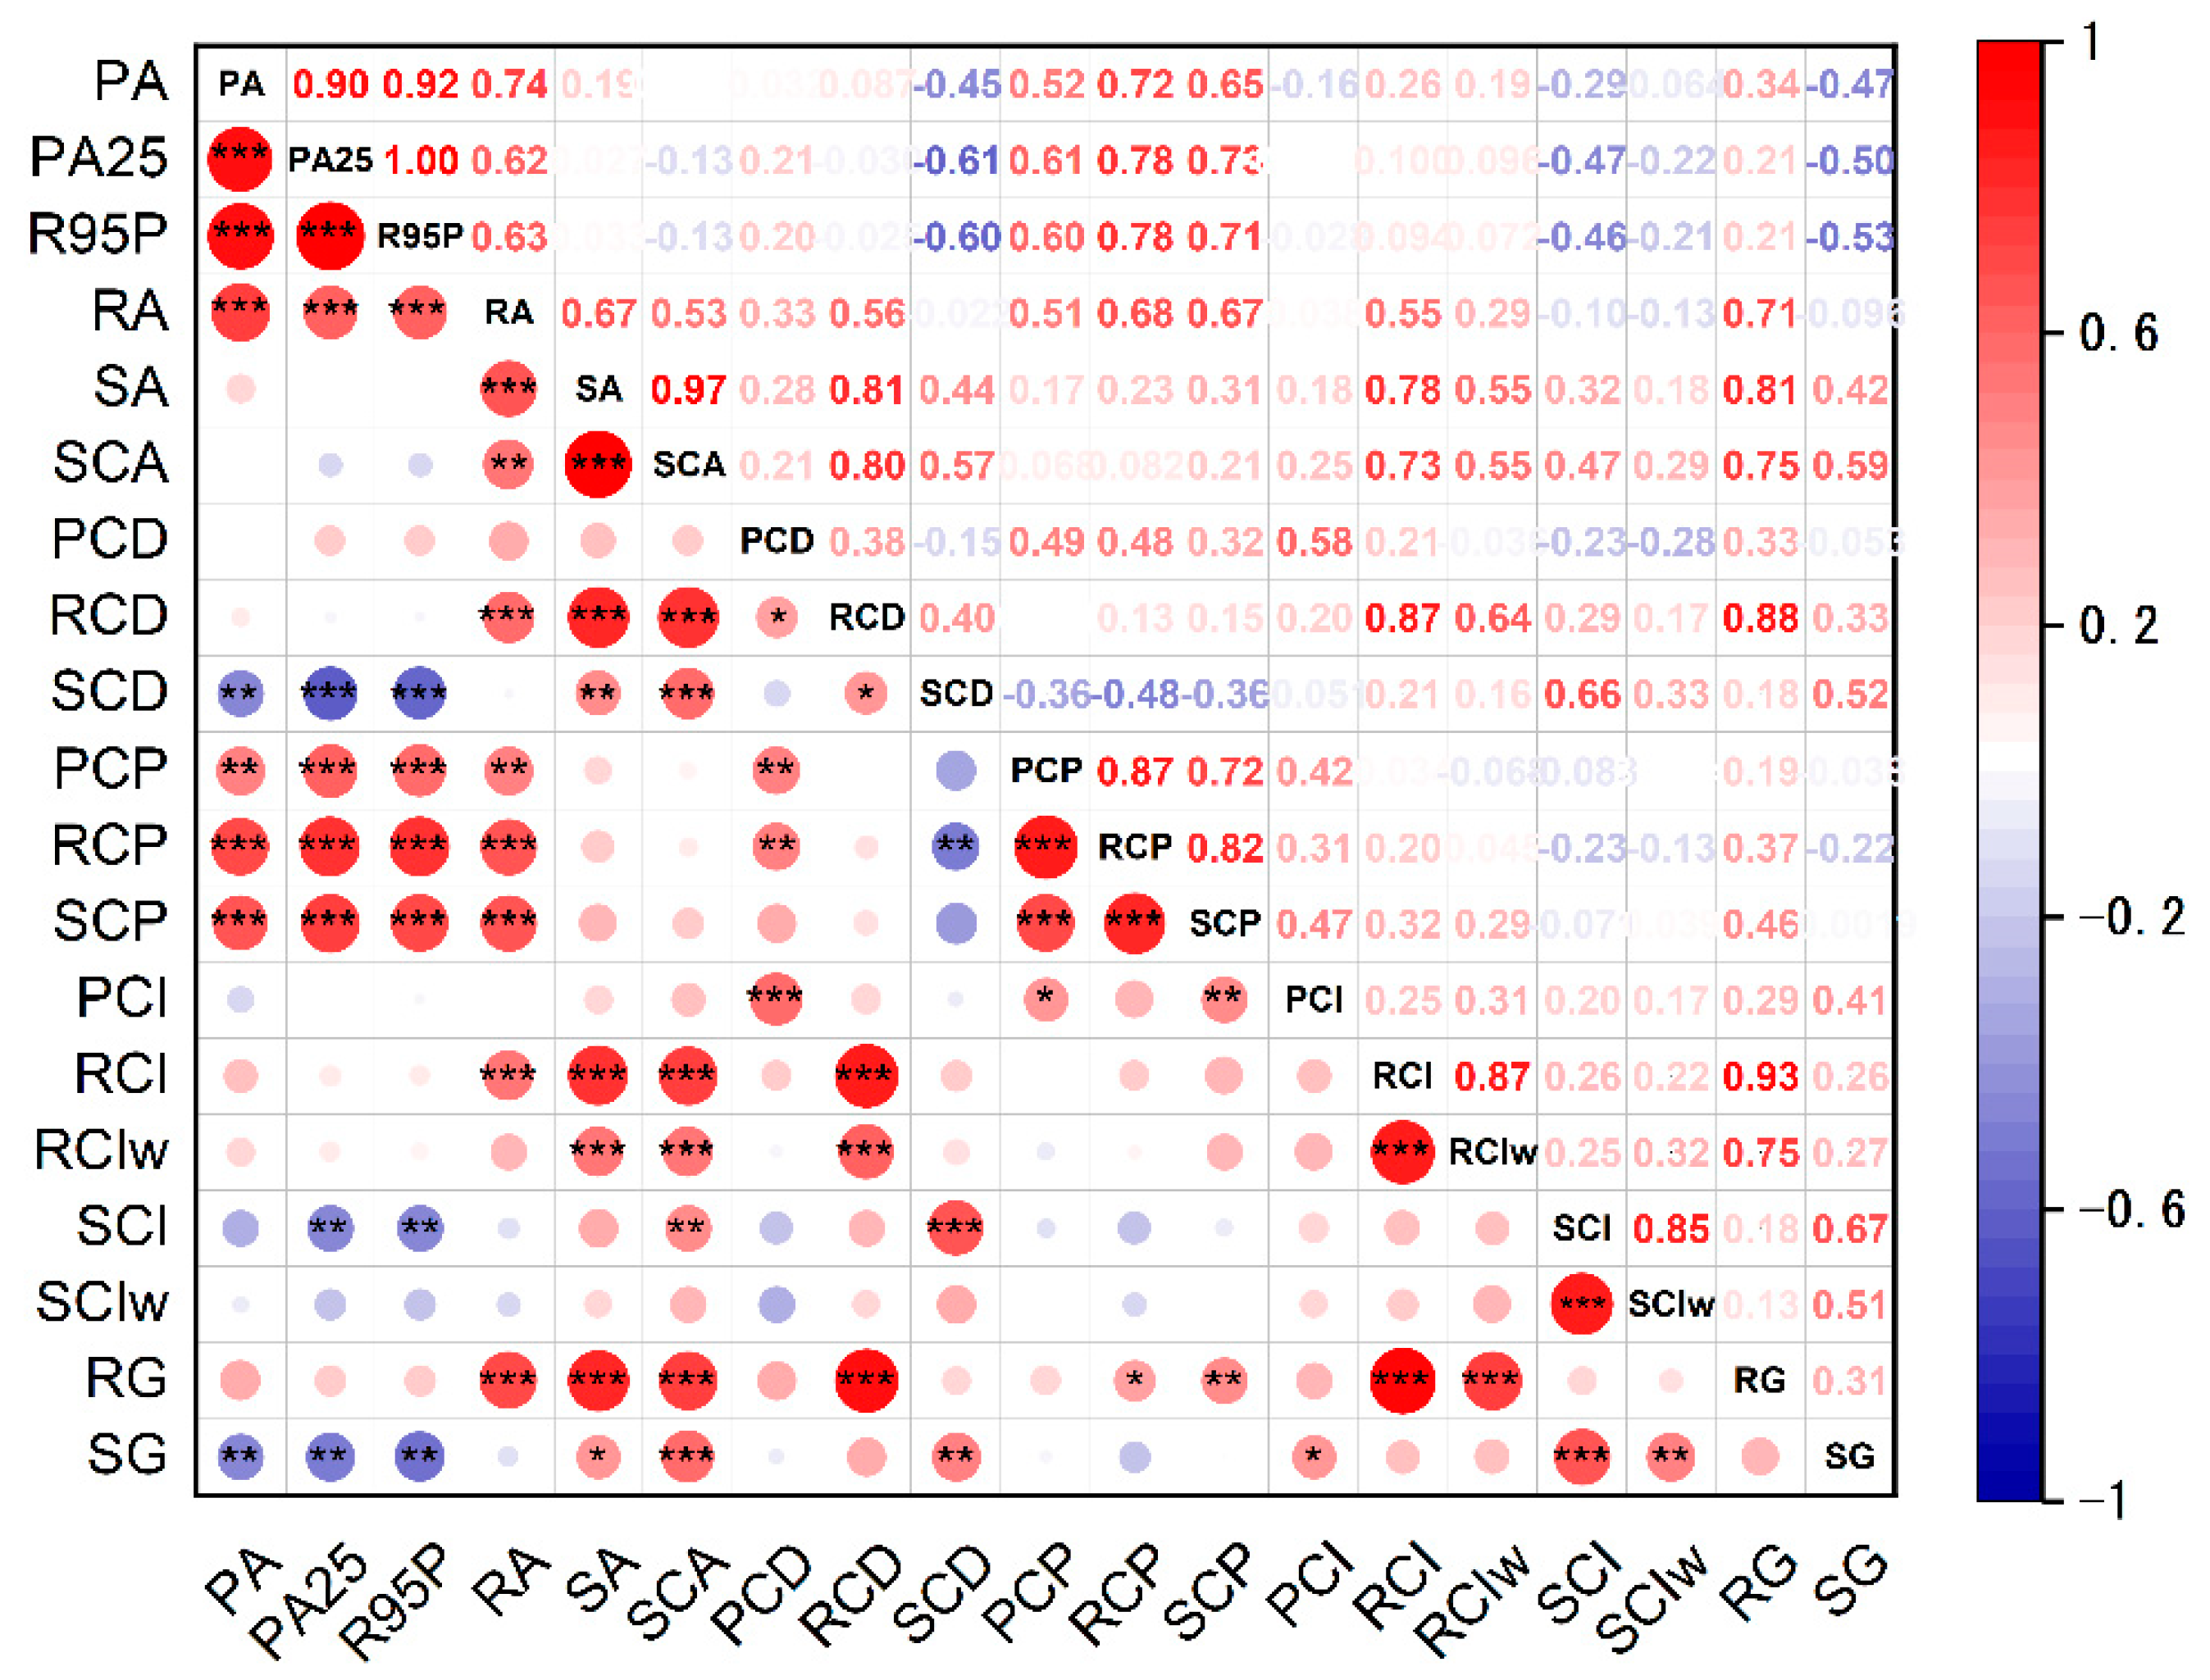
The correlation analysis for the amounts of precipitation, runoff, and sediment discharge and their concentration indices in the Daning River basin are shown in Figure 11. A highly positive correlation (nearly to 1) between PA25 and R95P was detected, which indicated that the R95P consisted almost entirely of HP and EP. The annual precipitation (PA), PA25, and R95P were significantly positively correlated to the annual runoff (RA), which suggests that a higher amount of precipitation led to a higher amount of runoff. Furthermore, strong significant correlations were detected between the precipitation and concentration periods (PCP, QCP, and SCP), indicating larger amounts of precipitation occurring during the later concentration periods for precipitation, runoff, and sediment. In addition, we found significant negative correlations between precipitation and the concentration of sediment at the seasonal, monthly, and daily scales, which suggests that more precipitation resulted in a more even sediment distribution.
Compared with the precipitation characteristics, significant positive correlations were observed between runoff and its concentration degree at the daily, monthly, and seasonal scales, indicating that higher runoff led to a more concentrated distribution. The sediment displayed weak correlations with the concentration indices, while the SCA was significantly correlated with the RCD, RCI, and RG. This indicates that higher runoff concentrations at the daily, monthly, seasonal scales led to higher SCA. It also suggests that the concentration of annual sediment discharge was more easily affected by the sediment concentration. There was a positive correlation among the concentration periods of precipitation, runoff, and sediment (r= 0.72–0.87, p < 0.01), which indicates that the PCP, RCP, and SCP were influenced and changed by various factors.
4. Discussion
Precipitation characteristics have a very important effect on runoff and sediment behavior. In the Daning River basin, the amount of precipitation is less than that in the lower basins of the Yangtze River, and the number of rainy days is similar to that in most of the areas in the middle and lower reaches of the Yangtze River [30]. Similarly as in most regions of China, the frequency of light precipitation in the basin is decreasing [37,38,39]. Additionally, it has been reported that the weakening atmospheric stability caused by global warming is the reason for the reduction in light precipitation [40] and is also responsible for the increase in heavy precipitation [41]. According to the correlation analysis, there was a strong, significant negative correlation between SP and its PCI (PCI0). The PCI0 detected a significant increasing trend. Based on the above reason, the drier days and larger precipitation events provide favorable conditions for the growth of vegetation, especially during the vegetation growing season.
Vegetation cover is influenced by various factors, including climate factors, such as precipitation, and human activities. Since the implementation of the ″Changzhi Project″ over the upper and middle reaches of the Yangtze River, the vegetation cover of the upper regions of the Yangtze River, including in the Three Gorges Reservoir area, has been greatly improved [42]. Although the NDVI did not display an immediate response to total precipitation, there was good agreement between NDVI and the antecedent precipitation index. In the monsoon climate, the NDVI showed a good correlation with lightly and moderately wet days [43]. The response characteristics of the NDVI to precipitation are different under different climatic conditions [44]. Similar patterns were found between the NDVI and extreme precipitation [45]. Precipitation and anthropogenic activities have a significant influence on variations in the NDVI in the Three Gorges Reservoir [46].
5. Conclusions
The runoff and sediment characteristics in the Daning River basin are influenced by changes in precipitation and vegetation cover. As water and sediment are the main carriers of water pollutants, analyzing the distribution characteristics of the precipitation, runoff, and sediment is important for nonpoint water pollution prevention and control in the Three Gorges Reservoir area. In this study, the temporal characteristics of the changes in precipitation, runoff, and sediment concentration on the daily, monthly, and seasonal scales were analyzed, as were the relationships within those scales. The following conclusions can be drawn:
Slight precipitation showed a significantly decreasing trend in the basin, while heavy and extreme precipitation displayed significantly increasing trends, presenting higher rainfall erosivity and a higher risk of flooding. This indicates that there will be an increased risk of pollutants being carried in the river channel.
The concentration analysis indicated a higher precipitation intensity as well as a higher concentration value (PCI and PCD). It was also observed that more precipitation at each intensity level resulted in more even distributions. At different time scales, the same order in the concentration indices was observed: runoff < precipitation < sediment. Sediment had a higher degree of concentration than the other factors.
Because of the changes in the precipitation characteristics and the implementation of vegetation restoration projects, vegetation cover has increased significantly. The reduction in the concentration degrees of sediment on the daily, monthly, and seasonal scales and the total amount of sediment discharge have a positive effect on soil conservation.
This research is helpful for water and soil conservation and improvement of the water treatment process. It provides valuable support for the development of the ecological environment in the Three Gorges Reservoir area.
Author Contributions
Conceptualization, data curation, formal analysis, software, writing—original draft, Y.L.; writing—review and editing, D.Y., A.W. and Z.S. All authors have read and agreed to the published version of the manuscript.
Funding
This research was funded by the National Key Research and Development Program of China (2016YFC0402301-02).
Institutional Review Board Statement
Not applicable.
Informed Consent Statement
Not applicable.
Data Availability Statement
Not applicable.
Conflicts of Interest
The authors declare no conflict of interest.
Abbreviations
| CD | concentration degree, including PCD, RCD, and SCD |
| CIa | concentration index on an annual scale, including PCIa, RCIa, and SCIa |
| CId | concentration index for the dry season, including PCId, RCId, and SCId |
| CIw | concentration index for the wet season, including PCIw, RCIw, and SCIw |
| CP | concentration period, including PCP, RCP, SCP |
| EP | extreme precipitation, the daily precipitation ≥ 50 mm |
| G | Gini concentration index, defined as Formula (7) |
| HP | heavy precipitation, the daily precipitation is 25–49.9 mm |
| LP | light precipitation, the daily precipitation is 1–9.9 mm |
| MK | the Mann–Kendall trend test |
| MP | moderate precipitation, the daily precipitation is 10–24.9 mm |
| NDVI | normalized difference vegetation index |
| PA | annual total amount of precipitation |
| PA25 | annual amount of precipitation when daily precipitation more than 25 mm |
| PCD | precipitation concentration degree, defined as Formula (4) |
| PCI | precipitation concentration index |
| PCI0 | precipitation concentration index of SP (0.1–0.9 mm) |
| PCIa | precipitation concentration index on an annual scale, defined as Formula (1) |
| PCId | precipitation concentration index for the dry season, defined as Formula (2) |
| PCIw | precipitation concentration index for the wet season, defined as Formula (2) |
| PCIw0 | precipitation concentration index of SP (0.1–0.9 mm) for the wet season |
| PCP | precipitation concentration period, defined as Formula (5) |
| PDA25 | annual number of rainy days of PA25 (≥ 25 mm) |
| R95P | total precipitation amount when the daily precipitation > 95th percentile of precipitation on wet days in the 1981–2010 period |
| RA | annual total amount of runoff |
| RCD | concentration degree for runoff |
| RCI | concentration index for runoff |
| RCIa | concentration index for runoff on an annual scale |
| RCIw | concentration index for runoff for the wet season |
| RCP | concentration period for runoff |
| RG | Gini concentration index for runoff |
| SA | annual total amount of sediment discharge |
| SCA | annual suspended sediment concentration |
| SCI | concentration index for sediment |
| SCIw | concentration index for sediment for the wet season |
| SCD | concentration degree for sediment |
| SCP | concentration period for sediment |
| SDII | annual total precipitation divided by the number of total wet days |
| SG | Gini concentration index for sediment |
| SP | slight precipitation, the daily precipitation is 0.1–0.9 mm |
| YPD | annual total number of rainy days |
| YPD0 | annual number of rainy days of SP (0.1–0.9 mm) |
| YPD1 | annual number of rainy days of LP (1–9.9 mm) |
| YPD10 | annual number of rainy days of MP (10–24.9 mm) |
| YPD25 | annual number of rainy days of HP (25–49.9 mm) |
| YPD50 | annual number of rainy days of EP (≥ 50 mm) |
References
- Li, Z.; Ma, J.; Guo, J.; Paerl, H.W.; Brookes, J.D.; Xiao, Y.; Fang, F.; Ouyang, W.; Lunhui, L. Water Quality Trends in the Three Gorges Reservoir Region before and after Impoundment (1992–2016). Ecohydrol. Hydrobiol. 2019, 19, 317–327. [Google Scholar] [CrossRef]
- Ye, L.; Cai, Q.-h.; Liu, R.-q.; Cao, M. The Influence of Topography and Land Use on Water Quality of Xiangxi River in Three Gorges Reservoir Region. Environ. Geol. 2009, 58, 937–942. [Google Scholar] [CrossRef]
- Ding, X.W.; Dong, X.S.; Hou, B.D.; Fan, G.H.; Zhang, X.Y. Visual Platform for Water Quality Prediction and Pre-Warning of Drinking Water Source Area in the Three Gorges Reservoir Area. J. Clean. Prod. 2021, 309, 12. [Google Scholar] [CrossRef]
- Luo, H.; Li, R.; Li, H.; Zhao, Y.; Li, Z.; Xiang, H.; Qiao, G.; Li, J. Risk Factor Research of Drinking Water for the Residents in the Water Level Fluctuation Zone of Wanzhou Section of the Three Gorges Reservior. Mod. Prev. Med. 2019, 46, 230–233+246. (In Chinese) [Google Scholar]
- Hu, J.; Lü, Y.; Fu, B.; Comber, A.J.; Harris, P. Quantifying the Effect of Ecological Restoration on Runoff and Sediment Yields: A Meta-Analysis for the Loess Plateau of China. Prog. Phys. Geogr. 2017, 41, 753–774. [Google Scholar] [CrossRef]
- Walling, D.; Fang, D. Recent Trends in the Suspended Sediment Loads of the World’s Rivers. Glob. Planet. Change 2003, 39, 111–126. [Google Scholar] [CrossRef]
- Mize, S.V.; Murphy, J.C.; Diehl, T.H.; Demcheck, D.K. Suspended-Sediment Concentrations and Loads in the Lower Mississippi and Atchafalaya Rivers Decreased by Half between 1980 and 2015. J. Hydrol. 2018, 564, 1–11. [Google Scholar] [CrossRef]
- Cheng, L.; Jueyi, S.; Yun, H.; Hirshfield, F. Changes in Runoff and Sediment Load from Major Chinese Rivers to the Pacific Ocean over the Period 1955–2010. Int. J. Sediment Res. 2013, 28, 486–495. [Google Scholar]
- Peng, T.; Tian, H.; Singh, V.P.; Chen, M.; Liu, J.; Ma, H.; Wang, J. Quantitative Assessment of Drivers of Sediment Load Reduction in the Yangtze River Basin, China. J. Hydrol. 2020, 580, 124242. [Google Scholar] [CrossRef]
- Yang, H.F.; Yang, S.L.; Xu, K.H.; Milliman, J.D.; Wang, H.; Yang, Z.; Chen, Z.; Zhang, C.Y. Human Impacts on Sediment in the Yangtze River: A Review and New Perspectives. Glob. Planet. Change 2018, 162, 8–17. [Google Scholar] [CrossRef]
- Pearce, W.; Holmberg, K.; Hellsten, I.; Nerlich, B. Climate Change on Twitter: Topics, Communities and Conversations about the 2013 Ipcc Working Group 1 Report. PLoS ONE 2014, 9, e94785. [Google Scholar] [CrossRef] [PubMed]
- Rajah, K.; O’Leary, T.; Turner, A.; Petrakis, G.; Leonard, M.; Westra, S. Changes to the Temporal Distribution of Daily Precipitation. Geophys. Res. Lett. 2014, 41, 8887–8894. [Google Scholar] [CrossRef]
- Sang, Y.F.; Wang, Z.G.; Li, Z.L.; Liu, C.M.; Liu, X.J. Investigation into the Daily Precipitation Variability in the Yangtze River Delta, China. Hydrol. Processes 2013, 27, 175–185. [Google Scholar] [CrossRef]
- Shi, P.; Qiao, X.Y.; Chen, X.; Zhou, M.; Qu, S.M.; Ma, X.X.; Zhang, Z.C. Spatial Distribution and Temporal Trends in Daily and Monthly Precipitation Concentration Indices in the Upper Reaches of the Huai River, China. Stoch. Environ. Res. Risk Assess. 2014, 28, 201–212. [Google Scholar] [CrossRef]
- Guo, E.L.; Wang, Y.F.; Jirigala, B.; Jin, E. Spatiotemporal Variations of Precipitation Concentration and Their Potential Links to Drought in Mainland China. J. Clean. Prod. 2020, 267, 14. [Google Scholar] [CrossRef]
- Masaki, Y.; Hanasaki, N.; Takahashi, K.; Hijioka, Y. Global-Scale Analysis on Future Changes in Flow Regimes Using Gini and Lorenz Asymmetry Coefficients. Water Resour. Res. 2014, 50, 4054–4078. [Google Scholar] [CrossRef]
- Meng, X.Y.; Wang, H. Significance of the China Meteorological Assimilation Driving Datasets for the Swat Model (Cmads) of East Asia. Water 2017, 9, 765. [Google Scholar] [CrossRef]
- Meng, X.Y.; Wang, H.; Wu, Y.P.; Long, A.H.; Wang, J.H.; Shi, C.X.; Ji, X.N. Investigating Spatiotemporal Changes of the Land-Surface Processes in Xinjiang Using High-Resolution Clm3.5 and Cldas: Soil Temperature. Sci. Rep. 2017, 7, 13286. [Google Scholar] [CrossRef]
- Liu, J.; Shanguan, D.H.; Liu, S.Y.; Ding, Y.J. Evaluation and Hydrological Simulation of Cmads and Cfsr Reanalysis Datasets in the Qinghai-Tibet Plateau. Water 2018, 10, 513. [Google Scholar] [CrossRef] [Green Version]
- Gu, X.; Xiao, S.; Yang, G.; He, X.; Zhao, Q.; Zhang, L.; Li, D. Hydrological Process Simulation of Manas River Basin Based on Cmads and Swat Model. J. Water Resour. Water Eng. 2021, 32, 116–123. [Google Scholar]
- Meng, X.Y.; Wang, H.; Chen, J. Profound Impacts of the China Meteorological Assimilation Driving Datasets for the Swat Model (Cmads). Water 2019, 11, 832. [Google Scholar] [CrossRef] [Green Version]
- Meng, X.Y.; Wang, H.; Shi, C.X.; Wu, Y.P.; Ji, X.N. Establishment and Evaluation of the China Meteorological Assimilation Driving Datasets for the Swat Model (Cmads). Water 2018, 10, 1555. [Google Scholar] [CrossRef] [Green Version]
- Wang, H.S.; Liu, D.S.; Lin, H.; Montenegro, A.; Zhu, X.L. Ndvi and Vegetation Phenology Dynamics under the Influence of Sunshine Duration on the Tibetan Plateau. Int. J. Climatol. 2015, 35, 687–698. [Google Scholar] [CrossRef]
- Xu, X. China Monthly Vegetation Index (Ndvi) Spatial Distribution Dataset; Data Registration and Publishing System of Resource and Environment Science Data Center, Chinese Academy of Sciences: Beijing, China, 2018. [Google Scholar]
- Xu, X. China Annual Vegetation Index (Ndvi) Spatial Distribution Dataset; Data Registration and Publishing System of Resource and Environment Science Data Center, Chinese Academy of Sciences: Beijing, China, 2018. [Google Scholar]
- Oliver, J.E. Monthly Precipitation Distribution—A Comparative Index. Prof. Geogr. 1980, 32, 300–309. [Google Scholar] [CrossRef]
- De Luis, M.; Gonzalez-Hidalgo, J.C.; Brunetti, M.; Longares, L.A. Precipitation Concentration Changes in Spain 1946–2005. Nat. Hazards Earth Syst. Sci. 2011, 11, 1259–1265. [Google Scholar] [CrossRef] [Green Version]
- Liu, Y.; Yan, D.; Wen, A.; Shi, Z.; Chen, T.; Chen, R. Relationship between Precipitation Characteristics at Different Scales and Drought/Flood during the Past 40 Years in Longchuan River, Southwestern China. Agriculture 2022, 12, 89. [Google Scholar] [CrossRef]
- Zhang, L.J.; Qian, Y.F. Annual Distribution Features of Precipitation in China and Their Interannual Variations. Acta Meteorol. Sin. 2003, 17, 146–163. [Google Scholar]
- Wang, W.G.; Xing, W.Q.; Yang, T.; Shao, Q.X.; Peng, S.Z.; Yu, Z.B.; Yong, B. Characterizing the Changing Behaviours of Precipitation Concentration in the Yangtze River Basin, China. Hydrol. Processes 2013, 27, 3375–3393. [Google Scholar] [CrossRef]
- Li, X.M.; Jiang, F.Q.; Li, L.H.; Wang, G.Q. Spatial and Temporal Variability of Precipitation Concentration Index, Concentration Degree and Concentration Period in Xinjiang, China. Int. J. Climatol. 2011, 31, 1679–1693. [Google Scholar] [CrossRef]
- Shrestha, S.; Yao, T.D.; Kattel, D.B.; Devkota, L.P. Precipitation Characteristics of Two Complex Mountain River Basins on the Southern Slopes of the Central Himalayas. Theor. Appl. Climatol. 2019, 138, 1159–1178. [Google Scholar] [CrossRef]
- Martin-Vide, J. Spatial Distribution of a Daily Precipitation Concentration Index in Peninsular Spain. Int. J. Climatol. 2004, 24, 959–971. [Google Scholar] [CrossRef]
- Mann, H.B. Nonparametric Tests against Trend. Econometrica 1945, 13, 245–259. [Google Scholar] [CrossRef]
- Kendall, M.G. Rank Correlation Methods. Br. J. Psychol. Gen. 1990, 11–12, 86–91. [Google Scholar] [CrossRef]
- Sen, P.K. Estimates of the Regression Coefficient Based on Kendall’s Tau. J. Am. Stat. Assoc. 1968, 63, 1379–1389. [Google Scholar] [CrossRef]
- Zhang, Y.Q.; Liu, C.M.; You, Q.L.; Chen, C.C.; Xie, W.X.; Ye, Z.W.; Li, X.C.; He, Q.N. Decrease in Light Precipitation Events in Huai River Eco-Economic Corridor, a Climate Transitional Zone in Eastern China. Atmos. Res. 2019, 226, 240–254. [Google Scholar] [CrossRef]
- Huang, G.; Wen, G. Spatial and Temporal Variations of Light Rain Events over China and the Mid-High Latitudes of the Northern Hemisphere. Chin. Sci. Bull. 2013, 58, 1402–1411. [Google Scholar] [CrossRef] [Green Version]
- Liu, B.; Xu, M.; Henderson, M. Where Have All the Showers Gone? Regional Declines in Light Precipitation Events in China, 1960–2000. Int. J. Climatol. 2011, 31, 1177–1191. [Google Scholar]
- Qian, Y.; Gong, D.Y.; Fan, J.W.; Leung, L.R.; Bennartz, R.; Chen, D.L.; Wang, W.G. Heavy Pollution Suppresses Light Rain in China: Observations and Modeling. J. Geophys. Res.-Atmos. 2009, 114, 16. [Google Scholar] [CrossRef]
- Liu, R.; Liu, S.C.; Cicerone, R.J.; Shiu, C.-J.; Li, J.; Wang, J.; Zhang, Y. Trends of Extreme Precipitation in Eastern China and Their Possible Causes. Adv. Atmos. Sci. 2015, 32, 1027–1037. [Google Scholar] [CrossRef] [Green Version]
- Wang, H.; He, M.; Ran, N.; Xie, D.; Wang, Q.; Teng, M.; Wang, P. China’s Key Forestry Ecological Development Programs: Implementation, Environmental Impact and Challenges. Forests 2021, 12, 101. [Google Scholar] [CrossRef]
- Kumar, T.V.L.; Uma, R.; Rao, K.K.; Barbosa, H.; Jothi, E.P.; Patnaik, K. Variability in Modis Ndvi in Relation to Southwest Monsoon over Western Ghats, India. J. Environ. Inform. 2016, 27, 52–61. [Google Scholar]
- Schultz, P.; Halpert, M. Global Correlation of Temperature, Ndvi and Precipitation. Adv. Space Res. 1993, 13, 277–280. [Google Scholar] [CrossRef]
- Pei, F.; Zhou, Y.; Xia, Y. Application of Normalized Difference Vegetation Index (Ndvi) for the Detection of Extreme Precipitation Change. Forests 2021, 12, 594. [Google Scholar] [CrossRef]
- Wen, Z.F.; Wu, S.J.; Chen, J.L.; Lu, M.Q. Ndvi Indicated Long-Term Interannual Changes in Vegetation Activities and Their Responses to Climatic and Anthropogenic Factors in the Three Gorges Reservoir Region, China. Sci. Total Environ. 2017, 574, 947–959. [Google Scholar] [CrossRef] [PubMed]
Figure 1.
Location of the hydrological station and CMDAS points on the Daning River in the Three Gorges Reservoir area.
Figure 1.
Location of the hydrological station and CMDAS points on the Daning River in the Three Gorges Reservoir area.

Figure 2.
(a) Precipitation and (b) rainy days at each intensity level over the basin.

Figure 3.
Monthly (a) precipitation and (b) rainy days at the five intensity levels in the Daning River basin.
Figure 3.
Monthly (a) precipitation and (b) rainy days at the five intensity levels in the Daning River basin.

Figure 4.
The annual averages of the (a) PCI and (b) PCD and PCP at each intensity over the basin. PCIa is the precipitation concentration index value on an annual scale, PCIw is the precipitation concentration index value for the wet season, PCId is the precipitation concentration index value for the dry season, PCD is the precipitation concentration degree value, and PCP is the precipitation concentration period value.

Figure 5.
Variations in the NDVI in the Daning River basin: (a) average annual NDVI from 1998 to 2017; (b) monthly variation in the NDVI and Sen’s slopes. * Significance at 10% level; ** significance at 5% level; *** significance at 1% level.
Figure 5.
Variations in the NDVI in the Daning River basin: (a) average annual NDVI from 1998 to 2017; (b) monthly variation in the NDVI and Sen’s slopes. * Significance at 10% level; ** significance at 5% level; *** significance at 1% level.

Figure 6.
Relationship between the NDVI and precipitation over the Daning River basin. PCI0 is the precipitation concentration index of SP (0.1–0.9 mm); PCIw0 is the precipitation concentration index of SP (0.1–0.9 mm) for the wet season, YPD is the annual number of rainy days, YPD0 is the annual number of rainy days of SP (0.1–0.9 mm), YPD1 is the annual number of rainy days of LP (1–9.9 mm), YPD10 is the annual number of rainy days of MP (10–24.9 mm), YPD25 is the annual number of rainy days of HP (25–49.9 mm), YPD50 is the annual number of rainy days of EP (≥50 mm), and PDA25 is the annual number of rainy days of PA25 (≥25 mm). * Significance at 10% level; ** significance at 5% level; *** significance at 1% level.

Figure 7.
Annual (a) runoff, (b) sediment discharge and (c) suspended sediment concentration in the Daning River basin.
Figure 7.
Annual (a) runoff, (b) sediment discharge and (c) suspended sediment concentration in the Daning River basin.

Figure 8.
The average values and trends of monthly runoff and sediment in the Daning River basin: (a) runoff and (b) sediment.
Figure 8.
The average values and trends of monthly runoff and sediment in the Daning River basin: (a) runoff and (b) sediment.

Figure 9.
Pearson correlation coefficients between the NDVI and the sediment characteristics. SA is the annual sediment discharge, SCA is the annual suspended sediment concentration, SG is the Gini concentration index for sediment, SCI is the concentration index for sediment, and SCD is the concentration degree for sediment. * Significance at 10% level; ** significance at 5% level; *** significance at 1% level.

Figure 10.
The boxes of the concentration indices of precipitation (P), runoff (R), and sediment (S) discharge. (a) The Gini concentration index value (G) for P, R, and S, (b) the concentration index value on an annual scale (CIa) for P, R, and S, (c) the concentration degree value (CD) for P, R, and S, and (d) the concentration period value (CP) for P, R, and S.

Figure 11.
The Pearson correlation coefficients between the precipitation, runoff, and sediment characteristics. PA is the annual total amount of precipitation, PA25 is the annual amount of precipitation when daily precipitation ≥ 25 mm, R95P is the total precipitation amount when the daily precipitation >95th percentile of precipitation on wet days in the 1981–2010 period, RA is the annual total amount of runoff, SA is the annual total amount of sediment, SCA is the annual suspended sediment concentration, PCD is the precipitation concentration degree, RCD is the concentration degree for runoff, SCD is the concentration degree for sediment, PCP is the precipitation concentration period, RCP is the concentration period for runoff, SCP is the concentration period for sediment, PCI is the precipitation concentration index, RCI is the concentration index for runoff, RCIw is the concentration index for runoff for the wet season, SCI is the concentration index for sediment, SCIw is the concentration index for sediment for the wet season, RG is the Gini concentration index for runoff, and SG is the Gini concentration index for sediment. * Significance at 10% level; ** significance at 5% level; *** significance at 1% level.


Table 1.
Annual precipitation, rainy days, and SDII trends at each intensity level over the Daning River basin during 1979–2017.
Table 1.
Annual precipitation, rainy days, and SDII trends at each intensity level over the Daning River basin during 1979–2017.
| Intensity | Precipitation | Rainy days | SDII |
|---|---|---|---|
| (mm/10 a) | (d/10 a) | ((mm/d)/10 a) | |
| Total | 78.26 ** | −10.00 * | 0.55 *** |
| SP 0.1–0.9 | −2.13 | −7.03 ** | 0.01 *** |
| LP 1–9.9 | −10.78 | −5.36 *** | 0.07 ** |
| MP 10–24.9 | 7.52 | −0 | 0.09 |
| HP 25–49.9 | 28.91 ** | 0.86 * | 0.86 |
| EP ≥ 50 | 37.00 *** | 0.57 *** | 5.93 ** |
| PA25 ≥ 25 | 80.05 *** | 1.43 ** | 2.20 *** |
Note(s): * Significance at 10% level; ** significance at 5% level; *** significance at 1% level. Units ″mm/10 a″, ″d/10 a″, and ″(mm/d)/10 a″ mean mm, day, and mm/day per decade; −0 means that the slope is 0, but the MK standard Z value is negative. SDII is the annual precipitation divided by the number of wet days. PA25 is the annual amount of precipitation when the daily precipitation ≥ 25 mm, that is, the amount of HP and EP.
Table 2.
Trends of precipitation, rainy days, and SDII in the wet/dry seasons at each intensity level over the Daning River basin during 1979–2017.
Table 2.
Trends of precipitation, rainy days, and SDII in the wet/dry seasons at each intensity level over the Daning River basin during 1979–2017.
| Intensity | Precipitation | Rainy days | SDII | |
|---|---|---|---|---|
| (mm/10 a) | (d/10 a) | ((mm/d)/10 a) | ||
| Wet Season | Total | 35.8 | −9.50 *** | 0.85 *** |
| SP 0.1–0.9 | −2.10 *** | −5.40 *** | +0 | |
| LP 1–9.9 | −18.41 *** | −5.33 *** | 0.06 | |
| MP 10–24.9 | −12.37 | −1.17 * | 0.31 *** | |
| HP 25–49.9 | 18.88 | 0.50 | 0.18 | |
| EP ≥ 50 | 36.66 *** | 0.56 *** | 3.93 *** | |
| Dry Season | Total | 37.14 *** | −0.40 | 0.49 *** |
| SP 0.1–0.9 | 0.26 | −2.07 | 0.01 *** | |
| LP 1–9.9 | 5.97 * | 0.62 | 0.15 ** | |
| MP 10–24.9 | 12.79 ** | 0.89 ** | −0.06 | |
| HP 25–49.9 | 8.87 *** | 0.27 *** | 2.40 *** | |
| EP ≥ 50 | - | - | - |
Note(s): * Significance at 10% level; ** significance at 5% level; *** significance at 1% level. Units ″mm/10 a″, ″d/10 a″ and ″(mm/d)/10 a″ mean mm, day, and mm/day per decade; +0 means that the slope is 0, but the MK standard Z value is positive. SDII is the annual precipitation divided by the number of wet days.
Table 3.
The correlation coefficients between the amount of precipitation and the PCI, the amount of precipitation and the PCD, the amount of precipitation and the PCP, and the PCI and PCD for the annual amount of precipitation and each intensity level for the Daning River basin.
Table 3.
The correlation coefficients between the amount of precipitation and the PCI, the amount of precipitation and the PCD, the amount of precipitation and the PCP, and the PCI and PCD for the annual amount of precipitation and each intensity level for the Daning River basin.
| P–PCI | P–PCD | P–PCP | PCI–PCD | |
|---|---|---|---|---|
| Total | −0.158 | 0.032 | 0.516 ** | 0.581 *** |
| 0.1–0.9 mm | −0.730 *** | −0.548 ** | 0.299 | 0.670 *** |
| 1–9.9 mm | −0.407 * | 0 | −0.069 | 0.698 *** |
| 10–24.9 mm | −0.820 *** | −0.579 *** | −0.056 | 0.707 *** |
| 25–49.9 mm | −0.651 *** | −0.561 *** | 0.415 * | 0.738 *** |
| ≥50 mm | −0.720 *** | −0.585 *** | 0.286 | 0.701 *** |
Note(s): P is the amount of precipitation, PCI is the precipitation concentration index, PCD is the precipitation concentration degree, and PCP is the precipitation concentration period. * Significance at 10% level; ** significance at 5% level; *** significance at 1% level.
Table 4.
The trends in the precipitation, runoff, and sediment concentration indices for the Daning River basin.
Table 4.
The trends in the precipitation, runoff, and sediment concentration indices for the Daning River basin.
| Precipitation | Runoff | Sediment | |
|---|---|---|---|
| Slope (/10 a) | Slope (/10 a) | Slope (/10 a) | |
| G | 0.004 | −0.007 | −0.039 *** |
| CIa | −0.211 | −0.219 | −11.602 *** |
| CIw | 0.070 | 0.143 | −4.655 ** |
| CId | 0.517 | −0.246 | +0 |
| CD | −0.021 * | +0 | −0.143 *** |
| CP/° | −2.672 | 6.737 | −0.976 |
Note(s): G is the Gini concentration index value, CIa is the concentration index value on an annual scale, CIw is the concentration index value for the wet season, CId is the concentration index value for the dry season, CD is the concentration degree value, and CP is the concentration period value. * Significance at 10% level; ** significance at 5% level; *** significance at 1% level. Unit “/10 a” means per decade; +0 means that the slope is 0, but the MK standard Z value is positive.
Publisher’s Note: MDPI stays neutral with regard to jurisdictional claims in published maps and institutional affiliations. |
© 2022 by the authors. Licensee MDPI, Basel, Switzerland. This article is an open access article distributed under the terms and conditions of the Creative Commons Attribution (CC BY) license (https://creativecommons.org/licenses/by/4.0/).
Share and Cite
MDPI and ACS Style
Liu, Y.; Wen, A.; Yan, D.; Shi, Z. Influence of Precipitation Characteristics and Vegetation on Runoff and Sediment: A Case on the Basin in the Three Gorges Reservoir Region. Water 2022, 14, 2141. https://doi.org/10.3390/w14132141
AMA Style
Liu Y, Wen A, Yan D, Shi Z. Influence of Precipitation Characteristics and Vegetation on Runoff and Sediment: A Case on the Basin in the Three Gorges Reservoir Region. Water. 2022; 14(13):2141. https://doi.org/10.3390/w14132141
Chicago/Turabian StyleLiu, Yuan, Anbang Wen, Dongchun Yan, and Zhonglin Shi. 2022. "Influence of Precipitation Characteristics and Vegetation on Runoff and Sediment: A Case on the Basin in the Three Gorges Reservoir Region" Water 14, no. 13: 2141. https://doi.org/10.3390/w14132141
Note that from the first issue of 2016, this journal uses article numbers instead of page numbers. See further details here.