
Observations and Correlations from a 3-Year Study of Fecal Indicator Bacteria in the Mohawk River in Upstate NY


1
Department of Chemistry, and Center for Neuroscience Research, University at Albany, SUNY, Albany, NY 12222, USA
2
Department of Engineering, State University of New York Polytechnic Institute, Utica, NY 13502, USA
*
Author to whom correspondence should be addressed.
Water 2022, 14(13), 2137; https://doi.org/10.3390/w14132137
Submission received: 30 May 2022
/
Revised: 26 June 2022
/
Accepted: 1 July 2022
/
Published: 5 July 2022
(This article belongs to the Special Issue Water Quality Changes of Lakes and Rivers)
Abstract
:Fecal indicator bacteria (FIB), such as E. coli and Enterococci, are used to indicate the potential of fecal contamination in waterways. One known source of FIB in urbanized areas is the occurrence of combined sewer overflows (CSOs). To explore the impact of CSOs on local water quality and FIB presence, sampling was conducted during the summers of 2017–2019 of two cities, one with CSOs and one without, on the Mohawk River in upstate New York, USA. Sampling included in situ physiochemical parameters of pH, temperature, and dissolved oxygen and laboratory tests for E. coli, Enterococci, nitrates, and total organic carbon (TOC). Correlations between parameters were explored using the Wilcoxon rank sum test and Spearman’s Rank correlation with and without considerations of site and city location. Overall, positive correlations between FIB and rainfall were identified in one city but were less significant in the other, suggesting a buffering of FIB concentrations likely due to inflow contributions from a reservoir. Samples collected downstream from an active CSO reached the detection limit of the FIB tests, demonstrating a 2-log or greater increase in FIB concentrations from dry weather conditions. The city with CSOs demonstrated greater FIB concentrations, which are likely a combination of greater urban runoff, CSOs, and the potential resuspension of sediment during high flow events. Due to the widespread presence of FIB in the region, future research includes utilizing microbial source tracking to identify the sources of contamination in the region.
1. Introduction
Communities rely on surface water bodies to provide drinking water, recreation, and socioeconomic benefits. Unfortunately, surface water quality is easily impacted by surface runoff, aging infrastructure, and discharges. Fecal contamination is of particular concern as it indicates the potential for pathogens in the surface water body. Combined sewer overflows (CSOs) are one known source of anthropogenic fecal contamination during rainfall events in urbanized regions. CSO locations may be monitored or unmonitored, and there is uncertainty regarding their contribution to local water quality on a per-location, per-event basis. Understanding sources and the extent of fecal contamination are the first steps in protecting a water body.
The direct testing of pathogens in surface water is less common and is an area of evolving research due to challenges with low concentrations and the difficult technical requirements of testing [1]. Therefore, fecal indicator bacteria (FIB) continue to be used to indicate the potential presence of pathogens from fecal contamination due to the ease of detection and low-cost culture-based methods. E. coli and Enterococci are the most used FIB and are the focus of the United States Environmental Protection Agency (USEPA) Recreational Water Quality Criteria (RWQC) [2]. These criteria are based on studies of the co-occurrence of FIB and recreational illnesses. The RWQC identify a geometric mean and statistical threshold value for 30-day periods, as well as a single sample beach action value (BAV). The BAV, or other location specific recreational thresholds, are commonly used when evaluating the occurrence of FIB in water-quality studies [3,4,5,6].
CSOs represent one potential source of FIB within a waterbody, but FIB are not specific to humans and occur in the gut of warm-blooded animals. Therefore, sources of FIB are often connected to the land use patterns within a watershed [3,7]. For example, urban watersheds that support higher population densities have attributed elevated FIB to illegal connections and cross-contamination between storm and sewer systems [8], point sources such as CSOs and wastewater treatment plants [9,10,11,12], non-point urban source runoff [7,12,13] such as FIB loading from pets and wildlife, lack of sanitation and solid waste management [4], and the resuspension of FIB containing sediment within the stormwater system and river [3,12,13,14,15]. Some overlap of sources exists in rural watersheds such as the occurrence of wildlife [7], but other sources include manure application [4,16], livestock, and septic system failures [7,17]. E. coli has also been shown to naturalize and grow in temperate soils [18], complicating its use as an indicator. FIB concentrations in urban watersheds and developed regions are often greater than those in rural or natural watersheds [5,7,15]; comparisons of urban point sources and rural non-point sources in the Scheldt drainage network showed a 2-3 order of magnitude greater FIB in wastewater treatment plant effluent than runoff from forested, cultivated, and pastured areas [9]. Many of these sources experience releases during rainfall events; therefore, correlations between FIB and rainfall are common [4], with potential increases in FIB of two orders of magnitude or greater in wet weather [3,10,12,13,19]. Once in the environment, FIB undergo additional physical and biological processes and stressors that can influence concentrations within water bodies [12,14,20] such as transport and dilution; sedimentation; resuspension [21,22]; and growth and die-off [23] due to temperature, sunlight [13], predation, and starvation [12,19,20].
Recent FIB field-studies suggest methods for statistical analysis using multiple linear regression [9,24], the Wilcoxon–Mann test [9], and Spearman rank analysis [8,25]. Similar research has been conducted in a small region of the Zenna River in Belgium [10] and a stretch of the lower Lahn River, Germany [25]. A study on waterborne pathogens in the South Nation River utilized Chi-square and Fishers exact tests to analyze the seasonality in marker detection [26]. Recently, a study based in the Elm Park stream in Dublin used hierarchical clustering as a means of analysis of FIB along several points in the stream [27]. T-tests have also been used to analyze the differences in E. coli and microbial source tracking marker concentrations in terms of sampling sites [28]. This study uses similar methods of data analysis as those above with a focus on variations and trends under the consideration of hydrologic connections and stormwater/wastewater infrastructure.
The objective of this work was to evaluate variations of water quality, especially FIB occurrence, in two cities with differences in land use, as well as stormwater and wastewater infrastructure systems along the Mohawk River in Upstate New York (NY), USA. Sampling locations were chosen upstream and downstream of the cities, at a critical tributary, and at locations that flow past known CSOs. Samples were collected over three years in dry and wet weather with FIB concentrations quantified and compared to BAVs. Correlations between water quality parameters, site locations, and rainfall were explored via statistical analysis, Spearman’s rank correlation, and the Wilcoxon rank-sum test.
2. Materials and Methods
2.1. Study Area
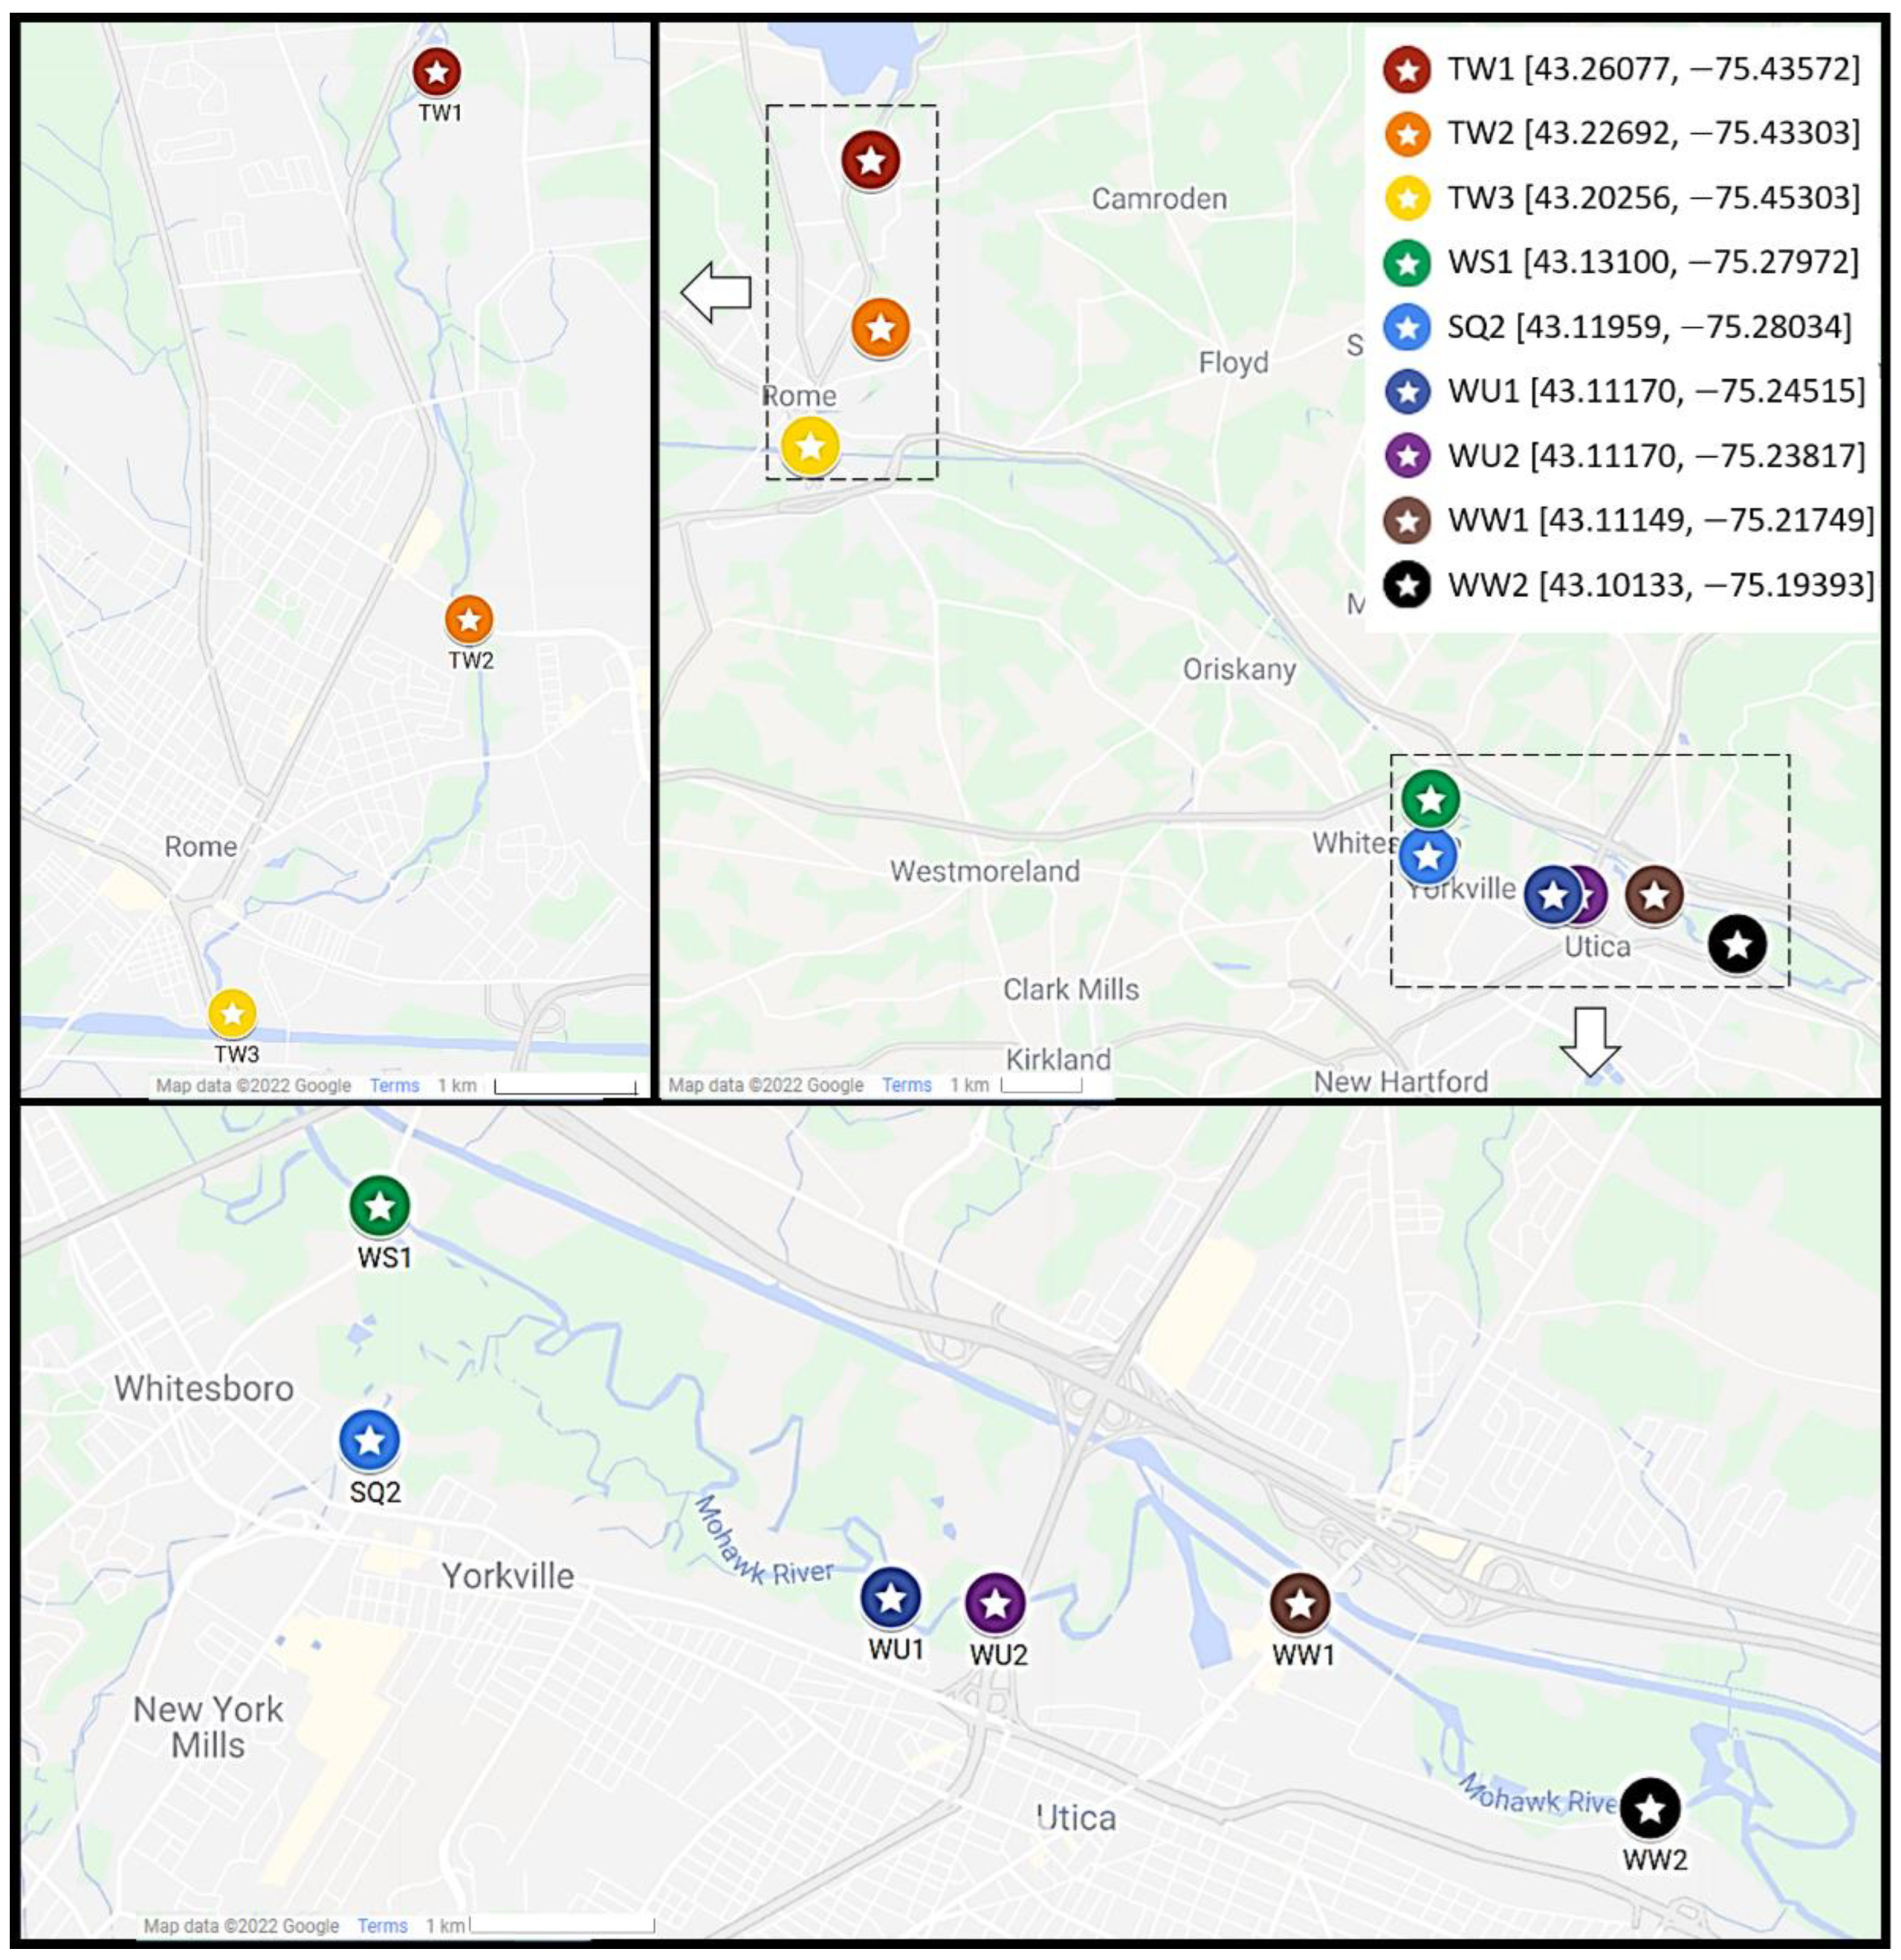
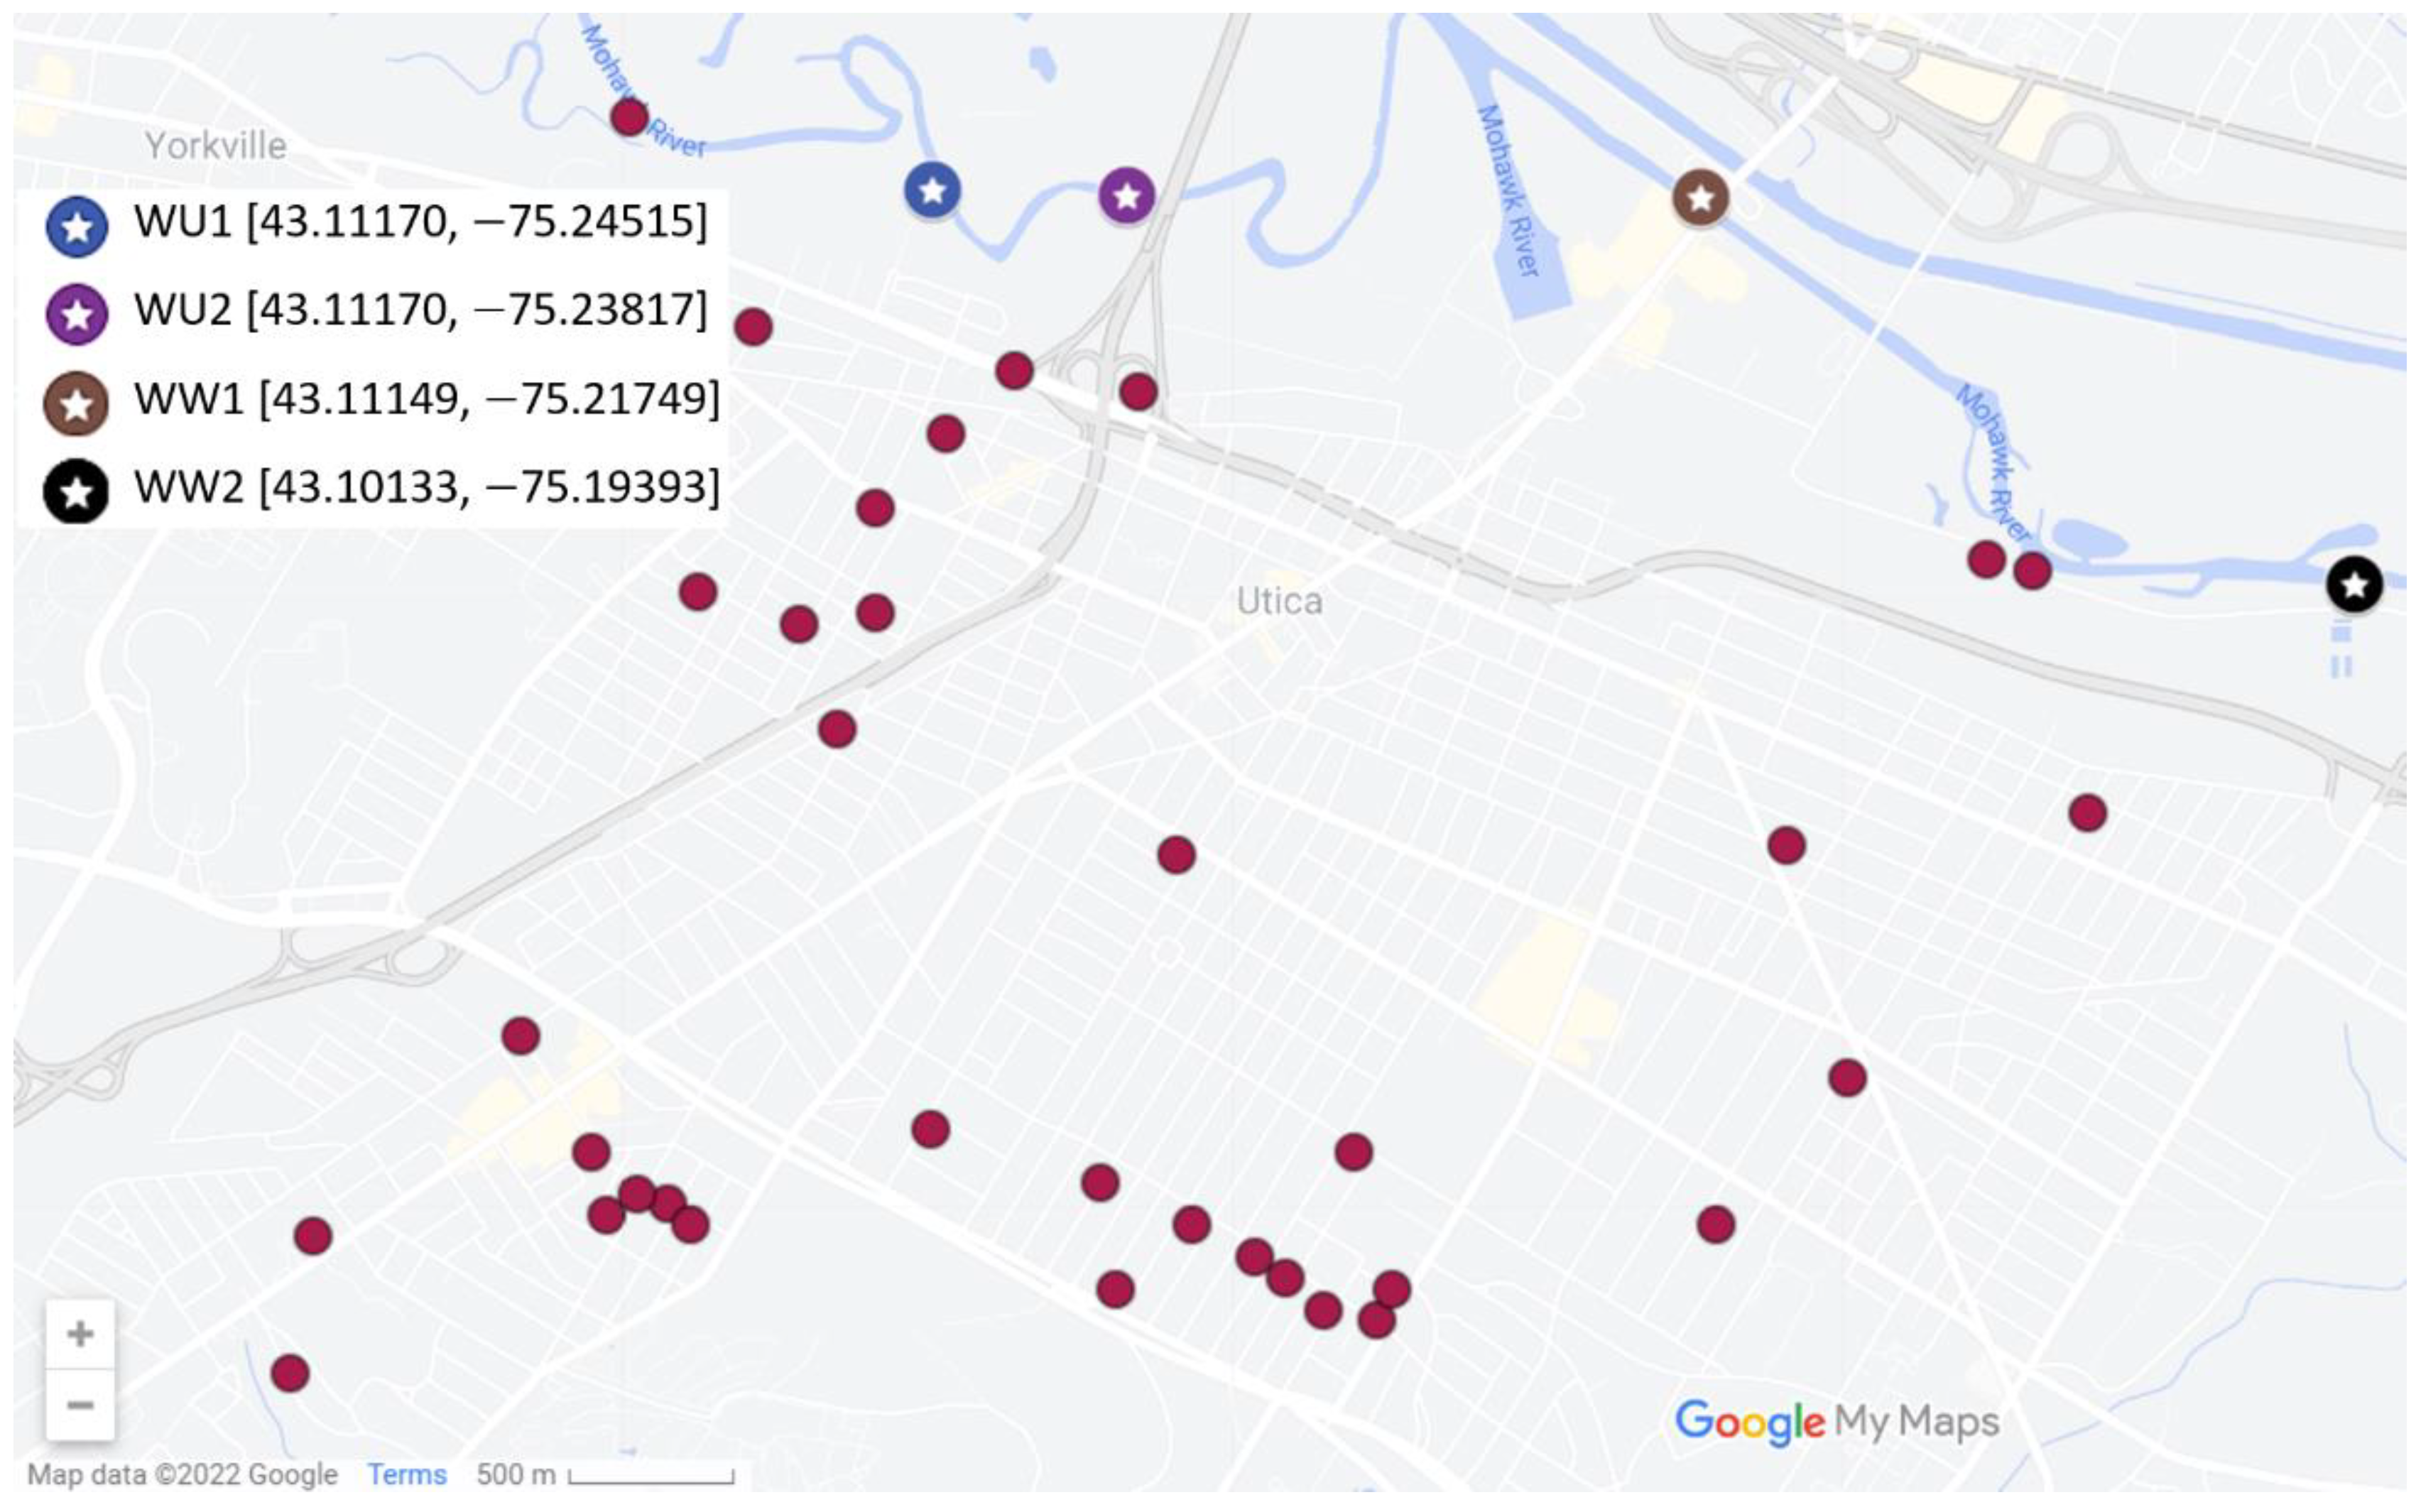
Nine total sampling locations in upstate New York were chosen to explore the relationship between infrastructure and FIB (Figure 1). At a conceptual level, locations were selected to capture water quality changes along the Mohawk River as water travels into and through the urban area of the city of Rome, NY and downstream to the nearby city of Utica, NY. Three of the nine sampling locations are along a 12 km stretch of the Delta Reservoir tailwater in Rome (i.e., the start of the Mohawk River). One sampling location was chosen at a tributary that joins the Mohawk River in the Utica region, and the remaining five sampling locations were selected are along a 14 km stretch of the Mohawk River as it enters and travels through the city of Utica. The three sampling locations in Rome were chosen to show the progression of water quality through the city where there are no known CSOs, among other differentiating features such as land use. The direction of flow for these sample locations starts downstream from the Delta Lake Reservoir (TW1), and it travels through Rome (TW2 and TW3), at which point the water flow mixes with the Erie canal. The Mohawk River then separates from the canal, eventually traveling through the western sample location in the city of Whitesboro (WS1), after which it enters the city of Utica, joins with water from Sauquoit Creek (SQ2), and travels east through the city (WU1 and WU2) toward the eastern edge passing the CSO outlet for the region’s wastewater treatment plant. This CSO location is between WW1 and WW2; the effluent outlet for the wastewater treatment plant is downstream of WW2. The city of Utica has 34 permitted CSOs, which discharge into Ballou creek, Nail creek, and directly to the Mohawk River [29] (Figure A1). Ballou creek and Nail creek flow through the city of Utica and ultimately into the Mohawk River.
The nine sites as outlined are located within four different subwatersheds identified by their 12-digit hydrologic unit classification (HUC-12). The HUC-12 subwatersheds were used to define data related to population density and land use. The EnviroAtlas [30] was used to characterize each HUC-12 subwatershed in terms of population density and the percent of land that is developed, forest, wetland, agriculture, pasture, cropland, and impervious. In addition, data regarding manure application rates and the percent of stream length with 15% or more impervious cover within 30 meters were also recorded (Table 1).
2.2. Sample Collection
Over the course of three years, samples were collected 38 times from each sample location in dry and wet weather. Thirteen samples at each site were collected between 8 June and 7 August in 2017, with an average of 5.0 days between samples. Five samples at each site were collected between 19 September and 3 October in 2018, with an average of 3.5 days between samples. Between 11 June and 31 July 2019, 20 samples were collected, resulting in an average of 2.6 days between samples. On one occasion in 2019, the WU1 sample was lost and therefore includes only 19 samples in 2019. The end result was a total of 341 unique samples over three years, with the majority of samples collected over the summer during the months of June and July.
Each sampling trip began with the sample location furthest downstream to avoid accidental disturbance of sediment at sample sites upstream. Samples were collected as grab samples following the United States Geological Survey (USGS) Interagency Field Manual for the collection of water-quality data [31]. In summary, four bottles of samples were collected at each site: two 125 mL samples for E. coli (ECO) and Enterococci (ENT) analysis and two 500 mL samples for TOC and nitrate analysis (Table A1). The samples were collected from the bank using an extendable sampling rod to avoid disturbing sediment. Bottles were filled with a small headspace to allow for shaking and placed in a dark ice-filled cooler and transported to the lab for analysis. In-situ field measurements of pH, water temperature (T), and dissolved oxygen (DO) were taken at each site using a HACH Sension+ MM156 Multimeter. In addition to water quality data, hourly rainfall data was recorded from the Griffiss Air Force Base/International Airport weather station in Rome, NY (KRME). These data were used to determine the cumulative rainfall the day of sampling prior to collection (R0), and the cumulative rainfall one day (R1), two days (R2), and three days (R3) prior to sampling. The flow data (FLO) for the Mohawk River in Rome, Sauquoit Creek near Utica, and the Mohawk River in Utica were collected from available USGS stream gage data [32].
2.3. Laboratory and Data Analysis
Due to a change in funding sources, samples from 2017 were analyzed by researchers at SUNY Polytechnic Institute, and samples from 2018 and 2019 were analyzed by an independent ELAP-certified laboratory in Onondaga county. E. coli and Enterococci were measured for all the three years using the IDEXX Colilert and Enterolert methods. In 2017, nitrate as NO3-N (NIT) was analyzed using the cadmium reduction method 8192 powder pillows, and total organic carbon (TOC) was determined using UV-VIS spectrophotometry. In 2018–2019, nitrate was determined using method LACHAT 10-107-04-1C and TOC by method SM 5310 B-00-11, both conducted by the independent laboratory.
Data analysis for quality control was conducted in Microsoft Excel® (Table A2). General statistical analysis, Spearman’s rank correlation analysis, and a test for the statistical significance of correlations were also performed in Microsoft Excel®. The Wilcoxon Rank Sum test was performed in MATLAB® at a significance level of 5% to observe the overlap of Enterococci and E. coli values between sites.
3. Results
3.1. General Statistics and Correlations
The general statistics for the full data set of 341 unique samples are contained in Table 2 and include the arithmetic mean, geometric mean, median, range, variance, standard deviation, maximum, and minimum for each of the parameters collected in the study. Rainfall accumulations were excluded from the geometric mean calculation due to zero values. FIB values reported at the detection limits of >24,200 cfu/100 mL (upper) and <10 cfu/100 mL (lower) were set at 24,200.1 and 9.9, respectively (Table A2). This allowed the values to be included in the analysis [25] but remain identifiable as values beyond detection capabilities. The general statistics show a wide range of FIB values across the region, indicating the occurrence of FIB values above and below the BAVs. The overall geometric means for E. coli and Enterococci, considering all sites and rainfall conditions, are 208.1 cfu/100 mL and 83.3 cfu/100 mL, which are comparable to the range of behavior seen in a trio of rivers in Ontario Canada [3].
Spearman’s rank correlation coefficient rs was calculated between all parameters measured during the sampling time period (Table A3). The Spearman’s rank correlation emphasizes the values following a monotonic path and was chosen among others due to the variability of the data with strong outliers that tend to influence linear regression. Using the Dancey and Reidy [33] classification, moderate strength correlations are defined as an absolute rs between 0.4 and 0.7, and strong correlations are defined as an absolute rs between 0.7 and 0.9. Statistically significant (p < 0.05) moderate correlations observed between physicochemical parameters include those between temperature and nitrate (+0.41) and between TOC and dissolved oxygen (−0.44). Enterococci had moderate correlations with E. coli (0.62) and rainfall the day before (+0.5), two days before (+0.46), and three days before sampling (+0.47). Statistically significant weak correlations, defined as the absolute rs < 0.4, exist throughout. Interestingly, E. coli demonstrated no moderate to strong correlations with any of the recorded parameters besides Enterococci. Neither FIB demonstrated moderate or strong correlations with the physiochemical parameters measured when all sample sites and rainfall conditions were considered together, suggesting that a site-by-site analysis may provide more value in understanding the behavior of FIB in the Utica–Rome region.
3.2. Site-Specific FIB Statistics and Correlations
Three main analyses were conducted to explore the spatial occurrence of FIB. First, the FIB for each site was compared to the USEPA Recreational Water Quality Criteria RWQC [2]. At an estimated illness rate of 36/1000, the RWQC identifies a geometric mean for E. coli and Enterococci of 126 cfu/100 mL and 35 cfu/100 mL and single sample beach action value (BAV) of 235 cfu/100 mL and 70 cfu/100 mL for E. coli and Enterococci, respectively. The distributions for FIB at each site were compared using the Wilcoxon rank sum test and evaluated for statistical significance at a p < 0.05. FIB at each site were also evaluated for moderate and strong correlations with physicochemical parameters, rainfall, and flow rate through the Spearman’s rank correlation coefficient. Table 3 and Table 4 summarize the results of these three analyses.
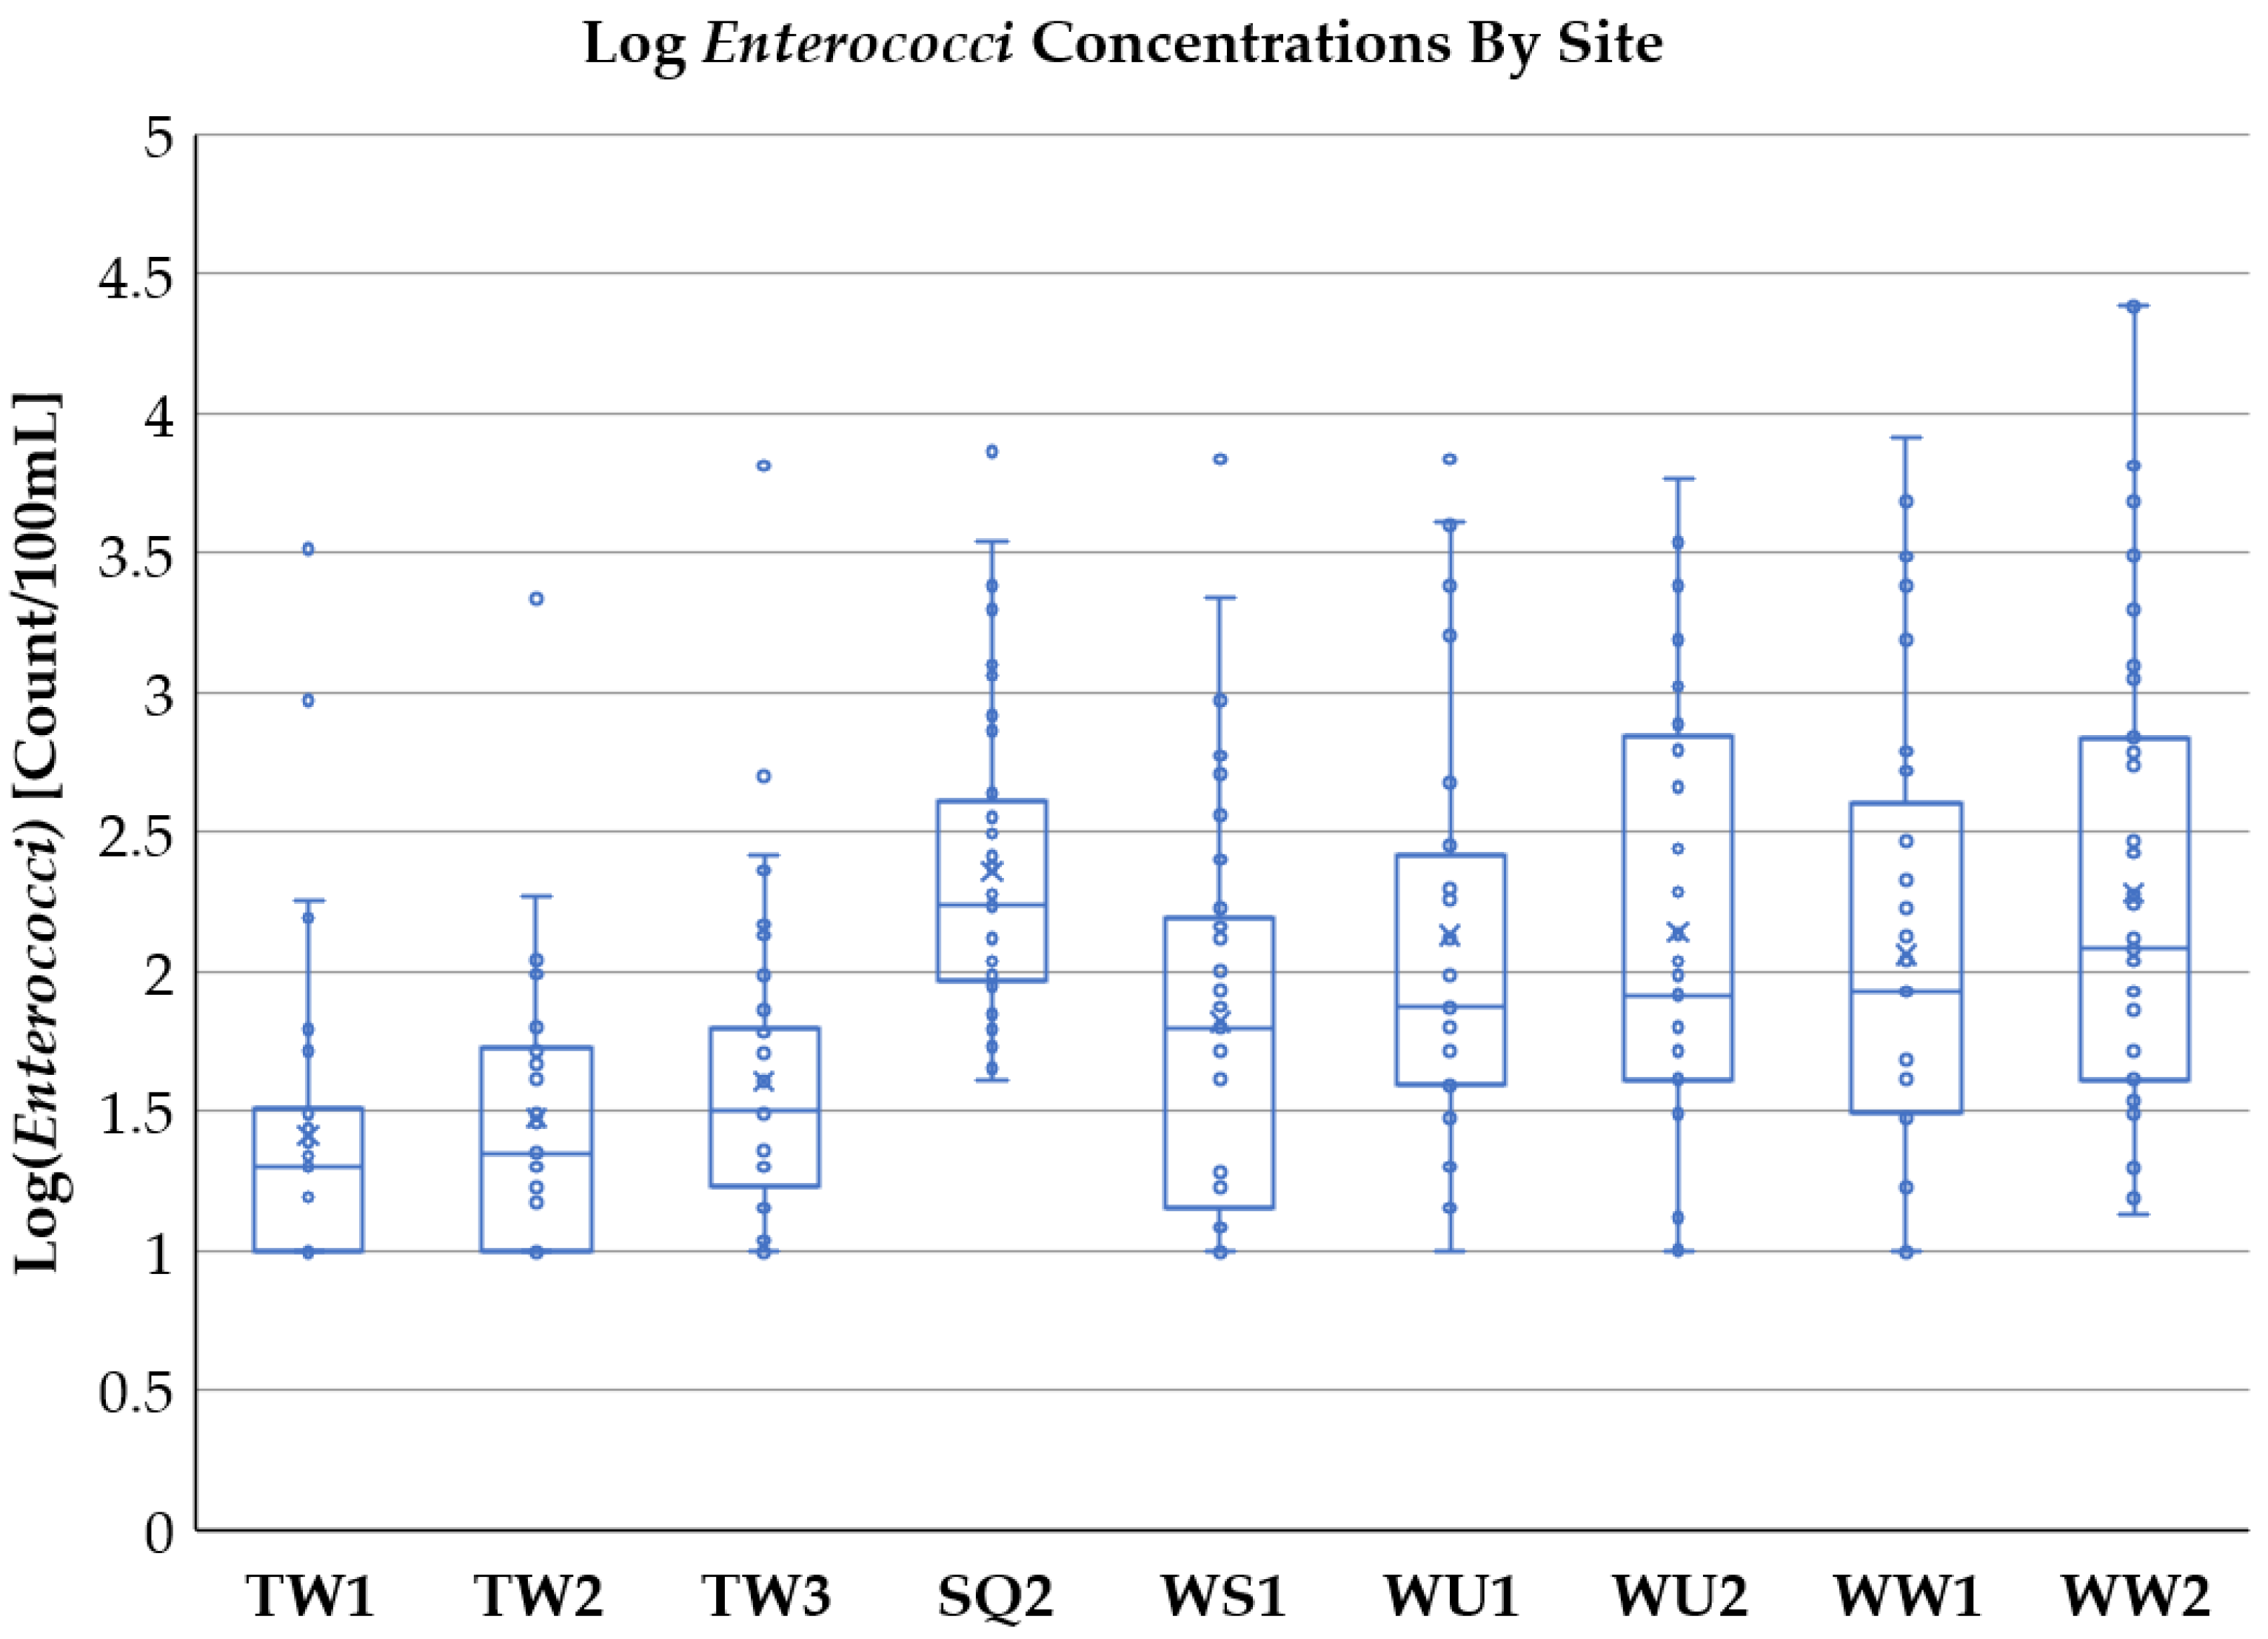
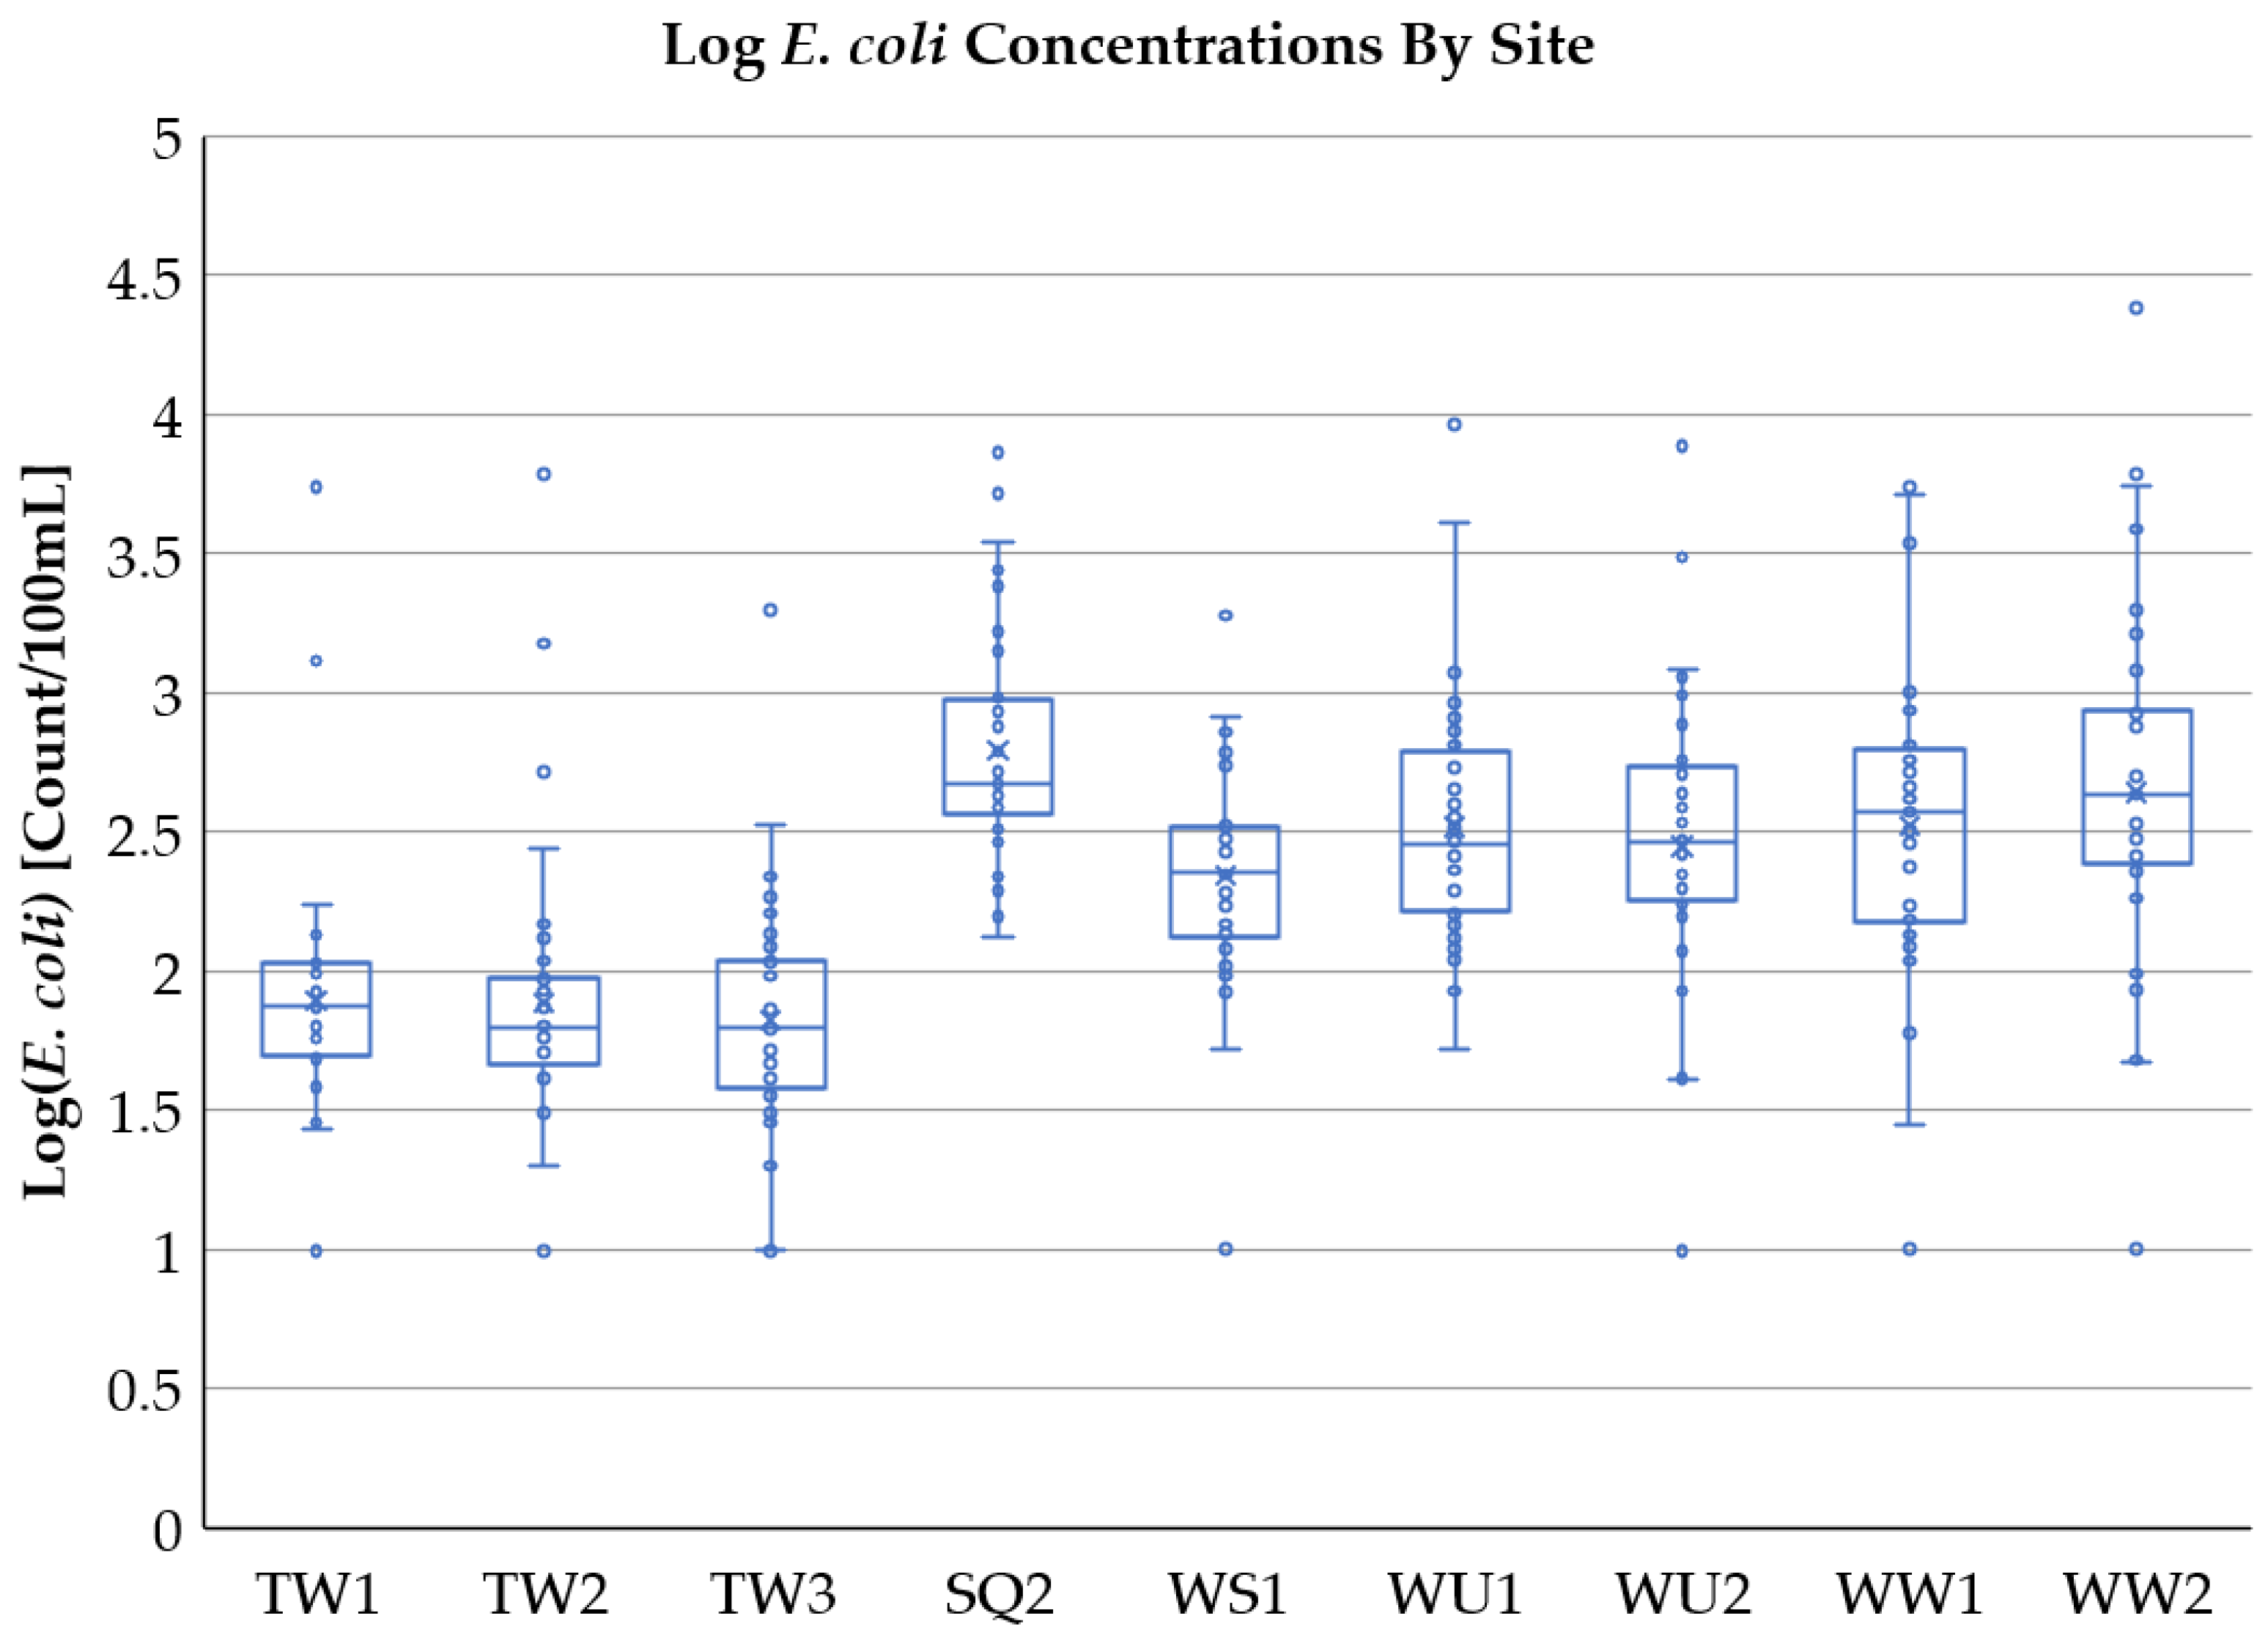
When evaluated on a site-by-site basis, geometric means for much of the Utica–Rome region failed the RWQC standards, and failures happened more frequently downstream in the more urbanized sites in Utica. The E. coli geometric means and frequency of compliance in the region correspond well with the range of geometric means reported in Ontario, Canada [3]. Lower geometric means and better compliance with RWQC in Rome, which represents the headwaters of the Mohawk River, is also consistent with the observation that lower geometric means and better recreational water quality were seen at sites at the upstream portions of the watershed [3]. The geometric means for E. coli decrease slightly as the water travels through Rome while demonstrating a general increase in magnitude as the water travels through Utica. The Enterococci geometric means demonstrate a general increase from upstream to downstream in both cities, similar to observations by others of increasing FIB in rivers flowing through urbanized regions [15]. The variability of FIB concentrations also increases from upstream to downstream (Figure A2 and Figure A3). Sauquoit Creek, SQ2, had the highest geometric mean and most frequent exceedance of the BAVs. This is likely the result of smaller flows within the tributary, which are less able to tolerate and dilute urban sources of FIB [3].
Based on observations of land-use and the hydrologic connections between various sites, regional similarity was expected. Sites near each other and in the same subwatershed were expected to be similar, while sites further away were expected to be statistically different. In general, FIB collected from the sites in Rome were found to be statistically different from those in Utica and Sauquoit Creek (Table 3 and Table 4, full p-values in Table A4 and Table A5). Utica sites similarly grouped with each other, while Sauquoit Creek was found to be statistically different than most other sites. Interestingly, SQ2 and WW2 are not found to be statistically different, indicating similarity in FIB distributions. Statistical difference was found between WS1 and WW2, suggesting that the water that enters the Utica region is statistically different than the water that leaves the region. Prior to reaching WS1, the Mohawk River travels through subwatersheds with higher percentages of agriculture and forest. This statistically significant difference may be attributed to the increase in population density and developed impervious cover as the Mohawk flows through Utica.
Many sites, but not all, demonstrated moderate correlations between FIB and rainfall as well as several locations with correlations between the two FIB and with TOC. Other studies have found correlations between FIB and organic carbon in sediment [6] and dissolved organic carbon [28]. A few strong correlations, rs > 0.7, were identified, including the significant rs value of 0.75 for WW2 between Enterococci concentrations and rain accumulated 3 days prior to the day of sampling. Given the location of WW2 as the most downstream point of the overall larger watershed, this correlation makes sense as water from far away requires time to travel to this location, which could include FIB induced from rainfall several days prior [5]. This conclusion is also supported by the moderate correlation with flow seen at both WW2 and WW1 [34]. Sauquoit Creek demonstrates strong correlations between E. coli, Enterococci, and TOC, as well as a moderate negative correlation (−0.67) between E. coli and nitrate not observed at any other location. This moderate negative correlation with nitrate suggests the FIB source is either source limited or lacks nitrate, resulting in a dilution effect [27] of the nitrate.
3.3. Precipitation
The Spearman’s rank analysis showed moderate correlations for several sites between FIB and rainfall. The occurrence of these correlations suggests that rainfall-initiated sources, such as runoff and CSOs, may be significant in this region. There were four sample days, which were preceded by significant dry periods with no rain for at least three days prior to the day of sampling [5]. These four sites were grouped together as dry sample days with the remaining data grouped together as wet samples. The geometric means for the FIB under wet and dry conditions are provided in Figure 2. Under dry and wet conditions, E. coli decrease over the length of the river in Rome, while the GMs for Enterococci increase slightly. The geometric means for the FIB in Rome are slightly higher following wet weather, except for E. coli at TW1, which is slightly lower. This buffering of the water quality in Rome is likely due to the dilution of FIB sources from the Delta Lake reservoir flow just upstream of TW1. Overall, the occurrence of wet weather appears to have minimal impact on FIB concentrations in the Mohawk River headwaters in Rome. This is also supported by the observation of weaker correlations between rainfall and FIB in this region.
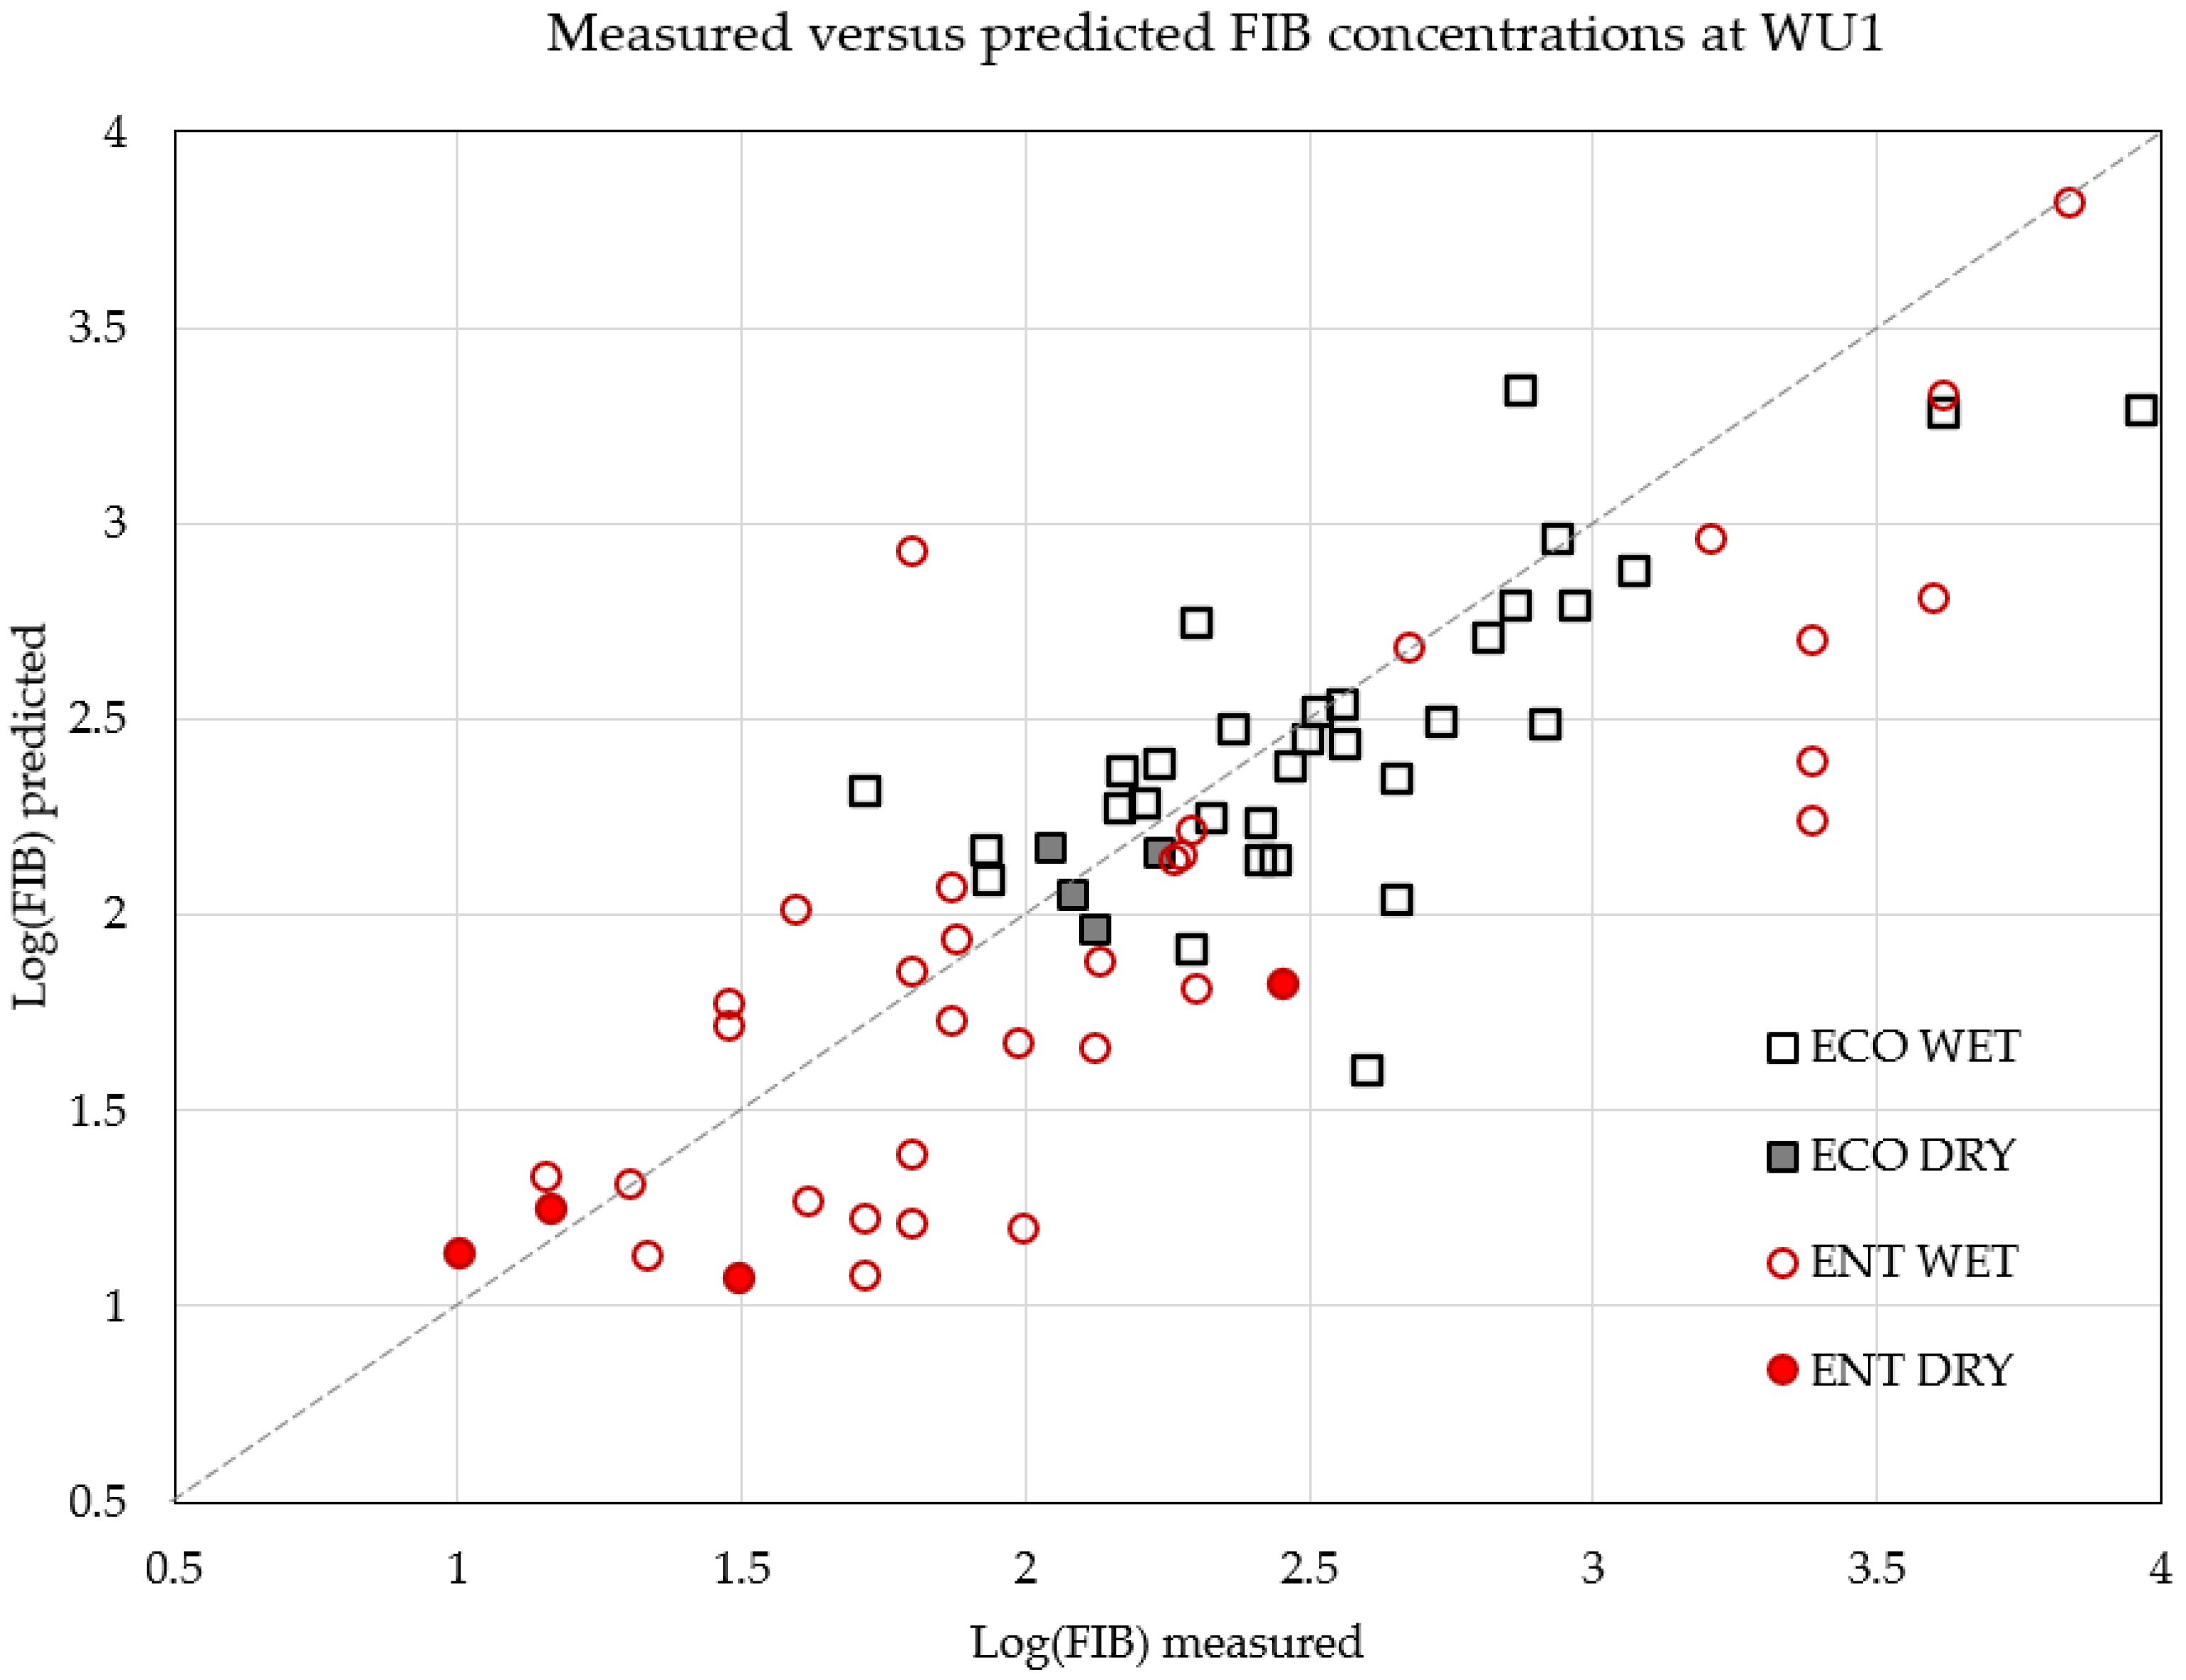
The remaining six sites show clear increases in geometric means under wet weather. Under both wet and dry weather, there is an increase in the geometric means between WS1 and WU1. Sauquoit Creek joins the Mohawk River between these two sample locations. To explore the viability of SQ2 as the primary source of FIB between these points, a mass balance approach was used to predict the downstream concentration at WU1 using USGS gage data and the collected FIB concentrations data. The log of the measured FIB concentrations versus the log of the predicted FIB concentrations for each sampling day is shown in Figure 3. On average, the mass balance approach underestimates the concentration of FIB at the downstream location particularly for Enterococci. However, as can be seen in the figure, there is significant variability in both over- and under-estimates, such that the mass balance cannot consistently explain the changes in FIB concentrations between WS1 and WU1 for each sampling date.
Returning to Figure 2, it is observed that under dry conditions, the FIB geometric means generally decrease as the water moves through the remaining sampling sites from WU1 to WW2 except for E. coli at WU2. Hydrologic connections between the New York State Department of Environmental Conservation (NYSDEC) wildlife area and the wetland just north of the sampling point WU2 may explain the increase in FIB between WU1 and WU2 in dry weather. Under wet conditions, the geometric means initially decrease from WU1 to WU2 and then experience an increase between WW1 and WW2, which surround a known CSO location. The greatest change in geometric mean between wet and dry weather occurs at WW2, where there is an order of magnitude increase under wet weather for both FIB similar to observations in the literature that show an order of magnitude or more change in urban systems under wet weather conditions [4,9,10,13].
3.4. Sewage Release Events
According to the New York state sewage discharge reports [35], there were a total of 139 weather-induced sewer overflow events between 2017 and 2019. Of those events, 22 events beginning on 16 different days occurred during the months of sampling. The releases during the sampling windows for 2017–2019 ranged in duration, with some activating for short periods of time such as 1–2 h while others spanned several days. Releases occurred at a combination of locations, including between WW1 and WW2; between WU1 and WU2; and at a pump station at the confluence of Sauquoit Creek and the Mohawk, i.e., downstream of SQ2 and in between WS1 and WU1. Six sampling days fell the day after a release occurred, and one sampling day occurred during CSO. Although several CSOs occurred throughout the region, separating the impact of CSOs the day prior from other sources of FIB such as runoff and sediment resuspension from increased flows is not possible with the data available. However, one sampling day did occur during an active CSO, and this demonstrates the significant short-term impact of active CSOs on FIB in the river.
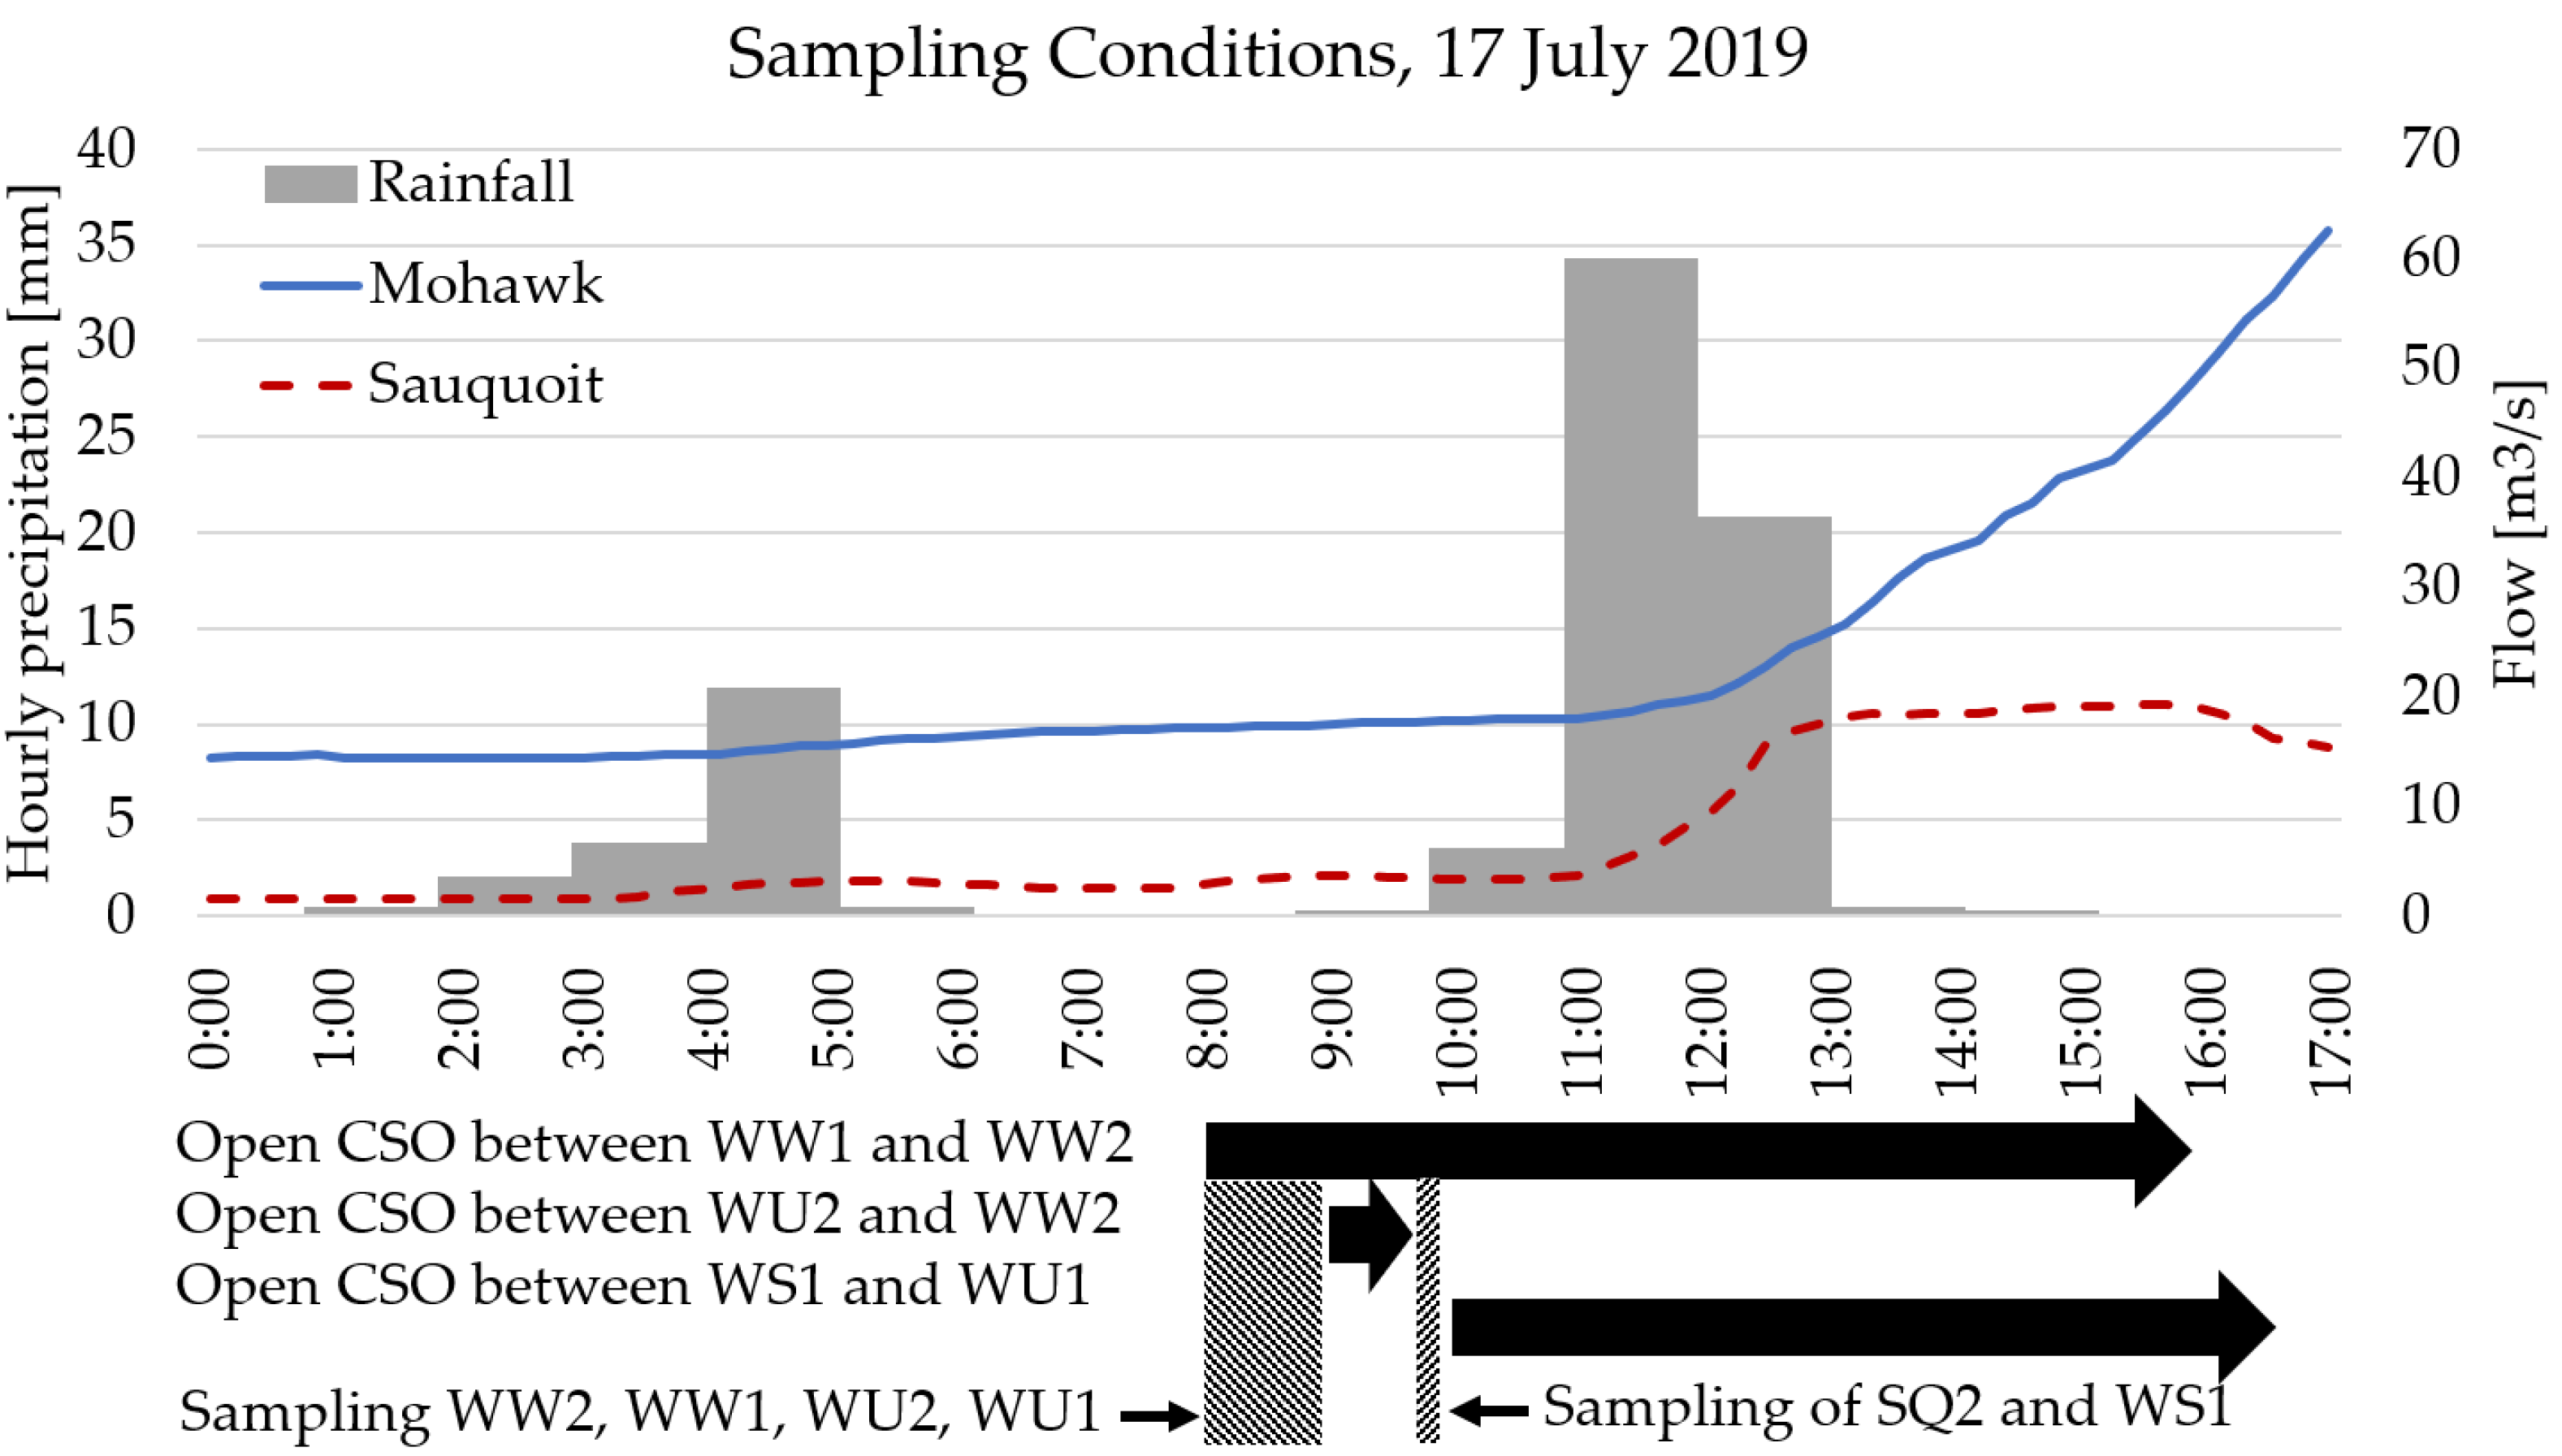
On 17 July 2019, the CSO between WW2 and WW1 opened due to heavy rain. Sampling was planned for 15–18 July of 2019, providing an opportune moment to observe the impact of the rainfall and CSO. Records show the CSO between WW2 and WW1 opened minutes prior to the arrival of the sampling team at WW2. Subsequent sampling of the upstream locations of WW1, WU2, and WU1 occurred just prior to the opening of two additional CSOs isolating the impact of the single CSO at WW2. Flow data for the Mohawk River confirm a minimal increase in flow during the sampling time period, suggesting that the additional resuspension of sediment due to high flows had not occurred, and significant runoff from throughout the basin had not yet arrived at the Utica sampling locations (Figure 4). By 17:00 17 July, the flow of Sauquoit Creek had already peaked due to the small watershed size, the CSOs had ended, and the Mohawk River flow was still rising as runoff reached the downstream site.
The activated CSO resulted in E. coli and Enterococci concentrations at WW2 above the detection limit of >24,200 cfu/100 mL and represented the greatest FIB concentrations recorded during the three-year span (Table 5). Cho et al. [13] experienced a similar detection limit issue when sampling E. coli and Enterococci concentrations during wet weather events in an urban watershed; downstream concentrations from CSOs may be higher as others have detected FIB in the range of 105 cfu/100 mL [10,12]. During the same rainfall event, SQ2 and WU2 demonstrated a rise in concentration, suggesting faster, local sources of FIB, such as those from runoff, had started to impact those sites. As discussed, Sauquoit Creek is small and does not benefit from a large flow to dilute incoming sources of FIB, and WU2 is adjacent to a small wildlife and wetland area that likely contributes FIB in runoff. Enterococci concentrations remained elevated throughout Utica the following day, including above the detection limit at WW2, but E. coli concentrations indicate potential dilution in several of the upstream locations. The flow recorded in the Mohawk on July 18 was the second greatest flow recorded for a sampling day and was approximately four times the average flow for the region and seven times the flow recorded during sampling the day before when the CSO began. High concentrations of FIB at several locations suggest runoff further upstream and/or that FIB-loaded sediment resuspension due to high flows [36] may have continued to produce high concentrations of Enterococci.
4. Discussion
The 2021–2026 Mohawk River Basin Action Agenda from the NYSDEC [37] includes a goal to improve and increase recreation in the Mohawk River Watershed. Therefore, understanding and reducing FIB in the Mohawk River is of regional importance. The Utica–Rome region of the river demonstrated a wide range of bacterial counts, many of which result in geometric means greater than recreational thresholds. This finding indicates recreation at several of these sites, particularly in the Utica region, is not recommended. However, sites along the Mohawk River headwater in Rome showed the greatest promise for recreation due to low GMs; more frequent compliance with BAV; and, on average, small changes in FIB concentration from prior rainfall.
The FIB in Rome demonstrated low FIB concentrations, weak to moderate correlations to rainfall, small changes in the geometric means for wet and dry conditions, and minimal to no change in concentrations through the 12 km stretch of the river. This behavior may be attributed to land use patterns in the region and the contribution of flow from the upstream reservoir. Of the HUC-12 subwatersheds in this region, this subwatershed has some of the highest percentages of agriculture, pasture, and crop land, as well as manure mass application rates (Table 1). Therefore, rural sources of FIB, such as livestock, wildlife, and manure application, are likely within this subwatershed. It also has a lower population density than the other subwatersheds, suggesting that a smaller impact from urban runoff is reasonable. The majority of the forest and agricultural land is in the upstream portion of the watershed; therefore, the FIB concentrations at TW1 would be most likely to resemble rural watersheds. It is useful to consider FIB concentration trends for this system in the context of similar studies from other regions. Comparing the present study to one in California, the geometric means for dry days in this study (18–88 cfu/100 mL) fell between those of natural creeks (10–20 MPN /100 mL) and a developed creek (103 MPN/100 mL [5], and within the range of wet and dry geometric means reported from Sault Ste. Marie, Sarnia, and Windsor Ontario Canada [3]. For all sampling days, both wet and dry, the geometric means for E. coli and Enterococci in Rome are between 79–88 cfu/100 mL and 32–48 cfu/100 mL and are most similar to the St. Mary’s River in Sault Ste. Marie with dry and wet geometric means between 4-162 E. coli units/100 mL [3]. The lack of variability of FIB under rainfall conditions is likely due to the mixing of the well-controlled outflow from the delta lake reservoir with rural FIB sources in the upper portions of the subwatershed [38]. Overall, the concentration of FIB in the Rome region of the Mohawk varies from day to day, but the system appears to benefit from dilution and a lack of any significant urban sources of FIB.
The Mud Creek-Sauquoit Creek subwatershed shares some land use similarities to the subwatershed in Rome. It has similar pasture and cropland percentages, with the lowest population density of the subwatersheds in the Utica region. However, the magnitude of FIB in this region is significantly greater than what is seen in Rome, resulting in geometric means of 598 cfu/100 mL and 214 cfu/100 mL for E. coli and Enterococci. Some of this can be attributed to the small flow of the creek, which had an average flow of 2.6 m3/s during the sampled period, and the inability to absorb FIB sources, particularly urban stormwater runoff, which has been shown to contain FIB on the order of 103–104 units/100 mL [3,7,8]. The higher percentage of developed and impervious land in this subwatershed would be expected to produce a greater proportion of urban runoff. In addition, just under 24% of the stream has 15% or more impervious cover within 30 meters. This combination of land use, coupled with the visible change between dry and wet conditions at SQ2 and moderate correlations with rainfall, suggests urban runoff is a likely source of FIB in this region. Sauquoit Creek responds quickly to rainfall that has the potential to resuspend sediment containing FIB, a potential source of FIB surface water systems [6,21,22,39]. The likely role of sediment in the FIB concentrations in the creek is also supported by a history of high turbidity and sediment impairment; 77% of the stream length in this subwatershed is impaired due to a combination of elevated nutrients, sediment and turbidity, and temperature [30].
The two remaining HUC-12 subwatersheds contain the five sampling locations covering the Mohawk as it enters and flows through Utica. These sample sites and subwatersheds differ from the two discussed previously in two significant ways. First, they are hydrologically connected to the subwatersheds that were just discussed; therefore, conditions from those subwatersheds impact the water that flows into these sites. In addition, the sampling points are not situated at the outlets. Therefore, the sample locations do not necessarily experience the full land use defined by the HUC-12 subwatershed. However, both of these subwatersheds have a higher population density than seen in Rome and the Sauquoit subwatershed, including regions of dense population close to the Mohawk River. Coupled with moderate to strong correlations with rainfall, urban runoff is a likely source of FIB in this region under wet conditions. Geometric means for the sites in Utica ranged from 227–393 cfu/100 mL for E. coli and 74–145 cfu/100 mL for Enterococci, similar to those reported for Windsor Ontario [3]. In addition, the range of FIB concentrations between 102 and 104 cfu/100 mL fits well with other studies of urban river systems such as those seen in the Humber River in Toronto Canada [8] and the Elm Park stream in Dublin Ireland [27]. The statistical difference between water entering and exiting the Utica region supports the view of substantial contributions of FIB unique to this stretch of the Mohawk. Although urban runoff and flow from Sauquoit Creek certainly influence FIB concentrations, the city’s 34 permitted CSOs are also likely to play a role in the elevated FIB concentrations. Although only one active CSO event was captured during the sampling campaign, 139 CSO events occurred between 2017 and 2019. The second order of magnitude increase of FIB from dry weather conditions downstream of the open CSO is consistent with other studies showing multi-log increases in FIB downstream of active CSOs [11,12,19,27]. Overall, CSOs have the potential to cause significant short-term changes in FIB concentrations. Longer-term impacts are less clear but given FIB have been shown to survive within the sediment of river systems and the potential for resuspension under high flow events [36,39,40], the loading of FIB into river sediment from frequent CSO events could result in long-term impacts on water quality [9,12,15]. Therefore, continued efforts to reduce the occurrence of CSOs in this region are recommended.
5. Conclusions
To document the water quality and potential fecal contamination in two cities in upstate New York, water samples were collected and analyzed over a period of three years. Each sample represents conditions at one location at one point in time, resulting in 38 samples at each site. Parameters of interest included in-situ measures of pH, temperature, dissolved oxygen, grab samples for laboratory analysis of nitrates, total organic carbon, E. coli, and Enterococci. These parameters were explored using general statistical analysis, Spearman’s rank correlation, and Wilcoxon rank-sum test.
The main results can be broken down into the following:
- The site-specific results indicate widespread fecal contamination in the Utica portion of the Mohawk River and Sauquoit Creek, with moderate to strong positive monotonic correlations between the E. coli an Enterococci values.
- Enterococci and E. coli concentrations were statistically different between the two cities and tributary, but frequent overlapping distributions were seen within the same city. The FIB concentrations of the Mohawk River entering the city of Utica were found to be statistically different than the elevated concentrations leaving the region.
- Sauquoit Creek and the Mohawk River in Utica demonstrated moderate to strong correlations between FIB and rainfall, suggesting surface runoff sources of FIB are significant in this region. The geometric means and FIB values fall within those expected for urbanized watersheds.
- FIB sources in Rome are most likely associated with agriculture and wildlife. Water quality changes due to wet weather were minimal and are hypothesized to be buffered by influent water from the Delta Lake reservoir. FIB concentrations remained low as water traveled through the urbanized region of the city, suggesting urban sources of FIB were not significant enough to substantially change the water quality during the sampling period.
- FIB concentrations downstream of an active CSO were above the detection limit of >24,200 cfu/100 mL, demonstrating the short-term impact of the CSO on water quality. Downstream sites indicate a moderate correlation between FIB and flow, suggesting the 139 CSO events that occurred between 2017 and 2019 could have acted as future sources of FIB through the loading of the sediment during the CSO and then resuspension in high flow events.
While the evidence and conceptualization of the infrastructure for each city suggest that land use, urban runoff, and combined versus separate sewer systems likely play a role in FIB concentrations, it is important to note that FIB are not source-specific. There is also a question of the significance of resuspension of sediment in this region. Therefore, although the data clearly show elevated FIB, an unanswered question remains regarding the actual source of the FIB (human, bovine, canine, etc.) and whether the sediment is significantly contributing to the observed FIB concentrations [36]. Expanding on this work, a parallel effort began in 2019 to explore the use of PCR-based fecal source tracking for the region, which has the potential to begin to clarify fecal sources and strengthen the conceptualization and understanding of water quality concerns within the region.
Author Contributions
Conceptualization, K.J.L. and C.M.R.; formal analysis, K.J.L., M.O. and C.M.R.; funding acquisition, C.M.R.; investigation, C.M.R.; methodology, K.J.L., M.O. and C.M.R.; project administration, C.M.R.; supervision, C.M.R.; writing—original draft, K.J.L.; and writing—review and editing, K.J.L., M.O. and C.M.R. All authors have read and agreed to the published version of the manuscript.
Funding
This research was partially funded by the New York State Department of Environmental Conservation (NYSDEC), DEC01-T00392GG-3350000. The views within this manuscript are those of the authors and do not represent the NYSDEC.
Data Availability Statement
The data presented in this study are available on request from the corresponding author. The data are not publicly available at this time due to continued use in ongoing research projects.
Acknowledgments
This was the combination of funding from the New York State Department of Environmental Conservation, DEC01-T00392GG-3350000. The views within this manuscript are those of the authors and do not represent the NYSDEC. Special thanks to the 2017–2019 undergraduate sampling team members.
Conflicts of Interest
The authors declare no conflict of interest.
Appendix A
Figure A1.
CSO locations throughout the city of Utica NY. CSO locations are from “Combined Sewer Overflows (CSOs): Beginning 2013” available dataset from data.ny.gov [29]. Sample sites are also marked on the map.
Figure A1.
CSO locations throughout the city of Utica NY. CSO locations are from “Combined Sewer Overflows (CSOs): Beginning 2013” available dataset from data.ny.gov [29]. Sample sites are also marked on the map.

Appendix A.1. Sample Collection and Quality Control

Table A1.
Sample collection and preservation [30].
Table A1.
Sample collection and preservation [30].
| Analyte | Volume (mL) | Container | Preservation | Maximum Holding Time |
|---|---|---|---|---|
| E. coli | 125 | Plastic | Cool < 10 °C | 6 h |
| Enterococci | 125 | Plastic | Cool < 10 °C | 6 h |
| TOC | 500 | Plastic | Cool < 6 °C, H2PO4, HCl, H3PO4 to pH < 2 | 28 days |
| Nitrate | 500 | Plastic | Cool < 6 °C | 48 h |
Appendix A.2. Quality Control
Specific quality control parameters were put into place concerning the following reasons: (1) detector malfunction, (2) detection limit. Detector malfunction applies to sample values in which a number was recorded as a placeholder number due to a detector malfunction at the time of sampling.
Table A2.
Quality control parameters.
| Parameter | Value | Reason |
|---|---|---|
| pH | 3.85–5.2 | Detector Malfunction |
| DO% | 0 | Detector Malfunction |
| DO% | 47000 | Detector Malfunction |
| TOC | 40.78 | Detector Malfunction |
| E-Coli | <9.9 | Below Detection limit |
| E-Coli | 2419.6 | Above Detection Limit |
| Enterococci | <9.9 | Below Detection limit |
| Enterococci | 2419.6 | Above Detection Limit |
| E-Coli * | 24,200.1 | Above Detection Limit |
| Enterococci * | 24,200.1 | Above Detection Limit |
Note(s): * Samples were diluted using 1:10 dilution, resulting in an increased detection limit for the technique.
From 8 June 2017 to 28 June 2017, dissolved oxygen measurements were made in ppm; after this date, DO was measured in % saturation. These earlier samples were converted to DO% using the correlation observed formula [41], and referenced oxygen concentrations were detailed in the electrochemistry manual [42]. For the calculation, it is essential to note that the sample’s temperature that was collected was used, while the pressure was assumed to be 760 mmHg, aka 1 atm, during the sampling period. The error associated with this calculation is ±1%. The saturation value associated with the temperature of the sample measured was interpolated from Table 5, and then DO% was calculated by dividing the DO given/over the interpolated using the equation for % saturation at saturation value *100 to acquire % DO [41].
Table A3.
Spearman’s rank correlation coefficient rs. * p < 0.01, ** p < 0.05.
| pH | T | DO | TOC | ECO | ENT | NIT | R0 | R1 | R2 | R3 | |
|---|---|---|---|---|---|---|---|---|---|---|---|
| pH | 0.13 ** | 0.29 * | −0.30 * | 0.09 | −0.01 | 0.07 | −0.28 * | −0.16 * | −0.17 * | −0.23 * | |
| T | −0.15 * | 0.17 * | −0.03 | −0.02 | 0.41 * | −0.01 | −0.05 | −0.25 * | −0.21 * | ||
| DO | −0.44 * | −0.37 * | −0.21 * | −0.20 * | 0.11 ** | −0.14 * | −0.18 * | −0.16 * | |||
| TOC | 0.36 * | 0.39 * | 0.15 ** | 0.15 * | 0.24 * | 0.34 * | 0.38 * | ||||
| ECO | 0.62 * | 0.37 * | 0.28 * | 0.25 * | 0.25 * | 0.26 * | |||||
| ENT | 0.20 * | 0.35 * | 0.50 * | 0.46 * | 0.47 * | ||||||
| NIT | 0.14 ** | −0.16 * | −0.17 * | 0.12 ** | |||||||
| R0 | 0.65 * | 0.35 * | 0.33 * | ||||||||
| R1 | 0.72 * | 0.64 * | |||||||||
| R2 | 0.88 * | ||||||||||
| R3 |
Table A4.
Wilcoxon sum test p-values, Enterococci.
| TW1 | TW2 | TW3 | SQ2 | WS1 | WU1 | WU2 | WW1 | WW2 | |
|---|---|---|---|---|---|---|---|---|---|
| TW1 | 0.393 | 0.046 | <0.001 | 0.008 | <0.001 | <0.001 | <0.001 | <0.001 | |
| TW2 | 0.318 | <0.001 | 0.021 | <0.001 | <0.001 | 0.002 | <0.001 | ||
| TW3 | <0.001 | 0.170 | 0.001 | 0.003 | 0.017 | <0.001 | |||
| SQ2 | <0.001 | 0.058 | 0.074 | 0.024 | 0.273 | ||||
| WS1 | 0.108 | 0.153 | 0.347 | 0.027 | |||||
| WU1 | 0.953 | 0.641 | 0.600 | ||||||
| WU2 | 0.550 | 0.632 | |||||||
| WW1 | 0.306 | ||||||||
| WW2 |
Table A5.
Wilcoxon sum test p-values, E. coli.
| TW1 | TW2 | TW3 | SQ2 | WS1 | WU1 | WU2 | WW1 | WW2 | |
|---|---|---|---|---|---|---|---|---|---|
| TW1 | 0.630 | 0.690 | <0.001 | <0.001 | <0.001 | <0.001 | <0.001 | <0.001 | |
| TW2 | 1.000 | <0.001 | <0.001 | <0.001 | <0.001 | <0.001 | <0.001 | ||
| TW3 | <0.001 | <0.001 | <0.001 | <0.001 | <0.001 | <0.001 | |||
| SQ2 | <0.001 | 0.005 | 0.005 | 0.030 | 0.200 | ||||
| WS1 | 0.250 | 0.300 | 0.150 | 0.022 | |||||
| WU1 | 0.990 | 0.690 | 0.180 | ||||||
| WU2 | 0.660 | 0.130 | |||||||
| WW1 | 0.450 | ||||||||
| WW2 |
Figure A2.
FIB: Box plots for Enterococci concentrations based on site.

Figure A3.
FIB: Box plots for E. coli concentrations based on site.

References
- Ohrel, R.L.; Register, K.M. Chapter 17: Bacteria Indicators of Potential Pathogens. In Volunteer Estuary Monitoring: A Methods Manual; EPA-842-B-06-003; United States Environmental Protection Agency, Office of Water, Office of Wetlands, Oceans, and Watersheds; Oceans and Coastal Protection Division: Washington, DC, USA, 2006; pp. 1–20. Available online: https://www.epa.gov/nep/volunteer-estuary-monitoring-methods-manual (accessed on 15 June 2022).
- United States Environmental Protection Agency. 2012 Recreational Water Quality Criteria; EPA 820-F-12-058; Office of Water: Washington, DC, USA, 2012. Available online: https://www.epa.gov/wqc/recreational-water-quality-criteria-and-methods (accessed on 15 June 2022).
- Marsalek, J.; Rochfort, Q. Urban wet-weather flows: Sources of fecal contamination impacting on recreational waters and threatening drinking-water sources. J. Toxicol. Environ. Health Part A 2004, 67, 1765–1777. [Google Scholar] [CrossRef] [PubMed]
- Islam, M.M.M.; Hofstra, N.; Islam, A. The Impact of Environmental Variables on Faecal Indicator Bacteria in the Betna River Basin, Bangladesh. Environ. Process. 2017, 4, 319–332. [Google Scholar] [CrossRef]
- Tiefenthaler, L.L.; Stein, E.D.; Lyon, G.S. Fecal indicator bacteria (FIB) levels during dry weather from Southern California reference streams. Environ. Monit. Assess. 2008, 155, 477–492. [Google Scholar] [CrossRef]
- O’Mullan, G.D.; Juhl, A.R.; Reichert, R.; Schneider, E.; Martinez, N. Patterns of sediment-associated fecal indicator bacteria in an urban estuary: Benthic-pelagic coupling and implications for shoreline water quality. Sci. Total Environ. 2018, 656, 1168–1177. [Google Scholar] [CrossRef] [PubMed]
- Paule-Mercado, M.; Ventura, J.; Memon, S.; Jahng, D.; Kang, J.; Lee, C. Monitoring and predicting the fecal indicator bacteria concentrations from agricultural, mixed land use and urban stormwater runoff. Sci. Total Environ. 2016, 550, 1171–1181. [Google Scholar] [CrossRef]
- Staley, Z.R.; Grabuski, J.; Sverko, E.; Edge, T.A. Comparison of microbial and chemical source tracking markers to identify fecal contamination sources in the Humber River (Toronto, Ontario, Canada) and Associated Storm Water Outfalls. Appl. Environ. Microbiol. 2016, 82, 6357–6366. [Google Scholar] [CrossRef] [Green Version]
- Ouattara, N.K.; Passerat, J.; Servais, P. Faecal contamination of water and sediment in the rivers of the Scheldt drainage network. Environ. Monit. Assess. 2011, 183, 243–257. [Google Scholar] [CrossRef] [Green Version]
- Ouattara, N.K.; Garcia-Armisen, T.; Anzil, A.; Brion, N.; Servais, P. Impact of Wastewater Release on the Faecal Contamination of a Small Urban River: The Zenne River in Brussels (Belgium). Water, Air, Soil Pollut. 2014, 225, 2013. [Google Scholar] [CrossRef]
- Mascher, F.; Mascher, W.; Pichler-Semmelrock, F.; Reinthaler, F.F.; Zarfel, G.E.; Kittinger, C. Impact of Combined Sewer Overflow on Wastewater Treatment and Microbiological Quality of Rivers for Recreation. Water 2017, 9, 906. [Google Scholar] [CrossRef] [Green Version]
- Passerat, J.; Ouattara, N.K.; Mouchel, J.-M.; Rocher, V.; Servais, P. Impact of an intense combined sewer overflow event on the microbiological water quality of the Seine River. Water Res. 2011, 45, 893–903. [Google Scholar] [CrossRef]
- Cho, K.H.; Cha, S.M.; Kang, J.-H.; Lee, S.W.; Park, Y.; Kim, J.-W.; Kim, J.H. Meteorological effects on the levels of fecal indicator bacteria in an urban stream: A modeling approach. Water Res. 2010, 44, 2189–2202. [Google Scholar] [CrossRef] [PubMed]
- Byappanahalli, M.N.; Nevers, M.B.; Korajkic, A.; Staley, Z.R.; Harwood, V.J. Enterococci in the environment. Microbiol. Mol. Biol. Rev. 2012, 76, 685–706. [Google Scholar] [CrossRef] [PubMed] [Green Version]
- Fluke, J.; González-Pinzón, R.; Thomson, B. Riverbed Sediments Control the Spatiotemporal Variability of E. coli in a Highly Managed, Arid River. Front. Water 2019, 1, 4. [Google Scholar] [CrossRef]
- Stocker, M.D.; Pachepsky, Y.A.; Hill, R.L.; Shelton, D.R. Depth-Dependent Survival of Escherichia coli and Enterococci in Soil after Manure Application and Simulated Rainfall. Appl. Environ. Microbiol. 2015, 81, 4801–4808. [Google Scholar] [CrossRef] [Green Version]
- Iverson, G.; Sanderford, C.; Humphrey, C.P.; Etheridge, J.R.; Kelley, T. Fecal Indicator Bacteria Transport from Watersheds with Differing Wastewater Technologies and Septic System Densities. Appl. Sci. 2020, 10, 6525. [Google Scholar] [CrossRef]
- Ishii, S.; Ksoll, W.B.; Hicks, R.E.; Sadowsky, M.J. Presence and Growth of Naturalized Escherichia coli in Temperate Soils from Lake Superior Watersheds. Appl. Environ. Microbiol. 2006, 72, 612–621. [Google Scholar] [CrossRef] [Green Version]
- Rechenburg, A.; Koch, C.; Claβen, T.; Kistemann, T. Impact of sewage treatment plants and combined sewer overflow basins on the microbiological quality of surface water. Water Sci. Technol. 2006, 54, 95–99. [Google Scholar] [CrossRef]
- Petersen, F.; Hubbart, J.A. Physical Factors Impacting the Survival and Occurrence of Escherichia coli in Secondary Habitats. Water 2020, 12, 1796. [Google Scholar] [CrossRef]
- Pandey, P.K.; Soupir, M.L. Assessing the Impacts of E. coli Laden Streambed Sediment on E. coli Loads over a Range of Flows and Sediment Characteristics. J. Am. Water Resour. Assoc. 2013, 49, 1261–1269. [Google Scholar] [CrossRef]
- Roslev, P.; Bastholm, S.; Iversen, N. Relationship Between Fecal Indicators in Sediment and Recreational Waters in a Danish Estuary. Water, Air, Soil Pollut. 2008, 194, 13–21. [Google Scholar] [CrossRef]
- Islam, M.M.M.; Sokolova, E.; Hofstra, N. Modelling of river faecal indicator bacteria dynamics as a basis for faecal contamination reduction. J. Hydrol. 2018, 563, 1000–1008. [Google Scholar] [CrossRef]
- Ekklesia, E.; Shanahan, P.; Chua, L.H.C.; Eikaas, H. Temporal variation of faecal indicator bacteria in tropical urban storm drains. Water Res. 2015, 68, 171–181. [Google Scholar] [CrossRef] [PubMed]
- Herrig, I.M.; Böer, S.I.; Brennholt, N.; Manz, W. Development of multiple linear regression models as predictive tools for fecal indicator concentrations in a stretch of the lower Lahn River, Germany. Water Res. 2015, 85, 148–157. [Google Scholar] [CrossRef] [PubMed]
- Marti, R.; Gannon, V.P.J.; Jokinen, C.; Lanthier, M.; Lapen, D.R.; Neumann, N.F.; Ruecker, N.J.; Scott, A.; Wilkes, G.; Zhang, Y.; et al. Quantitative multi-year elucidation of fecal sources of waterborne pathogen contamination in the South Nation River basin using Bacteroidales microbial source tracking markers. Water Res. 2013, 47, 2315–2324. [Google Scholar] [CrossRef]
- Reynolds, L.J.; Martin, N.A.; Sala-Comorera, L.; Callanan, K.; Doyle, P.; O’Leary, C.; Buggy, P.; Nolan, T.M.; O’Hare, G.M.P.; O’Sullivan, J.J.; et al. Identifying Sources of Faecal Contamination in a Small Urban Stream Catchment: A Multiparametric Approach. Front. Microbiol. 2021, 12, 661954. [Google Scholar] [CrossRef]
- Surbeck, C.Q.; Jiang, S.C.; Grant, S.B. Ecological Control of Fecal Indicator Bacteria in an Urban Stream. Environ. Sci. Technol. 2009, 44, 631–637. [Google Scholar] [CrossRef]
- New York Open Data, New York State Department of Environmental Conservation. Combined Sewer Overflows (CSOs): Beginning 2013. [Data file] Last updated 10 November 2020. Available online: https://data.ny.gov/Energy-Environment/Combined-Sewer-Overflows-CSOs-Beginning-2013/ephi-ffu6 (accessed on 3 July 2022).
- Pickard, B.R.; Daniel, J.; Mehaffey, M.; Jackson, L.E.; Neale, A. EnviroAtlas: A new geospatial tool to foster ecosystem services science and resource management. Ecosyst. Serv. 2015, 14, 45–55. [Google Scholar] [CrossRef] [Green Version]
- U.S. Geological Survey; Lurry, D.L.; Kolbe, C.M. Interagency Field Manual for the Collection of Water-Quality Data; Dept. of the Interior, U.S. Geological Survey: Austin, TX, USA, 2000.
- U.S. Geological Survey, 2016, National Water Information System Data Available on the World Wide Web (USGS Water Data for the Nation). Available online: http://waterdata.usgs.gov/nwis/ (accessed on 15 June 2022).
- Dancey, C.P.; Reidy, J. Statistics without Maths for Psychology; Pearson Education: London, UK, 2007. [Google Scholar]
- Stumpf, C.H.; Piehler, M.F.; Thompson, S.; Noble, R.T. Loading of fecal indicator bacteria in North Carolina tidal creek headwaters: Hydrographic patterns and terrestrial runoff relationships. Water Res. 2010, 44, 4704–4715. [Google Scholar] [CrossRef]
- New York State Department of Environmental Conservation. Sewage Pollution Right to Know Sewage Historical Discharge Reports. Available online: https://www.dec.ny.gov/chemical/101187.html (accessed on 15 June 2022).
- Bradshaw, J.K.; Snyder, B.J.; Oladeinde, A.; Spidle, D.; Berrang, M.E.; Meinersmann, R.J.; Oakley, B.; Sidle, R.C.; Sullivan, K.; Molina, M. Characterizing relationships among fecal indicator bacteria, microbial source tracking markers, and associated waterborne pathogen occurrence in stream water and sediments in a mixed land use watershed. Water Res. 2016, 101, 498–509. [Google Scholar] [CrossRef] [Green Version]
- New York State Department of Environmental Conservation. Mohawk River Basin Action Agenda: 2021–2026. Available online: https://www.dec.ny.gov/docs/water_pdf/mohawkrbaa2021.pdf (accessed on 15 June 2022).
- Baral, D.; Speicher, A.; Dvorak, B.; Admiraal, D.; Li, X. Quantifying the Relative Contributions of Environmental Sources to the Microbial Community in an Urban Stream under Dry and Wet Weather Conditions. Appl. Environ. Microbiol. 2018, 84. [Google Scholar] [CrossRef] [Green Version]
- Petersen, F.; Hubbart, J.A. Quantifying Escherichia coli and Suspended Particulate Matter Concentrations in a Mixed-Land Use Appalachian Watershed. Water 2020, 12, 532. [Google Scholar] [CrossRef] [Green Version]
- Badgley, B.D.; Thomas, F.I.M.; Harwood, V.J. Quantifying environmental reservoirs of fecal indicator bacteria associated with sediment and submerged aquatic vegetation. Environ. Microbiol. 2011, 13, 932–942. [Google Scholar] [CrossRef] [PubMed]
- Water on the Web: Understanding: Water Quality: Parameters. Available online: http://www.waterontheweb.org/under/waterquality/parameters.html (accessed on 12 December 2020).
- Bier, A. Electrochemistry-Theory and Practice, 3rd ed.; DOC182.53.90629; HACH: Loveland, CO, USA, 2018; Available online: https://www.hach.com/asset-get.download-en.jsa?id=7672493965 (accessed on 23 November 2020).
Figure 1.
Mohawk River water quality sampling locations. Legend shows Sample ID followed by latitude and longitude.
Figure 1.
Mohawk River water quality sampling locations. Legend shows Sample ID followed by latitude and longitude.

Figure 2.
Plot of geometric means for FIB under dry (R3 = 0) and wet conditions.

Figure 3.
Measured versus predicted values of FIB after the confluence of Sauquoit Creek and the Mohawk River in Utica, NY.
Figure 3.
Measured versus predicted values of FIB after the confluence of Sauquoit Creek and the Mohawk River in Utica, NY.

Figure 4.
Plot of rainfall and flow in the Mohawk and Sauquoit Creek as a function of time on 17 July 2019. Timeline of CSO activation and sampling of specific sites is shown below to demonstrate collection of samples prior to activation of CSOs upstream.
Figure 4.
Plot of rainfall and flow in the Mohawk and Sauquoit Creek as a function of time on 17 July 2019. Timeline of CSO activation and sampling of specific sites is shown below to demonstrate collection of samples prior to activation of CSOs upstream.

Table 1.
Land use and population statistics for HUC-12 subwatershed.
| HUC-12 | 20200040301 | 20200040309 | 20200040310 | 20200040311 |
| HUC-12 Name | Headwaters Mohawk River | Mud Creek—Sauquoit Creek | Crane Creek—Mohawk River | Reall Creek—Mohawk River |
| Sample Sites | TW1, TW2, TW3 | SQ2 | WS1, WU1, WU2 | WW1, WW2 |
| Area (km2) | 47.81 | 130.30 | 151.87 | 185.78 |
| Pop. density (/km2) | 582.69 | 566.18 | 788.33 | 812.89 |
| % Developed | 26.31 | 37.27 | 36.77 | 25.65 |
| % Forest | 39.64 | 31.04 | 35.58 | 50.36 |
| %Wetland | 4.32 | 3.96 | 7.16 | 4.27 |
| % Agriculture | 31.15 | 25.40 | 16.32 | 20.73 |
| % Pasture | 16.57 | 15.10 | 13.00 | 13.06 |
| % Cropland | 10.67 | 9.55 | 2.93 | 4.04 |
| % Impervious | 7.00 | 10.84 | 13.09 | 7.87 |
| Manure application (kg N/km2/yr) | 4.53 | 3.50 | 2.05 | 2.83 |
| Percent of stream and shoreline with 15% or more impervious cover within 30 meters | 10.24 | 23.80 | 7.31 | 10.20 |
Table 2.
General statistics (n = 341 samples).
| pH | T | DO | TOC | ECO | ENT | NIT | R0 | R1 | R2 | R3 | |
|---|---|---|---|---|---|---|---|---|---|---|---|
| (−) | (°C) | (% Sat) | (mg/L) | (cfu/100mL) | (cfu/100mL) | (mg/L) | (mm) | (mm) | (mm) | (mm) | |
| Arithmetic Mean | 7.9 | 19.33 | 87.1 | 3.2 | 635.5 | 618.4 | 1.1 | 2.5 | 7.6 | 12.7 | 15.2 |
| Geometric Mean | 7.9 | 19.22 | 85.9 | 3 | 208.1 | 83.3 | 0.8 | N/A | N/A | N/A | N/A |
| Median | 7.9 | 19.50 | 86.1 | 3 | 194.2 | 53.2 | 0.9 | 0.0 | 2.5 | 7.6 | 10.2 |
| Range | 2 | 13.61 | 122.8 | 12 | 24190.2 | 24190.2 | 4.9 | 30.5 | 78.7 | 78.7 | 78.7 |
| Variance | 0.1 | 13.06 | 213.4 | 2 | 3.09 × 10⁶ | 4.87 × 10⁶ | 0.5 | 2.5 | 7.6 | 7.6 | 10.2 |
| Standard deviation | 0.4 | 2.72 | 14.6 | 1.4 | 1757.3 | 2205.8 | 0.7 | 7.6 | 15.2 | 15.2 | 17.8 |
| Maximum | 8.8 | 25.00 | 175.3 | 12.7 | >24,200 | >24,200 | 4.9 | 30.5 | 78.7 | 78.7 | 78.7 |
| Minimum | 6.8 | 11.39 | 52.5 | 0.7 | <10 | <10 | 0 | 0.0 | 0.0 | 0.0 | 0.0 |
Table 3.
Site-specific characterization: E. coli (n = 38).
| Site | GM (cfu/100mL) | %ABAV | Statistical Difference in FIB Distribution (p < 0.05) | Moderate to Strong Spearman Rank Correlations (p < 0.05) |
|---|---|---|---|---|
| TW1 | 87.68 | 5% | WS1, SQ2, WU1, WU2, WW1, and WW2 | |
| TW2 | 83.25 | 8% | WS1, SQ2, WU1, WU2, WW1, and WW2 | R0 (0.41) |
| TW3 | 79.12 | 5% | WS1, SQ2, WU1, WU2, WW1, and WW2 | ENT (0.44), R0 (0.57) |
| WS1 | 227.72 | 49% | TW1, TW2, TW3, SQ2, and WW2 | TOC (0.41), R0 (0.49), R1 (0.48), R2 (0.41), and R3 (0.42) |
| SQ2 | 598.21 | 84% | TW1, TW2, TW3, WS1, WU1, WU2, and WW1 | TOC (0.7), ENT (0.78), NIT (−0.67), R0 (0.49), R1 (0.52), R2 (0.46), and R3 (0.52) |
| WU1 * | 328.6 | 58% | TW1, TW2, TW3, and SQ2 | TOC (0.48), R2 (0.4) |
| WU2 | 340.85 | 59% | TW1, TW2, TW3, and SQ2 | ENT (0.42) |
| WW1 | 334 | 65% | TW1, TW2, TW3, and SQ2 | DO% (−0.5), TOC (0.44), FLO (0.45), ENT (0.58), R1 (0.41), R2 (0.54), and R3 (0.58) |
| WW2 | 393.09 | 76% | TW1, TW2, TW3, and WS1 | ENT (0.78), R1 (0.49), R2 (0.54), and R3 (0.62) |
Note(s): * n for WU1 is 37, strong correlations are bold.
Table 4.
Site-specific characterization: Enterococci (n = 38).
| Site | GM | %ABAV | Statistical Difference p < 0.05 | Moderate to Strong Spearman Rank Correlations |
|---|---|---|---|---|
| TW1 | 32.43 | 11% | TW3, WS1, SQ2, WU1, WU2, WW1, and WW2 | TOC (0.48), R1 (0.42) |
| TW2 | 38.15 | 14% | WS1, SQ2, WU1, WU2, WW1, and WW2 | R1 (0.48) |
| TW3 | 48.05 | 22% | TW1, SQ2, WU1, WU2, WW1, and WW2 | ECO (0.44), R0 (0.58), R1 (0.46), and R2 (0.4) |
| WS1 | 74.46 | 43% | TW1, TW2, SQ2, and WW2 | TOC (0.57), R1 (0.69), R2 (0.6), and R3 (0.63) |
| SQ2 | 214.19 | 81% | TW1, TW2, TW3, WS1, and WW1 | TOC (0.72), ECO (0.78), R0 (0.55), R1 (0.51), and R3 (0.45) |
| WU1 * | 104.08 | 56% | TW1, TW2, and TW3 | TOC (0.56), R1 (0.59), R2 (0.56), and R3 (0.54) |
| WU2 | 104.63 | 51% | TW1, TW2, and TW3 | TOC (0.56), ECO (0.42), R0 (0.41), R1 (0.69), R2 (0.69), and R3 (0.66) |
| WW1 | 119.32 | 51% | TW1, TW2, TW3, and SQ2 | TOC (0.43), FLO (0.51), ECO (0.58), R1 (0.64), R2 (0.62), and R3 (0.68) |
| WW2 | 145.83 | 62% | TW1, TW2, TW3, and WS1 | FLO (0.55), ECO (0.78), R0 (0.43), R1 (0.63), R2 (0.65), and R3 (0.75) |
Note(s): * n for WU1 is 37; strong correlations are bold.
Table 5.
FIB concentrations (cfu/100mL) at sites from the Utica region from 16 July to 18 July; 17 July included an active CSO between WW1 and WW2.
Table 5.
FIB concentrations (cfu/100mL) at sites from the Utica region from 16 July to 18 July; 17 July included an active CSO between WW1 and WW2.
| Site | 16 July 2019 | 17 July 2019 | 18 July 2019 | |||
|---|---|---|---|---|---|---|
| ECO | ENT | ECO | ENT | ECO | ENT | |
| WS1 | 269 | <10 | 820 | 364 | 10 | 6870 |
| SQ2 | 471 | 238 | 3450 | 3450 | 5170 | 1150 |
| WU1 | 364 | 41 | 862 | 473 | 52 | 6870 |
| WU2 | 341 | 63 | 1140 | 624 | 41 | 5790 |
| WW1 | 292 | 31 | 573 | 305 | 5480 | 8160 |
| WW2 | 504 | 52 | >24,200 | >24,200 | 6130 | >24,200 |
Publisher’s Note: MDPI stays neutral with regard to jurisdictional claims in published maps and institutional affiliations. |
© 2022 by the authors. Licensee MDPI, Basel, Switzerland. This article is an open access article distributed under the terms and conditions of the Creative Commons Attribution (CC BY) license (https://creativecommons.org/licenses/by/4.0/).
Share and Cite
MDPI and ACS Style
Lininger, K.J.; Ormanoski, M.; Rodak, C.M. Observations and Correlations from a 3-Year Study of Fecal Indicator Bacteria in the Mohawk River in Upstate NY. Water 2022, 14, 2137. https://doi.org/10.3390/w14132137
AMA Style
Lininger KJ, Ormanoski M, Rodak CM. Observations and Correlations from a 3-Year Study of Fecal Indicator Bacteria in the Mohawk River in Upstate NY. Water. 2022; 14(13):2137. https://doi.org/10.3390/w14132137
Chicago/Turabian StyleLininger, Kyle J., Michael Ormanoski, and Carolyn M. Rodak. 2022. "Observations and Correlations from a 3-Year Study of Fecal Indicator Bacteria in the Mohawk River in Upstate NY" Water 14, no. 13: 2137. https://doi.org/10.3390/w14132137
Note that from the first issue of 2016, this journal uses article numbers instead of page numbers. See further details here.