
SLONIP—A Slovenian Web-Based Interactive Research Platform on Water Isotopes in Precipitation


1
Department of Environmental Sciences, Jožef Stefan Institute, Jamova Cesta 39, 1000 Ljubljana, Slovenia
2
Faculty of Mathematics and Physics, University of Ljubljana, Jadranska Ulica 19, 1000 Ljubljana, Slovenia
*
Author to whom correspondence should be addressed.
Water 2022, 14(13), 2127; https://doi.org/10.3390/w14132127
Submission received: 9 May 2022
/
Revised: 27 June 2022
/
Accepted: 28 June 2022
/
Published: 4 July 2022
(This article belongs to the Special Issue Isotope Fingerprints of Precipitation in Groundwater, Lakes and Rivers)
Abstract
:Knowledge of how the isotopic composition (i.e., δ2H, δ18O and 3H) of precipitation changes within an individual catchment allows the origins of surface and groundwater to be differentiated and the dynamic characteristics of water within individual water bodies to be traced. This paper presents the Slovenian Network of Isotopes in Precipitation (SLONIP), a research platform that has been operating since April 2020. The SLONIP platform currently contains 2572 isotope data points of monthly composite precipitation from eight locations obtained from various investigations performed since 1981. It also provides information about a sample’s location, analysis, and links to the relevant scientific papers. It also presents the data in numerical and graphical form, including monthly, seasonal, and annual means and local meteoric water lines, all calculated using a Python code made freely available on GitHub. The platform provides essential information for geographically, climatologically, and geologically diverse regions like Slovenia and can help improve our understanding of the water cycle on a local and regional scale.
Keywords:
precipitation; isotopic composition; oxygen; hydrogen; d-excess; tritium; LMWL; statistical evaluation; Python; Slovenia1. Introduction
Water is crucial for life and moves through the Earth’s four spheres as part of the water cycle via evaporation, transpiration, condensation, precipitation, infiltration, and runoff. The natural water cycle is also influenced by anthropogenic activities, e.g., water extraction, including pumping for human, agricultural, and industrial use, water treatment, water storage, distribution, and wastewater treatment. Precipitation represents an integral part of the hydrological cycle, as it is the primary source of surface water and groundwater. Existing patterns of precipitation and storm events are likely to change in the future since precipitation is directly impacted by changes in atmospheric circulation, in addition to the increase in water vapor resulting from a warmer climate due to increased emissions of greenhouse gases [1]. Water molecules, as they move through the water cycle, i.e., from ocean to precipitation to surface and eventually groundwater, can be traced using the stable (16O, 17O, 18O, 1H, 2H) and radioactive (3H) isotopes, e.g., [2,3,4,5,6,7,8,9,10]. This is possible because the isotopic composition of precipitation and its temporal and spatial distribution are determined by local and regional geographical characteristics (e.g., latitude, altitude, distance from the oceans), origin and mixing of air masses, temperature, amount of precipitation, humidity, evaporation, and seasonal changes [3,4,6,11]. Therefore, understanding temporal and spatial variations in the amount and mode of precipitation and information regarding the stable isotopic composition of hydrogen (δ2H) and oxygen (δ18O) together with the activity concentration of tritium (3H) is essential [6,8,10,11,12,13].
In 1958, developments in analytical techniques allowing the isotopic composition of precipitation to be characterized [2] led the International Atomic Energy Agency (IAEA), in collaboration with the World Meteorological Organization (WMO), to collect data on the isotopic composition of global precipitation. In 1961, a global network of stations [8] was established, and the first isotopic data with ancillary meteorological data were provided to the Global Network of Isotopes in Precipitation (GNIP) database, which has been maintained by the IAEA [5]. The dataset contains more than 130,000 precipitation isotope records from >1000 stations worldwide and is an invaluable resource for water cycle investigations, validation, and improvement of climatic prediction models and other applications on the regional and global scales [14]. The GNIP portal also provides a location map, δ2H versus δ18O plot, monthly, annual, and long-term isotope means, and two types of regression lines. In addition, basic information about the contributing partner, related references, and downloadable data files are provided. The shortcomings of GNIP have been the slow collection and publication of data, lack of data for specific research areas, and information about the data source, including sampling, analysis, and other specific information important for a particular location. Moreover, participation in GNIP is voluntary, so long-term data (i.e., >40 years) are rare, and the number of stations reporting data has changed over time.
On the national level, many researchers have reported on the isotope in precipitation networks operating in Austria [15], Australia [16], Canada [17], Chile [18], China [19], Germany [20], Hungary, Italy [21], Malawi [22], Switzerland [13], USA [9,23,24], Siberia [25], and, on the regional level, in the Adriatic–Pannonian region [26,27,28]. Interestingly, besides GNIP, only certain countries (e.g., Switzerland and Austria in Europe) have established a network of stations where the isotopic composition of precipitation is regularly monitored on a long-term monthly basis, maintained on the federal level, and where the data is accessible via a website. Consequently, the GNIP database is mainly used in water resources investigations and modeling [29,30], while the data from smaller networks are rarely included in regional or global simulations [9,18,26,27,28,31,32]. However, for most networks, data availability is limited, and there is a delay in updating datasets. In addition, the available databases lack functionality beyond data access and overview, such as user-friendly visualizations and analytical processing, i.e., functionalities typically available in other environmental applications [33,34].
Geographical diversity (e.g., complex topography, geomorphology, and diverse vegetation), geographical location, and the mixing of continental, subalpine or alpine, and sub-Mediterranean climates have a major effect on the climate of Slovenia and its meteorological characteristics [35], which vary significantly [36]. Additionally, the geological composition of the territory influences hydrological and hydrogeological characteristics, which makes data on the isotopic composition of precipitation in this area interesting. In Slovenia, although the monitoring of precipitation is performed as part of the regular activities of the Slovenian Environmental Agency (ARSO), monitoring the isotopic composition of precipitation is not included in the regular national monitoring program. However, a review of isotopes in precipitation activities in Slovenia (1981 to 2015) reveals numerous short-term investigations [37]. The outcome of this review is what stimulated the establishment of the Slovenian Network of Isotopes in Precipitation (SLONIP), a web-based interactive research platform [38].
This paper aims to briefly summarize past investigations into the isotopic composition of precipitation in Slovenia and present the development and functioning of the SLONIP platform, established and maintained by the Jožef Stefan Institute (JSI). As part of SLONIP, we aimed to provide detailed sampling locations, analytical details, a list of relevant references, data in numerical form, and their visualization. Calculations of monthly, seasonal, and annual means and local meteoric water lines are also included. In addition, a Python code for statistical evaluations and graphical presentations was developed and is available on GitHub [38].
2. Materials and Methods
2.1. The History of the SLONIP
Briefly, the first research on the isotopic composition of oxygen and hydrogen in precipitation in Slovenia was performed as part of tracer experiments in the karst Ljubljanica River drainage basin between 1972–1975 [39]. Unfortunately, the analyses were performed in Germany and Austria, and the raw data are not publicly available. The systematic monitoring of isotopes in precipitation in Slovenia began in 1981, but only in Ljubljana [26,27,28,37,40,41,42,43,44]. In 2000, as a part of Mediterranean precipitation investigations [44], we identified the need for a more refined understanding of the isotopic variation of precipitation. In response, a program for collecting new data with higher spatial and temporal resolution in different parts of the country was initiated [44,45,46]. Since then, the number of sampling locations has grown into a countrywide Slovenian Network of Isotopes in Precipitation (SLONIP). However, during a review of past monitoring activities performed in the period 1981–2015 [37], recommendations were made regarding future monitoring based on several gaps identified, such as the limited information about past sampling locations and sampling methods. Also, researchers have used different approaches, and additional meteorological data and information on how these data were obtained are often missing. Isotope techniques and evaluation approaches have also changed and developed with time. Another issue is that numerical data is presented in graphical form in many cases, and only a limited amount of data collected at a particular station is publicly available [37], and only part of the data set provided by the JSI is available in the international GNIP database.
The idea of establishing the Slovenian Network of Isotopes of Precipitation (SLONIP) research platform following the GNIP model was presented for the first time in 2006 [47]. This initiative was followed by a lengthy transitional period, where various activities took place. Unfortunately, these were not unified at the national or inter-institute level [37]. Finally, in 2015, the infrastructure at the JSI was upgraded, which enabled the independent monitoring of water isotopes in precipitation at selected sites in Slovenia. Simultaneously, a need appeared to make the SLONIP platform publicly accessible and interactive. While part of the functionality of the SLONIP platform is related to that of GNIP (e.g., information on measurement stations along with monthly, annual, and long-term isotopic means and regression lines), SLONIP has added functionality enabling data processing and visualization (Section 3).
2.2. SLONIP Platform Architecture
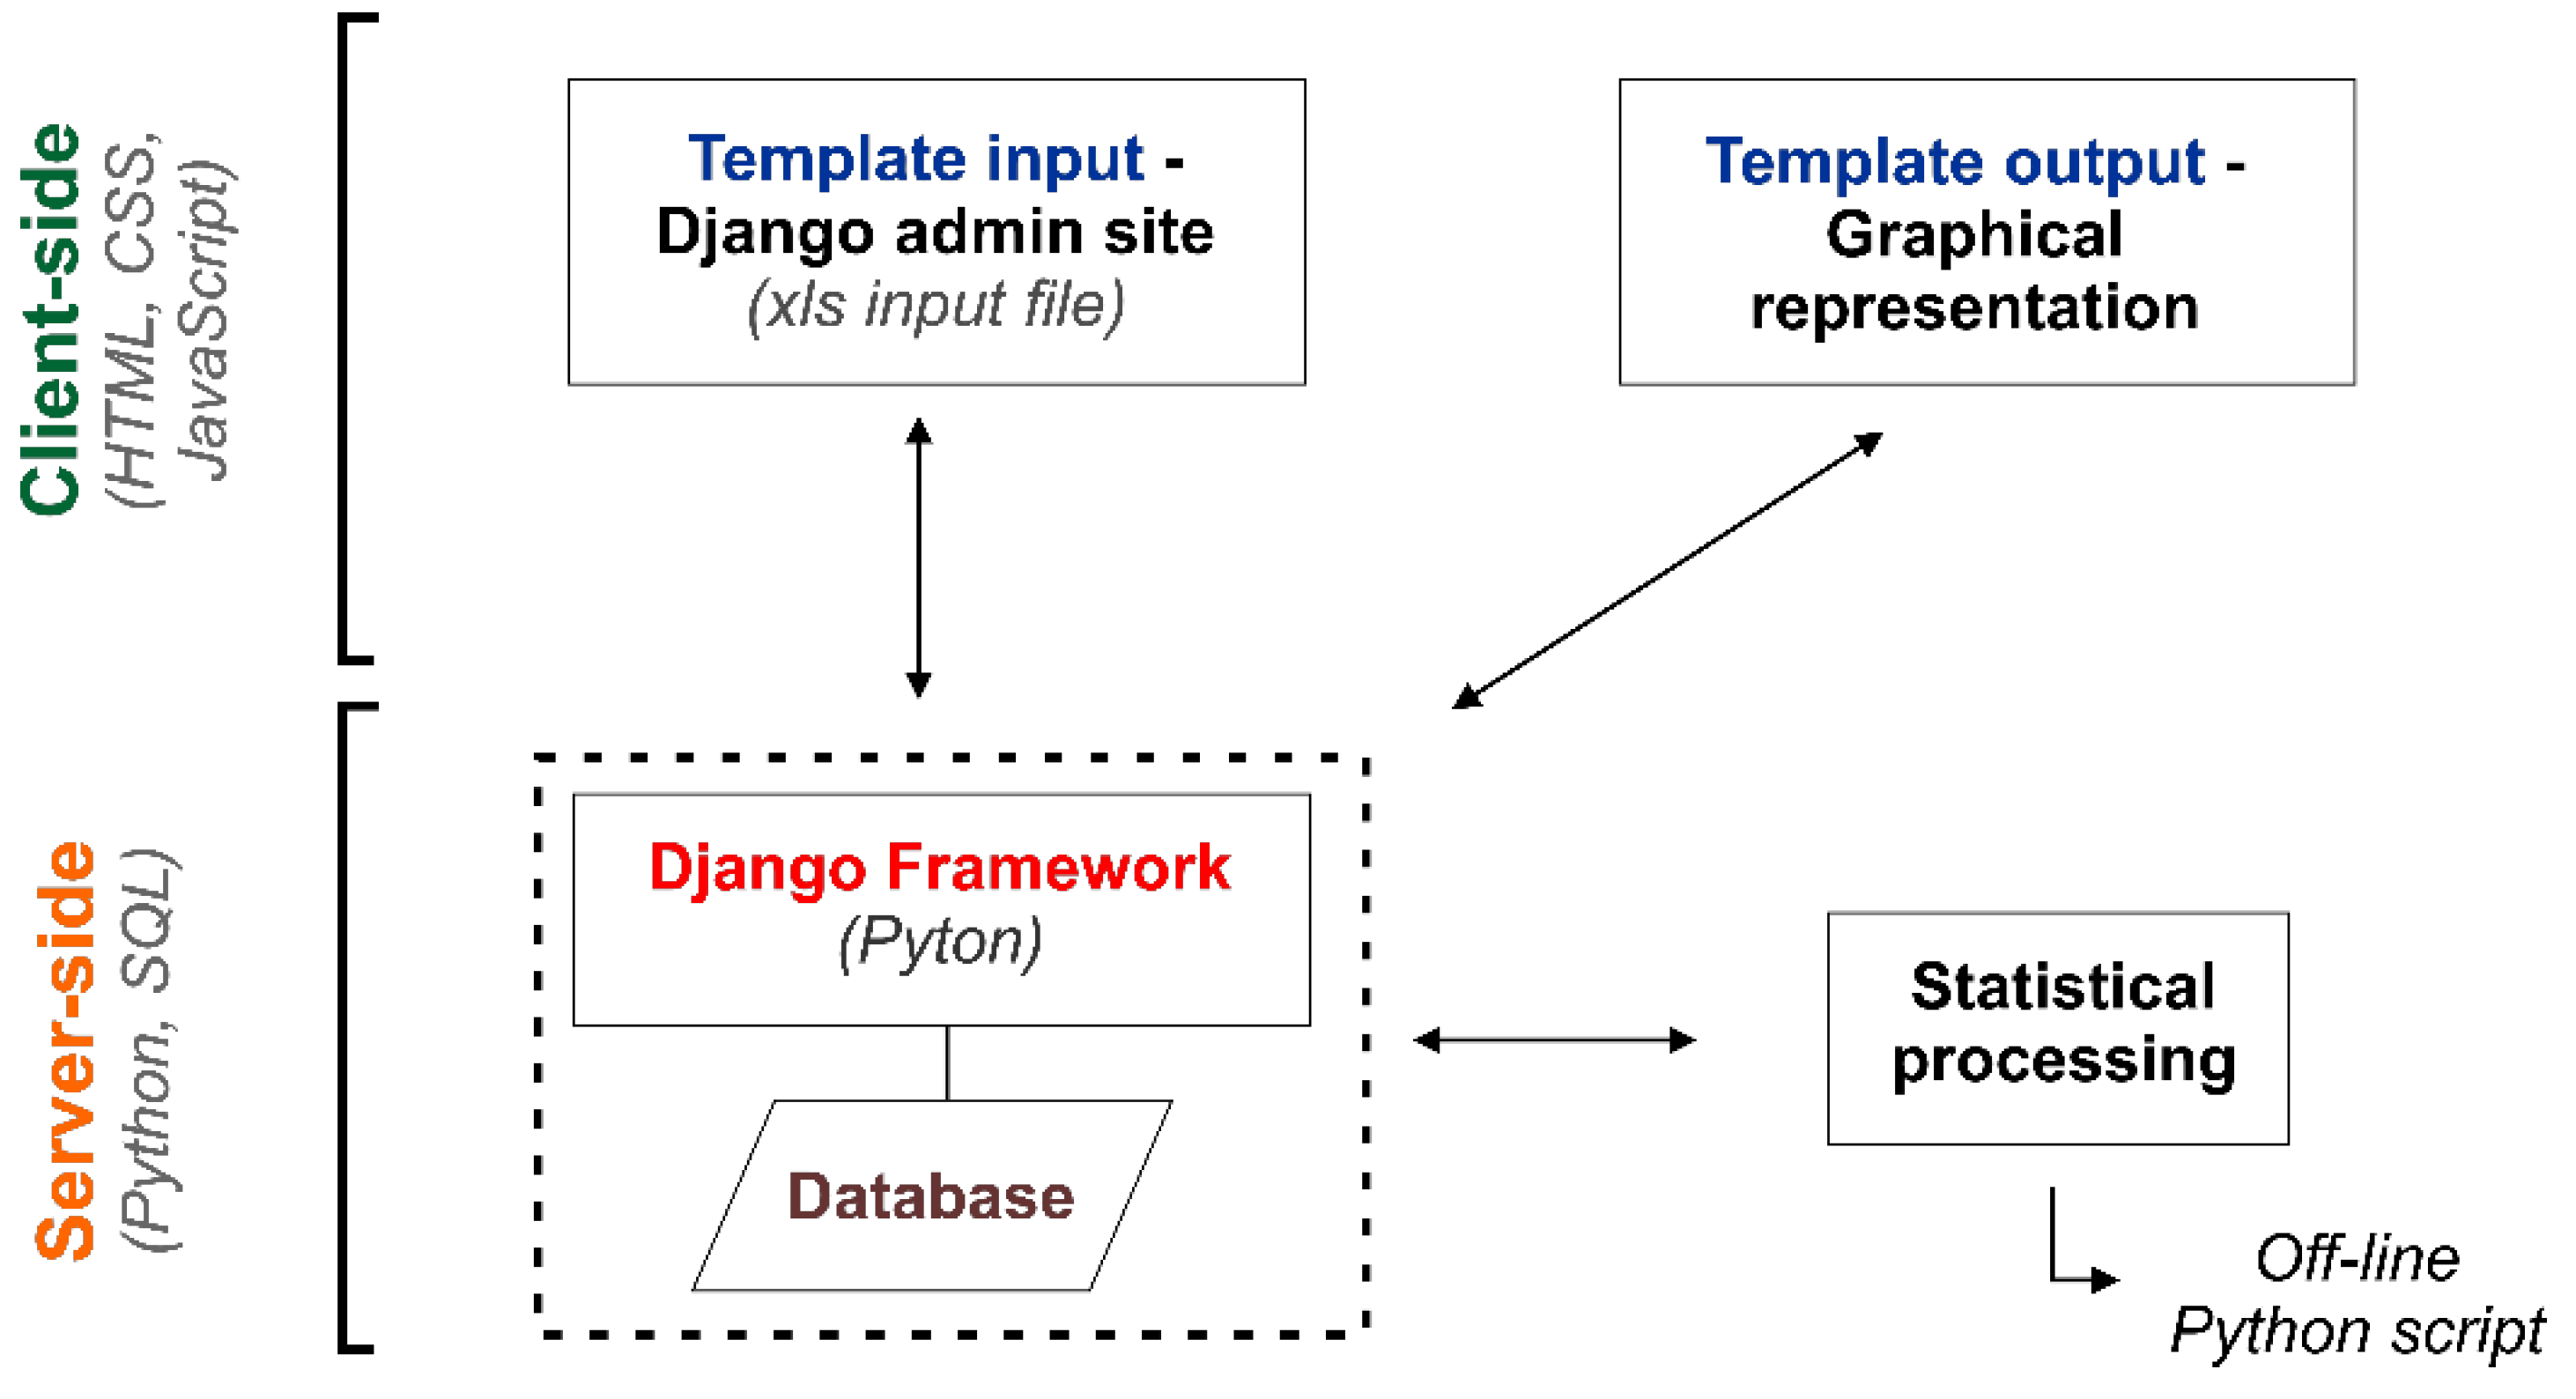
The structure of the code for the interactive SLONIP platform is based on Django [48], i.e., a server-side web framework written in the programming language Python. Django represents the logical foundation of the code that serves as the platform’s backend (i.e., the server-side) and is capable of communicating with the frontend (i.e., the client-side). The platform’s frontend is the part of the code responsible for the graphical interface as seen by the web user. The backend takes care of the data displayed on the page. It makes sure it is safely stored in a database and that the data is readily available if instructed by the frontend (triggered by an action performed by a web user) and is where the statistical processing of the data is performed.
The architecture of the SLONIP platform is schematically depicted in Figure 1. The webpage is built in an admin-friendly way, i.e., the admin is not required to apply any explicit changes to the code to change the content displayed on the client-side. The content comprises numerical data and textual information (displayed in paragraphs on the website). The content manipulation of the page can be done through the website Django-admin interface. For example, an administrator can create a new station (object) and assign different attributes such as raw data files and supplementary info to it. Specifically, the raw data files (xls) administered via the website’s admin page are statistically processed in the backend with the help of the same code that is an integral part of the offline program, publicly available on GitHub [38] (https://github.com/nyuhanc/Isotopes-in-precipitation-statistics) (accessed on 6 May 2022). Once processed, data are stored in the database, ready to be sent back to the frontend, where they are displayed as graphs and tables.
2.3. Selection of Stations and Data Attributes
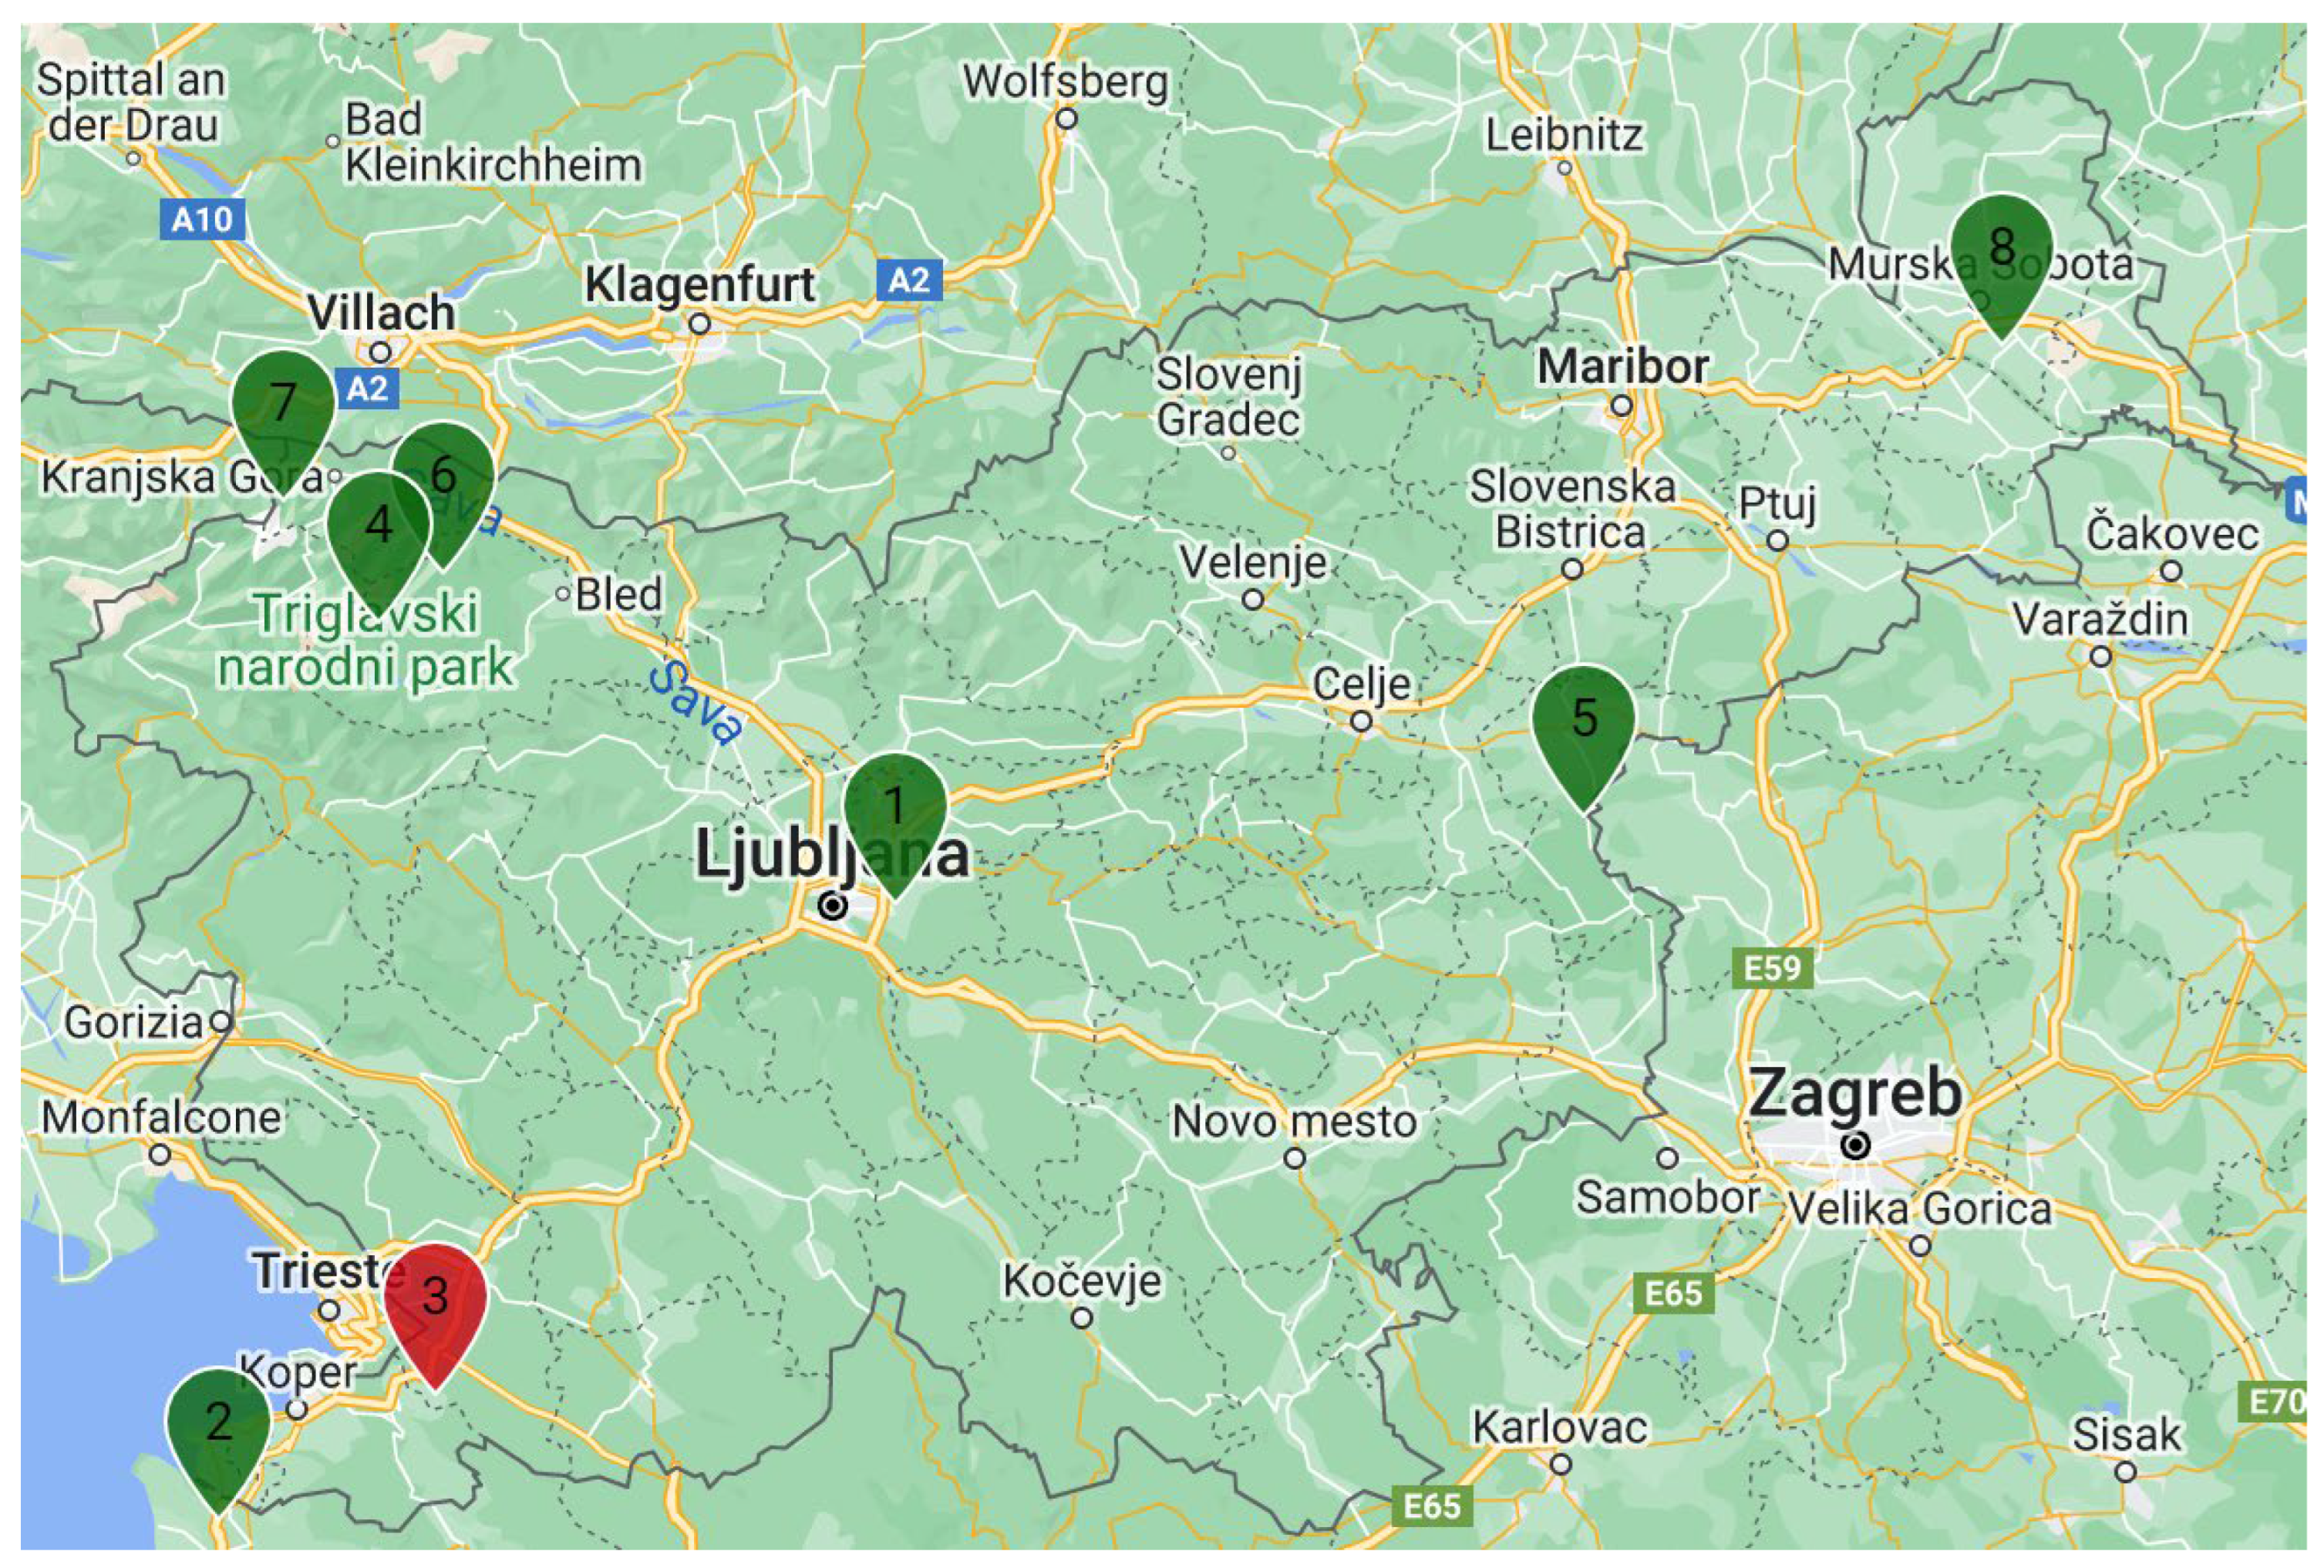
The selection of stations on the SLONIP platform was based on a review of the isotope in precipitation monitoring activities performed between 1981 and 2015 [37] and Slovenian climate characteristics. The selection, eight stations in total, was confirmed by a geostatistical evaluation of the network in the context of Slovenian—Hungarian research cooperation [26,27,28]. The locations of the eight stations (Ljubljana, Portorož, Kozina, Kredarica, Rateče, Zg. Radovna, Murska Sobota and Sv. Urban) are presented in Figure 2, and their main attributes, station ID, station name, latitude, longitude, altitude, and type of station, are given in Table 1. The “green” stations correspond to stations active until the end of 2021, while the stations colored “red” are inactive. The data for Ljubljana (Table 1), where the station was moved twice in the past [42,43], are merged into a single data set (i.e., Ljubljana) because no significant differences were observed in the published and evaluated dataset [42,43,49].
Thirty-two different data attributes were selected for each station (Table 2). The data were then used for statistical calculations and uploaded to the website (see Section 3.1).
2.4. Isotopes in Precipitation Data Acquisition
Although sampling and analysis have changed with time [37], the most rational approach for monitoring isotopes in precipitation is to perform monthly composite sampling at meteorological stations that are part of a national network [5,37], such as the Slovenian National Meteorological Network maintained by the Slovenian Environmental Agency (ARSO; [50]), which provide reliable meteorological data. Therefore, isotopic monitoring was performed at ARSO’s meteorological synoptic or precipitation stations (Table 1). Precipitation samples were collected by the staff of ARSO from a classical rain gauge collector three times (synoptic stations) or once per day (precipitation stations). In a few cases, sampling was conducted at stations maintained by the JSI (i.e., Ljubljana–JSI, Ljubljana–Reaktor [37,42,43]) or volunteers (i.e., Sv. Urban [51]). In all cases, the samples were collected as soon as possible after a precipitation event. Sampling details before 2015 are available on the SLONIP platform [52] and in the review of Vreča and Malenšek [37]. Since 2016, impurities (e.g., particulate matter) have been removed by filtration (12–25 μm pore size ashless filter papers). Samples for hydrogen and oxygen stable isotope measurements were stored in glass bottles (minimum 30 mL) and in high-density polyethylene bottles (minimum 300 mL) for activity concentration of tritium measurements.
Figure 2.
Locations of active (green) and inactive (red) SLONIP stations (base map source: Google Maps). The numbers correspond to upload on the website and not to Station ID.
Figure 2.
Locations of active (green) and inactive (red) SLONIP stations (base map source: Google Maps). The numbers correspond to upload on the website and not to Station ID.


Table 1.
SLONIP station attributes. ARSO—Slovenian Environmental Agency; JSI—Jožef Stefan Institute.
Table 1.
SLONIP station attributes. ARSO—Slovenian Environmental Agency; JSI—Jožef Stefan Institute.
| Station ID | Station Name | Latitude | Longitude | Altitude | Type of Station | Köppen–Geiger Climate Code [53] |
|---|---|---|---|---|---|---|
| ° N | ° E | m | ||||
| SLO_01 | Ljubljana–Bežigrad | 46.065507 | 14.512352 | 299 | Synoptic ARSO | |
| SLO_02 | Ljubljana–JSI | 46.041944 | 14.487778 | 292 | Other at JSI | Cfb |
| SLO_03 | Ljubljana–Reaktor 1 | 46.094612 | 14.597046 | 282 | Other at JSI | |
| SLO_04 | Portorož | 45.475314 | 13.615985 | 2 | Synoptic ARSO | Cfa |
| SLO_05 | Kozina | 45.604249 | 13.931941 | 484 | Precipitation ARSO | Cfa |
| SLO_08 | Kredarica | 46.378784 | 13.848628 | 2514 | Synoptic ARSO | ET |
| SLO_09 | Rateče | 46.497090 | 13.712891 | 864 | Synoptic ARSO | Dfb |
| SLO_11 | Zg. Radovna | 46.428176 | 13.942715 | 750 | Precipitation ARSO | Dfb |
| SLO_14 | Murska Sobota | 46.652078 | 16.191278 | 186 | Synoptic ARSO | Cfb |
| SLO_16 | Sv. Urban | 46.183584 | 15.590748 | 283 | Other 2 | Cfb |
1 The data for the Ljubljana stations are merged into a single dataset and are presented on the website as station Ljubljana. 2 Station maintained by a volunteer.
Stable hydrogen (δ2H) and oxygen (δ 18O) isotopic composition was determined using isotope ratio mass spectrometry (IRMS) [37,40,42,43,44,46,54]. The results are reported as δ values in per mill (‰) relative to international standards [55,56,57]. Activity concentration of tritium was determined using either gas proportional counting (GPC) [43,44,46] or liquid scintillation counting (LSC) following electrolytic enrichment (EE) [42,54]. The results are reported in Bqkg−1 and expressed as 3H in Tritium Units (1 T.U. = 0.118 BqL−1) assuming 1L = 1 kg of water. The analytical details are described in [37,40,41,42,43,44,46,54].
Table 2.
SLONIP data attributes.
| Attribute | Description |
|---|---|
| Sample_ID | Unique sample ID: Station_ID_MMYY (e.g., sample obtained at station SLO_01 and representing the average of January 2011 would be labelled SLO_01_0111) |
| Station_ID | Unique station ID. SLO_xy for Slovenia (e.g., SLO_01, SLO_02, …) |
| Name | Location name (e.g., Ljubljana–Reaktor, Portorož) |
| Year | 2011, 2012, etc. |
| Month | 1, 2, 3, 4, 5, 6, 7, 8, 9, 10, 11 or 12 |
| P_mm | Monthly amount of precipitation (mm to 1 decimal) |
| Source of data | e.g., Ljubljana—Bežigrad, meteo.si, accessed 12 March 2018 |
| T_°C | Average monthly air temperature where available (°C to 1 decimal), if not the nearest meteorological station |
| Source of data | e.g., Ljubljana—Bežigrad, meteo.si, accessed 12 March 2018 |
| RH_% | Monthly average relative humidity (in %) |
| Source of data | e.g., Ljubljana—Bežigrad, meteo.si, accessed 12 March 2018 |
| δ18O_‰ | Stable isotopic composition of oxygen (δ18O) reported in ‰ to 2 decimals |
| Comment | e.g., technique used: DELTA DI—dual inlet isotope ratio mass spectrometer Finnigan MAT DELTA plus with automated CO2–H2O and H2–H2O equilibrator HDOEQ48 |
| Lab name | Laboratory name (e.g., JSI O-2) |
| Source of data | e.g., reference or laboratory name |
| δ2H _‰ | Stable isotopic composition of hydrogen (δ2H) reported in ‰ to 1 decimal |
| Comment | e.g., technique used: DELTA DI—dual inlet isotope ratio mass spectrometer Finnigan MAT DELTA plus with automated CO2–H2O and H2–H2O equilibrator HDOEQ48 |
| Lab name | Laboratory name (e.g., JSI O-2) |
| Source of data | e.g., reference or laboratory name |
| d_‰ | Deuterium excess (d) reported in ‰ to 1 decimal, calculated as d = δ2H—8 × δ18O (Dansgaard, 1964), source of data |
| Source of data | e.g., reference or laboratory name |
| 3H_ Bqkg−1 | Activity concentration of tritium (As) reported in Bqkg−1, to 2 or 3 decimals |
| Uncertainty | Measurement uncertainty of the activity concentration of tritium in Bqkg−1 reported to 2 or 3 decimals |
| Comment | e.g., technique used: LSC EE—electrolytic enrichment liquid scintillation counting |
| Lab name | Laboratory name (e.g., JSI O-2) |
| Source of data | e.g., reference or laboratory name |
| 3H_TU | Activity concentration of tritium (As) recalculated to Tritium Units (1 TU = 0.118 Bqkg−1), taking into account 1 kg = 1 L, reported to 1 decimal |
| Uncertainty | Measurement uncertainty of the activity concentration of tritium in TU reported to 1 decimal |
| Comment | e.g., 1 TU = 0.118 Bqkg−1 |
| Lab name | Laboratory name (e.g., JSI O-2) |
| Source of data | e.g., reference or laboratory name |
| Remarks | Any additional remarks like information about the nearest meteorological station if samples are not collected at the ARSO station |
In 2016 the infrastructure of the JSI laboratories was improved, and since then, the isotopic composition of hydrogen (δ2H) and oxygen (δ18O) has been determined using the H2–H2O [58] and CO2–H2O [59,60] equilibration technique. Measurements are performed on a dual inlet isotope ratio mass spectrometer (DI IRMS, Finnigan MAT DELTA plus, Finnigan MAT GmbH, Bremen, Germany) with an automated H2–H2O and CO2–H2O HDOeq 48 Equilibration Unit (custom built by M. Jaklitsch). The results are normalized to VSMOW/SLAP using LIMS (Laboratory Information Management System for Light Stable Isotopes) program. For details see [27,61,62,63,64]. The overall uncertainties are estimated to be less than 1 ‰, 0.05 ‰ and 1.01 ‰ for δ2H, δ18O and deuterium excess, respectively. Activity concentration of tritium is determined using liquid scintillation counting (LSC) following electrolytic enrichment (EE) on a TriCarb 3170 TR/SL (Canberra Packard) or Quantulus 1220 (PerkinElmer, Waltham, MA, USA) following an accredited method (LP-090).
3. Results and Discussion
3.1. The Graphical User Interface of the SLONIP Platform
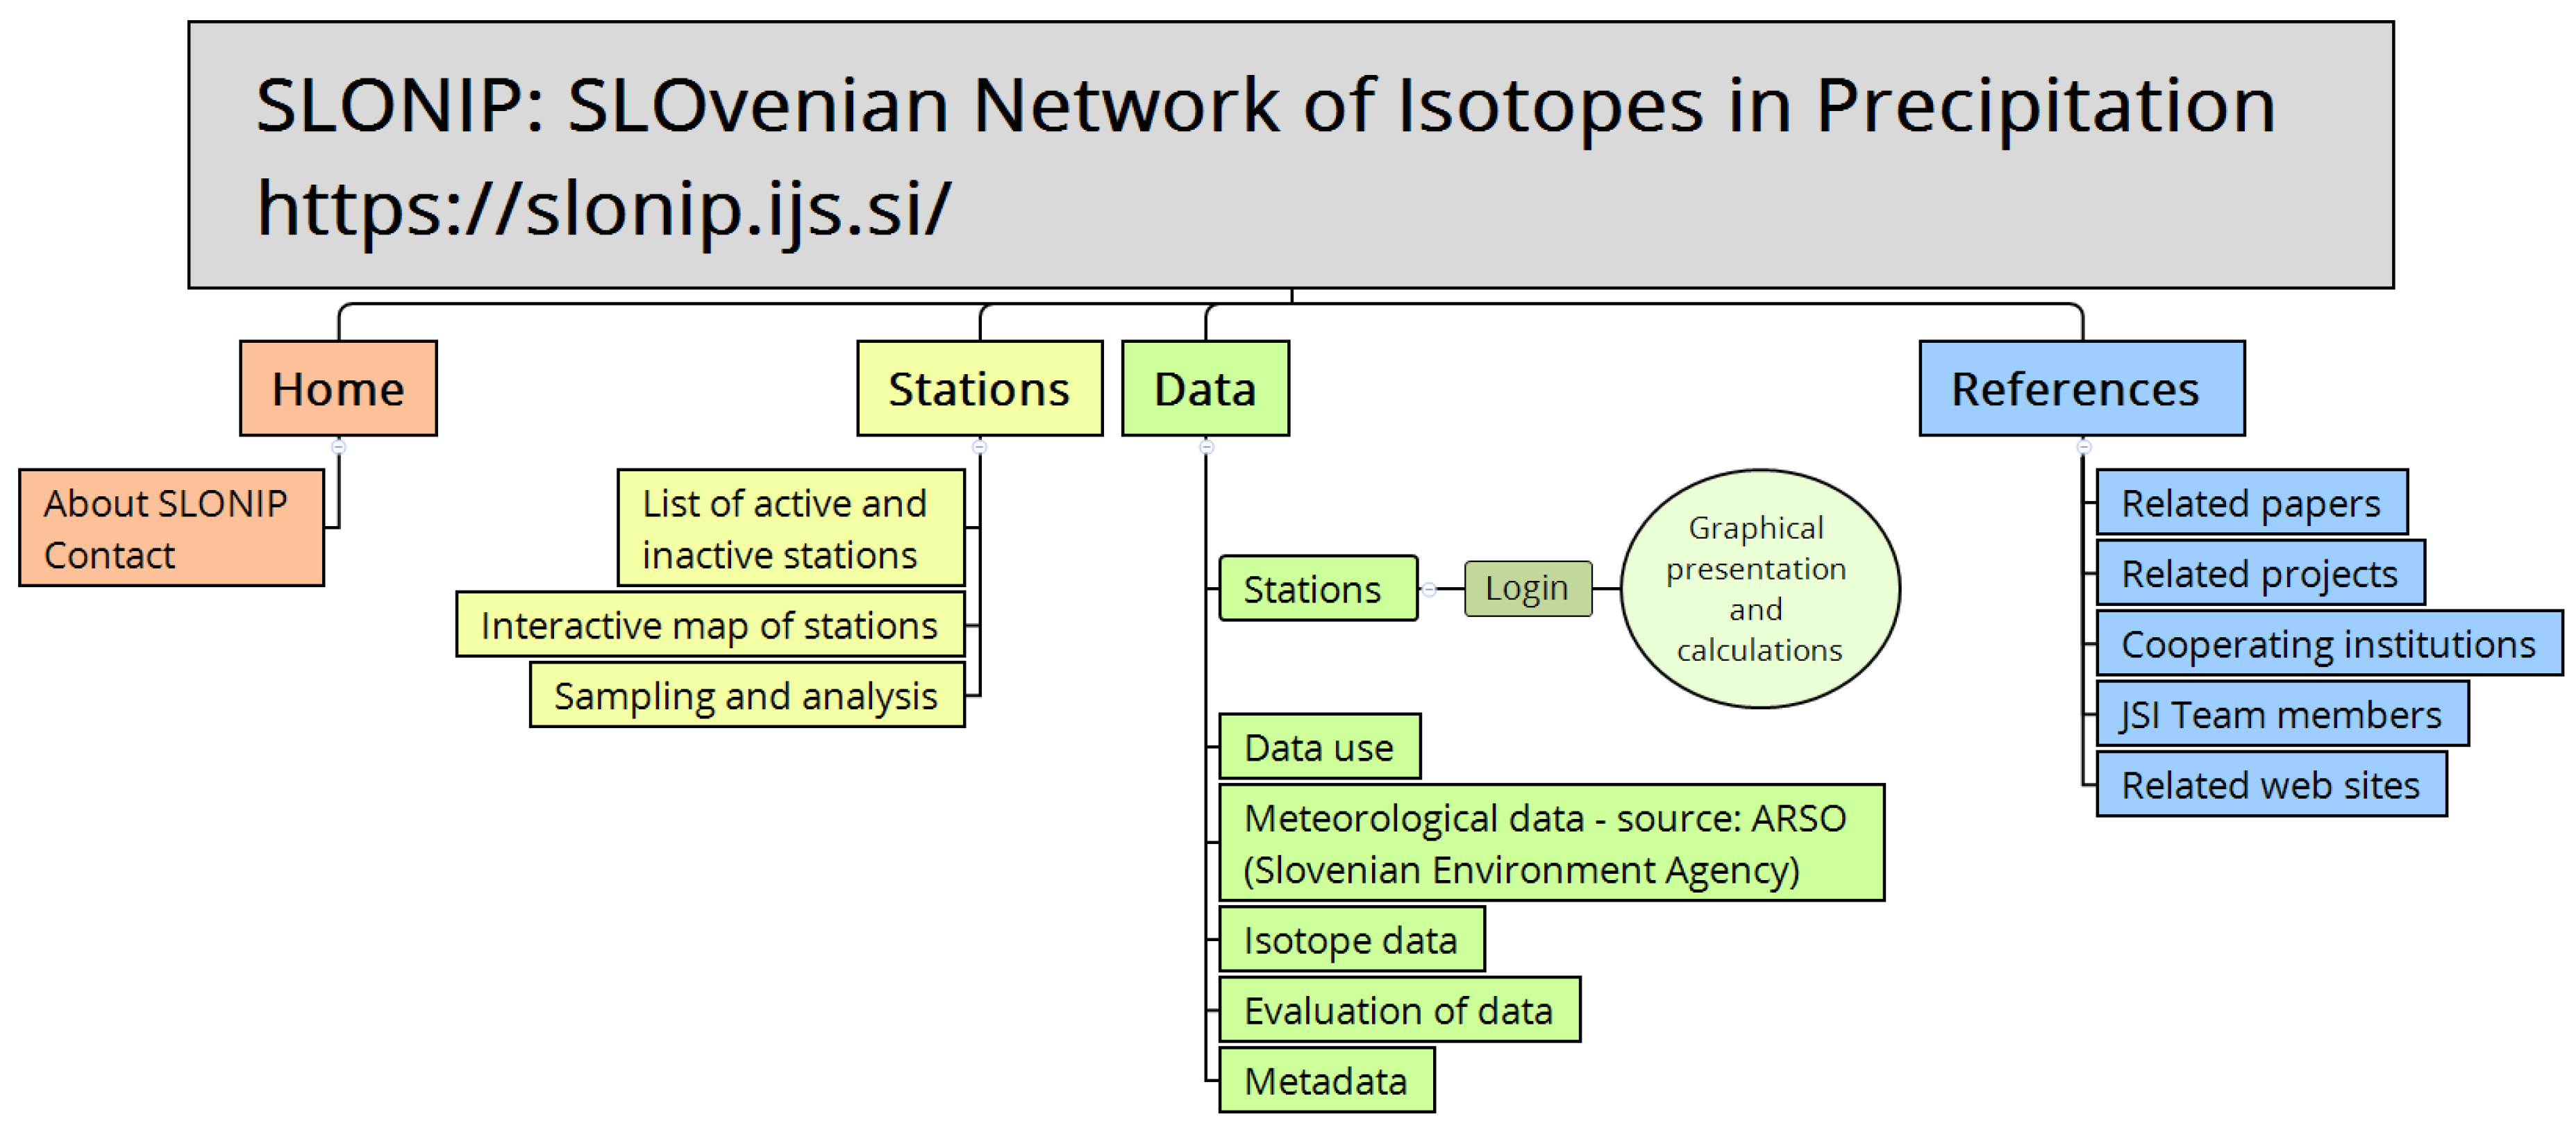
The graphical user interface of the SLONIP platform [52] and its main content are presented in Figure 3. The website has four main navigation menus: Home, Stations, Data and References. The website has been operating since 1 April 2020 and continues to be maintained and gradually supplemented with the new data.
The Home menu provides basic information about the SLONIP, including an overview of the isotopic composition of water as part of the hydrological cycle, possible applications, the purpose of the portal and its Terms of Use.
The Stations menu summarizes information about the monitoring stations (Figure 2). It also gives sampling frequency and information about how the isotopic composition of precipitation is determined and has links to the relevant sources of information.
At the core of the SLONIP platform is the Data menu, divided into two parts: the Stations data and the Supplementary data use info. When logged in, the Stations data gives access to the graphical presentation of monthly meteorological and isotope data and calculations available for individual stations obtained by the Python script [38]. The Supplementary data use info part includes five submenus. First, the terms of use and privacy policy are explained in the Data use menu, and then the accessibility of the meteorological data is defined in the Meteorological data menu. In the third, Isotope data submenu, information about raw data, normalization procedures and other information related to reporting of isotope data in the database will eventually be included. Perhaps the most important is the fourth Evaluation of data submenu, where the statistical data analysis is presented. All of the numeric data seen on the Stations data menu, i.e., the local meteoric water lines (LMWLs), the mean monthly, seasonal and annual data, are displayed and calculated dynamically by default using pre-written formulas.
Although statistical procedures should be universal, different laboratories often use different statistical formulas and methods. Consequently, if the methods used are not clearly reported, it can lead to the results being misinterpreted. An example is the calculation of LMWLs using different regression methods [65]. To make the calculations in the Evaluation of data submenu more accessible, a Python script, “Isotopes in precipitation—statistics”, was developed and is publicly available on the GitHub repository [38]. Before performing any calculations, the data need to be parsed as described in the README.md file, which gives an example for the Murska Sobota station. Finally, the fifth submenu is where the Metadata are listed. The References menu enables access to relevant scientific papers, a list of projects, cooperating institutions, team members ,and related websites.
3.2. Functioning of the SLONIP Portal
The SLONIP platform is intended primarily for viewing data and providing users with summary information for a particular station. Graphical and numerical data also provide users with insight into the variability of the isotopic composition of precipitation at different locations in Slovenia and is important for further climatological, hydrological, hydrogeological, and other applications, such as determining the provenience of food.
The SLONIP research portal functions best in terms of user experience when using Google Chrome or Mozilla Firefox. The Home, Stations, and Reference menus are publicly available, while the individual station’s data, monthly meteorological and isotope data, and different calculations are accessible only upon login.
The Station data includes the long-term means for each station and a summary of all eight stations is presented in Table 3, where the climatological and isotope differences among the stations are clearly shown. The longest data set (1981–2010) is for Ljubljana; however, it contains data from three different locations [42,43]. Since there are no significant differences between the data [49], it is reported as a single dataset. The datasets for other stations are shorter. Also, except for Kozina, all stations were in operation until the end of 2021 and will continue to be supplemented with new data.
Further, the scatter plot of δ2H versus δ18O is presented (Figure 4), including all monthly data as well as different LMWLs, i.e., precipitation amount unweighted or weighted (PW) major axis (MA) or reduced major axis (RMA) regression lines. The lines are also displayed separately (see table), and by clicking the colored buttons above the plot, differences among the LMWLs are revealed. The LMWLs represent the site-specific covariation of hydrogen and oxygen stable isotope ratios and have practical utility as a hydrologic framework and a benchmark for evaluating hydroclimatic processes in isotope-enabled climate models [66]. The slopes of SLONIP LMWLs presented here vary around eight units, while the intercepts vary between 6.54 (RMA at Sv. Urban) and 19.71 (PWMA at Kredarica) and differ among the stations depending on the regression method used. Therefore, it is important when performing future hydrological studies to precisely describe the regression methods applied, particularly since precipitation-weighted regression LMWLs better represent the hydrological influence of precipitation [65].
A climate histogram and isotope data plots (Raw data button) are also available graphically and numerically by scrolling along the plot. In some cases, the isotope data are missing, either because precipitation was too low (e.g., December 2016 for the Murska Sobota station) or the sample was not collected or stored correctly prior to analysis (e.g., October 2016 and July 2017 for the Murska Sobota station). The whole data sets are available on request but will be made available for download in the future.
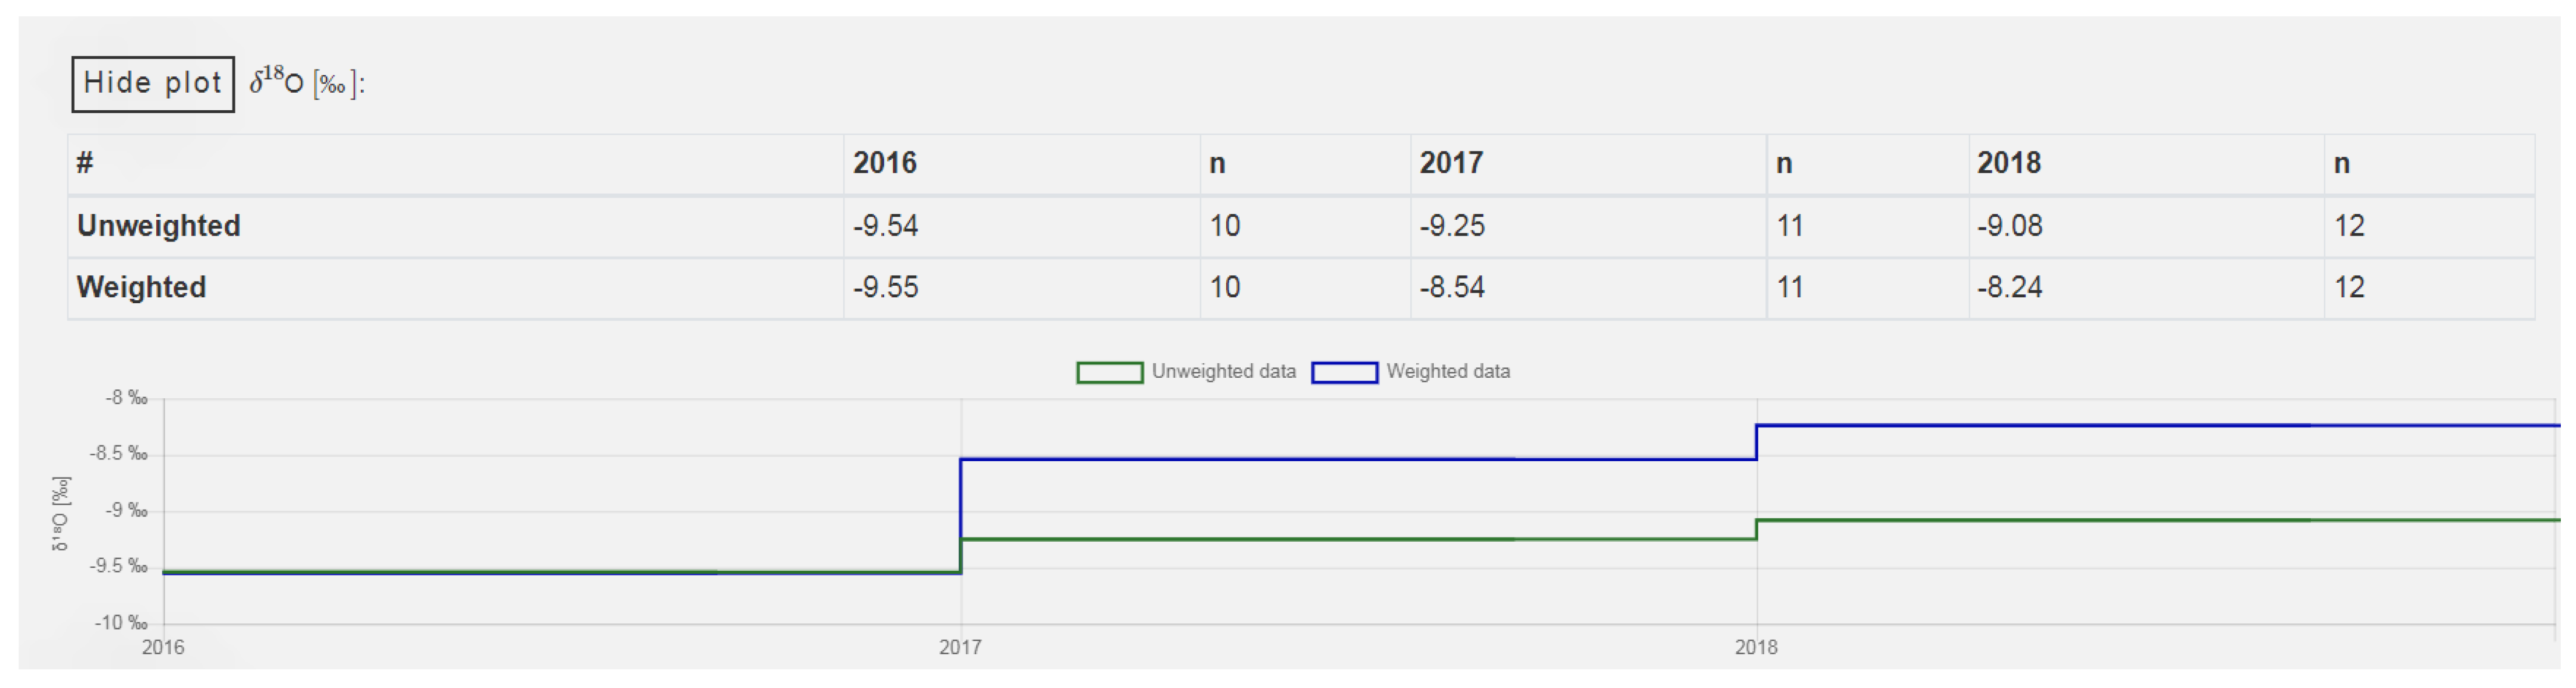
Finally, monthly, seasonal, and annual data are presented. The user can select different display options by clicking the “box” buttons Show/Hide data or plot. In addition, the user can compare the differences between the unweighted and precipitation amount weighted data. For example, δ18O annual means at Murska Sobota in 2016 show no significant difference between unweighted and weighted data, whereas differences are pronounced for 2017 and 2018 (Figure 5). The different δ18O annual means indicate the importance of not uniformly distributed precipitation, which changes monthly and annually.
3.3. Future Development and the Importance of the SLONIP Platform
The first step in developing the SLONIP platform will be to update the database with archived isotope data following the open data principles. By doing this, Slovenian isotopes in precipitation research will become accessible to different levels of society. In addition, a threshold of 48 months of observations will be used to balance the spatial coverage as recommended by Putman et al. [66]. This criterion is now fulfilled in the SLONIP portal only for the Ljubljana and Portorož stations, and it is vital that the website continues to be updated and the whole network remains in operation [26]. Although challenging, expanding the network to include information from other locations would also be beneficial. The problem is that important information was not always recorded sufficiently, and publicly available data is limited [37]. Therefore, a Slovenian national collaborative network is planned among research institutions and other stakeholders. Networking on a regional level is vital to properly evaluate and interpret the data [26,27,28]. Equally, connecting the platform to similar platforms, like the GNIP [5], is also anticipated.
The data can also improve precipitation isotope time-series predictions in Europe [29]. The available Piso.AI model adequately describes the monthly time series for Ljubljana and Portorož. However, the minimum and maximum values are mostly under- or overestimated, e.g., up to 9 ‰ in δ18O for Ljubljana. Previous investigations also suggest that the community could establish more realistic isoscapes of precipitation by merging national with regional networks [26,31]. The final goal is to establish appropriate isoscapes through long-term cooperation with neighboring countries.
SLONIP has already proven invaluable in many investigations. These studies are presented in the Reference part of the portal along with other sources (e.g., Google Scholar refers to “isotopes in precipitation, Ljubljana” more than 3700 times). For example, it has been used in the evaluation of GNIP data [11,67], in investigations of precipitation [26,27,28,49,68,69] and many hydrological and hydrogeological investigations [62,68,70,71,72,73,74,75,76,77,78,79], moisture recycling in Alpine regions [80], bottled water provenance [81] and identification, and characterization of nitrate pollution sources [82]. The SLONIP data, in combination with Hungarian and other neighboring networks, were used for detailed geostatistical evaluation of the design of the precipitation stable-isotope monitoring network and proved to be a well-represented network [26]. The results were used also for determination of the “altitude” and “continental” isotope effects [27] and to derive the gridded (1 km × 1 km) amount-weighted annual precipitation isoscapes [28] for the Adriatic–Pannonian region.
Knowledge of monthly, seasonal, annual, and daily variations in the isotopic composition of precipitation is essential for understanding climate change and the redistribution of precipitation due to extreme future events. Therefore, the SLONIP platform and the offline Python script can be an excellent basis for further use of isotopes in water resources research, studying the effects of climatic factors on isotopes in precipitation, water vapor source, and inflow corridors of precipitation in Slovenia and in other fields, e.g., food authentication. The data will also be used in the future to derive the temporal and spatial distribution of stable oxygen and hydrogen isotopic compositions.
4. Conclusions
Stable and radioactive water isotopes are potent tools for tracking the path of water molecules over the whole water cycle; for example, tracing the source of water, its flow pathways, and quantifying the exchange of water, solutes and particulates between hydrological compartments during hydrological processes. In the last decade, several studies have been published on water isotopes. This number is increasing due to the development of new measurement techniques such as laser absorption spectroscopy that allow for measurements of stable isotope ratios at high resolutions.
The current paper describes the SLONIP, a web-based interactive research platform that collects existing, accessible data on the isotopic composition of precipitation in Slovenia obtained in the framework of research at the JSI since 1981, thereby improving access to the data for scientific research groups and other interested users. The platform is in line with FAIR data concepts, and the functionalities and tools available are especially valuable for lay people interested in isotope precipitation data but not experienced in data treatment, analysis, and visualization. Moreover, “raw” data is available to the scientific community upon request.
The platform [52] is available at https://slonip.ijs.si/ (accessed on 10 April 2022) and contains 2572 monthly isotope data points for composite precipitation samples from eight locations. SLONIP also provides location, sampling, and analysis (including references) information and isotopic data in numerical and graphical form. Monthly, seasonal, and annual means and precipitation amount weighted means and LMWLs calculated using different regression methods are presented. In addition, the Python code [38] enabling the respective calculations available on the platform is deposited on GitHub (https://github.com/nyuhanc/Isotopes-in-precipitation-statistics) (accessed on 6 May 2022).
In the future, SLONIP will be updated with new data and, if possible, data from other Slovenian institutions. Finally, to follow the FAIR data concept, it will be upgraded to a SlovenIan Water Isotopes Portal (SIWIP) that will provide isotope information for the complete water cycle (e.g., in precipitation, snow, surface and groundwater, tap and bottled water).
Author Contributions
Conceptualization, P.V., A.P. and D.K.; methodology, P.V., A.P. and D.K.; software, A.P. and P.V.; validation, P.V. and A.P.; formal analysis, P.V. and A.P.; investigation, P.V.; resources, P.V., A.P. and D.K.; data curation, P.V. and A.P.; writing—original draft preparation, P.V.; writing—review and editing, P.V., A.P. and D.K.; visualization, P.V., A.P. and D.K.; supervision, P.V.; project administration, P.V.; funding acquisition, P.V. All authors have read and agreed to the published version of the manuscript.
Funding
This research was funded by the Slovenian Research Agency—ARRS (P1-0143, N1-0054) and by International Atomic Energy Agency—IAEA (RC No. 23485).
Institutional Review Board Statement
Not applicable.
Informed Consent Statement
Not applicable.
Data Availability Statement
Data are available at https://slonip.ijs.si/ [52], Python script “Isotopes in precipitation—statistics” is available in the GitHub repository [38], and “raw” data are available to the scientific community upon registration to the website and specific request.
Acknowledgments
The work of J. Pezdič, who initiated monitoring of the isotopic composition of precipitation in Ljubljana and all colleagues from JSI and other institutions who participated in developing SLONIP is greatly acknowledged. We also thank the IAEA and ARSO for their scientific and technical support and our project partners for their valuable discussions. The Slovenian team developed the SLONIP platform in the context of Slovenian–Hungarian cooperation (N1-0054 and SSN118205).
Conflicts of Interest
The authors declare no conflict of interest.
References
- Feng, X.; Liu, C.; Xie, F.; Lu, J.; Chiu, L.S.; Tintera, G.; Chen, B. Precipitation Characteristic Changes Due to Global Warming in a High-resolution (16 Km) ECMWF Simulation. Q. J. R. Meteorol. Soc. 2019, 145, 303–317. [Google Scholar] [CrossRef] [PubMed] [Green Version]
- Aggarwal, P.K.; Froehlich, K.F.; Gat, J.R. Isotopes in the Water Cycle; Springer: Dordrecht, The Netherlands, 2005; ISBN 1-4020-3010-X. [Google Scholar]
- Craig, H. Isotopic Variations in Meteoric Waters. Science 1961, 133, 1702–1703. [Google Scholar] [CrossRef] [PubMed]
- Dansgaard, W. Stable Isotopes in Precipitation. Tellus 1964, 16, 436–468. [Google Scholar] [CrossRef]
- International Atomic Energy Agency; World Meteorological Organization. Global Network of Isotopes in Precipitation. The GNIP Database. Available online: https://nucleus.iaea.org/wiser (accessed on 21 April 2022).
- Kendall, C.; McDonnell, J. Isotope Tracers in Catchment Hydrology; Elsevier: Amsterdam, The Netherlands, 1998; ISBN 978-0-444-81546-0. [Google Scholar]
- Lucas, L.L.; Unterweger, M.P. Comprehensive Review and Critical Evaluation of the Half-Life of Tritium. J. Res. Natl. Inst. Stand. Technol. 2000, 105, 541–549. [Google Scholar] [CrossRef] [PubMed]
- Schotterer, U.; Oldfield, F.; Fröhlich, K. GNIP: Global Network for Isotopes in Precipitation; Läderach: Bern, Switzerland, 1996; ISBN 978-3-9521078-0-5. [Google Scholar]
- West, J.B. (Ed.) Isoscapes: Understanding Movement, Pattern, and Process on Earth through Isotope Mapping; Springer: Dordrecht, The Netherlands, 2010; ISBN 978-90-481-3353-6. [Google Scholar]
- Clark, I.D.; Fritz, P. Environmental Isotopes in Hydrogeology; CRC Press Taylor & Francis Group: Boca Raton, FL, USA, 1997; ISBN 978-0-429-06957-4. [Google Scholar]
- Rozanski, K.; Araguás-Araguás, L.; Gonfiantini, R. Isotopic Patterns in Modern Global Precipitation. In Climate Change in Continental Isotopic Records; American Geophysical Union: Washington, DC, USA, 1993; pp. 1–36. [Google Scholar]
- Araguas-Araguas, L.; Froehlich, K.; Rozanski, K. Deuterium and Oxygen-18 Isotope Composition of Precipitation and Atmospheric Moisture. Hydrol. Process. 2000, 14, 1341–1355. [Google Scholar] [CrossRef]
- Schürch, M.; Kozel, R.; Schotterer, U.; Tripet, J.-P. Observation of Isotopes in the Water Cycle—The Swiss National Network (NISOT). Environ. Geol. 2003, 45, 1–11. [Google Scholar] [CrossRef]
- International Atomic Energy Agency. The Global Network of Isotopes in Precipitation. IAEA Bull. 2019, 60, 18–19. [Google Scholar]
- Hager, B.; Foelsche, U. Stable Isotope Composition of Precipitation in Austria. Austrian J. Earth Sci. 2015, 108, 2–13. [Google Scholar] [CrossRef]
- Hollins, S.E.; Hughes, C.E.; Crawford, J.; Cendón, D.I.; Meredith, K.T. Rainfall Isotope Variations over the Australian Continent—Implications for Hydrology and Isoscape Applications. Sci. Total Environ. 2018, 645, 630–645. [Google Scholar] [CrossRef]
- Gibson, J.J.; Edwards, T.W.D.; Birks, S.J.; Amour, N.A.S.; Buhay, W.M.; McEachern, P.; Wolfe, B.B.; Peters, D.L. Progress in Isotope Tracer Hydrology in Canada. Hydrol. Process. 2005, 19, 303–327. [Google Scholar] [CrossRef]
- Boschetti, T.; Cifuentes, J.; Iacumin, P.; Selmo, E. Local Meteoric Water Line of Northern Chile (18° S–30° S): An Application of Error-in-Variables Regression to the Oxygen and Hydrogen Stable Isotope Ratio of Precipitation. Water 2019, 11, 791. [Google Scholar] [CrossRef] [Green Version]
- Liu, J.; Song, X.; Yuan, G.; Sun, X.; Yang, L. Stable Isotopic Compositions of Precipitation in China. Tellus B Chem. Phys. Meteorol. 2014, 66, 22567. [Google Scholar] [CrossRef] [Green Version]
- Stumpp, C.; Klaus, J.; Stichler, W. Analysis of Long-Term Stable Isotopic Composition in German Precipitation. J. Hydrol. 2014, 517, 351–361. [Google Scholar] [CrossRef]
- Longinelli, A.; Selmo, E. Isotopic Composition of Precipitation in Italy: A First Overall Map. J. Hydrol. 2003, 270, 75–88. [Google Scholar] [CrossRef]
- Banda, L.C.; Rivett, M.O.; Zavison, A.S.K.; Kamtukule, S.; Kalin, R.M. National Stable Isotope Baseline for Precipitation in Malawi to Underpin Integrated Water Resources Management. Water 2021, 13, 1927. [Google Scholar] [CrossRef]
- Vachon, R.W.; Welker, J.M.; White, J.W.C.; Vaughn, B.H. Monthly Precipitation Isoscapes (δ18O) of the United States: Connections with Surface Temperatures, Moisture Source Conditions, and Air Mass Trajectories. J. Geophys. Res. 2010, 115, D21126. [Google Scholar] [CrossRef]
- Welker, J.M. Isotopic (δ18O) Characteristics of Weekly Precipitation Collected across the USA: An Initial Analysis with Application to Water Source Studies. Hydrol. Process. 2000, 14, 1449–1464. [Google Scholar] [CrossRef]
- Kostrova, S.S.; Meyer, H.; Fernandoy, F.; Werner, M.; Tarasov, P.E. Moisture Origin and Stable Isotope Characteristics of Precipitation in Southeast Siberia. Hydrol. Process. 2020, 34, 51–67. [Google Scholar] [CrossRef] [Green Version]
- Hatvani, I.G.; Szatmári, G.; Kern, Z.; Erdélyi, D.; Vreča, P.; Kanduč, T.; Czuppon, G.; Lojen, S.; Kohán, B. Geostatistical Evaluation of the Design of the Precipitation Stable Isotope Monitoring Network for Slovenia and Hungary. Environ. Int. 2021, 146, 106263. [Google Scholar] [CrossRef]
- Kern, Z.; Hatvani, I.G.; Czuppon, G.; Fórizs, I.; Erdélyi, D.; Kanduč, T.; Palcsu, L.; Vreča, P. Isotopic ‘Altitude’ and ‘Continental’ Effects in Modern Precipitation across the Adriatic–Pannonian Region. Water 2020, 12, 1797. [Google Scholar] [CrossRef]
- Kern, Z.; Erdélyi, D.; Vreča, P.; Bronić, I.K.; Fórizs, I.; Kanduč, T.; Štrok, M.; Palcsu, L.; Süveges, M.; Czuppon, G.; et al. Isoscape of Amount-Weighted Annual Mean Precipitation Tritium (3H) Activity from 1976 to 2017 for the Adriatic–Pannonian Region—AP3H_v1 Database. Earth Syst. Sci. Data 2020, 12, 2061–2073. [Google Scholar] [CrossRef]
- Nelson, D.B.; Basler, D.; Kahmen, A. Precipitation Isotope Time Series Predictions from Machine Learning Applied in Europe. Proc. Natl. Acad. Sci. USA 2021, 118, e2024107118. [Google Scholar] [CrossRef] [PubMed]
- Sturm, K.; Hoffmann, G.; Langmann, B.; Stichler, W. Simulation of δ18O in Precipitation by the Regional Circulation Model REMOiso. Hydrol. Process. 2005, 19, 3425–3444. [Google Scholar] [CrossRef]
- Hatvani, I.G.; Erdélyi, D.; Vreča, P.; Kern, Z. Analysis of the Spatial Distribution of Stable Oxygen and Hydrogen Isotopes in Precipitation across the Iberian Peninsula. Water 2020, 12, 481. [Google Scholar] [CrossRef] [Green Version]
- Kong, Y.; Wang, K.; Li, J.; Pang, Z. Stable Isotopes of Precipitation in China: A Consideration of Moisture Sources. Water 2019, 11, 1239. [Google Scholar] [CrossRef] [Green Version]
- Balk, T.; Kukkonen, J.; Karatzas, K.; Bassoukos, T.; Epitropou, V. A European Open Access Chemical Weather Forecasting Portal. Atmos. Environ. 2011, 45, 6917–6922. [Google Scholar] [CrossRef]
- Shi, Y.; Ren, C.; Luo, M.; Ching, J.; Li, X.; Bilal, M.; Fang, X.; Ren, Z. Utilizing World Urban Database and Access Portal Tools (WUDAPT) and Machine Learning to Facilitate Spatial Estimation of Heatwave Patterns. Urban Clim. 2021, 36, 100797. [Google Scholar] [CrossRef]
- Pučnik, J. Velika knjiga o Vremenu; Cankarjeva Založba: Ljubljana, Slovenia, 1980; p. 366. [Google Scholar]
- Dolinar, M.; Frantar, P.; Kurnik, B. Značilnosti Vodne Bilance Slovenije v Obdobju 1971–2000; Vodnogospodarski Biro: Maribor, Slovenia, 2008; pp. 19–25. [Google Scholar]
- Vreča, P.; Malenšek, N. Slovenian Network of Isotopes in Precipitation (SLONIP)—A Review of Activities in the Period 1981–2015. Geologija 2016, 59, 67–84. [Google Scholar] [CrossRef]
- Pavšek, A.; Vreča, P. Isotopes-in-Precipitation-Statistics. Available online: https://github.com/nyuhanc/Isotopes-in-precipitation-statistics (accessed on 6 May 2022).
- Gospodarič, R.; Habič, P. Underground Water Tracing; Investigations in Slovenia 1972–1975; ZRC SAZU: Postojna, Slovenia, 1976; p. 309. [Google Scholar]
- Pezdič, J. Isotope Fractionation of Long Term Precipitation Averages in Ljubljana (Slovenia). RMZ Mater. Geoenviron. 2003, 50, 641–650. [Google Scholar]
- Pezdič, J. Izotopi in Geokemijski Procesi; Univerza v Ljubljani: Ljubljana, Slovenia, 1999; ISBN 961-6047-10-8. [Google Scholar]
- Vreča, P.; Bronić, I.K.; Leis, A.; Demšar, M. Isotopic Composition of Precipitation at the Station Ljubljana (Reaktor), Slovenia—Period 2007–2010. Geologija 2014, 57, 217–230. [Google Scholar] [CrossRef]
- Vreča, P.; Bronić, I.K.; Leis, A.; Brenčič, M. Isotopic Composition of Precipitation in Ljubljana (Slovenia). Geologija 2008, 51, 169–180. [Google Scholar] [CrossRef]
- Vreča, P.; Bronić, I.K.; Horvatinčić, N.; Barešić, J. Isotopic Characteristics of Precipitation in Slovenia and Croatia: Comparison of Continental and Maritime Stations. J. Hydrol. 2006, 330, 457–469. [Google Scholar] [CrossRef]
- Vreča, P.; Brenčič, M.; Leis, A. Comparison of Monthly and Daily Isotopic Composition of Precipitation in the Coastal Area of Slovenia. Isot. Environ. Health Stud. 2007, 43, 307–321. [Google Scholar] [CrossRef] [PubMed]
- Vreča, P.; Bronić, I.K.; Leis, A. Isotopic Composition of Precipitation in Portorož (Slovenia). Geologija 2011, 54, 129–138. [Google Scholar] [CrossRef]
- Vreča, P.; Pavšek, A. Slovenska mreža opazovanj izotopske sestave padavin (SLONIP)—Predstavitev spletne strani. In Proceedings of the Raziskave s Področja Geodezije in Geofizike 2021; Slovensko Združenje za Geodezijo in Geofiziko: Ljubljana, Slovenia, 2022; Volume 27, pp. 45–53. (In Slovene). Available online: http://fgg-web.fgg.uni-lj.si/SUGG/referati/2022/SZGG_2022_Vreca_Pavsek.pdf (accessed on 8 May 2022).
- Django Software Foundation. Django, Version 3.0.3; Django Software Foundation: Lawrence, KS, USA, 2019. [Google Scholar]
- Brenčič, M.; Kononova, N.K.; Vreča, P. Relation between Isotopic Composition of Precipitation and Atmospheric Circulation Patterns. J. Hydrol. 2015, 529, 1422–1432. [Google Scholar] [CrossRef]
- Slovenian Environmental Agency (ARSO). ARSO METEO. Available online: http://www.meteo.si/ (accessed on 4 May 2022).
- Kanduč, T.; Kocman, D.; Lojen, S.; Štrok, M.; Svetek, B.; Žigon, S.; Vreča, P. Working Report on Isotope Composition of Precipitation at Stations Velenje, Sv. Urban at Podčetrtek and Murska Sobota—Rakičan, NE Slovenia—Period 2012–2016; Jožef Stefan Institute, Department of Environmental Sciences: Ljubljana, Slovenia, 2018; p. 25. [Google Scholar]
- Jožef Stefan Institute. SLONIP: Slovenian Network of Isotopes in Precipitation. Available online: https://slonip.ijs.si/ (accessed on 10 April 2022).
- Kottek, M.; Grieser, J.; Beck, C.; Rudolf, B.; Rubel, F. World Map of the Köppen-Geiger Climate Classification Updated. Meteorol. Z. 2006, 15, 259–263. [Google Scholar] [CrossRef]
- Vreča, P.; Bronić, I.K.; Leis, A. Isotopic Composition of Precipitation at the Station Portorož, Slovenia—Period 2007–2010. Geologija 2015, 58, 233–246. [Google Scholar] [CrossRef] [Green Version]
- Coplen, T.B. Guidelines and Recommended Terms for Expression of Stable-Isotope-Ratio and Gas-Ratio Measurement Results: Guidelines and Recommended Terms for Expressing Stable Isotope Results. Rapid Commun. Mass Spectrom. 2011, 25, 2538–2560. [Google Scholar] [CrossRef]
- Coplen, T.B. Reporting of Stable Hydrogen, Carbon, and Oxygen Isotopic Abundances (Technical Report). Pure Appl. Chem. 1994, 66, 273–276. [Google Scholar] [CrossRef]
- International Atomic Energy Agency. Reference Sheet for VSMOW2 and SLAP2 International Measurement Standards; IAEA: Vienna, Austria, 2017; p. 8. [Google Scholar]
- Coplen, T.B.; Wildman, J.D.; Chen, J. Improvements in the Gaseous Hydrogen-Water Equilibration Technique for Hydrogen Isotope-Ratio Analysis. Anal. Chem. 1991, 63, 910–912. [Google Scholar] [CrossRef]
- Epstein, S.; Mayeda, T. Variations of 18O content of waters from natural sources. Geochim Cosmochim Acta 1953, 4, 213–224. [Google Scholar] [CrossRef]
- Avak, H.; Brand, W.A. The Finning MAT HDO-Equilibration—A fully automated H2O/gas phase equilibration system for hydrogen and oxygen isotope analyses. Thermo Electron. Corp. Appl. News 1995, 11, 1–13. [Google Scholar]
- Nagode, K.; Kanduč, T.; Zuliani, T.; Bračič Železnik, B.; Jamnik, B.; Vreča, P. Daily Fluctuations in the Isotope and Elemental Composition of Tap Water in Ljubljana, Slovenia. Water 2021, 13, 1451. [Google Scholar] [CrossRef]
- Serianz, L.; Cerar, S.; Vreča, P. Using Stable Isotopes and Major Ions to Identify Recharge Characteristics of the Alpine Groundwater-Flow Dominated Triglavska Bistrica River. Geologija 2021, 64, 205–220. [Google Scholar] [CrossRef]
- Zuliani, T.; Kanduč, T.; Novak, R.; Vreča, P. Characterization of Bottled Waters by Multielemental Analysis, Stable and Radiogenic Isotopes. Water 2020, 12, 2454. [Google Scholar] [CrossRef]
- Žvab Rožič, P.; Polenšek, T.; Verbovšek, T.; Kanduč, T.; Mulec, J.; Vreča, P.; Strahovnik, L.; Rožič, B. An Integrated Approach to Characterising Sulphur Karst Springs: A Case Study of the Žvepovnik Spring in NE Slovenia. Water 2022, 14, 1249. [Google Scholar] [CrossRef]
- Crawford, J.; Hughes, C.E.; Lykoudis, S. Alternative Least Squares Methods for Determining the Meteoric Water Line, Demonstrated Using GNIP Data. J. Hydrol. 2014, 519, 2331–2340. [Google Scholar] [CrossRef]
- Putman, A.L.; Fiorella, R.P.; Bowen, G.J.; Cai, Z. A Global Perspective on Local Meteoric Water Lines: Meta-analytic Insight Into Fundamental Controls and Practical Constraints. Water Resour. Res. 2019, 55, 6896–6910. [Google Scholar] [CrossRef]
- Hughes, C.E.; Crawford, J. A New Precipitation Weighted Method for Determining the Meteoric Water Line for Hydrological Applications Demonstrated Using Australian and Global GNIP Data. J. Hydrol. 2012, 464–465, 344–351. [Google Scholar] [CrossRef]
- Vodila, G.; Palcsu, L.; Futó, I.; Szántó, Z. A 9-Year Record of Stable Isotope Ratios of Precipitation in Eastern Hungary: Implications on Isotope Hydrology and Regional Palaeoclimatology. J. Hydrol. 2011, 400, 144–153. [Google Scholar] [CrossRef]
- Liotta, M.; Bellissimo, S.; Favara, R.; Valenza, M. Isotopic Composition of Single Rain Events in the Central Mediterranean. J. Geophys. Res. 2008, 113, D16304. [Google Scholar] [CrossRef] [Green Version]
- Brenčič, M. Hydrogeochemistry of Coastal Carbonate Aquifer in Lucija–Portorož (Gulf of Trieste, Northern Adriatic Sea, Slovenia). Acta Carsol. 2009, 38, 179–186. [Google Scholar] [CrossRef]
- Torkar, A.; Brenčič, M.; Vreča, P. Chemical and Isotopic Characteristics of Groundwater-Dominated Radovna River (NW Slovenia). Environ. Earth Sci. 2016, 75, 1296. [Google Scholar] [CrossRef]
- Marković, T.; Brkić, Ž.; Larva, O. Using Hydrochemical Data and Modelling to Enhance the Knowledge of Groundwater Flow and Quality in an Alluvial Aquifer of Zagreb, Croatia. Sci. Total Environ. 2013, 458–460, 508–516. [Google Scholar] [CrossRef] [PubMed]
- Mezga, K.; Urbanc, J.; Cerar, S. The Isotope Altitude Effect Reflected in Groundwater: A Case Study from Slovenia. Isot. Environ. Health Stud. 2014, 50, 33–51. [Google Scholar] [CrossRef]
- Verbovšek, T.; Kanduč, T. Isotope Geochemistry of Groundwater from Fractured Dolomite Aquifers in Central Slovenia. Aquat. Geochem. 2016, 22, 131–151. [Google Scholar] [CrossRef]
- Ogrinc, N.; Kanduč, T.; Stichler, W.; Vreča, P. Spatial and Seasonal Variations in δ18O and δD Values in the River Sava in Slovenia. J. Hydrol. 2008, 359, 303–312. [Google Scholar] [CrossRef]
- Ogrinc, N.; Kocman, D.; Miljević, N.; Vreča, P.; Vrzel, J.; Povinec, P. Distribution of H and O Stable Isotopes in the Surface Waters of the Sava River, the Major Tributary of the Danube River. J. Hydrol. 2018, 565, 365–373. [Google Scholar] [CrossRef]
- Cerar, S.; Urbanc, J. Carbonate Chemistry and Isotope Characteristics of Groundwater of Ljubljansko Polje and Ljubljansko Barje Aquifers in Slovenia. Sci. World J. 2013, 2013, 948394. [Google Scholar] [CrossRef]
- Koren, K.; Serianz, L.; Janža, M. Characterizing the Groundwater Flow Regime in a Landslide Recharge Area Using Stable Isotopes: A Case Study of the Urbas Landslide Area in NW Slovenia. Water 2022, 14, 912. [Google Scholar] [CrossRef]
- Cucchi, F.; Franceschini, G.; Zini, L. Hydrogeochemical Investigations and Groundwater Provinces of the Friuli Venezia Giulia Plain Aquifers, Northeastern Italy. Environ. Geol. 2008, 55, 985–999. [Google Scholar] [CrossRef]
- Froehlich, K.; Kralik, M.; Papesch, W.; Rank, D.; Scheifinger, H.; Stichler, W. Deuterium Excess in Precipitation of Alpine Regions—Moisture Recycling. Isot. Environ. Health Stud. 2008, 44, 61–70. [Google Scholar] [CrossRef] [PubMed]
- Brencic, M.; Vreca, P. Identification of Sources and Production Processes of Bottled Waters by Stable Hydrogen and Oxygen Isotope Ratios. Rapid Commun. Mass Spectrom. 2006, 20, 3205–3212. [Google Scholar] [CrossRef] [PubMed]
- Saccon, P.; Leis, A.; Marca, A.; Kaiser, J.; Campisi, L.; Böttcher, M.E.; Savarino, J.; Escher, P.; Eisenhauer, A.; Erbland, J. Multi-Isotope Approach for the Identification and Characterisation of Nitrate Pollution Sources in the Marano Lagoon (Italy) and Parts of Its Catchment Area. Appl. Geochem. 2013, 34, 75–89. [Google Scholar] [CrossRef] [Green Version]
Figure 1.
A schematic representation of the SLONIP platform architecture.

Figure 3.
The schematic structure of the SLONIP website [52].
Figure 3.
The schematic structure of the SLONIP website [52].

Figure 4.
The snapshot of the scatter plot of δ2H versus δ18O including all monthly data (blue dots) and different LMWLs, i.e., precipitation-amount unweighted or weighted major axis (MA) or reduced major axis (RMA) regression lines for the Murska Sobota station data [52].
Figure 4.
The snapshot of the scatter plot of δ2H versus δ18O including all monthly data (blue dots) and different LMWLs, i.e., precipitation-amount unweighted or weighted major axis (MA) or reduced major axis (RMA) regression lines for the Murska Sobota station data [52].

Figure 5.
The snapshot of the numerical and graphical presentation of δ18O annual unweighted and weighted means at the Murska Sobota station [52].
Figure 5.
The snapshot of the numerical and graphical presentation of δ18O annual unweighted and weighted means at the Murska Sobota station [52].

Table 3.
Available data in SLONIP: long-term means of precipitation amount (P), air temperature (T), the isotopic composition of oxygen (δ18O), the isotopic composition of hydrogen (δ2H), deuterium excess (d) and activity concentration of tritium (3H). N—number of all isotope data in SLONIP; n.d.—not determined.
| Station Name | Data Available in SLONIP | N | P | T | δ18O | δ2H | d | 3H | |
|---|---|---|---|---|---|---|---|---|---|
| since | to | mm | °C | ‰ | ‰ | ‰ | T.U. | ||
| Ljubljana 1 | 1981 | 2010 | 1291 | 1363 2 | 10.7 2 | −8.71 | −60.1 | 9.6 | 15.2 |
| Portorož | 2000 | 2010 | 482 | 986 | 13.7 | −6.31 | −42.2 | 8.4 | 7.3 |
| Kozina | 2000 | 2003 | 153 | 1235 | n.d. | −7.24 | −46.3 | 11.6 | 5.6 |
| Kredarica | 2016 | 2018 | 136 | 2088 | 0.7 | −10.93 | −73.4 | 14.0 | 6.7 |
| Rateče | 2016 | 2018 | 127 | 1691 | 7.5 | −9.55 | −65.3 | 11.1 | 6.4 |
| Zg. Radovna | 2016 | 2018 | 139 | 1779 | n.d. | −8.94 | −60.6 | 10.9 | 6.7 |
| Murska Sobota | 2016 | 2018 | 119 | 823 | 11.5 | −9.28 | −65.8 | 8.4 | 7.5 |
| Sv. Urban | 2016 | 2018 | 125 | 1024 3 | 11.2 3 | −8.53 | −59.2 | 9.0 | 7.7 |
Publisher’s Note: MDPI stays neutral with regard to jurisdictional claims in published maps and institutional affiliations. |
© 2022 by the authors. Licensee MDPI, Basel, Switzerland. This article is an open access article distributed under the terms and conditions of the Creative Commons Attribution (CC BY) license (https://creativecommons.org/licenses/by/4.0/).
Share and Cite
MDPI and ACS Style
Vreča, P.; Pavšek, A.; Kocman, D. SLONIP—A Slovenian Web-Based Interactive Research Platform on Water Isotopes in Precipitation. Water 2022, 14, 2127. https://doi.org/10.3390/w14132127
AMA Style
Vreča P, Pavšek A, Kocman D. SLONIP—A Slovenian Web-Based Interactive Research Platform on Water Isotopes in Precipitation. Water. 2022; 14(13):2127. https://doi.org/10.3390/w14132127
Chicago/Turabian StyleVreča, Polona, Aljaž Pavšek, and David Kocman. 2022. "SLONIP—A Slovenian Web-Based Interactive Research Platform on Water Isotopes in Precipitation" Water 14, no. 13: 2127. https://doi.org/10.3390/w14132127
Note that from the first issue of 2016, this journal uses article numbers instead of page numbers. See further details here.