
Rainwater Isotopic Composition in the Ecuadorian Andes and Amazon Reflects Cross-Equatorial Flow Seasonality


1
Isotope Climatology and Environmental Research Centre, Institute for Nuclear Research, Eötvös Loránd Research Network, Bem tér 18/c, 4026 Debrecen, Hungary
2
School of Physical Sciences and Nanotechnology, Yachay Tech University, Urcuquí 100119, Ecuador
*
Author to whom correspondence should be addressed.
Water 2022, 14(13), 2121; https://doi.org/10.3390/w14132121
Submission received: 14 May 2022
/
Revised: 28 June 2022
/
Accepted: 28 June 2022
/
Published: 3 July 2022
(This article belongs to the Special Issue Use of Water Isotopes in Hydrological Processes II)
Abstract
:The variability of the rainfall stable isotopic values (δ2Hp, δ18Op) in the Ecuadorian Amazon to the Andes presents a marked local “altitude” effect. At the same time, this complex orography creates diverse precipitation regimes (unimodal, bimodal, and three-modal) that make it difficult to establish a relationship with the local amount. Nevertheless, stations along these regions show a similar intra-annual isotopic variability, with lower values during MAM and ON. In contrast, higher values are found during DJF and JAS in a w-shaped pattern, suggesting a common regional controller. A monthly δ2Hp and δ18Op collection campaign was established in Central Ecuador (n = 30) to complement stations biased towards the northern and southern parts. Based on back trajectory analysis, the results demonstrated that moisture arrives from two primary sources: the Tropical North Atlantic (DJFM) and the Amazon Basin (JAS). Nevertheless, their convergence (AMJ and ON) is the crucial factor modulating the lowest isotopic values. Precisely, this convergence is stronger at the V-Index region (5° S–5° N, 65°–75° W), where the wind seasonality and reversal at low levels are enhanced, allowing the inter-hemispheric moisture flux transport (cross-equatorial flow). We propose that the amount of rainfall located at the V-Index region is a more robust approach for explaining the δ2Hp and δ18Op variability rather than the local amount.
Keywords:
cross-equatorial flow; stable isotopes; V-Index; low-level jet; precipitation; aerial lake1. Introduction
The stable isotopes of water, oxygen-18 (18O), and deuterium (2H) are some of the most common environmental tracers of relevance for climatological, glaciological, oceanographic, and hydrological studies [1,2]. In the case of precipitation, the observed isotopic variations in oxygen and hydrogen (δ18Op and δ2Hp) are due to isotopic fractionation occurring during water phase changes (evaporation and condensation), where the heavy isotopes preferentially condense, and lighter molecules tend to evaporate [1,2]. Dansgaard (1964) formulated several empirical relationships between the observed δ18Op, δ2Hp, and the environmental parameters (e.g., surface air temperature, amount of precipitation, latitude, altitude, distance from the coast), which are known as fractionation effects [2].
At mid and high latitudes, the gradual lowering of δ18Op and δ2Hp values respond to the progressive cooling of air masses transporting moisture from the tropics towards the poles and the pronounced seasonal air temperature variations [1,2]. For tropical regions characterized by minimal temperature fluctuations (except at sites with steep orography, e.g., the Andes), δ18Op and δ2Hp changes are not associated with temperature. However, there is a noticeable negative correlation with the amount of precipitation, coined as the “amount” effect [3,4,5,6,7,8,9]. Although the rest of the effects might also increase or decrease the isotopic signal, this will ultimately depend on the site’s location.
One of the primary applications of isotopes lies in the field of paleoclimatology. In these studies, suitable well-behaved proxies (e.g., ice cores, tree-rings, speleothems) incorporate a meteoric isotopic signal to their structure at different accumulation rates, permitting inferences about past environments possible [2,10]. The suitability of δ18Op and δ2Hp for these studies is their ability to encode information about the source of the precipitation and its evaporation and condensation history [11]. Most paleoclimate studies have been conducted in the mid and high latitudes, where the annual input of total solar radiation is lower, allowing the presence of clearly defined seasons (warm/cold, dry/wet). In contrast, annual solar radiation is larger at low latitudes, with small temperature fluctuations along the year, and where day-periodic processes and circulations dominate the regional climate and weather [12].
In South America, there has been little discussion about precipitation outside the South American Monsoon (SAM) spanning the equator [13]. This region is characterized by complex local topography interacting with the annual migration of the Intertropical Convergence Zone (ITCZ) [7,13,14,15,16]. The ITCZ is a tropical belt of deep convective clouds where heat and moisture-laden surface trade winds converge, forming a zone of increased precipitation [2,17]. Unfortunately, this continental configuration spanning the equator presents two rainfall maxima occurring with the equinoxes, while the dry seasons are demarked by solstices [18], making the transfer to the paleoclimate proxy material and subsequent interpretation problematic.
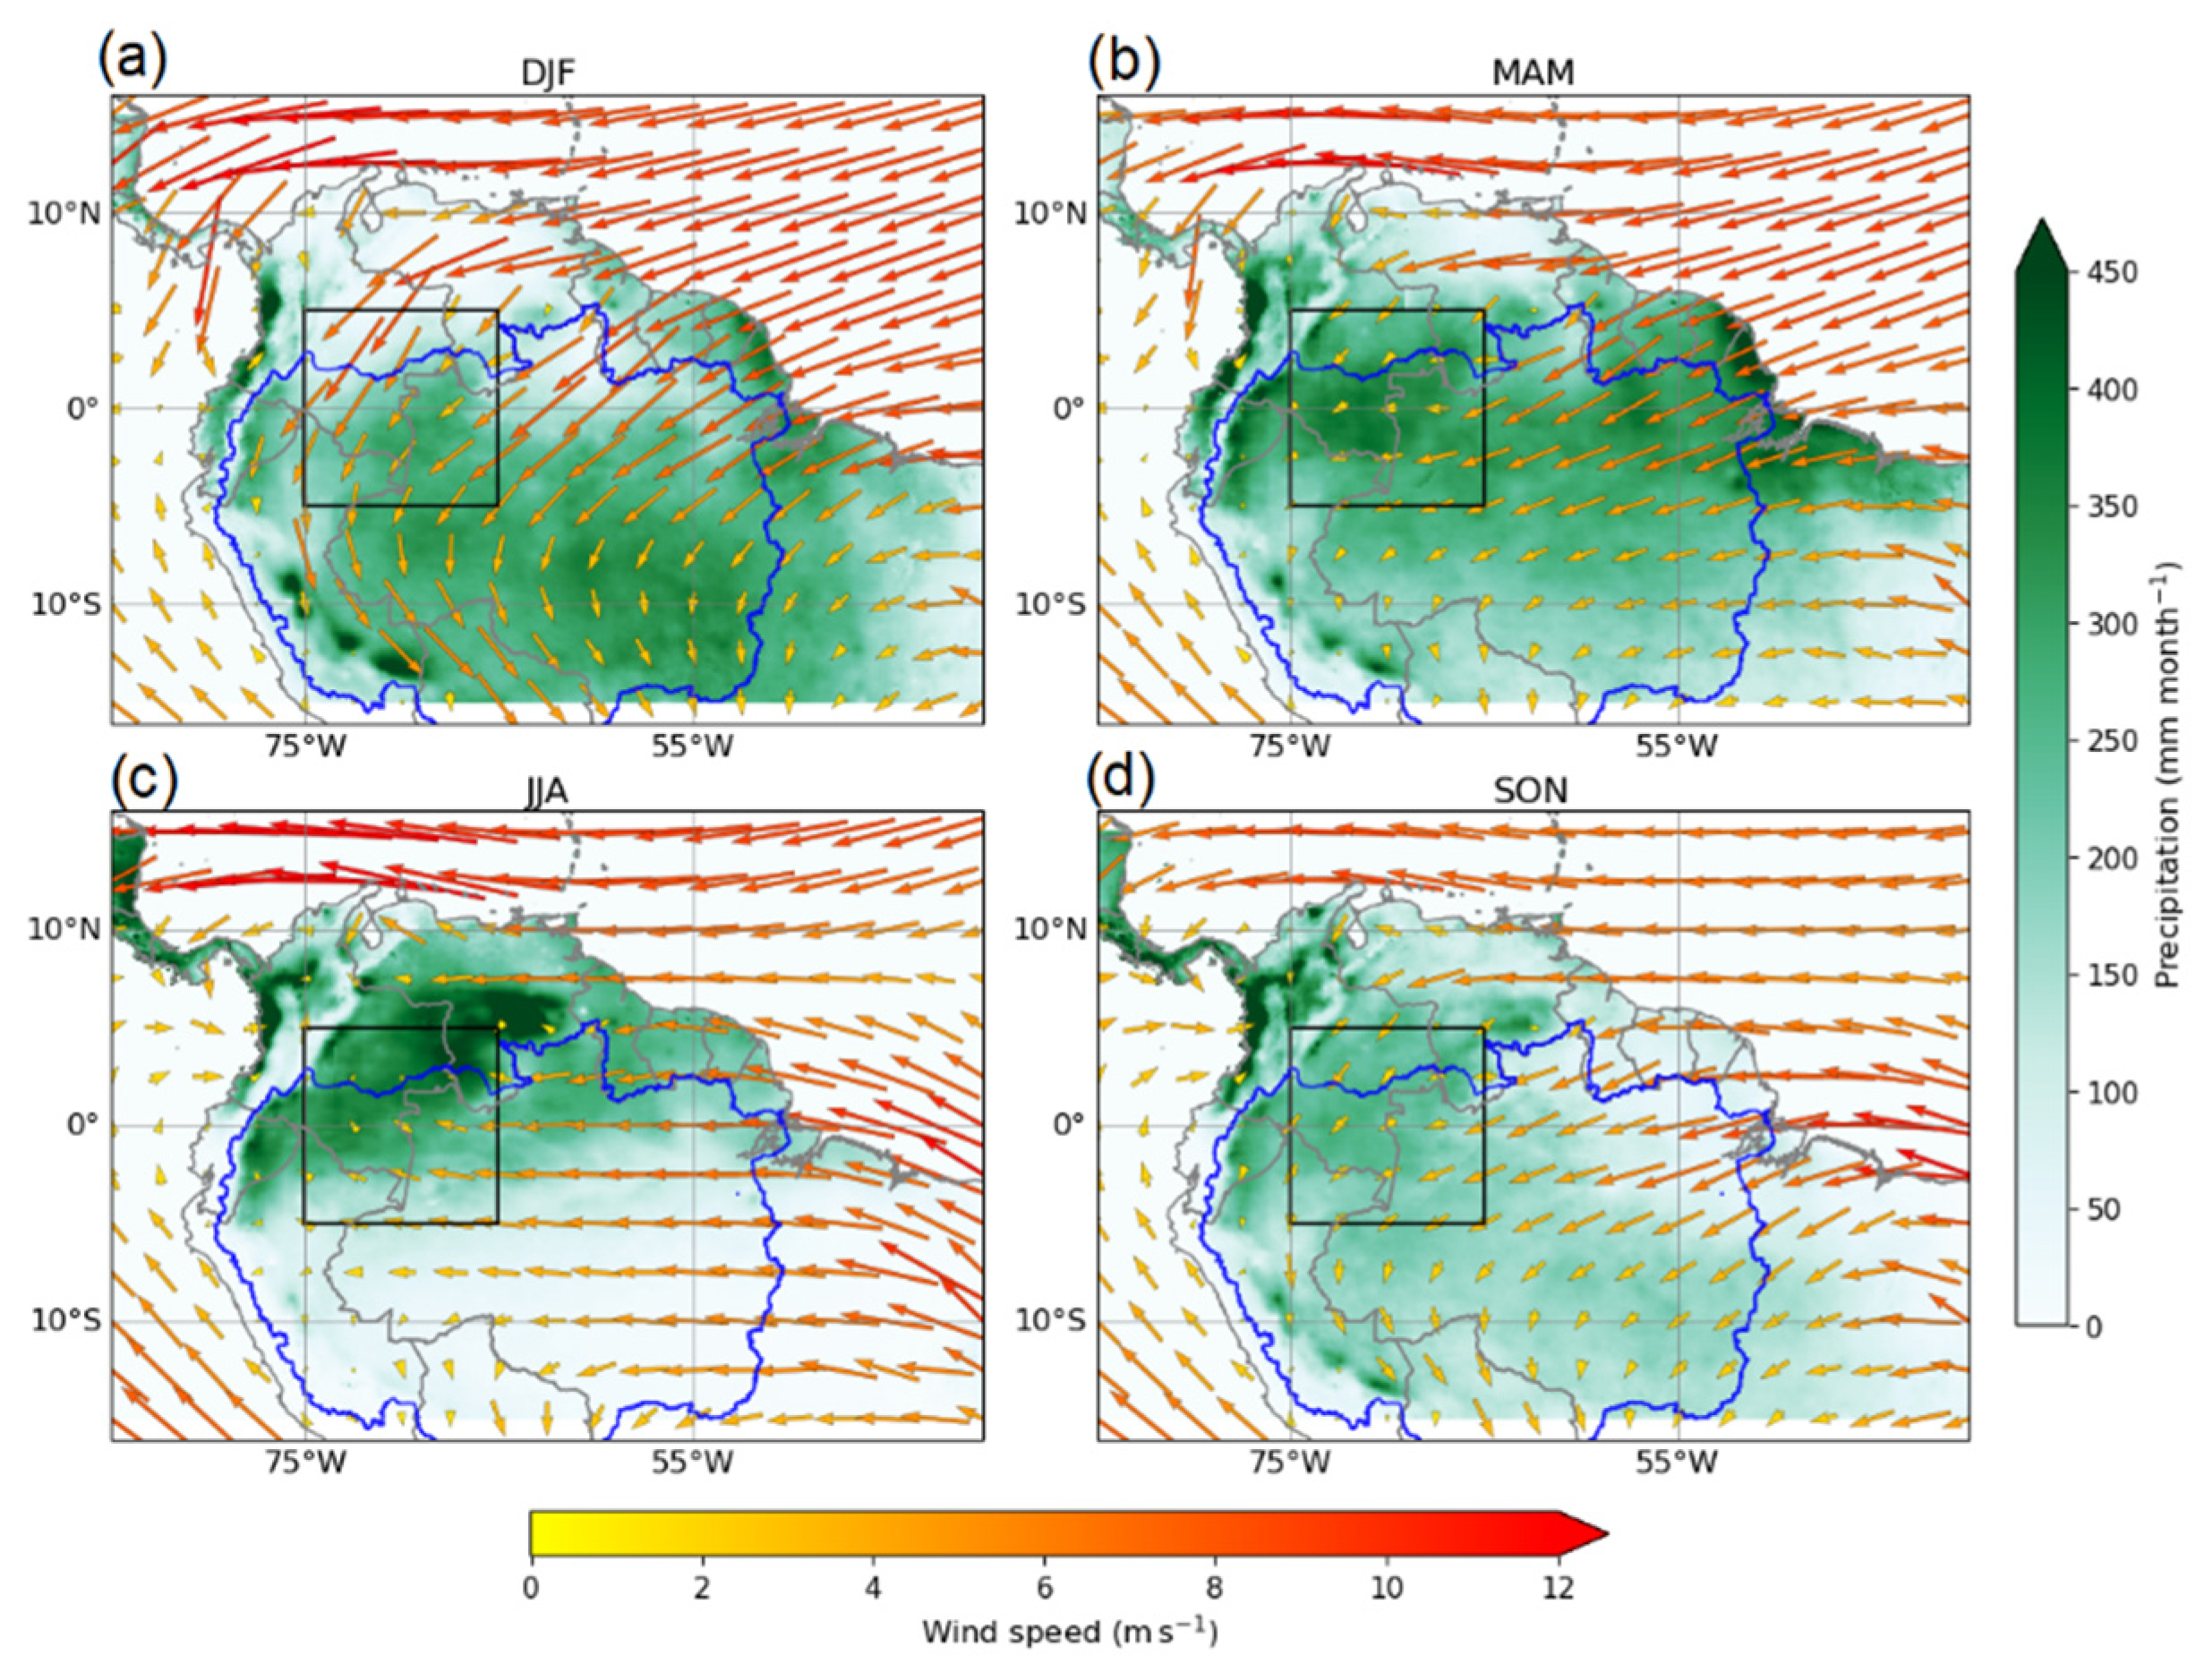
Previous research has established that the climate of Ecuador is indeed controlled by the ITCZ seasonal excursions and complex Andean orography [7,13,15]. In the first case, the ITCZ excursions throughout the year determine the provenance of air masses with different humidity and temperature conditions [2,7,15]. When the ITCZ is at its northernmost position (JJA), cold westerlies flow into Ecuador, whereas during austral summer (DJF), moist winds from easterly directions reach the country [15]. Regarding the Andes, it acts as a weather divide between the Pacific coast and the western Amazon due to its high elevation (>4000 m a.s.l.; Figure S1). The influence of the Andes is evident in the diverse rainfall regimes it creates (unimodal, bimodal, three-modal), the most common being the bimodal regime with higher rainfall in March–April (MA) and October–November (ON) [15,19]. Although the Ecuadorian climate is not monsoonal (see Figure S2), its unique location at the geographical equator permits investigating the interhemispheric moisture transport over tropical South America, linking the Southern to the Northern Hemisphere fluxes [20,21]. This transport of moisture, mass, momentum, and energy is called the cross-equatorial flow of air masses [22]. The cross-equatorial flow plays a crucial role in the advection of moist and warm air from tropical regions toward the poles [23,24]. Wang et al. [24] showed that precipitation variability over South America involves significant meridional migration and reversal of low-level winds between the south and north of the equator. These wind corridors in the lower atmosphere are Low-level jets (LLJs) and transport water vapor that modulates weather and climate [20,25,26]. Hence, LLJs are vital structures in the water vapor transport in the atmosphere, feeding the precipitation systems [26]. The cross-equatorial flow over the western equatorial Amazon (V-Index region; 5°S–5°N, 65°–75°W; black squares in Figure 1) also presents a LLJ like structure that effectively captures the seasonal reversal of the circulation in the continent (contrary to the eastern Amazon) and is strongly associated with the SAM transitions in the equinox and solstice seasons [20,24,27]. This monsoon index (V-Index) was constructed to represent the cross-equatorial flow variability, where positive (negative) values indicate southerly (northerly) winds [24,28,29]. Northerly winds dominate the cross-equatorial flow in austral summer (DJF) and southerly winds in winter (JJA), with a transition from northerly to southerly winds in autumn (AMJ) and southerly to northerly winds in spring (SON) [24] (Figure 1). A critical role of this atmospheric structure is the advection of moist, warm air polewards [20]. Bendix et al. [16] already indicated the passage of a LLJ at the eastern Andean slope from February to March in the Ecuadorian territory, which most likely corresponds to this low-level cross-equatorial flow. Unfortunately, direct and continuous rawin observations are scarce in the country and have delayed the investigation of these essential meteorological structures.
The seminal work of Garcia et al. [7] investigated the δ2Hp and δ18Op patterns in Ecuador by establishing two latitudinal northern and southern transects from the Coastal to the Amazon regions in the country. The authors showed that the Andes complex orography and the ITCZ precipitation in austral autumn (March–May) and spring (October–November) at these latitudes were responsible for the lowest δ18Op values, representing an amount effect. In addition, the surprisingly high δ2Hp and δ18Op values in the Ecuadorian Amazon (>2000 km from the Atlantic) were due to the intense recycling of water vapor in the Amazon Basin, which is not fractionated during evapotranspiration and hence enriched the signal [7,30]. However, questions have been raised about the inadequacy of the local amount effect to capture the observed isotopic variation in the country. For instance, Villacís et al. [31] found that the local amount of precipitation in Nuevo Rocafuerte in the western Amazon (Figure 2) poorly explained the δ18Op variability at daily and monthly intervals. On the other hand, upstream convection in northeastern South America and localized using Outgoing Longwave Radiation (OLR) (a proxy for convective precipitation) resulted in a better predictor of the monitored isotopic values. Similarly, Lima [32] monitored the rainfall and runoff in the Ecuadorian Andes and noted the discrepancy in the precipitation regime between the Papallacta and the Izobamba Andean stations (Figure 2), where the first shows a unimodal rainfall regime (April–August) while the second displays a bimodal pattern (March–May and October–November). Nevertheless, both stations present similar isotopic seasonality bringing up doubts about the efficacy of the local amount of precipitation to capture the δ2Hp and δ18Op variability. The issue has also been addressed by simulating stable water isotopes using regional and global circulation models, resulting in underestimation [33], overestimation [34], or a slight improvement compared to the northern hemisphere [35].
Overall, previously published studies are limited to local surveys, and the existing literature fails to resolve the contradiction between the various rainfall regimes and the common inter-annual variability of δ18Op over the Ecuadorian inter-Andean valley and Amazon. Hence, this paper provides new insight into explaining the common annual “w-shape” δ18Op pattern identified among stations located at different elevations and latitudes in the Ecuadorian Andes and Amazon (Figure 2). We focus on the precipitation amount over the V-Index region to accomplish this task, which effectively captures the rainfall and convection change over tropical and subtropical South America and is a transition zone from America’s southern to northern monsoon [21,24,36,37]. This provides a new approach that harnesses the distinct geographical location of continental Ecuador for explaining the δ2Hp and δ18Op variability.
Figure 2.
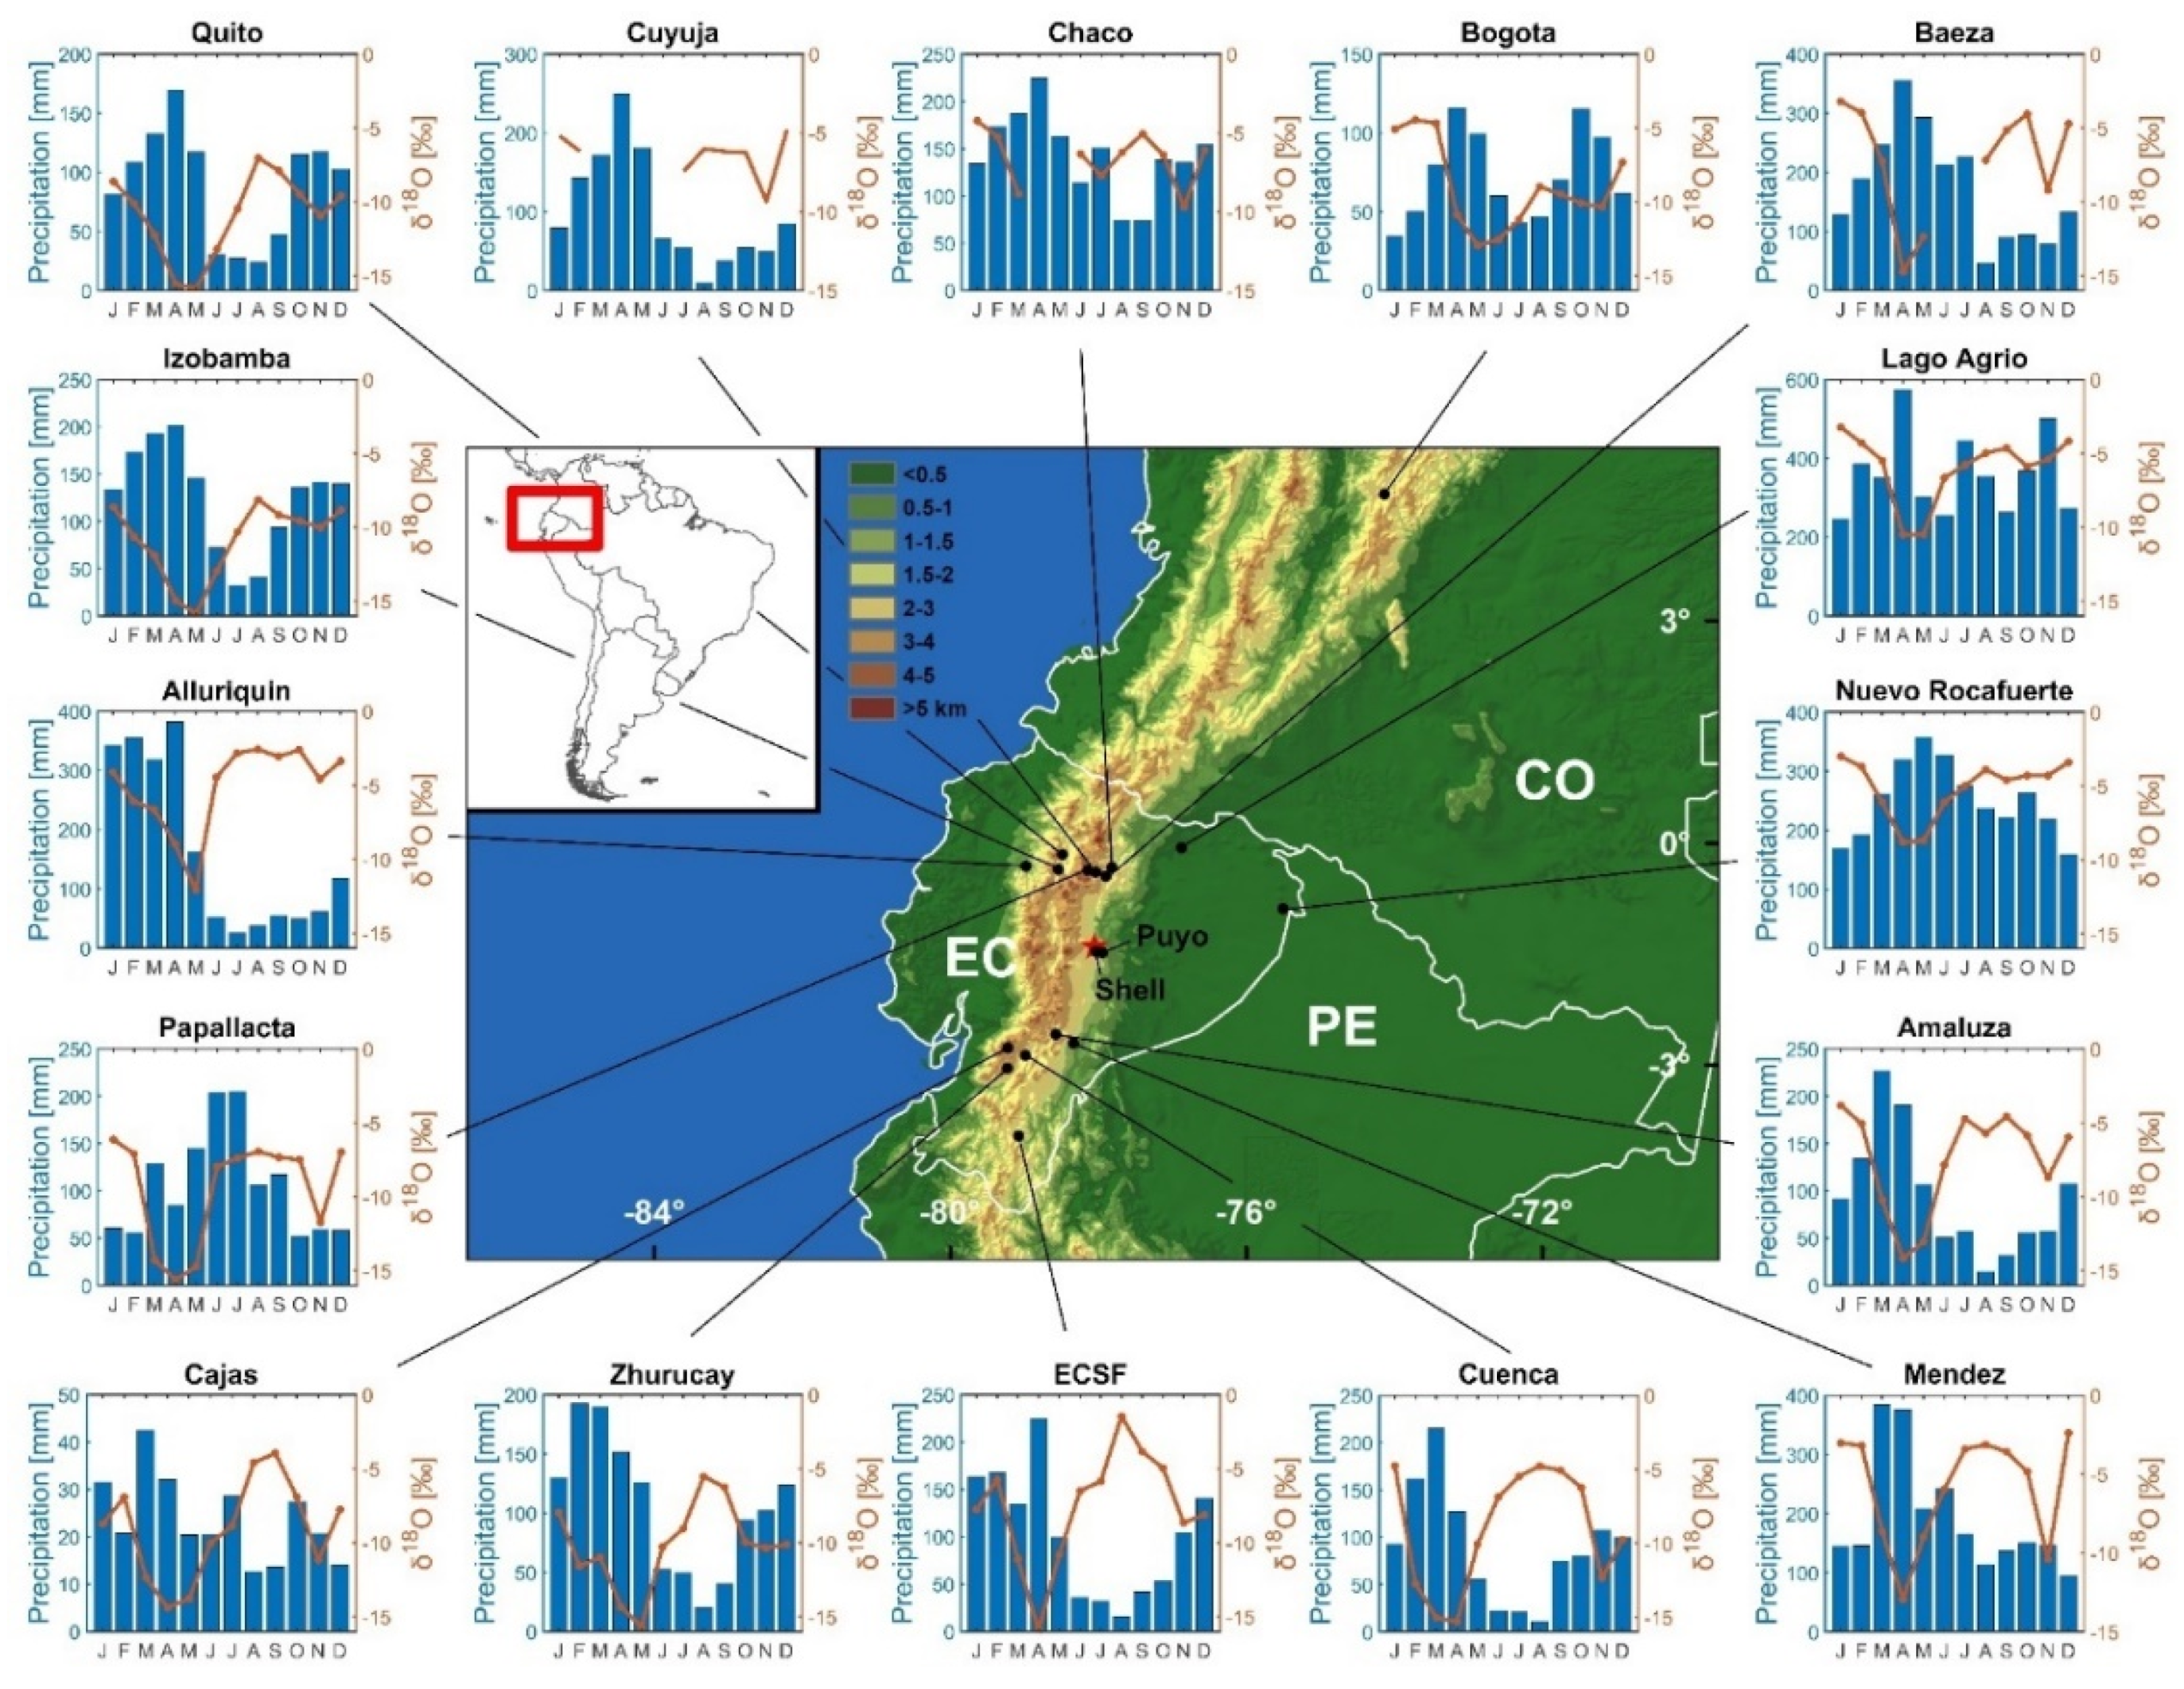
Rainfall climatology and δ18Op seasonality for stations along Ecuador’s Amazon and Andean region. Datasets correspond to the Global Network of Isotopes in Precipitation (GNIP) [38]. Data for ECSF from Goller et al. [39] and Timbe et al. [40]. Values for Zhurucay are from Mosquera et al. [41], Cajas from Esquivel-Hernández et al. [42] and for Nuevo Rocafuerte from Bowen [43]. The Mera study site is marked by a red star, whereas the nearby Shell and Puyo instrumental stations are also indicated.
Figure 2.
Rainfall climatology and δ18Op seasonality for stations along Ecuador’s Amazon and Andean region. Datasets correspond to the Global Network of Isotopes in Precipitation (GNIP) [38]. Data for ECSF from Goller et al. [39] and Timbe et al. [40]. Values for Zhurucay are from Mosquera et al. [41], Cajas from Esquivel-Hernández et al. [42] and for Nuevo Rocafuerte from Bowen [43]. The Mera study site is marked by a red star, whereas the nearby Shell and Puyo instrumental stations are also indicated.

The work has been divided into three parts. The first part introduces the study site, where monitored δ2Hp and δ18Op were carried out to counteract the data sparsity at this latitude (red star in Figure 2). The methods used for retrieving and processing gridded data are also presented. Furthermore, the transport history of air masses using back trajectories is shown. The second part shows the results and discussion, where the local altitude and the regional amount of precipitation at the V-Index region are evaluated for the study site and previous δ18Op datasets from Andean and Amazonian stations. Finally, part three provides a summary of the main conclusions.
2. Materials and Methods
2.1. Study Site and Local Monitoring Campaign
The study site is in Mera, Province of Pastaza (1° 24′ S, 78° 03′ W, 1200 m a.s.l.) at the eastern foothills of the Ecuadorian Andes (Figure 2). The climate is transitional between lowland and montane forests, receiving constant moisture throughout the year [13]. The seasonal distribution of precipitation is bimodal, with an average of 4500 mm annual precipitation. It consists of two minor (December–February and July–September) and two main rainy seasons (April–June and October–November). The mean monthly temperature fluctuates between 21 and 23 °C [13].
The site presents an optimal location for stable isotopic monitoring. It fills the δ2Hp and δ18Op data gap between the northern and southern transects in the country. In addition, the Mera site is a transition between the Amazon lowland and the eastern Andean foothills, which is essential to evaluate a potential altitude effect. Rainwater samples in the Mera site were collected over 30 months from February 2019 to July 2021 in a 12 L plastic container, to which 300 mL of paraffin oil was added to prevent evaporation according to standard procedures [44]. Monthly rainfall samples were collected, and containers were replaced at the beginning of each month for δ2Hp and δ18Op measurements. After each collection, precipitation was preserved in polyethylene terephthalate (PET) bottles, tightly sealed to avoid contamination and evaporation. Rainwater samples were immediately transported to the Chemistry laboratory at the Universidad Politécnica Salesiana-Quito, Ecuador (UPS) for monthly volume measurement, packing, and shipping to the Isotope Climatology and Environmental Research Centre, Institute for Nuclear Research, Debrecen, Hungary. However, due to the coronavirus pandemic, the amount of precipitation could not be measured continuously at the UPS laboratory, and therefore the samples were directly dispatched. Hence, the amount of precipitation (March–December 2020) was obtained from Shell and Puyo stations located 10 and 15 km from the rainwater collector to fill data gaps (Figure 2). The correlation between Puyo (956 m) and Shell (1043 m) stations for their common 1981–2021 precipitation period is r = 0.72 (p < 0.01), and for the gap March–December 2020 is r = 0.89 (p < 0.01). The rainwater samples were measured by a Los Gatos Research, Liquid Water Isotope Analyzer (LGR LWIA-24i, ABB-Los Gatos Research, San Jose, California, United States). The internal laboratory standards were calibrated against international water standards, V-SMOW, GISP, and SLAP. The reproducibility was better than 0.16‰ for δ18Op and better than 1.04‰ for δ2Hp, based on repetitions of laboratory standards.
In addition to precipitation, the daily air temperature was recorded at an hourly rate from February 2019 until April 2020 (14 months) with a DS1922L iButton temperature logger (±0.5 °C accuracy, 0.0625 °C resolution) installed 2 m above the ground and protected with a radiation shield. The complete analytical results are presented in the Supplementary Materials (Table S1). The obtained data were validated with temperature records from Puyo and Shell instrumental stations and ERA5 reanalysis (2 m temperature product) 0.25° × 0.25° horizontal resolution [45] (Figure 3 and Figure S3).
2.2. Stable Isotopes Datasets
The δ2Hp and δ18Op from stations located in the Ecuadorian Amazon lowlands and inter-Andean highlands were primarily obtained from the IAEA Global Network of Isotopes in Precipitation (GNIP) database [38], except for Estación Científica San Francisco (ECSF) obtained from Goller et al. (2005) [39] and Timbe et al. (2014) [40]. Similarly, the isotopic values for Zhurucay basin correspond to Mosquera et al. (2016) [41] and for Cajas station from Esquivel-Hernández et al. [42]. In the case of Nuevo Rocafuerte, the values were acquired from the isoscape model proposed by Bowen et al. [43]. Although isoscapes models can be coarse at unmonitored sites, the obtained values for Nuevo Rocafuerte compared well with those monitored in the 2001–2002 period by Villacís et al. (2008) (r = 0.89, p < 0.01). When the precipitation values were missing from the corresponding stations, they were acquired from the Global Historical Climatology Network (GHCN) version 4 [46].
2.3. Moisture Sources
The HYSPLIT (HYbrid Single-Parcel Lagrangian Integrated Trajectory) model [47], successfully used in past investigations in Ecuador (see [6,48]), was utilized to identify the sources of moisture employing the PySplit package [49]. The trajectories originating at the Mera site in Central Ecuador were calculated at 1500 m, the altitude where broad precipitation encompasses most of the shallow and deep convection in the tropical Andes [50]. The meteorological data were obtained from the GDAS (Global Data Assimilation System) at 1° × 1° spatial and 3-h time resolution. Trajectories were calculated from 2014 to 2019 for 240 h (10 days) every two days. In order to refine the analysis, the calculation of moisture uptake was carried out following the methodology described in Sodemann et al. [51], which utilizes a Lagrangian framework tracking moisture changes inside the atmospheric boundary layer and marking them as uptake points along the back trajectories path. For calculating the moisture uptake, values of precipitation = −0.2 and evaporation = 0.2 at 6 h intervals were used. The analysis and visualization used Python version 3.9.10 in the Scientific Python Development Environment (Spyder) 5.0. (Figure 4). In addition, calculated clusters on back trajectories for all the stations indicated in Figure 2 for the 2019 year were carried out utilizing the “openair” R package [52] (Figure S4).
2.4. Cross-Equatorial Flow over Western Amazon and Precipitation Gridded Products
Equatorial South America, although not monsoonal per se [13,15,53,54], is linked to the SAM through LLJs (e.g., cross-equatorial flow, Orinoco) and its seasonal convection variability [24,25,36,55]. In the first case, the V-Index region (5° S–5° N, 65°–75° W; black boxes in Figure 1) was identified according to Wang et al. [24] and captured the interhemispheric migration of rainfall crossing the equator. For its boundary identification, Wang et al. [24] constructed a monsoon meridional V-Index using a 925-hPa monthly mean meridional winds. At this level, the cross-equatorial flow and the meridional wind moisture transport are of a high magnitude. Here, positive (negative) values indicate southerly (northerly) winds [24,29]. Regarding seasonal variations of convection in tropical South America (1976–2006), they have been studied using pentad means of Outgoing Longwave Radiation (OLR) [36]. Using an Empirical Orthogonal Function (EOF) analysis of the OLR product, Garcia et al. [36] found three dominant modes describing the seasonal variations in convection associated with the SAM. In particular, the third mode, EOF3 (4.4%), corresponds to the equatorial symmetric mode around 3–5° N in the western Amazon and central equatorial Atlantic and represents the semiannual response of the tropical convection to insolation changes during the year [36]. In other words, EOF3 indicates convection occurring during the transition from dry to wet seasons on the equator and intersects the abovementioned V-Index region (see Figure 1 in Garcia et al. [36]). This supports the suitability of this area for capturing the climatological variations at a semiannual scale. Our paper did not calculate the V-Index and directly utilized the V-Index coordinates (5°S–5°N, 65°–75°W). However, we calculated the EOF3 according to Garcia et al. [36] using monthly OLR data from the NOAA/OAR/ESRL PSL at 2.5° × 2.5° resolution [56] (Figure S5).
The precipitation time-series averaged at the V-Index region were obtained from the European Centre for Medium-Range Weather Forecasts (ECMWF) ERA5 [57], The Climate Hazard group Infrared Precipitation with Stations CHIRPS [58], and the Climate Research Unit CRU TS4.05 [45]. In the case of the ERA5, the total precipitation NetCDF product on single levels from 1979 to 2021 (0.25° × 0.25° resolution) was used. This product is expressed in m (of water equivalent) day−1; hence the conversion to mm month−1 used the formula tp [mm] = tp [m day−1] × 1000 × N, where N is the number of days in the month. Regarding CRU, the horizontal resolution for the precipitation product was 0.5° × 0.5°, whereas, for CHIRPS, the resolution was 0.05° × 0.05°, making it an appropriate product for capturing the rainfall variability of the Andes [59]. The Pearson correlation coefficient was used to evaluate the monthly δ18Op variation regionally at the Mera site. The δ18Op time-series were compared with the gridded ERA5, CRU, CHIRPS precipitation, and the OLR datasets from February 2019 to July 2021 at p < 0.05. Initially, it was carried out for Mera and then for the rest of the stations in the 1992–1996 and 1998–2016 periods. Finally, precipitable water was obtained from a Weather Research and Forecasting (WRF) simulation with a domain of 50 km horizontal resolution (100 × 100 grid cells, centered at 1.77° S–78.10° W) and 51 levels in the vertical with a top pressure of 10 hPa. The WRF experiment was forced by the Community Climate System Model version 4, satisfactorily employed in South America and recently in Ecuador [60]. Precipitable water is an absolute measure of the total water of the air and equals the amount of water if all the water vapor was condensed [37,61].
3. Results and Discussion
3.1. Mera Site Isotopic Patterns
3.1.1. Local Meteoric Water Line (LMWL)
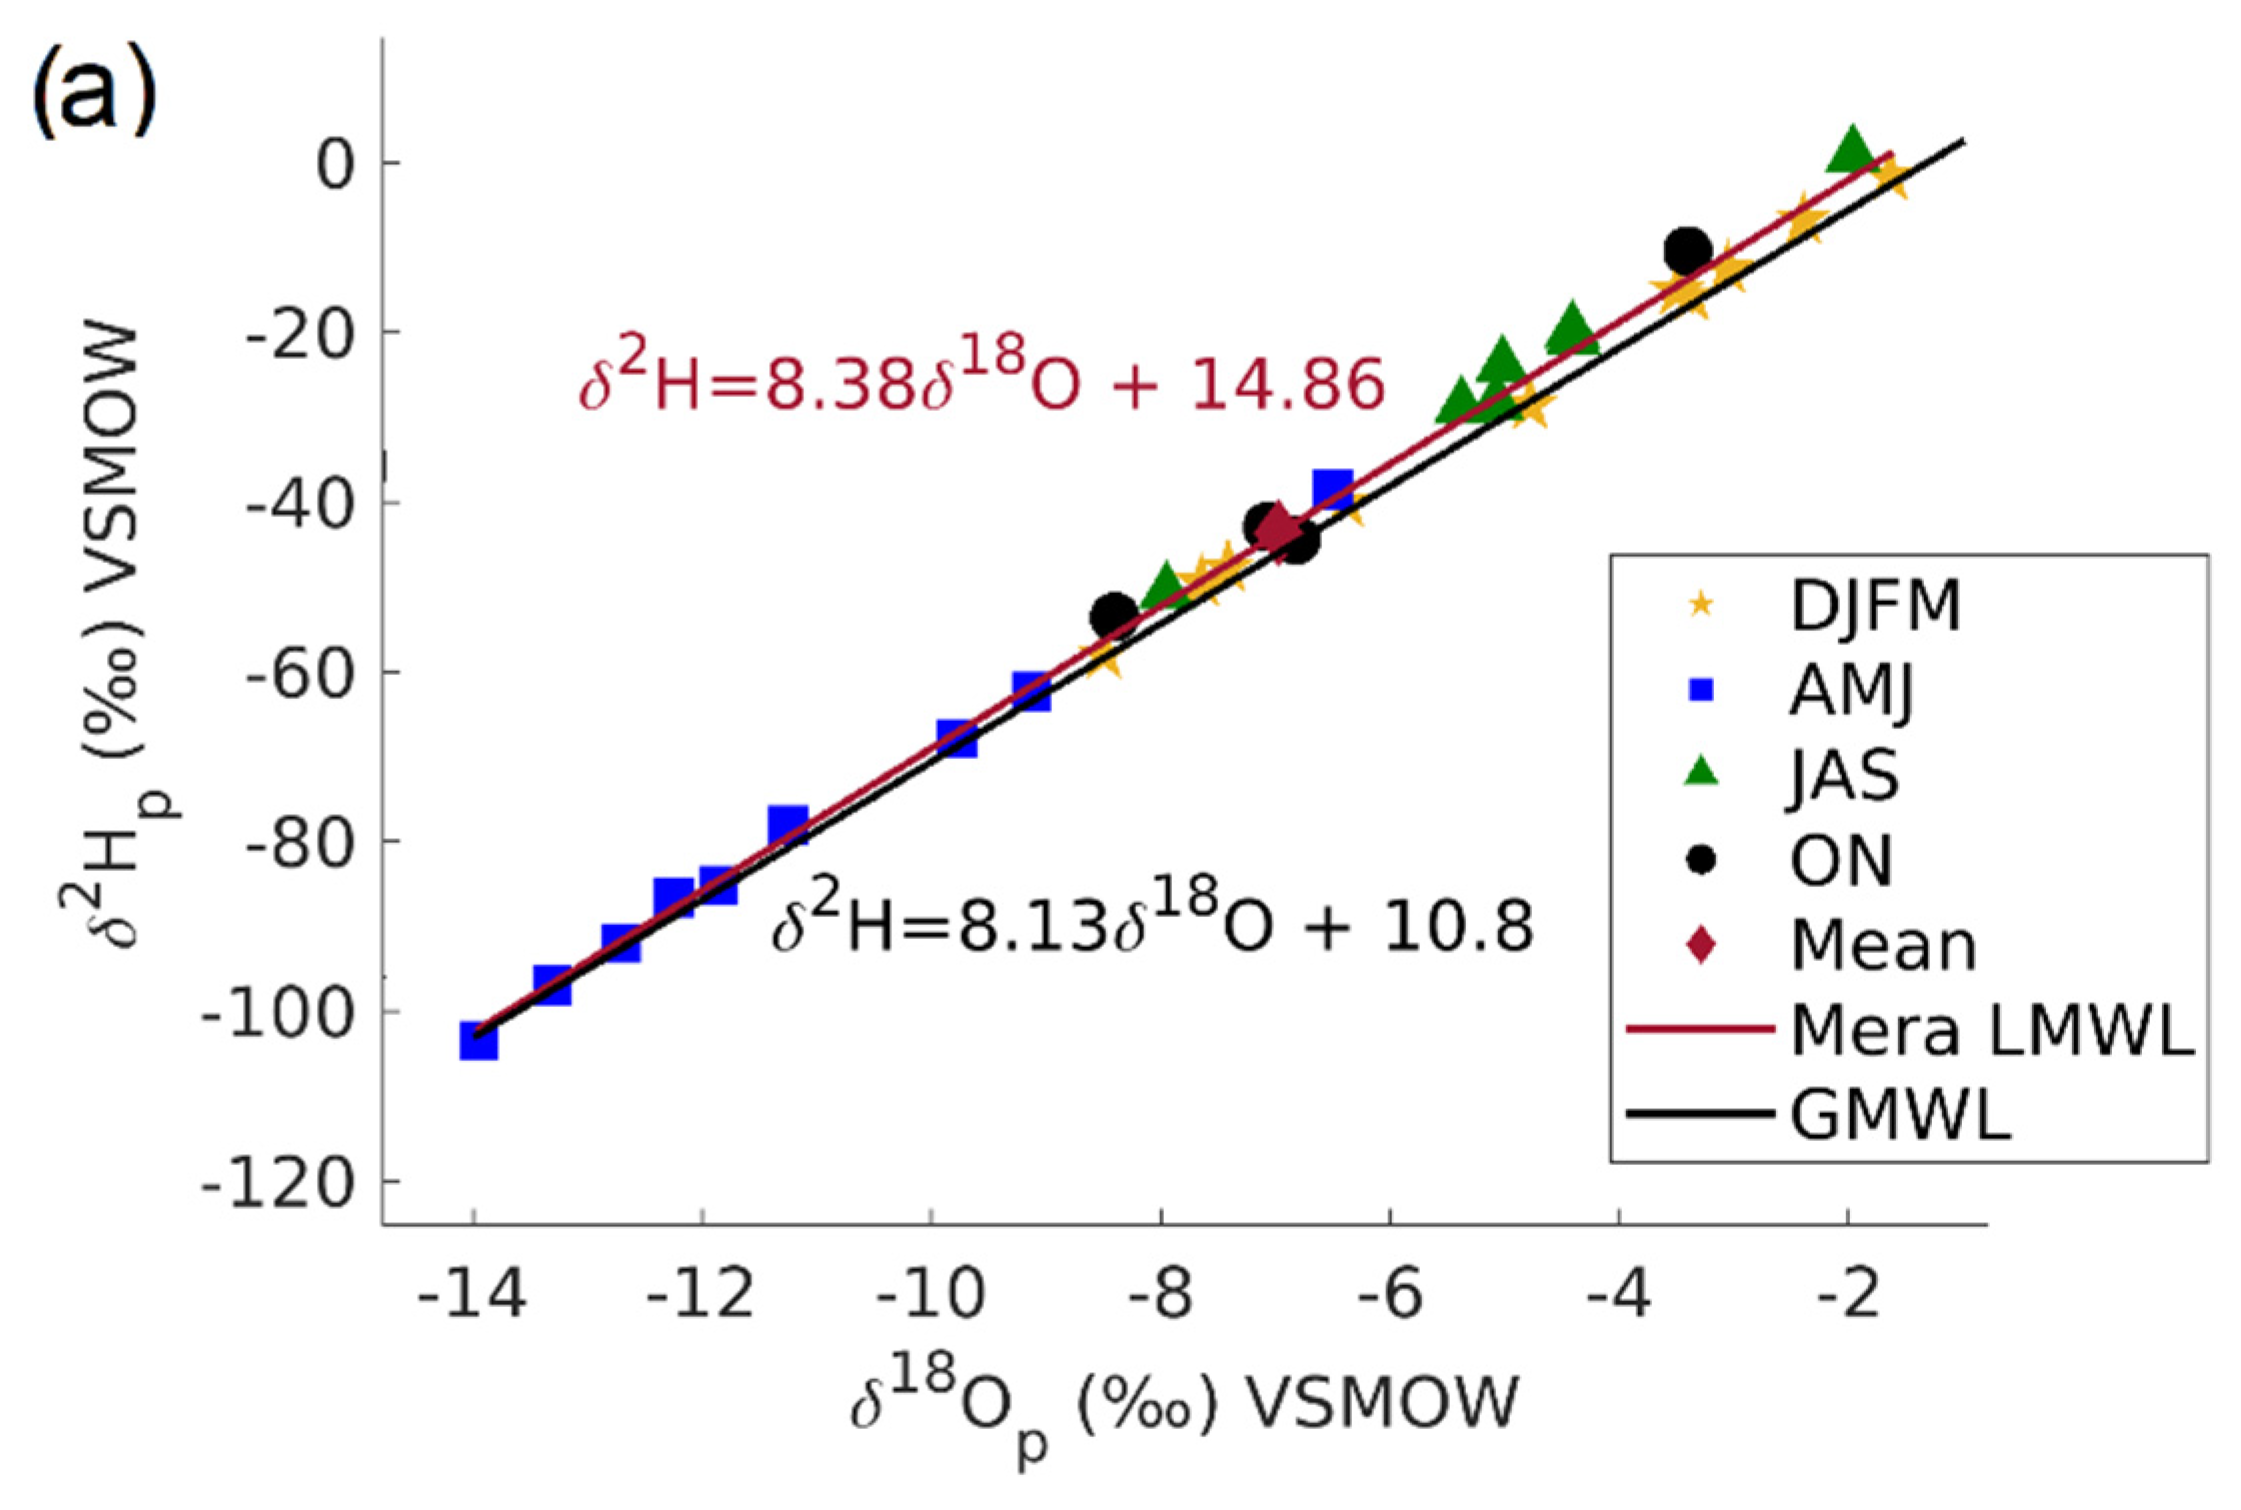
The relationship of δ18Op and δ2Hp at the Mera site is closely aligned to the Global Meteoric Water Line (GMWL). Their linear relationship (LMWL) is δ2Hp = 8.38δ18Op +14.86 (n = 30), showing an ~5‰ higher deuterium intercept (Figure 3a). A closer inspection of the figure shows the intra-annual seasonality in δ18Op, where austral summer (DJFM; min −8.5‰, max −1.6‰, mean −4.9‰) and winter (JAS; min −8.0‰, max −2.0‰, mean −4.9‰) indicate the most 18O-enriched values, whereas the austral autumn (AMJ; min −14.0‰, max −6.5‰, mean −11.2‰) present the most 18O-depleted. In the case of austral spring (ON; min −8.4‰, max −3.4‰, mean −6.4‰), the values plot close to the mean average, although the value for October 2020 was particularly high (−3.40‰ δ18Op). As the results show that δ2Hp and δ18Op are well correlated, the subsequent discussion primarily focuses on the δ18Op. The Mera LWWL (δ2Hp = 8.38δ18Op +14.86) agrees with the recently calculated Jumandy (δ2Hp = 8.33δ18Op +14.65) and Ikiam (δ2Hp = 8.30δ18Op +14.64) LMWLs encompassing a similar but shorter period from April 2019 to February 2020 [6]. The sites are comparable to the Mera site due to their similar location at the western Amazon with ~65 km distance from each other, supporting our findings.
3.1.2. δ18Op Correlation with Local Temperature and Precipitation
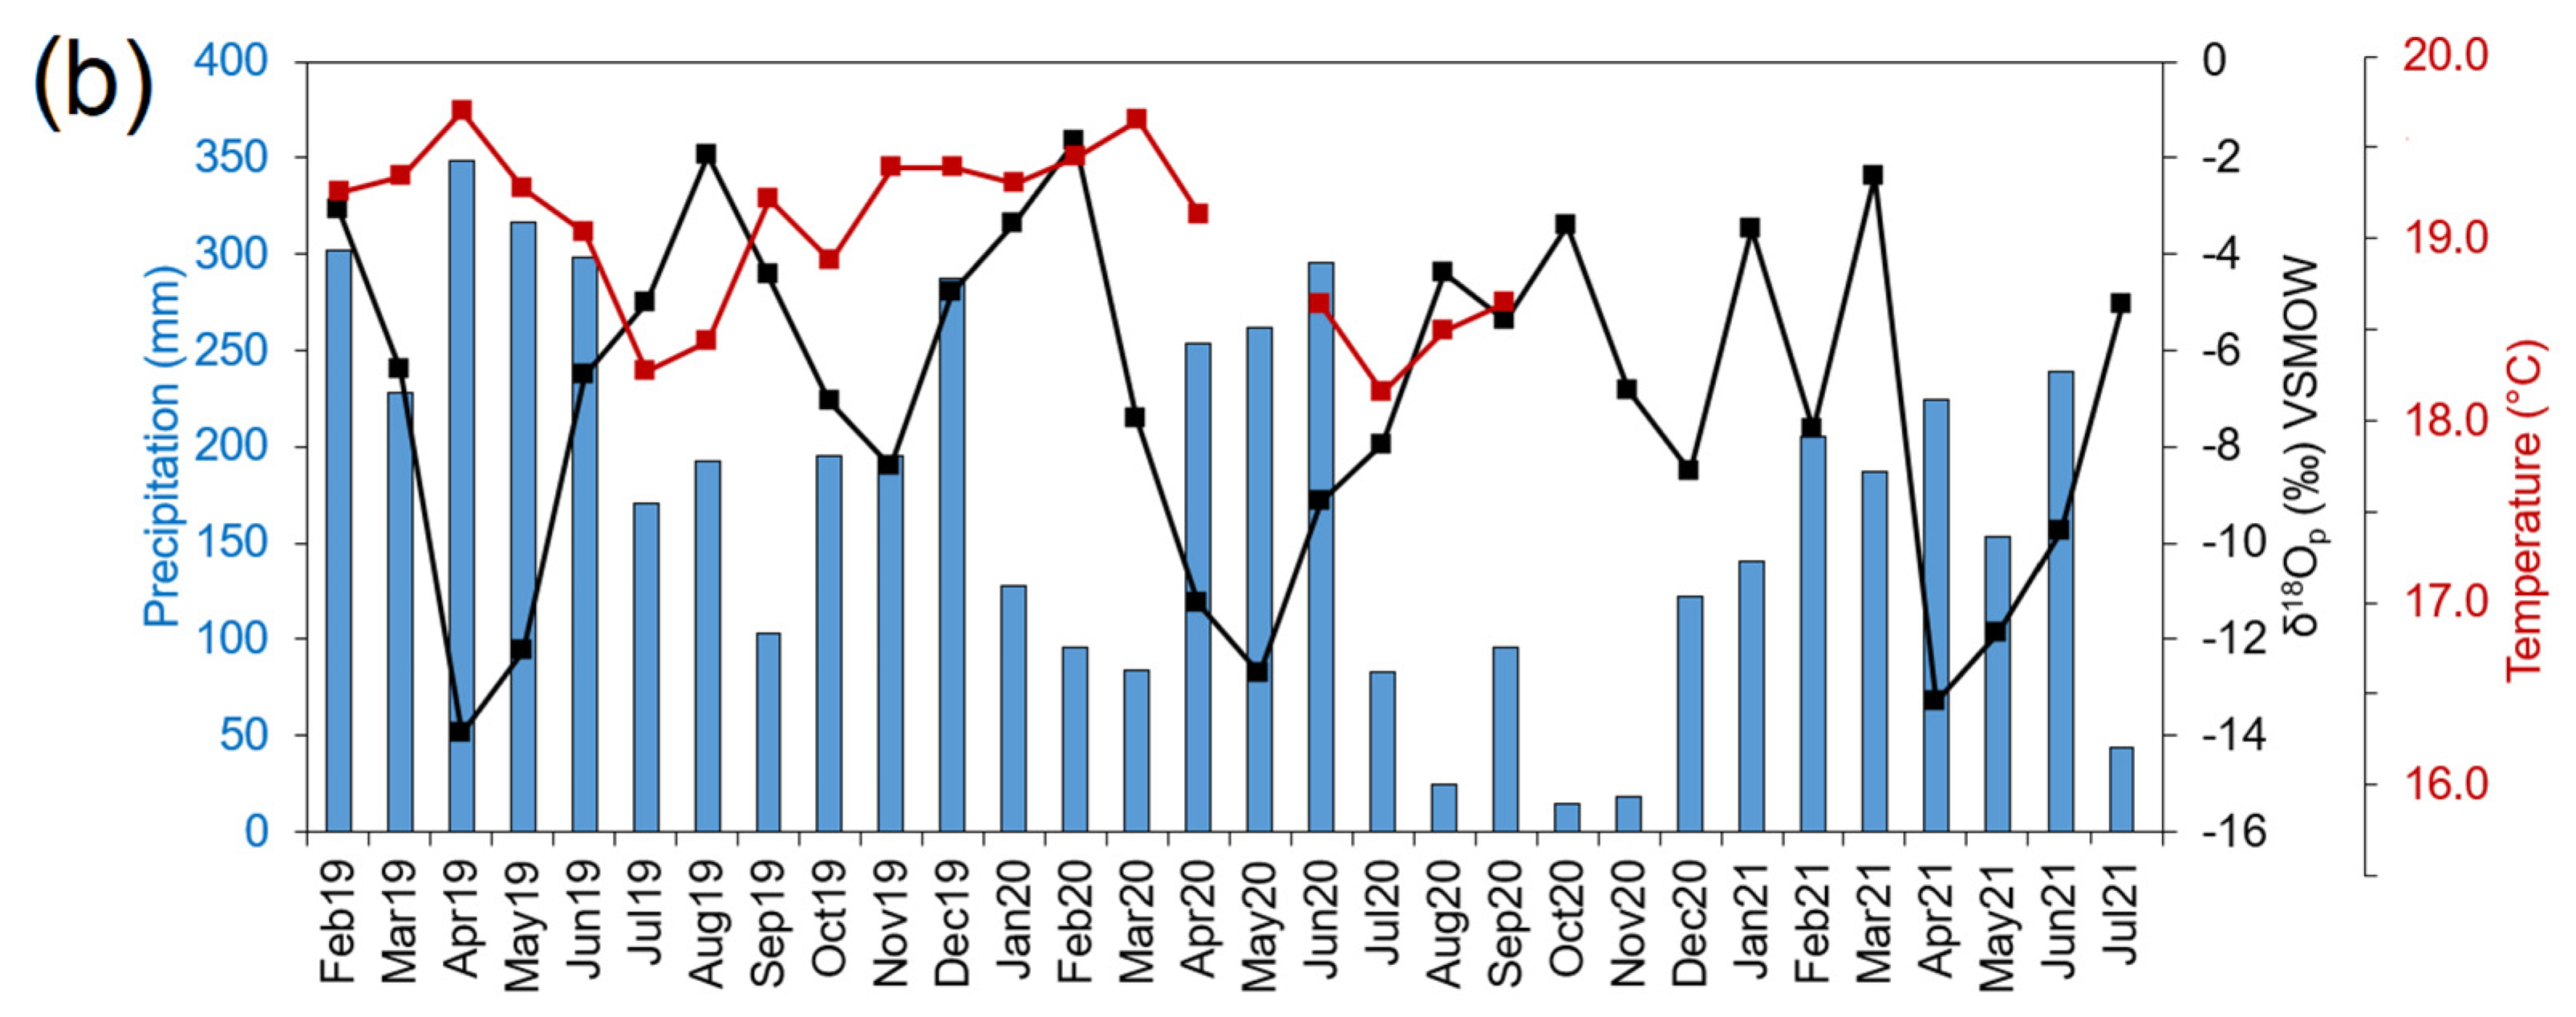
The 14-month (February 2019 to April 2020) temperature monitoring in the Mera site revealed a low seasonal amplitude with a mean of 19.1 °C (min. 18.2 °C and max. 19.7 °C) as presented in Figure 3b and Figure S3. A marked drop of approximately 1 °C occurred in July–August with a gradual increase in the following months, September–April. Comparing our monitored temperature data with the 2 m temperature ERA5 reanalysis for the Mera site and the Ecuadorian Amazon region, along with including the Puyo and Shell instrumental stations for the same period of 2019–2021, resulted in similar findings (Figure S3a). Indeed, these records confirm the trough during austral winter (JJA) and the low seasonal temperature variation in the site. The ERA5 2m mean temperature interpolated for Mera was 20.7 °C (min. 19.3 °C and max. 21.8 °C), and for the averaged Ecuadorian Amazon, the mean was 22.3 °C (min. 20.9 °C and max. 23.4 °C). In addition, the validation with Puyo and Shell instrumental stations gave a mean of 23.3 °C (min. 21.5 °C and max. 25.2 °C) and 23.4 °C (min. 20.5 °C and max. 25.6 °C), respectively. The temperature variability is higher in the Puyo and Shell stations (4–5 °C), whereas in the ERA5 reanalysis, the Mera and Amazon variation is lower (2.5 °C), being relatively close to our registered values (1.5 °C). This marked difference in employing instrumental stations is most likely related to their location. The correlation between Puyo and Shell stations for their common temperature period (1981–2021) is r = 0.63 (p < 0.01), which suggests differences in their locality (e.g., the Shell station is located at the Rio Amazonas airport, where the potential urban heat island effect might play a role). Nevertheless, the temperature seasonal variation is coherent among the records and might be related to the solar insolation having peaks during Vernal and Autumnal equinoxes (March 20 and September 22). Conversely, the approximately 1 °C decrease during July–August could be attributed to the June solstice [13]. The diurnal cycle showed higher variability, with temperatures fluctuating from 15 to over 35 °C in a few hours, reflecting the high diurnal variations characteristic of tropical climates [12] (Figure S3d). There is a weak correlation between the δ18Op and all the above-stated temperature records: Mera monitored (r = −0.22; p < 0.05), Mera ERA5 (r = −0.12; p < 0.05), Amazon ERA5 (r = −0.05; p < 0.05), Puyo (r = −0.09; p < 0.05) and Shell (r = 0.07; p < 0.05). This finding is consistent with that of Jiménez–Iñiguez et al. [6] at Jumandy and Ikiam stations in the northwestern Amazon, indicating that the temperature effect does not influence the δ18Op due to the low-temperature variation, which is unlikely to imprint a significant isotopic signal. A note of caution is due here since these results apply to Amazon lowlands and might differ towards the Andes (See Section 3.2.1).
On the other hand, comparing the δ18Op with the local amount of rainfall gave a low negative correlation of r = −0.46 (p < 0.01). It can be seen from Figure 3b that a marked decrease in δ18Op occurs during April–May (AM) and October–November (ON). In contrast, during austral winter (JAS), the highest δ18Op values are anti-correlated with the less-humid months. This low correlation between local precipitation and δ18Op can be partly explained by the location of the Mera site, being a transition zone between the Amazon lowlands and the Andes cordillera with elevations above 4000 m (Figure S1). Here, high cloud frequencies at the eastern Andean slope as a result of barrage effects of the easterlies have been reported in the literature [62]. The Andes’s interaction with prevailing wind flow triggers convection and the development of rapid organized convective storms called Mesoscale convective systems (MCSs) [63]. This continuous input of convective cloudiness significantly increases the precipitation at the eastern Andean slopes and Amazon foothills, altering the correlation with the monitored δ18Op at the Mera site. These results agree with those obtained by Jiménez–Iñiguez et al. [6], who recently monitored isotopic rainfall at Ikiam and Jumandy stations from April 2019 to February 2020. The authors showed that the most depleted δ18Op coincided with the highest precipitation during March–June and October–December, obtaining an r = −0.41 (p < 0.01) between the δ18Op and local precipitation. This correlation is similar to our r= −0.46 and agrees with the AM and ON depleted seasons, supporting the hypothesis proposed by Garcia et al. [7] that the lowest δ18Op values correspond to the seasonal passage of the ITCZ (MAM and ON). In addition, associated with these ITCZ excursions is the semiannual variability of convection with two peaks in austral autumn and spring due to in-situ radiational heating (sun crossing the equator) triggering zenithal convective thunderstorms after equinoxial insolation [16,64,65].
3.1.3. δ18Op and Moisture Trajectories
Although the annual ITCZ excursions crossing Ecuador explain the drop in δ18Op values during austral autumn and spring, further analysis is required to interpret the higher δ18Op values. Bulk back trajectories and clusters show that during summer (DJF), northeast trajectories from the tropical north Atlantic crossing Venezuela, Colombia, and finally Ecuador are dominant from 500 to 4000 m (~950 to 600 hPa) (Figure S6). A second trajectory from the South Pacific is also evident and is notably stronger until 2000 m (~800 hPa), gradually decreasing at lower pressures (~700 to 600 hPa). This “bow-shape” configuration is enhanced in Figure 4, where only the trajectories bringing moisture are plotted. Here the moisture flux upstream contributes to the majority of the flow arriving in Ecuador, with a lower amount being uptake in the vicinity of the Mera site (Figure 4a,e). This fast-flowing northeast flow is likely related to the Orinoco Low-Level jet (OLLJ), which is a low-level nocturnal wind occurring during austral summer at 950–800 hPa with mean wind speeds of 8 m s−1 over Colombia and Venezuela [66] (Figure S7). It has been recently reported that the OLLJ influences the northeastern part of Ecuador (jet exit region) based on the transport of air pollutants moving from the Orinoco river basin towards Ecuador [16,67]. On the other hand, the water vapor moving from the South Pacific corresponds to the Humboldt current, characteristic of the wind system at the coast [68,69].
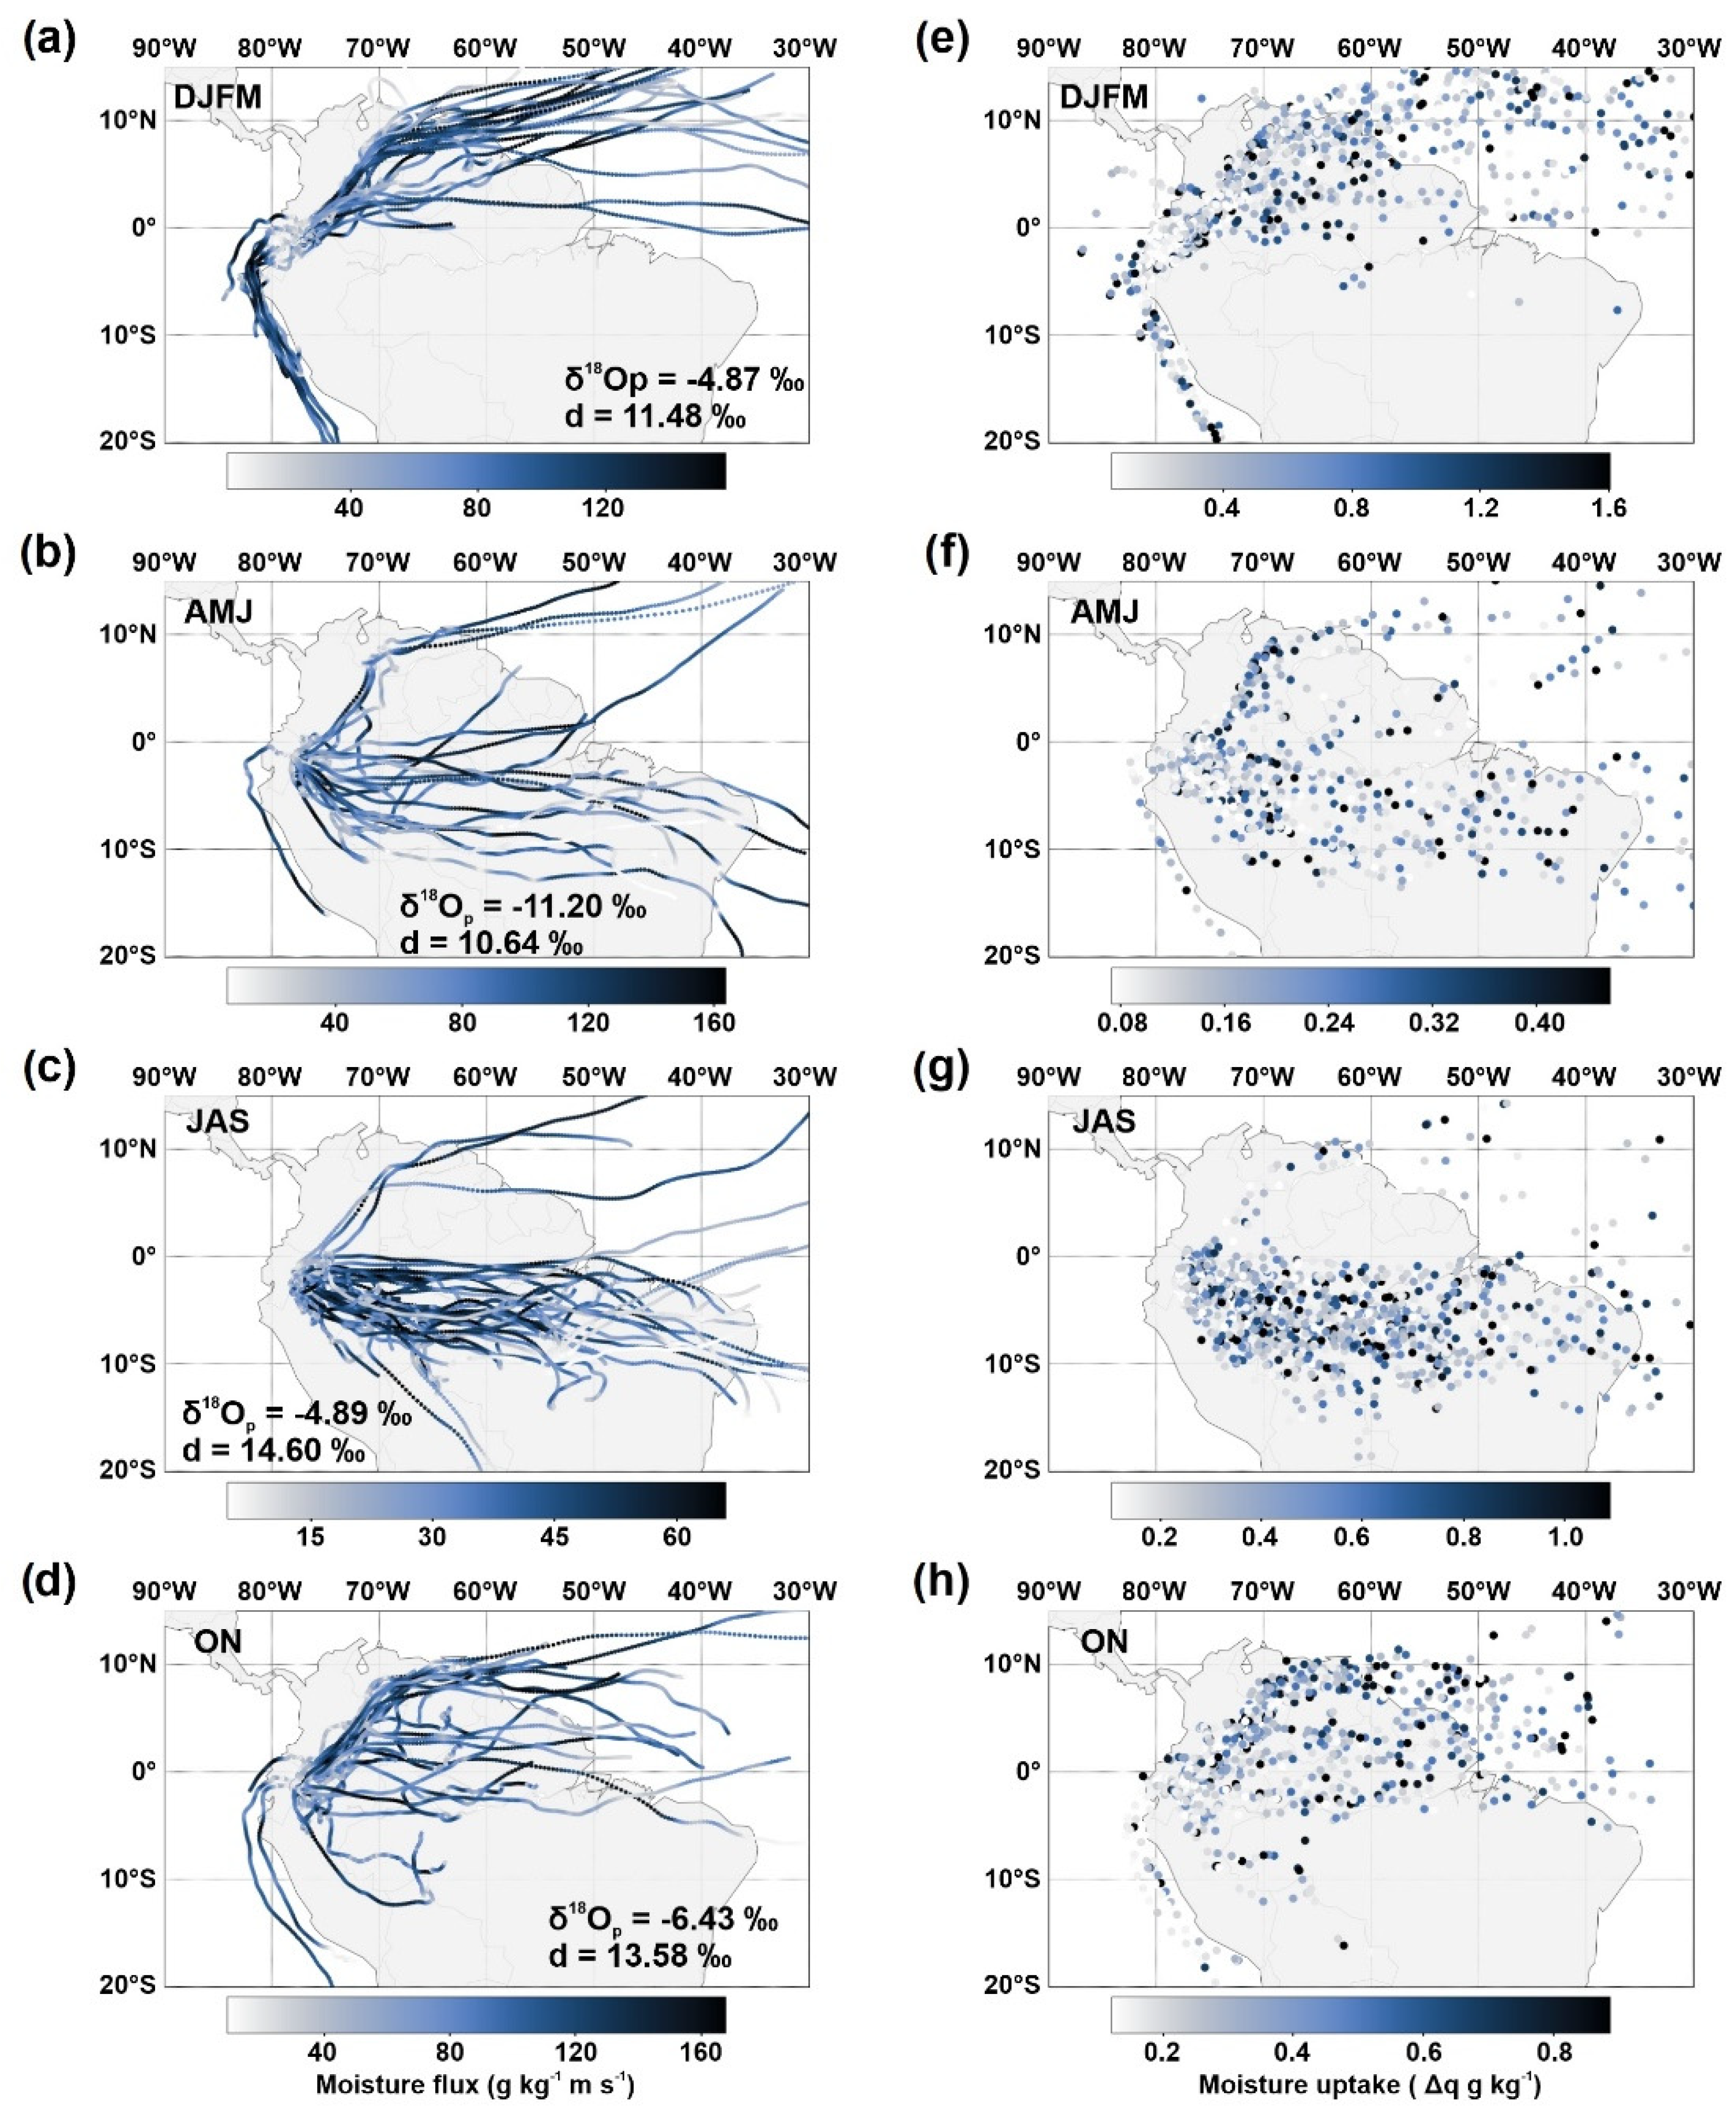
Figure S6 reveals that in austral autumn (MAM), Atlantic Northeast and Pacific Southwest trajectories are less prevalent, while easterly continental paths crossing over the Amazon basin become more distinct. In particular, trajectories at 3000 to 4000 m (~700 to 600 hPa) seem to move close and parallel to the geographical equator. Similarly, the moisture flux and uptake graphs (Figure 4b,f) show a combined continental signal coming from the northeastern and eastern parts of the continent resulting in the most depleted δ18Op values (−11.20‰) during the year. This equatorial Amazon flow could be attributed to the equatorial mid-tropospheric easterly jet (EMTEJ). The EMTEJ is an easterly jet at 700–600 hPa centered on the equator with a maximum wind speed of 10 m s−1 from March to August that travels from the Atlantic Ocean to the Andes and is weakened during ENSO years (Figure S8) [54,70]. The EMTEJ has been reported by Hastenrath [71] along the eastern equatorial Pacific using upper-wind radiosoundings measurements over Galapagos (1967–1971). Similarly, Poveda et al. [54,70] have described the EMTEJ over the continent. Indeed, the trajectories during austral winter (JJA) are characterized by easterly paths crossing the Amazon basin from east to west, where northeasterly paths have minimal influence (Figure S6). The EMTEJ dynamics are stronger, and most of the uptake moisture at the Mera site has an eastern and southeastern provenance (Figure 4c,g). It is noteworthy to mention that this season has the highest yearly δ18Op values (−4.89‰). In general, the OLLJ and EMTEJ are the primary LLJs involved in transporting moisture converging at the V-Index region (Figure 1) with direct influence over the Ecuadorian territory. Finally, in a similar configuration to autumn but in the reverse, the bulk trajectories for spring (SON) depict a steady decline in the number of eastern trajectories and a gradual increase in the ones with a northeastern signature (Figure S6). The moisture flux is shared by the two source regions, although most of the moisture uptake is northeasterly biased (Figure 4d,h). Analogous to AMJ, the δ18Op values (−6.43‰) are also lower.
Recent studies have shown that d-excess across terrestrial environments is related to moisture recycling and sub-cloud moisture re-evaporation, whereas the classical interpretation of changes in evaporation in the oceanic source suits coastal and marine sites [72,73]. In South America, it has been observed that land surface evapotranspiration is a good indicator of the atmospheric moisture source [7,30,72,73]. Higher d-excess values indicate significant recycling of moisture [6]. For the Mera site, the highest d-excess values (14.60‰) occur during austral winter (JAS) (Figure 4). Here, the moisture flux trajectories cross the Amazon basin from east to west, receiving a clear tree transpiration input from the central-southern Amazon that rises the d-excess values [74].
On the contrary, the low d-excess values are observed during austral summer (DJFM, 11.48‰) and autumn (AMJ, 10.64‰). The d-excess values are lower because the moisture uptake chiefly comes from seasonally depleted areas in tree-transpired rainfall (see Figure S4 in Staal et al. [74]). In fact, the observed low transpiration flux from trees in the northwestern Amazon is explained by the high moisture interception by the forest canopy and the lack of a pronounced dry season [74]. For instance, MAM trajectories (Figure S6) mainly arrive from the Tropical North Atlantic and the central Amazon subregion, the zones with the lowest mean monthly transpiration during this season in [74], offering a minimal contribution to the rise of d-excess.
Comparison of the Mera HYSPLIT back trajectories with the trajectory paths [6,48,68,69,75,76,77,78], wind directions [16], and cloud frequency [62] of other studies at the eastern Ecuadorian Amazon and Andes attained similar results depicting preferential pathways of moisture flow (Figure S4). Thus, the distinct seasonal trajectories (Figure 4 and Figure S6) are associated with the cross-equatorial flow dynamics showing a southerly and northerly winds regime [24]. A northerly wind regime is prevalent from the end of austral spring (Nov) until the end of summer (Mar). In contrast, a southerly regime dominates during winter (JAS) (Figure 1a,c). Nevertheless, during austral autumn (AMJ) and spring (ON), both southerly and northerly winds are observed, implying that these are transition seasons influenced by the ITCZ positioning [24] (Figure 1b,d).
3.1.4. Mera δ18Op and V-Index Region Precipitation
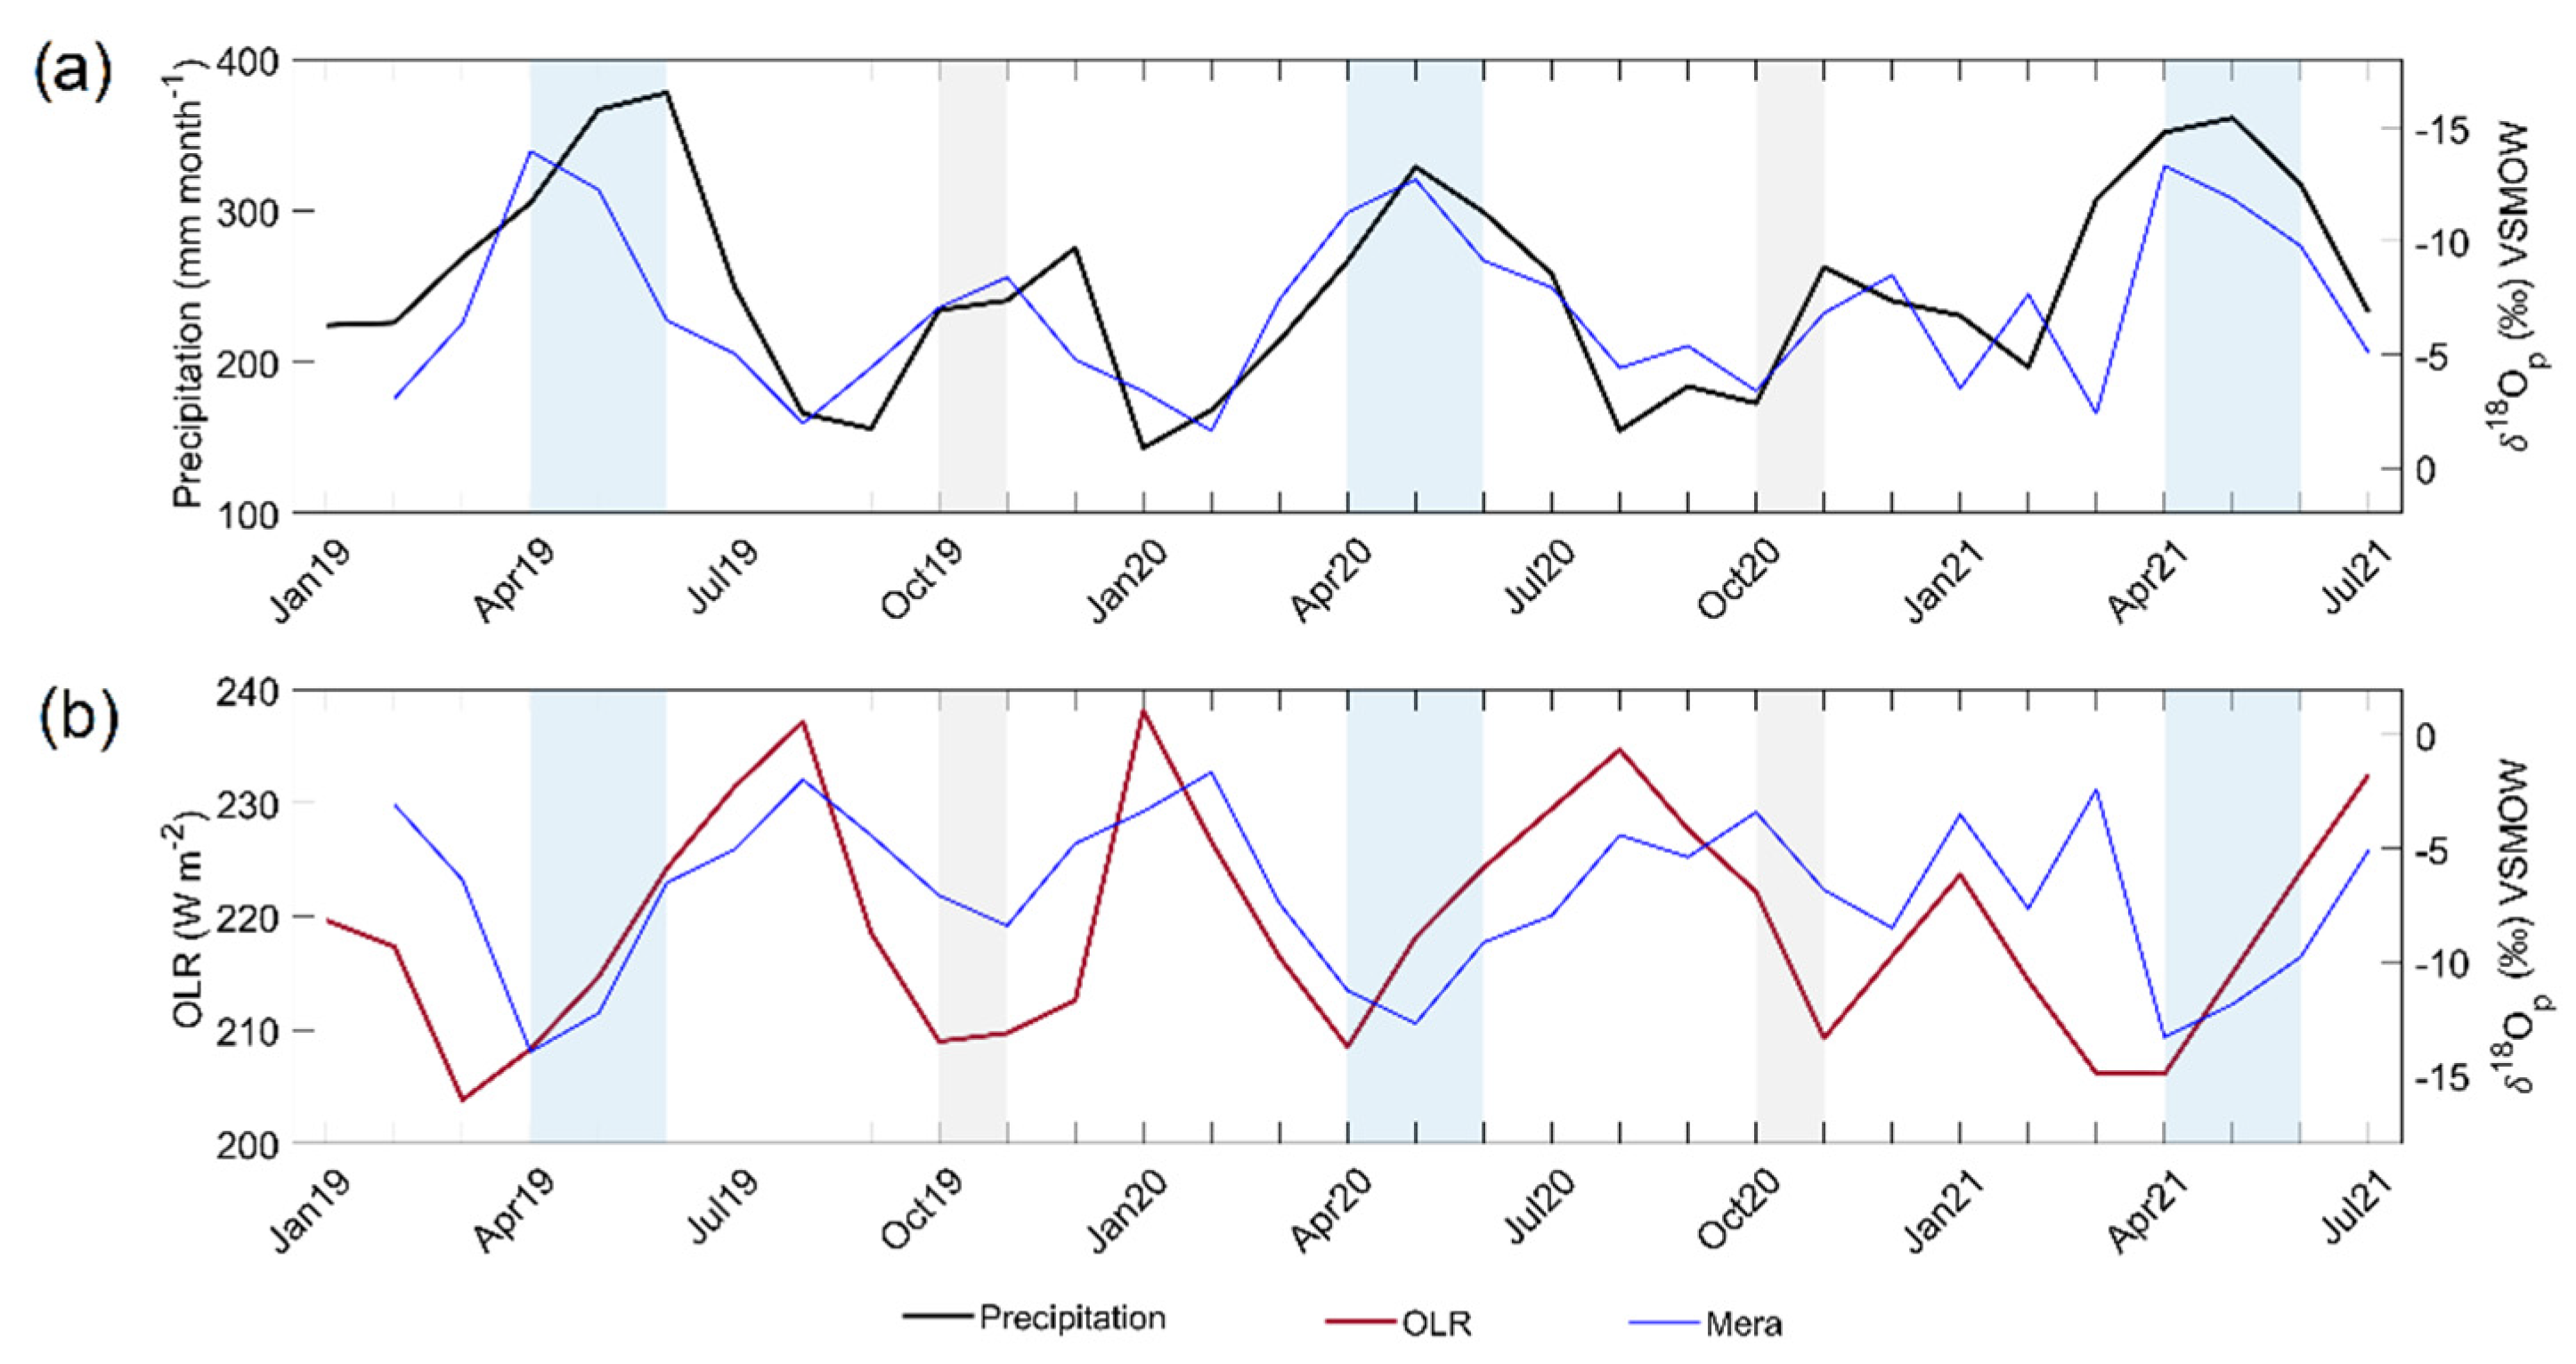
Pearson correlation coefficient between the monitored monthly δ18Op at the Mera site with precipitation in the V-Index region from February 2019 to July 2021 showed higher correlations with all the gridded products. A closer inspection of Table 1 indicates that the highest correlation was obtained with the CRU rainfall (r = −0.71; n = 20), whereas the lowest was achieved utilizing the CHIRPS dataset (r = −0.63; n = 28). However, both products presented incomplete data for the year 2021. Hence, the ERA5 total precipitation product was selected for further evaluation (r = −0.69; n = 30) along with the OLR dataset (Figure 5).
Remarkably, the Mera δ18Op time-series follows the general pattern of regional precipitation at the V-Index region. Figure 5a reveals the marked decrease of δ18Op during austral autumn and spring (AMJ and ON), coinciding with the bimodal zenithal rain peak in the region (low OLR values in Figure 5b). On the contrary, higher δ18Op values are visualized during the less-wetter periods in summer and winter (DJFM and JAS). A similar case was found with the OLR values for the same period (r = 0.47; Table 1). Although the synchrony is lower than the ERA5 precipitation (due to the coarser resolution), the general trend is preserved (Figure 5b). The OLR values decline during AMJ and ON (<220 W m−2), indicating deep convective activity during these months over the equator, after the equinoxes, known as zenithal rain [31,64].
3.2. Andean and Amazon Isotopic Patterns
3.2.1. Local Altitude Effect
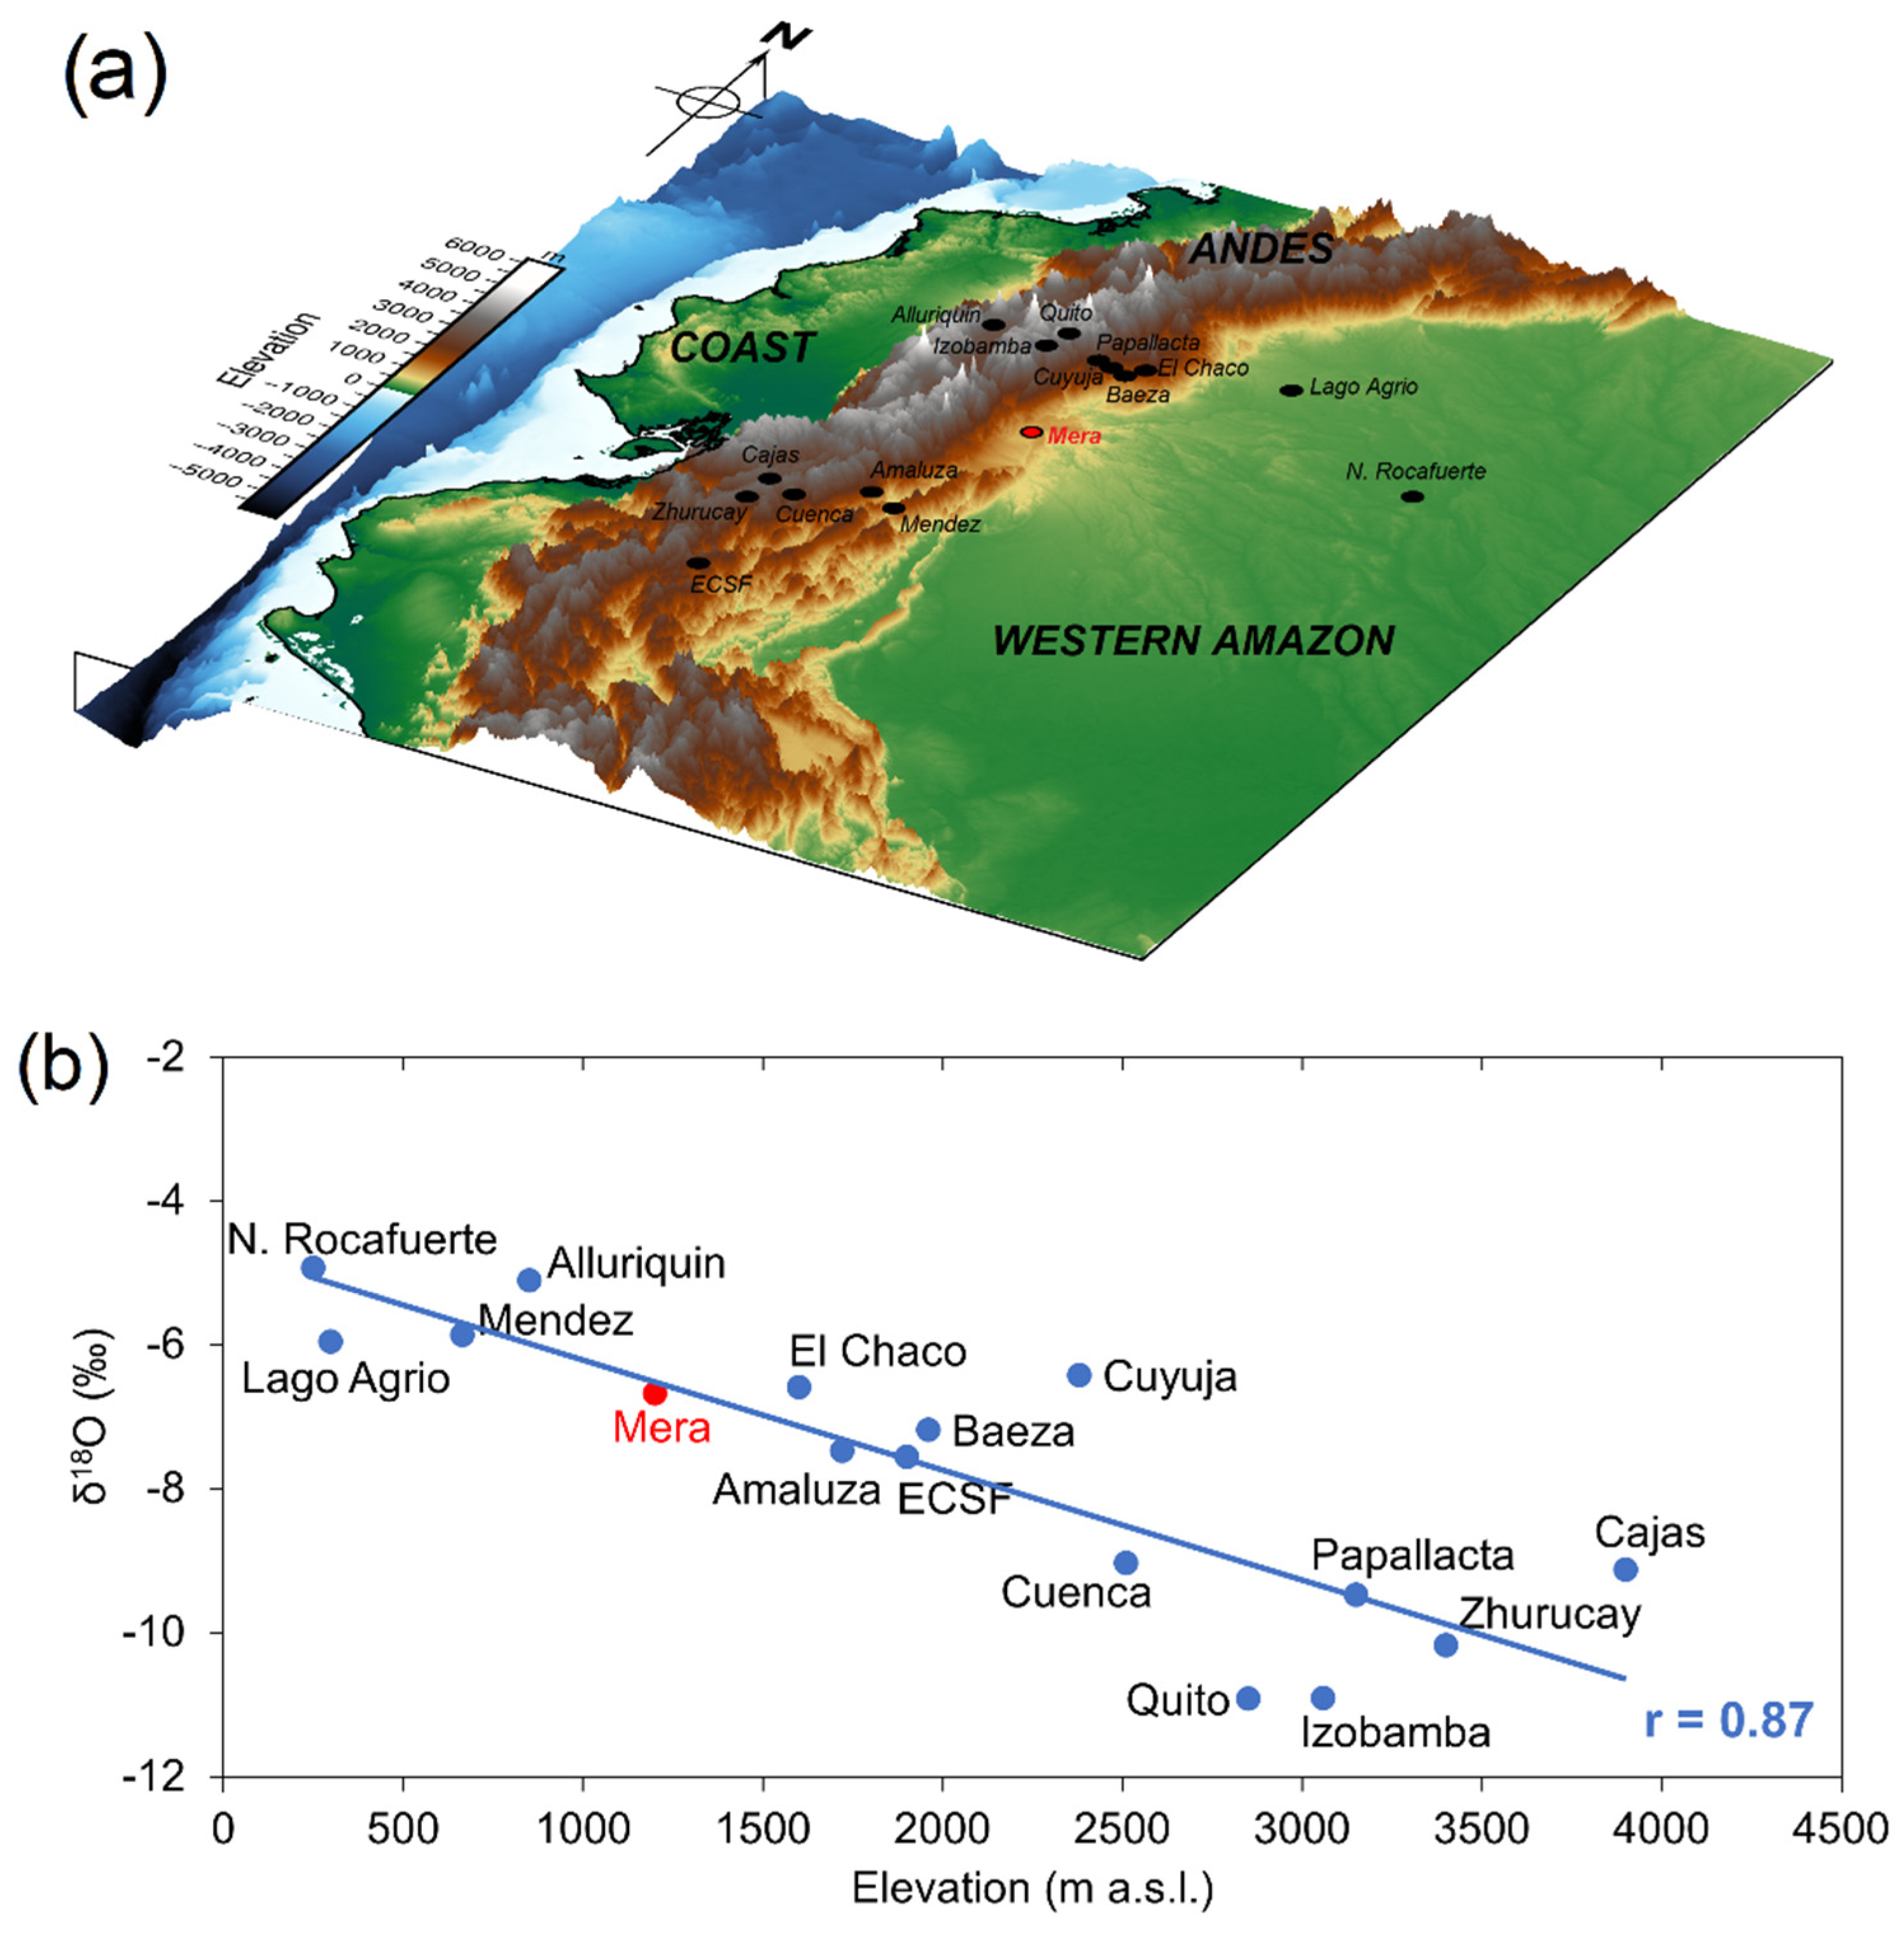
Previous studies have indicated that a combination of local and regional factors might drive the δ18Op signal in Ecuador [8,31]. For better comprehension, cluster analysis of back trajectories for all the stations in Figure 2 during 2019 is presented in Figure S4. The plots showed that there is a typical pattern, with clusters during austral summer (DJF) and winter (JJA) bringing moisture to the sites from Tropical North Atlantic (crossing the Orinoco plains) and the Amazon basin. On the contrary, the mixing of air masses with a northerly and southerly origin is observed during austral autumn (MAM) and spring (SON), in accord with the discussion in Section 3.1.3. Among the different seasons, clusters with a regional provenance (upstream) rather than local prevail. The latter has a limited spatial extension and, therefore, can be assumed to represent in situ meteorological and topographical factors complementing the modulation of the isotope hydrology in the area. These factors include temperature, pressure, relative humidity, and precipitation types [1,6,8,79]. Due to the complex Andes orographical features, the temperature decrease with altitude is the dominant factor controlling further changes in the δ18Op values. Hence, the mean annual δ18Op against the altitudinal gradient was calculated (Figure 6b), indicating a decrease in the δ18Op values with elevation among the stations. The altitudinal gradient change is −0.15‰ δ18Op per 100-m rise, pointing out the critical role of the Andes cordillera and its local isotopic imprint.
The annually averaged −0.15‰ per 100 m is in good agreement with the previously −0.17‰ shown in two latitudinal transects in Ecuador (Garcia et al., 1998) and the −0.22‰ per 100 m in a southern tropical montane forest during September to December 2010 [9]. Consequently, topographic relief plays a vital role in the spatial variability of δ18Op, especially among montane sites [80].
It is worth noting that the Alluriquin station presents a similar annual δ18Op and groups together with the Amazonian stations N. Rocafuerte, Lago Agrio, and Mendez. Despite its further western location in the Andes, it is enriched in 18O. This can be explained in part due to its close distance to the moisture source in the Pacific Ocean, where the seasonal Pacific contribution to the total clusters is 47% in DJF, 25% in MAM, and 24% in SON (Figure S4), counteracting the altitude effect and the Rayleigh fractionation.
3.2.2. Regional Amount Effect at the V-Index Region
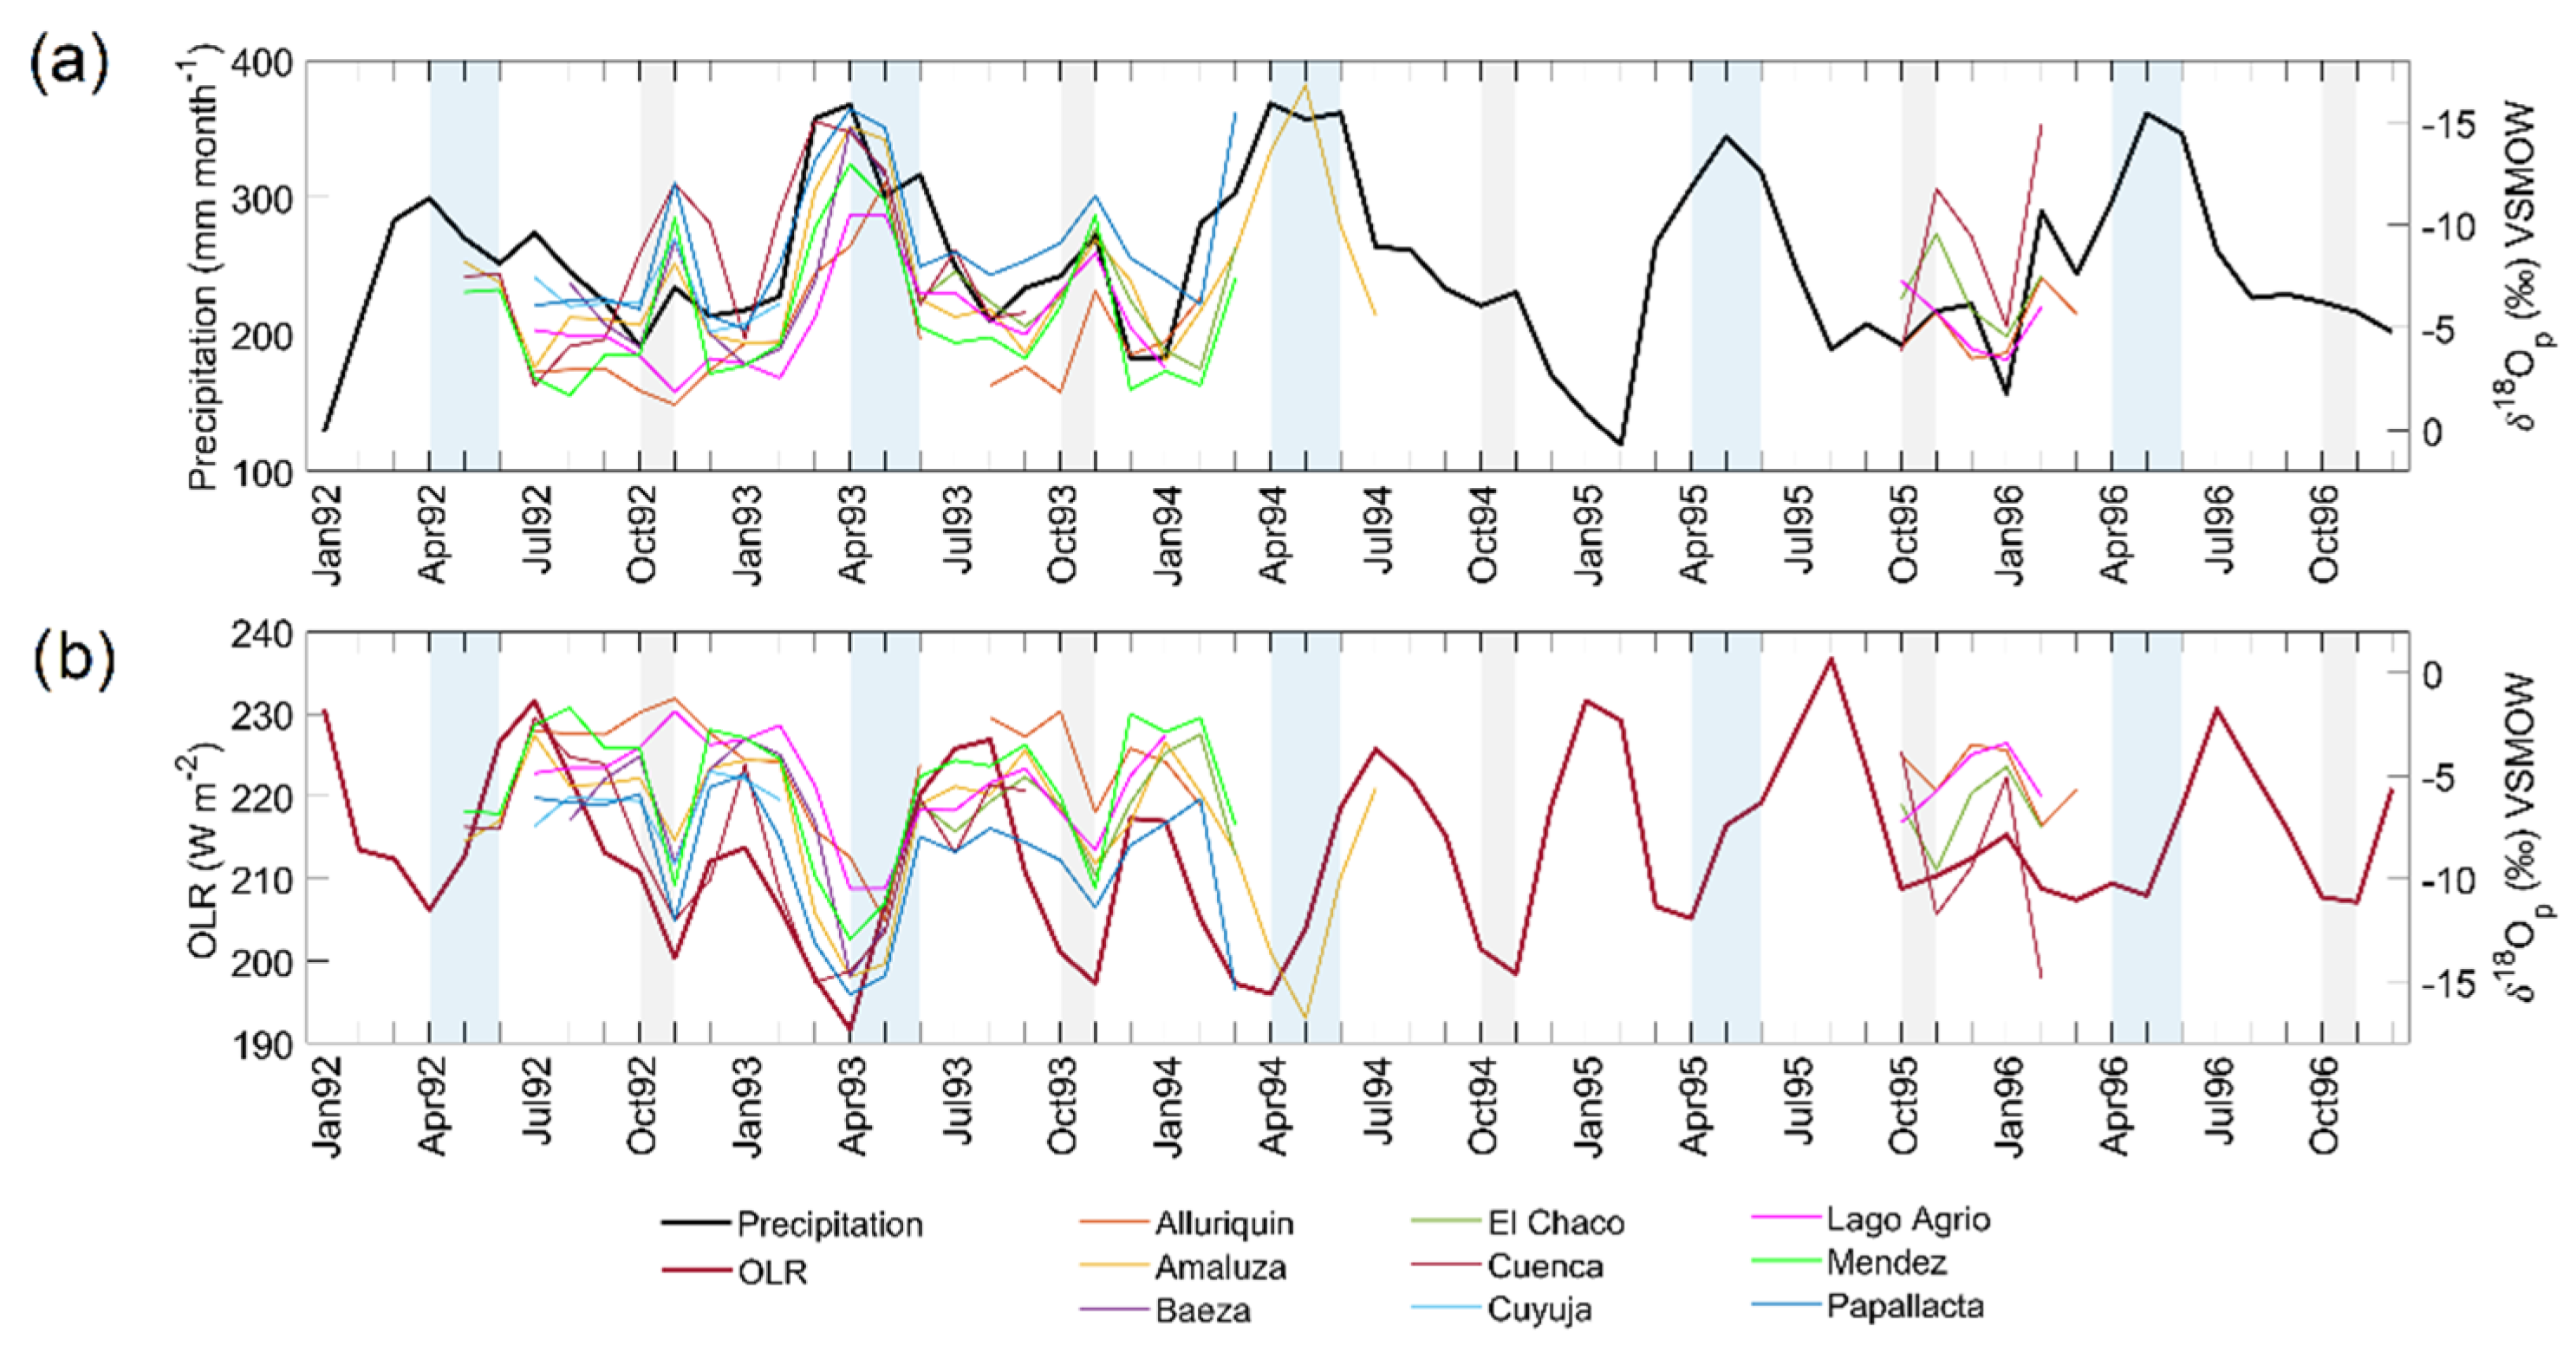
Given that the Mera δ18Op values closely follow the rainfall at the V-Index region, we extend our analysis to evaluate the δ18Op variability in stations distributed along the highlands, eastern slope, and Amazon lowlands (Figure 2). As shown in Table 1, the results indicate that on average, the V-ERA5 precipitation gives a significant r = −0.61 and r = −0.70 correlation for the 1992–1996 and 1998–2015 periods with the δ18Op, respectively. On the contrary, using only the local precipitation amount reveals an r = −0.26 and r = −0.49.
Figure 7 clearly shows that the δ18Op values reflect the seasonal changes in precipitation and convection at the V-Index region, supporting the idea that in the tropics, the isotopic signature in precipitation not only consists in the local processes but in particular of the integrated history along the parcel trajectory [31,34,81,82]. It is important to note that although the Bogota station is located ~700 km further from the Quito station (Figure 2), it is still within the V-index region, although close to the western edge. Its δ18Op seasonality also follows the regional precipitation at the V-index regime, but it presents the lowest correlation of all the Andean stations (r = −0.50). A possible explanation for this might be the additional LLJs that bring moisture to Northern South America, particularly the Caribbean and Choco Jet, which impinge a different isotopic imprint from the Caribbean Sea and Tropical South Pacific [53,54,83].
The close resemblance of the δ18Op with the rainfall at the western V-Index regime may be explained due to the V-Index location, entirely on the path of moisture-laden trade winds receiving the flow from their confluence and capturing the interhemispheric hydrology [37]. This framework adequately explains the typical δ18Op seasonality in Ecuadorian Amazon and Andes, pointing to a common regional controller imprinting the observed “w-shape” pattern (Figure 2). Nonetheless, to explain the total isotopic variability, besides this regional controller, local factors should also be incorporated such as temperature, pressure, relative humidity, and convective and stratiform proportions [8,31,79]. In our case, the change in temperature with altitude (lapse rate) was considered the most relevant local factor, enhancing the δ18Op throughs during the wettest seasons (AMJ, ON), hence being more prominent in the Andean stations (See Figure 2). Nevertheless, current research on cloud dynamics at tropical and midlatitudes has shown that precipitation sampled on Earth’s surface consists of varying proportions of high-intensity convective and lower-intensity stratiform rain types [79]. These differences in rain formation impart characteristic isotope signatures, and changes in their proportions may primarily be responsible for the observed stable isotopic variability in precipitation, providing an alternative approach for the δ2Hp, δ18Op interpretation [79,84]. Hence, future work should estimate these proportions locally, which might offer an expanded overview of the isotopic variability in Ecuador, complementing the altitude and our proposed amount effect at the V-Index region. Similarly, for the 1992–1996 and 1998–2015 periods, significant but lower correlations between the OLR and δ18Op were found (r = 0.51 and r = 0.53), suggesting the convective character of the V-Index region [65].
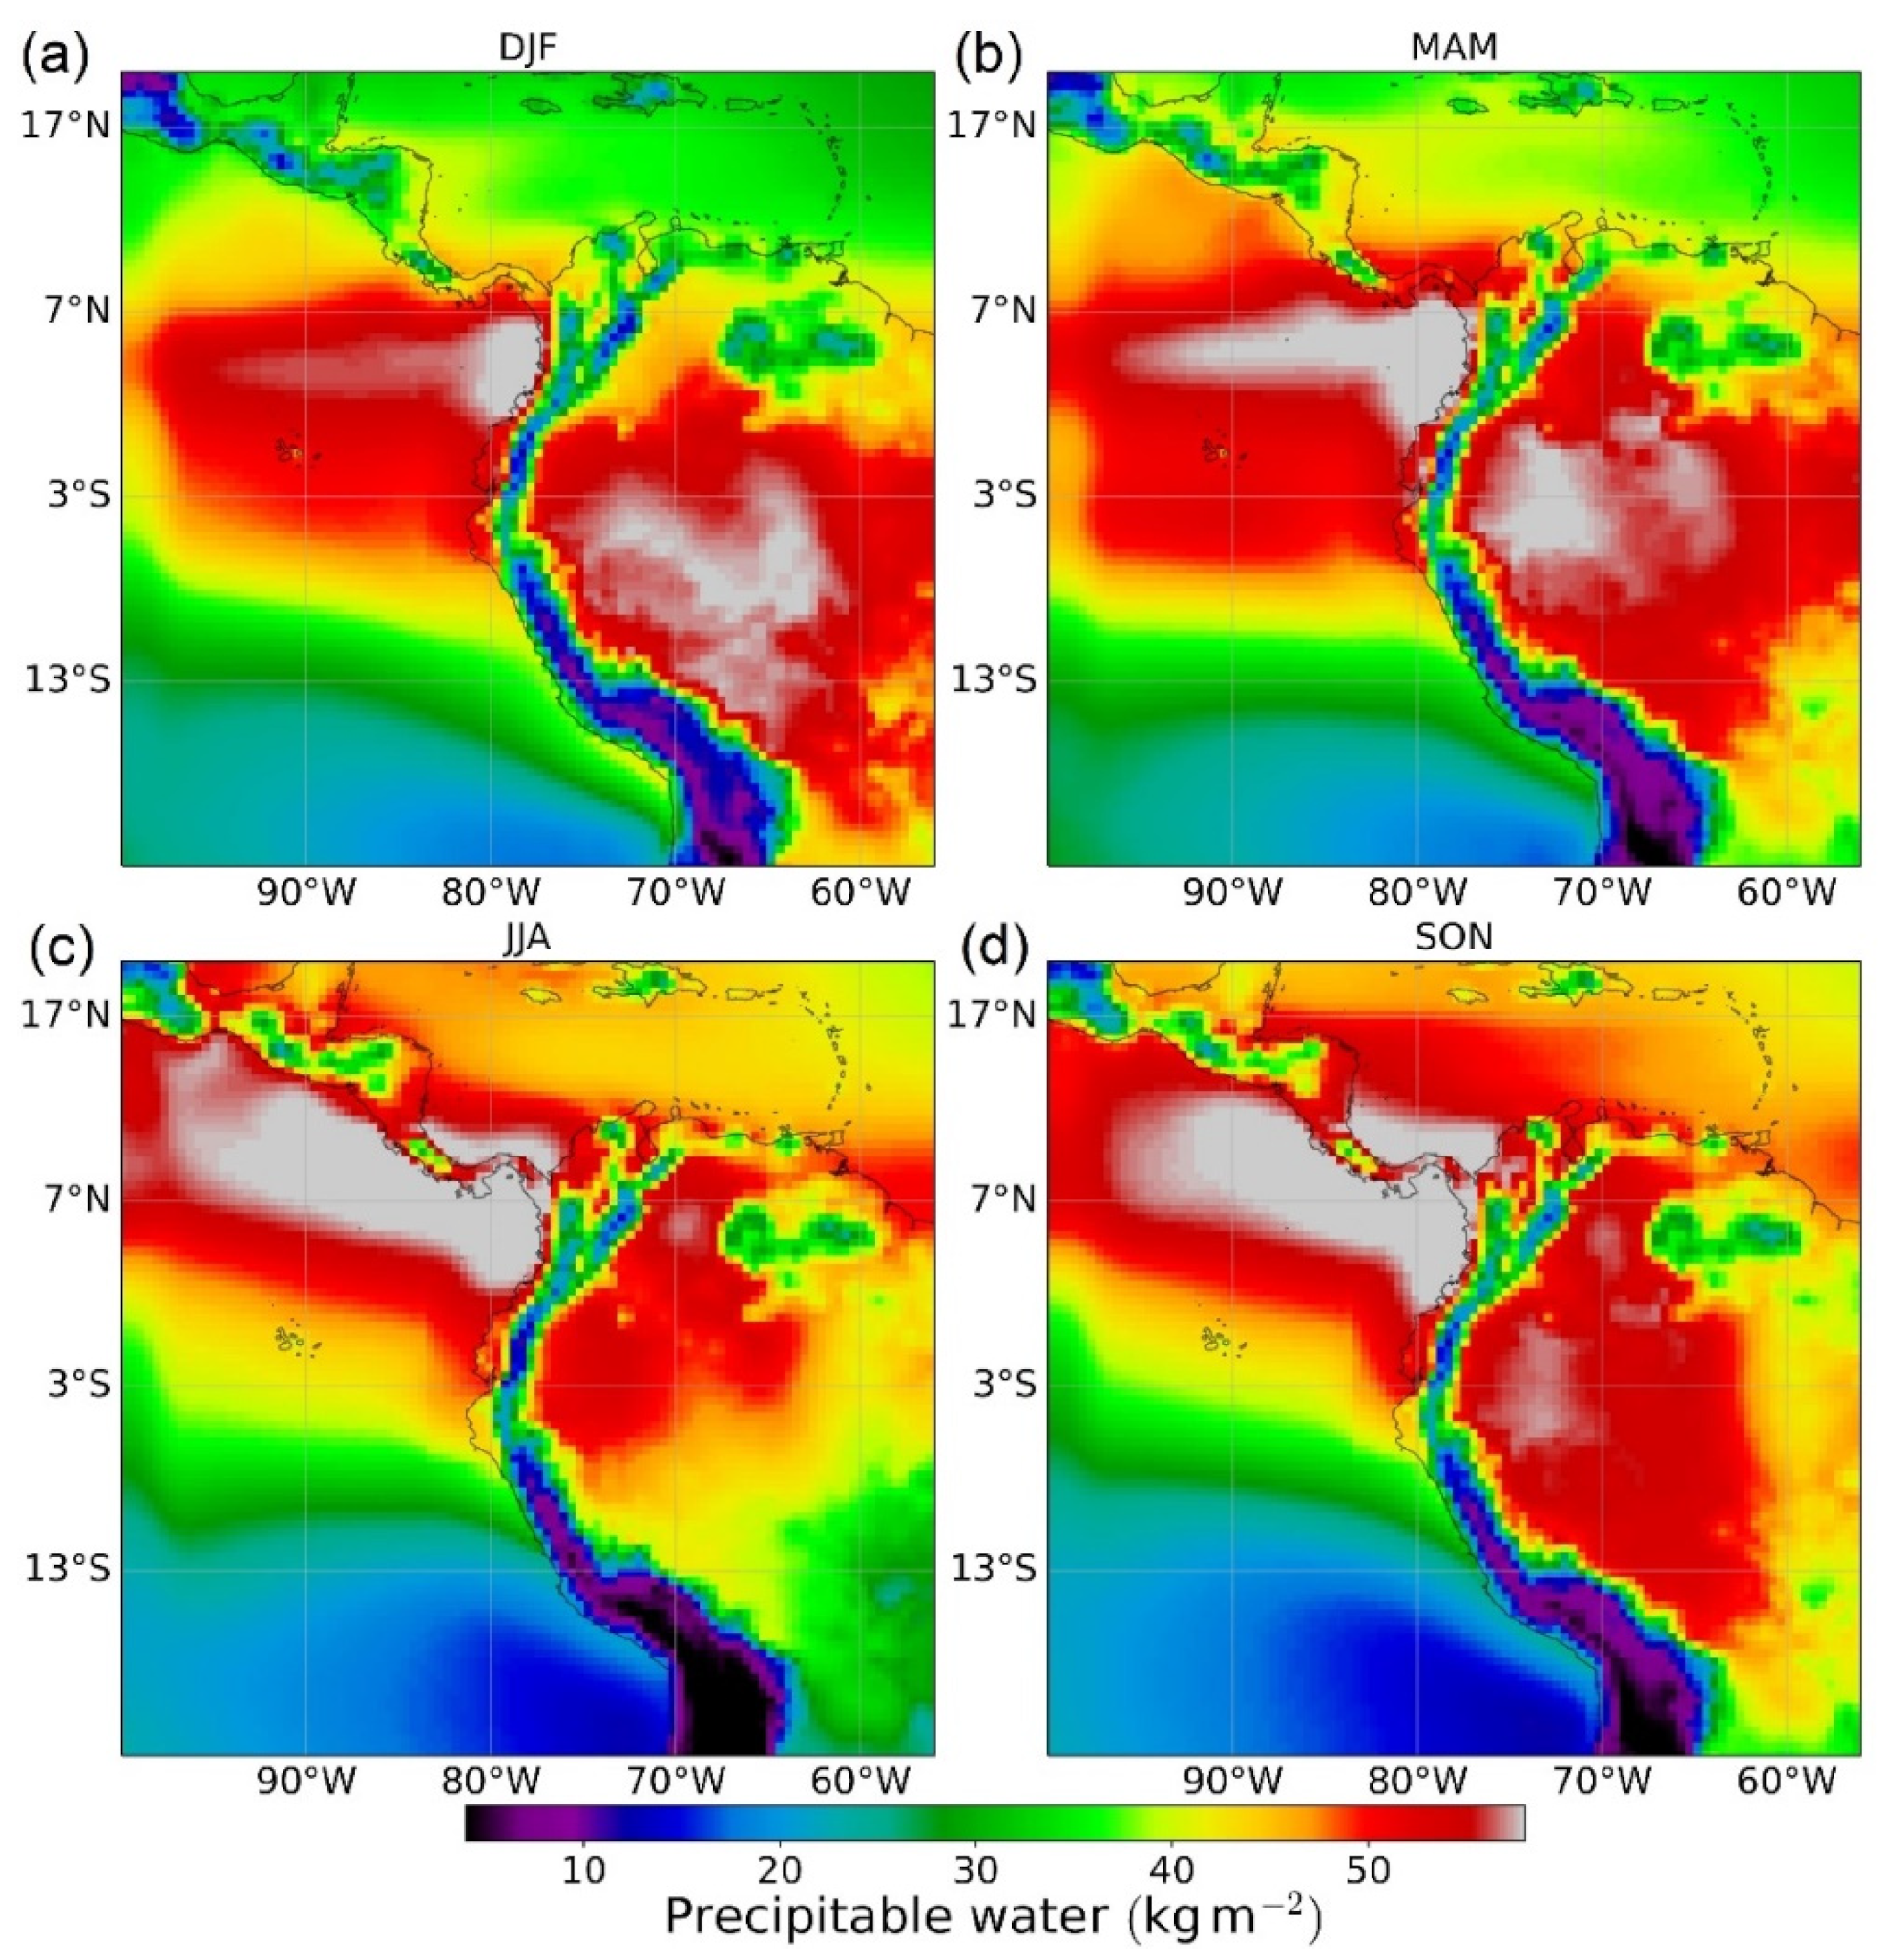
What makes the V-Index region particularly special could be answered by looking at the Aerial lake concept over the Amazon, a new framework for considering large-scale moisture transport proposed by Arraut et al. [37] (See their Figure 3). Aerial lakes are sections of moisture pathways in which the flow slows down and broadens, due to diffluence, presenting a high amount of precipitable water [37]. This latter is clearly observable in Figure 8, where higher values of precipitable water are observed year-round, except during austral winter (JJA), where the maximum value reaches ~50 kg m−2. This aerial lake of moisture is most profound in the west (V-Index region). It plays a vital role as a reservoir distributing moisture toward Central America in the dry season (JJA) and towards the South American subtropics in the wet (DJF), following the cross-equatorial southerly and northerly flows previously discussed.
Regarding its application in paleoclimatology, Vargas et al. [13] recently constructed a tree-ring δ18O record (1864–2018) using a tropical cedar tree (C. nebulosa) located in Mera, Ecuador. The authors found a correlation (r = −0.50; p < 0.01) between the δ18O tree-ring record and precipitation overlapping the V-Index region (See their Figure 5). It can thus be suggested that the stable isotopic signal in this area is robust. In fact, despite the limited number of replicates (n = 4), the constructed record was in phase with the regional precipitation values at the decadal scale, independently supporting our hypothesis of a regional controller.
Various studies have assessed the efficacy of the OLR for identifying areas of strong convection in South America, which showed to be strongly correlated with δ18Op [31,81]. However, although successfully applied, this methodology seems inadequate for Ecuador due to the short δ18Op available records (Table 1), low sampling frequency (e.g., monthly), and the coarse resolution of the OLR products. This method brings spatially extended correlations, especially over the Atlantic ocean, where surface heating becomes insignificant [64] (Figure S9). On the other hand, the analysis is spatially constrained by using the V-Index region, avoiding potential spurious correlations.
In conclusion, our new proposed framework improves our current understanding of δ18O and δ2H in precipitation in the Ecuadorian territory and offers a new alternative for calibrating archives at these latitudes.
4. Conclusions
The precipitation at the equator shows a bimodal pattern due to the semiannual convection responding to the surface heating impinged by the seasonal migration of the sun [64]. Several weeks after the vernal and autumnal equinoxes (~March 20; ~September 22), higher convection is developed, whereas it is inhibited after boreal winter and summer solstices (DJF and JJA) [64]. These higher equatorial convective activities determine wetter months while their suppression defines less-wetter seasons calling this zenithal precipitation.
We revisited the concept of cross-equatorial flow over northwestern Amazon at the V-Index region (5° S–5° N, 65°–75° W) [24]. At this latitude, the cross-equatorial flow (a LLJ) effectively responds to the equinox and solstice monsoon transitions through the low-level wind reversals (925 hPa) during austral autumn (MAM) and spring (SON) [27] (Figure 1), effectively capturing the zenithal rainfall seasonality.
Zenithal precipitation is characteristic of the Ecuadorian Andes and Amazon and is usually masked due to the complex Andes orography restricting a thorough evaluation of the water stable isotopes in precipitation (δ2Hp, δ18Op), in particular the amount effect. We show that the rainfall amount averaged over the V-Index region better explains the δ18Op variability at the Mera monitoring site in Central Ecuador (February 2019 to July 2021, n = 30) than the local amount. The correlation between δ18Op and ERA5 precipitation at the V-Index region gave an r = −0.69 (p < 0.05). In contrast, lower correlations were obtained with the local amount of precipitation (r = −0.46; p < 0.05), in agreement with previous studies [6,31,32]. Expanding the analysis to the stations at the Ecuadorian highlands and Amazon territory during two periods, 1992–1996 and 1998–2015, gave on average, an r = −0.66 (p < 0.05), in contrast to the r = −0.37 (p < 0.05) with the local amount.
Previous studies have indicated that the altitude effect is an important controller of the δ18Op variability in Ecuador [7,32]. This study confirms that the decrease in temperature with elevation is the chiefly local effect producing a −0.15‰ per 100 m in the δ18Op and is more prominent for stations in the inter-Andean valleys. Together, the local altitude and the regional amount at the V-index domain are the principal effects of imprinting the isotopic signal. On the other hand, upstream convection (detected by Outgoing Longwave Radiation, OLR), previously described as a suitable method for finding convective areas highly correlated with locally monitored δ18Op [31], is not suitable for an extended evaluation within the territory. The short-term available isotopic record in the country and the coarse resolution of the OLR products make the correlation between OLR and δ18Op spatially extensive (Figure S9). Conversely, our evaluation at the V-Index region spatially constrains the zenithal rainfall dynamics. Back trajectories paths indicate that the Orinoco and equatorial mid-tropospheric easterly jets (OLLJ and EMTEJ, respectively) are the primary LLJs involved in transporting moisture converging at the V-Index region with direct influence over the Ecuadorian territory.
Previous to this study, it was difficult to make inferences about the δ18Op seasonality over Ecuador. Our contribution provides the most updated evaluation on the topic and offers a suitable explanation (besides ITCZ excursions) regarding the isotopic bimodality, indicated by lower δ18Op values during austral autumn (MAM) and spring (SON). This issue has not been addressed in detail before by previous and recent studies [6,7,8,9,31,32].
Finally, the precipitation amount focused on the V-index provides a novel approach to explain the δ18Op seasonality over Ecuador, giving us a new framework for calibrating paleoclimate archives.
Supplementary Materials
The following supporting information can be downloaded at: www.mdpi.com/article/10.3390/w14132121/s1, Figures S1–S9: Supplementary figures; Figure S1: Topography of Ecuador and the Mera study site; Figure S2: Global Monsoon areas; Figure S3: Seasonal temperature fluctuations in the Mera study site; Figure S4: Cluster analysis on back trajectories for Amazonian and Andean stations; Figure S5: EOF mode patterns of the OLR in tropical South America; Figure S6: Bulk back trajectories for the Mera site (2014–2019); Figure S7: Monthly wind vectors (950–850 hPa) and precipitation in Northern South America; Figure S8: Monthly wind vectors (700–600 hPa) and precipitation in Northern South America; Figure S9: Spatial correlation between δ18Op and OLR at the inter-Andean valley and Amazon stations. Table S1: Monitoring precipitation isotopic values. Refs. [85,86,87,88,89,90] are cited in Supplementary Materials.
Author Contributions
Conceptualization, D.V. and E.L.; methodology, D.V., E.L., M.T. and L.P.; software, D.V., O.C. and E.L.; validation, D.V.; formal analysis, D.V.; investigation, D.V., E.L. and M.T.; resources, L.P.; data curation, D.V., O.C. and E.L.; writing—original draft preparation, D.V.; writing—review and editing, D.V., O.C., E.L., M.T. and L.P.; visualization, D.V. and O.C.; supervision, E.L., M.T. and L.P.; project administration, L.P.; funding acquisition, L.P. All authors have read and agreed to the published version of the manuscript.
Funding
The research was supported by the European Union and the State of Hungary, co-financed by the European Regional Development Fund in the project of GINOP-2.3.2-15-2016-00009 ‘ICER’. D.V. was supported by a Ph.D. scholarship from the Stipendium Hungaricum program SHE-00784-003/2017. E.L. work was additionally financed by the János Bolyai Research Scholarship of the Hungarian Academy of Sciences BO/00281/21/10.
Institutional Review Board Statement
Not applicable.
Informed Consent Statement
Not applicable.
Data Availability Statement
Not applicable.
Acknowledgments
We are grateful to Annabel Wolf for providing the Python code to calculate the moisture uptake trajectories. We thank Lisseth Carlosama, Madison Herrera, Sheila Serrano (Universidad Politécnica Salesiana-Quito) and Franklin Villa for their assistance during the monitoring campaign. The authors gratefully acknowledge the NOAA Air Resources Laboratory (ARL) for the provision of the HYSPLIT transport and dispersion model used in this publication.
Conflicts of Interest
The authors declare no conflict of interest.
References
- Clark, I. Groundwater Geochemistry and Isotopes; CRC Press: Boca Raton, FL, USA, 2015; ISBN 1466591749. [Google Scholar]
- Araguás-Araguás, L.; Froehlich, K.; Rozanski, K. Deuterium and oxygen-18 isotope composition of precipitation and atmospheric moisture. Hydrol. Process. 2000, 14, 1341–1355. [Google Scholar] [CrossRef]
- Dansgaard, W. Stable isotopes in precipitation. Tellus 1964, 16, 436–468. [Google Scholar] [CrossRef]
- Kurita, N.; Ichiyanagi, K.; Matsumoto, J.; Yamanaka, M.D.; Ohata, T. The relationship between the isotopic content of precipitation and the precipitation amount in tropical regions. J. Geochem. Explor. 2009, 102, 113–122. [Google Scholar] [CrossRef]
- Rozanski, K.; Araguás-Araguás, L. Spatial and temporal variability of stable isotope composition of precipitation over the South American continent. Bull. L’institut Français D’études Andin. 1995, 24, 379–390. [Google Scholar]
- Jiménez, A.; Ampuero, A.; Valencia, B.G.; Mayta, V.C.; Cruz, F.W.; Vuille, M.; Novello, V.F.; Misailidis Stríkis, N.; Aranda, N.; Conicelli, B. Stable isotope variability of precipitation and cave drip-water at Jumandy cave, western Amazon River basin (Ecuador). J. Hydrol. 2022, 610, 127848. [Google Scholar] [CrossRef]
- Garcia, M.; Villalba, F.; Araguas-Araguas, L.; Rozanski, K. The role of atmospheric circulation patterns in controlling the regional distribution of stable isotope contents in precipitation: Preliminary results from two transects in the Ecuadorian Andes. In Isotope Techniques in the Study of Environmental Change; International Atomic Energy Agency: Vienna, Austria, 1998; ISBN 92-0-100598-9. [Google Scholar]
- Zhiña, D.X.; Mosquera, G.M.; Esquivel-Hernández, G.; Córdova, M.; Sánchez-Murillo, R.; Orellana-Alvear, J.; Crespo, P. Hydrometeorological factors controlling the stable isotopic composition of precipitation in the highlands of south Ecuador. J. Hydrometeorol. 2022, 23, 1059–1074. [Google Scholar] [CrossRef]
- Windhorst, D.; Waltz, T.; Timbe, E.; Frede, H.-G.; Breuer, L. Impact of elevation and weather patterns on the isotopic composition of precipitation in a tropical montane rainforest. Hydrol. Earth Syst. Sci. 2013, 17, 409–419. [Google Scholar] [CrossRef] [Green Version]
- Bradley, R.S. Paleoclimatology; Elsevier: Amsterdam, The Netherlands, 2015; ISBN 9780123869135. [Google Scholar] [CrossRef]
- Guy, H.; Seimon, A.; Perry, L.B.; Konecky, B.L.; Rado, M.; Andrade, M.; Potocki, M.; Mayewski, P.A. Subseasonal Variations of Stable Isotopes in Tropical Andean Precipitation. J. Hydrometeorol. 2019, 20, 915–933. [Google Scholar] [CrossRef] [Green Version]
- Hastenrath, S. Climate Dynamics of the Tropics; Springer: Dordrecht, The Netherlands, 1991; Volume 8, ISBN 978-0-7923-1346-5. [Google Scholar] [CrossRef]
- Vargas, D.; Pucha-Cofrep, D.; Serrano-Vincenti, S.; Burneo, A.; Carlosama, L.; Herrera, M.; Cerna, M.; Molnár, M.; Jull, A.J.T.; Temovski, M.; et al. ITCZ precipitation and cloud cover excursions control Cedrela nebulosa tree-ring oxygen and carbon isotopes in the northwestern Amazon. Glob. Planet. Chang. 2022, 211, 103791. [Google Scholar] [CrossRef]
- Vuille, M.; Burns, S.J.; Taylor, B.L.; Cruz, F.W.; Bird, B.W.; Abbott, M.B.; Kanner, L.C.; Cheng, H.; Novello, V.F. A review of the South American monsoon history as recorded in stable isotopic proxies over the past two millennia. Clim. Past 2012, 8, 1309–1321. [Google Scholar] [CrossRef] [Green Version]
- Ilbay-Yupa, M.; Lavado-Casimiro, W.; Rau, P.; Zubieta, R.; Castillón, F. Updating regionalization of precipitation in Ecuador. Theor. Appl. Climatol. 2021, 143, 1513–1528. [Google Scholar] [CrossRef]
- Bendix, J.; Lauer, W. Die Niederschlagsjahreszeiten in Ecuador und ihre klimadynamische Interpretation (Rainy seasons in ecuador and their climate-dynamic interpretation). Erdkunde 1992, 46, 118–134. [Google Scholar] [CrossRef]
- Schneider, T.; Bischoff, T.; Haug, G.H. Migrations and dynamics of the intertropical convergence zone. Nature 2014, 513, 45–53. [Google Scholar] [CrossRef]
- Webster, P.J.; Fasullo, J. Tropical Meteorology and Climate|Monsoon: Dynamical Theory. In Encyclopedia of Atmospheric Sciences; Elsevier: Amsterdam, The Netherlands, 2015; pp. 151–164. [Google Scholar] [CrossRef]
- Campozano, L.; Célleri, R.; Trachte, K.; Bendix, J.; Samaniego, E. Rainfall and Cloud Dynamics in the Andes: A Southern Ecuador Case Study. Adv. Meteorol. 2016, 2016, 3192765. [Google Scholar] [CrossRef] [Green Version]
- Martinez, J.A.; Arias, P.A.; Junquas, C.; Espinoza, J.C.; Condom, T.; Dominguez, F.; Morales, J.S. The Orinoco Low-Level Jet and the Cross-Equatorial Moisture Transport over Tropical South America: Lessons from Seasonal WRF Simulations. J. Geophys. Res. Atmos. 2022, 127, e2021JD035603. [Google Scholar] [CrossRef]
- Murakami, T.; Nakazawa, T. Transition from the Southern to Northern Hemisphere Summer Monsoon. Mon. Weather Rev. 1985, 113, 1470–1486. [Google Scholar] [CrossRef]
- Hu, P.; Chen, W.; Huang, R.; Nath, D. On the weakening relationship between the South China Sea summer monsoon onset and cross-equatorial flow after the late 1990s. Int. J. Climatol. 2018, 38, 3202–3208. [Google Scholar] [CrossRef]
- Sturm, C.; Vimeux, F.; Krinner, G. Intraseasonal variability in South America recorded in stable water isotopes. J. Geophys. Res. 2007, 112, D20118. [Google Scholar] [CrossRef] [Green Version]
- Wang, H.; Fu, R. Cross-Equatorial Flow and Seasonal Cycle of Precipitation over South America. J. Clim. 2002, 15, 1591–1608. [Google Scholar] [CrossRef]
- Builes-Jaramillo, A.; Yepes, J.; Salas, H.D. The Orinoco Low-Level Jet and its association with the hydroclimatology of northern South America. J. Hydrometeorol. 2021, 23, 209–223. [Google Scholar] [CrossRef]
- Gimeno, L.; Dominguez, F.; Nieto, R.; Trigo, R.; Drumond, A.; Reason, C.J.C.; Taschetto, A.S.; Ramos, A.M.; Kumar, R.; Marengo, J. Major Mechanisms of Atmospheric Moisture Transport and Their Role in Extreme Precipitation Events. Annu. Rev. Environ. Resour. 2016, 41, 117–141. [Google Scholar] [CrossRef] [Green Version]
- Fu, R.; Arias, P.A.; Wang, H. The Connection between the North and South American Monsoons BT. In The Monsoons and Climate Change: Observations and Modeling; de Carvalho, L.M.V., Jones, C., Eds.; Springer International Publishing: Cham, Switzerland, 2016; pp. 187–206. ISBN 978-3-319-21650-8. [Google Scholar] [CrossRef]
- Arias, P.A.; Fu, R.; Vera, C.; Rojas, M. A correlated shortening of the North and South American monsoon seasons in the past few decades. Clim. Dyn. 2015, 45, 3183–3203. [Google Scholar] [CrossRef]
- Ruiz-Vásquez, M.; Arias, P.A.; Martínez, J.A.; Espinoza, J.C. Effects of Amazon basin deforestation on regional atmospheric circulation and water vapor transport towards tropical South America. Clim. Dyn. 2020, 54, 4169–4189. [Google Scholar] [CrossRef]
- Salati, E.; Dall’Olio, A.; Matsui, E.; Gat, J.R. Recycling of water in the Amazon basin: An isotopic study. Water Resour. Res. 1979, 15, 1250–1258. [Google Scholar] [CrossRef]
- Villacís, M.; Vimeux, F.; Taupin, J.D. Analysis of the climate controls on the isotopic composition of precipitation (δ18O) at Nuevo Rocafuerte, 74.5° W, 0.9° S, 250 m, Ecuador. Comptes Rendus Geosci. 2008, 340, 1–9. [Google Scholar] [CrossRef]
- Lima, P. Uso de Isotopos Estables para el Estudio de las Fuentes de Agua Superficiales en el Ecuador y sus Implicaciones para la Gestión de los Recursos Hídricos. INGENIO 2019, 2, 38–45. [Google Scholar] [CrossRef]
- Vuille, M.; Bradley, R.S.; Werner, M.; Healy, R.; Keimig, F. Modeling δ18O in precipitation over the tropical Americas: 1. Interannual variability and climatic controls. J. Geophys. Res. Atmos. 2003, 108, 4174. [Google Scholar] [CrossRef] [Green Version]
- Sturm, C.; Hoffmann, G.; Langmann, B. Simulation of the Stable Water Isotopes in Precipitation over South America: Comparing Regional to Global Circulation Models. J. Clim. 2007, 20, 3730–3750. [Google Scholar] [CrossRef] [Green Version]
- Yoshimura, K.; Kanamitsu, M.; Noone, D.; Oki, T. Historical isotope simulation using Reanalysis atmospheric data. J. Geophys. Res. 2008, 113, D19108. [Google Scholar] [CrossRef]
- Garcia, S.R.; Kayano, M.T. Some evidence on the relationship between the South American monsoon and the Atlantic ITCZ. Theor. Appl. Climatol. 2010, 99, 29–38. [Google Scholar] [CrossRef]
- Arraut, J.M.; Nobre, C.; Barbosa, H.M.J.; Obregon, G.; Marengo, J. Aerial Rivers and Lakes: Looking at Large-Scale Moisture Transport and Its Relation to Amazonia and to Subtropical Rainfall in South America. J. Clim. 2012, 25, 543–556. [Google Scholar] [CrossRef]
- IAEA/WMO. Global Network of Isotopes in Precipitation. The GNIP Database. 2020. Available online: https://nucleus.iaea.org/wiser (accessed on 16 March 2022).
- Goller, R.; Wilcke, W.; Leng, M.J.; Tobschall, H.J.; Wagner, K.; Valarezo, C.; Zech, W. Tracing water paths through small catchments under a tropical montane rain forest in south Ecuador by an oxygen isotope approach. J. Hydrol. 2005, 308, 67–80. [Google Scholar] [CrossRef]
- Timbe, E.; Windhorst, D.; Crespo, P.; Frede, H.-G.; Feyen, J.; Breuer, L. Understanding uncertainties when inferring mean transit times of water trough tracer-based lumped-parameter models in Andean tropical montane cloud forest catchments. Hydrol. Earth Syst. Sci. 2014, 18, 1503–1523. [Google Scholar] [CrossRef] [Green Version]
- Mosquera, G.M.; Segura, C.; Vaché, K.B.; Windhorst, D.; Breuer, L.; Crespo, P. Insights into the water mean transit time in a high-elevation tropical ecosystem. Hydrol. Earth Syst. Sci. 2016, 20, 2987–3004. [Google Scholar] [CrossRef] [Green Version]
- Esquivel-Hernández, G.; Mosquera, G.M.; Sánchez-Murillo, R.; Quesada-Román, A.; Birkel, C.; Crespo, P.; Célleri, R.; Windhorst, D.; Breuer, L.; Boll, J. Moisture transport and seasonal variations in the stable isotopic composition of rainfall in Central American and Andean Páramo during El Niño conditions (2015–2016). Hydrol. Process. 2019, 33, 1802–1817. [Google Scholar] [CrossRef]
- Bowen, G.J. The Online Isotopes in Precipitation Calculator, Version 3.1. Available online: https://wateriso.utah.edu/waterisotopes/pages/data_access/oipc.html (accessed on 25 February 2022).
- IAEA/WMO. Precipitation Sampling Guide V2. 2 September 2014. 2014. Available online: http://www-naweb.iaea.org/napc/ih/documents/other/gnip_manual_v2.02_en_hq.pdf (accessed on 22 January 2019).
- Harris, I.; Osborn, T.J.; Jones, P.; Lister, D. Version 4 of the CRU TS monthly high-resolution gridded multivariate climate dataset. Sci. Data 2020, 7, 109. [Google Scholar] [CrossRef] [Green Version]
- NOAA National Centers for Environmental Information. Global Historical Climatology Network (GHCN). Available online: https://www.ncei.noaa.gov/products/land-based-station/global-historical-climatology-network-monthly (accessed on 11 April 2022).
- Stein, A.F.; Draxler, R.R.; Rolph, G.D.; Stunder, B.J.B.; Cohen, M.D.; Ngan, F. NOAA’s HYSPLIT Atmospheric Transport and Dispersion Modeling System. Bull. Am. Meteorol. Soc. 2015, 96, 2059–2077. [Google Scholar] [CrossRef]
- Trachte, K. Atmospheric Moisture Pathways to the Highlands of the Tropical Andes: Analyzing the Effects of Spectral Nudging on Different Driving Fields for Regional Climate Modeling. Atmosphere 2018, 9, 456. [Google Scholar] [CrossRef] [Green Version]
- Warner, M.S.C. Introduction to PySPLIT: A Python Toolkit for NOAA ARL’s HYSPLIT Model. Comput. Sci. Eng. 2018, 20, 47–62. [Google Scholar] [CrossRef]
- Anders, A.M.; Nesbitt, S.W. Altitudinal Precipitation Gradients in the Tropics from Tropical Rainfall Measuring Mission (TRMM) Precipitation Radar. J. Hydrometeorol. 2015, 16, 441–448. [Google Scholar] [CrossRef]
- Sodemann, H.; Schwierz, C.; Wernli, H. Interannual variability of Greenland winter precipitation sources: Lagrangian moisture diagnostic and North Atlantic Oscillation influence. J. Geophys. Res. 2008, 113, D03107. [Google Scholar] [CrossRef] [Green Version]
- Carslaw, D.C.; Ropkins, K. openair—An R package for air quality data analysis. Environ. Model. Softw. 2012, 27–28, 52–61. [Google Scholar] [CrossRef]
- Arias, P.A.; Martínez, J.A.; Vieira, S.C. Moisture sources to the 2010–2012 anomalous wet season in northern South America. Clim. Dyn. 2015, 45, 2861–2884. [Google Scholar] [CrossRef]
- Poveda, G.; Jaramillo, L.; Vallejo, L.F. Seasonal precipitation patterns along pathways of South American low-level jets and aerial rivers. Water Resour. Res. 2014, 50, 98–118. [Google Scholar] [CrossRef]
- Jiménez-Sánchez, G.; Markowski, P.M.; Jewtoukoff, V.; Young, G.S.; Stensrud, D.J. The Orinoco Low-Level Jet: An Investigation of Its Characteristics and Evolution Using the WRF Model. J. Geophys. Res. Atmos. 2019, 124, 10696–10711. [Google Scholar] [CrossRef]
- Liebmann, B.; Smith, C.A. Description of complete (interpolated) outgoing longwave radiation data set. Bull. Am. Meteorol. Soc. 1996, 77, 1275–1277. [Google Scholar]
- Hersbach, H.; Bell, B.; Berrisford, P.; Hirahara, S.; Horányi, A.; Muñoz-Sabater, J.; Nicolas, J.; Peubey, C.; Radu, R.; Schepers, D.; et al. The ERA5 global reanalysis. Q. J. R. Meteorol. Soc. 2020, 146, 1999–2049. [Google Scholar] [CrossRef]
- Funk, C.; Peterson, P.; Landsfeld, M.; Pedreros, D.; Verdin, J.; Shukla, S.; Husak, G.; Rowland, J.; Harrison, L.; Hoell, A.; et al. The climate hazards infrared precipitation with stations—A new environmental record for monitoring extremes. Sci. Data 2015, 2, 150066. [Google Scholar] [CrossRef] [Green Version]
- Segura, H.; Espinoza, J.C.; Junquas, C.; Lebel, T.; Vuille, M.; Garreaud, R. Recent changes in the precipitation-driving processes over the southern tropical Andes/western Amazon. Clim. Dyn. 2020, 54, 2613–2631. [Google Scholar] [CrossRef]
- Chimborazo, O.; Vuille, M. Present-day climate and projected future temperature and precipitation changes in Ecuador. Theor. Appl. Climatol. 2021, 143, 1581–1597. [Google Scholar] [CrossRef]
- EUMetrain Product Tutorial on TPW Content Products. Available online: http://www.eumetrain.org (accessed on 22 June 2022).
- Bendix, J.; Rollenbeck, R.; Göttlicher, D.; Cermak, J. Cloud occurrence and cloud properties in Ecuador. Clim. Res. 2006, 30, 133–147. [Google Scholar] [CrossRef] [Green Version]
- Campozano, L.; Trachte, K.; Célleri, R.; Samaniego, E.; Bendix, J.; Albuja, C.; Mejia, J.F. Climatology and Teleconnections of Mesoscale Convective Systems in an Andean Basin in Southern Ecuador: The Case of the Paute Basin. Adv. Meteorol. 2018, 2018, 4259191. [Google Scholar] [CrossRef] [PubMed]
- Matsumoto, J.; Murakami, T. Annual Changes of Tropical Convective Activities as Revealed from Equatorially Symmetric OLR Data. J. Meteorol. Soc. Jpn. Ser. II 2000, 78, 543–561. [Google Scholar] [CrossRef] [Green Version]
- Hastenrath, S. Annual cycle of upper air circulation and convective activity over the tropical Americas. J. Geophys. Res. Atmos. 1997, 102, 4267–4274. [Google Scholar] [CrossRef]
- Jiménez-Sánchez, G.; Markowski, P.M.; Young, G.S.; Stensrud, D.J. The Orinoco Low-Level Jet: An Investigation of Its Mechanisms of Formation Using the WRF Model. J. Geophys. Res. Atmos. 2020, 125, e2020JD032810. [Google Scholar] [CrossRef]
- Rodríguez-Gómez, C.; Echeverry, G.; Jaramillo, A.; Ladino, L.A. The Negative Impact of Biomass Burning and the Orinoco Low-Level Jet on the Air Quality of the Orinoco River Basin. Atmósfera 2021, 35, 497–520. [Google Scholar] [CrossRef]
- Makowski Giannoni, S.; Trachte, K.; Rollenbeck, R.; Lehnert, L.; Fuchs, J.; Bendix, J. Atmospheric salt deposition in a tropical mountain rainforest at the eastern Andean slopes of south Ecuador—Pacific or Atlantic origin? Atmos. Chem. Phys. 2016, 16, 10241–10261. [Google Scholar] [CrossRef] [Green Version]
- Emck, P. A Climatology of South Ecuador-with Special Focus on the Major Andean Ridge as Atlantic-Pacific Climate Divide. Ph.D. Thesis, Friedrich-Alexander-Universität Erlangen-Nürnberg, Erlangen, Germany, 2007. [Google Scholar]
- Poveda, G.; Mesa, O. La corriente de chorro superficial del Oeste (“del Chocó”) y otras dos corrientes de chorro en Colombia: Climatología y variabilidad durante las fases del ENSO. Rev. Académica Colomb. Cienc. 1999, 23, 517–528. [Google Scholar]
- Hastenrath, S. Equatorial mid-tropospheric easterly jet over the eastern Pacific. J. Meteorol. Soc. Jpn. Ser. II 1999, 77, 701–709. [Google Scholar] [CrossRef] [Green Version]
- Wei, Z.; Lee, X. The utility of near-surface water vapor deuterium excess as an indicator of atmospheric moisture source. J. Hydrol. 2019, 577, 123923. [Google Scholar] [CrossRef]
- Xia, Z.; Winnick, M.J. The competing effects of terrestrial evapotranspiration and raindrop re-evaporation on the deuterium excess of continental precipitation. Earth Planet. Sci. Lett. 2021, 572, 117120. [Google Scholar] [CrossRef]
- Staal, A.; Tuinenburg, O.A.; Bosmans, J.H.C.; Holmgren, M.; van Nes, E.H.; Scheffer, M.; Zemp, D.C.; Dekker, S.C. Forest-rainfall cascades buffer against drought across the Amazon. Nat. Clim. Chang. 2018, 8, 539–543. [Google Scholar] [CrossRef]
- Landshuter, N.; Mölg, T.; Grießinger, J.; Bräuning, A.; Peters, T. 10-year Characteristics of Moisture Source Regions and Their Potential Effect on Seasonal Isotopic Signatures of δ18O in Tropical Trees of Southern Ecuador. Front. Earth Sci. 2020, 8, 604804. [Google Scholar] [CrossRef]
- Fabian, P.; Rollenbeck, R.; Spichtinger, N.; Brothers, L.; Dominguez, G.; Thiemens, M. Sahara dust, ocean spray, volcanoes, biomass burning: Pathways of nutrients into Andean rainforests. Adv. Geosci. 2009, 22, 85–94. [Google Scholar] [CrossRef] [Green Version]
- Fabian, P.; Kohlpaintner, M.; Rollenbeck, R. Biomass burning in the Amazon-fertilizer for the mountaineous rain forest in Ecuador. Environ. Sci. Pollut. Res. 2005, 12, 290–296. [Google Scholar] [CrossRef] [PubMed]
- Baker, J.C.A. Unravelling the Drivers of Short- and Long-Term Variability in the Amazon Hydrological Cycle Using Tree-Ring Oxygen Isotopes. Ph.D. Thesis, University of Leeds, Leeds, UK, 2017. [Google Scholar]
- Aggarwal, P.K.; Romatschke, U.; Araguas-Araguas, L.; Belachew, D.; Longstaffe, F.J.; Berg, P.; Schumacher, C.; Funk, A. Proportions of convective and stratiform precipitation revealed in water isotope ratios. Nat. Geosci. 2016, 9, 624–629. [Google Scholar] [CrossRef] [Green Version]
- Gonfiantini, R.; Roche, M.-A.; Olivry, J.-C.; Fontes, J.-C.; Zuppi, G.M. The altitude effect on the isotopic composition of tropical rains. Chem. Geol. 2001, 181, 147–167. [Google Scholar] [CrossRef]
- Vimeux, F.; Gallaire, R.; Bony, S.; Hoffmann, G.; Chiang, J.C.H. What are the climate controls on δD in precipitation in the Zongo Valley (Bolivia)? Implications for the Illimani ice core interpretation. Earth Planet. Sci. Lett. 2005, 240, 205–220. [Google Scholar] [CrossRef]
- Wolf, A.; Roberts, W.H.G.; Ersek, V.; Johnson, K.R.; Griffiths, M.L. Rainwater isotopes in central Vietnam controlled by two oceanic moisture sources and rainout effects. Sci. Rep. 2020, 10, 16482. [Google Scholar] [CrossRef]
- Sakamoto, M.S.; Ambrizzi, T.; Poveda, G. Moisture Sources and Life Cycle of Convective Systems over Western Colombia. Adv. Meteorol. 2011, 2011, 890759. [Google Scholar] [CrossRef]
- Chang, H.K.; Gonçalves, R.D.; Aggarwal, P.K.; Stradioto, M.R.; Hespanhol, E.C.B.; Sturchio, N.C.; Romatschke, U.; Araguas, L.J.A. Groundwater isotope ratios reflect convective and stratiform (paleo)precipitation fractions in Brazil. J. Hydrol. 2020, 585, 124801. [Google Scholar] [CrossRef]
- Uieda, L.; Tian, D.; Leong, W.J.; Toney, L.; Schlitzer, W.; Grund, M.; Newton, D.; Ziebarth, M.; Jones, M.; Wessel, P. PyGMT: A Python Interface for the Generic Mapping Tools. 2021. Available online: https://www.researchgate.net/project/PyGMT-A-Python-interface-for-the-Generic-Mapping-Tools (accessed on 22 June 2022).
- Wang, B.; Liu, J.; Kim, H.-J.; Webster, P.J.; Yim, S.-Y.; Xiang, B. Northern Hemisphere summer monsoon intensified by mega-El Nino/southern oscillation and Atlantic multidecadal oscillation. Proc. Natl. Acad. Sci. USA 2013, 110, 5347–5352. [Google Scholar] [CrossRef] [PubMed] [Green Version]
- Douville, H.; Raghavan, K.; Renwick, J.; Allan, R.P.; Arias, P.A.; Barlow, M.; Cerezo-Mota, R.; Cherchi, A.; Gan, T.Y.; Gergis, J.; et al. Water Cycle Changes. In Climate Change 2021: The Physical Science Basis. Contribution of Working Group I to the Sixth Assessment Report of the Intergovernmental Panel on Climate Change. 2021. Available online: https://www.unep.org/resources/report/climate-change-2021-physical-science-basis-working-group-i-contribution-sixth (accessed on 22 June 2022).
- Xie, P.; Arkin, P.A. Global Precipitation: A 17-Year Monthly Analysis Based on Gauge Observations, Satellite Estimates, and Numerical Model Outputs. Bull. Am. Meteorol. Soc. 1997, 78, 2539–2558. [Google Scholar] [CrossRef]
- Hersbach, H.; Bell, B.; Berrisford, P.; Biavati, G.; Horányi, A.; Muñoz Sabater, J.; Nicolas, J.; Peubey, C.; Radu, R.; Rozum, I.; et al. ERA5 Monthly Averaged Data on Single Levels from 1979 to Present. Copernicus Climate Change Service (C3S) Climate Data Store (CDS). Available online: https://cds.climate.copernicus.eu/ (accessed on 10 July 2021). [CrossRef]
- Trouet, V.; Van Oldenborgh, G.J. KNMI Climate Explorer: A Web-Based Research Tool for High-Resolution Paleoclimatology. Tree-Ring Res. 2013, 69, 3–13. [Google Scholar] [CrossRef] [Green Version]
Figure 1.
950–850 hPa ERA5 wind vectors (arrows) and long-term mean CHIRPS precipitation for austral (a) summer (b) autumn (c) winter (d) spring. The black box indicates the SAM V-Index region over the western Amazon (5° S–5° N, 65°–75° W), an area where the seasonal reversal of the cross-equatorial flow over South America is observed, according to Wang et al. [24]. The blue line indicates the limits of the Amazon basin.

Figure 3.
The monitoring campaign at the Mera site, Central Ecuador, from February 2019 to July 2021 (n = 30) showing (a) the meteoric relationship for 18O and 2H in precipitation. The mean value for δ18Op is −6.98‰ and for δ2Hp is −43.62‰ (red diamond); (b) the comparison between the local amount of rainfall (blue bars) with δ18Op (black line) and temperature (red line).


Figure 4.
Seasonal moisture flux and uptake for the Mera site, Central Ecuador, calculated from 2014 to 2019 at 1500 m following the method of Sodemann et al. [51] using the PySplit package [49]. (a,e) December–March; (b,f) April–June; (c,g) July–September; (d,h) October–November. The seasonal δ18Op and d-excess values are indicated at the bottom of each map.

Figure 5.
The monitoring of δ18Op in the Mera site, central Ecuador, from February 2019 to July 2021 and comparison with (a) amount of precipitation and (b) Outgoing Longwave Radiation (OLR) at the northwestern V-Index region. The blue and gray stripes highlight the bimodal peak in precipitation (zenithal rain) during AMJ and ON. The right y-axis is reversed in (a) for direct comparison.

Figure 6.
The altitude effect for δ18Op at the Andean and western Amazonian stations in Ecuador. (a) 3-D perspective map of Ecuador indicating the location of the stations with δ18Op values at northern and southern latitudes (black dots). The Mera site in central Ecuador links these domains due to its location in an unrepresented area in the Amazon. (b) Mean annual δ18Op values for the stations displayed in (a) presenting an altitude gradient of −0.15‰ per 100 m.

Figure 7.
A comparison between δ18Op from inter-Andean and western Amazonian stations in Ecuador (Figure 1) with (a) ERA5 precipitation 1992–1996, (b) OLR 1992–1996, (c) ERA5 precipitation 1998–2015, and (d) OLR 1998–2015. As in Figure 5, the blue and gray stripes highlight the bimodal peak in precipitation during AMJ and ON rainfall. For direct comparison, the right y-axis is reversed in (a) and (c).


Figure 8.
Precipitable water from a WRF simulation for 18Z (1 p.m. Ecuador continental time) with a horizontal resolution of 50 km over northern South America for austral: (a) summer, (b) autumn, (c) winter, (d) spring.
Figure 8.
Precipitable water from a WRF simulation for 18Z (1 p.m. Ecuador continental time) with a horizontal resolution of 50 km over northern South America for austral: (a) summer, (b) autumn, (c) winter, (d) spring.


Table 1.
A comparison between gridded precipitation at northwestern V-Index region from CRU, CHIRPS, and ERA5 with monitored δ18Op across the Andes and western Amazon from previous studies and the monitored Mera site.
Table 1.
A comparison between gridded precipitation at northwestern V-Index region from CRU, CHIRPS, and ERA5 with monitored δ18Op across the Andes and western Amazon from previous studies and the monitored Mera site.
| Site | Lat | Lon | Elev. m. asl | Period | Local Amount | V-CRU | V-CHIRPS | V-ERA5 | V-OLR | Reference |
|---|---|---|---|---|---|---|---|---|---|---|
| Baeza | −0.46 | −77.89 | 1960 | 1992–1993 | −0.50 | −0.85 | −0.91 | −0.77 | 0.62 | [7] |
| El Chaco | −0.33 | −77.81 | 1600 | 1993–1996 | 0.20 | −0.67 | −0.56 | −0.34 | 0.29 | |
| Cuyuja | −0.41 | −78.02 | 2380 | 1992–1993 | 0.29 | −0.13 | −0.40 | −0.42 | 0.20 | |
| Mendez | −2.71 | −78.33 | 665 | 1992–1994 | −0.62 | −0.55 | −0.74 | −0.66 | 0.65 | |
| Cuenca | −2.88 | −78.98 | 2510 | 1992–1996 | −0.67 | −0.26 | −0.47 | −0.60 | 0.76 | |
| Papallacta | −0.37 | −78.14 | 3150 | 1992–1994 | −0.10 | −0.56 | −0.70 | −0.68 | 0.68 | |
| Lago Agrio | −0.08 | −76.86 | 297 | 1992–1996 | −0.33 | −0.74 | −0.74 | −0.61 | 0.31 | |
| Amaluza | −2.60 | −78.56 | 1720 | 1992–1994 | −0.14 | −0.65 | −0.81 | −0.78 | 0.59 | |
| Alluriquin | −0.31 | −78.96 | 850 | 1992–1996 | −0.47 | −0.44 | −0.54 | −0.64 | 0.46 | |
| Mean | −0.26 | −0.54 | −0.65 | −0.61 | 0.51 | |||||
| Izobamba | −0.37 | −78.53 | 3058 | 1998–2008 | −0.48 | −0.47 | −0.47 | −0.57 | 0.38 | [38] |
| Quito | −0.16 | −78.48 | 2850 | 1998–2014 | −0.54 | −0.64 | −0.64 | −0.69 | 0.38 | |
| Bogota | 4.7 | −74.12 | 2547 | 1998–2016 | −0.39 | −0.52 | −0.56 | −0.50 | 0.12 | |
| N. Rocafuerte | −0.89 | −75.49 | 250 | 2001–2002 | −0.49 | −0.78 | −0.85 | −0.86 | 0.48 | [31] |
| Zhurucay | −3.06 | −79.23 | 3400 | 2011–2014 | −0.57 | −0.54 | −0.57 | −0.69 | 0.54 | [41] |
| † Mean | −0.49 | −0.62 | −0.64 | −0.70 | 0.53 | |||||
| Mera | −1.40 | −78.05 | 1200 | 2019–2021 | −0.46 | −0.71 | −0.63 | −0.69 | 0.47 | This study |
Note: All the correlations are significant at p < 0.05. † Calculated mean excluding the Bogota station.
Publisher’s Note: MDPI stays neutral with regard to jurisdictional claims in published maps and institutional affiliations. |
© 2022 by the authors. Licensee MDPI, Basel, Switzerland. This article is an open access article distributed under the terms and conditions of the Creative Commons Attribution (CC BY) license (https://creativecommons.org/licenses/by/4.0/).
Share and Cite
MDPI and ACS Style
Vargas, D.; Chimborazo, O.; László, E.; Temovski, M.; Palcsu, L. Rainwater Isotopic Composition in the Ecuadorian Andes and Amazon Reflects Cross-Equatorial Flow Seasonality. Water 2022, 14, 2121. https://doi.org/10.3390/w14132121
AMA Style
Vargas D, Chimborazo O, László E, Temovski M, Palcsu L. Rainwater Isotopic Composition in the Ecuadorian Andes and Amazon Reflects Cross-Equatorial Flow Seasonality. Water. 2022; 14(13):2121. https://doi.org/10.3390/w14132121
Chicago/Turabian StyleVargas, Danny, Oscar Chimborazo, Elemér László, Marjan Temovski, and László Palcsu. 2022. "Rainwater Isotopic Composition in the Ecuadorian Andes and Amazon Reflects Cross-Equatorial Flow Seasonality" Water 14, no. 13: 2121. https://doi.org/10.3390/w14132121
Note that from the first issue of 2016, this journal uses article numbers instead of page numbers. See further details here.