
Optimal Water Resources Allocation in the Yinma River Basin in Jilin Province, China, Using Fuzzy Programming


1
MOE Key Laboratory of Resources Environmental Systems Optimization, North China Electric Power University, Beijing 102206, China
2
Spic Yuxin Power Generation, Co., Ltd., Xinxiang 453000, China
3
College of New Energy and Environment, Jilin University, Changchun 130012, China
*
Author to whom correspondence should be addressed.
†
These authors contributed equally to this work.
Water 2022, 14(13), 2119; https://doi.org/10.3390/w14132119
Submission received: 27 May 2022
/
Revised: 23 June 2022
/
Accepted: 30 June 2022
/
Published: 2 July 2022
(This article belongs to the Section Water Resources Management, Policy and Governance)
Abstract
:Being one of the most important sources of water in the Jilin Province in China, the Yinma River Basin (YRB) is facing problems of water scarcity in low economic areas and low utilization in richer areas mainly caused by the irrational allocation of water, excessive pursuit of economic benefits, and neglect of environmental problems. Restricting watershed development involves potential decision-making risks. Some scholars have used the interval two-stage stochastic planning method to adjust water resource allocation in the Drinking Horse River Basin, but the method uses historical statistics for projection and does not take into account the ambiguity and uncertainty in real planning situations. Therefore, this study addresses the problems prevalent in the allocation of water resources in the YRB through optimization using stochastic programming methods, interval and two-stage, and introduces the fuzzy mathematical programming method, with the aim of coordinating the water balance of various water-consuming sectors in the YRB, so as to reconfigure the water allocation. The goal is to solve the existing problems of irrational water allocation, reduce system risks posed by excessive economic development, mitigate water shortages in the water-consuming sectors, and alleviate potential decision-making risks and vague uncertainties associated with the allocation of water resources. Additionally, optimization of the pollution-holding capacity improvement project was carried out. The interval fuzzy two-stage model simulation developed in this study shows that the distribution of water across the different administrative regions can be reduced by up to 30% compared with the original model, effectively reducing the problem of water wastage. Post-optimization, the impact of water shortage in the water resources allocation scheme is alleviated to a significant degree, and there is no water shortage in some areas. At the same time, the eco-environmental sector has gradually taken the leading role in the distribution of water reuse among the different water-consuming sectors. The pollution-holding capacity has been enhanced, and the discharge and river entry chemical oxygen demand (COD) and ammonia nitrogen, two typical pollutants, have been reduced. The membership interval in the interval fuzzy two-stage model reflects the relationship between the possible level of the target value and the risk level. This study provides a guideline for decision makers for balancing the relationship between benefits and risks and proposes a planning scheme that is more conducive to the development of the river basin.
1. Introduction
Water resources are vital to the survival of animals, plants, and microorganisms and are also equally important for human life and social development [1,2,3,4,5,6,7]. Over the past few decades, the demand for water in society has increased significantly due to rapid population growth and the rapid development of various industries [8,9,10]. As we all know, Earth has abundant water resources, but only about 2.5% of them are freshwater [11]; most of them exist in the form of glaciers or deep groundwater, and only 0.26% of the world’s freshwater resources are distributed in lakes, reservoirs, and rivers [12]. The survival, as well as social and economic development, of mankind depends mainly on this relatively readily available 0.26% freshwater resource for its water needs. Rivers are widely distributed on land and are the most important sources of water for humans [13,14,15,16,17]. Due to the exponential growth of the population, existing freshwater resources are being rapidly depleted. In the 20th century, in particular, the global population quadrupled, and, simultaneously, water withdrawals from natural freshwater systems increased eightfold. As a result, water scarcity exists both in economically developed countries and regions, as well as in the sparsely populated Himalayas [18,19,20]. The Middle East has long been recognized by experts as a semi-arid-to-arid region, with millions of people facing a lack of access to water for domestic use and water depletion becoming a serious and deteriorating ecological problem in the region [21,22,23,24,25,26]. In Africa, more than 785 million people live in conditions of extreme water scarcity [27,28,29,30,31]. Water resources are also becoming increasingly scarce in some European countries, with a negative impact on local economic development [32,33,34]. Although China is rich in water resources, it has a large population, accounting for 22% of the total population of the world, and only 8% of the world’s freshwater resources, which are unevenly distributed spatially and temporally, with more than 80% of its water resources concentrated in coastal areas of the southeast [35], leading to severe drought and water shortages in northern China [36,37,38,39,40].
In areas where water resources are scarce, rivers are centrally controlled to ensure the supply of water to urban, industrial, and agricultural sectors [41]. Faced with this increasingly tense water situation, nations around the world have taken steps to adopt the strategies necessary for the sustainable management of water withdrawals from rivers and other water sources [42]. Studies have shown that adjusting the allocation of water resources in a basin and balancing the relationship between water supply and water demand is an effective means of alleviating water shortages in a basin [43,44,45,46]. Jodar-Abellan et al. [47] developed a conceptual model to mitigate drought in southeastern Spain by analyzing the relationship between the sources of water resources and the demand for water. The model balances the water needs of various end users and offers a new approach to water allocation in the context of water scarcity and increasing water demand. Schlüter et al. [44] used the EPIC modelling system to build a water management model for the Amudaria River and its delta, taking into account the changing demands of the water use sectors and responding to the changing priorities of the water use sectors, providing water on demand and mitigating the environmental degradation caused by water scarcity in the area. Degefu et al. [48] provide a framework for addressing water allocation in transboundary rivers under shared water resources in water scarcity situations, taking into account the water allocation challenges that exist in transboundary rivers facing water scarcity situations, which can provide water allocation results that are easier to implement and enforce under water scarcity conditions. China was one of the first countries to develop and use watershed resources, and the tension between the supply and demand of water resources in the basin is also extremely high [49,50], seriously hampering the sustainable economic and ecological development of the basin. The imbalance between supply and demand of water resources in the basin must be addressed. Many scholars have already conducted studies on water resource management in China. Yao et al. [51] developed a multi-objective, multistage Starkelberg–Nash–Kurnow model to optimize water allocation based on water rights allocation and overcome water allocation problems caused by uneven annual inflows in response to the poor sustainability of water allocation in the Min River Basin in China. Zhang et al. [52] constructed a general equilibrium model embedded in the IO table of soil and water resources to address the imbalance between economic and ecological benefits in the Heihe River Basin, providing a theoretical solution to achieve the redistribution of water resources while maintaining economic and ecosystem stability in the dryland basin. Yang et al. [53] proposed a holistic basin-scale approach to determine the ecological water demand of the Yellow River Basin and to allocate water resources according to the natures of the water-using sectors.
There are various water allocation models, including typical water evaluation and planning (WEAP) models [54,55], irrigation water allocation models [56,57], and traditional water allocation models [58]. However, these models are often modeled using statistical data collected over the years to optimize and forecast future changes. However, reality is fraught with uncertainty, and statistical planning using mathematical methods alone cannot withstand the risks posed by uncertain events. The Songhua River is a major water system in northeast China [59,60]. As a secondary tributary of the Songhua River, the Yinma River is a key target for control in Jilin Province. Studies have already focused on water allocation in the Yinma River Basin using planning methods. As a secondary tributary of the Songhua River, the Yinma River is a priority for control in Jilin province. Studies have been carried out using planning methods to focus on the allocation of water resources in the Yinma River Basin. This has seriously hindered ecological protection and economic improvement; therefore, the prevalent contradictions between water use and supply and demand need to be solved urgently. Meng et al. [61] constructed an interval two-stage optimization approach based on water allocation in the Yinma River Basin to improve system gains when water resources are allocated. However, Meng et al. [61] overallocate water resources to sectors with low discharge or high water use benefits, while the scope for optimization is too broad, and there are ambiguities and uncertainties about the amount of water to be reused, along with ecological issues, leading to wastage of water resources in areas with low discharge or high water use benefits in the Yinma River Basin. Therefore, a more scientific approach to optimizing the allocation of water resources in the Yinma River Basin is urgently needed.
In view of the discussion above, this study introduces a fuzzy programming method based on the YRB water resource distribution model using the two-stage interval model developed by Meng et al. [61]. The main focus of this study is to develop an optimal water distribution model for the YRB by interval fuzzy two-stage stochastic programming (IFTSP), with comprehensive economic effects as an objective function. The study aims to optimize the allocation of water in various regions and sectors of the YRB to ensure effective use of water while simultaneously considering the state of pollution discharge in the watershed and to formulate plans that are conducive to the comprehensive evolution of economic and ecological use of water resources in the YRB.
2. Study Area
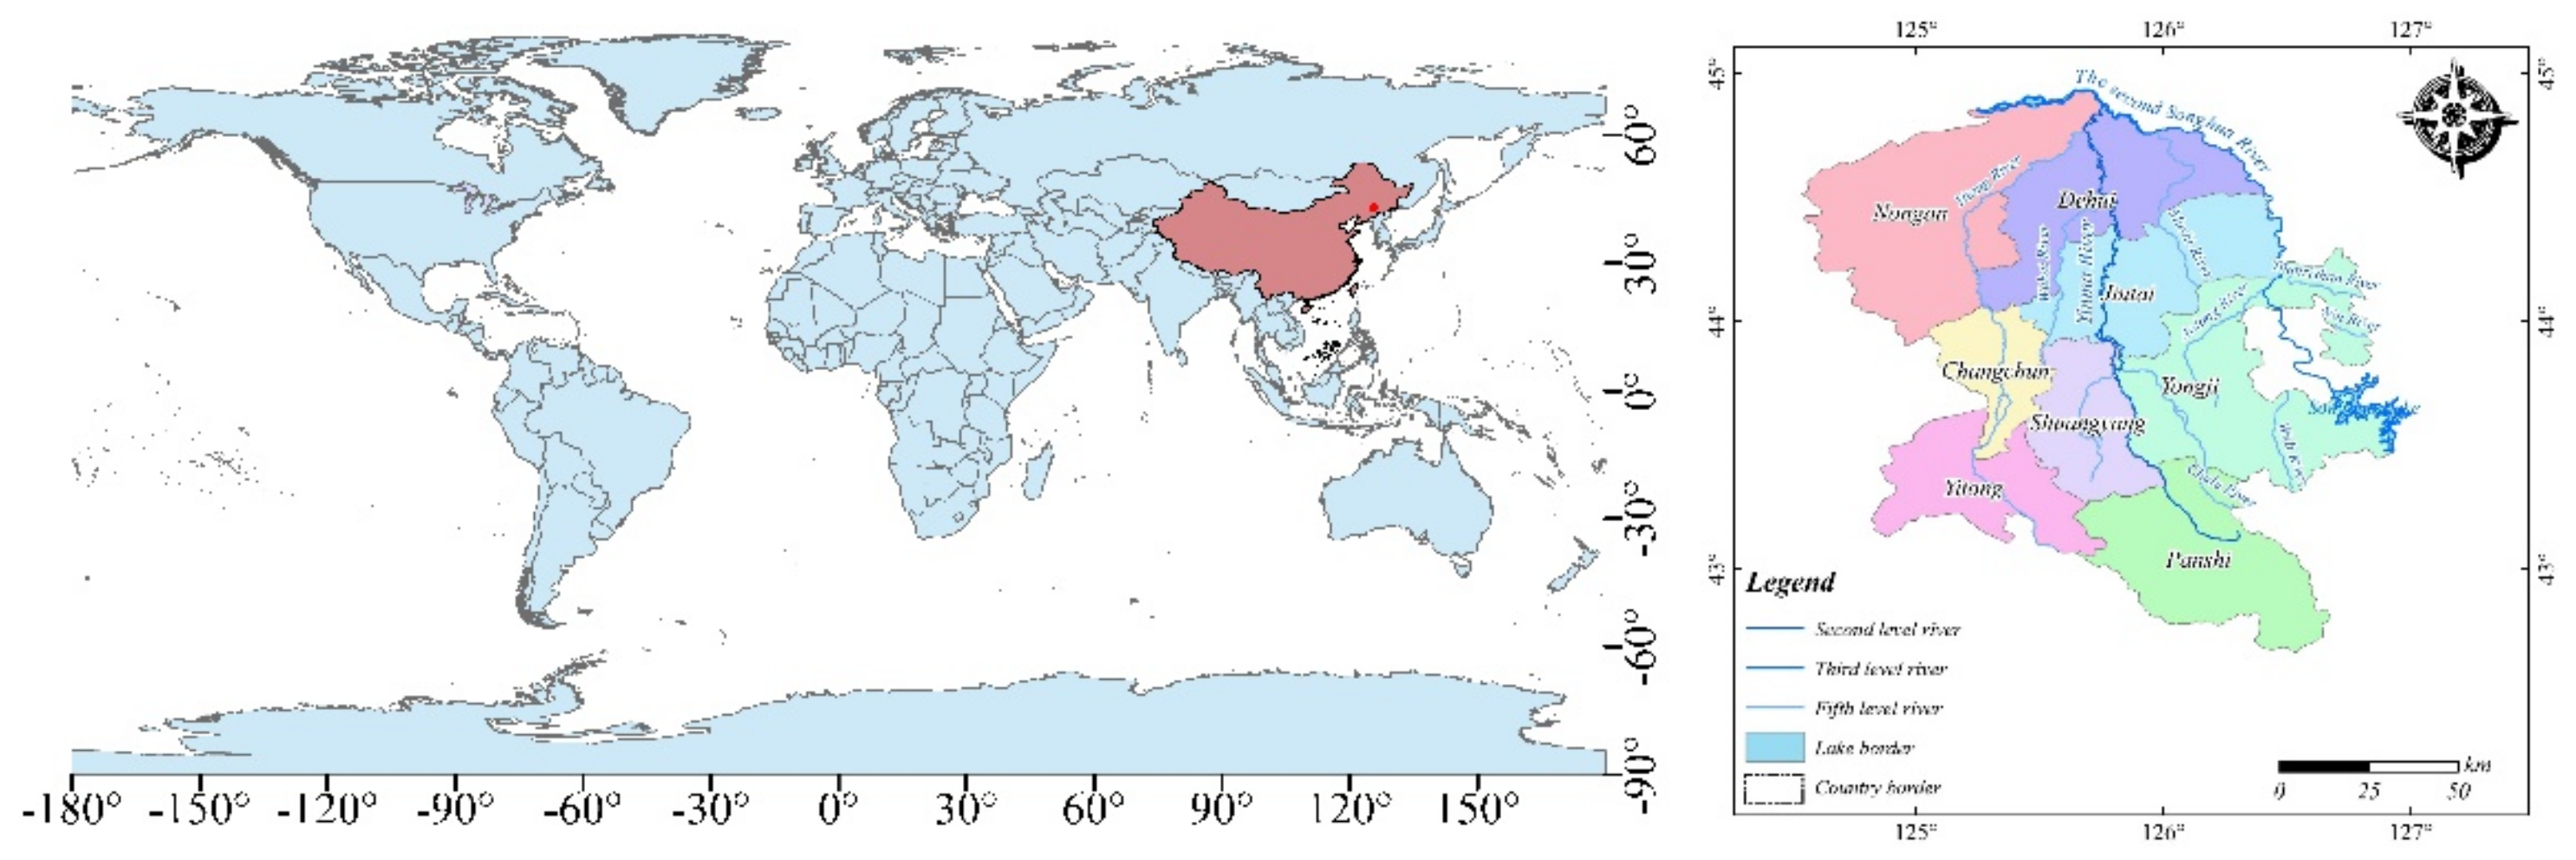
The Yinma River Basin, located in the middle of Jilin Province, originated from Hulanling, Yima Town, Panshi City, Jilin Province; the basin flows through seven areas, including Changchun City, Nongan County, Dehui city, Jiutai District, Yongji County, Panshi City, Yitong Manchu Autonomous County, and Xiadian District of Siping City, and is injected into the Second Songhua River about 15 km north of Jishantun Village of Nongan County [62]. A distribution map of the Yinma River Basin is shown in Figure 1. As can be seen in the Geography of Jilin Province, the Drinking Horse River Basin has a diagonal rectangular shape in a bird’s eye view from above, with a relatively simple type of topography, the eastern part being mainly a transition area between the mountains and the Songliao Plain, the southern part being mainly low mountainous hills, the northwestern part being mainly extensive plains, and the central part being a plain terrace with a high southeast and low northwest topography, with most of the rivers flowing from north to south.
3. Model Development
3.1. Interval Fuzzy Two-Stage Model
The fuzzy programming method transforms the fuzzy mathematical problem into the general linear programming method and presents the fuzzy parameters in the form of fuzzy random variables. The expression of the interval fuzzy two-stage stochastic programming method is as follows [63,64,65].
Constraints:
where represents the fuzzy membership interval of the model and and represent the upper and lower limits of the objective function of the interval two-stage stochastic programming model, respectively. Using an interactive algorithm, the model is divided into two sub-models considering the upper and lower bounds to solve the problem. The solutions are and , and the optimized value is .
3.2. Water Allocation Model Based on the IFTSP Approach
The present study introduces a fuzzy mathematical planning approach on account of an interval two-stage stochastic planning model and constructs the interval fuzzy two-stage stochastic programming method of water resource allocation model to reallocate water resources in the YRB, solving the problem of wastage of water resources caused by their imbalance and ensuring the maximization of economic benefits so as to achieve an efficient allocation of water resources in the basin [63,66].
In this approach, the minimum and maximum water consumption quotas of every water-consuming k-sector in the j-region of the YRB during the t-period are set as fuzzy variables, and the objective functions of the IFTSP model are constructed as follows:
where denotes the affiliation interval of the model.
Constraints:
- (1)
- Constraints on the maximization of water resource income:
- (2)
- Constraint on available water resources [61]:
The amount of water resources used by k-sector in j-region in t-period should not exceed the amount of water allocated by the department.
- (3)
- Constraints on sectoral water demand:
The available water resources of k-sector in j-region in t-period should not exceed the water consumption limit of the department. are fuzzy variables.
- (4)
- Constraints on sewage treatment capacity [61]:
The amount of sewage discharged by k-sector in j-region in t-period cannot exceed the sewage treatment capacity of the department.
- (5)
- Constraints on reuse water treating capacity [61]:
The recycled water used by k-sector in j-region in t-period should not exceed the recycled water used by the department.
- (6)
- Constraints on total pollutant control [61]:
The discharge of pollutants in j-region during t-period shall not exceed the pollutant control capacity of the area.
- (7)
- Constraints on sewage carrying capacity of the basin [61]
The pollutant absorbing capacity of each monitored section in t-period should not exceed its sewage carrying capacity.
- (8)
- Non-negative constraints [61]:
i represents the 11 water environment monitoring sections in the YRB;
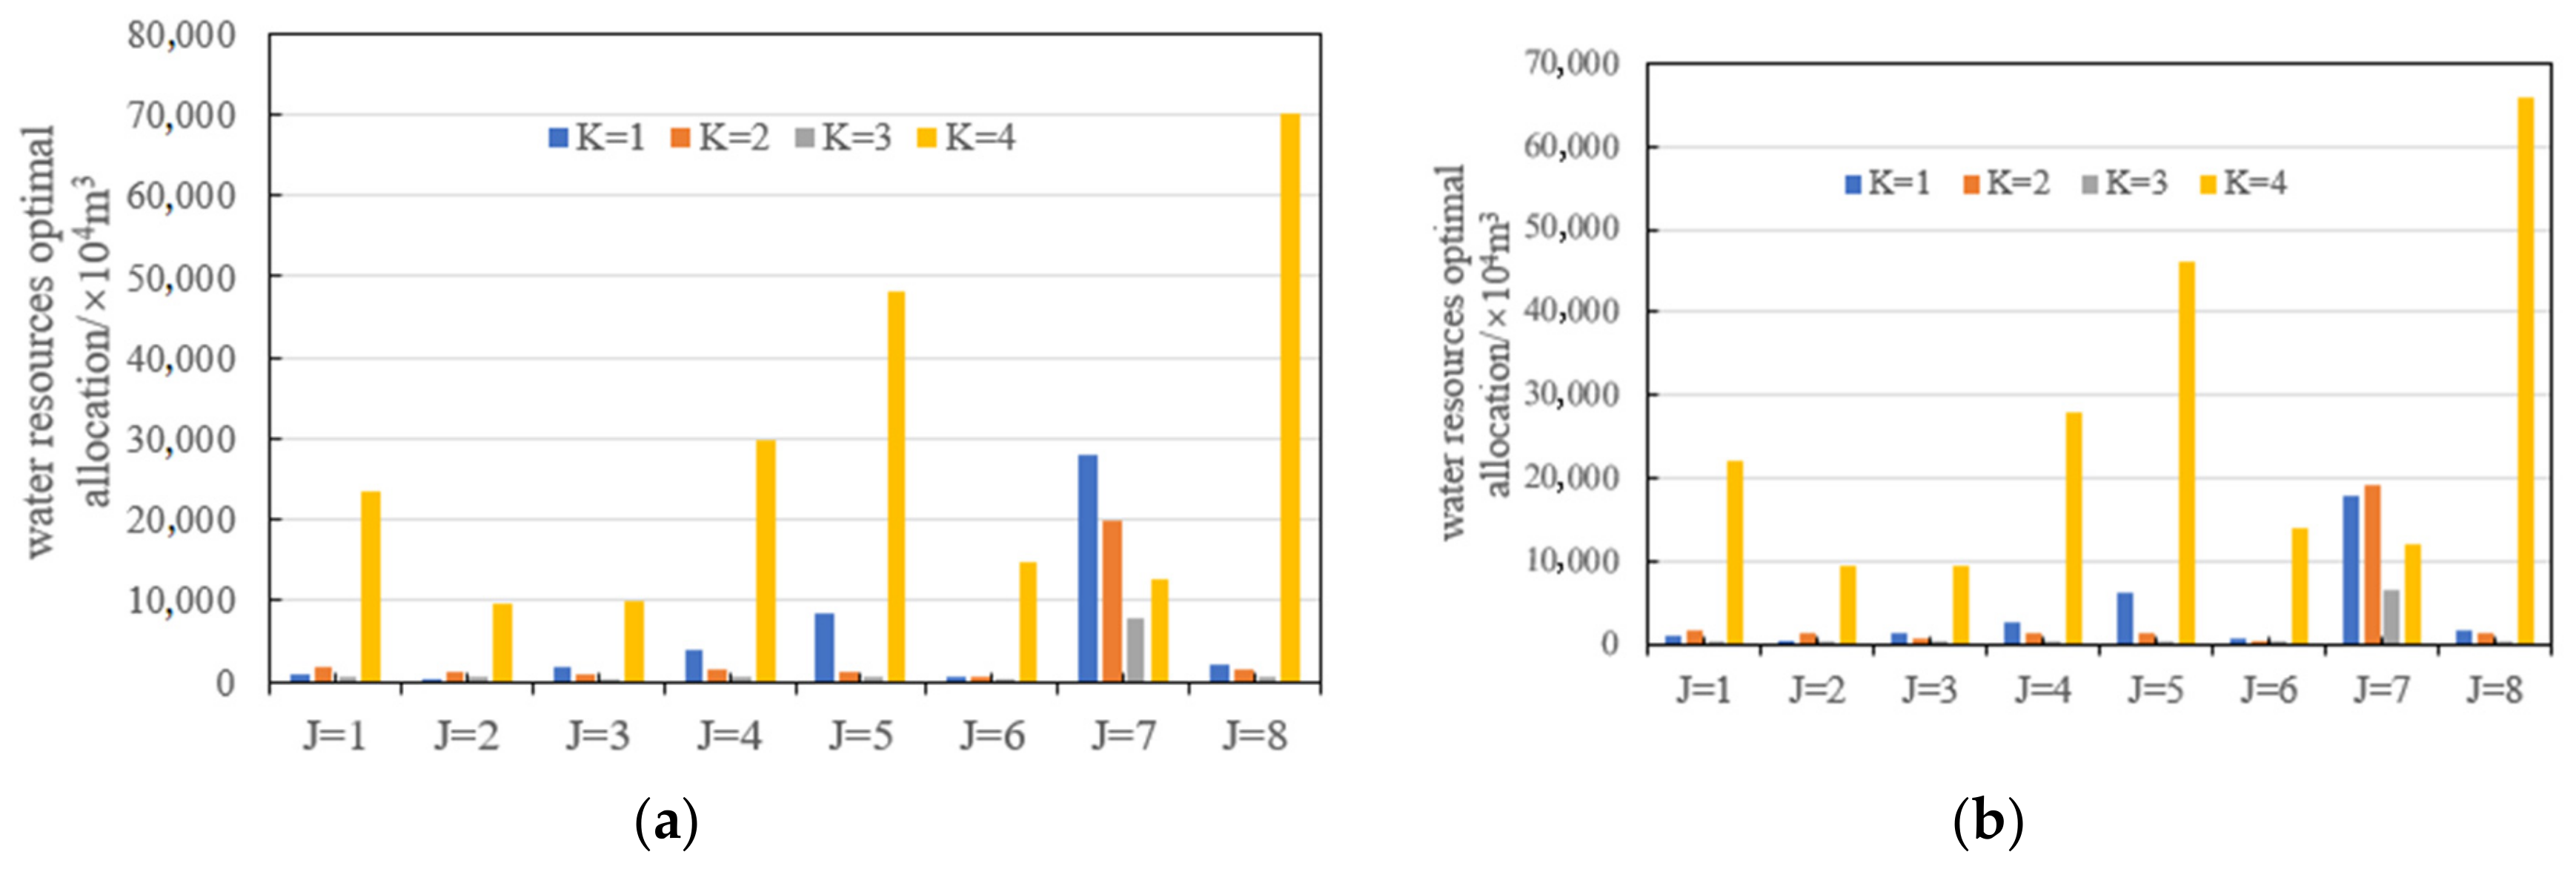
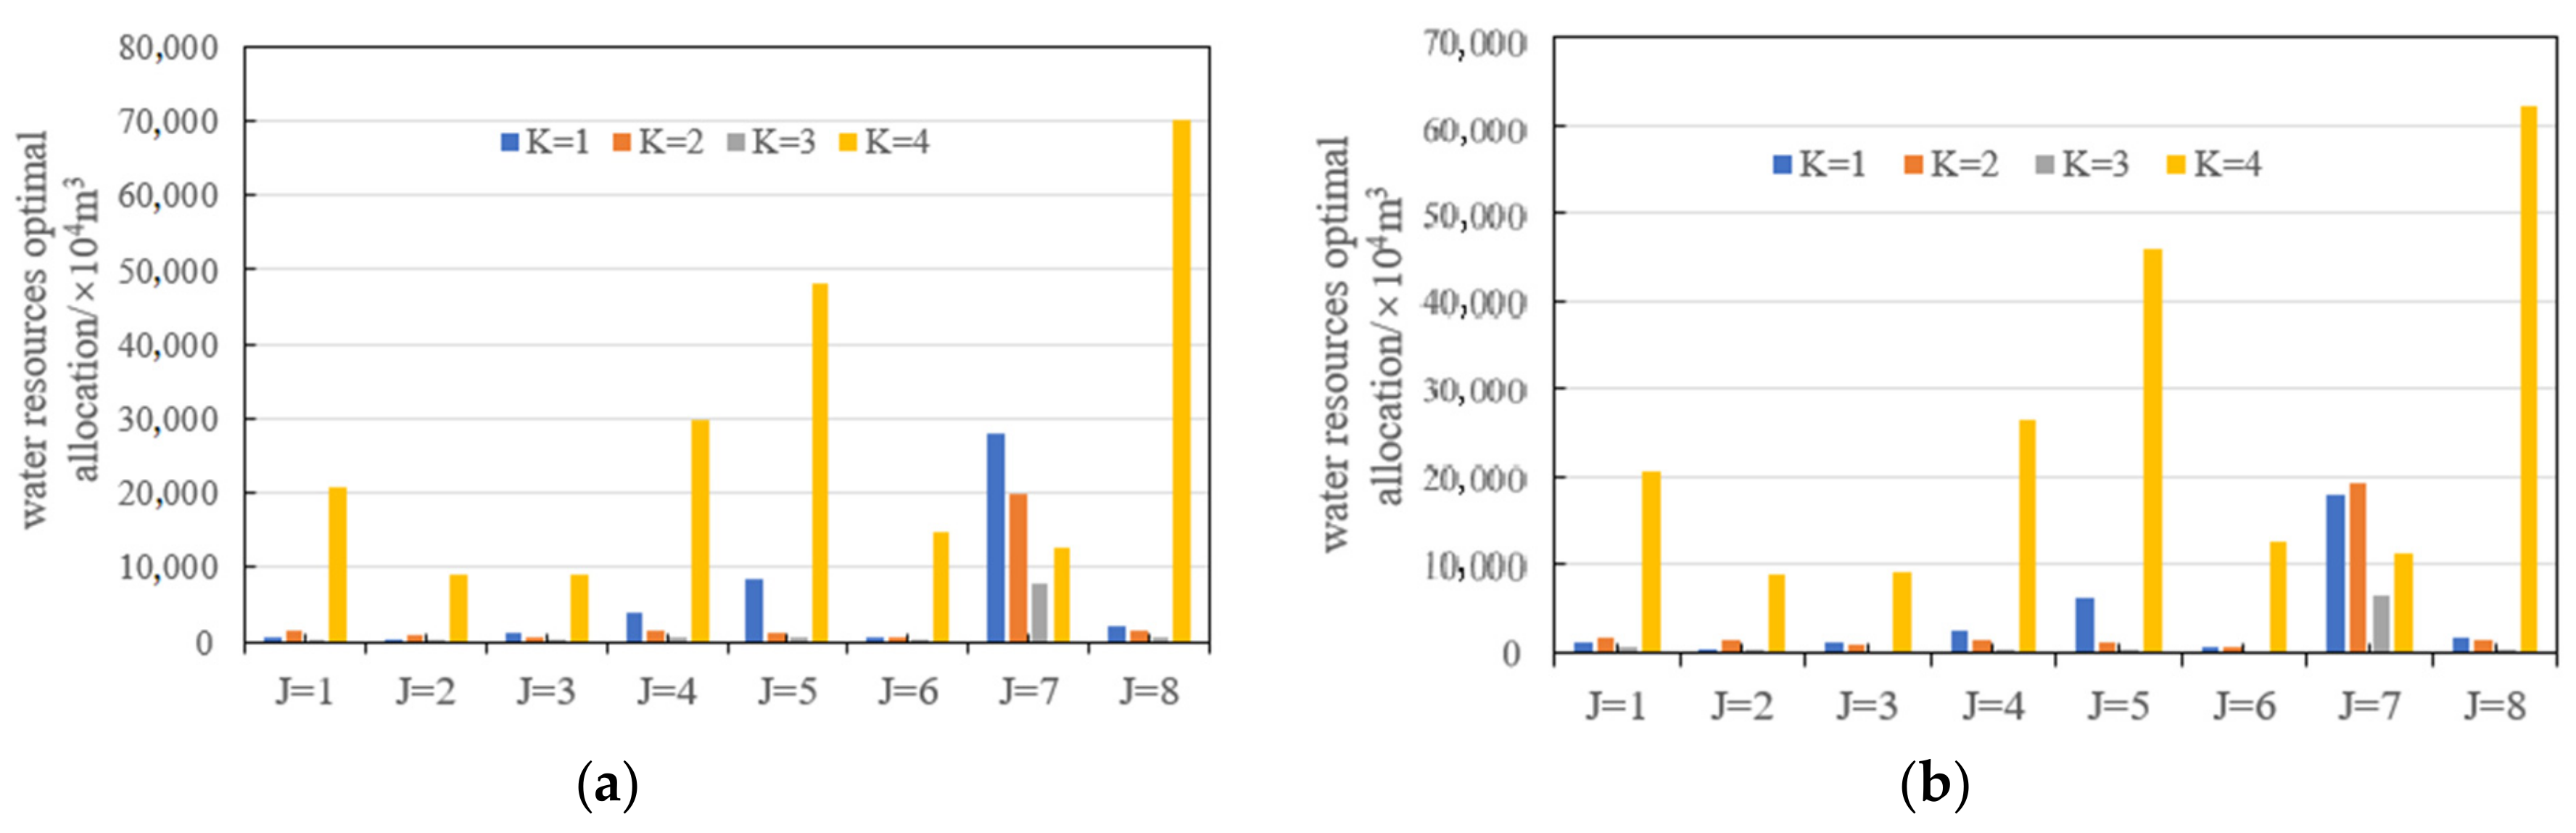
j = 1 to 8 represent the eight regions in the YRB, respectively;
k represents the water sector, and k = 1 to 4 represent the industrial sector, municipal living sector, ecological–environmental sector, and agricultural sector, respectively;
t represents the planning period, and t = 1 to 3 represent the three five-year-planning periods from 2015 to 2020, 2020 to 2025, and 2025 to 2030, respectively;
h represents water resource availability levels of the YRB; h = 1, 2, and 3, respectively, represent low, medium, and high flow levels;
r represents typical pollutant control index types, r = 1 represents COD and r = 2 represents ammonia nitrogen;
l represents the type of pollution carrying capacity improvement project, l = 1 represents wetland, l = 2 represents floating bed, l = 3 represents corridor, l = 4 represents pre-storage, l = 5 represents conservation forest, l = 6 represents silt removal, and l = 7 represents aeration;
represents the time length of each planning period, which is 5 years in the present case, as stated earlier;
represents the probability that the water resource availability in the basin is h;
represents the amount of water resource preferentially allocated to the k-sector in the j-region during the t-period (104 m3/year);
represents the water reuse allocated to the k-sector in the j-region during the t-period (104 m3/year);
represents the missing water amount of a sector due to imbalanced demand and supply of water sources in the k-sector in the j-region at the h-level of availability of water resources during the t-period (104 m3/year);
, respectively, represent the minimum and maximum water consumption limits of the k-sector in the j-region of the YRB during the t-period (104 m3/year);
represents the available water amount in the basin during the t-period at the h-level (104 m3/year);
represents the water revenue generated by unit water resources of the k-sector in the j-region of the YRB during the t-period (104 yuan/104 m3);
represents the loss caused by water shortage arising from the imbalanced demand and supply of water sources in the k-sector in the j-region during the t-period 104 yuan/104 m3);
represents the cost of water use for every k-sector in the j-region during the t-period (104 yuan/104 m3);
represents the cost of recycling water of every k-sector in the j-region during the t-period (104 yuan/104 m3);
represents the cost of sewage treatment for the k-sector in the j-region during the t-period (104 yuan/104 m3);
represents the cost of recycling water allocated by the k-sector in the j-region during the t-period (104 yuan/104 m3);
represents the pollution production coefficient of the k-sector in the j-region during the t-period;
represents the effluent discharge factor of the k-sector in the j-region during the t-period;
represents the recycling rate of the k-sector in the j-region during the t-period;
denotes the treatment capacity for the discharged sewage water by the k-sector in the j-region during the t-period (104 tons/year);
denotes the effluent pollutants concentration post centralized treatment of wastewater generated by each water-utilization activity of the k-sector in the j-region during the t-period (tons/104 m3);
denotes the degree of control of pollutants in the j-region during the t-period (tons/year);
represents the pollutants emission influx coefficient from each water utilization activity of the k-sector during the t-period;
denotes the emission factor of the j-region to water–environmental control unit i;
denotes the pollution intake at h-level during the t-period (tons/year);
represents the improvement rate of post-treatment pollutant efficiency of pollutant absorbing capacity enhancement works implemented by the control unit i during the t-period (tons/year);
represents the specific engineering quantity of pollution absorbing capacity enhancement works of the control unit i during the t-period;
represents a 0–1 planning parameter, where 0 and 1 represent whether the project is implemented or not, respectively;
represents the engineering cost generated by implementing the pollution absorbing capacity enhancement works of type l in the control unit i during the t-period.
3.3. Model Solving
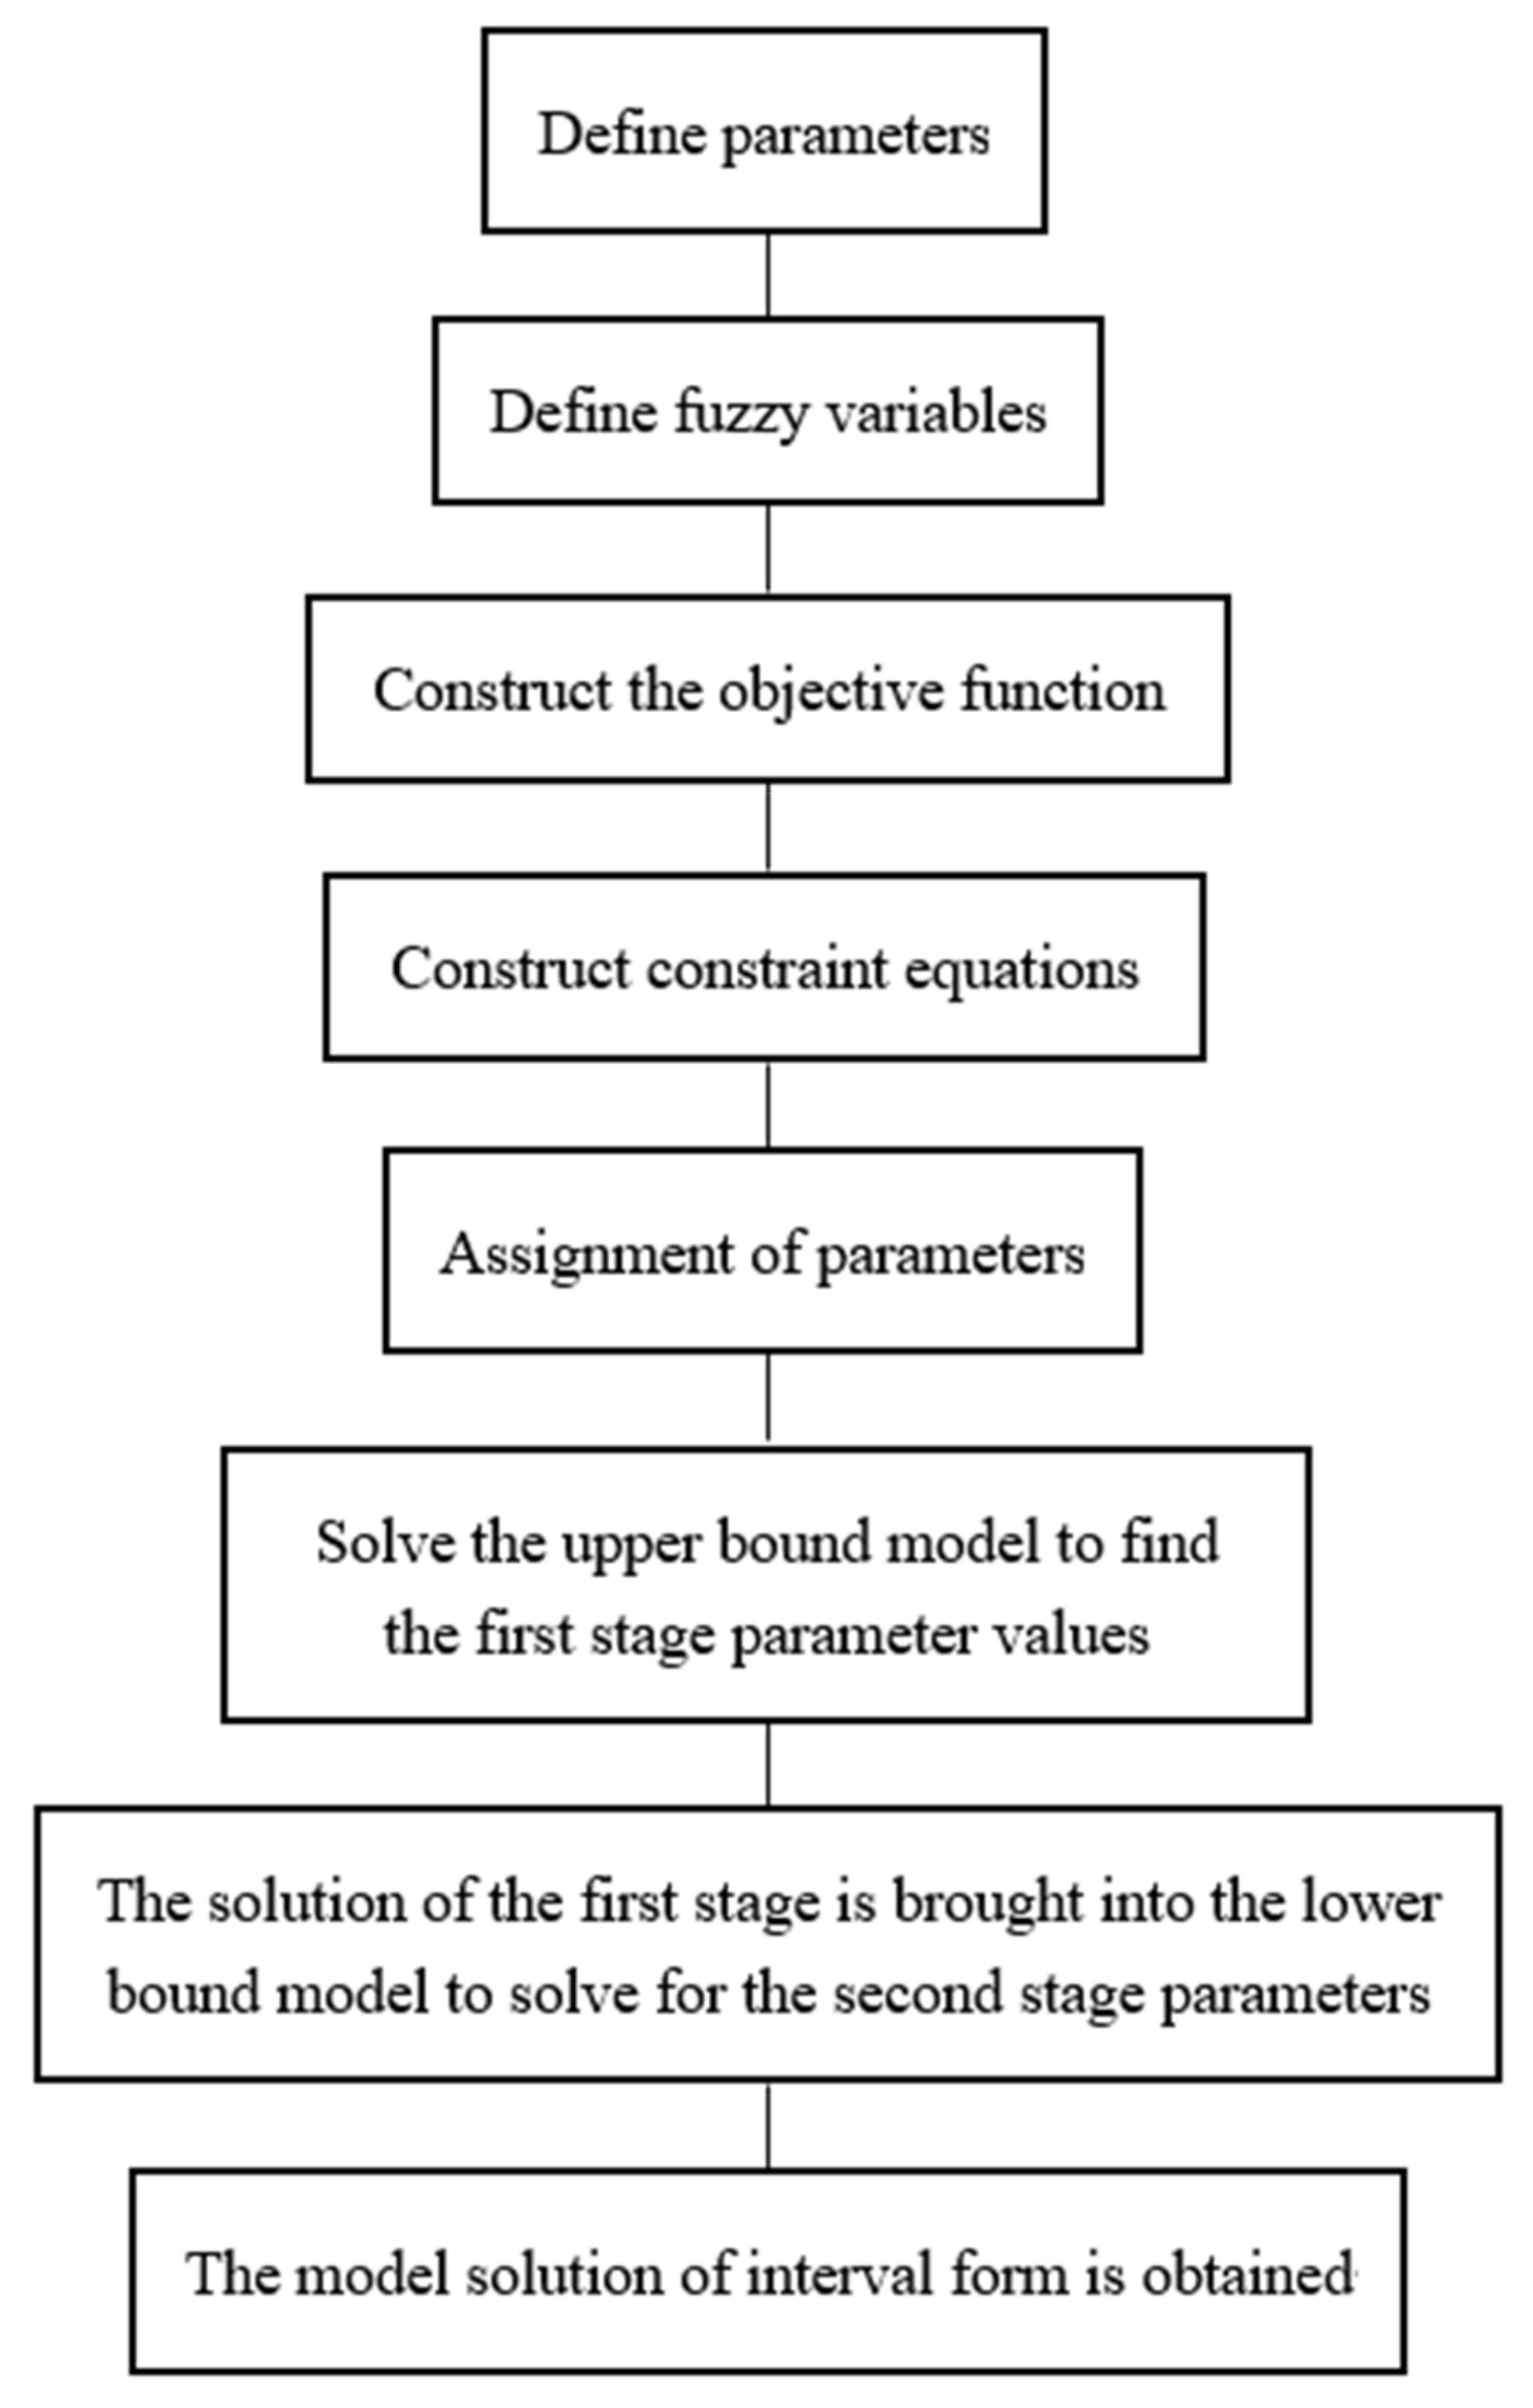
In this paper, LINGO 18.0 software (LINDO, Chicago, IL, USA) was used to con-struct the water resource allocation model of the Yinma River Basin based on the IFTSP optimization method. Parameter data were acquired from Research on Water Quality Target Management Techniques and Water Pollution Management Strategies in the Yinma River Basin, which is a China Water Pollution Prevention and Control Science and Tech-nology Major Project. The flowchart for the model construction is shown in Figure 2.
4. Results and Discussion
In order to solve the Yinma River Basin’s water resource allocation model based on the IFTSP method, the objective functions and [63] of the IFTSP model were obtained first and then substituted into the IFTSP model as constraint conditions. Based on the interactive algorithm, the IFTSP model can be transformed into two groups of deterministic submodels [67,68] to solve the upper and lower bounds of the objective function, respectively. Lingo 11 software was used in this study to solve the developed IFTSP model, and the fuzzy membership degree interval was obtained as [0.32, 0.99]. The level of fuzzy membership indicates the balance between risk and decision making: the low level of fuzzy membership indicates the low risk and income of the scheme, and the decision maker is less likely to adopt the scheme. The high degree of fuzzy membership indicates that the scheme has high risk and high income, and the decision maker is more likely to adopt the scheme.
4.1. Change Analysis of the YRB Water Resources Allocation Based on the IFTSP Method
4.1.1. Water Resources Allocation Scheme in the YRB Based on the IFTSP Method
The IFTSP model has the ability to solve the problem of uncertainty associated with the distribution of water resources so as to realize the maximization of the expected benefit with the available water resources of the river basin. However, under the influence of the limiting factors of sewage recycling, the planned water resources model automatically allocates water resources to the areas with higher water benefits or lower sewage output, whereas the areas with lower water benefits or higher sewage output are allocated less water than the target value, resulting in inequality in water allocation and, consequently, in wastage of water resources. Therefore, the initial scheme of water resources allocation was adjusted by the method of IFTSP so as to realize a reasonable allocation and effective utilization of water resources and subsequently solve the real problem. The unreasonable distribution of water and soil resources and the uneven spatial and temporal distribution of rainfall are important factors in inter-basin water transfer projects [69,70,71]. Table 1 shows the YRB water resources allocation schemes in different planning periods under optimal allocation.
It can be seen in Table 1 that with the advance of the planning period, the water consumption of various departments in different planning areas has increased year by year, indicating that the water demands of various departments in the Yinma River Basin have been increasing with economic development, and the economic development of the Yinma River Basin has shown a good upward trend. The proportion of agricultural water use outside the jurisdiction of Changchun City is the largest among all allocations of water resources, indicating that the Yinma River Basin prioritizes agricultural water use. For example, the lower and upper limits of the proportion of agricultural water use in the three planning periods of water resource allocation in the Nong’an area are [96.00%, 95.00%], [95.00%, 94.70%], and [94.50%, 94.00%], respectively. Comparing the water resources allocation under different scenarios, it can be found that the water consumption of each sector gradually decreased within the same planning period, and the water resources allocation is more reasonable, indicating that the IFTSP model constructed in this study can effectively optimize and adjust the water resources allocation scheme. In all the scenarios, water resources can be fully utilized to avoid the wastage of water resources.
In the Dehui area, the lower and the upper limits of water resources allocation in the first planning period of the industrial and the municipal life sectors are [4475.00, 4732.00] × 104 m3/year and [1026.40, 1283.00] × 104 m3/year, respectively, decreasing [0%, 16.70%] compared to those without adjustment. Similarly, the lower and the upper limits of water resources allocation are [6144.00, 6144.00] × 104 m3/year and [1032.00, 1290.00] × 104 m3/year, respectively, decreasing [0%, 26.40%] and [20%, 19.00%] compared with those without adjustment in the second planning period; and the lower and the upper limits of water resources allocation are [8432.00, 8432.00] × 104 m3/year and [1036.80, 1296.00] × 104 m3/year, respectively, decreasing [0%, 30.00%] and [20%, 20%] compared to those without adjustment in the third planning period. This shows that in the past, water resources were wasted and that the utilization efficiency of water resources was low. After model adjustment, the distribution range of water resources was more scientific and reasonable, the utilization efficiency of water resources was improved, and the shortage of water resources in the Yinma River Basin was alleviated.
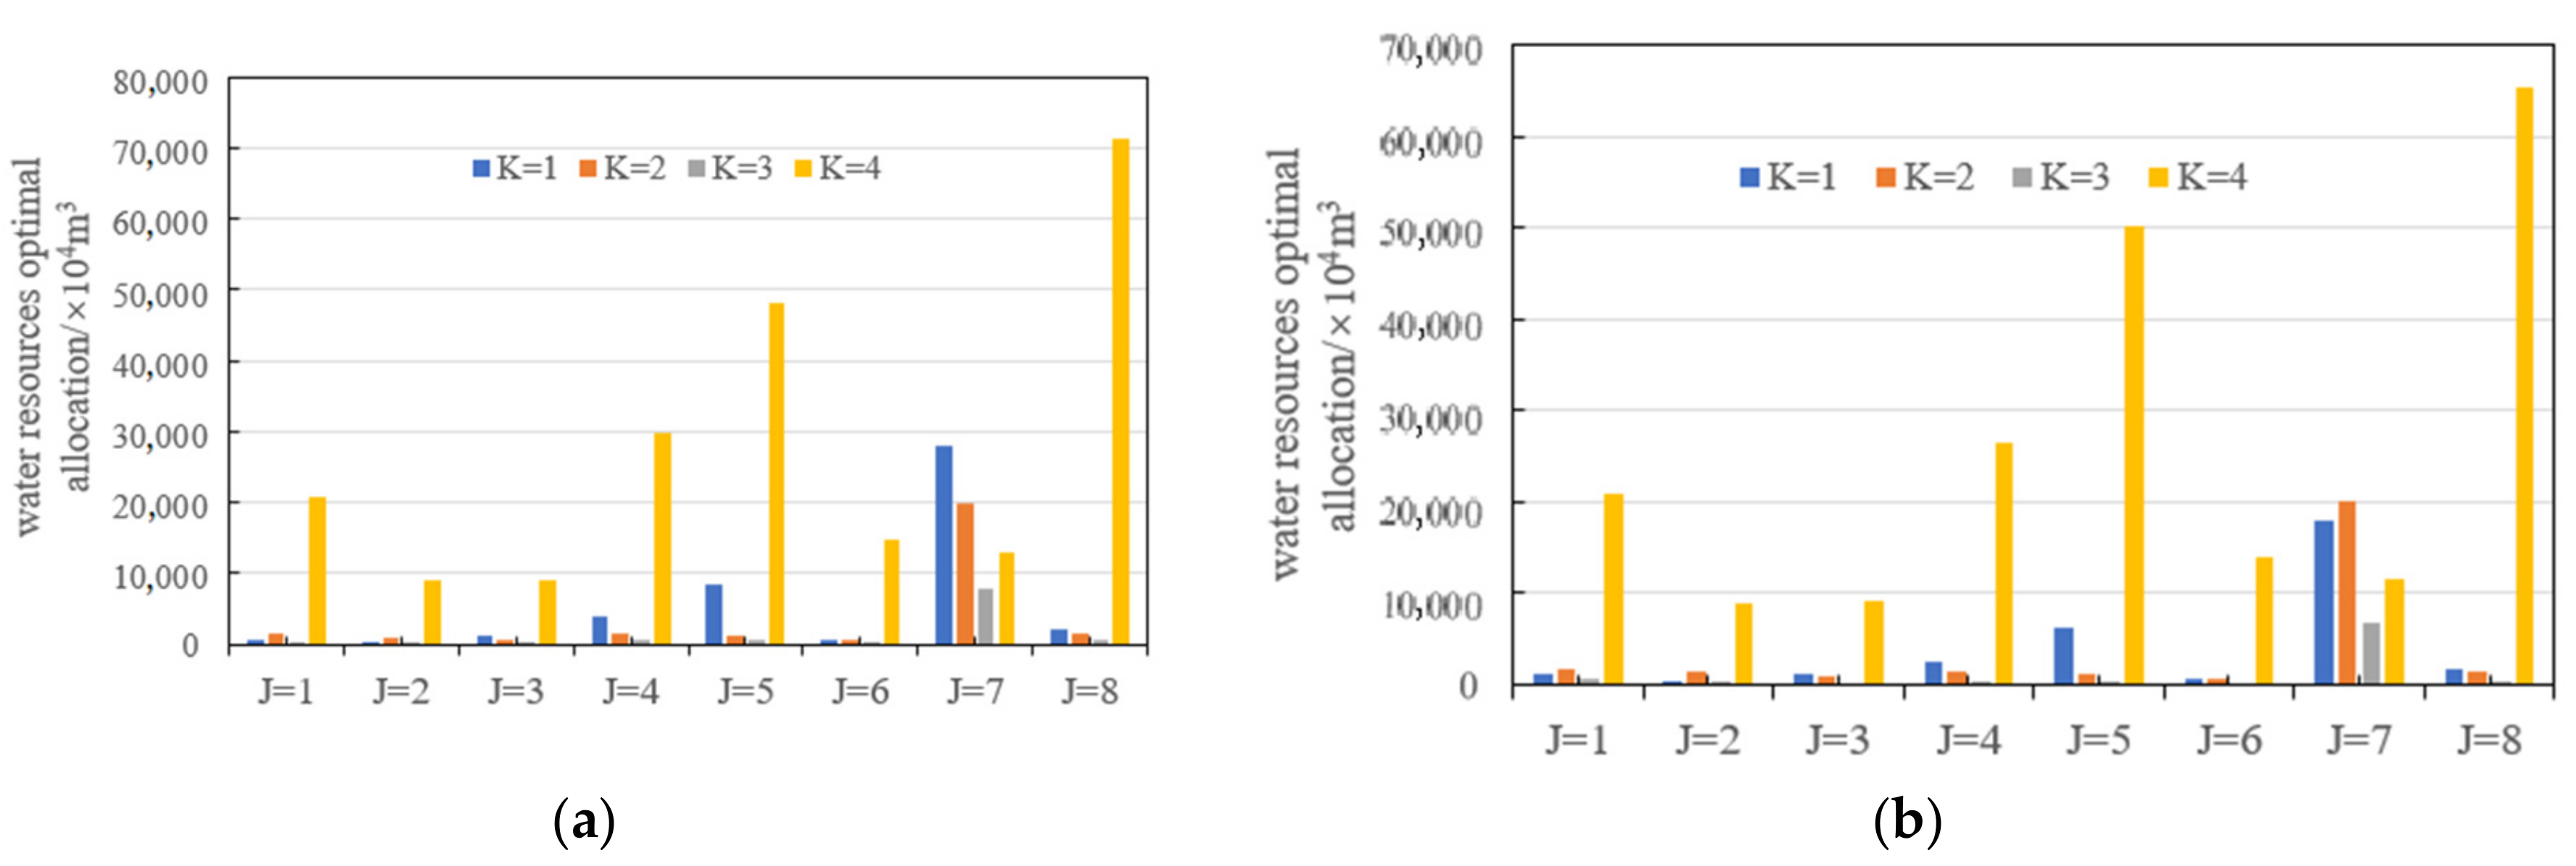
It can be seen in Figure 3, Figure 4 and Figure 5 that the lower and the upper limits of the ecological and environmental sector of the water resources allocation scheme did not change. This indicates that the water resources allocation of the ecological sector should reach the optimal state; the lower limits of the agricultural sector of the water resources allocation scheme in different planning periods are consistent with the original data, but the upper limits dropped by 20%, 21%, and 22% compared with the original allocation during the three planning periods, respectively. This shows that after fuzzy optimization, the phenomenon of high water resources allocation can be reduced while ensuring basic water use, and the risks and benefits can be balanced. The changes in water resource allocation in the other districts are also similar to those in the Dehui district. In general, the allocation of water resources in various regions in different sectors shows a downward trend compared with the original allocations within the same planning period. The optimized allocations could fulfill the water demands of different sectors in various regions as well as potentially improve the benefits of water use by saving water resources and avoiding wastage of water. Wastage of water resources was also prevented in areas or sectors with high profits or low emissions, avoiding the wastage of water resources in various regions or departments caused by the excessive allocation of water resources.
4.1.2. Analysis of Water Reuse by Different Sectors in the YRB Based on the IFTSP Method
In the era of climate change, the requirements for sustainable wastewater management and the concept of water reuse are becoming more and more important. Water reuse is considered a key technology for overcoming potential regional and sectoral water shortages [72,73,74]. Table 2 shows the reuse of water during the three planning periods in the YRB based on the optimal allocation scheme of the IFTSP model. As shown in Table 2, the amount of water reused in each sector of the YRB has gradually increased during the three planning periods, and the ecological and environmental sectors dominate in terms of the amount of water reused, while the agricultural sector accounts for zero water reuse. This indicates that the water reuse facilities in the ecological sector are sound and perfect but that there are great problems with water reuse in the agricultural sector, to which government departments need to pay special attention. For example, in the Yitong region of Siping City, the water wastage figures for the ecological sector for the three periods based on the original and optimal allocations are [124.10, 124.10] × 104 m3/year, [75.40, 146.20] × 104 m3/year, and [92.10, 166.00] × 104 m3/year, respectively, and the corresponding reuse volumes for the three periods account for [100%, 100%], [100%, 73%], and [100%, 75%] of the total allocation of water reuse for the region, respectively. This is because, in the Yitong area of Siping City, the industrial sector does not occupy a dominant position and the proportion of water reused by the industrial sector is small. However, in the Changchun and Panshi regions, the distribution of water reuse in industrial sectors is greater than that in other regions based on optimal allocation. The distribution of industrial water reuse in the Changchun region during the three planning periods is [0, 184.40] × 104 m3/year, [0, 784.90] × 104 m3/year, and [0, 320.20] × 104 m3/year, respectively, while in the Panshi region it is [0, 1317.80] × 104 m3/year, [481.60, 481.60] × 104 m3/year, and [404.96, 2243.60] × 104 m3/year, respectively. As a key industrial city, Changchun has many industrial companies, dominated by the industrial sector, with a large demand for industrial water. However, in the water resource allocation process, due to water shortage or inability to allocate water resources to meet department requirements, to alleviate the water shortage problem in the environmental department, the environmental department continues to increase the amount of reused water and alleviate the problem of water shortage through water reuse [75,76,77]. At the same time, it improves the efficiency of water resource utilization. The optimal allocation model of water resources in the basin is derived from the pursuit of high economic benefits of water use while taking into account ecological issues to enhance sustainable ecological development and maintain the stability of the ecological function of the Yinma River Basin. Therefore, the constructed basin water resource allocation model increases the allocations to the ecological and environmental sectors in order to maximize the economic benefits of water use while also considering ecological issues to improve ecological sustainability and maintain the stability of ecological functions in the YRB [78,79].
The IFTSP approach aims to avoid the wastage of water resources in the YRB, which can significantly improve the uneven distribution of recycled water. While considering the environmental benefits of the YRB, this approach also considers the stability and sustainability of ecological functions, as stated above [80], which further aids in overcoming water resource wastage.
4.1.3. Analysis of Water Shortage Variation in the YRB Based on the IFTSP Method
The difference between water demand and supply due to an inadequate water supply is called water shortage [80,81]. The incorporation of the IFTSP method in the optimization of the water resources allocation scheme can considerably alleviate the supply–demand mismatch and consequently increase the stability of water resources in the YRB. The changes in water shortage with respect to three water use sectors in different regions of the YRB during the different planning periods are presented in Tables S1–S3 in the Supplementary Materials.
As shown in Tables S1–S3, with the gradual increase in available water flow levels in the YRB, water shortage decreases significantly. For example, under the three levels of available water resources (low, medium, and high) in the first planning period, the water shortage for the industrial sector in the Dehui region is [656.98, 1938.10] × 104 m3/year, [656.98, 1938.10] × 104 m3/year, and [656.98, 1938.10] × 104 m3/year, respectively. The corresponding water deficits in the region for the second planning period are [656.98, 2334.00] × 104 m3/year, [656.98, 1768.50] × 104 m3/year, and [656.98, 1175.28] × 104 m3/year, respectively; and those for the third planning period are [656.98, 3421.49] × 104 m3/year, [656.98, 2773.49] × 104 m3/year, and [656.98, 2177.93] × 104 m3/year, respectively. This is mainly due to the fact that water demand is increasing and therefore water shortages are also increasing due to improvement in the economic levels and living standards of the region with the advancement of each planning period. The water deficits in the agricultural sector in the Dehui region for the first planning period at low, medium, and high water flow levels are [13745.70, 16867.60] × 104 m3/year, [13745.70, 16867.60] × 104 m3/year, and [12542.70, 16867.60] × 104 m3/year, respectively; similarly, the corresponding water deficits are [6062.65 16953.00] × 104 m3/year, [6062.65, 16953.00] × 104 m3/year, and [6062.65, 16953.00] × 104 m3/year, respectively, for the second planning period, and the corresponding deficit values for the third planning period are [8673.13, 13531.82] × 104 m3/year, [8673.13, 13531.82] × 104 m3/year, and [8673.13, 13531.82] × 104 m3/year, respectively. The water deficits in the industrial sector in the Yitong region for the first planning period are [94.94, 94.94] × 104 m3/year, [94.94, 94.94] × 104 m3/year, and [94.94, 94.94] × 104 m3/year, respectively, corresponding to low, medium, and high water availability levels. Similarly, for the second planning period, at low, medium, and high available water resource levels, the water deficits of the industrial sector in this region are [108.71, 131.50] × 104 m3/year, [108.71, 131.50] × 104 m3/year, and [108.71, 131.50] × 104 m3/year, respectively. The water deficits for the third planning period are [41.18, 148.00] × 104 m3/year, [41.18, 148.00] × 104 m3/year, and [41.18, 148.00] × 104 m3/year, respectively, corresponding to the three levels of water resource availability. The water deficits of the industrial sector under Changchun’s jurisdiction at the three levels of available water resources are [1132.20, 2053.00] × 104 m3/year, [0, 786.20] × 104 m3/year, and [0, 0] × 104 m3/year for the first planning period and [0, 4768.69] × 104 m3/year, [0 3309.00] × 104 m3/year, and [0, 1777.00] × 104 m3/year for the second planning period, respectively. The water deficits in the municipal sector in the Changchun region for the first two planning periods at the three available water flow levels are [0, 40.83] × 104 m3/year, [0, 40.83] × 104 m3/year, and [0, 40.83] × 104 m3/year; and [0, 41.34] × 104 m3/year, [0, 41.34] × 104 m3/year, and [0, 41.34] × 104 m3/year, respectively. The water deficits in the agricultural sector under Changchun’s jurisdiction for the first two planning periods at the three levels of available water resources are [3381.60, 4149.61] × 104 m3/year, [3381.60, 4149.61] × 104 m3/year, and [3381.60, 4149.61] × 104 m3/year; and [0, 4170.60] × 104 m3/year, [0, 4170.60] × 104 m3/year, and [0, 4170.60] × 104 m3/year, respectively. Furthermore, all other areas have zero water shortages at the three levels of available water resources in all the planning periods, with the exception of the industrial sector in Nongan County and the agricultural sector, which had water shortages at different levels of available water resources in all three planning periods, indicating that the allocation of water resources to different sectors in all areas met water demand at the three levels of available water resources. At the same time, there is a certain relationship between the amount of water shortage in each department and the amount of water reused in each department. There are certain problems associated with the use of recycled water in the agricultural sector and there is no reuse of water. Therefore, in terms of water shortage, the amount of water shortage in the agricultural sector is higher than that of the agricultural sector. On the contrary, the amount of water reused in the ecological sector is very large, so the water shortage in the ecological sector is always 0.00 m3/year, indicating that water reuse can effectively alleviate the water shortage problem in various sectors of the basin. Based on the IFTSP method, the water shortage of various water sectors in each planning area decreases gradually with the increase in available water resources in three different planning periods, indicating that water resource allocation based on the IFTSP model is more reasonable. The IFTSP-based optimized water resources allocation scheme not only magnifies the profits from water consumption but also enhances water resource stability in the YRB.
4.2. Economic Efficiency and Pollutant Emissions before and after Using Fuzzy Approaches with IFTSP Models
4.2.1. Analysis of the Effect of Basin Water Allocation on the System’s Economic Efficiency
The rationality of water resource allocation is conducive to improving the economic benefits of water resources, reducing water shortages in different regions, and focusing on ecological and environmental benefits, while also improving the economic benefits of the system [82,83,84,85,86]. The IFTSP model developed in this work not only addresses rational water resource allocation, reduces water shortage in various locations, and emphasizes ecological and environmental advantages, but also enhances the system’s economic returns. The system’s economic advantages vary depending on the amount of water available in the basin. For example, for h = 2, in the ITSP approach-based water resources allocation model for the YRB, the economic benefits of the system are CNY [19331.25, 22109.34] × 104, whereas those based on the IFTSP approach model are CNY [19330.15, 22104.46] × 104; for h = 3, the economic advantages of the system based on the ITSP method are CNY [21263.04, 22490.41] × 104 due to the high amount of accessible water resources. The optimal allocation model of water resources in the river basin developed in this study not only considers the rational allocation of water resources but also focuses on the ecological and environmental benefits of the YRB, thereby narrowing the decision space for decision makers and mitigating decision risks at the cost of some of the system’s economic benefits; therefore, the economic benefits of the YRB system under the derived optimal water allocation scheme are slightly lower than those warranted by the ITSP method of water allocation. As a result, when compared with the ITSP model, the IFTSP model ensures a more rational allocation of water resources in the YRB and improves decision-making efficiency.
4.2.2. Analysis of Changes in COD Levels from the YRB during the First Planning Period
COD (Chemical Oxygen Demand) is an important organic pollution parameter that can be measured quickly in the research fields of river pollution and industrial wastewater properties [87,88,89,90]. The variation in COD levels in the YRB before and after the application of the coupled fuzzy method is examined in this research, with the first planning period being used as an example. Table 3 illustrates COD emissions from various water-consuming industries in various planning areas at low water resource levels (h = 1) as predicted by the ITSP and IFTSP of YRB water allocation models during the first planning period. The ITSP-based COD levels were much lower than those from the IFTSP water resources allocation model for the YRB. COD levels for the ecological sector were zero in all the eight regions in both the ITSP and IFTSP model-derived water allocation schemes, which is consistent with the ecological sector’s management requirements. Furthermore, the agricultural sector in each region accounts for most of the COD, owing to fertilizer application; but this scenario is significantly improved by the IFTSP-based water allocation in the YRB due to the fact that the IFTSP model not only considers the system’s benefits but also takes the YRB’s ecological state into account. The IFTSP has resulted in a huge reduction in the amount of water discharged from the YRB, thereby avoiding ecosystem risks and improving the stability of the river basin’s water resources, while also boosting the river basin’s water resource security.
5. Conclusions
In this paper, coupled with the fuzzy method, a water resource allocation model of the Yinma River Basin based on the interval fuzzy two-stage stochastic programming method has been constructed. While ensuring the optimization of the economic benefits of the system, the water resources of the Yinma River Basin are reasonably allocated, and various water-using departments are optimized; and while avoiding unreasonable allocations of water resources, the water demands among various departments are balanced, avoiding insufficient water use or the waste of water resources caused by low or high allocation of water resources. The results of the model simulation were further reduced and made accurate by the fuzzy method to provide a more reasonable decision space. In addition, the model considers the pollutant discharge of various water-consuming departments in the basin in the form of constraints, optimizes the discharge of water resources while optimizing the allocation of water resources, and relieves the pressure of pollutants in the Yinma River Basin. In this study, the current situation in the Yinma River Basin has not been fully considered. For a more complex environment, the model can be further adjusted by adopting methods such as robust optimization. The Yinma River Basin water resources allocation model was constructed based on the interval fuzzy two-stage stochastic programming method with fuzzy intervals of two stages, which provides a reference for governments and departments in the Yinma River Basin to manage the basin. The method allows for the constructed basin water resource allocation model to be adapted to a wider range of scenarios and provide new ideas for model construction. The model can also be applied to the optimal management of other watersheds, providing decision makers with a theoretical scientific planning scheme.
Supplementary Materials
The following supporting information can be downloaded at: https://www.mdpi.com/article/10.3390/w14132119/s1, Table S1: Simulation results of the IFTSP model in the first planning period; Table S2: Simulation results of the IFTSP model in the second planning period; Table S3: Simulation results of the IFTSP model in the third planning period.
Author Contributions
Conceptualization, P.L. and H.Y.; methodology, W.H.; software, W.H., P.L., and H.Y.; validation, P.L., L.Y. and W.H.; formal analysis, H.Y.; investigation, P.L.; resources, W.H.; data curation, L.Y.; writing—original draft preparation, L.Y., P.S. and N.H.; writing—review and editing, L.Y., P.S. and N.H.; visualization, P.L.; supervision, H.Y.; project administration, Y.L. All authors have read and agreed to the published version of the manuscript.
Funding
This research received no external funding.
Institutional Review Board Statement
Not applicable.
Informed Consent Statement
Not applicable.
Data Availability Statement
Not applicable.
Conflicts of Interest
The authors declare no conflict of interest.
References
- Shiklomanov, I.A. Appraisal and Assessment of World Water Resources. Water Int. 2000, 25, 11–32. [Google Scholar] [CrossRef]
- Huang, Z.; Yuan, X.; Liu, X. The key drivers for the changes in global water scarcity: Water withdrawal versus water availability. J. Hydrol. 2021, 601, 126658. [Google Scholar] [CrossRef]
- Yang, D.; Yang, Y.; Xia, J. Hydrological cycle and water resources in a changing world: A review. Geogr. Sustain. 2021, 2, 115–122. [Google Scholar] [CrossRef]
- Jung, M.; Arnell, A.; de Lamo, X.; Garcia-Rangel, S.; Lewis, M.; Mark, J.; Merow, C.; Miles, L.; Ondo, I.; Pironon, S.; et al. Areas of global importance for conserving terrestrial biodiversity, carbon and water. Nat. Ecol. Evol. 2021, 5, 1499–1509. [Google Scholar] [CrossRef]
- Westall, F.; Brack, A. The Importance of Water for Life. Space Sci. Rev. 2018, 214, 50. [Google Scholar] [CrossRef]
- Li, P.; Qian, H. Water resources research to support a sustainable China. Int. J. Water Resour. Dev. 2018, 34, 327–336. [Google Scholar] [CrossRef] [Green Version]
- Bhattacharya, S.; Gupta, A.B.; Gupta, A.; Pandey, A. Introduction to Water Remediation: Importance and Methods. In Water Remediation; Springer: Singapore, 2018; pp. 3–8. [Google Scholar] [CrossRef]
- Ma, S.; Luo, W. Comparison of nonclassicality between photon-added and photon-subtracted squeezed vacuum states. Chin. Phys. B 2012, 21, 024203. [Google Scholar] [CrossRef]
- Chen, Z.; Wu, G.; Wu, Y.; Wu, Q.; Shi, Q.; Ngo, H.H.; Vargas Saucedo, O.A.; Hu, H.-Y. Water Eco-Nexus Cycle System (WaterEcoNet) as a key solution for water shortage and water environment problems in urban areas. Water Cycle 2020, 1, 71–77. [Google Scholar] [CrossRef]
- Gohari, A.; Eslamian, S.; Mirchi, A.; Abedi-Koupaei, J.; Massah Bavani, A.; Madani, K. Water transfer as a solution to water shortage: A fix that can Backfire. J. Hydrol. 2013, 491, 23–39. [Google Scholar] [CrossRef]
- Petersen, L.; Heynen, M.; Pellicciotti, F. Freshwater Resources: Past, Present, Future. In International Encyclopedia of Geography; Wiley: Hobiken, NJ, USA, 2019; pp. 1–12. [Google Scholar] [CrossRef]
- Oki, T.; Kanae, S. Global hydrological cycles and world water resources. Science 2006, 313, 1068–1072. [Google Scholar] [CrossRef] [Green Version]
- Sabater, S.; Bregoli, F.; Acuna, V.; Barcelo, D.; Elosegi, A.; Ginebreda, A.; Marce, R.; Munoz, I.; Sabater-Liesa, L.; Ferreira, V. Effects of human-driven water stress on river ecosystems: A meta-analysis. Sci. Rep. 2018, 8, 11462. [Google Scholar] [CrossRef]
- Mustapha, A.; Aris, A.Z.; Juahir, H.; Ramli, M.F.; Kura, N.U. River water quality assessment using environmentric techniques: Case study of Jakara River Basin. Env. Sci. Pollut. Res. Int. 2013, 20, 5630–5644. [Google Scholar] [CrossRef]
- Huang, F.; Wang, X.; Lou, L.; Zhou, Z.; Wu, J. Spatial variation and source apportionment of water pollution in Qiantang River (China) using statistical techniques. Water Res. 2010, 44, 1562–1572. [Google Scholar] [CrossRef]
- Fan, L.; Liu, G.; Wang, F.; Geissen, V.; Ritsema, C.J. Factors affecting domestic water consumption in rural households upon access to improved water supply: Insights from the Wei River Basin, China. PLoS ONE 2013, 8, e71977. [Google Scholar] [CrossRef] [Green Version]
- Kumar, V.; Del Vasto-Terrientes, L.; Valls, A.; Schuhmacher, M. Adaptation strategies for water supply management in a drought prone Mediterranean river basin: Application of outranking method. Sci. Total Environ. 2016, 540, 344–357. [Google Scholar] [CrossRef]
- Li, H.; Xu, C.-Y.; Beldring, S.; Tallaksen, L.M.; Jain, S.K. Water Resources Under Climate Change in Himalayan Basins. Water Resour. Manag. 2015, 30, 843–859. [Google Scholar] [CrossRef]
- Vaidya, R.A. Governance and management of local water storage in the Hindu Kush Himalayas. Int. J. Water Resour. Dev. 2015, 31, 253–268. [Google Scholar] [CrossRef] [Green Version]
- Jasrotia, A.S.; Majhi, A.; Singh, S. Water Balance Approach for Rainwater Harvesting using Remote Sensing and GIS Techniques, Jammu Himalaya, India. Water Resour. Manag. 2009, 23, 3035–3055. [Google Scholar] [CrossRef]
- Madani, K. Water management in Iran: What is causing the looming crisis? J. Environ. Stud. Sci. 2014, 4, 315–328. [Google Scholar] [CrossRef]
- Ashraf, S.; AghaKouchak, A.; Nazemi, A.; Mirchi, A.; Sadegh, M.; Moftakhari, H.R.; Hassanzadeh, E.; Miao, C.-Y.; Madani, K.; Mousavi Baygi, M.; et al. Compounding effects of human activities and climatic changes on surface water availability in Iran. Clim. Chang. 2018, 152, 379–391. [Google Scholar] [CrossRef]
- Dalin, C.; Wada, Y.; Kastner, T.; Puma, M.J. Groundwater depletion embedded in international food trade. Nature 2017, 543, 700–704. [Google Scholar] [CrossRef] [Green Version]
- Voss, K.A.; Famiglietti, J.S.; Lo, M.; Linage, C.; Rodell, M.; Swenson, S.C. Groundwater depletion in the Middle East from GRACE with implications for transboundary water management in the Tigris-Euphrates-Western Iran region. Water Resour Res. 2013, 49, 904–914. [Google Scholar] [CrossRef] [Green Version]
- Wheida, E.; Verhoeven, R. An alternative solution of the water shortage problem in Libya. Water Resour. Manag. 2006, 21, 961–982. [Google Scholar] [CrossRef]
- Nabi, G.; Ali, M.; Khan, S.; Kumar, S. The crisis of water shortage and pollution in Pakistan: Risk to public health, biodiversity, and ecosystem. Env. Sci. Pollut. Res. Int. 2019, 26, 10443–10445. [Google Scholar] [CrossRef] [Green Version]
- Derbile, E.K.; Bonye, S.Z.; Yiridomoh, G.Y. Mapping vulnerability of smallholder agriculture in Africa: Vulnerability assessment of food crop farming and climate change adaptation in Ghana. Environ. Chall. 2022, 8, 100537. [Google Scholar] [CrossRef]
- Nkhonjera, G.K. Understanding the impact of climate change on the dwindling water resources of South Africa, focusing mainly on Olifants River basin: A review. Environ. Sci. Policy 2017, 71, 19–29. [Google Scholar] [CrossRef]
- Yomo, M.; Mourad, K.A.; Gnazou, M.D.T. Examining Water Security in the Challenging Environment in Togo, West Africa. Water 2019, 11, 231. [Google Scholar] [CrossRef] [Green Version]
- Ahmed, S.A.; Guerrero Florez, M.; Karanis, P. The impact of water crises and climate changes on the transmission of protozoan parasites in Africa. Pathog. Glob. Health 2018, 112, 281–293. [Google Scholar] [CrossRef]
- Orimoloye, I.R.; Ololade, O.O.; Mazinyo, S.P.; Kalumba, A.M.; Ekundayo, O.Y.; Busayo, E.T.; Akinsanola, A.A.; Nel, W. Spatial assessment of drought severity in Cape Town area, South Africa. Heliyon 2019, 5, e02148. [Google Scholar] [CrossRef] [Green Version]
- Bindi, M.; Olesen, J.E. The responses of agriculture in Europe to climate change. Reg. Environ. Chang. 2010, 11, 151–158. [Google Scholar] [CrossRef]
- Jonsdottir, H.; Eliasson, J.; Madsen, H. Assessment of serious water shortage in the Icelandic water resource system. Phys. Chem. Earth Parts A/B/C 2005, 30, 420–425. [Google Scholar] [CrossRef]
- Lloyd-Hughes, B.; Saunders, M.A. A drought climatology for Europe. Int. J. Climatol. 2002, 22, 1571–1592. [Google Scholar] [CrossRef]
- Deng, X.-P.; Shan, L.; Zhang, H.; Turner, N.C. Improving agricultural water use efficiency in arid and semiarid areas of China. Agric. Water Manag. 2006, 80, 23–40. [Google Scholar] [CrossRef]
- Wang, X.C.; Jin, P.K. Water shortage and needs for wastewater re-use in the north China. Water Sci. Technol. 2006, 53, 35–44. [Google Scholar] [CrossRef]
- Zhu, Z.; Zhou, H.; Ouyang, T.; Deng, Q.; Kuang, Y.; Huang, N. Water shortage: A serious problem in sustainable development of China. Int. J. Sustain. Dev. World Ecol. 2009, 8, 233–237. [Google Scholar] [CrossRef]
- Cheng, B.; Li, H.; Yue, S.; Huang, K. A conceptual decision-making for the ecological base flow of rivers considering the economic value of ecosystem services of rivers in water shortage area of Northwest China. J. Hydrol. 2019, 578, 124126. [Google Scholar] [CrossRef]
- Qian, L.; Zhang, R.; Hong, M.; Wang, H.; Yang, L. A new multiple integral model for water shortage risk assessment and its application in Beijing, China. Nat. Hazards 2015, 80, 43–67. [Google Scholar] [CrossRef]
- Geng, S.; Zhou, Y.; Zhang, M.; Smallwood, K.S. A Sustainable Agro-ecological Solution to Water Shortage in the North China Plain (Huabei Plain). J. Environ. Plan. Manag. 2001, 44, 345–355. [Google Scholar] [CrossRef]
- Nilsson, C.; Reidy, C.A.; Dynesius, M.; Revenga, C. Fragmentation and flow regulation of the world’s large river systems. Science 2005, 308, 405–408. [Google Scholar] [CrossRef] [Green Version]
- Richter, B.D.; Mathews, R.; Harrison, D.L.; Wigington, R. Ecologically sustainable water management: Managing river flows for ecological integrity. Ecol. Appl. 2003, 13, 206–224. [Google Scholar] [CrossRef]
- Gebre, S.L.; Cattrysse, D.; Van Orshoven, J. Multi-Criteria Decision-Making Methods to Address Water Allocation Problems: A Systematic Review. Water 2021, 13, 125. [Google Scholar] [CrossRef]
- Schlüter, M.; Savitsky, A.G.; McKinney, D.C.; Lieth, H. Optimizing long-term water allocation in the Amudarya River delta: A water management model for ecological impact assessment. Environ. Model. Softw. 2005, 20, 529–545. [Google Scholar] [CrossRef]
- Sadati, S.; Speelman, S.; Sabouhi, M.; Gitizadeh, M.; Ghahraman, B. Optimal Irrigation Water Allocation Using a Genetic Algorithm under Various Weather Conditions. Water 2014, 6, 3068–3084. [Google Scholar] [CrossRef]
- Li, J.; Qiao, Y.; Lei, X.; Kang, A.; Wang, M.; Liao, W.; Wang, H.; Ma, Y. A two-stage water allocation strategy for developing regional economic-environment sustainability. J. Env. Manag. 2019, 244, 189–198. [Google Scholar] [CrossRef]
- Jodar-Abellan, A.; Fernández-Aracil, P.; Melgarejo-Moreno, J. Assessing Water Shortage through a Balance Model among Transfers, Groundwater, Desalination, Wastewater Reuse, and Water Demands (SE Spain). Water 2019, 11, 1009. [Google Scholar] [CrossRef] [Green Version]
- Degefu, D.M.; He, W.; Yuan, L.; Zhao, J.H. Water Allocation in Transboundary River Basins under Water Scarcity: A Cooperative Bargaining Approach. Water Resour. Manag. 2016, 30, 4451–4466. [Google Scholar] [CrossRef]
- Zhang, H.; Jin, G.; Yu, Y. Review of River Basin Water Resource Management in China. Water 2018, 10, 425. [Google Scholar] [CrossRef] [Green Version]
- Cai, B.; Zhang, W.; Hubacek, K.; Feng, K.; Li, Z.; Liu, Y.; Liu, Y. Drivers of virtual water flows on regional water scarcity in China. J. Clean. Prod. 2019, 207, 1112–1122. [Google Scholar] [CrossRef]
- Yao, L.; Xu, Z.; Chen, X. Sustainable water allocation strategies under various climate scenarios: A case study in China. J. Hydrol. 2019, 574, 529–543. [Google Scholar] [CrossRef]
- Zhang, Y.; Lu, Y.; Zhou, Q.; Wu, F. Optimal water allocation scheme based on trade-offs between economic and ecological water demands in the Heihe River Basin of Northwest China. Sci. Total Environ. 2020, 703, 134958. [Google Scholar] [CrossRef]
- Yang, Z.; Cui, B.; Chen, H. A holistic approach for evaluating ecological water allocation in the Yellow River basin of China. Front. Environ. Sci. Eng. China 2007, 1, 99–106. [Google Scholar] [CrossRef]
- Agarwal, S.; Patil, J.P.; Goyal, V.C.; Singh, A. Assessment of Water Supply–Demand Using Water Evaluation and Planning (WEAP) Model for Ur River Watershed, Madhya Pradesh, India. J. Inst. Eng. Ser. A 2018, 100, 21–32. [Google Scholar] [CrossRef]
- Li, X.; Zhao, Y.; Shi, C.; Sha, J.; Wang, Z.-L.; Wang, Y. Application of Water Evaluation and Planning (WEAP) model for water resources management strategy estimation in coastal Binhai New Area, China. Ocean Coast. Manag. 2015, 106, 97–109. [Google Scholar] [CrossRef]
- Li, M.; Guo, P.; Singh, V.P. An efficient irrigation water allocation model under uncertainty. Agric. Syst. 2016, 144, 46–57. [Google Scholar] [CrossRef]
- Zhang, C.; Guo, P.; Huo, Z. Irrigation water resources management under uncertainty: An interval nonlinear double-sided fuzzy chance-constrained programming approach. Agric. Water Manag. 2021, 245, 106658. [Google Scholar] [CrossRef]
- Babel, M.S.; Gupta, A.D.; Nayak, D.K. A Model for Optimal Allocation of Water to Competing Demands. Water Resour. Manag. 2005, 19, 693–712. [Google Scholar] [CrossRef]
- Hu, C.; Xia, J.; She, D.; Xu, C.; Zhang, L.; Song, Z.; Zhao, L. A modified regional L-moment method for regional extreme precipitation frequency analysis in the Songliao River Basin of China. Atmos. Res. 2019, 230, 104629. [Google Scholar] [CrossRef]
- Mu, X.; Li, Y.; Gao, P.; Shao, H.; Wang, F. The Runoff Declining Process and Water Quality in Songhuajiang River Catchment, China under Global Climatic Change. CLEAN-Soil Air Water 2012, 40, 394–401. [Google Scholar] [CrossRef]
- Meng, C.; Wang, X.; Li, Y. An Optimization Model for Water Management Based on Water Resources and Environmental Carrying Capacities: A Case Study of the Yinma River Basin, Northeast China. Water 2018, 10, 565. [Google Scholar] [CrossRef] [Green Version]
- Lin, Q.G.; Huang, G.H.; Bass, B.; Qin, X.S. IFTEM: An interval-fuzzy two-stage stochastic optimization model for regional energy systems planning under uncertainty. Energy Policy 2009, 37, 868–878. [Google Scholar] [CrossRef]
- Liao, X.; Meng, C.; Cai, B.; Zhao, W. Interval-Parameter Two-Stage Stochastic Programming (IPTSP) Model of Ecological Water Replenishment Scheme in the National Nature Reserve for Improved Suitable Habitat for Rare and Endangered Migrant Birds. Water 2020, 12, 1520. [Google Scholar] [CrossRef]
- Wang, S.; Huang, G.H. A two-stage mixed-integer fuzzy programming with interval-valued membership functions approach for flood-diversion planning. J. Environ. Manag. 2013, 117, 208–218. [Google Scholar] [CrossRef]
- Khosrojerdi, T.; Moosavirad, S.H.; Ariafar, S.; Ghaeini-Hessaroeyeh, M. Optimal Allocation of Water Resources Using a Two-Stage Stochastic Programming Method with Interval and Fuzzy Parameters. Nat. Resour. Res. 2018, 28, 1107–1124. [Google Scholar] [CrossRef]
- Khalifa, H.A. On two-stage fuzzy random programming for water resources management. Afr. J. Math. Comput. Sci. Res. 2015, 8, 31–36. [Google Scholar] [CrossRef] [Green Version]
- Liao, X.; Meng, C.; Ren, Z.; Zhao, W. Optimization of Ecological Water Supplement Scheme for Improved Suitable Habitat Area for Rare Migratory Birds in Nature Reserves Using Interval-Parameter Fuzzy Two-Stage Stochastic Programming Model. Int. J. Environ. Res. Public Health 2020, 17, 7562. [Google Scholar] [CrossRef]
- Li, M.; Guo, P.; Fang, S.Q.; Zhang, L.D. An inexact fuzzy parameter two-stage stochastic programming model for irrigation water allocation under uncertainty. Stoch. Environ. Res. Risk Assess. 2013, 27, 1441–1452. [Google Scholar] [CrossRef]
- Shen, D.; Speed, R. Water Resources Allocation in the People’s Republic of China. Int. J. Water Resour. Dev. 2009, 25, 209–225. [Google Scholar] [CrossRef]
- Wade Miller, G. Integrated concepts in water reuse: Managing global water needs. Desalination 2006, 187, 65–75. [Google Scholar] [CrossRef]
- Fu, Q.; Li, L.; Li, M.; Li, T.; Liu, D.; Hou, R.; Zhou, Z. An interval parameter conditional value-at-risk two-stage stochastic programming model for sustainable regional water allocation under different representative concentration pathways scenarios. J. Hydrol. 2018, 564, 115–124. [Google Scholar] [CrossRef]
- Mohr, M.; Dockhorn, T.; Drewes, J.E.; Karwat, S.; Lackner, S.; Lotz, B.; Nahrstedt, A.; Nocker, A.; Schramm, E.; Zimmermann, M. Assuring water quality along multi-barrier treatment systems for agricultural water reuse. J. Water Reuse Desalination 2020, 10, 332–346. [Google Scholar] [CrossRef]
- Bauer, S.; Dell, A.; Behnisch, J.; Linke, H.J.; Wagner, M. Sustainability requirements of implementing water-reuse concepts for new industrial park developments in water-stressed regions. J. Water Reuse Desalination 2020, 10, 490–499. [Google Scholar] [CrossRef]
- Amaris, G.; Dawson, R.; Gironas, J.; Hess, S.; Ortuzar, J.D. Understanding the preferences for different types of urban greywater uses and the impact of qualitative attributes. Water Res. 2020, 184, 116007. [Google Scholar] [CrossRef]
- Lefebvre, O. Beyond NEWater: An insight into Singapore’s water reuse prospects. Curr. Opin. Environ. Sci. Health 2018, 2, 26–31. [Google Scholar] [CrossRef]
- Sgroi, M.; Vagliasindi, F.G.A.; Roccaro, P. Feasibility, sustainability and circular economy concepts in water reuse. Curr. Opin. Environ. Sci. Health 2018, 2, 20–25. [Google Scholar] [CrossRef]
- Wilcox, J.; Nasiri, F.; Bell, S.; Rahaman, M.S. Urban water reuse: A triple bottom line assessment framework and review. Sustain. Cities Soc. 2016, 27, 448–456. [Google Scholar] [CrossRef]
- Pandit, A.; Minné, E.A.; Li, F.; Brown, H.; Jeong, H.; James, J.-A.C.; Newell, J.P.; Weissburg, M.; Chang, M.E.; Xu, M.; et al. Infrastructure ecology: An evolving paradigm for sustainable urban development. J. Clean. Prod. 2017, 163, S19–S27. [Google Scholar] [CrossRef]
- Tzanakakis, V.A.; Paranychianakis, N.V.; Angelakis, A.N. Water Supply and Water Scarcity. Water 2020, 12, 2347. [Google Scholar] [CrossRef]
- Liu, J.; Yang, H.; Gosling, S.N.; Kummu, M.; Florke, M.; Pfister, S.; Hanasaki, N.; Wada, Y.; Zhang, X.; Zheng, C.; et al. Water scarcity assessments in the past, present and future. Earths Future 2017, 5, 545–559. [Google Scholar] [CrossRef] [PubMed]
- Damkjaer, S.; Taylor, R. The measurement of water scarcity: Defining a meaningful indicator. Ambio 2017, 46, 513–531. [Google Scholar] [CrossRef] [PubMed] [Green Version]
- Fan, Y.; He, L.; Kang, S.; Wang, S.; Fang, Y. A novel approach to dynamically optimize the spatio-temporal distribution of crop water consumption. J. Clean. Prod. 2021, 310, 12743. [Google Scholar] [CrossRef]
- Wu, M.; Ge, W.; Wu, Z.; Guo, X.; Di, D.; Huang, S. Evaluation of the Benefits of Urban Water Resource Utilization Based on the Catastrophe and Emergy Methods. Water Resour. Manag. 2020, 34, 1843–1853. [Google Scholar] [CrossRef]
- Wang, Y.; Li, Z.; Guo, S.; Zhang, F.; Guo, P. A risk-based fuzzy boundary interval two-stage stochastic water resources management programming approach under uncertainty. J. Hydrol. 2020, 582, 124553. [Google Scholar] [CrossRef]
- Wang, Y.; Liu, L.; Guo, S.; Yue, Q.; Guo, P. A bi-level multi-objective linear fractional programming for water consumption structure optimization based on water shortage risk. J. Clean. Prod. 2019, 237, 117829. [Google Scholar] [CrossRef]
- Cheng, B.; Li, H. Impact of climate change and human activities on economic values produced by ecosystem service functions of rivers in water shortage area of Northwest China. Env. Sci. Pollut. Res. Int. 2020, 27, 26570–26578. [Google Scholar] [CrossRef]
- Bhat, R.A.; Singh, D.V.; Qadri, H.; Dar, G.H.; Dervash, M.A.; Bhat, S.A.; Unal, B.T.; Ozturk, M.; Hakeem, K.R.; Yousaf, B. Vulnerability of municipal solid waste: An emerging threat to aquatic ecosystems. Chemosphere 2022, 287, 132223. [Google Scholar] [CrossRef]
- Kumar, H.; Kumari, M. Experimental and theoretical investigation of 3,3′-diamino dipropyl amine: Highly efficient corrosion inhibitor for carbon steel in 2 N HCl at normal and elevated temperatures. J. Mol. Struct. 2021, 1229, 129598. [Google Scholar] [CrossRef]
- Boubaker, F.; Ridha, B.C. Esparto paper industry wastewater treatment by adsorption onto powdered activated carbon. Int. J. Environ. Anal. Chem. 2020, 101, 2817–2834. [Google Scholar] [CrossRef]
- Anwar, R.Z.; Abdelghani, C.F.; Cherifa, A.; Zohra, G.F.; Bechlaghem, A. Analysis and reliability of a wastewater treatment plant: The contribution of operational safety at Tlemcen WWTP, Algeria. Euro-Mediterr. J. Environ. Integr. 2021, 6, 31. [Google Scholar] [CrossRef]
Figure 1.
Geographical location of the study area.

Figure 2.
The flowchart for the model construction.

Figure 3.
Optimal allocation of water resources in the YRB in the first planning period. (a) Upper limit of water resource. (b) Lower limit of water resource.
Figure 3.
Optimal allocation of water resources in the YRB in the first planning period. (a) Upper limit of water resource. (b) Lower limit of water resource.

Figure 4.
Optimal allocation of water resources in the YRB in the second planning period. (a) Upper limit of water resource. (b) Lower limit of water resource.
Figure 4.
Optimal allocation of water resources in the YRB in the second planning period. (a) Upper limit of water resource. (b) Lower limit of water resource.

Figure 5.
Optimal allocation of water resources in the YRB in the third planning period. (a) Upper limit of water resource. (b) Lower limit of water resource.
Figure 5.
Optimal allocation of water resources in the YRB in the third planning period. (a) Upper limit of water resource. (b) Lower limit of water resource.


Table 1.
Optimal allocation of YRB’s water resources during different planning periods (×104 m3/year).
Table 1.
Optimal allocation of YRB’s water resources during different planning periods (×104 m3/year).
| Region | Department | Planning Period | ||
|---|---|---|---|---|
| t = 1 | t = 2 | t = 3 | ||
| Panshi | Industry | [573.60, 758.00] | [768.80, 1089] | [1047.37, 1047.37] |
| Municipal | [1380.00, 1736.00] | [1387.20, 1754.00] | [1393.60, 1771.00] | |
| Ecology | [396.00, 498.00] | [435.00, 572.40] | [479.00, 657.60] | |
| Agriculture | [20,727.00, 21,945.00] | [20,748.00, 22,250.00] | [21,301.00, 23,461.00] | |
| Yongji | Industry | [222.00, 222.00] | [311.00, 311.00] | [287.20, 427.00] |
| Municipal | [1110.97, 1341.00] | [1062.40, 1362.00] | [1066.40, 1333.00] | |
| Ecology | [304.00, 382.80] | [334.00, 439.20] | [368.00, 505.20] | |
| Agriculture | [8939.00, 9465.00] | [8949.00, 9597.00] | [9187.00, 9609.27] | |
| Shuangyang | Industry | [772.00, 772.00] | [1244.00, 1244.00] | [1961.00, 1961.00] |
| Municipal | [641.60, 815.00] | [649.60, 836.00] | [658.40, 857.00] | |
| Ecology | [182.00, 229.20] | [200.00, 264.00] | [221.00, 303.60] | |
| Agriculture | [9116.00, 9487.00] | [9074.00, 9481.00] | [9430.00, 9980.00] | |
| Jiutai | Industry | [1738.09, 1806.00] | [2551.82, 2654.00] | [3651.80, 3800.00] |
| Municipal | [1121.60, 1416.00] | [1130.40, 1437.00] | [1138.40, 1459.00] | |
| Ecology | [326.00, 410.40] | [366.00, 480.00] | [410.00, 561.60] | |
| Agriculture | [26,298.00, 27,523.00] | [26,431.00, 27,905.00] | [27734.00, 29,801.00] | |
| Dehui | Industry | [4475.00, 4732.00] | [6144.00, 6144.00] | [8432.00, 8432.00] |
| Municipal | [1026.40, 1283.00] | [1032.00, 1290.00] | [1036.80, 1296.00] | |
| Ecology | [300.00, 376.80] | [336.00, 440.40] | [376.00, 516.00] | |
| Agriculture | [45,819.00, 45819.00] | [46,051.00, 46,051.00] | [48,321.00, 48,321.00] | |
| Yitong | Industry | [538.00, 538.00] | [610.00, 610.00] | [689.00, 689.00] |
| Municipal | [641.45, 553.00] | [440.80, 559.00] | [442.40, 564.00] | |
| Ecology | [126.00, 157.20] | [138.00, 180.00] | [152.00, 204.00] | |
| Agriculture | [12,696.00, 13,536.00] | [12,566.00, 13,921.00] | [12,792.00, 14,725.00] | |
| Changchun | Industry | [11,248.14, 12,033.00] | [17,995.92, 18,062.16] | [24,922.75, 28,075.39] |
| Municipal | [16,685.10, 18,539.00] | [16,894.80, 19,295.00] | [17,107.20, 19,782.00] | |
| Ecology | [5081.05, 5523.60] | [5072.00, 6628.80] | [5833.00, 7953.60] | |
| Agriculture | [11,272.00, 11,272.00] | [11,329.00, 11,961.00] | [11,887.00, 12,774.00] | |
| Nong’an | Industry | [1172.73, 1291.00] | [1680.37, 1727.00] | [2269.00, 2200.93] |
| Municipal | [1109.60, 1387.00] | [1128.80, 1451.00] | [1148.80, 1495.00] | |
| Ecology | [319.00, 400.80] | [357.00, 469.20] | [400.00, 548.40] | |
| Agriculture | [61,958.00, 61,958.00] | [62,271.00, 65,744.00] | [65,342.00, 70,211.00] | |
Table 2.
Water reuse allocation options for the YRB for several planning periods (× 104 m3/year).
| Region | Department | Reused Water | ||
|---|---|---|---|---|
| t = 1 | t = 2 | t = 3 | ||
| Panshi | Industrial | [0.00, 184.40] | [0.00, 320.20] | [481.64, 481.64] |
| Municipal | [0.00, 168.70] | [0.00, 129.88] | [0.00, 170.36] | |
| Ecological | [194.90, 407.58] | [214.19, 393.04] | [295.07, 527.05] | |
| Agricultural | [0.00, 0.00] | [0.00, 0.00] | [0.00, 0.00] | |
| Yongji | Industrial | [0.00, 0.00] | [0.00, 0.00] | [0.00, 139.80] |
| Municipal | [0.00, 76.82] | [0.00, 79.40] | [0.00, 130.36] | |
| Ecological | [220.44, 335.60] | [132.77, 243.33] | [110.60, 424.11] | |
| Agricultural | [0.00, 0.00] | [0.00, 0.00] | [0.00, 0.00] | |
| Shuangyang | Industrial | [0.00, 0.00] | [0.00, 102.18] | [0.00, 0.00] |
| Municipal | [0.00, 78.43] | [0.00, 138.19] | [0.00, 80.49] | |
| Ecological | [105.48, 208.17] | [231.05, 418.25] | [155.96, 274.24] | |
| Agricultural | [0.00, 0.00] | [0.00, 0.00] | [0.00, 0.00] | |
| Jiutai | Industrial | [0.00, 67.91] | [0.00, 0.00] | [0.00, 148.20] |
| Municipal | [0.00, 137.11] | [0.00, 126.16] | [0.00, 139.17] | |
| Ecological | [184.39, 361.67] | [210.93, 375.47] | [269.65, 466.88] | |
| Agricultural | [0.00, 0.00] | [0.00, 0.00] | [0.00, 0.00] | |
| Dehui | Industrial | [0.00, 0.00] | [0.00, 0.00] | [0.00, 0.00] |
| Municipal | [0.00, 125.47] | [0.00, 126.16] | [0.00, 126.75] | |
| Ecological | [168.74, 327.70] | [210.93, 375.47] | [245.59, 414.72] | |
| Agricultural | [0.00, 0.00] | [0.00, 0.00] | [0.00, 0.00] | |
| Yitong | Industrial | [0.00, 0.00] | [0.00, 0.00] | [0.00, 0.00] |
| Municipal | [0.00, 0.00] | [0.00, 53.89] | [0.00, 54.08] | |
| Ecological | [124.09, 124.09] | [75.45, 146.15] | [92.08, 166.04] | |
| Agricultural | [0.00, 0.00] | [0.00, 0.00] | [0.00, 0.00] | |
| Changcuhn | Industrial | [0.00, 784.86] | [0.00, 1317.84] | [404.96, 2243.61] |
| Municipal | [0.00, 0.00] | [0.00, 0.00] | [0.00, 0.00] | |
| Ecological | [4251.28, 4735.23] | [4954.918, 5672.73] | [5474.30, 6330.24] | |
| Agricultural | [0.00, 0.00] | [0.00, 0.00] | [0.00, 0.00] | |
| Nongan | Industrial | [0.00, 13.81] | [0.00, 46.63] | [0.00, 68.07] |
| Municipal | [0.00, 135.65] | [0.00, 137.99] | [0.00, 140.44] | |
| Ecological | [182.42, 354.27] | [234.44, 426.59] | [272.12, 478.40] | |
| Agricultural | [0.00, 0.00] | [0.00, 0.00] | [0.00, 0.00] | |
Table 3.
COD levels of different water-consuming sectors at low water use levels in the first planning period (×104 m3/year).
Table 3.
COD levels of different water-consuming sectors at low water use levels in the first planning period (×104 m3/year).
| Regions | ITSP | IFTSP | ||||||
|---|---|---|---|---|---|---|---|---|
| Industrial | Municipal | Ecological | Agricultural | Industrial | Municipal | Ecological | Agricultural | |
| Panshi | 289.96 | 447.59 | 0.00 | 9875.25 | 286.96 | 399.30 | 0.00 | 9534.32 |
| Yongji | 408.48 | 330.52 | 0.00 | 4590.53 | 408.48 | 292.76 | 0.00 | 4469.50 |
| Shuangyang | 56.47 | 197.79 | 0.00 | 7779.34 | 56.47 | 174.75 | 0.00 | 7748.60 |
| Jiutai | 112.56 | 343.65 | 0.00 | 21,192.71 | 112.56 | 305.48 | 0.00 | 20,775.42 |
| Dehui | 5198.25 | 311.37 | 0.00 | 20,847.65 | 4474.39 | 279.55 | 0.00 | 19252.10 |
| Yitong | 985.71 | 144.02 | 0.00 | 3248.64 | 985.71 | 144.02 | 0.00 | 3135.91 |
| Changchun | 7581.73 | 4499.27 | 0.00 | 6627.94 | 6941.50 | 4039.43 | 0.00 | 6125.25 |
| Nongan | 694.12 | 336.61 | 0.00 | 18,649.36 | 599.53 | 302.21 | 0.00 | 17,225.61 |
Publisher’s Note: MDPI stays neutral with regard to jurisdictional claims in published maps and institutional affiliations. |
© 2022 by the authors. Licensee MDPI, Basel, Switzerland. This article is an open access article distributed under the terms and conditions of the Creative Commons Attribution (CC BY) license (https://creativecommons.org/licenses/by/4.0/).
Share and Cite
MDPI and ACS Style
Li, P.; Yang, H.; He, W.; Yang, L.; Hao, N.; Sun, P.; Li, Y. Optimal Water Resources Allocation in the Yinma River Basin in Jilin Province, China, Using Fuzzy Programming. Water 2022, 14, 2119. https://doi.org/10.3390/w14132119
AMA Style
Li P, Yang H, He W, Yang L, Hao N, Sun P, Li Y. Optimal Water Resources Allocation in the Yinma River Basin in Jilin Province, China, Using Fuzzy Programming. Water. 2022; 14(13):2119. https://doi.org/10.3390/w14132119
Chicago/Turabian StyleLi, Pengyu, Hao Yang, Wei He, Luze Yang, Ning Hao, Peixuan Sun, and Yu Li. 2022. "Optimal Water Resources Allocation in the Yinma River Basin in Jilin Province, China, Using Fuzzy Programming" Water 14, no. 13: 2119. https://doi.org/10.3390/w14132119
Note that from the first issue of 2016, this journal uses article numbers instead of page numbers. See further details here.